Attached files
| file | filename |
|---|---|
| EX-32.2 - SECTION 906 CERTIFICATION CFO - Calamos Asset Management, Inc. /DE/ | clms-2015x06x30xex322.htm |
| EX-31.2 - SECTION 302 CERTIFICATION CFO - Calamos Asset Management, Inc. /DE/ | clms-2015x06x30xex312.htm |
| EX-32.1 - SECTION 906 CERTIFICATION CEO - Calamos Asset Management, Inc. /DE/ | clms-2015x06x30xex321.htm |
| EX-31.1 - SECTION 302 CERTIFICATION CEO - Calamos Asset Management, Inc. /DE/ | clms-2015x06x30xex311.htm |
UNITED STATES
SECURITIES AND EXCHANGE COMMISSION
Washington, D.C. 20549
________________
FORM 10-Q
________________
þ | QUARTERLY REPORT PURSUANT TO SECTION 13 OR 15(d) OF THE SECURITIES EXCHANGE ACT OF 1934 |
FOR THE QUARTERLY PERIOD ENDED: June 30, 2015 | |
or | |
¨ | TRANSITION REPORT PURSUANT TO SECTION 13 OR 15(d) OF THE SECURITIES EXCHANGE ACT OF 1934. |
Commission File Number: 000-51003
________________
CALAMOS ASSET MANAGEMENT, INC.
(Exact Name of Registrant as Specified in its Charter)
________________
Delaware | 32-0122554 | |
(State or Other Jurisdiction of | (I.R.S. Employer | |
Incorporation or Organization) | Identification No.) | |
2020 Calamos Court, Naperville, Illinois | 60563 | |
(Address of Principal Executive Offices) | (Zip Code) | |
(630) 245-7200
(Registrant’s telephone number, including area code)
___________________
Indicate by check mark whether the registrant (1) has filed all reports required to be filed by Section 13 or 15(d) of the Securities Exchange Act of 1934 during the preceding 12 months (or for such shorter period that the registrant was required to file such reports) and (2) has been subject to such filing requirements for the past 90 days. þ Yes ¨ No
Indicate by check mark whether the registrant has submitted electronically and posted on its corporate Web site, if any, every Interactive Data File required to be submitted and posted pursuant to Rule 405 of Regulation S-T (§232.405 of this chapter) during the preceding 12 months (or for such shorter period that the registrant was required to submit and post such files). þ Yes ¨ No
Indicate by check mark whether the registrant is a large accelerated filer, an accelerated filer, a non-accelerated filer, or a smaller reporting company. See the definitions of “large accelerated filer,” “accelerated filer” and “smaller reporting company” in Rule 12b-2 of the Exchange Act.
Large accelerated filer ¨ | Accelerated filer þ | Non-accelerated filer ¨ | Smaller reporting company ¨ |
(Do not check if a smaller reporting company) | |||
Indicate by check mark whether the registrant is a shell company (as defined in Rule 12b-2 of the Exchange Act). ¨ Yes þ No
At July 31, 2015, there were 20,530,571 shares of Class A common stock and 100 shares of Class B common stock outstanding.
TABLE OF CONTENTS
2
PART I — FINANCIAL INFORMATION
Item 1. Consolidated Financial Statements
CALAMOS ASSET MANAGEMENT, INC.
CONSOLIDATED STATEMENTS OF FINANCIAL CONDITION
(in thousands, except share data)
June 30, 2015 | December 31, 2014 | ||||||
(unaudited) | |||||||
ASSETS | |||||||
Current assets: | |||||||
Cash and cash equivalents | $ | 90,018 | $ | 35,285 | |||
Receivables: | |||||||
Affiliates and affiliated funds | 15,321 | 16,024 | |||||
Customers | 4,188 | 2,967 | |||||
Investment securities | 278,074 | 339,959 | |||||
Partnership investments | 114,313 | 143,723 | |||||
Prepaid expenses | 3,983 | 3,188 | |||||
Deferred tax assets, net | 7,496 | 9,194 | |||||
Other current assets | 3,902 | 2,508 | |||||
Total current assets | 517,295 | 552,848 | |||||
Non-current assets: | |||||||
Deferred tax assets, net | 29,200 | 31,067 | |||||
Goodwill | 6,380 | 6,380 | |||||
Property and equipment, net of accumulated depreciation and amortization ($63,121 at June 30, 2015 and $61,145 at December 31, 2014) | 13,583 | 14,246 | |||||
Other non-current assets | 2,059 | 2,615 | |||||
Total non-current assets | 51,222 | 54,308 | |||||
Total assets | $ | 568,517 | $ | 607,156 | |||
LIABILITIES AND EQUITY | |||||||
LIABILITIES | |||||||
Current liabilities: | |||||||
Distribution fees payable | $ | 8,212 | $ | 10,614 | |||
Accrued compensation and benefits | 14,785 | 24,476 | |||||
Interest payable | 1,390 | 1,386 | |||||
Liabilities of partnership investments | 253 | 10,117 | |||||
Accrued expenses and other current liabilities | 7,378 | 6,009 | |||||
Total current liabilities | 32,018 | 52,602 | |||||
Non-current liabilities: | |||||||
Long-term debt | 45,955 | 45,955 | |||||
Deferred rent | 8,835 | 8,803 | |||||
Other non-current liabilities | 1,418 | 1,710 | |||||
Total non-current liabilities | 56,208 | 56,468 | |||||
Total liabilities | 88,226 | 109,070 | |||||
Redeemable non-controlling interest in partnership investments | 78,721 | 76,167 | |||||
EQUITY | |||||||
Class A Common Stock, $0.01 par value; authorized 600,000,000 shares; 25,231,667 shares issued and 17,613,573 shares outstanding at June 30, 2015; 24,990,781 shares issued and 17,920,722 shares outstanding at December 31, 2014 | 252 | 250 | |||||
Class B Common Stock, $0.01 par value; authorized 1,000 shares; 100 shares issued and outstanding at June 30, 2015 and December 31, 2014 | — | — | |||||
Additional paid-in capital | 223,463 | 221,208 | |||||
Retained earnings | 85,970 | 89,311 | |||||
Accumulated other comprehensive income | 2,374 | 1,297 | |||||
Treasury stock; 7,618,094 shares at June 30, 2015 and 7,070,059 shares at December 31, 2014 | (110,829 | ) | (107,129 | ) | |||
Calamos Asset Management, Inc. stockholders’ equity | 201,230 | 204,937 | |||||
Non-controlling interest in Calamos Investments LLC (Calamos Interests) | 200,340 | 216,982 | |||||
Total equity | 401,570 | 421,919 | |||||
Total liabilities and equity | $ | 568,517 | $ | 607,156 | |||
See accompanying notes to consolidated financial statements.
3
CALAMOS ASSET MANAGEMENT, INC.
CONSOLIDATED STATEMENTS OF OPERATIONS
(in thousands, except share data)
(unaudited)
Three Months Ended June 30, | Six Months Ended June 30, | ||||||||||||||
2015 | 2014 | 2015 | 2014 | ||||||||||||
REVENUES | |||||||||||||||
Investment management fees | $ | 48,962 | $ | 49,697 | $ | 94,910 | $ | 99,975 | |||||||
Distribution and underwriting fees | 10,747 | 12,642 | 21,594 | 25,631 | |||||||||||
Other | 642 | 666 | 1,264 | 1,329 | |||||||||||
Total revenues | 60,351 | 63,005 | 117,768 | 126,935 | |||||||||||
EXPENSES | |||||||||||||||
Employee compensation and benefits | 21,848 | 19,730 | 46,722 | 43,726 | |||||||||||
Distribution expenses | 10,489 | 12,307 | 21,006 | 24,958 | |||||||||||
Marketing and sales promotion | 4,330 | 4,666 | 17,735 | 8,371 | |||||||||||
General and administrative | 9,592 | 9,668 | 19,718 | 19,170 | |||||||||||
Total operating expenses | 46,259 | 46,371 | 105,181 | 96,225 | |||||||||||
Operating income | 14,092 | 16,634 | 12,587 | 30,710 | |||||||||||
NON-OPERATING INCOME | |||||||||||||||
Net interest expense | (721 | ) | (1,460 | ) | (1,451 | ) | (2,925 | ) | |||||||
Investment and other income | 692 | 10,464 | 6,429 | 12,047 | |||||||||||
Total non-operating income (loss) | (29 | ) | 9,004 | 4,978 | 9,122 | ||||||||||
Income before income taxes | 14,063 | 25,638 | 17,565 | 39,832 | |||||||||||
Income tax provision | 1,275 | 2,046 | 1,740 | 3,408 | |||||||||||
Net income | 12,788 | 23,592 | 15,825 | 36,424 | |||||||||||
Net income attributable to non-controlling interest in Calamos Investments LLC (Calamos Interests) | (11,249 | ) | (17,183 | ) | (11,137 | ) | (27,813 | ) | |||||||
Net (income) loss attributable to redeemable non-controlling interest in partnership investments | 494 | (3,181 | ) | (2,554 | ) | (3,244 | ) | ||||||||
Net income attributable to Calamos Asset Management, Inc. | $ | 2,033 | $ | 3,228 | $ | 2,134 | $ | 5,367 | |||||||
Earnings per share: | |||||||||||||||
Basic | $ | 0.11 | $ | 0.18 | $ | 0.12 | $ | 0.29 | |||||||
Diluted | $ | 0.11 | $ | 0.17 | $ | 0.11 | $ | 0.28 | |||||||
Weighted average shares outstanding: | |||||||||||||||
Basic | 17,789,931 | 18,243,363 | 17,830,916 | 18,658,954 | |||||||||||
Diluted | 18,635,798 | 19,048,456 | 18,618,888 | 19,345,019 | |||||||||||
Cash dividends declared per share | $ | 0.15 | $ | 0.125 | $ | 0.30 | $ | 0.25 | |||||||
See accompanying notes to consolidated financial statements.
4
CALAMOS ASSET MANAGEMENT, INC.
CONSOLIDATED STATEMENTS OF COMPREHENSIVE INCOME
(in thousands)
(unaudited)
Three Months Ended June 30, | Six Months Ended June 30, | ||||||||||||||
2015 | 2014 | 2015 | 2014 | ||||||||||||
Net income | $ | 12,788 | $ | 23,592 | $ | 15,825 | $ | 36,424 | |||||||
Other comprehensive income, before income tax provision | |||||||||||||||
Unrealized gains on available-for-sale securities: | |||||||||||||||
Unrealized gains | 3,039 | 8,136 | 12,055 | 10,654 | |||||||||||
Reclassification adjustment for realized gains included in net income | (1,657 | ) | (4,794 | ) | (2,510 | ) | (5,610 | ) | |||||||
Other comprehensive income, before income tax provision | 1,382 | 3,342 | 9,545 | 5,044 | |||||||||||
Income tax provision related to other comprehensive income | 184 | 156 | 632 | 425 | |||||||||||
Other comprehensive income, after income tax provision | 1,198 | 3,186 | 8,913 | 4,619 | |||||||||||
Comprehensive income | 13,986 | 26,778 | 24,738 | 41,043 | |||||||||||
Comprehensive income attributable to non-controlling interest in Calamos Investments LLC (Calamos Interests) | (12,134 | ) | (20,102 | ) | (18,973 | ) | (31,689 | ) | |||||||
Comprehensive (income) loss attributable to redeemable non-controlling interest in partnership investments | 494 | (3,181 | ) | (2,554 | ) | (3,244 | ) | ||||||||
Comprehensive income attributable to Calamos Asset Management, Inc. | $ | 2,346 | $ | 3,495 | $ | 3,211 | $ | 6,110 | |||||||
See accompanying notes to consolidated financial statements.
5
CALAMOS ASSET MANAGEMENT, INC.
CONSOLIDATED STATEMENTS OF CHANGES IN EQUITY
Six Months Ended June 30, 2015
(in thousands, except share data)
(unaudited)
Calamos Asset Management, Inc. Stockholders | |||||||||||||||||||||||||||||||
(in thousands) | Common Stock | Additional Paid-in Capital | Retained Earnings | Accumulated Other Comprehensive Income | Treasury Stock | Non-controlling Interest in Calamos Investments LLC (Calamos Interests) | Total | Redeemable Non-controlling Interest in Partnership Investments | |||||||||||||||||||||||
Balance at December 31, 2014 | $ | 250 | $ | 221,208 | $ | 89,311 | $ | 1,297 | $ | (107,129 | ) | $ | 216,982 | $ | 421,919 | $ | 76,167 | ||||||||||||||
Net income | — | — | 2,134 | — | — | 11,137 | 13,271 | 2,554 | |||||||||||||||||||||||
Other comprehensive income | — | — | — | 1,077 | — | 7,836 | 8,913 | — | |||||||||||||||||||||||
Issuance of common stock (240,886 Class A common shares) | 2 | (2 | ) | — | — | — | — | — | — | ||||||||||||||||||||||
Repurchase of common stock by Calamos Investments LLC (548,035 Class A common shares) | — | — | — | — | (1,498 | ) | (5,246 | ) | (6,744 | ) | — | ||||||||||||||||||||
Impact of the redemption of common stock from Calamos Investments LLC by Calamos Asset Management, Inc. (240,886 Class A common shares) | — | 2,202 | — | — | (2,202 | ) | — | — | — | ||||||||||||||||||||||
Cumulative impact of changes in ownership of Calamos Investments LLC | — | (108 | ) | — | — | (566 | ) | (674 | ) | — | |||||||||||||||||||||
Compensation expense recognized under stock incentive plans | — | 792 | — | — | — | 2,776 | 3,568 | — | |||||||||||||||||||||||
Impact on non-controlling interests as a result of dividends paid to Calamos Investments LLC on repurchased common stock | — | (629 | ) | — | — | — | 629 | — | — | ||||||||||||||||||||||
Dividend equivalent accrued under stock incentive plans | — | — | (124 | ) | — | — | (435 | ) | (559 | ) | — | ||||||||||||||||||||
Equity and tax distributions paid to non-controlling interests in Calamos Investments LLC (Calamos Interests) | — | — | — | — | — | (32,773 | ) | (32,773 | ) | — | |||||||||||||||||||||
Dividends declared | — | — | (5,351 | ) | — | — | — | (5,351 | ) | — | |||||||||||||||||||||
Balance at June 30, 2015 | $ | 252 | $ | 223,463 | $ | 85,970 | $ | 2,374 | $ | (110,829 | ) | $ | 200,340 | $ | 401,570 | $ | 78,721 | ||||||||||||||
See accompanying notes to consolidated financial statements.
6
CALAMOS ASSET MANAGEMENT, INC.
CONSOLIDATED STATEMENTS OF CASH FLOWS
(in thousands)
(unaudited)
Six Months Ended June 30, | |||||||
2015 | 2014 | ||||||
Cash and cash equivalents at beginning of period | $ | 35,285 | $ | 39,078 | |||
Cash flows provided by operating activities: | |||||||
Net income | 15,825 | 36,424 | |||||
Adjustments to reconcile net income to net cash provided by operating activities: | |||||||
Amortization of deferred sales commissions | 950 | 1,346 | |||||
Other depreciation and amortization | 2,204 | 2,196 | |||||
Loss on disposal of property and equipment | 71 | (110 | ) | ||||
Deferred rent | 32 | (127 | ) | ||||
Change in unrealized gains on trading securities, derivative assets, derivative liabilities and partnership investments | (8,331 | ) | (10,179 | ) | |||
Net realized losses on sale of investment securities, derivative assets, derivative liabilities and partnership investments | 2,566 | 2,707 | |||||
Deferred taxes, net | 2,989 | 5,120 | |||||
Stock-based compensation | 3,568 | 2,775 | |||||
Employee taxes paid on vesting under stock incentive plans | (730 | ) | (477 | ) | |||
(Increase) decrease in assets: | |||||||
Receivables: | |||||||
Affiliates and affiliated funds, net | 703 | 179 | |||||
Customers | (1,221 | ) | 2,065 | ||||
Other assets | (2,595 | ) | (4,572 | ) | |||
Increase (decrease) in liabilities: | |||||||
Distribution fees payable | (2,402 | ) | (378 | ) | |||
Accrued compensation and benefits | (9,691 | ) | (7,755 | ) | |||
Accrued expenses and other liabilities | 467 | (2,112 | ) | ||||
Net cash provided by operating activities | 4,405 | 27,102 | |||||
Cash flows provided by investing activities: | |||||||
Net additions to property and equipment | (1,600 | ) | (701 | ) | |||
Purchases of investment securities | (7,068 | ) | (68,023 | ) | |||
Proceeds from sale of investment securities | 80,669 | 232,192 | |||||
Contributions to partnership investments | — | (38,091 | ) | ||||
Distributions from partnership investments | 23,139 | — | |||||
Net cash provided by investing activities | 95,140 | 125,377 | |||||
Cash flows used in financing activities: | |||||||
Deferred tax benefit (expense) on vesting under stock incentive plans | 56 | (10 | ) | ||||
Repurchase of common stock by Calamos Investments LLC (548,035 at June 30, 2015, and 1,779,670 at June 30, 2014 Class A common shares) | (6,744 | ) | (21,591 | ) | |||
Equity distributions paid to non-controlling interests (Calamos Interests) | (23,338 | ) | (38,897 | ) | |||
Tax distributions paid to non-controlling interests (Calamos Interests) | (9,435 | ) | (15,695 | ) | |||
Cash dividends paid to common stockholders | (5,351 | ) | (4,722 | ) | |||
Net cash used in financing activities | (44,812 | ) | (80,915 | ) | |||
Net increase in cash and cash equivalents | 54,733 | 71,564 | |||||
Cash and cash equivalents at end of period | $ | 90,018 | $ | 110,642 | |||
Supplemental disclosure of cash flow information: | |||||||
Cash paid for: | |||||||
Income taxes, net | $ | 62 | $ | 155 | |||
Interest | $ | 1,516 | $ | 2,977 | |||
See accompanying notes to consolidated financial statements.
7
CALAMOS ASSET MANAGEMENT, INC.
NOTES TO CONSOLIDATED FINANCIAL STATEMENTS
(1) Organization and Description of Business
Calamos Asset Management, Inc. (“CAM”), representing the public shares outstanding, as of June 30, 2015, owned 22.2% of the operating company, Calamos Investments LLC (“Calamos Investments”), with the remaining 77.8% privately owned by Calamos Family Partners, Inc. (“CFP”), a Delaware corporation, and John P. Calamos, Sr., the Chairman, Chief Executive Officer and Global Co-Chief Investment Officer of CAM. CAM, together with Calamos Investments and Calamos Investments’ subsidiaries (the “Company”), operates the investment advisory and distribution services businesses reported within these consolidated financial statements. CAM operates and is the sole manager, and thus controls all of the business and affairs of Calamos Investments and, as a result of this control, consolidates the financial results of Calamos Investments with its own financial results. CFP and John P. Calamos, Sr. (collectively "Calamos Interests") ownership interest, in accordance with applicable accounting guidance, is reflected and referred to within these consolidated financial statements as "non-controlling interest in Calamos Investments LLC". As shown in the diagram below, CFP also owns all of CAM’s outstanding Class B common stock, which represents 97.4% of the combined voting power of all classes of CAM’s voting stock. The graphic below illustrates our organizational and ownership structure as of June 30, 2015:
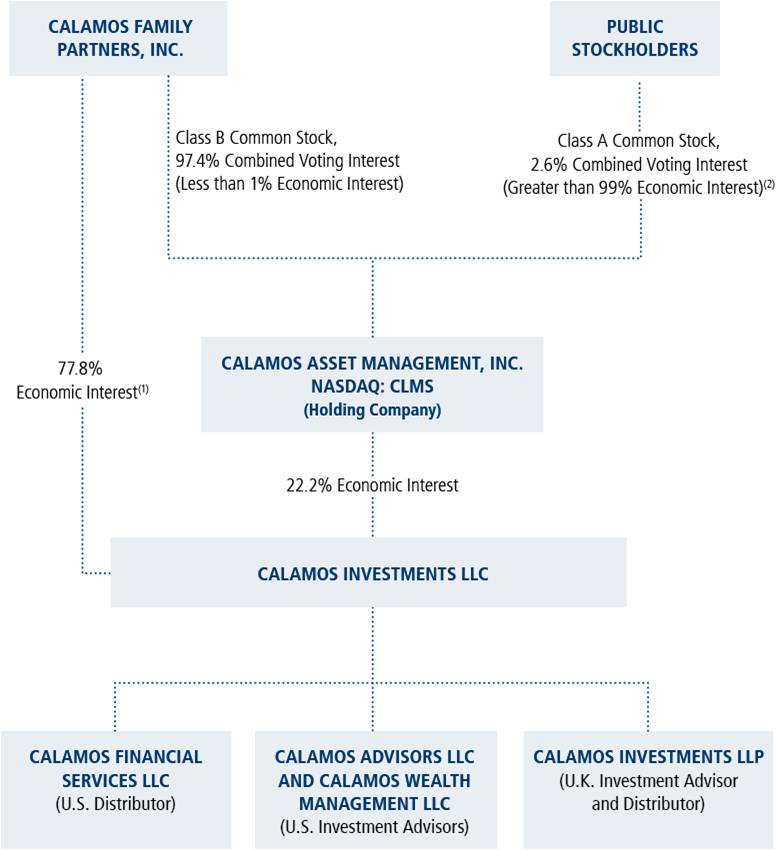
(1) | Represents combined economic interest of Calamos Family Partners, Inc. and John P. Calamos, Sr. who is also a member of Calamos Investments LLC. |
(2) | Represents combined economic interest of all public stockholders, including John P. Calamos, Sr. and John P. Calamos, Jr.’s combined 17.13% ownership interest of Class A common stock. The calculation of ownership interest includes options and restricted stock units ("RSUs") that vest within 60 days, as well as CFP’s indirect ownership interest in Class A common stock purchased by Calamos Investments LLC, pursuant to the Company’s share repurchase plan. |
8
CALAMOS ASSET MANAGEMENT, INC.
NOTES TO CONSOLIDATED FINANCIAL STATEMENTS – (Continued)
The Company primarily provides investment advisory services to individuals and institutional investors through a number of investment products that include open-end funds and closed-end funds (the “Funds”), separate accounts, offshore funds, an exchange traded fund and partnerships, as well as provides model portfolio design and oversight for separately managed accounts. The subsidiaries through which the Company provides these services include: Calamos Advisors LLC (“CAL”), a Delaware limited liability company and registered investment advisor; Calamos Financial Services LLC (“CFS”), a Delaware limited liability company and registered broker-dealer; Calamos Wealth Management LLC, a Delaware limited liability company and registered investment advisor; and Calamos Investments LLP, a United Kingdom limited liability partnership, registered investment advisor with the Financial Conduct Authority in the United Kingdom, and a global distributor of the offshore funds and Company products. For reporting purposes, the offshore funds are included within the open-end funds.
(2)Summary of Significant Accounting Policies
Basis of Presentation
The consolidated financial statements are prepared in accordance with accounting principles generally accepted in the United States of America (“GAAP”), which require the use of estimates and assumptions that affect the reported amounts of assets, liabilities, revenues and expenses, and the disclosure of contingent assets and liabilities. Management believes the accounting estimates are appropriate and reasonably stated; however, due to the inherent uncertainties in making estimates, actual amounts could differ from these estimates.
The consolidated financial statements as of June 30, 2015 and for the three and six months ended June 30, 2015, and 2014 have not been audited by the Company’s independent registered public accounting firm. In the opinion of management, these statements contain all adjustments, including those of a normal recurring nature, necessary for fair presentation of the financial condition and results of operations. The results for the interim periods presented are not necessarily indicative of the results to be obtained for a full fiscal year. This Form 10-Q filing should be read in conjunction with the Company’s Annual Report on Form 10-K for the year ended December 31, 2014.
Principles of Consolidation
The Company consolidates investments in which the Company’s ownership exceeds 50% or in which the Company operates and controls the business and affairs of the entity or is deemed to be the primary beneficiary. In order to make this determination, an analysis is performed to determine if the investment in an affiliate or partnership is a variable interest entity ("VIE"). The Company has evaluated its investments in affiliates and partnerships and has concluded that they are not VIEs. With respect to partnership investments, the limited partners have no control of the business and affairs of the partnership, no substantive ability to dissolve (liquidate) the partnership, or otherwise remove the general partner (CAL and Calamos Investments) without cause or have other substantive rights.
The consolidated financial statements include the financial statements of CAM, Calamos Investments, Calamos Investments’ wholly-owned subsidiaries, and the Company’s partnerships in which it owns a majority interest or in which it has operating control. The equity method of accounting is used for investments in which the Company has significant influence, but less than 50% ownership. All significant intercompany balances and transactions have been eliminated.
The Calamos Interests’ combined 77.8% interest in Calamos Investments at June 30, 2015 and December 31, 2014, is represented as a non-controlling interest in Calamos Investments LLC in the Company’s consolidated financial statements. Non-controlling interest in Calamos Investments is derived by multiplying the historical equity of Calamos Investments by the Calamos Interests’ aggregate ownership percentage for the periods presented. Issuances and repurchases of CAM’s common stock may result in changes to CAM’s ownership percentage and to the non-controlling interests’ ownership percentage of Calamos Investments with resulting changes reflected in the consolidated statements of changes in equity. Income is allocated based on the average ownership interest during the period in which the income is earned.
CAM owns certain assets to which it has exclusive economic rights. As of June 30, 2015 and December 31, 2014, these assets included cash, cash equivalents and investment securities of $78.6 million and $79.3 million, net current and non-current deferred tax assets of $36.7 million and $40.3 million, net current income taxes receivable of $3.8 million and $2.4 million, and a loan receivable from Calamos Investments of $25.0 million and $21.0 million, respectively, that are reported together with Calamos Investments’ consolidated assets in the consolidated statements of financial condition. Additionally, net income before income taxes of $17.6 million and $39.8 million for the six months ended June 30, 2015 and 2014, respectively, each included $654,000 and $729,000, respectively, of interest income, dividend income and realized gains and losses on cash and cash equivalents held solely by CAM. These portions of CAM’s income and expense are not affected by non-controlling interests.
Calamos Investments, through its wholly owned subsidiaries and affiliates, is indirectly the general partner and controls the operations of Calamos Global Opportunities Fund LP, for which it acquired a majority interest in the partnership during the second
9
CALAMOS ASSET MANAGEMENT, INC.
NOTES TO CONSOLIDATED FINANCIAL STATEMENTS – (Continued)
quarter of 2014. The results of this partnership are included in the Company's consolidated financial statements for the year ended December 31, 2014 and the six months ended June 30, 2015. Calamos Investments, through a wholly owned subsidiary, was indirectly the general partner and controlled the operations of Calamos Arista Strategic Fund LP, a U.S. feeder fund, and Calamos Arista Strategic Fund Ltd, an offshore feeder fund, both to Calamos Arista Strategic Master Fund LTD, a hedge fund in the Cayman Islands. As Calamos Investments was the general partner and controlled the operations of Calamos Arista Strategic Fund LP and Calamos Arista Strategic Fund Ltd, the results of these partnerships and the master fund were included in the Company’s consolidated financial results for the year ended December 31, 2014. Calamos Arista Strategic Fund LP was liquidated on December 26, 2014. The partnership redemptions were completed during the first quarter of 2015 for proceeds of $23.1 million. For the year ended December 31, 2014, the amount due to non-controlling interest of $7.7 million related to this partnership investment was presented in liabilities of partnership investments in our consolidated statements of financial condition. The operations of Calamos International Growth Fund LP were controlled by CAL, the general partner. In December 2013, the limited partners of Calamos International Growth Fund LP redeemed all of their interests in the fund. As a result, the Company deconsolidated Calamos International Growth Fund LP and accounted for this partnership investment using the equity method as of December 31, 2014. Calamos International Growth Fund LP was dissolved on April 10, 2014. See Note 5, Partnership Investments, for more discussion regarding these funds.
For the periods the partnerships are consolidated, the assets and liabilities of the partnerships are presented as partnership investments and liabilities of partnership investments, respectively, in the consolidated statements of financial condition. The net income for these partnerships are included in investment and other income in the consolidated statements of operations, and the change in partnership investments is included in contributions to or distributions from partnership investments in the consolidated statements of cash flows. The underlying assets and liabilities that are being consolidated are described in Note 5, Partnership Investments. The combined interests of all of the consolidated partnerships not owned by the Company and that are redeemable at the option of the holder, are presented as redeemable non-controlling interest in partnership investments in the Company’s consolidated financial statements for the periods those partnerships were consolidated.
The Company holds non-controlling interests in certain other partnership investments that are included in partnership investments in the consolidated statements of financial condition. These other partnership investments are accounted for under the equity method.
Restricted Cash
The Company has a $430,000 security deposit that is restricted from the Company’s general corporate use and is being reported in other non-current assets in the consolidated statements of financial condition.
Treasury Stock
On November 13, 2014, the Company announced a repurchase of up to an additional 3 million shares of the Company's outstanding Class A Common Stock primarily to continue to manage the dilution from share issuances under the Company’s incentive compensation plan. During the six months ended June 30, 2015, Calamos Investments repurchased 548,035 shares of Class A common stock, at an average purchase price of $12.31 and a total cost of $6.7 million under this repurchase program. As Calamos Investments is consolidated with CAM, the repurchased shares are reported as treasury shares. As such, CAM’s 22.2% ownership interest in these shares totaling $1.5 million is reported in treasury stock, with Calamos Interests’ 77.8% ownership interest in these shares totaling $5.2 million reported in non-controlling interest in the consolidated statements of financial condition. The total shares repurchased are not included in the calculation of basic and diluted earnings per share in accordance with GAAP.
During the three and six months ended June 30, 2015, CAM redeemed 83,445 and 240,886, respectively, Class A common shares from Calamos Investments for a value of $1.0 million and $2.8 million, respectively, which represents the fair value of the shares on the date of redemption. As Calamos Investments is consolidated with CAM, the impact of the distribution reflecting the non-controlling interest is $764,000 and $2.2 million, respectively.
During the three and six months ended June 30, 2015, dividends on shares held by Calamos Investments totaled $397,000 and $808,000, respectively. The payment of these dividends increased Calamos Investments' equity resulting in a $309,000 adjustment for the second quarter of 2015, and a $629,000 adjustment for the six months ended June 30, 2015, from additional paid in capital to non-controlling interest in Calamos Investments LLC in the consolidated statement of changes in equity. These adjustments represent Calamos Interests' ownership interest in those dividend payments.
For a comprehensive disclosure of the Company's significant accounting policies, see the Company's Annual Report on Form 10-K for the year ended December 31, 2014.
10
CALAMOS ASSET MANAGEMENT, INC.
NOTES TO CONSOLIDATED FINANCIAL STATEMENTS – (Continued)
(3)Investment Securities
The Company is required to carry all investment securities it owns at fair value and record all changes in fair value in current earnings. As such, unrealized gains and losses on trading securities, as well as realized gains and losses on all investment securities, are included in investment and other income in the consolidated statements of operations. Unrealized gains and losses on available-for-sale securities are reported, net of CAM's deferred income tax, as a separate component of accumulated other comprehensive income in equity until realized.
The following table provides a summary of investment securities as of June 30, 2015 and December 31, 2014:
(in thousands) | ||||||||||||||||
June 30, 2015 | Cost | Unrealized Gains | Unrealized Losses | Fair Value | ||||||||||||
Available-for-sale securities: | ||||||||||||||||
Funds | ||||||||||||||||
Equity | ||||||||||||||||
Global Growth | $ | 130,327 | $ | 9,810 | $ | (807 | ) | $ | 139,330 | |||||||
U.S. Growth | 64,376 | 6,731 | (52 | ) | 71,055 | |||||||||||
Value | 5,098 | 52 | (140 | ) | 5,010 | |||||||||||
Alternative | 31,117 | 1,190 | (1 | ) | 32,306 | |||||||||||
Fixed Income/High Yield | 17,843 | 60 | (176 | ) | 17,727 | |||||||||||
Convertible | 5,162 | 104 | (2 | ) | 5,264 | |||||||||||
Multi-Strategy | 1,551 | 158 | (25 | ) | 1,684 | |||||||||||
Total Funds | 255,474 | 18,105 | (1,203 | ) | 272,376 | |||||||||||
Common stock | 138 | 129 | — | 267 | ||||||||||||
Total available-for-sale securities | $ | 255,612 | $ | 18,234 | $ | (1,203 | ) | $ | 272,643 | |||||||
Trading securities: | ||||||||||||||||
Funds | ||||||||||||||||
Equity | ||||||||||||||||
U.S. Growth | $ | 5,147 | $ | 284 | $ | — | $ | 5,431 | ||||||||
Total investment securities | $ | 278,074 | ||||||||||||||
(in thousands) | ||||||||||||||||
December 31, 2014 | Cost | Unrealized Gains | Unrealized Losses | Fair Value | ||||||||||||
Available-for-sale securities: | ||||||||||||||||
Funds | ||||||||||||||||
Equity | ||||||||||||||||
Global Growth | $ | 142,610 | $ | 5,275 | $ | (1,872 | ) | $ | 146,013 | |||||||
U.S. Growth | 64,526 | 3,194 | (410 | ) | 67,310 | |||||||||||
Value | 9,979 | 286 | (171 | ) | 10,094 | |||||||||||
Alternative | 40,752 | 1,283 | (4 | ) | 42,031 | |||||||||||
Fixed Income/High Yield | 17,596 | 1 | (423 | ) | 17,174 | |||||||||||
Convertible | 10,163 | 15 | (1 | ) | 10,177 | |||||||||||
Multi-Strategy | 1,494 | 198 | (9 | ) | 1,683 | |||||||||||
Total Funds | 287,120 | 10,252 | (2,890 | ) | 294,482 | |||||||||||
Common stock | 136 | 125 | — | 261 | ||||||||||||
Total available-for-sale securities | $ | 287,256 | $ | 10,377 | $ | (2,890 | ) | $ | 294,743 | |||||||
Trading securities: | ||||||||||||||||
Funds | ||||||||||||||||
Equity | ||||||||||||||||
U.S. Growth | $ | 52,147 | $ | 33 | $ | (6,964 | ) | $ | 45,216 | |||||||
Total investment securities | $ | 339,959 | ||||||||||||||
11
CALAMOS ASSET MANAGEMENT, INC.
NOTES TO CONSOLIDATED FINANCIAL STATEMENTS – (Continued)
The investments in Funds at June 30, 2015 and December 31, 2014, of $277.8 million and $339.7 million, respectively, were invested in affiliated funds and accounts that are separately managed.
The aggregate fair value of available-for-sale investment securities that were in an unrealized loss position at June 30, 2015 and December 31, 2014 was $35.3 million and $98.1 million, respectively. As of June 30, 2015 and December 31, 2014, the Company had no investment securities that had been in a continuous loss position for 12 months or longer.
The Company recorded an other-than-temporary impairment charge of $811,000 for the three and six months ended June 30, 2015 on certain available-for-sale securities with unrealized losses. No other-than-temporary impairment charges were recorded for the three and six months ended June 30, 2014. The other-than-temporary impairment charges were reported in non-operating income (loss), in the consolidated statements of operations.
As of June 30, 2015 and December 31, 2014, the Company believes that the remaining $1.2 million and $2.9 million, respectively, in unrealized losses on certain available-for-sale securities are only temporary in nature, as these losses are a result of short-term declines in the net asset value of the funds. Further, the Company has the intent and ability to hold these securities for a period of time sufficient to allow for recovery of the market value. The Company also considered current market conditions and the nature of the securities held when determining the recoverability of those securities' market value.
The following table provides a summary of changes in investment securities for the three and six months ended June 30, 2015 and 2014:
Three Months Ended June 30, | Six Months Ended June 30, | ||||||||||||||
(in thousands) | 2015 | 2014 | 2015 | 2014 | |||||||||||
Available-for-sale securities: | |||||||||||||||
Proceeds from sales | $ | 25,572 | $ | 107,065 | $ | 40,572 | $ | 194,328 | |||||||
Gross realized gains on sales | $ | 2,013 | $ | 5,018 | $ | 2,558 | $ | 5,472 | |||||||
Trading securities: | |||||||||||||||
Change in unrealized gains (losses) | $ | (605 | ) | $ | (125 | ) | $ | 7,215 | $ | 8,437 | |||||
The table below summarizes the tax provision on unrealized gains and gains reclassified out of accumulated other comprehensive income (loss) on available-for-sale securities for the three and six months ended June 30, 2015 and 2014:
Three Months Ended June 30, 2015 | Three Months Ended June 30, 2014 | ||||||||||||||||||||||
(in thousands) | Before-Tax Amount | Tax Provision | After-Tax Amount | Before-Tax Amount | Tax Provision | After-Tax Amount | |||||||||||||||||
Available-for-sale securities: | |||||||||||||||||||||||
Changes in unrealized gains | $ | 3,039 | $ | 320 | $ | 2,719 | $ | 8,136 | $ | 635 | $ | 7,501 | |||||||||||
Reclassification adjustment for realized gains included in income | (1,657 | ) | (136 | ) | (1,521 | ) | (4,794 | ) | (479 | ) | (4,315 | ) | |||||||||||
Other comprehensive income | $ | 1,382 | $ | 184 | $ | 1,198 | $ | 3,342 | $ | 156 | $ | 3,186 | |||||||||||
Six Months Ended June 30, 2015 | Six Months Ended June 30, 2014 | ||||||||||||||||||||||
(in thousands) | Before-Tax Amount | Tax Provision | After-Tax Amount | Before-Tax Amount | Tax Provision | After-Tax Amount | |||||||||||||||||
Available-for-sale securities: | |||||||||||||||||||||||
Changes in unrealized gains | $ | 12,055 | $ | 1,084 | $ | 10,971 | $ | 10,654 | $ | 971 | $ | 9,683 | |||||||||||
Reclassification adjustment for realized gains included in income | (2,510 | ) | (452 | ) | (2,058 | ) | (5,610 | ) | (546 | ) | (5,064 | ) | |||||||||||
Other comprehensive income | $ | 9,545 | $ | 632 | $ | 8,913 | $ | 5,044 | $ | 425 | $ | 4,619 | |||||||||||
Reclassification of realized gains out of accumulated other comprehensive income are reported in non-operating income (loss), in investment income, in the consolidated statement of operations. See Note 9, Non-Operating Income (Loss).
12
CALAMOS ASSET MANAGEMENT, INC.
NOTES TO CONSOLIDATED FINANCIAL STATEMENTS – (Continued)
(4)Derivative Assets and Liabilities
The Company may use exchange-traded option contracts as an economic hedge of price changes in its investment securities portfolio in order to reduce the volatility equity markets have on the fair value of the Company's corporate investment portfolio and that could result in realized or unrealized gains and losses. The Company's investment securities, totaling $278.1 million at June 30, 2015, consist primarily of positions in several Calamos equity and fixed income funds. The equity price risk in the investment portfolio may be hedged using exchange-traded option contracts that correlate most closely with the change in value of the portfolio being hedged. The use of these option contracts are part of a hedge overlay strategy to minimize downside risk in the hedged portfolio. The Company may adjust its hedge position in response to movement and volatility in prices and changes in the composition of the hedged portfolio, but generally is not actively buying and selling contracts.
The Company has elected not to offset its derivative assets with its derivative liabilities even if a right of offset exists. When applicable, the fair value of option contracts is reported on a gross basis in derivative assets and derivative liabilities in the consolidated statements of financial condition. Net gains and losses on these contracts are reported in investment and other income in the consolidated statements of operations. The Company did not record a gain or loss for the three and six months ended June 30, 2015 and 2014. The Company may use these derivatives for risk management purposes but does not designate the contracts as hedges for accounting purposes. The Company had no derivative instruments outstanding as of June 30, 2015 and 2014.
(5)Partnership Investments
Presented below are the underlying assets and liabilities of the partnerships that the Company reports on a consolidated basis, as well as partnership investments that the Company accounts for under the equity method. These investments are presented as partnership investments and liabilities of partnership investments, respectively, in its consolidated statements of financial condition as of June 30, 2015 and December 31, 2014.
(in thousands) | June 30, 2015 | December 31, 2014 | |||||
Consolidated partnerships: | |||||||
Assets | |||||||
Securities owned | $ | 108,264 | $ | 103,079 | |||
Cash and cash equivalents | 5,445 | 39,205 | |||||
Receivables for securities sold | 305 | — | |||||
Other current assets | 192 | 1,188 | |||||
Exchange-traded option contracts, net | 63 | 201 | |||||
Total assets of consolidated partnerships | $ | 114,269 | $ | 143,673 | |||
Liabilities | |||||||
Payables for securities purchased | $ | — | $ | (2,256 | ) | ||
Due to non-controlling interest in partnership investments | — | (7,719 | ) | ||||
Accrued expenses and other current liabilities | (253 | ) | (142 | ) | |||
Total | $ | (253 | ) | $ | (10,117 | ) | |
Equity method investment in partnerships | $ | 44 | $ | 50 | |||
Profits and losses are allocated to the general partner and limited partners in proportion to their ownership interests at the beginning of each month. Partners' admissions, additional contributions and withdrawals are permitted on a monthly basis.
Calamos Arista Strategic Fund LP was liquidated on December 26, 2014. The partnership redemptions were completed during the first quarter of 2015 for proceeds of $23.1 million. This investment is presented as a consolidated partnership as of the year ended December 31, 2014, in the table above.
During the second quarter of 2014, Calamos Investments, through its wholly owned subsidiaries and affiliates, acquired a majority interest in Calamos Global Opportunities Fund LP. This investment is presented as a consolidated partnership as of December 31, 2014, and June 30, 2015.
13
CALAMOS ASSET MANAGEMENT, INC.
NOTES TO CONSOLIDATED FINANCIAL STATEMENTS – (Continued)
(6)Fair Value Measurements
The Company utilizes a three-tier fair value hierarchy which prioritizes the inputs used in measuring fair value as follows: Level 1 — observable inputs such as quoted prices for identical assets and liabilities in active markets; Level 2 — inputs, other than the quoted prices in active markets, that are observable either directly or indirectly (including quoted prices of similar securities, interest rates, credit risk, fair value adjustments to quoted foreign securities, etc.); and Level 3 — unobservable inputs in which there is little or no market data, and require the reporting entity to develop its own assumptions. For each period presented, the Company did not have any assets or liabilities measured at fair value using Level 3 measurements. Transfers between levels are measured at the end of the reporting period. The Company had no transfers between levels during the period.
Investments are presented in the consolidated financial statements at fair value in accordance with GAAP. Investments in open-end funds are stated at fair value based on end of day published net asset values of shares owned by the Company. The fair value of investments in open-end funds was $255.0 million and $312.8 million at the end of June 30, 2015 and December 31, 2014, respectively. There are no unfunded commitments related to these investments. These investments may be redeemed daily with a redemption notice period of up to seven days. Investments in securities traded on a national securities exchange are stated at the last reported sales price on the day of valuation. Other securities, including derivatives, traded in the over-the-counter market and listed securities for which no sale was reported on that date are stated at the last quoted bid price. However, short sales positions and call options written are reported at the last quoted ask price. Convertible bonds, fixed income securities and other securities for which quotations are not readily available are valued at fair value based on observable inputs such as market prices for similar instruments as validated by third party pricing agencies and the Company’s prime broker. Debt securities are valued based upon prices received from an independent pricing service or from a dealer or broker who makes markets in such securities. Pricing services utilize various observable market data and as such, debt securities are generally categorized as Level 2.
The following tables provide the hierarchy of inputs used to derive the fair value of the Company’s assets and liabilities measured at fair value on a recurring basis as of June 30, 2015 and December 31, 2014, respectively. Foreign currency contracts are carried in the Company's partnership investments and are presented on a net basis where the right of offset exists, and had no impact for either period presented.
14
CALAMOS ASSET MANAGEMENT, INC.
NOTES TO CONSOLIDATED FINANCIAL STATEMENTS – (Continued)
Fair Value Measurements Using | ||||||||||||
(in thousands) Description | June 30, 2015 | Quoted Prices in Active Markets for Identical Assets and Liabilities (Level 1) | Significant Other Observable Inputs (Level 2) | |||||||||
Cash and cash equivalents | ||||||||||||
Money market funds | $ | 26,220 | $ | 26,220 | $ | — | ||||||
Investment securities (Note 3) | ||||||||||||
Funds | ||||||||||||
Equity | ||||||||||||
Global Growth | 139,330 | 139,330 | — | |||||||||
U.S. Growth | 76,486 | 76,486 | — | |||||||||
Value | 5,010 | 5,010 | — | |||||||||
Alternative | 33,672 | 33,672 | — | |||||||||
Fixed Income/High Yield | 17,727 | 12,575 | 5,152 | |||||||||
Convertible | 5,264 | 5,264 | — | |||||||||
Multi-Strategy | 1,684 | 1,684 | — | |||||||||
Total Funds | 279,173 | 274,021 | 5,152 | |||||||||
Common stock | 267 | 267 | — | |||||||||
Investment securities | 279,440 | 274,288 | 5,152 | |||||||||
Securities and derivatives owned by partnership investments (Note 5) | ||||||||||||
Common stocks | 56,246 | 29,163 | 27,083 | |||||||||
Preferred stocks | 6,257 | 5,337 | 920 | |||||||||
Convertible bonds | 43,636 | — | 43,636 | |||||||||
Corporate bonds | 2,125 | — | 2,125 | |||||||||
Money market funds | 5,396 | 5,396 | — | |||||||||
Foreign currency | 49 | 49 | — | |||||||||
Exchange-traded put option contracts | 63 | 63 | — | |||||||||
113,772 | 40,008 | 73,764 | ||||||||||
Securities sold but not yet purchased (Note 3) | ||||||||||||
Common stocks | (1,366 | ) | (1,366 | ) | — | |||||||
Total | $ | 418,066 | $ | 339,150 | $ | 78,916 | ||||||
15
CALAMOS ASSET MANAGEMENT, INC.
NOTES TO CONSOLIDATED FINANCIAL STATEMENTS – (Continued)
Fair Value Measurements Using | ||||||||||||
(in thousands) Description | December 31, 2014 | Quoted Prices in Active Markets for Identical Assets and Liabilities (Level 1) | Significant Other Observable Inputs (Level 2) | |||||||||
Cash and cash equivalents | ||||||||||||
Money market funds | $ | 1,209 | $ | 1,209 | $ | — | ||||||
Investment securities (Note 3) | ||||||||||||
Funds | ||||||||||||
Equity | ||||||||||||
Global Growth | 146,013 | 146,013 | — | |||||||||
U.S. Growth | 112,526 | 112,526 | — | |||||||||
Value | 12,218 | 12,218 | — | |||||||||
Alternative | 42,031 | 42,031 | — | |||||||||
Fixed Income/High Yield | 17,174 | 12,174 | 5,000 | |||||||||
Convertible | 11,021 | 11,021 | — | |||||||||
Multi-Strategy | 1,683 | 1,683 | — | |||||||||
Total Funds | 342,666 | 337,666 | 5,000 | |||||||||
Common stock | 261 | 261 | — | |||||||||
Investment securities | 342,927 | 337,927 | 5,000 | |||||||||
Securities and derivatives owned by partnership investments (Note 5) | ||||||||||||
Common stocks | 51,403 | 26,237 | 25,166 | |||||||||
Preferred stocks | 5,736 | 2,281 | 3,455 | |||||||||
Convertible bonds | 41,119 | — | 41,119 | |||||||||
Corporate bonds | 4,821 | — | 4,821 | |||||||||
Money market funds | 37,060 | 7,851 | 29,209 | |||||||||
Foreign currency | 513 | 513 | — | |||||||||
Exchange-traded put option contracts | 201 | 201 | — | |||||||||
140,853 | 37,083 | 103,770 | ||||||||||
Securities sold but not yet purchased (Note 3) | ||||||||||||
Common stocks | (2,968 | ) | (2,968 | ) | — | |||||||
Total | $ | 482,021 | $ | 373,251 | $ | 108,770 | ||||||
The fair value of the Company’s long-term debt, which has a total carrying value of $46.0 million at June 30, 2015 and December 31, 2014, was $53.4 million and $54.2 million, respectively. During the third quarter of 2014, $46.2 million of senior notes outstanding were repaid. The fair value and carrying value of the Company’s payment obligation was $1.7 million at June 30, 2015, and December 31, 2014. This obligation is associated with the Company's purchase of Black Capital LLC in 2012, reported in other current liabilities in the consolidated statements of financial condition. These fair value estimates are calculated using discounted cash flows based on the Company’s incremental borrowing rates and market inputs for similar bonds for the debt, and the treasury yield curve plus market spread for the payment obligation. The fair values of the debt and payment obligation are based on Level 2 inputs within the fair value hierarchy.
The carrying value of all other financial instruments approximates fair value due to the short maturities of these financial instruments.
(7)Loans Payable
The Company has access to margin loans for the settlement of call options, as well as an additional source of liquidity. The interest rate that can be charged on margin loans is 1.5% per annum, based on the brokerage firm’s lending rate. These loans are due on demand. The Company can borrow up to 70% of its marginable securities on deposit with its brokerage firm. The Company had no margin loan balances outstanding at June 30, 2015 and December 31, 2014.
16
CALAMOS ASSET MANAGEMENT, INC.
NOTES TO CONSOLIDATED FINANCIAL STATEMENTS – (Continued)
(8)Stock-Based Compensation
Under the Company’s incentive compensation plan, certain employees of the Company receive stock-based compensation comprised of stock options and restricted stock units (“RSUs”). Historically, RSUs have been settled with newly issued shares so that no cash was used by the Company to settle awards; however, the Company may also use treasury shares upon the exercise of stock options and upon conversion of RSUs. The Company’s Annual Report on Form 10-K for the year ended December 31, 2014 provides details of this plan and its provisions.
During the six months ended June 30, 2015, the Company granted 780,649 RSUs and there were 282,546 RSUs forfeited. During the same period, the Company granted no stock options and there were 251,806 stock options forfeited.
During the six months ended June 30, 2015, 298,558 RSUs vested with 57,672 units withheld for taxes and 240,886 RSUs converted into an equal number of shares of CAM’s Class A common stock. The total intrinsic value and the fair value of the converted shares was $3.1 million. The total tax benefit realized in connection with the vesting of the RSUs during the six months ended June 30, 2015 was $362,000, as the Company receives tax benefits based upon the portion of Calamos Investments’ expense that it recognizes.
During the six months ended June 30, 2015 and 2014, compensation expense recorded in connection with the RSUs and stock options was $3.6 million and $2.8 million, respectively, of which $792,000 and $617,000, respectively, was credited as additional paid-in capital after giving effect to the non-controlling interests. The amount of deferred tax asset created was $293,000 and $228,000 during the six months ended June 30, 2015 and 2014, respectively. As of June 30, 2015, $18.5 million of total unrecognized compensation expense related to unvested stock option and RSU awards is expected to be recognized over a weighted-average period of 3.0 years.
(9)Non-Operating Income (Loss)
Non-operating income (loss) was comprised of the following components for the three and six months ended June 30, 2015 and 2014:
Three Months Ended June 30, | Six Months Ended June 30, | ||||||||||||||
(in thousands) | 2015 | 2014 | 2015 | 2014 | |||||||||||
Interest income | $ | 45 | $ | 50 | $ | 89 | $ | 89 | |||||||
Interest expense | (766 | ) | (1,510 | ) | (1,540 | ) | (3,014 | ) | |||||||
Net interest expense | (721 | ) | (1,460 | ) | (1,451 | ) | (2,925 | ) | |||||||
Investment income | 241 | 9,912 | 5,767 | 10,769 | |||||||||||
Dividend income | 299 | 347 | 526 | 1,010 | |||||||||||
Miscellaneous other income | 152 | 205 | 136 | 268 | |||||||||||
Investment and other income | 692 | 10,464 | 6,429 | 12,047 | |||||||||||
Non-operating income (loss) | $ | (29 | ) | $ | 9,004 | $ | 4,978 | $ | 9,122 | ||||||
17
CALAMOS ASSET MANAGEMENT, INC.
NOTES TO CONSOLIDATED FINANCIAL STATEMENTS – (Continued)
(10)Income Taxes
Calamos Investments is subject to certain income-based state taxes; therefore, income taxes reflect not only the portion attributed to CAM stockholders but also a portion of income taxes attributable to non-controlling interests.
Three Months Ended June 30, | Six Months Ended June 30, | ||||||||||||||
2015 | 2014 | 2015 | 2014 | ||||||||||||
(in thousands) | |||||||||||||||
Income tax provision | $ | 1,275 | $ | 2,046 | $ | 1,740 | $ | 3,408 | |||||||
Income tax provision attributable to non-controlling interest in Calamos Investments | (17 | ) | (34 | ) | (31 | ) | (79 | ) | |||||||
Income tax provision attributable to CAM | 1,258 | 2,012 | 1,709 | 3,329 | |||||||||||
Net income attributable to CAM | 2,033 | 3,228 | 2,134 | 5,367 | |||||||||||
Income before taxes attributable to CAM | $ | 3,291 | $ | 5,240 | $ | 3,843 | $ | 8,696 | |||||||
CAM’s effective income tax rate | 38.2 | % | 38.4 | % | 44.5 | % | 38.3 | % | |||||||
CAM's effective income tax rate was 38.2% for the second quarter of 2015, compared with 38.4% for the second quarter of 2014. For the first six months of 2015, CAM's effective income tax rate was 44.5%, compared with 38.3% for the first six months of 2014, a result of $238,000 of deferred tax expense related to expired employee stock options.
As of December 31, 2014, the Company's total capital loss carryforward was $456,000 which will expire in 2017, if not used before the expiration date. As of June 30, 2015, the Company did not have a valuation allowance on this deferred tax asset.
(11)Earnings Per Share
The following table reflects the calculation of basic and diluted earnings per share:
Three Months Ended June 30, | Six Months Ended June 30, | ||||||||||||||
(in thousands, except per share amounts) | 2015 | 2014 | 2015 | 2014 | |||||||||||
Earnings per share – basic: | |||||||||||||||
Earnings available to common shareholders | $ | 2,033 | $ | 3,228 | $ | 2,134 | $ | 5,367 | |||||||
Weighted average shares outstanding | 17,790 | 18,243 | 17,831 | 18,659 | |||||||||||
Earnings per share – basic | $ | 0.11 | $ | 0.18 | $ | 0.12 | $ | 0.29 | |||||||
Earnings per share – diluted: | |||||||||||||||
Earnings available to common shareholders | $ | 2,033 | $ | 3,228 | $ | 2,134 | $ | 5,367 | |||||||
Weighted average shares outstanding | 17,790 | 18,243 | 17,831 | 18,659 | |||||||||||
Dilutive impact of restricted stock units | 846 | 805 | 788 | 686 | |||||||||||
Weighted average shares outstanding | 18,636 | 19,048 | 18,619 | 19,345 | |||||||||||
Earnings per share – diluted | $ | 0.11 | $ | 0.17 | $ | 0.11 | $ | 0.28 | |||||||
When dilutive, diluted shares outstanding are calculated (a) assuming that Calamos Interests exchanged all of their ownership interest in Calamos Investments and their CAM Class B common stock for shares of CAM’s Class A common stock (the "Exchange") and (b) including the effect of outstanding dilutive equity incentive compensation awards. As of June 30, 2015, and 2014, the impact of the Exchange was anti-dilutive and, therefore, excluded from the calculation of diluted earnings per share.
The Company uses the treasury stock method to reflect the dilutive effect of unvested RSUs and unexercised stock options on diluted earnings per share. Under the treasury stock method, if the average market price of common stock increases above the option’s exercise price, the proceeds that would be assumed to be realized from the exercise of the option would be used to acquire outstanding shares of common stock. However, the awards may be anti-dilutive even when the market price of the underlying stock exceeds the option’s exercise price. This result is possible because compensation cost attributed to future services and not yet recognized is included as a component of the assumed proceeds upon exercise. The dilutive effect of such options and RSUs would increase the weighted average number of shares used in the calculation of diluted earnings per share.
18
CALAMOS ASSET MANAGEMENT, INC.
NOTES TO CONSOLIDATED FINANCIAL STATEMENTS – (Continued)
The Company amended its certificate of incorporation requiring that the Exchange be based on a fair value approach (details of the amendment are set forth in the Company’s Schedule 14C filed with the Securities and Exchange Commission on January 12, 2009). The amendment results in the same or fewer shares of Class A common stock being issuable at the time of the Exchange.
The shares issuable upon the Exchange as presented are estimated solely on the formula as described in Schedule 14C that does not necessarily reflect all inputs used in a fair valuation. It is critical to note that this formula does not incorporate certain economic factors and as such, in the event of an actual Exchange, the majority of the Company’s independent directors may determine the fair market value of CAM’s net assets and its ownership in Calamos Investments. For example, premiums and/or discounts for control and marketability as well as a different discount rate for future cash flows may be applied. Therefore, the directors’ valuation may result in the actual number of shares being materially different from the shares presented. Further, based upon currently available information, the Company believes it is unlikely that any Exchange would transpire without a fair market valuation of CAM’s net assets and possibly an agreement by Calamos Interests to Exchange, based upon that fair market valuation.
The following table shows the number of shares which were excluded from the computation of diluted earnings per share as they were anti-dilutive:
Three Months Ended June 30, | Six Months Ended June 30, | ||||||||||
2015 | 2014 | 2015 | 2014 | ||||||||
Shares of Class A common stock issuable upon an Exchange of Calamos Interests’ ownership in Calamos Investments* | 23,495,196 | 30,782,715 | 23,495,196 | 30,782,715 | |||||||
Restricted stock units | 5,250 | — | 11,874 | — | |||||||
Stock options | 1,177,361 | 1,970,507 | 1,177,361 | 1,970,507 | |||||||
Total | 24,677,807 | 32,753,222 | 24,684,431 | 32,753,222 | |||||||
* Number of shares calculated with the value of Calamos Investments determined by using the closing price of our shares as of June 30, 2015 ($12.25) and June 30, 2014 ($13.39) as well as assuming said closing prices fully reflect all of CAM's assets; including the application of a 12% discount rate to certain deferred tax assets at each of June 30, 2015 and 2014. The value of Calamos Investments is then multiplied by Calamos Interests' percentage ownership in Calamos Investments, with the result divided by the applicable period-end closing price. See Note 2, Summary of Significant Accounting Policies - Principles of Consolidation, for a description of certain assets owned by CAM.
(12)Commitments and Contingencies
On March 31, 2015, the initial public offering of a Calamos-sponsored closed-end fund was completed with underwriters of the closed-end fund subsequently exercising a portion of their over-allotment option, the closing of which over-allotment option occurred on May 13, 2015. As contemplated in the fund's prospectus, CAL, the fund's investment adviser has implemented a share purchase program pursuant to which CAL will, through a plan agent, purchase up to $20 million of common shares of the fund in the open market, subject to applicable federal securities laws as well as to a variety of market and discount conditions and a daily purchase limit. The purchase plan, which seeks to provide increased liquidity for the fund's common shares, commenced on July 7, 2015 and will run through February 25, 2016. Subsequent to June 30, 2015, CAL purchased $2.7 million of common shares of the fund under this program.
In the normal course of business, the Company may be party to various legal proceedings from time to time. Management believes that a current complaint filed against CAL and CFS, alleging breaches of fiduciary duties with respect to the receipt of advisory, distribution and servicing fees paid by an open-end investment company advised by CAL, is without merit and CAL and CFS intend to defend themselves vigorously against the allegations. Currently, management believes that the ultimate resolution of this legal proceeding will not materially affect the Company’s business, financial position or results of operations and that the likelihood of a material adverse impact is remote.
(13)Recently Issued Accounting Pronouncements
The Company has reviewed all newly issued accounting pronouncements that are applicable to its business and to the preparation of its consolidated financial statements, including those not yet required to be adopted. The Company does not believe any such pronouncements will have a material effect on the Company’s financial position or results of operations. Accounting guidance that will become effective in future years, with respect to the Company’s consolidated financial statements, is described below:
In February 2015, the Financial Accounting Standards Board ("FASB") issued an accounting update amending the consolidation requirements under GAAP. This standard modifies existing consolidation guidance for reporting organizations that are required
19
CALAMOS ASSET MANAGEMENT, INC.
NOTES TO CONSOLIDATED FINANCIAL STATEMENTS – (Continued)
to evaluate whether they should consolidate certain legal entities. This guidance is effective for annual and interim periods beginning after December 15, 2015, and requires either a retrospective or a modified retrospective approach to adoption. Early adoption is permitted. The Company is currently evaluating the potential impact of this standard on its results of operations, cash flows or financial position, as well as the available transition methods.
In May 2014, the FASB issued new guidance on revenue from contracts with customers. The new revenue recognition standard provides a five-step analysis of transactions to determine when and how revenue is recognized. The core principle of the guidance is that an entity should recognize revenue to depict the transfer of promised goods or services to customers in an amount that reflects the consideration to which the entity expects to be entitled in exchange for those goods or services. In July 2015, the FASB decided to defer the effective date of the new revenue guidance by one year to annual reporting periods beginning after December 15, 2017, with early adoption being permitted for annual periods beginning after December 15, 2016. The Company's effective date is January 1, 2018. The Company is evaluating the effect of adopting this new accounting guidance but does not expect adoption will have a material impact on its results of operations, cash flows or financial position.
Item 2. Management’s Discussion and Analysis of Financial Condition and Results of Operations
We are a firm of 351 full-time associates that primarily provides investment advisory services to institutions and individuals, managing and servicing $24.4 billion and $25.8 billion in assets under management as of June 30, 2015 and 2014, respectively. Assets under management do not include assets under advisement of $680 million and $781 million as of June 30, 2015 and 2014, respectively, for which the Company provides model portfolio design and oversight.
Our operating results fluctuate primarily due to changes in the total value and composition of our assets under management. The value and composition of our assets under management are, and will continue to be, influenced by a variety of factors including: purchases and redemptions of shares of open-end funds; net inflows into and withdrawals from separate accounts that we manage; fluctuations in the financial markets around the world that result in appreciation or depreciation of assets under management; and the number and types of our investment strategies and products.
We market our investment strategies to our clients through a variety of products designed to suit their investment needs. We currently categorize the portfolios that we manage within four investment product types captured in our funds and separate accounts. The following table lists our assets under management by product as of June 30, 2015 and 2014.
June 30, | |||||||
(in millions) | 2015 | 2014 | |||||
Funds | |||||||
Open-end funds | $ | 13,863 | $ | 16,072 | |||
Closed-end funds | 6,977 | 6,511 | |||||
Total funds | 20,840 | 22,583 | |||||
Separate Accounts | |||||||
Institutional accounts | 2,583 | 2,195 | |||||
Managed accounts | 1,009 | 977 | |||||
Total separate accounts | 3,592 | 3,172 | |||||
Total assets under management | $ | 24,432 | $ | 25,755 | |||
Our revenues are substantially comprised of investment management fees earned under contracts with funds and separate accounts that we manage or service. Our revenues are also comprised of distribution and underwriting fees, including asset-based distribution and/or service fees received pursuant to Rule 12b-1 plans. Investment management fees and distribution and underwriting fees may fluctuate based on a number of factors including: the total value and composition of our assets under management; market appreciation and depreciation on investments; the level of net inflows and outflows, which represent the sum of new and existing client funding, withdrawals and terminations; and purchases and redemptions of open-end fund shares. The mix of assets under management among our investment products impacts our revenues as our fee schedules vary by product.
Our largest operating expenses are typically related to: employee compensation and benefits expenses, which include salaries, incentive compensation and related benefits costs; distribution expenses, which include open-end funds distribution cost (such as Rule 12b-1 payments) and amortization of deferred sales commissions; and marketing and sales promotion expenses, which include expenses necessary to market products offered by us. Operating expenses may fluctuate due to a number of factors including variations in staffing and compensation, changes in distribution expense as a result of fluctuations in open-end fund net sales and market appreciation or depreciation, and marketing-related expenses that include supplemental distribution payments.
20
Operating Results
Second Quarter and Six Months Ended June 30, 2015 Compared with Second Quarter and Six Months Ended June 30, 2014
Assets Under Management
Assets under management were $24.4 billion and $25.8 billion as of June 30, 2015 and 2014, respectively, and consisted of 85% funds and 15% separate accounts as of June 30, 2015, and 88% funds and 12% separate accounts as of June 30, 2014.
Three Months Ended June 30, | Six Months Ended June 30, | ||||||||||||||||||||||||||
Change | Change | ||||||||||||||||||||||||||
(in millions) | 2015 | 2014 | Amount | Percent | 2015 | 2014 | Amount | Percent | |||||||||||||||||||
Open-end Funds | |||||||||||||||||||||||||||
Beginning assets under management | $ | 14,334 | $ | 16,009 | $ | (1,675 | ) | (10)% | $ | 14,790 | $ | 16,128 | $ | (1,338 | ) | (8)% | |||||||||||
Sales | 575 | 947 | (372 | ) | (39) | 1,299 | 2,160 | (861 | ) | (40) | |||||||||||||||||
Redemptions | (1,148 | ) | (1,328 | ) | 180 | 14 | (2,646 | ) | (2,744 | ) | 98 | 4 | |||||||||||||||
Market appreciation | 102 | 444 | (342 | ) | (77) | 420 | 528 | (108 | ) | (20) | |||||||||||||||||
Ending assets under management | 13,863 | 16,072 | (2,209 | ) | (14) | 13,863 | 16,072 | (2,209 | ) | (14) | |||||||||||||||||
Average assets under management | 14,253 | 15,835 | (1,582 | ) | (10) | 14,404 | 15,925 | (1,521 | ) | (10) | |||||||||||||||||
Closed-end Funds | |||||||||||||||||||||||||||
Beginning assets under management | 6,758 | 6,337 | 421 | 7 | 6,211 | 6,266 | (55 | ) | (1) | ||||||||||||||||||
Sales | 262 | 44 | 218 | * | 795 | 52 | 743 | * | |||||||||||||||||||
Market appreciation (depreciation) | (43 | ) | 130 | (173 | ) | * | (29 | ) | 193 | (222 | ) | * | |||||||||||||||
Ending assets under management | 6,977 | 6,511 | 466 | 7 | 6,977 | 6,511 | 466 | 7 | |||||||||||||||||||
Average assets under management | 7,027 | 6,329 | 698 | 11 | 6,635 | 6,310 | 325 | 5 | |||||||||||||||||||
Institutional Accounts | |||||||||||||||||||||||||||
Beginning assets under management | 2,406 | 2,757 | (351 | ) | (13) | 1,576 | 3,081 | (1,505 | ) | (49) | |||||||||||||||||
Sales | 302 | 64 | 238 | * | 1,153 | 157 | 996 | * | |||||||||||||||||||
Redemptions | (146 | ) | (704 | ) | 558 | 79 | (228 | ) | (1,156 | ) | 928 | 80 | |||||||||||||||
Market appreciation | 21 | 78 | (57 | ) | (73) | 82 | 113 | (31 | ) | (27) | |||||||||||||||||
Ending assets under management | 2,583 | 2,195 | 388 | 18 | 2,583 | 2,195 | 388 | 18 | |||||||||||||||||||
Average assets under management | 2,491 | 2,392 | 99 | 4 | 2,177 | 2,621 | (444 | ) | (17) | ||||||||||||||||||
Managed Accounts | |||||||||||||||||||||||||||
Beginning assets under management | 978 | 1,044 | (66 | ) | (6) | 929 | 1,068 | (139 | ) | (13) | |||||||||||||||||
Sales | 65 | 22 | 43 | * | 141 | 41 | 100 | * | |||||||||||||||||||
Redemptions | (32 | ) | (117 | ) | 85 | 73 | (80 | ) | (156 | ) | 76 | 49 | |||||||||||||||
Market appreciation (depreciation) | (2 | ) | 28 | (30 | ) | * | 19 | 24 | (5 | ) | (21) | ||||||||||||||||
Ending assets under management | 1,009 | 977 | 32 | 3 | 1,009 | 977 | 32 | 3 | |||||||||||||||||||
Average assets under management | 992 | 1,010 | (18 | ) | (2) | 976 | 1,028 | (52 | ) | (5) | |||||||||||||||||
Total Assets Under Management | |||||||||||||||||||||||||||
Beginning assets under management | 24,476 | 26,147 | (1,671 | ) | (6) | 23,506 | 26,543 | (3,037 | ) | (11) | |||||||||||||||||
Sales | 1,204 | 1,077 | 127 | 12 | 3,388 | 2,410 | 978 | 41 | |||||||||||||||||||
Redemptions | (1,326 | ) | (2,149 | ) | 823 | 38 | (2,954 | ) | (4,056 | ) | 1,102 | 27 | |||||||||||||||
Market appreciation | 78 | 680 | (602 | ) | (89) | 492 | 858 | (366 | ) | (43) | |||||||||||||||||
Ending assets under management | $ | 24,432 | $ | 25,755 | $ | (1,323 | ) | (5) | $ | 24,432 | $ | 25,755 | $ | (1,323 | ) | (5) | |||||||||||
Average assets under management | $ | 24,763 | $ | 25,566 | $ | (803 | ) | (3)% | $ | 24,192 | $ | 25,884 | $ | (1,692 | ) | (7)% | |||||||||||
________________
* Not meaningful
Fund inflows in the second quarter and first six months of 2015 were primarily due to sales in our multi-strategy (closed-end funds), alternative, global growth, and U.S. growth strategies, but were not sufficient to overcome the aggregate outflows sustained from redemptions in our U.S. growth, alternative, and global growth strategies. Net redemptions in our funds were $311 million in the second quarter of 2015, compared with net redemptions of $337 million in the second quarter of 2014. Appreciation of $59 million in the second quarter of 2015 was $515 million lower than market appreciation of $574 million in the second quarter of
21
2014. Net redemptions of $552 million for the first six months of 2015 represent an unfavorable change of $20 million from redemptions of $532 million for the first six months of 2014. Market appreciation in all of our funds totaled $391 million in the first six months of 2015, and $721 million in the first six months of 2014.
Separate accounts, which represent accounts we manage for both institutions and individuals, combined net sales were $189 million in the second quarter of 2015, compared with net redemptions of $735 million in the second quarter of 2014. Institutional net sales of $156 million, driven primarily from U.S. growth strategies, represent a favorable change of $796 million compared with net redemptions of $640 million in the second quarter of 2014. Managed account net sales were $33 million, compared with net redemptions of $95 million in the second quarter of 2014. Separate account combined appreciation in the second quarter of 2015 was $19 million, compared with appreciation of $106 million in the second quarter of 2014.
Separate account net sales in the first six months of 2015 were $1.0 billion, compared with net redemptions of $1.1 billion in the first six months of 2014. Institutional net sales were $925 million in the first six months of 2015, compared with net redemptions of $1.0 billion in the first six months of 2014. Institutional account appreciation was $82 million in the first six months of 2015, compared with $113 million in the first six months of 2014. In the first six months of 2015, managed account net sales were $61 million, an improvement of $176 million from net redemptions of $115 million in the first six months of 2014.
Financial Overview
Three Months Ended June 30, | Six Months Ended June 30, | ||||||||||||||||||||||||||
Change | Change | ||||||||||||||||||||||||||
2015 | 2014 | Amount | Percent | 2015 | 2014 | Amount | Percent | ||||||||||||||||||||
(in thousands, except margin) | |||||||||||||||||||||||||||
Operating income | $ | 14,092 | $ | 16,634 | $ | (2,542 | ) | (15)% | $ | 12,587 | $ | 30,710 | $ | (18,123 | ) | (59)% | |||||||||||
Operating margin | 23.4 | % | 26.4 | % | (3.0 | )% | (11)% | 10.7 | % | 24.2 | % | (13.5 | )% | (56)% | |||||||||||||
Net income attributable to Calamos Asset Management, Inc. | $ | 2,033 | $ | 3,228 | $ | (1,195 | ) | (37)% | $ | 2,134 | $ | 5,367 | $ | (3,233 | ) | (60)% | |||||||||||
Operating income for the second quarter of 2015 was $14.1 million, compared with operating income of $16.6 million for the second quarter of 2014. Operating margin for the second quarter of 2015 decreased to 23.4% from 26.4% for the second quarter of 2014. Operating income for the first six months of 2015 decreased by 59% to $12.6 million from $30.7 million for the same period a year ago. Operating margin was 10.7% for the first six months of 2015, a decline from 24.2% for the first six months of 2014. The decrease in both operating income and operating margin in the first six months of 2015 was primarily attributable to closed-end fund launch expenses of $11.5 million in the first quarter of 2015. Excluding the closed-end fund launch, non-GAAP operating income was $24.1 million for the first six months of 2015, compared with $30.7 million in the first six months of 2014, and non-GAAP operating margin was 20.5% for the first six months of 2015, compared with 24.2% for the first six months of 2014. See "Supplemental Non-GAAP Financial Measures" for descriptions of non-GAAP financial measures and a reconciliation of non-GAAP financial measures to GAAP financial measures.
Revenues
Total revenues decreased by $2.7 million, or 4%, to $60.4 million for the second quarter of 2015 from $63.0 million for the second quarter of 2014. Total revenues decreased by $9.2 million, or 7%, to $117.8 million for the first six months of 2015, from $126.9 million for the first six months of 2014. The decrease was primarily due to lower investment management fees and distribution and underwriting fees.
Three Months Ended June 30, | Six Months Ended June 30, | ||||||||||||||||||||||||||||
Change | Change | ||||||||||||||||||||||||||||
(in thousands) | 2015 | 2014 | Amount | Percent | 2015 | 2014 | Amount | Percent | |||||||||||||||||||||
Investment management fees | $ | 48,962 | $ | 49,697 | $ | (735 | ) | (1 | )% | $ | 94,910 | $ | 99,975 | $ | (5,065 | ) | (5 | )% | |||||||||||
Distribution and underwriting fees | 10,747 | 12,642 | (1,895 | ) | (15 | )% | 21,594 | 25,631 | (4,037 | ) | (16 | )% | |||||||||||||||||
Other | 642 | 666 | (24 | ) | (4 | )% | 1,264 | 1,329 | (65 | ) | (5 | )% | |||||||||||||||||
Total revenues | $ | 60,351 | $ | 63,005 | $ | (2,654 | ) | (4 | )% | $ | 117,768 | $ | 126,935 | $ | (9,167 | ) | (7 | )% | |||||||||||
Investment management fees decreased by 1% in the second quarter of 2015 compared with the second quarter of 2014, which was primarily due to an $803 million, or 3%, decrease in average assets under management for the same periods. Investment management fees from open-end funds decreased by 9% to $27.3 million for the second quarter of 2015, from $30.0 million for
22
the second quarter of 2014, driven by a 10% decrease in average open-end fund assets. Investment management fees from our closed-end funds increased by 12% to $16.2 million for the second quarter of 2015, from $14.4 million for the second quarter of 2014, due to an 11% increase in average closed-end fund assets. Investment management fees from our separately managed accounts increased by 6% to $5.0 million for the second quarter of 2015, from $4.7 million for the second quarter of 2014, due to a 2% increase in average separately managed accounts assets under management. Investment management fees that we earned as a percentage of average assets under management were 0.78% for the second quarter of 2015, compared with 0.77% for the second quarter of 2014. Investment management fees from assets under advisement for which we provide model portfolio design and oversight were $527,000 for the second quarter of 2015, compared with $589,000 for the second quarter of 2014. Investment management fees that we earned as a percentage of assets under advisement for the second quarter of 2015 and 2014 were 0.30%.
Investment management fees decreased by 5% in the first six months of 2015, compared with the first six months of 2014, which was primarily due to a $1.7 billion, or 7%, decrease in average assets under management for the same periods. Investment management fees from open-end funds decreased by 9% to $54.8 million for the first six months of 2015, from $60.2 million for the first six months of 2014, driven by a 10% decrease in average open-end fund assets. Investment management fees from our closed-end funds increased by 6% to $30.3 million for the first six months of 2015, from $28.6 million for the first six months of 2014, due to a 5% increase in average closed-end fund assets. Investment management fees from our separately managed accounts decreased by 12% to $8.8 million for the first six months of 2015, from $10.0 million for the first six months of 2014, due to a 14% decrease in average separately managed accounts assets under management. Investment management fees that we earned as a percentage of average assets under management for the first six months of 2015 were 0.78%, compared with 0.77% for the first six months of 2014. Investment management fees from assets under advisement for which we provide model portfolio design and oversight were $1.1 million for the first six months of 2015, compared with $1.2 million for the first six months of 2014. Investment management fees that we earned as a percentage of assets under advisement for the first six months of 2015 and 2014 were 0.30%.
Distribution and underwriting fees decreased by 15%, or $1.9 million to $10.7 million for the second quarter of 2015. Distribution and underwriting fees decreased by 16%, or $4.0 million to $21.6 million for the first six months of 2015, compared with the first six months of 2014. The decrease was primarily due to a shift in open-end fund assets from Class A, B and C shares to Class I shares. More open-end fund investors are choosing to compensate their financial advisors through fee-based models, increasing the demand for and a shift towards our Class I shares. Because we do not collect distribution fees from Class I shares, our distribution revenue has decreased with this shift in assets. For the second quarter and first six months of 2015, average open-end fund assets decreased by 10% across most share classes compared with the second quarter and first six months of 2014. The decrease in average open-end fund assets when compared with the prior year periods is largely due to net redemptions in our U.S. growth and alternative strategies.
Operating Expenses
Operating expenses decreased by $112,000 and increased by $9.0 million for the second quarter and first six months of 2015, respectively, from the second quarter and first six months of 2014. For the second quarter of 2015, an increase in employee compensation and benefits expenses, was partially offset by decreases in distribution expenses, marketing and sales promotion expenses, and general and administrative expenses. For the first six months of 2015, increases in marketing and sales promotion expenses, primarily the result of $11.5 million of expenses related to the launch of a new closed-end fund, employee compensation and benefits expenses, and general and administrative expenses were partially offset by a decrease in distribution expenses.
Three Months Ended June 30, | Six Months Ended June 30, | ||||||||||||||||||||||||||
Change | Change | ||||||||||||||||||||||||||
(in thousands) | 2015 | 2014 | Amount | Percent | 2015 | 2014 | Amount | Percent | |||||||||||||||||||
Employee compensation and benefits | $ | 21,848 | $ | 19,730 | $ | 2,118 | 11% | $ | 46,722 | $ | 43,726 | $ | 2,996 | 7% | |||||||||||||
Distribution expenses | 10,489 | 12,307 | (1,818 | ) | (15)% | 21,006 | 24,958 | (3,952 | ) | (16)% | |||||||||||||||||
Marketing and sales promotion | 4,330 | 4,666 | (336 | ) | (7)% | 17,735 | 8,371 | 9,364 | * | ||||||||||||||||||
General and administrative | 9,592 | 9,668 | (76 | ) | (1)% | 19,718 | 19,170 | 548 | 3% | ||||||||||||||||||
Total operating expenses | $ | 46,259 | $ | 46,371 | $ | (112 | ) | —% | $ | 105,181 | $ | 96,225 | $ | 8,956 | 9% | ||||||||||||
________________
* Not meaningful
Employee compensation and benefits expenses increased by $2.1 million and $3.0 million for the second quarter and first six months of 2015, respectively, when compared with the second quarter and first six months of 2014. The increase in the second quarter and first six months of 2015 is primarily due to increases in incentive compensation expenses, equity compensation expenses, and base salaries and related benefits. The increase in incentive compensation expenses for the first six months of 2015 was primarily due to the launch of a new closed-end fund in the first quarter of 2015. The increase in equity compensation expenses
23
in the second quarter and first six months of 2015 was primarily the result of the reversal of inception-to-date expenses for forfeited awards recorded in the prior year periods and new awards granted in the second quarter and first six months of 2015.
Distribution expenses decreased by $1.8 million and $4.0 million for the second quarter and first six months of 2015, respectively, when compared with the second quarter and first six months of 2014. The decreases were primarily due to a shift of average open-end fund assets to Class I shares which do not result in distribution expenses.
Marketing and sales promotion expenses decreased by $336,000 and increased by $9.4 million for the second quarter and first six months of 2015, respectively, when compared with the second quarter and first six months of 2014. The decrease in the second quarter of 2015 was primarily due to lower supplemental distribution payments to distribution intermediaries. Supplemental distribution payments are positively correlated with the levels of open-end fund assets that we manage. The increase in the first six months of 2015 is largely the result of the launch of a new closed-end fund in the first quarter of 2015.
General and administrative expenses decreased by $76,000 and increased by $548,000 for the second quarter and first six months of 2015, respectively, when compared with the second quarter and first six months of 2014. Many offsetting factors gave rise to the net decreases in expenses during the second quarter of 2015; however, the main drivers were reductions in travel and entertainment expenses and occupancy-related costs, offset by higher professional services expenses. The main drivers to the increase for the first six months of 2015 were higher professional services expenses, partially offset by a reduction in travel and entertainment expenses.
Non-Operating Activities, Net of Redeemable Non-controlling Interest in Partnership Investments
Non-operating income, net of redeemable non-controlling interest in partnership investments decreased by $5.4 million and $3.5 million for the second quarter and first six months of 2015, respectively, when compared with the second quarter and first six months of 2014. The decrease in the second quarter of 2015 was driven by a decrease in investment income of $9.7 million offset by a decrease in interest expense of $744,000. The decrease in the first six months of 2015 was due to a decrease in investment income of $5.0 million offset by a decrease in interest expense of $1.5 million when compared with the first six months of 2014. The decrease in investment income for the three and six months ended June 30, 2015 when compared with the same periods in 2014 was mainly due to lower realized gains generated from tax harvesting activities and lower unrealized gains within the Company's investment portfolio. The decrease in interest expense for the second quarter and first six months of 2015 when compared with the same periods in 2014 was due to a decrease in long-term debt outstanding.
The following table summarizes our non-operating activities, net of redeemable non-controlling interest in partnership investments for the second quarter and six months ended June 30, 2015 and 2014:
Three Months Ended June 30, | Six Months Ended June 30, | ||||||||||||||||||||||
(in thousands) | 2015 | 2014 | Change | 2015 | 2014 | Change | |||||||||||||||||
Interest income | $ | 45 | $ | 50 | $ | (5 | ) | $ | 89 | $ | 89 | $ | — | ||||||||||
Interest expense | (766 | ) | (1,510 | ) | 744 | (1,540 | ) | (3,014 | ) | 1,474 | |||||||||||||
Net interest expense | (721 | ) | (1,460 | ) | 739 | (1,451 | ) | (2,925 | ) | 1,474 | |||||||||||||
Investment income | 241 | 9,912 | (9,671 | ) | 5,767 | 10,769 | (5,002 | ) | |||||||||||||||
Dividend income | 299 | 347 | (48 | ) | 526 | 1,010 | (484 | ) | |||||||||||||||
Miscellaneous other income | 152 | 205 | (53 | ) | 136 | 268 | (132 | ) | |||||||||||||||
Investment and other income | 692 | 10,464 | (9,772 | ) | 6,429 | 12,047 | (5,618 | ) | |||||||||||||||
Non-operating income (loss), GAAP basis | (29 | ) | 9,004 | (9,033 | ) | 4,978 | 9,122 | (4,144 | ) | ||||||||||||||
Net (income) loss attributable to redeemable non-controlling interest in partnership investments | 494 | (3,181 | ) | 3,675 | (2,554 | ) | (3,244 | ) | 690 | ||||||||||||||
Non-operating income, net of redeemable non-controlling interest in partnership investments, non-GAAP basis (1) | $ | 465 | $ | 5,823 | $ | (5,358 | ) | $ | 2,424 | $ | 5,878 | $ | (3,454 | ) | |||||||||
(1) | Non-operating income, net of redeemable non-controlling interest in partnership investments is a non-GAAP financial measure. Management believes this measure provides comparability of this information among reporting periods and is an effective measure for reviewing the Company’s non-operating contribution to its results. |
The following table provides a summary of the returns that we generated from our corporate investment portfolio. This table combines the investment and dividend income as reported in our consolidated statement of operations with the change in fair value of our investment securities that are recorded in accumulated other comprehensive income, a component of equity, for the second quarter and six months ended June 30, 2015:
24
Three Months Ended June 30, 2015 | Six Months Ended June 30, 2015 | ||||||||||||||||||||||
(in thousands) | Non-Operating Income (Loss), net | Change in Accumulated Other Comprehensive Income | Total | Non-Operating Income (Loss), net | Change in Accumulated Other Comprehensive Income | Total | |||||||||||||||||
Funds and common stock | $ | 761 | $ | 1,382 | $ | 2,143 | $ | 2,219 | $ | 9,545 | $ | 11,764 | |||||||||||
Partnership investments | (520 | ) | — | (520 | ) | 3,548 | — | 3,548 | |||||||||||||||
Investment income | 241 | 1,382 | 1,623 | 5,767 | 9,545 | 15,312 | |||||||||||||||||
Dividend income | 299 | 299 | 526 | 526 | |||||||||||||||||||
Redeemable non-controlling interest in partnership investments | 494 | 494 | (2,554 | ) | (2,554 | ) | |||||||||||||||||
Investment portfolio results | $ | 1,034 | $ | 2,416 | $ | 3,739 | $ | 13,284 | |||||||||||||||
Less: Non-controlling interest in Calamos Investments LLC | (885 | ) | (7,836 | ) | |||||||||||||||||||
Deferred income taxes | (184 | ) | (632 | ) | |||||||||||||||||||
Change in accumulated other comprehensive income | $ | 313 | $ | 1,077 | |||||||||||||||||||
Our investment portfolio returned $2.4 million, or 0.8%, and $13.3 million, or 4.2%, in the second quarter and first six months of 2015, respectively. These results primarily reflect realized and unrealized gains from investment securities within the Company's investment portfolio.
Income Tax Provision
Calamos Investments LLC (“Calamos Investments”) is subject to certain income-based state taxes; therefore, income taxes reflect not only the portion attributed to us but also income taxes attributable to non-controlling interests. CAM's effective income tax rate for the second quarter and first six months of 2015 was approximately 38.2% and 44.5%, respectively, compared with 38.4% and 38.3% for the second quarter and first six months of 2014. The effective income tax rate increase for the first six months of 2015 is a result of $238,000 of deferred tax expense related to expired employee stock options.
As of June 30, 2015, the total capital loss carryforward that expires in 2017 was $456,000, and the Company did not have a valuation allowance on this deferred tax asset. The ultimate realization of this deferred tax asset is dependent upon the generation of sufficient capital gains prior to the expiration.
Net income
Net income attributable to CAM was $2.0 million and $2.1 million for the second quarter and first six months of 2015, respectively, compared with $3.2 million and $5.4 million for the second quarter and first six months of 2014. Non-GAAP net income attributable to CAM was $3.9 million and $7.0 million for the second quarter and first six months of 2015, respectively, compared with $4.2 million and $8.1 million for the second quarter and first six months of 2014. See "Supplemental Non-GAAP Financial Measures" below for descriptions of non-GAAP financial measures and a reconciliation of non-GAAP financial measures to GAAP financial measures.
Supplemental Non-GAAP Financial Measures
We provide investors with certain adjusted, non-GAAP financial measures including non-GAAP operating income, non-GAAP operating margin, non-GAAP net income attributable to CAM and non-GAAP diluted earnings per share. These non-GAAP financial measures are provided to supplement the consolidated financial statements presented on a GAAP basis. These non-GAAP financial measures adjust GAAP financial measures to include the tax benefit from the amortization of deferred taxes on intangible assets, and to exclude closed-end fund launch expenses, net of taxes, and CAM’s non-operating income, net of taxes. We believe these adjustments are appropriate to enhance an overall understanding of our operating financial performance, as well as to facilitate comparisons with our historical earnings results. These adjustments to our GAAP results are made with the intent of providing investors a more complete understanding of our underlying earnings results and trends and our marketplace performance. In addition, these non-GAAP financial measures are among the primary indicators management uses as a basis of managing our business.
25
The presentation of this additional information is not meant to be considered in isolation or as a substitute for the directly comparable financial measures prepared in accordance with GAAP. Investors should review the reconciliations of the non-GAAP financial measures to their most directly comparable GAAP financial measures as provided in the tables below:
Three Months Ended June 30, | Six Months Ended June 30, | ||||||||||||||
2015 | 2014 | 2015 | 2014 | ||||||||||||
(in thousands) | |||||||||||||||
GAAP operating income | $ | 14,092 | $ | 16,634 | $ | 12,587 | $ | 30,710 | |||||||
Adjustment: | |||||||||||||||
Closed-end fund launch expenses | — | — | 11,544 | — | |||||||||||
Non-GAAP operating income | $ | 14,092 | $ | 16,634 | $ | 24,131 | $ | 30,710 | |||||||
Total revenues | $ | 60,351 | $ | 63,005 | $ | 117,768 | $ | 126,935 | |||||||
GAAP operating margin | 23.4 | % | 26.4 | % | 10.7 | % | 24.2 | % | |||||||
Non-GAAP operating margin | 23.4 | % | 26.4 | % | 20.5 | % | 24.2 | % | |||||||
Three Months Ended June 30, | Six Months Ended June 30, | ||||||||||||||
2015 | 2014 | 2015 | 2014 | ||||||||||||
(in thousands, except per share data) | |||||||||||||||
GAAP net income attributable to CAM | $ | 2,033 | $ | 3,228 | $ | 2,134 | $ | 5,367 | |||||||
Adjustments: | |||||||||||||||
Deferred tax amortization on intangible assets | 1,979 | 1,979 | 3,958 | 3,958 | |||||||||||
Closed-end fund launch expenses, net of taxes(1) | — | — | 1,615 | — | |||||||||||
Non-operating income, net of taxes | (101 | ) | (974 | ) | (659 | ) | (1,179 | ) | |||||||
Non-GAAP net income attributable to CAM | $ | 3,911 | $ | 4,233 | $ | 7,048 | $ | 8,146 | |||||||
Diluted - Weighted average shares outstanding | 18,635,798 | 19,048,456 | 18,618,888 | 19,345,019 | |||||||||||
Diluted earnings per share | $ | 0.11 | $ | 0.17 | $ | 0.11 | $ | 0.28 | |||||||
Non-GAAP diluted earnings per share | $ | 0.21 | $ | 0.22 | $ | 0.38 | $ | 0.42 | |||||||
________________
(1) Closed-end fund launch expenses are shown net of the non-controlling interest in Calamos Investments and income taxes.
Non-GAAP operating income is calculated by adjusting for the closed-end fund launch expenses from GAAP operating income. Non-GAAP operating margin is calculated by dividing non-GAAP operating income by total revenues.
Non-GAAP net income attributable to CAM is calculated by adjusting the following items from GAAP net income attributable to CAM:
(i) | amortization of deferred taxes on intangible assets associated with the election under section 754 of the Internal Revenue Code of 1986, as amended (Section 754 election); |
(ii) | closed-end fund launch expenses, net of taxes; and |
(iii) | non-operating income, net of taxes. |
Non-GAAP diluted earnings per share is calculated by dividing non-GAAP net income attributable to CAM by diluted weighted average shares outstanding.
The deferred tax assets from the Section 754 election allows for a quarterly reduction of $2.0 million in future income taxes owed by us through 2019, to the extent that a tax payable exists during the quarter. As a result, this cash savings has accrued solely for the benefit of the shareholders of CAM’s common stock. We believe that adjusting this item from the calculation of the above
26
non-GAAP items can be a useful measure in allowing investors to see our performance. Closed-end fund launch expenses, net of taxes, are excluded because revenue associated with these expenses will not fully impact results until future periods. Non-operating income is excluded from the above non-GAAP items as it can distort comparisons between periods. As noted above, we believe that measures excluding these items are useful in analyzing operating trends and allows for more comparability between periods, which may be useful to investors.
We believe that non-GAAP operating income, non-GAAP operating margin, non-GAAP net income attributable to CAM and non-GAAP diluted earnings per share are useful measures of performance and may be useful to investors, because they provide measures of our core business activities adjusting for items that are non-cash and costs that may distort comparisons between periods. These measures are provided in addition to our operating income, operating margin, net income attributable to CAM and diluted earnings per share calculated under GAAP, but are not substitutes for those calculations.
Liquidity and Capital Resources
We manage our liquidity position to ensure adequate resources are available to fund ongoing operations of the business, provide seed capital for new funds, provide conservative levels of capital for the Company’s regulated subsidiaries, fund our stock repurchase program, and invest in other corporate strategic initiatives. Our principal sources of liquidity are cash flows from operating activities and our corporate investment portfolio, which is comprised of cash and cash equivalents, investment securities, derivatives and partnership investments. Investment securities are principally comprised of Company-sponsored funds. In addition, the individual securities held within our partnership investments are typically highly liquid. Borrowings by Calamos Investments have also been a source of liquidity.
Our working capital requirements historically have been met through cash generated by operations. We believe cash generated from operations and financing activities will be sufficient over the foreseeable future to meet our working capital requirements and liquidity needs with respect to the foregoing activities, as well as to support future growth.
The following table summarizes our principal sources of liquidity as of June 30, 2015 and December 31, 2014:
(in thousands) | June 30, 2015 | December 31, 2014 | Increase (Decrease) | ||||||||
Cash and cash equivalents | $ | 90,018 | $ | 35,285 | $ | 54,733 | |||||
Investment securities | 278,074 | 339,959 | (61,885 | ) | |||||||
Partnership investments, net of liabilities and redeemable non-controlling interests | 35,339 | 57,439 | (22,100 | ) | |||||||
Total corporate investment portfolio | $ | 403,431 | $ | 432,683 | $ | (29,252 | ) | ||||
Calamos Investments is the borrower of our $46.0 million in long-term debt. Calamos Investments was in compliance with its financial debt covenants as of June 30, 2015 and December 31, 2014.
As of June 30, 2015, Calamos Investments had a $25.0 million short-term, interest-bearing loan from CAM to fund new seed investments, continue our stock repurchase program, as well as to provide excess liquidity.
On March 31, 2015, the initial public offering of a Calamos-sponsored closed-end fund was completed with underwriters of the closed-end fund subsequently exercising a portion of their over-allotment option, the closing of which over-allotment option occurred on May 13, 2015. As contemplated in the fund's prospectus, CAL, the fund's investment adviser has implemented a share purchase program pursuant to which CAL will, through a plan agent, purchase up to $20 million of common shares of the fund in the open market, subject to applicable federal securities laws as well as to a variety of market and discount conditions and a daily purchase limit. The purchase plan, which seeks to provide increased liquidity for the fund's common shares, commenced on July 7, 2015 and will run through February 25, 2016. Subsequent to June 30, 2015, CAL purchased $2.7 million of common shares of the fund under this program.
The following is a summary of covenant compliance as of June 30, 2015 with the terms and covenants having the same meanings set forth under our amended note purchase agreements:
27
Covenant | June 30, 2015 | ||
EBITDA/interest expense - not less than 3.0 | 14.47 | ||
Debt/EBITDA - not more than 2.75 | 1.41 | ||
Investment coverage ratio - not less than 1.175 | 4.56 | ||
Net worth - not less than $160 million | $257.5 million | ||
The following table summarizes key data relating to our liquidity and capital resources:
(in thousands) | June 30, 2015 | December 31, 2014 | |||||
Statements of financial condition data: | |||||||
Cash and cash equivalents | $ | 90,018 | $ | 35,285 | |||
Receivables | 19,509 | 18,991 | |||||
Investment securities | 278,074 | 339,959 | |||||
Partnership investments, net of liabilities and redeemable non-controlling interests | 35,339 | 57,439 | |||||
Deferred tax assets, net | 36,696 | 40,261 | |||||
Long-term debt, including current portion | 45,955 | 45,955 | |||||
The deferred tax assets above include an annual reduction of $7.9 million in future income taxes owed by us through 2019. This reduction results from our election under Section 754 of the Internal Revenue Code, whereby we stepped up the tax basis in certain intangible assets to their fair market value. These assets are amortized over fifteen years on CAM’s tax return. As a result, this cash savings will accrue solely for the benefit of the Company.
Cash flows for the six months ended June 30, 2015 and 2014 are shown below.
June 30, | |||||||
(in thousands) | 2015 | 2014 | |||||
Cash flow data: | |||||||
Net cash provided by operating activities | $ | 4,405 | $ | 27,102 | |||
Net cash provided by investing activities | 95,140 | 125,377 | |||||
Net cash used in financing activities | (44,812 | ) | (80,915 | ) | |||
Net cash provided by operating activities totaled $4.4 million for the six months ended June 30, 2015. These net cash flows are primarily attributable to investment management and distribution and underwriting fees generated by core business activities, partially offset by staff, distribution, and other operating expenses.
Net cash provided by investing activities totaled $95.1 million for the six months ended June 30, 2015. The net cash provided by investing activities primarily represents net cash inflows as a result of proceeds from sales of investments of $34.1 million and the liquidation of our interest in Calamos Arista Strategic Fund LP, a consolidated partnership, totaling $23.1 million. The remaining sales and repurchases of investment securities totaling $40.1 million were as a result of our tax harvesting strategy.
Net cash used in financing activities totaled $44.8 million for the six months ended June 30, 2015, and largely represents pro rata equity and income tax distributions paid by Calamos Investments to our non-controlling interests of $32.8 million. Net cash used in financing activities was also due to Calamos Investments' repurchase of $6.7 million in Class A common stock as a result of our stock repurchase program, and cash dividends paid to common stockholders of $5.4 million. Finally, we expect cash flows from financing activities to change with tax distributions based on the levels of income that we generate.
Recently Issued Accounting Pronouncements
The Company has reviewed all newly issued accounting pronouncements that are applicable to its business and to the preparation of its consolidated financial statements, including those not yet required to be adopted. The Company does not believe any such pronouncements will have a material effect on the Company’s financial position or results of operations. Accounting guidance that will become effective in future years, with respect to the Company’s consolidated financial statements, is described below:
In February 2015, the Financial Accounting Standards Board ("FASB") issued an accounting update amending the consolidation
28
requirements under GAAP. This standard modifies existing consolidation guidance for reporting organizations that are required to evaluate whether they should consolidate certain legal entities. This guidance is effective for annual and interim periods beginning after December 15, 2015, and requires either a retrospective or a modified retrospective approach to adoption. Early adoption is permitted. The Company is currently evaluating the potential impact of this standard on its results of operations, cash flows or financial position, as well as the available transition methods.
In May 2014, the FASB issued new guidance on revenue from contracts with customers. The new revenue recognition standard provides a five-step analysis of transactions to determine when and how revenue is recognized. The core principle of the guidance is that an entity should recognize revenue to depict the transfer of promised goods or services to customers in an amount that reflects the consideration to which the entity expects to be entitled in exchange for those goods or services. In July 2015, the FASB decided to defer the effective date of the new revenue guidance by one year to annual reporting periods beginning after December 15, 2017, with early adoption being permitted for annual periods beginning after December 15, 2016. The Company's effective date is January 1, 2018. The Company is evaluating the effect of adopting this new accounting guidance but does not expect adoption will have a material impact on its results of operations, cash flows or financial position.
Critical Accounting Policies and Estimates
Our significant accounting policies are summarized in note 2 of the Notes to the Consolidated Financial Statements included in our Annual Report on Form 10-K for the year ended December 31, 2014. A complete discussion of critical accounting policies is included in Management's Discussion and Analysis of Financial Condition and Results of Operations in our Annual Report on Form 10-K for the year ended December 31, 2014. There were no significant changes in our significant accounting policies or critical accounting policies during the six months ended June 30, 2015.
Other Information - Market Capitalization
Calamos Investments is owned (a) 22.2% by CAM, and (b) 77.8% by Calamos Interests. As of June 30, 2015, CAM holds two groups of assets: (1) CAM’s 22.2% ownership interest in Calamos Investments and (2) primarily cash and cash equivalents, investment securities, income tax receivables, net deferred tax assets, and a loan receivable from Calamos Investments. CAM presents the entire operations of Calamos Investments with its own in the consolidated financial statements. Calamos Interests’ 77.8% ownership in Calamos Investments is presented as a non-controlling interest in the consolidated financial statements. Prior to March 1, 2009, we added approximately 77 million shares to the Class A common shares outstanding so our number of fully diluted shares would reflect Calamos Interests’ ownership in Calamos Investments. The resulting share count of approximately 97 million provided a reasonable proxy for the number of shares used in determining the market capitalization of the fully consolidated company.
During 2009, CAM’s certificate of incorporation was amended to provide that ownership in Calamos Investments is exchangeable into Class A shares of CAM on a fair value basis rather than a one-to-one basis, as previously structured. As a result, the reported market capitalization of CAM only reflects CAM’s 22.2% interest in Calamos Investments, rather than the full value of Calamos Investments.
Forward-Looking Information
This report and other documents or statements made or filed by us contain certain forward-looking statements within the meaning of Section 27A of the Securities Act of 1933, as amended, and Section 21E of the Securities Exchange Act of 1934, as amended. These forward-looking statements may include, without limitation: statements regarding proposed new products; results of operations or liquidity; projections, predictions, expectations, estimates or forecasts of our business; financial and operating results and future economic performance; market capitalization; management's goals and objectives; payment of dividends; and other similar expressions concerning matters that are not historical facts.
Forward-looking statements may sometimes be identified by words such as “anticipate,” “assume,” “believe,” “continue,” “could,” “estimate,” “expect,” “future,” “intend,” “may,” “opportunity,” “potential,” “predict,” “seek,” “should,” “trend,” “will,” “would,” and similar expressions.
Forward-looking statements are not a guarantee of future performance or results, or of the date of such performance or results, if achieved. Forward-looking statements are based on information available and known at the time those statements are made as well as management's good faith belief as of that time with respect to future events, and are subject to risks and uncertainties that could cause actual performance or results to differ materially from those expressed in or suggested by the forward-looking statements, including risks not otherwise listed or described in this report.
Important factors that could cause such differences include, but are not limited to: changes in applicable laws, rules or regulations;
29
downward fee pressures and increased industry competition; risks inherent to the investment management business; the loss of revenues due to contract terminations and redemptions; unsatisfactory service levels by third-party vendors; the inability to maintain compliance with financial covenants; the performance of our investment strategies and corporate investment portfolio; our ownership and organizational structure; general and prolonged declines in the prices of securities; realization of deferred income tax assets; significant changes in market conditions and the economy that require a modification to our business plan; catastrophic or unpredictable events; the loss of key executives; the unavailability, consolidation and elimination of third-party retail distribution channels; increased costs of and timing of payments related to distribution; failure to recruit and retain qualified personnel; a loss of assets, and thus revenues; fluctuation in the level of our expenses; fluctuation in foreign currency exchange rates with respect to our global operations and business; changes in accounting estimates; poor performance of our largest funds; damage to our reputation; the extent and timing of any share repurchases; and the variability of any exchanges of interests in Calamos Investments into Class A common stock.
Further, the value and composition of our assets under management are, and will continue to be, influenced by a variety of factors including, among other things: purchases and redemptions of shares of the open-end funds and other investment products; fluctuation in both the underlying value and liquidity of the financial markets around the world that result in appreciation or depreciation of assets under management; open-end fund capital gain distributions; our ability to access capital markets; our introduction of new investment strategies, products and programs; our ability to educate our clients about our investment philosophy and provide them with best-in-class service; the relative investment performance of our products as compared to competing offerings and market indices; competitive conditions in the pooled fund, asset management and broader financial services sectors; investor sentiment and confidence; our decision to open or close products and strategies; and our ability to execute on our strategic plan to expand the business. Item 1A of the Company's Annual Report on Form 10-K for the year ended December 31, 2014 discusses some of these and other important factors in detail under the caption “Risk Factors.”
Forward-looking statements speak only as of the date the statements are made. Readers should not place undue reliance on any forward-looking statements when deciding whether to buy, sell or hold our securities. We assume no obligation to update forward-looking statements to reflect actual results, changes in assumptions or changes in other factors affecting forward-looking information.
Item 3. Quantitative and Qualitative Disclosures About Market Risk
An analysis of our market risk was included in our Annual Report on Form 10-K for the year ended December 31, 2014. There were no material changes to the Company’s market risk during the six months ended June 30, 2015.
Item 4. Controls and Procedures
Our management, including our principal executive and principal financial officers, has evaluated the effectiveness of our disclosure controls and procedures (as defined in Rule 13a-15(e) under the Securities Exchange Act of 1934, as amended) as of June 30, 2015, and has concluded that such disclosure controls and procedures are effective to ensure that information required to be disclosed by us in the reports that we file or submit under the Securities Exchange Act of 1934 is recorded, processed, summarized and reported within the time periods specified in the SEC’s rules and forms.
There were no changes in the Company’s internal control over financial reporting that occurred during the second quarter that have materially affected, or are reasonably likely to materially affect, the Company’s internal control over financial reporting.
PART II — OTHER INFORMATION
Item 1. Legal Proceedings
As previously reported in the Company's periodic reports, Calamos Advisors LLC and Calamos Financial Services LLC were named as defendants in a complaint captioned Chill v. Calamos Advisors LLC, et at. The complaint relates to investment advisory and distribution fees paid by an open-end investment company managed by Calamos Advisors LLC. The defendants believe that the complaint is without merit and intend to defend themselves vigorously against the allegations.
In the normal course of business, the Company may be a party to various legal proceedings and other regulatory matters. Currently, there is no such litigation or matters that management believes would have a material effect on our consolidated financial position or results of operations.
30
Item 2. Unregistered Sales of Equity Securities and Use of Proceeds
ISSUER PURCHASES OF EQUITY SECURITIES
(a) Total Number of Shares Purchased | (b) Average Price Paid Per Share | (c) Total Number of Shares Purchased as Part of Publicly Announced Plans or Programs | (d) Maximum Number of Shares that May be Purchased Under the Plans or Programs | |||||||||
April 1 - April 30, 2015 | 33,793 | $ | 12.50 | 33,793 | 2,718,007 | |||||||
May 1 - May 31, 2015 | 238,872 | $ | 12.19 | 238,872 | 2,479,135 | |||||||
June 1 - June 30, 2015 | 97,229 | $ | 12.14 | 97,229 | 2,381,906 | |||||||
Total | 369,894 | $ | 12.21 | 369,894 | ||||||||
On November 13, 2014, the Company announced a repurchase of up to an additional 3 million shares of the Company's outstanding Class A Common Stock primarily to continue to manage the dilution from share issuances under the Company’s incentive compensation plan. Common stock purchased under the share repurchase program are by Calamos Investments LLC and not directly for the individual, personal accounts of John P. Calamos, Sr.
31
Item 6. Exhibits
Exhibit Number | Description of Exhibit | ||
3(i) | Second Amended and Restated Certificate of Incorporation of the Registrant (incorporated by reference to Exhibit 3(i) to the Registrant’s Annual Report on Form 10-K filed with the Securities and Exchange Commission on March 13, 2009). | ||
3(ii) | Second Amended and Restated By-laws of the Registrant (incorporated by reference to Exhibit 3(ii) to the Registrant’s Annual Report on Form 10-K filed with the Securities and Exchange Commission on March 13, 2009). | ||
4.1 | Stockholders’ Agreement among John P. Calamos, Sr., Nick P. Calamos and John P. Calamos, Jr., certain trusts controlled by them, Calamos Family Partners, Inc. and the Registrant (incorporated by reference to Exhibit 4.1 to the Registrant’s Quarterly Report on Form 10-Q filed with the Securities and Exchange Commission on December 3, 2004 File No. 000-51003). | ||
4.2 | Registration Rights Agreement between Calamos Family Partners, Inc., John P. Calamos, Sr. and the Registrant (incorporated by reference to Exhibit 4.2 to the Registrant’s Quarterly Report on Form 10-Q filed with the Securities and Exchange Commission on December 3, 2004 File No. 000-51003). | ||
4.3 | Note Purchase Agreement, dated as of July 13, 2007, by and among Calamos Investments LLC and various institutional investors (incorporated by reference to Exhibit 4.1 to the Registrant’s Current Report on Form 8-K filed with the Securities and Exchange Commission on July 18, 2007). | ||
4.4 | Waiver and First Amendment to 2007 Note Purchase Agreement, dated as of December 22, 2008, between Calamos Investments LLC and various institutional investors (incorporated by reference to Exhibit 4.5 to the Registrant’s Current Report on Form 8-K filed with the Securities and Exchange Commission on December 29, 2008). | ||
31.1 | Certification of Principal Executive Officer pursuant to Rule 13a-14(a). | ||
31.2 | Certification of Principal Financial Officer pursuant to Rule 13a-14(a). | ||
32.1 | Certification of Principal Executive Officer pursuant to 18 U.S.C. Section 1350. | ||
32.2 | Certification of Principal Financial Officer pursuant to 18 U.S.C. Section 1350. | ||
101.INS | XBRL Instance Document | ||
101.SCH | XBRL Taxonomy Extension Schema Document | ||
101.CAL | XBRL Taxonomy Extension Calculation Linkbase Document | ||
101.LAB | XBRL Taxonomy Extension Label Linkbase Document | ||
101.PRE | XBRL Taxonomy Extension Presentation Linkbase Document | ||
101.DEF | XBRL Taxonomy Extension Definition Linkbase Document | ||
32
SIGNATURES
Pursuant to the requirements of the Securities Exchange Act of 1934, the registrant has duly caused this report to be signed on its behalf by the undersigned thereunto duly authorized.
CALAMOS ASSET MANAGEMENT, INC.
(Registrant)
Date: | August 6, 2015 | By: /s/ Nimish S. Bhatt |
Name: Nimish S. Bhatt | ||
Title: Senior Vice President and Chief Financial Officer | ||
33