Attached files
| file | filename |
|---|---|
| 8-K - ARROW ELECTRONICS, INC. 8-K - ARROW ELECTRONICS INC | a6708234.htm |
EXHIBIT 99.1
First-Quarter 2011 CFO Commentary
As reflected in our earnings release, there are a number of items that impact the comparability of our results with those in the trailing quarter and the first quarter of last year. Any discussion of our results will exclude these items to give you a better sense of our operating results. As always, the operating information we provide to you should be used as a complement to GAAP numbers. For a complete reconciliation between our GAAP and Non-GAAP results, please refer to our earnings release or the earnings reconciliation found at the end of this document.
First-Quarter Summary
Our growth strategy and the related momentum we built throughout the second half of 2009 and 2010 have continued into the first quarter of 2011, with the Arrow team generating the strongest first-quarter results in our history. We once again posted exceptional pro forma revenue growth of 12% year over year. Operating income grew more than 2x faster than sales on a year-over-year basis, while earnings per share increased in excess of 60%. Our returns reflect our ability to create shareholder value:
|
●
|
Return on invested capital is up 190 basis points year over year to 14%
|
|
●
|
Return on working capital of almost 32% is up 240 basis points year over year
|
Consolidated Overview – First Quarter
P&L Highlights
($ in millions, except per share data, may reflect rounding)
|
1Q11
|
Q/Q
Change
|
Y/Y
Change
|
Y/Y Change
Pro forma
|
||||
|
Sales
|
$5,223
|
Flat
|
+23%
|
+12%
|
|||
|
Gross Profit Margin
|
13.8%
|
+80bps
|
+110bps
|
+40bps
|
|||
|
Operating Exp/Sales
|
9.3%
|
+80bps
|
+20bps
|
-60bps
|
|||
|
Operating Income
|
$234.7
|
-1%
|
+54%
|
+44%
|
|||
|
Operating Margin
|
4.5%
|
Flat
|
+90bps
|
+100bps
|
|||
|
Net Income
|
$146.0
|
-4%
|
+58%
|
+46%
|
|||
|
Diluted EPS
|
$1.24
|
|
-4%
|
+63%
|
+50%
|
1
|
●
|
First quarter sales of $5.2 billion increased 23% year over year
|
|
o
|
Flat on a sequential basis
|
|
§
|
Pro forma for acquisitions and excluding FX, sales were up 10% year over year and were down 6% sequentially
|
|
●
|
Consolidated gross profit margin was 13.8%
|
|
o
|
Increased 110 basis points year over year, with 70 basis points from acquisitions and the remaining from organic growth and mix
|
|
o
|
On a sequential basis gross margin was up 80 basis points, principally due to greater mix of components business and acquisitions
|
|
o
|
Pro forma for acquisitions, gross profit margin was up 40 basis points year over year
|
|
●
|
Operating expenses as a percentage of sales was 9.3%
|
|
o
|
Increased 20 basis points year over year and increased 80 basis points sequentially
|
|
o
|
On an absolute dollar basis, operating expenses increased 27% year over year and 10% sequentially, primarily driven by the recent acquisitions and variable costs associated with increased sales
|
|
§
|
Pro forma for acquisitions, operating expenses were up only 5% year over year, well below sales growth
|
|
●
|
Operating income was $234.7 million
|
|
o
|
Increased 54% year over year and decreased 1% sequentially
|
|
o
|
Operating income growth once again outpaced sales growth, increasing more than 2x faster than sales on a year-over-year basis
|
|
o
|
Pro forma for acquisitions, operating income increased 44% year over year, or almost 4x sales growth
|
|
●
|
Operating income as a percentage of sales was 4.5%
|
|
o
|
Increased 90 basis points year over year and was flat sequentially
|
|
o
|
Pro forma for acquisitions, operating income as a percentage of sales increased 100 basis points year over year
|
|
●
|
Effective tax rate for the quarter was 30.4%
|
|
●
|
Net income was $146.0 million
|
|
o
|
Increased 58% compared with last year and decreased 4% sequentially
|
|
o
|
Pro forma for acquisitions, net income increased 46% year over year
|
|
●
|
Earnings per share were $1.27 and $1.24 on a basic and diluted, respectively
|
|
o
|
Diluted EPS increased 63% year over year and declined 4% sequentially
|
|
o
|
Pro forma for acquisitions, EPS increased 50% year over year
|
2
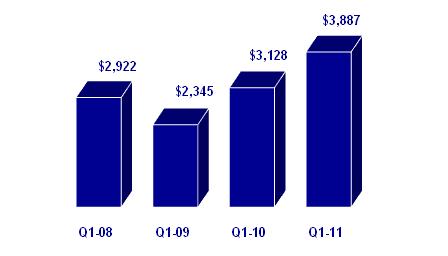
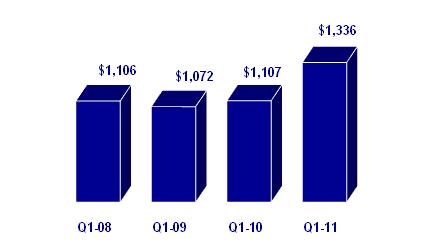
Global Components
 |
|
| Sales ($ in millions) |
|
●
|
Sales increased 24% year over year and increased 16% sequentially
|
|
o
|
Sales well ahead of normal seasonality
|
|
o
|
Pro forma for acquisitions and excluding FX, sales increased 11% year over year and 8% sequentially
|
|
●
|
Gross margin increased 80 basis points year over year led by strength in Asia Pacific and the Americas, as well as a positive contribution from our recent acquisitions
|
|
o
|
Sequentially, gross margin increased 20 basis points
|
|
o
|
Gross margin in our core customer base of small and medium size customers increased 10 basis points from the fourth quarter
|
|
●
|
Lead times are near normal historical levels
|
|
o
|
No meaningful changes in cancellation rates
|
|
●
|
Our quarterly survey of approximately 300 customers in North America shows that the outlook for purchase requirements heading into the second quarter remained positive
|
|
o
|
The majority of the surveyed customers believe they continue to have the appropriate level of inventory heading into the second quarter
|
|
●
|
Operating profit grew 2x faster than sales on a year-over-year basis, again demonstrating the operating leverage in the business
|
|
●
|
Operating margin increased 100 basis points year over year and 50 basis points sequentially to 5.9%
|
|
o
|
Represents the highest level in more than 5 years
|
3
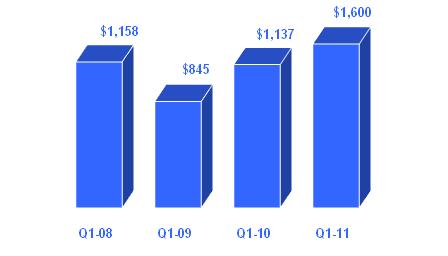
Americas Components
 |
|
| Sales ($ in millions) |
|
●
|
Sales increased 41% year over year and increased 19% sequentially
|
|
o
|
On an organic basis, sales were modestly ahead of normal seasonality
|
|
●
|
We saw strong growth at the end of the quarter
|
|
o
|
Our backlog is solid heading into the second quarter
|
|
●
|
Vertical markets continued to exhibit good year-over-year growth
|
|
o
|
Lighting grew at a double-digit rate while aerospace and defense and alternative energy grew at a high-single digit rate
|
|
●
|
Operating income grew faster than sales year over year
|
|
o
|
Operating margin increased 50 basis points year over year
|
|
●
|
Return on working capital increased 480 basis points year over year on an organic basis
|
|
●
|
Looking ahead to the second quarter, we would expect our organic growth to be slightly above normal seasonality
|
4
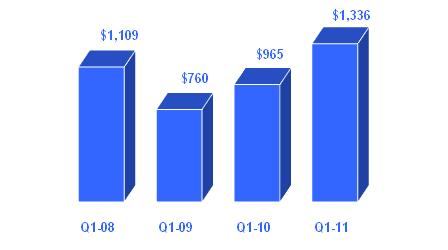
Europe Components
 |
|
| Sales ($ in millions) |
|
●
|
Sales increased 38% year over year and 24% sequentially
|
|
o
|
Excluding the impact of foreign exchange, sales were up 37% year over year and up 23% quarter over quarter
|
|
o
|
In our core business, Q1 represented the highest level of quarterly sales since 2003
|
|
●
|
Sales were significantly ahead of normal seasonality
|
|
●
|
Performance was above expectations in all regions, with particular strength in Central Europe
|
|
●
|
We continue to see solid growth from our vertical markets
|
|
o
|
Lighting and automotive grew more than 30% year over year and aerospace and military was up 15%
|
|
●
|
Operating income grew almost 2x faster than sales on a year over year basis
|
|
o
|
Operating margin increased 110 basis points year over year and 150 basis points sequentially
|
|
●
|
Return on working capital increased 70 basis points year over year
|
|
●
|
Looking forward, we would expect sales growth to be in line with the high end of normal seasonality in the second quarter
|
5
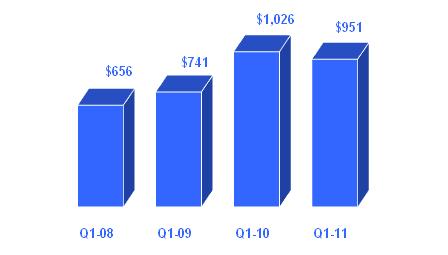
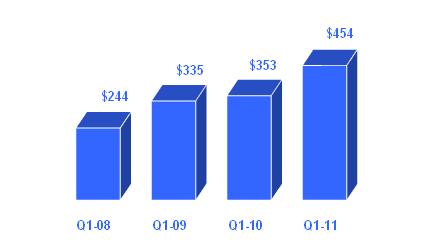
Asia Pacific Components
 |
|
| Sales ($ in millions) |
|
●
|
Sales declined 7% year over year and increased 3% sequentially
|
|
o
|
Ahead of normal seasonality
|
|
o
|
Mobile-handset components business weakness persisted in Q1
|
|
●
|
Growth in our core business was extremely robust, increasing 18% year over year, with good performance in greater China, Taiwan, Korea, and the ASEAN region
|
|
o
|
Sequentially, the core business increased 7%, well ahead of normal seasonality
|
|
●
|
Strong performance in a number of vertical markets including transportation/automotive (+52% year over year) and lighting (+19%)
|
|
o
|
PEMCO sales increased more than 50% year over year
|
|
●
|
Operating profit increased 18% year over year and 2% sequentially
|
|
o
|
Operating profit in the core business was up 54% year over year and increased 3x faster than sales
|
|
o
|
Operating margin increased 80 basis points year over year
|
|
●
|
Return on working capital declined 70 basis points year over year
|
|
●
|
Looking ahead to the second quarter, we would expect sales to be in line with normal seasonality, driven by continued momentum in the core business and an expected rebound in the mobile-handset components business.
|
6
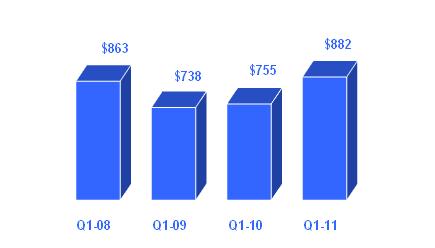
Global Enterprise Computing Solutions
 |
|
| Sales ($ in millions) |
|
●
|
Sales increased 21% year over year and declined 30% sequentially
|
|
o
|
Record level first-quarter revenue
|
|
o
|
Pro forma and excluding FX, sales increased 9% year over year and declined 32% sequentially
|
|
●
|
Sales in line with the high end of normal seasonality
|
|
o
|
Extremely strong double-digit year-over-year growth in industry-standard servers (40%+), storage (25%+), and services (65%+)
|
|
o
|
Exceptional growth in faster growing products with security up 16% year over year, virtualization up 39%, and networking up 24%
|
|
●
|
Gross margin increased 200 basis points year over year and was up 120 basis points sequentially, driven by changes in product mix and the addition of acquisitions
|
|
o
|
Pro forma for acquisitions, gross profit increased 30 basis points year over year and 130 basis points sequentially
|
|
●
|
Operating income grew 63% year over year and increased 3x faster than sales
|
|
o
|
Operating margin increased 70 basis points year over year
|
|
●
|
Return on working capital continues to excel
|
|
●
|
Looking ahead to the second quarter we would expect sales to be above normal seasonality
|
7
ECS America
 |
|
| Sales ($ in millions) |
|
●
|
Sales increased 17% year over year and declined 34% sequentially
|
|
o
|
Pro forma for acquisitions, sales increased 9% year over year
|
|
●
|
Sales growth in line with normal seasonality
|
|
o
|
Strong double-digit year-over-year growth in industry-standard servers (+42%), storage (+30%), and services (+50%)
|
|
●
|
Gross profit increased 290 basis points year over year and 180 basis points sequentially
|
|
o
|
Strength driven by changes in product mix and the addition of Shared Technologies
|
|
o
|
Pro forma for acquisitions gross profit increased 60 basis points year over year
|
|
●
|
A combination of top-line growth and improved gross profit resulted in operating income growth of 58% year over year
|
|
o
|
Operating income grew almost 3.5x faster than sales year over year
|
|
o
|
Operating margin expanded 90 basis points year over year
|
8
ECS Europe
 |
|
| Sales ($ in millions) |
|
●
|
Sales increased 29% year over year and declined 17% sequentially
|
|
o
|
Excluding the impact of FX, sales increased 29% year over year and declined 20% sequentially
|
|
o
|
Pro forma and excluding FX, sales increased 10% year over year and declined 25% sequentially
|
|
●
|
Sales growth ahead of normal seasonality
|
|
o
|
All regions grew this quarter with particularly strong growth in the UK, Western Europe, and the Nordic region
|
|
o
|
Very solid double-digit year-over-year growth in all product categories
|
|
●
|
On a year-over-year basis, operating profit increased 58% and grew 2x faster than sales
|
|
o
|
Operating margin improved 30 basis points year over year
|
|
●
|
Return on working capital increased 320 basis points year over year
|
Cash Flow and Balance Sheet Highlights
|
●
|
Working Capital
|
We continue to effectively manage all levers of our working capital and working capital to sales of $.14 remains at the low end of our long-term target range. Return on working capital increased 240 basis points year over year and is almost 32% on a consolidated basis. This is a key driver in creating shareholder value.
9
|
●
|
Return on Invested Capital
|
Our return on invested capital increased 190 basis points year over year to 14%, again demonstrating our commitment to generating superior returns for our shareholders. ROIC is considerably ahead of our weighted average cost of capital.
|
●
|
Cash Flow from Operations
|
Our working capital needs were lower than the year-ago period and therefore we used $180 million in cash from operations compared to a use of $282 million in the first quarter of 2010. On a trailing twelve month basis, we generated $323 million in cash from operations, during a period where organic revenue grew 22%.
|
●
|
Share Buyback
|
During the first quarter we executed on the remaining $33 million of our previous $200 million authorization, repurchasing a total of 6.9 million shares at an average price of $29.06. We now have $50 million that can be spent on future buybacks.
|
●
|
Debt and Liquidity
|
Our balance sheet and capital structure remain strong with conservative debt levels, and a net debt to EBITDA ratio of approximately 1.4x. Our financial position remains extremely strong, and we have $1.4 billion in committed liquidity facilities in addition to our cash of more than $500 million. Thus we now have the flexibility to take advantage of opportunities in the marketplace.
Second Quarter 2011 Guidance
|
●
|
Consolidated Sales $5.55Bn to $5.95Bn
|
|
o
|
Global Components $4.00Bn to $4.20Bn
|
|
o
|
Global ECS $1.55Bn to $1.75Bn
|
|
●
|
Diluted EPS $1.30 to $1.40
|
On an organic basis, we would expect growth in both of our business segments to track slightly ahead of normal seasonality in the second quarter. The addition of our recently acquired businesses will result in above seasonal growth in global components.
10
Arrow Electronics Revenue Seasonality
Core Global Components*
|
GLOBAL
|
GLOBAL
|
|||||||||||
|
NAC
|
EUR ex FX
|
A/P
|
COMPONENTS
|
COMP ex FX
|
||||||||
|
Q1
|
Flat to +2%
|
+13%
|
Flat to -13%
|
+2% to +4%
|
+3% to +5%
|
|||||||
|
Q2
|
Flat to -3%
|
-2% to -7%
|
+3% to +14%
|
+1% to -1%
|
Flat to -1%
|
|||||||
|
Q3
|
Flat to -2%
|
Flat to -10%
|
+15% to +20%
|
+2% to +3%
|
Flat to +2%
|
|||||||
|
Q4
|
Flat to -7%
|
-4% to +1%
|
-4% to -5%
|
-2% to -5%
|
-3% to -8%
|
|||||||
Global ECS
|
GLOBAL
|
GLOBAL
|
|||||||||
|
NA
|
EUR ex FX
|
ECS*
|
ECS ex FX
|
|||||||
|
Q1
|
-25% to -35%
|
-16% to -28%
|
-30% to -35%
|
-25% to -35%
|
||||||
|
Q2
|
+20% to +22%
|
+7% to +11%
|
+15% to +20%
|
+17% to +18%
|
||||||
|
Q3
|
-1% to -9%
|
-8% to -12%
|
-5% to -15%
|
-8% to -12%
|
||||||
|
Q4
|
+29% to +35%
|
+31% to +69%
|
+35% to +45%
|
+30% to +43%
|
||||||
Consolidated
|
TOTAL
|
|||
|
ARROW, Ex FX
|
|||
|
Q1
|
-6% to -11%
|
||
|
Q2
|
+5% to +6%
|
||
|
Q3
|
-1% to +1%
|
||
|
Q4
|
+5% to +12%
|
||
* Core global components, excluding acquisitions
11
Risk Factors
The discussion of the company’s business and operations should be read together with the risk factors contained in Item 1A of its 2010 Annual Report on Form 10-K, filed with the Securities and Exchange Commission, which describe various risks and uncertainties to which the company is or may become subject. If any of the described events occur, the company’s business, results of operations, financial condition, liquidity, or access to the capital markets could be materially adversely affected.
The recent earthquake and tsunami, and other collateral events, in Japan may negatively impact our supply of products or cause shortages of some components, which could have a material adverse effect on the company’s business.
As a result of the effects of the earthquake and tsunami that recently occurred in Japan, including the resultant nuclear crisis, certain of the company’s vendors may be unable to deliver sufficient quantities of components or deliver them in a timely manner. Further, depending on the length of these disruptions, we may need to locate alternate suppliers to fulfill our customers’ needs. While it is too early to predict what impact this crisis will have, it could have a material adverse affect on the company’s business.
Certain Non-GAAP Financial Information
In addition to disclosing results that are determined in accordance with Generally Accepted Accounting Principles ("GAAP"), the company provides certain non-GAAP financial information relating to operating income, net income attributable to shareholders and net income per basic and diluted share, each as adjusted for certain charges, credits and losses that the company believes impact the comparability of its results of operations. These charges, credits and losses arise out of the company's efficiency enhancement initiatives, acquisitions, prepayment of debt, and certain legal and tax matters. A reconciliation of the company's non-GAAP financial information to GAAP is set forth in the table below.
The company believes that such non-GAAP financial information is useful to investors to assist in assessing and understanding the company's operating performance and underlying trends in the company's business because management considers the charges, credits and losses referred to above to be outside the company's core operating results. This non-GAAP financial information is among the primary indicators management uses as a basis for evaluating the company's financial and operating performance. In addition, the company's Board of Directors may use this non-GAAP financial information in evaluating management performance and setting management compensation.
12
The presentation of this additional non-GAAP financial information is not meant to be considered in isolation or as a substitute for, or alternative to, operating income, net income and net income per basic and diluted share determined in accordance with GAAP. Analysis of results and outlook on a non-GAAP basis should be used as a complement to, and in conjunction with, data presented in accordance with GAAP.
Earnings Reconciliation
($ in thousands, except per share data)
|
Q1 2011
|
Q4 2010
|
Q1 2010
|
||||
|
Operating income, as Reported
|
$219,168
|
$231,795
|
$145,270
|
|||
|
Restructuring, integration, and other charges
|
9,607
|
6,070
|
7,437
|
|||
|
Settlement of legal matters
|
5,875
|
--
|
--
|
|||
|
Operating income, as Adjusted
|
$234,650
|
$237,865
|
$152,707
|
|||
|
Net income attributable to shareholders, as Reported
|
$136,309
|
$157,889
|
|
$87,046
|
||
|
Restructuring, integration, and other charges
|
7,199
|
5,459
|
5,545
|
|||
|
Settlement of legal matters
|
3,609
|
--
|
|
--
|
||
|
Gain on bargain purchase
|
(1,078)
|
--
|
--
|
|
||
|
Impact of settlement of tax matters
|
||||||
|
Income tax
|
--
|
(9,404)
|
--
|
|||
|
Interest (net of taxes)
|
--
|
(2,312)
|
--
|
|||
|
Net income attributable to shareholders, as Adjusted
|
$146,039
|
$151,632
|
$92,591
|
|||
|
Diluted EPS, as Reported
|
$1.16
|
$1.34
|
$.71
|
|||
|
Restructuring, integration, and other charges
|
.06
|
.05
|
.05
|
|||
|
Settlement of legal matters
|
.03
|
--
|
--
|
|||
|
Gain on bargain
|
(.01)
|
|
--
|
|
--
|
|
|
Impact of settlement of tax matters
|
|
|||||
|
Income tax
|
--
|
(.08)
|
--
|
|||
|
Interest (net of tax)
|
--
|
(.02)
|
--
|
|||
|
Diluted EPS, as Adjusted
|
$1.24
|
$1.29
|
$.76
|
|||
The sum of the components for net income per share, as Adjusted, may not agree to totals, as presented, due to rounding.
13
Earnings Reconciliation
References to restructuring and other charges refer to the following incremental charges taken in the periods indicated:
Q1-11 Restructuring, Integration, and Other Charges: During the first quarter of 2011, the company recorded restructuring, integration, and other charges of $9.6 million ($7.2 million net of related taxes or $.06 per share on both a basic and diluted basis) primarily related to initiatives taken by the company to improve operating efficiencies.
Q1-11 Settlement of Legal Matters: During the first quarter of 2011, the company recorded a charge of $5.9 million ($3.6 million net of related taxes or $.03 per share on both a basic and diluted basis) in connection with the settlement of a legal matter in 2011.
Q1-11 Gain on Bargain Purchase: During the first quarter of 2011, the company recognized a gain on bargain purchase of $1.8 million ($1.1 million net of related taxes or $.01 per share on both a basic and diluted basis) related to the acquisition of Nu Horizons Electronics in 2011.
Q4-10 Restructuring, Integration, and Other Charges: During the fourth quarter of 2010, the company recorded restructuring, integration, and other charges of $6.1 million ($5.5 million net of related taxes or $.05 per share on both a basic and diluted basis) primarily related to initiatives taken by the company to improve operating efficiencies.
Q4-10 Impact of Settlement of Tax Matters: During the fourth quarter of 2010, the company recorded a net reduction of the provision for income taxes of $9.4 million ($.08 per share on both a basic and diluted basis) and a reduction in interest expense of $3.8 million ($2.3 million net of related taxes or $.02 per share on both a basic and diluted basis) primarily related to the settlement of certain income tax matters covering multiple years.
Q1-10 Restructuring, Integration, and Other Charges: During the first quarter of 2010, the company recorded restructuring, integration, and other charges of $7.4 million ($5.5 million net of related taxes or $.05 per share on both a basic and diluted basis) primarily related to initiatives taken by the company to improve operating efficiencies.
| 14 |