Attached files
| file | filename |
|---|---|
| 8-K - FORM 8-K - LegacyTexas Financial Group, Inc. | c16135e8vk.htm |
| EX-99.1 - EXHIBIT 99.1 - LegacyTexas Financial Group, Inc. | c16135exv99w1.htm |

| 1 NASDAQ: VPFGFirst Quarter 2011 Results Gary Base - President and Chief Executive OfficerPatti McKee - Executive Vice President and Chief Financial OfficerMark Hord - Executive Vice President and General Counsel Exhibit 99.2 |

| 2 Safe Harbor Statement When used in filings by ViewPoint Financial Group, Inc. (the "Company") with the Securities and Exchange Commission (the "SEC"), in the Company's press releases or other public or shareholder communications, and in oral statements made with the approval of an authorized executive officer, the words or phrases "will likely result," "are expected to," "will continue," "is anticipated," "estimate," "project," "intends" or similar expressions are intended to identify "forward-looking statements" within the meaning of the Private Securities Litigation Reform Act of 1995. Such statements are subject to certain risks and uncertainties, including, among other things, changes in economic conditions, legislative changes, changes in policies by regulatory agencies, fluctuations in interest rates, the risks of lending and investing activities, including changes in the level and direction of loan delinquencies and write-offs and changes in estimates of the adequacy of the allowance for loan losses, the Company's ability to access cost-effective funding, fluctuations in real estate values and both residential and commercial real estate market conditions, demand for loans and deposits in the Company's market area, competition, changes in management's business strategies and other factors set forth under Risk Factors in our 2010 Form 10-K that could cause actual results to differ materially from historical earnings and those presently anticipated or projected. The Company wishes to advise readers that the factors listed above could materially affect the Company's financial performance and could cause the Company's actual results for future periods to differ materially from any opinions or statements expressed with respect to future periods in any current statements. The Company does not undertake - and specifically declines any obligation - to publicly release the result of any revisions which may be made to any forward-looking statements to reflect events or circumstances after the date of such statements or to reflect the occurrence of anticipated or unanticipated events. |
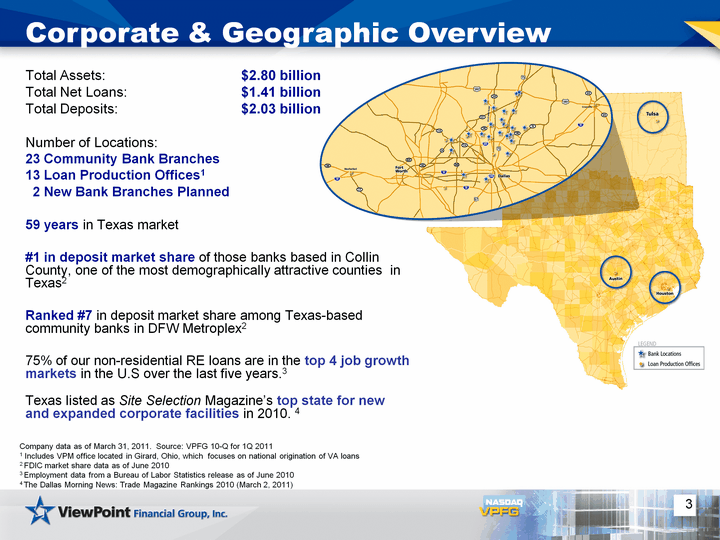
| 3 Total Assets: $2.80 billionTotal Net Loans: $1.41 billionTotal Deposits: $2.03 billionNumber of Locations: 23 Community Bank Branches 13 Loan Production Offices1 2 New Bank Branches Planned 59 years in Texas market#1 in deposit market share of those banks based in Collin County, one of the most demographically attractive counties in Texas2Ranked #7 in deposit market share among Texas-based community banks in DFW Metroplex275% of our non-residential RE loans are in the top 4 job growth markets in the U.S over the last five years.3Texas listed as Site Selection Magazine's top state for new and expanded corporate facilities in 2010. 4 Corporate & Geographic Overview Company data as of March 31, 2011. Source: VPFG 10-Q for 1Q 20111 Includes VPM office located in Girard, Ohio, which focuses on national origination of VA loans2 FDIC market share data as of June 20103 Employment data from a Bureau of Labor Statistics release as of June 20104 The Dallas Morning News: Trade Magazine Rankings 2010 (March 2, 2011) |
| 4 Two New Locations Planned Two new bank branches planned for 3Q 2011Assuming leases on bank facilities that were closed due to merger of two national banksLower cost, faster ramp-up timeFlower Mound market2,178 VPFG households2010 Estimated Average Household Income: $106,1142010 Estimated Population: 212,959Carrollton market5,365 VPFG households2010 Estimated Average Household Income: $88,7072010 Estimated Population: 238,420 Source: Nielsen Claritas, Company Documents |
| 5 Capitalize on a position of balance sheet strength Continue to grow organically in our economically stable and growing Texas marketRemain focused on our community banking approach and enhance the profitability of existing relationshipsContinue to develop existing lines of business, diversify the loan portfolio and develop Commercial and Industrial lendingEvaluate other opportunities to deploy capital: new locations, dividends, potential acquisitions, etc. Business Strategy |
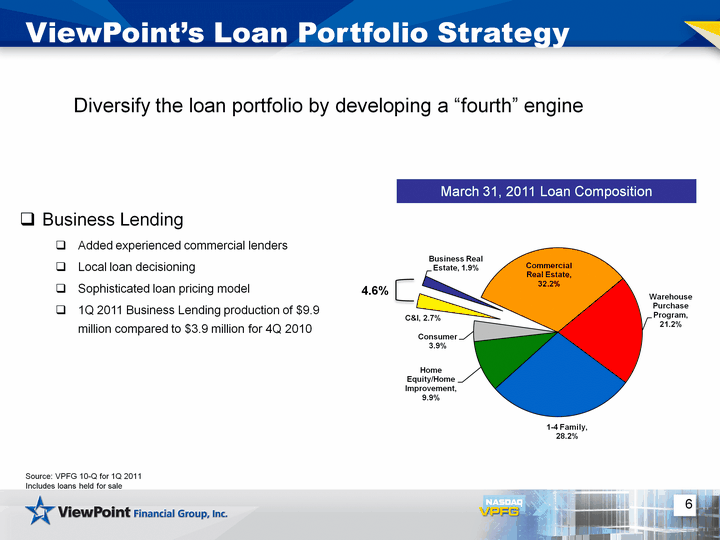
| 6 ViewPoint's Loan Portfolio Strategy Business LendingAdded experienced commercial lendersLocal loan decisioningSophisticated loan pricing model 1Q 2011 Business Lending production of $9.9 million compared to $3.9 million for 4Q 2010 March 31, 2011 Loan Composition Source: VPFG 10-Q for 1Q 2011Includes loans held for sale (CHART) Diversify the loan portfolio by developing a "fourth" engine 4.6% |
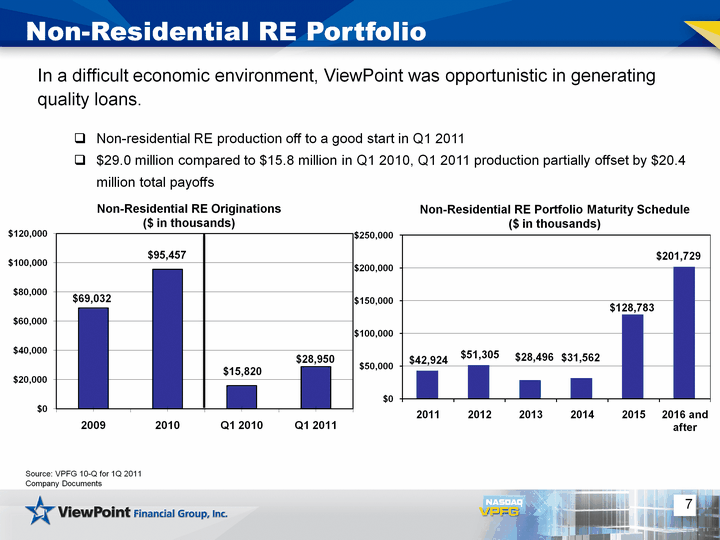
| 7 Non-Residential RE Portfolio Source: VPFG 10-Q for 1Q 2011Company Documents In a difficult economic environment, ViewPoint was opportunistic in generating quality loans.Non-residential RE production off to a good start in Q1 2011$29.0 million compared to $15.8 million in Q1 2010, Q1 2011 production partially offset by $20.4 million total payoffs (CHART) Non-Residential RE Originations($ in thousands) (CHART) Non-Residential RE Portfolio Maturity Schedule($ in thousands) |
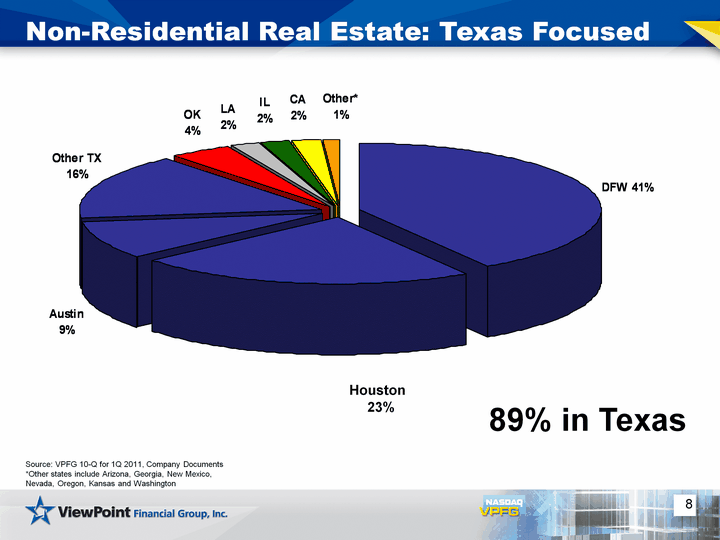
| TX DFW Houston Austin Other TX OK LA IL CA Other* Dollar 0.89 0.41 0.23 0.09 0.16 0.04 0.02 0.02 0.02 0.01 8 Non-Residential Real Estate: Texas Focused 89% in Texas Source: VPFG 10-Q for 1Q 2011, Company Documents*Other states include Arizona, Georgia, New Mexico, Nevada, Oregon, Kansas and Washington Houston23% |
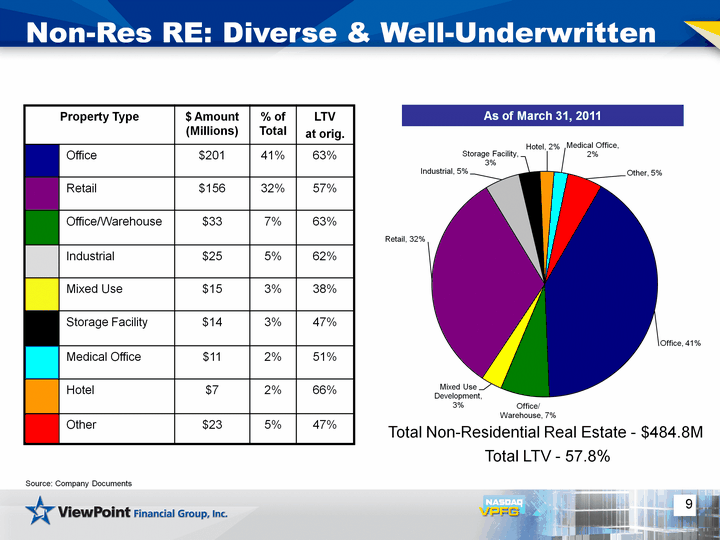
| 9 Non-Res RE: Diverse & Well-Underwritten Property Type Property Type $ Amount (Millions) % of Total LTVat orig. Office $201 41% 63% Retail $156 32% 57% Office/Warehouse $33 7% 63% Industrial $25 5% 62% Mixed Use $15 3% 38% Storage Facility $14 3% 47% Medical Office $11 2% 51% Hotel $7 2% 66% Other $23 5% 47% Total Non-Residential Real Estate - $484.8M Total LTV - 57.8% Source: Company Documents As of March 31, 2011 (CHART) |
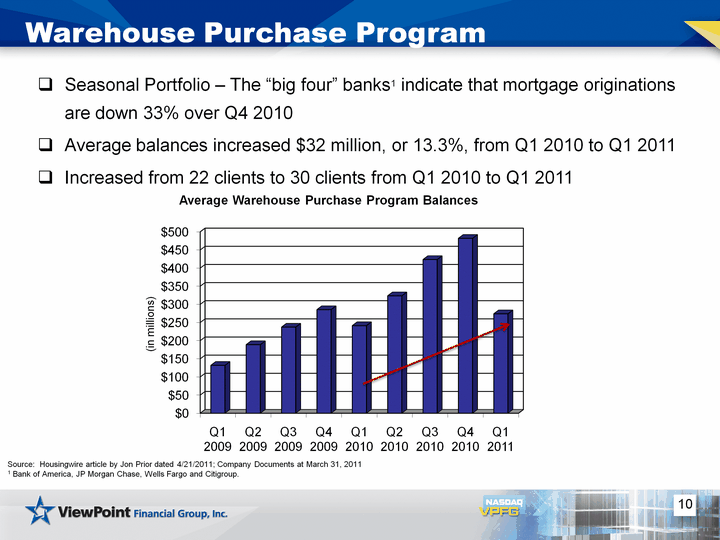
| 10 Warehouse Purchase Program Seasonal Portfolio - The "big four" banks1 indicate that mortgage originations are down 33% over Q4 2010Average balances increased $32 million, or 13.3%, from Q1 2010 to Q1 2011Increased from 22 clients to 30 clients from Q1 2010 to Q1 2011 Source: Housingwire article by Jon Prior dated 4/21/2011; Company Documents at March 31, 20111 Bank of America, JP Morgan Chase, Wells Fargo and Citigroup. (CHART) |
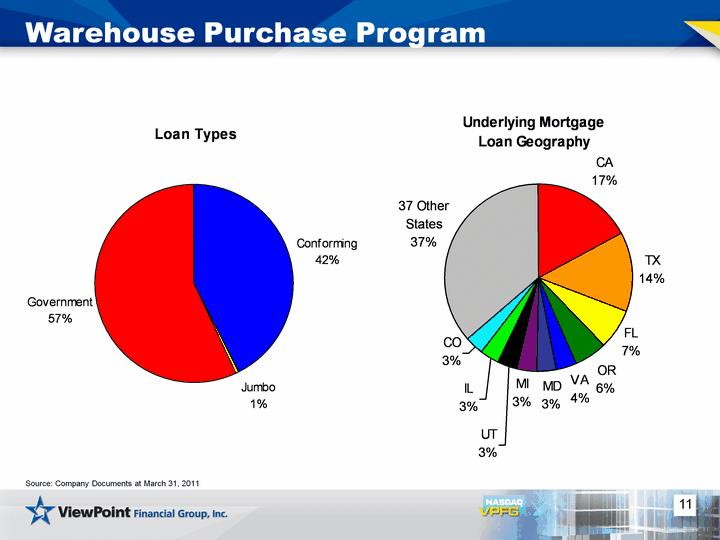
| 11 Warehouse Purchase Program Source: Company Documents at March 31, 2011 Conforming Jumbo Government East 127654116 1865313 170969520 CA TX FL OR VA MD MI UT IL CO 37 Other States East 17.24 13.69 6.76 5.61 3.52 3.47 3.45 3.32 3.32 3.2 36.42 |
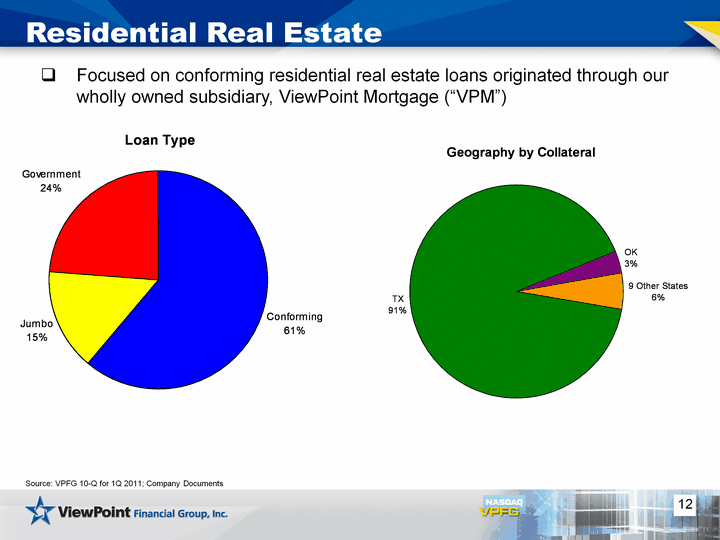
| 12 Residential Real Estate Source: VPFG 10-Q for 1Q 2011; Company Documents Focused on conforming residential real estate loans originated through our wholly owned subsidiary, ViewPoint Mortgage ("VPM") Conforming Jumbo Government Residential 52717598 12958223 20565967 TX OK 9 Other States Residential Geography 91.14 3.35 5.51 |
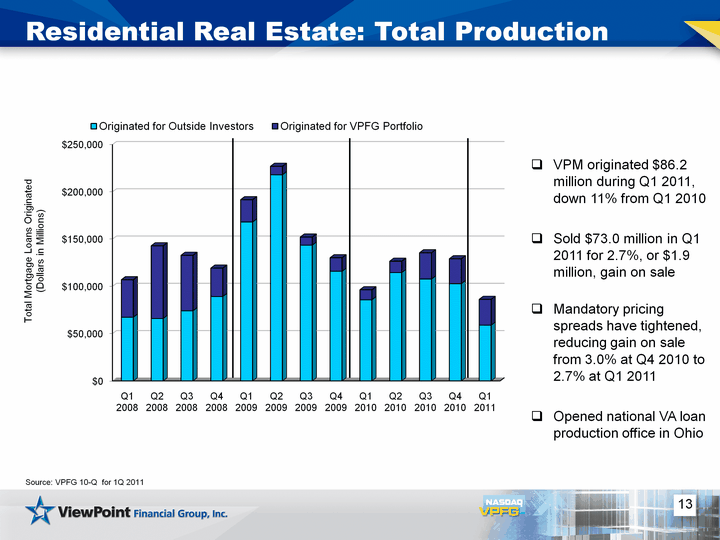
| 13 Residential Real Estate: Total Production VPM originated $86.2 million during Q1 2011, down 11% from Q1 2010Sold $73.0 million in Q1 2011 for 2.7%, or $1.9 million, gain on sale Mandatory pricing spreads have tightened, reducing gain on sale from 3.0% at Q4 2010 to 2.7% at Q1 2011Opened national VA loan production office in Ohio (CHART) Total Mortgage Loans Originated(Dollars in Millions) Source: VPFG 10-Q for 1Q 2011 |
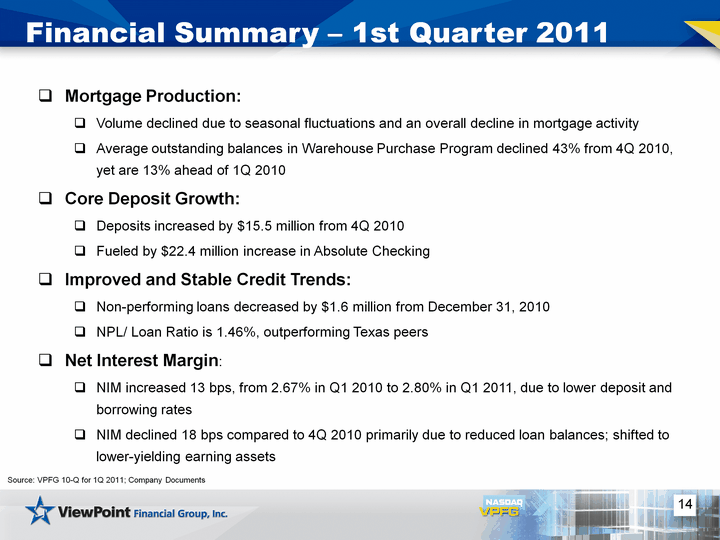
| 14 Financial Summary - 1st Quarter 2011 Mortgage Production: Volume declined due to seasonal fluctuations and an overall decline in mortgage activity Average outstanding balances in Warehouse Purchase Program declined 43% from 4Q 2010, yet are 13% ahead of 1Q 2010Core Deposit Growth: Deposits increased by $15.5 million from 4Q 2010Fueled by $22.4 million increase in Absolute CheckingImproved and Stable Credit Trends: Non-performing loans decreased by $1.6 million from December 31, 2010NPL/ Loan Ratio is 1.46%, outperforming Texas peersNet Interest Margin: NIM increased 13 bps, from 2.67% in Q1 2010 to 2.80% in Q1 2011, due to lower deposit and borrowing ratesNIM declined 18 bps compared to 4Q 2010 primarily due to reduced loan balances; shifted to lower-yielding earning assets Source: VPFG 10-Q for 1Q 2011; Company Documents |
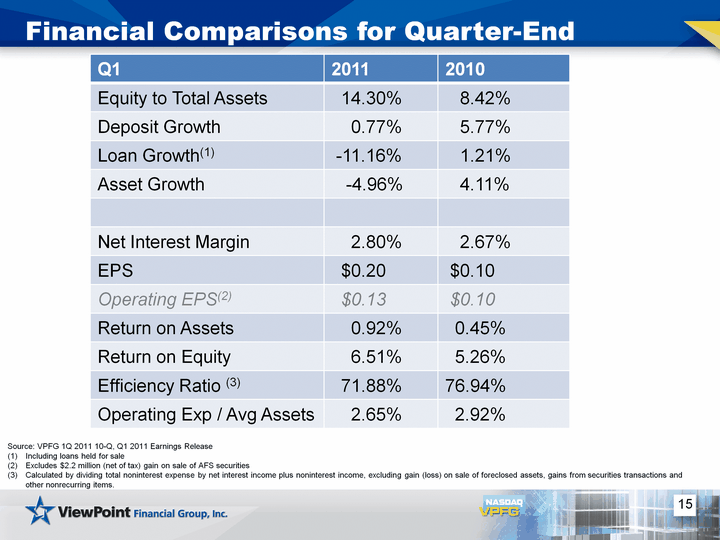
| 15 Financial Comparisons for Quarter-End Q1 2011 2010 Equity to Total Assets 14.30% 8.42% Deposit Growth 0.77% 5.77% Loan Growth(1) -11.16% 1.21% Asset Growth -4.96% 4.11% Net Interest Margin 2.80% 2.67% EPS $0.20 $0.10 Operating EPS(2) $0.13 $0.10 Return on Assets 0.92% 0.45% Return on Equity 6.51% 5.26% Efficiency Ratio (3) 71.88% 76.94% Operating Exp / Avg Assets 2.65% 2.92% Source: VPFG 1Q 2011 10-Q, Q1 2011 Earnings ReleaseIncluding loans held for saleExcludes $2.2 million (net of tax) gain on sale of AFS securitiesCalculated by dividing total noninterest expense by net interest income plus noninterest income, excluding gain (loss) on sale of foreclosed assets, gains from securities transactions and other nonrecurring items. |
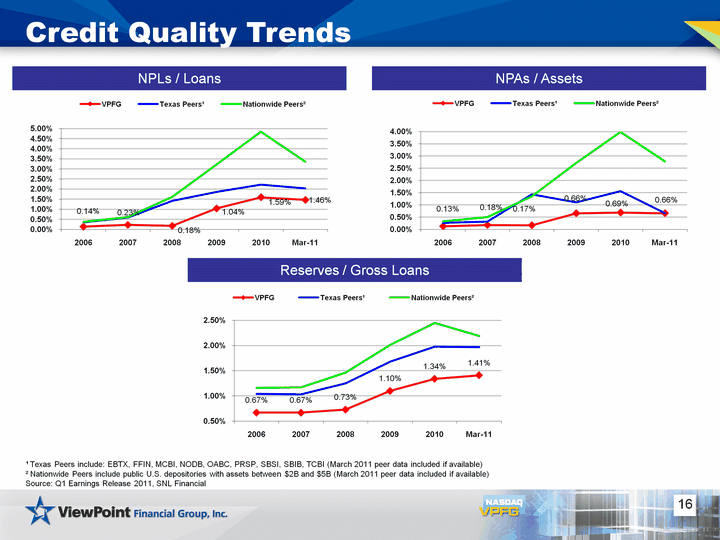
| 16 Credit Quality Trends (CHART) (CHART) (CHART) NPAs / Assets NPLs / Loans 1 Texas Peers include: EBTX, FFIN, MCBI, NODB, OABC, PRSP, SBSI, SBIB, TCBI (March 2011 peer data included if available)2 Nationwide Peers include public U.S. depositories with assets between $2B and $5B (March 2011 peer data included if available)Source: Q1 Earnings Release 2011, SNL Financial Reserves / Gross Loans |
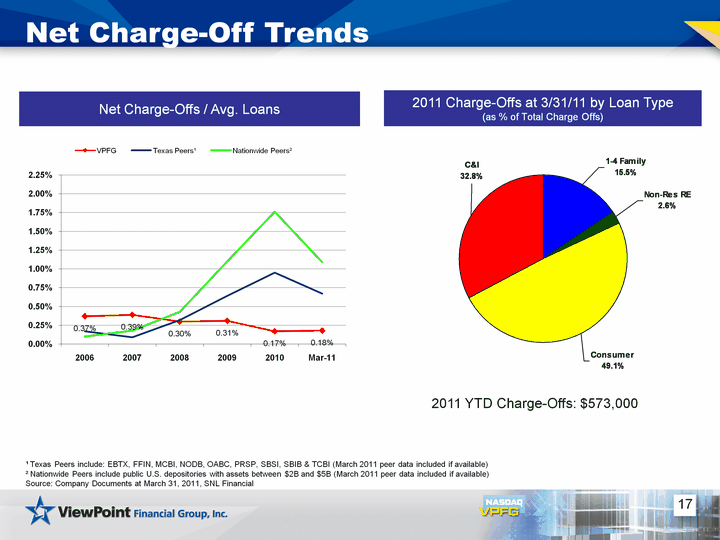
| 17 Net Charge-Off Trends 2011 Charge-Offs at 3/31/11 by Loan Type (as % of Total Charge Offs) (as % of Total Charge Offs) (as % of Total Charge Offs) Net Charge-Offs / Avg. Loans 2011 YTD Charge-Offs: $573,000 1 Texas Peers include: EBTX, FFIN, MCBI, NODB, OABC, PRSP, SBSI, SBIB & TCBI (March 2011 peer data included if available)2 Nationwide Peers include public U.S. depositories with assets between $2B and $5B (March 2011 peer data included if available)Source: Company Documents at March 31, 2011, SNL Financial 2011 1-4 Family 89164.12 Non-Res RE 15007.34 Consumer 281399.61 C&I 188233.46 |
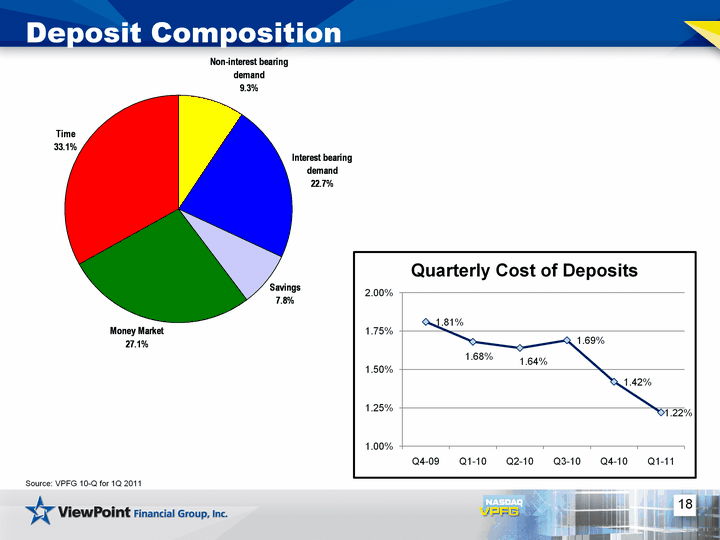
| 18 Deposit Composition Source: VPFG 10-Q for 1Q 2011 (CHART) Non-interest bearing demand Interest bearing demand Savings Money Market Time 189632 461272 158399 550503 673213 |
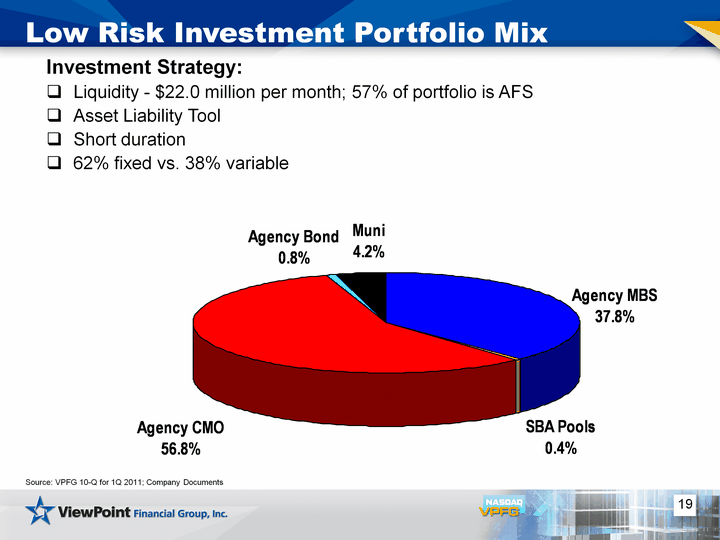
| 19 Low Risk Investment Portfolio Mix Source: VPFG 10-Q for 1Q 2011; Company Documents Investment Strategy:Liquidity - $22.0 million per month; 57% of portfolio is AFSAsset Liability Tool Short duration 62% fixed vs. 38% variable Agency MBS SBA Pools Agency CMO Agency Bond Muni 462716749 4868006 695645326 9998521 50483830 |
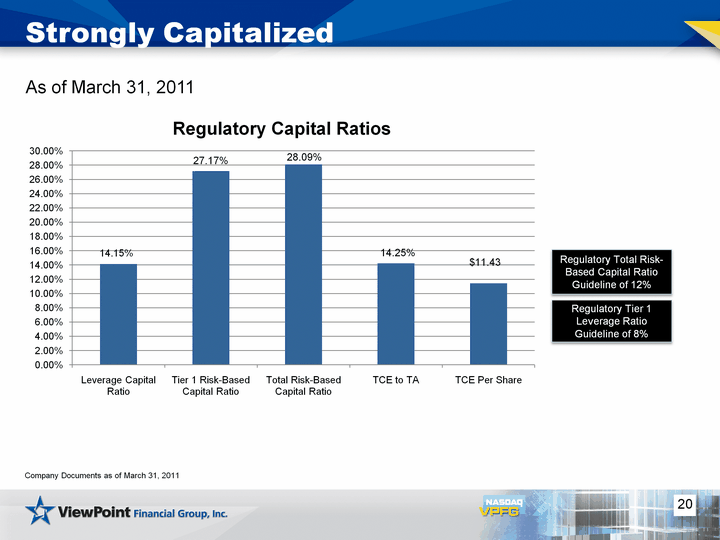
| 20 Strongly Capitalized Company Documents as of March 31, 2011 (CHART) Regulatory Total Risk- Based Capital Ratio Guideline of 12% Regulatory Tier 1 Leverage Ratio Guideline of 8% As of March 31, 2011 |

| 21 Dividend Source: VPFG 10-Q for 1Q 2011; Company documents ViewPoint Financial Group, Inc. has always paid a dividend since becoming a public stock companyAnnounced a dividend of 25% of earnings, or $0.05 per share ($0.20 per share annually), on April 22, 2011 |
| 22 Summary One of the largest independent community banking franchises in TexasExperienced management team with strong local tiesImproving profitabilityStrong credit metrics reflecting disciplined underwriting standardsStrong capital levels can support continued growthFavorable asset quality compared to publicly-traded Texas peers |

| 23 Questions? |
| 1 Appendix The subsequent tables present non-GAAP reconciliations of the following calculations: Operating EPS - excludes non-recurring $2.2 million (net of tax) gain on sale of securities that occurred during Q1 2011 (using a 35% tax rate) TCE (Tangible Common Equity) to TCA (Tangible Common Assets) ratio TCE per share |
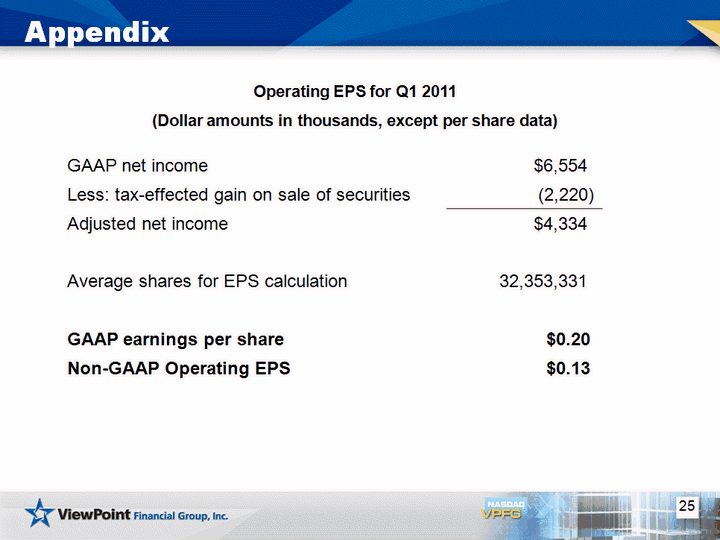
| 2 Appendix Operating EPS for Q1 2011 (Dollar amounts in thousands, except per share data) GAAP net income $6,554 Less: tax-effected gain on sale of securities (2,220) Adjusted net income $4,334 Average shares for EPS calculation 32,353,331 GAAP earnings per share $0.20 Non-GAAP Operating EPS $0.13 |
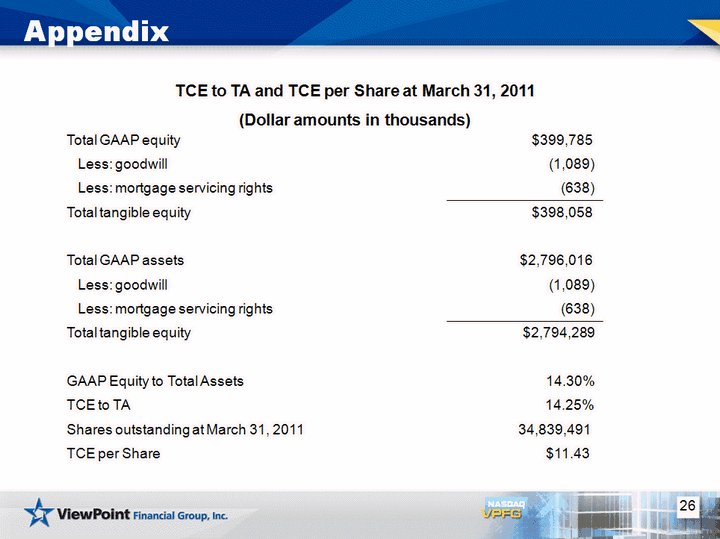
| 3 Appendix TCE to TA and TCE per Share at March 31, 2011 (Dollar amounts in thousands) Total GAAP equity $399,785 Less: goodwill (1,089) Less: mortgage servicing rights (638) Total tangible equity $398,058 Total GAAP assets $2,796,016 Less: goodwill (1,089) Less: mortgage servicing rights (638) Total tangible equity $2,794,289 GAAP Equity to Total Assets 14.30% TCE to TA 14.25% Shares outstanding at March 31, 2011 34,839,491 TCE per Share $11.43 |
