Attached files
| file | filename |
|---|---|
| EX-32.2 - CREATIVE VISTAS INC | v216524_ex32-2.htm |
| EX-31.2 - CREATIVE VISTAS INC | v216524_ex31-2.htm |
| EX-32.1 - CREATIVE VISTAS INC | v216524_ex32-1.htm |
| EX-31.1 - CREATIVE VISTAS INC | v216524_ex31-1.htm |
| EX-21.1 - CREATIVE VISTAS INC | v216524_ex21-1.htm |
| EX-10.16 - CREATIVE VISTAS INC | v216524_ex10-16.htm |
UNITED STATES
SECURITIES AND EXCHANGE COMMISSION
WASHINGTON, D.C. 20549
FORM 10-K
(Mark one)
x ANNUAL REPORT PURSUANT TO SECTION 13 OR 15 (D) OF THE SECURITIES EXCHANGE ACT OF 1934
For the fiscal year ended December 31, 2010
or
¨ TRANSITION REPORT PURSUANT TO SECTION 13 OR 15(D) OF THE SECURITIES EXCHANGE ACT OF 1934
For the transition period from _____ to _____
Commission File Number: 0 - 16819
CREATIVE VISTAS, INC.
(Exact name of registrant as specified in its charter)
|
Arizona
(State or Other Jurisdiction of
Incorporation or Organization)
2100 Forbes Street
Unit 8-10
Whitby, Ontario, Canada
(Address of Principal Executive Offices)
|
86-0464104
(I.R.S. Employer
Identification No.)
L1N 9T3
(Zip Code)
|
Registrant’s Telephone Number, Including Area Code: 905-666-8676
Securities registered pursuant to Section 12(b) of the Exchange Act:
None
Securities registered pursuant to Section 12(g) of the Exchange Act:
Common Stock, No Par Value
(Title of Class)
Indicate by check mark if the registrant is a well-known seasoned issuer, as defined in Rule 405 of the Securities Act.
Yes o No x
Indicate by check mark if the registrant is not required to file reports pursuant to Section 13 or 15(d) of the Exchange Act.
Yes o No x
Indicate by check mark whether the registrant (1) has filed all reports required to be filed by Section 13 or 15(d) of the Securities Exchange Act of 1934 during the preceding 12 months (or for such shorter period that the registrant was required to file such reports), and (2) has been subject to such filing requirements for the past 90 days. Yes x No¨
Indicate by check mark whether the registrant has submitted electronically and posted on its corporate site, if any, every Interactive Data File required to be submitted and posted pursuant to Rule 405 of Regulation S-T (§ 232.405 of this chapter) during the preceding 12 months (or for such shorter period that the registrant was required to submit and post such files).
Yes ¨ No¨
Indicate by check mark if disclosure of delinquent filers pursuant to Item 405 of Regulation S-K is not contained herein, and will not be contained, to the best of registrant’s knowledge, in the definitive proxy or information statements incorporated by reference in Part III of this Form 10-K or any amendment to the Form 10-K. x
Indicate by check mark whether the registrant is a large accelerated filer, an accelerated filer, a non-accelerated filer, or a smaller reporting company. See the definitions of “large accelerated filer,” “accelerated filer” and “smaller reporting company” in Rule 12b-2 of the Exchange Act. (Check one): Yes x No¨
|
Large Accelerated Filer ¨
|
Accelerated Filer ¨
|
|
|
Non-Accelerated Filer ¨
|
Smaller Reporting Company x
|
|
|
(Do not check if a smaller reporting company)
|
||
Indicate by check mark whether the registrant is a shell company (as defined in Rule 12b-2 of the Exchange Act).
¨ Yes x No
The aggregate market value of the voting and non-voting common equity held by non-affiliates computed by reference to the price at which the common equity was last sold, or the average bid and asked price of such common equity, as of the last business day of the registrant’s most recently completed second fiscal quarter was approximately $629,798 (8,991,121 Shares at $0.07).
APPLICABLE ONLY TO REGISTRANTS INVOLVED IN BANKRUPTCY
PROCEEDINGS DURING THE PRECEDING FIVE YEARS:
Indicate by check mark whether the registrant has filed all documents and reports required to be filed by Section 12, 13 or 15(d) of the Securities Exchange Act of 1934 subsequent to the distribution of securities under a plan confirmed by a court.
Yes ¨ No¨
At March 31, 2011, the number of shares outstanding of the registrant’s common stock, no par value (the only class of common stock), was 37,488,714.
|
PART I
|
||||
|
Item 1.
|
Business
|
1
|
||
|
Item 1A.
|
Risk Factors
|
13
|
||
|
Item 1B.
|
Unresolved Staff Comments
|
18 | ||
|
Item 2.
|
Properties
|
18
|
||
|
Item 3.
|
Legal Proceedings
|
18
|
||
|
Item 4.
|
Removed and Reserved
|
18
|
||
|
PART II
|
||||
|
Item 5.
|
Market for the Registrant's Common Equity Related Stockholder Matters and Issuer Purchases of Equity Securities
|
19
|
||
|
Item 6.
|
Selected Financial Data
|
19
|
||
|
Item 7.
|
Management's Discussion and Analysis of Financial Condition and Results of Operations
|
19
|
||
|
Item 7a.
|
Quantitative and Qualitative Disclosures about Market Risk
|
26
|
||
|
Item 8.
|
Financial Statements and Supplementary Data
|
F-1 - F-27
|
||
|
Item 9.
|
Changes in and Disagreements with Accountants on Accounting and Financial Disclosure
|
27
|
||
|
Item 9a.
|
Controls and Procedures
|
27
|
||
|
Item 9b.
|
Other Information
|
27
|
||
|
PART III
|
||||
|
Item 10.
|
Directors, Executive Officers and Corporate Governance
|
27
|
||
|
Item 11.
|
Executive Compensation
|
29
|
||
|
Item 12.
|
Security Ownership of Certain Beneficial Owners and Management and Related Stockholder Matters
|
30
|
||
|
Item 13.
|
Certain Relationships and Related Transactions, and Director Independence
|
33
|
||
|
Item 14.
|
Principle Accountant Fees and Services
|
33
|
||
|
Item 15.
|
|
Exhibits and Financial Statement Schedules
|
|
34
|
Forward-Looking Statements
Certain statements within this Form 10-K constitute “forward-looking statements” within the meaning of the Private Securities Litigation Reform Act of 1995. Such forward-looking statements involve known and unknown risks, uncertainties and other factors that may cause the actual results, performance or achievements of Creative Vistas, Inc. to be materially different from any future results, performance or achievements expressed or implied by such forward-looking statements. These forward-looking statements are based on our current expectations and are subject to a number of risks, uncertainties and assumptions relating to our operations, financial condition and results of operations, including, among others, rapid technological and other changes in the market we serve, our numerous competitors and the few barriers to entry for potential competitors, the seasonality and quarterly variations we experience in our revenue, our customer concentration, our uncertain revenue growth, our ability to attract and retain qualified personnel, our ability to expand our infrastructure and manage our growth, and our ability to identify, finance and integrate acquisitions, among others. If any of these risks or uncertainties materializes, or if any of the underlying assumptions prove incorrect, actual results may differ significantly from results expressed or implied in any forward-looking statements made by us. These and other risks are detailed in this Annual Report on Form 10-K and in other documents filed by us with the Securities and Exchange Commission. Creative Vistas, Inc. undertakes no obligation to update publicly any forward-looking statements for any reason, even if new information becomes available or other events occur in the future.
PART I
|
Item 1.
|
Business
|
Corporate Background and Overview
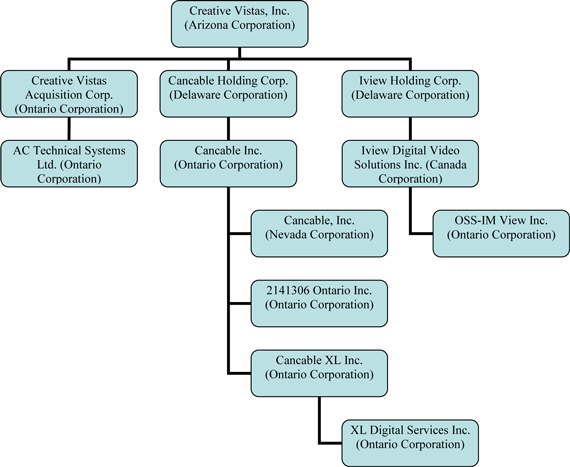
Creative Vistas, Inc. was incorporated in the state of Arizona on July 18, 1983. We are a leading provider of security-related technologies and systems. We also provide the deployment of broadband services to the commercial and residential market. We primarily operate through our subsidiaries AC Technical Systems Ltd. (“AC Technical Systems”) and Iview Digital Video Solutions Inc. (“Iview DVSI”), to provide integrated electronic security-related technologies and systems. AC Technical Systems is responsible for all of our revenues in the security sector for 2010. It provides its systems to various high profile clients including: government, school boards, retail outlets, banks, and hospitals. Iview DVSI is responsible for providing video surveillance products and technologies to the market.
On December 31, 2005, we acquired Cancable Inc. (“Cancable”) through our wholly owned Delaware subsidiary, Cancable Holding Corp. Cancable is in the business of providing the deployment and servicing of broadband technologies in both residential and commercial markets. Cancable has offices in Ontario, Canada. All related documents were disclosed in Form 8-K/A filed on January 6, 2006. In October 2007, we entered into an agreement, through our wholly owned newly formed Ontario subsidiary, Cancable XL Inc. (“Cancable XL”), to acquire all of the issued and outstanding shares of capital stock and any other equity interests of XL Digital Services Inc. (“XL Digital”), an Ontario corporation. All related documents were disclosed in Form 8K filed on October 17, 2007. In October 2009, we incorporated OSS-IM View Inc. which is responsible for providing BI software. The current version of BI software manages data from over a million multi-faceted transactions for large field-services customers. Wireless and web enabled, the software provides automated intelligent decision-making for managing customer transactions, vehicles, technicians, supply chains, HR-related functions and other activities.
Today, our operations are divided into two distinct operating segments: (a) security and surveillance products and services, and (b) broadband deployment and provisioning services. Through AC Technical Systems we provide integrated security solutions to our commercial customer base. Through Cancable, and XL Digital, we provide broadband deployment and provisioning services to residential and commercial markets.
The current corporate structure is as follows:
2
Security and Surveillance Products and Services
AC Technical Systems is focused on the electronic security segment of the security industry. Through our technology integration team of engineers, we integrate various security related products to provide single source solutions to our growing customer base. Our design, engineering and integration facilities are located in Ontario, Canada. We operate through our Iview DVSI subsidiary to build out Digital Video Management Systems (DVMS) to provide PC based video management systems to the surveillance market. Iview is a product company and sells to distributors and integrators in North America. Iview is in the early stages of building a strong consistent sales and marketing team to begin contributing revenues to us.
Industry Overview
We believe that the security industry is growing at a steady pace. There has been renewed focus on our industry since the events of September 11, 2001. The growth is spurred by the continuous evolution of new technologies and processes. We believe that the industry is growing for the following reasons:
|
|
·
|
Increased global awareness due to the increased threats of terrorism;
|
|
|
·
|
Older security devices such as the VCR have become obsolete and new technologies have provided much more efficient systems at a better price;
|
|
|
·
|
Evolving digital technologies have started to replace antiquated analog technologies in the market space;
|
|
|
·
|
Expansion of budgets due to increased awareness of the need for security;
|
|
|
·
|
Increase in crime rates and shrinkage in the industry;
|
|
|
·
|
Integration of multiple devices has expanded the market for technically advanced integrators such as our firm; and
|
|
|
·
|
Growing public concern about crime.
|
|
|
·
|
Decreased cost of security technology.
|
The security industry is highly fragmented with a large number of manufacturers, dealers, distributors, integrators and service groups. All of these parties provide part of the entire solution to the customer. Customers prefer a one-stop shop that provides them with the entire solution and also designs and customizes a solution that fits their needs. This solution may include custom design of hardware, software, along with highly sophisticated integration work. In most cases the cost to the customer is higher when using a large number of parties as opposed to one efficient integrator. We believe that when many parties are involved in providing a solution to the customer, many needs of the customer may not be addressed. The amount of time a customer has to devote to build multiple relationships as opposed to one relationship is substantial. There are also tendencies for different parties to “pass the blame” to the other party when it comes to technical and service issues with the project. As a result, the customer prefers dealing with one source that can handle all issues and be accountable for an entire project. There are a limited number of companies besides us that are capable of providing this entire integrated solution. Providing such a solution requires years of experience, infrastructure for performing all six core functions that we provide, access to technologies and a significant commitment to maintaining a satisfied customer.
A company that is implementing a new security system or enhancing an old system usually has to go through the following steps:
|
|
·
|
Retain a consultant to appropriately outline its needs and design a system that satisfies those needs;
|
|
|
·
|
Once the design is complete, a tender is released whereby a number of invited system integrators bid on the required system;
|
|
|
·
|
System integrators work with various suppliers of hardware and software to meet the system requirements. They also engage these suppliers to complete subcomponents of the system;
|
|
|
·
|
When security systems have to be installed in multiple locations, the company may have to tender the system requirements to different system integrators from various regions; and
|
|
|
·
|
The customer, based on price and qualifications of the system integrator, will award the project to one or more system integrators.
|
3
The process described above can cause a number of issues for clients including client frustrations with project delays, cost inefficiencies, incompatible systems and lack of vendor accountability. It also makes it very difficult for the customer to make changes to the system. In addition, a customer looking to implement security systems in multiple locations may have to hire multiple integrators and suppliers to integrate systems. This usually results in systems that are not consistent with each other. These systems may also not communicate efficiently with a central system. In addition, as security systems become more technologically advanced, an experienced engineering team is required to understand the needs of the customer and satisfy those needs by incorporating the most efficient technologies available into the security system. This may also include some development of hardware and software to customize and integrate the system. Most system integrators are not capable of development, as they do not have a research and development department. Also, the manufacturers of different subsystems are usually not willing to provide custom solutions on a project basis. Customers are realizing the sophistication required in order to provide a good security system and recognizing that their in-house personnel lack the skills and time necessary to coordinate their security projects.
Our Strategy
We have identified four key markets to target with our solution described below. These are 1) government, 2) education 3) healthcare and 4) retail. We offer a one-stop-shop that provides a fully integrated technology based security system to meet the needs of the customer. We understand the needs of the customer and provide a custom solution to meet their needs. We expedite project completion, reduce costs to the customer, reduce manpower requirements of the customer and improve systems consistency in multiple locations.
We provide the following services:
|
|
·
|
Consulting, audit, review and planning;
|
|
|
·
|
Engineering and design;
|
|
|
·
|
Customization, software development and interfacing;
|
|
|
·
|
System integration, installation and project management;
|
|
|
·
|
System training, technical support and maintenance; and
|
|
|
·
|
Ongoing maintenance, preventative maintenance and service and upgrades.
|
We believe that the following key attributes provide us with a sustainable competitive advantage including:
|
|
·
|
Experience and expertise in the security industry;
|
|
|
·
|
In-house research and development departments;
|
|
|
·
|
Dedicated service team;
|
|
|
·
|
Access to and experience in a variety of product mix;
|
|
|
·
|
Customized software and hardware products;
|
|
|
·
|
Strong references; and
|
|
|
·
|
Strong partnerships with suppliers and integrators.
|
Our strategy for growth and expansion is to:
|
|
·
|
Expand our network of technology partners;
|
|
|
·
|
Develop and maintain long-term relationships with clients;
|
|
|
·
|
Open regional offices in key areas to expand revenue and service;
|
|
|
·
|
Capitalize on our position as a leading provider of technologically advanced security systems; and
|
|
|
·
|
Expand our marketing and sales program within our key vertical markets.
|
At the beginning of each new client relationship, we designate an account manager as the client service contact. This individual is the point person for communications between the client and us. The account manager usually has a number of years of experience in the industry and a good understanding of technologies and solutions that we provide. This person is also a trained salesperson who is able to build a long-term relationship with the customer. The account manager works with our project department, engineering department, marketing department, finance department and research and development department to provide an effective solution for the customer. Once the customer has engaged us to provide a solution, the engagement usually goes through one or more of the stages outlined below:
4
Consulting, audit, review and planning
We identify the client’s objectives and security system requirements. We then audit and review the client’s existing system. This audit of the existing system evaluates inventory counts and the existing infrastructure. Then we provide an audit report to outline current deficiencies and vulnerabilities. At this point we design a system alternative to meet the needs of the customer. The alternative system is prioritized based on the needs of the customer. We also include an efficient cost model to ensure that the customer understands the cost of the system. We provide a Return On Investment (ROI) model where applicable. We also provide a preliminary project implementation plan that contains a graphical model of the client’s premises with exact outlines of equipment locations. Our comprehensive planning process helps the customer to properly budget for its needs on a long-term basis.
Engineering and design
The engineering and design process involves preparation of detailed project specifications and working drawings by a team of our design engineers. These drawings lay out the entire property and provide a detailed map of all security equipment and the methodologies used to integrate the system. The specification and drawings also outline any needs for custom software or hardware design services, systems designers and computer-aided design system operators. These specifications and drawings detail areas of high sensitivity, the layout of the main control room, and the placement of cameras, card readers, monitors, switches and other equipment.
Once our system design has been completed, we provide a complete list of components and recommendations. We highly recommend off-the-shelf non-proprietary components in order to ensure that the customer is not tied into one supplier. When off-the-shelf components are not available or are not compatible with each other, we design software or hardware to provide compatibility.
Customization, software development, interface
In many cases, the customer’s needs may not be completely satisfied by the equipment available in the market place. The customer may request features or equipment that are not readily available. For example, a financial institution may request us to take information from their transaction records and an Automatic Teller Machine (ATM), and then integrate that information with a Digital Video Recorder (DVR). This would allow them to review video of an individual who has processed a transaction on an ATM. Normally a financial institution requiring this information would have to go through tapes of data in order to find it. Such a bank would have to search all the transactions that occurred during a period of time and then, based on that information, go over tapes of video. Sometimes the video may not be available if the tapes are only held for a short period of time. Our firm’s integrated system makes this search process instantaneous. Our system allows a bank to search by a number of criteria including time, date, transaction, number and withdrawal amount. A bank can also have video associated with such a search instantly.
Many times we provide an interface to bring multiple technologies together. In one project we integrated eleven different products into one system, thus allowing for a completely integrated system. This integrated system also has a very user-friendly interface that avoids having to deal with multiple monitors and Graphical User Interfaces (GUI).
System integration, installation, project management:
Once we determine that a project has passed through the consulting/audit, design/engineering and customization/software interfacing stage (if required) we can start the implementation of system. During this stage, we provide the following:
|
|
·
|
Detailed schedule of integration
|
|
|
·
|
List of components and labor assignments
|
|
|
·
|
Officially assign the project to one of our project managers
|
|
|
·
|
Production department starts procurement schedules
|
|
|
·
|
Construction draw date schedules
|
|
|
·
|
Progress billings and schedule site visits for quality control
|
|
|
·
|
Tests of final terminations and technology components in-house in order to avoid product failure on site
|
|
|
·
|
Hardware/software and network integration
|
|
|
·
|
Validation and testing
|
|
|
·
|
Final sign off and pass over to service department
|
During this stage the project manager manages the project and the projects are updated weekly to ensure that all components are working efficiently. During certain projects the project manager may opt to use subcontractors to provide services that are not highly advanced technically. These services may include standard wiring and cabling. The customer is updated on the status of the project weekly. These updates may include Gantt charts. During this stage, many customers see the need for additional enhanced equipment, which increases the value of the contract to us.
5
System training, technical support, maintenance
When a project has been completed through system integration, the customer is provided with a complete training program. We train the customer on how to use the system and also provide them with manuals from manufacturers as well as training guides put together by us. Once the training is complete the system will go on line and there is a transfer process to the service department from the projects department. Ongoing technical support and maintenance are provided by our dedicated service team.
Ongoing maintenance, preventative maintenance and service, upgrades:
This is the final stage of our process and it is an ongoing stage. We provide various types of maintenance contracts, which vary depending on the level of response required by the customer. We also provide a service plan suitable to the customer. If the customer does not require a service contract, we provide them with service on an incident by incident basis.
The entire six steps process continues for each customer. Once a project is complete, there are upgrades that are required. Depending on the value of the upgrades, they may initiate a new project. During every stage an account manager is updated on the process. Account managers have regular meetings with the customers after projects are complete in order to help set budgets for the following years and also educate customers on new products and technologies that may be available in the market.
Research and Development
We have our own in-house research and development programs which are supported by the National Research Council of Canada. We may receive grants and tax credits for projects and product development if they qualify for the program. Our product development department develops new products and also enhances existing products. We have the capability to build various forms of hardware and software modules. Once a product is designed, the underlying technologies are used on an ongoing basis to enhance future projects and develop new products. This is one of the differentiating factors between our competitors and us. Our research and development expenses were approximately $860,000 in fiscal year 2010 and $590,000 in fiscal year 2009. Expenses include engineering salaries, costs of development tools and equipment. None of the expenses were borne directly by customers.
Warranties and Maintenance
We offer maintenance and service on all our products, including parts and labor, which range from one year to six years depending upon the type of product concerned and the type of contract signed by the customers. In addition, we provide a one-year warranty on equipment and a 90 day warranty all installation projects completed by us. We receive the same warranty on equipment from our other external suppliers.
On non-warranty items, we perform repair services for our products sold at our main office in Ontario, Canada or at customer locations. For the years ended December 31, 2010 and December 31, 2009, our revenue from such service and maintenance activities was $1,409,400 and $1,471,500 respectively, and is included in service revenue in the accompanying consolidated statements of operations and comprehensive (loss).
Marketing
Our marketing activities are conducted on both national and regional levels. We obtain engagements through direct negotiation with clients, competitive bid processes, referrals and direct sales calls. Our marketing plan is derived with input from all our account managers and senior management. Our plan is to grow vertically within targeted markets where we have a superior level of expertise. Our marketing is very target specific. We market within our four key markets. We also find niche markets where our technologies can provide effective solutions to the customer. Some of our marketing activities include:
|
|
·
|
Trade Shows
|
|
|
·
|
Mailers
|
|
|
·
|
Direct sales calls
|
|
|
·
|
Web promotions
|
|
|
·
|
Seminars
|
|
|
·
|
Collaborations with manufacturers
|
6
|
|
·
|
Collaborations with consultants and architects
|
We also collaborate with providers of complementary technologies and products who are not competitive with us. For example, there is a convergence of IT services and the security industry. We are evaluating the possibility of partnering with an IT services provider in order to provide our existing and potential customers with an expanded scope of services. We are also doing the same within the building automation industry as we see a convergence of building automation technologies and services with the security industry.
We are evaluating several opportunities to expand our operations via joint ventures and partnerships with regional and international companies that can provide us with additional expertise and an expanded presence. In addition we are evaluating the possibility of acquiring similar businesses and expanding our operations.
Customers
We provide our products and services to customers in four markets:
|
|
·
|
Government
|
|
|
·
|
Healthcare
|
|
|
·
|
Education
|
|
|
·
|
Retail
|
We also provide our products and services to various other sectors including corporate facilities, mining, entertainment and the automobile industry through direct sales to end-users and through subcontracting agreements.
Backlog
Our backlog consists of written purchase orders and contract, we have received for product deliveries and engineering services that we expect to deliver or complete within 12 months. All of these orders and contracts are subject to cancellation at any time. As of December 31, 2010, our backlog was approximately $2,000,000.
Competition
The security industry is highly fragmented and competitive. We compete with a number of different companies regionally and nationally. We have various different types of competitors including consultants, integrators, and engineering and design firms. Our main competitors include Siemens, ADT, Simplex, Intercon and Diebold. Our competitors also include equipment manufacturers and vendors that provide security services. Some of our competitors have greater name recognition and financial resources than we do. However, we believe that we have a well-respected name and are known for our quality work and technical expertise. We may face future competition from potential new entrants into the security industry and increased competition from existing competitors that may attempt to develop the ability to offer the full range of services offered by us. We cannot assure that we will be able to compete successfully in the future against existing or potential competitors.
Employees
As of December 31, 2010, Cancable has a staff of over 400 employees and A.C. Technical Systems has a staff of 47 employees.
None of our employees are covered by a collective bargaining agreement or represented by a labor union. We consider our relationship with our employees to be satisfactory.
The design and implementation of our equipment and the installation of our systems require substantial technical capabilities in many different disciplines from computer science to electronics with advanced hardware and software development. As a company, we encourage and provide training for new and existing technical personnel. In addition we conduct training courses and also send our technical persons to various technical courses offered by manufacturers of various products. We have various incentive programs for our employees to improve their skills within all departments. These include reimbursements for training fees and raises based on skill sets.
7
Broadband deployment and provisioning services
We operate through our subsidiaries Cancable Inc., XL Digital Services Inc. and Cancable, Inc. (together the “Cancable Group”), located in Canada and the United States to provide and deploy broadband services. Cancable Inc. and XL Digital Services Inc. were subsequent acquisitions. Cancable Group has re-branded its name to Dependable HomeTech in 2007.
Cancable Inc. is a growing Canadian based leader in providing and servicing broadband technologies to both residential and commercial markets. The Cancable service offering, network deployment, IT integration, and support services enable the cable television and telecommunications industries to deliver a high quality broadband experience to their customers. Cancable’s clients rely on Cancable’s knowledge and expertise to rapidly deploy the latest technologies to support advanced cable services, cable broadband Internet access and DSL. Services provisioned include new installations, reconnections, disconnections, service upgrades and downgrades, inbound technical call center sales and trouble resolution for cable Internet subscribers, and network servicing for broadband video, data, and voice services for residential, business, and commercial marketplaces.
Cancable has a long history as a field services organization. It has been successful in developing long-term relationships with its clients and is highly regarded in the industry for quality. This is evidenced by its status as the largest service provider to Rogers Cable Inc., Canada’s largest cable company and the exclusive supplier to Cogeco Cable Inc. in the Windsor, Ontario area. Cancable’s central appeal to its customers is its ability to deliver its quality services and at a cost which they cannot match internally.
XL Digital Services Inc. (“XL Digital”), incorporated in 2007, is a Canadian-based company provisioning the deployment and servicing of broadband technologies in the residential market for Canada’s largest cable television provider, Rogers Cable. XL Digital, with over 70 employees, provides its deployment and provisioning services for Rogers within two territories where the Company currently did not have a presence. The acquisition enables the Company to further expand its services into these two growing territories. XL Digital also brings the Company a number of years of significant management experience within the cable and telecommunications sector.
Senior Management
Cancable Group has a proven team with over 70 years of cable TV contracting/technical deployment and support experience.
Ross Jepson, President and CEO, joined Cancable in December, 2001 after many years of executive management experience in the cable industry most notably as President of Cablenet Canada, Managing Director of Videotron UK, Executive Vice President for Cableworks Communications and Chief Operating Officer of IT Canada. Ross has over 25 years of local, national and international management experience in Operations and Business Development.
Paul Mease, Senior Vice President, Field Services, originally joined the company in August 2005 and now has overall leadership of the Canadian and US field operations. Paul has extensive operational and contracting field services experience having held various senior positions within several large multi trade construction companies including Aecon Inc. and E.S. Fox. Ltd. He has spent almost his entire career within various aspects of field services including operations, procurement, support, fleet and asset management, acquisitions and strategic growth. Paul has both a P. Eng and a MBA.
Cheryl Lewis, Vice-President, Dependable HomeTech Services, leads the Operational and Business Development for Dependable HomeTech's call centre division. Prior to joining Cancable in 1997, Cheryl spent 10 years in the Hospitality industry, gaining a wealth of knowledge in Sales and Customer Service. Throughout her career with Dependable HomeTech she has been involved in the operations of our field services team as well as Customer Service for both Ontario and US Operations. She is currently also responsible for company growth initiatives.
8
Catherine Lewis, P. Eng., MBA, CMA, Chief Financial Officer, joined Cancable in March 2009 and brings over 20 years of accounting and finance experience. She has held senior finance roles in the IT, telecom and technology sectors encompassing the full spectrum of service, product and manufacturing. Companies included CompuCom/CCSI, Telus, AT&T Canada and Nortel. Ms. Lewis is responsible for finance and accounting functions for Cancable.
Cancable believes that there is a large and growing market for its services and the demand for its services are growing as:
|
|
·
|
The increase in popularity of the Internet and in the complexity of Internet sites has increased demand for high-speed Internet access from both residential and commercial consumers;
|
|
|
·
|
Technological advances, including the shift from an analog to a digital network environment and the ability to leverage existing network infrastructure to deploy high-speed services such as IP networking technologies, have accelerated the availability of advanced services such as digital video and high-speed Internet access;
|
|
|
·
|
Cable and telecommunications service providers have made significant investments to build and upgrade their wired and wireless networks, creating a substantial opportunity to deliver advanced services to commercial and residential consumers;
|
|
|
·
|
End-users increasingly demand access to integrated video, voice and data services, advanced set top boxes, high-speed digital modems, telephone lines, voice mail, computer networks, video conferencing and other technologies. Cancable’s clients must rapidly deploy these technologies in order to maximize their revenue per end-user, realize a return on their investments and maintain or gain competitive advantages; and
|
|
|
·
|
The availability of multiple choices for end-users to receive advanced services has led broadband service providers to focus increasingly on end-user satisfaction to control turnover and to rely on technology enabling companies for some of their non-core activities, such as installation, integration, fulfillment, maintenance, warranty and support services.
|
Key Client Relationships
Cancable has three main customer relationships, Rogers Cable Inc., Time Warner Entertainment, and Cogeco Cable. Rogers Cable Inc. is the most significant.
Rogers Cable Inc.
Rogers Cable Inc. is Cancable Group’s largest customer employing more than 280 of our field technicians as of December 2010. In addition to its in-house capability, Rogers currently utilizes eight contractors to manage its cable TV activity. This number is down from 22 contractors three years ago. Over the past two years, as a result of the vendor consolidation and its top rated performance, Cancable Group has emerged as Rogers’ primary contractor in Ontario with more than a 25% share of completed work orders.
The Contract Field Technical Support Industry
Overview
In 2004, the cable television industry in Canada served 9.3 million homes of which 2.3 million were subscribers to digital cable. While direct to home satellite service providers have penetrated the video market, cable operators continue to maintain an overall 77% market share.
A significant development for both cable and telecom companies has been the acceptance of the internet as a mass medium for commerce and communications involving both residential and commercial consumers. A recent report stated that, as of 2004, 44% of Canadian homes were connected to high-speed Internet services. Approximately 2.3 million homes connect via cable while 1.9 million connect via telco providers.
At present, Cancable’s management believes that there are approximately 25 providers of contract field technical support serving the Ontario cable television market. Management also believes that this number will be markedly reduced in the near future as evidenced by the vendor consolidation initiative recently completed by Rogers. Management believes that its cable television clients who operate in multiple geographic markets will prefer to align themselves with larger technology enablers, like Cancable, who are able to deploy consistent service on a wider scale and have the expertise and resources to deploy and maintain increasingly complex technologies.
9
Accordingly, management believes that its target market presents substantial growth opportunities due to:
|
|
·
|
the increasingly competitive landscape in the areas of video, internet and telecom delivery, which are requiring cable operators to increase their commitment to quality customer service and strict quality standards;
|
|
|
·
|
a drive for cost reductions on the part of the cable operators, caused by price competition due to “bundling” strategies by them and their competitors;
|
|
|
·
|
the increasing demand by residential and commercial consumers for advanced broadband services such as high-speed internet access, digital video and telephone;
|
|
|
·
|
the need to satisfy the demand for emerging broadband communications technologies such as web-based video conferencing;
|
|
|
·
|
virtual private networks, which are networks run over the internet that provide privacy to the network users;
|
|
|
·
|
Voice-Over-IP (VOIP), which will allow simultaneous two-way voice communication with high-speed data transmission over broadband; and
|
|
|
·
|
the availability of multiple choices for consumers to receive these advanced services, which has led to intensifying competition for subscribers and an increased focus among BSPs on consumer satisfaction, and the need for BSPs to rapidly deploy technology and equipment capable of delivering advanced services to residential and commercial consumers to realize a return on the significant investments they have made to build and upgrade their networks.
|
Over the next three years Cancable’s management expects to see its industry change significantly for the following reasons:
Increasing Technological Complexity
Each of Cancable’s target market segments is experiencing rapid changes in technology. The convergence of previously separate technologies has produced newer, more complex technologies, such as bundled video, voice and data services. Delivering these services requires more highly trained technicians, cross-trained in several technologies, to provide installation, integration, fulfillment, and long-term maintenance and support services than in the past. For example:
|
|
·
|
Cable Internet access. High-speed internet access requires that cable system operators provide initial installation and testing as well as on-going maintenance and support of new technologies, such as cable modems and network cards.
|
|
|
·
|
VOIP. Cable operators are already in the process of utilizing their networks for the provision of local telephone. This area represents a potentially significant source of incremental activity for Cancable.
|
|
|
·
|
Convergence of video and telecom services. Increasingly, traditional telecom carriers are entering the field of entertainment and data delivery, either through strategic investments in alternate technologies (see Direct Broadcast Satellite below) or through the adaptation of the existing telecom infrastructure.
|
|
|
·
|
Direct to home Satellite. Programming services require installation of a satellite receiving antenna or dish and a digital receiver at the consumer premises. In order to facilitate high-speed internet access, additional coordination is required between the satellite technologies and the standard telephone line modem connections that handle outbound communications from the consumer. Although certain DTH equipment may be installed by the consumer, there is a growing trend toward professional installation of satellite equipment.
|
|
|
·
|
Premise networking. Premise networking requires installation, certification and maintenance of high-speed data networks, including LANs/WANs, client/server networks, and video, audio and security networks meeting stringent industry requirements. Substantial resources must be committed to train and retain field technicians in the new technologies. Cancable believes that these increasing knowledge and training requirements present a significant competitive advantage for larger, well-capitalized enabling companies, and provide additional motivation for BSPs to rely on independent technology enablers thereby avoiding costly investments in internal service and fulfillment infrastructures.
|
10
Increased Reliance by BSPs on outsourcing
Technological advances and deregulation in the cable, telecommunications, satellite wireless and premise networking industries have provided residential and commercial consumers with multiple choices for receiving advanced services. The escalating competition for end-users has increased competitive pressures on BSPs, which is requiring them to focus more on consumer satisfaction. The providers' need to rapidly upgrade and expand existing systems, as a result of increased competition and growing demand for advanced services, should lead to a continued increase in the level of reliance on independent technology enablers for non-core activities, such as installation, integration, fulfillment, and long-term maintenance, warranty and support services. Management anticipates that BSPs will increase their reliance on independent technology enablers like Cancable to the extent that the enablers provide services that are of a higher quality and more cost efficient than existing, in-house infrastructure, in the same way that providers historically have relied on outside sources for other ancillary functions, such as design and manufacture of consumer premise equipment. Many emerging BSPs, such as DSL and DTH providers, often enter new markets where they have little or no local presence and limited resources to meet the growing demand for their advanced video, voice and data services. These providers typically have no in-house service infrastructure. Cancable believes these BSPs will continue to rely on independent technology enablers to meet their installation and maintenance needs. Cancable believes there will be an increased need for higher value-added services as the broadband industry continues to evolve and recurring upgrades and value-added improvements become more significant. Historically, large corporations with internal information technology departments have been primary users for such applications. However, the rapidly growing demand for such applications from small to medium-sized businesses and residential end-users, which do not have internal deployment and maintenance capabilities, presents additional growth opportunities for independent technology enablers like Cancable.
Emergence of Preferred Providers of Technology Enabling Services
Cancable believes that because of the increasing geographic scope of and complexity of technology deployed by BSPs, there is a growing trend towards long-term, strategic alliances with technology enabling companies, in contrast to the historic, contractual project-by-project arrangements. Cancable believes that its industry is highly fragmented and characterized by smaller, privately held companies that offer a limited range of industry-specific services to a small number of clients in concentrated geographic areas. In Cancable’s experience, BSPs in its target markets who rely on technology enabling companies prefer to align themselves with larger, better capitalized companies that:
|
|
·
|
have the expertise and resources to deploy and maintain increasingly complex technologies over large networks;
|
|
|
·
|
consistently deliver high quality service;
|
|
|
·
|
provide regional coverage and have the capacity to work on multiple projects simultaneously; and
|
|
|
·
|
have the ability and willingness to invest in infrastructure to enhance the deployment and maintenance of the advanced technologies demanded by residential and commercial customers.
|
Industry Trends Specific to the Contract Field Technical Support Industry
|
|
·
|
Competition at the client level. Some of Cancable’s customers are in a monopolistic industrial environment. Today, these customers are faced with increasing competition which is forcing them to adapt the new reality. Part of this adaptation includes taking an in-depth review of their internal cost structure to determine which services must be performed by employees and which should be contracted out, at lower cost.
|
|
|
·
|
Consolidation at the client level. The cable television industry in particular has been undergoing a trend towards consolidation for many years. This trend has resulted in changes in the manner in which services are contracted for and has changed the relationship between client and service provider. Relationships today are driven less by personal contacts and more by professional qualifications. Also important to industry relationships today are the service provider’s ability to provide a service level that is uniform across its work force and to integrate its management and reporting systems with those of the client.
|
11
|
|
·
|
Trend towards contracting out. The above two drivers are causing cable television and telecommunications service providers to move increasingly towards contracting out services that are perceived to be non-core but are manageable through sophisticated systems and a high level of integration between their own internal systems and those of the support provider. While not a current client of Cancable, Bell Canada is leading the trend in this area with almost all of its field service activities contracted out. Cancable believes that its two largest clients, Rogers Cable and Cogeco Cable, contract out approximately two-thirds of their field installation and service call work. Cancable expects that this percentage will continue to increase and that the outsourcing trend will spread to these clients’ other field activities that are currently not outsourced.
|
|
|
·
|
Consolidation among service providers. As an adjunct to consolidation at the client level, larger clients want to increase efficiency by reducing the number of vendors in each area. This trend tends to favor those service providers that are able to scale up to the demands of increased volumes and are able to meet the system integration requirements of the client.
|
12
|
ITEM 1A.
|
RISK FACTORS
|
Described below are the material risks that we face. Our business, operating results or financial condition could be materially adversely affected by, and the trading price of our common stock could decline due to, any of these risks.
Competitive pressure from larger firms
The security industry is highly competitive. We compete with a number of large international firms, which have more extensive resources than we do. In addition, these competitors may have greater brand recognition, proprietary technologies and superior purchasing power as well as other competitive advantages.
Risks associated with budget constraints and cut back of customer spending:
We are dependent on large institutional and commercial customers and their budgets. If there are cut backs in budgets by its customers it will adversely impact our revenues.
Risks associated with possible delays of construction schedules
We have contracted to provide security systems to a number of new buildings. Delays in construction of these buildings could potentially delay revenues being realized.
Supplier product failures
We do not currently manufacture our own products and must purchase products from others. It could adversely impact our relationships with our customers if there are delays in receiving products from suppliers or if there are defects in these products.
Contracts with government agencies may not be renewed or funded
Contracts with government agencies accounts for some of our revenues. Many of these contracts are subject to annual review and renewal by the agencies and may be terminated at any time or on short notice. Each government contract is only valid if the agency appropriates enough funds for such contracts. Accordingly, we might fail to derive any revenue from sales to government agencies under a contract in any given future period. In addition, if government agencies fail to renew or terminate any of these contracts, it would adversely affect our business and results of operations.
We have a small number of customers from which we receive a large portion of our sales. Our experience has been that some of these substantial customers will be a source of significant sales in the succeeding year and some will not. Consequently, we are often required to replace one customer with one or more other customers in order to generate the same amount of sales. There can be no assurance that we will continue to be able to do so.
Key personnel losses
Competition for highly qualified technical personnel is intense and we may not be successful in attracting and retaining the necessary personnel, which would limit the rate at which we can develop products and generate sales. In particular, the departure of any of our senior management members or other key personnel could harm our business.
13
Intellectual property protection risks
Our intellectual property might not be protected. No new intellectual property has been acquired within the last three years. Despite our precautions, it may be possible for unauthorized third parties to copy our products or obtain and use information that we regard as proprietary to create products that compete against ours. If we fail to protect and preserve our intellectual property, we may lose an important competitive advantage. In addition, we may from time to time be served with claims from third parties asserting that our products or technologies infringe their intellectual property rights. If, as a result of any claims, we were precluded from using technologies or intellectual property rights, licenses to the disputed third-party technology or intellectual property rights might not be available on reasonable commercial terms, or at all. We may initiate claims or litigation against third parties for infringement of our proprietary rights or to establish the validity of our proprietary rights. Litigation, either as plaintiff or defendant, could result in significant expenses or divert the efforts of our technical and management personnel from productive tasks, whether or not the litigation is resolved in our favor. A successful claim against us, coupled with our failure to develop or license a substitute technology, could cause our business, financial condition and results of operations to be adversely affected.
We may not be able to increase our bonding
Many of our government contracts require that we obtain bonding. We may not be able to increase our bonding and, therefore, we may not be able to pursue larger projects as a primary contractor.
Fluctuation in quarterly results
Our quarterly results have varied over the past few years and will likely continue to do so. The results will vary based on the timing of the projects, construction schedules and customer budgets. Such fluctuations may contribute to volatility in the market price for our stock.
Lengthy sales cycle
The sale of our products and services frequently involves a significant commitment of resources to evaluate and propose a project. The approval process for our proposals usually involves multiple departments within our clients and may take several months. Accordingly, depending on the length of recording and processing time, a sale can take a prolonged period of time.
We may not be able to successfully make acquisitions or form partnerships as a means of fostering our growth
Our growth strategy involves successfully acquiring companies that will add value to our firm and also build partnerships with companies who can complement our core competencies. We may not be successful in identifying or consummating transactions with such companies.
Continued need for additional financing
To implement our growth plan, we may need additional financing. We will need additional financing upon, but not limited to, any of the following events:
|
|
·
|
Changes in operating plans
|
|
|
·
|
Lower than anticipated sales
|
|
|
·
|
Increased costs of expansion
|
|
|
·
|
Increase in competition relating to decrease in price
|
|
|
·
|
Increased operating costs
|
|
|
·
|
Potential acquisitions
|
Additional financing may not be available on commercially reasonable terms or may not be available at all.
Cancable Group, one of our major subsidiaries, relies on certain large clients for a significant portion of our revenues
Cancable Group currently derives a significant portion of its revenues from a limited number of clients. For the fiscal year ended December 31, 2010, Rogers Cable TV Limited accounted for approximately 68.5% of Cancable’s revenues. The services required by any one client can be limited by a number of factors, including industry consolidation, technological developments, economic slowdown and internal budget constraints. Cancable Group’s clients are not obligated to purchase additional services and most of Cancable’s contracts are cancelable on short notice. As a result of these factors, the volume of work performed for specific clients is likely to vary from period to period and a major client in one period may not use Cancable’s services to the same degree in a subsequent period. A temporary or permanent loss of any of Cancable’s key clients could seriously harm its business. If any cancelled contracts were not replaced with contracts from other clients, Cancable’s revenues might decrease and its profitability could be adversely affected.
14
Cancable will be adversely affected by a decline in the growth of the cable and telecom industries
The broadband communications industry has experienced a high rate of growth. If the rate of growth slows, and broadband service providers reduce their capital investments in upgrades or expansion of their systems, Cancable’s clients may not require the same volume of services from Cancable and it may not be able to execute its growth strategy. In that case, Cancable’s profitability and its prospects could be adversely affected.
Our clients may not rely on the Contract Field Technical Support services we provide
Cancable’s success is dependent on the continued reliance by BSPs on independent companies like Cancable for performance of their installation, integration, fulfillment, and long- term maintenance and support services. If these providers elect to perform these services themselves, Cancable’s revenues may decline and its business could be harmed.
Consolidation of broadband service providers could result in fewer and smaller customers for us
The cable, telecommunications, satellite and wireless industries could experience significant consolidation activity. In addition, the consolidation of Cancable’s clients could have the effect of reducing the number of its current or potential clients, which could result in Cancable’s dependence on a smaller number of clients.
Cancable may face reduced customer demand due to new technologies
Cancable’s industry is subject to rapid changes in technology. Existing technologies for transmission of video, voice and data are subject to potential displacement by various new technologies. New technologies may be developed that allow broadband service providers to deliver their services to consumers without a significant upgrade of their existing systems. Furthermore, new technologies may be developed that enable consumers to perform more easily their own installation and maintenance of the equipment required for the delivery of these services at their premises. Cancable will need to be able to enhance its current service offerings to keep pace with technological developments and to address increasingly sophisticated client needs. Cancable may not be successful in developing and marketing service offerings that respond to technological advances in a timely manner, and its services may not adequately or competitively address the needs of the changing marketplace. If Cancable is not successful in responding in a timely manner to technological changes, market conditions and industry developments, it may lose current clients or be unable to obtain new clients and its business, prospects, operating results and financial condition could suffer.
Cancable may not be able to compete on price with our competitors
Cancable’s industry is fragmented and highly competitive. Accordingly, it cannot be assured of being able to maintain or enhance its competitive position. Historically, there have been relatively few barriers to entry into the markets in which Cancable operates. As a result, any organization that has adequate financial resources and access to technical expertise may become one of our competitors. Competition in the industry depends on a number of factors, including price. Cancable’s competitors may have lower cost structures and may, therefore, be able to provide their services at lower rates than it can. Cancable also faces competition from the in-house service organizations of its existing or prospective clients, which often employ personnel who perform some of the same types of services as it does. If Cancable is unable to maintain or enhance its competitive position, its business, prospects, operating results and financial condition may suffer materially.
Cancable may face an inability to attract and retain qualified employees
Cancable’s ability to provide high-quality services on a timely basis requires that it employ an adequate number of field technicians. Accordingly, its ability to meet the demand for its services will be limited by Cancable’s ability to attract, train and retain skilled personnel. Cancable’s industry is characterized by highly competitive labor markets and, like many of its competitors, historically Cancable has experienced high rates of employee turnover. Furthermore, its labor expenses may increase as a result of a shortage in the supply of skilled personnel and its efforts to improve its employee retention, which could adversely impact its profitability. Cancable cannot be certain that it will be able to improve its employee retention rates or maintain an adequate skilled labor force necessary to operate efficiently and to support its growth strategy. Failure to do so could impair its ability to operate efficiently and maintain its reputation for high quality service. This could also impair Cancable’s ability to retain current clients and attract new clients that could cause its financial performance to decline.
15
Mismatch of Staffing Levels and Contract Requirements
Since Cancable’s business is driven by large, and sometimes multi-year contracts, Cancable forecasts its personnel needs for future projected business. If Cancable increases its staffing levels in anticipation of a project that is subsequently delayed, reduced or terminated, it may underutilize these additional personnel, which would increase its expenses and could harm its business.
Cancable relies on key senior employees and management
Cancable’s success is substantially dependent upon the retention of, and the continued performance by, its senior management and other key employees, including key employees of companies that it may acquire in the future. If any member of Cancable’s senior management team becomes unable or unwilling to participate in its business and operations and it is not able to replace them in a timely manner, its business could suffer. Cancable does not maintain "key man" life insurance policies on any member of its senior management or any of its key employees.
Cancable is a growing business and may require additional financing which may not be available to us
Cancable may require additional financing, including access to a bank operating line and lease financing for vehicles, to fully implement its business strategy in a timely manner. Cancable’s future requirements will depend on many factors, including continued progress in its client development and expansion programs. There can be no assurance that additional funding will be available or, if available, that it will be available on acceptable terms. If such funding is not available, Cancable may be forced to reduce or eliminate expenditures for further development of its proposed new initiatives and contemplated acquisitions. There can be no assurance that Cancable will be able raise additional capital if its capital resources are exhausted. Cancable’s ability to arrange such financing in the future will depend in part upon prevailing capital market conditions as well as its business performance. Failure to obtain such financing could delay implementation of Cancable’s strategy and could have a material adverse effect on its ability to successfully develop its business. Such financing, if available, could result in dilution to existing shareholders.
We have issued a substantial number of warrants and options and other convertible securities, which may cause the trading price of our securities to decline and may limit our ability to raise capital from other sources:
As of December 31, 2010, there were 15,212,983 shares of common stock issuable upon the exercise of warrants and 1,729,155 shares issuable upon the exercise of options. If all these warrants and options were exercised by the holders, this will result in a dilution in shareholders’ percentage holdings by approximately 30%. Included in the balance were 1,600,000 shares related to the Employee Stock Options (see Note 13 in the Financial Statements). Also, included in the balance, 15,012,983 shares of common stock issuable upon the exercise of warrants and 129,155 shares issuable upon the exercise of options issued to Laurus Master Fund, Ltd and its related entities, Erato Corporation, Valens Offshore Fund and Valens U.S. Fund, LLC and PSource Structured Debt Limited (“Laurus”). Additionally, there were 49 shares of common stock of Cancable issuable upon the exercise of options and 20 shares of common stock of Iview issuable upon the exercise of options to Laurus and its related entities. While these securities are outstanding, the holders will have the opportunity to profit from a rise in the price of our securities with a resulting dilution (upon exercise or conversion) in the value of the interests of our other security holders. Our ability to obtain additional financing during the period these convertible securities are outstanding may be adversely affected and their existence may have a negative effect on the price of our securities. We may be obligated to issue additional shares in payment of accrued interest on our term notes as a result of adjustments to the conversion or exercise prices of our convertible securities. Additional shares of our common stock may be issued if additional amounts are funded under our existing financing arrangements with Laurus or if we obtain additional financings in the future. The happening of certain events such as stock splits, reverse stock splits, stock dividends or conversion price would trigger an adjustment in the exercise or conversion price (as applicable). The adjustment would be based upon a weighted average formula in the case of below exercise or conversion price issuances. The adjustment will depend on the number of shares issued and the difference between the issuance price and the then effective exercise or conversion price. Since no such transactions are currently contemplated, it is not presently possible to quantify possible future adjustments. The holders of these securities are likely to exercise them at a time when we would, in all likelihood, be able to obtain any needed capital by a new offering of securities on terms more favorable to us than those of the outstanding warrants and options.
16
Because our directors own approximately 76% of our outstanding common shares, they could make and control corporate decisions that may be disadvantageous to minority shareholders
Our directors own approximately 76.0% of the outstanding common shares. Accordingly, they will have a significant influence in determining the outcome of all corporate transactions or other matters, including mergers, consolidations and the sale of all or substantially all of our assets, and also the power to prevent or cause a change in control. The interests of our directors may differ from the interests of the other shareholders and thus result in corporate decisions that are disadvantageous to other shareholders.
Exchange rate fluctuations may have adverse effects on our revenues
A significant portion of our revenues and expenses are denominated in Canadian dollars. As a result, we will be exposed to currency exchange rate risk. Our reported earnings could fluctuate materially as a result of foreign exchange rate fluctuations.
Our substantial debt could adversely affect our financial position
Our substantial indebtedness could have important consequences to you. Our annual debt service requirements related to payments of principal on the net balance of our term notes ($16,551,128 at December 31, 2010) are $14,051,128 and $2,500,000 in 2011 and 2013 respectively. In addition, interest on the notes is payable on a monthly basis. We also have a series of other notes payable totaling $1,500,000 as of December 31, 2010. The $1,500,000 promissory note included in other notes payable, which were issued by Creative Vistas Acquisition to The Burns Trust and The Navaratnam Trust in connection with the acquisition of AC Technical, have no fixed term of repayment. The note payable was transferred to Malar Trust during Fiscal Year 2006 with the same payment term. The term notes are secured by substantially all of our assets. Interest on term notes are settled in cash. We do not currently have the ability to repay the notes in the event of a demand by the holder; accordingly, in the event we are unable to generate sufficient cash flow from our operations, we may face difficulties in servicing our substantial debt load. In such event, we could be forced to seek protection from our creditors, which could cause the liquidation of the Company in order to repay the secured debt. In any liquidation of us, the holders of our debt (including The Malar Trust), and in all likelihood our unsecured creditors would be required to be paid in full before any payments could be made to the holders of our common stock. In addition, our outstanding indebtedness could limit our ability to obtain any additional financing.
There is no active trading market in our securities
Effective February 23, 2011, our common stock became ineligible for quotation on the OTC Bulletin Board due to quoting inactivity pursuant to Rule 15c2-11 under the Securities Exchange Act of 1934, as amended. The Company’s common stock has been moved to OTC Link, which is operated by OTC Markets Group Inc. (formerly known as Pink OTC Markets Inc. or “Pink Sheets”). OTC Link is an electronic quotation system that displays quotes from broker dealers for many over-the-counter securities. Although, our common stock is quoted on OTC Link, there is no active trading in the stock. A trading market may not develop and stockholders may not be able to liquidate their investment without considerable delay. If a market should develop, the price of our stock may be highly volatile.
Penny Stock regulations apply to our securities:
Our securities are subject to the “penny” stock regulation of Rule 15g-9 of the Securities Exchange Act of 1934. Rule 15g-9 of the Exchange Act is commonly referred to as the “penny stock” rule and imposes special sales practice requirements upon broker-dealers who sell such securities to persons other than established customers or accredited investors. A penny stock is any equity security with a market price less than $5.00 per share, subject to certain exceptions. Rule 3a51-1 of the Exchange Act provides that any equity security is considered a penny stock unless that security is: registered and traded on a national securities exchange and meets specified criteria set forth by the SEC; authorized for quotation in the National Association of Securities Dealers’ Automated Quotation System; issued by a registered investment company; issued with a price of five dollars or more; or issued by an issuer with net tangible assets in excess of $2,000,000. This rule may affect the ability of broker-dealers to sell our securities.
17
For transactions covered by Rule 15g-9, a broker-dealer must furnish to all investors in penny stocks a risk disclosure document, make a special suitability determination of the purchaser, and receive the purchaser’s written agreement to the transaction prior to the sale. In order to approve a person’s account for transactions in penny stocks, the broker-dealer must (i) obtain information concerning the person’s financial situation, investment experience, and investment objectives; (ii) reasonably determine, based on that information that transactions in penny stocks are suitable for the person and that the person has sufficient knowledge and experience in financial matters to reasonably be expected to evaluate the transactions in penny stocks; and (iii) deliver to the person a written statement setting forth the basis on which the broker-dealer made the determination of suitability stating that it is unlawful to effect a transaction in a designated security subject to the provisions of Rule 15g-9(a)(2) unless the broker-dealer has received a written agreement from the person prior to the transaction. Such written statement from the broker-dealer must also set forth, in highlighted format immediately preceding the customer signature line, that the broker-dealer is required to provide the person with the written statement and the person should sign and return the written statement to the broker-dealer only if it accurately reflects the person’s financial situation, investment experience and investment objectives.
Losing our status as a Canadian Controlled Private Corporation could adversely affect our financial position:
A Canadian Controlled Private Corporation (“CCPC”) is a corporation that is not controlled by a non-Canadian entity. If, in the future, more than 50% of the voting shares of AC Technical are owned by a non-Canadian entity, such as by Laurus exercising its rights under the Share Pledge Agreement, we would lose our status as a CCPC. Unless a company is a CCPC, it is not eligible for certain Canadian research and development tax credits. As a non-CCPC, the maximum Canadian research and development tax credits are 20% (for both Federal and Provincial Canadian taxes) of total eligible research and development expenditures. AC Technical is presently entitled to claim the maximum credits available to CCPCs of 41.5% (for both Federal and Provincial Canadian taxes) of the total eligible expenditures. During Fiscal Year 2010, this extra 21.5% totaled approximately $200,000.
Available Information
We file annual, quarterly and current reports, proxy statements and other information with the U.S. Securities and Exchange Commission ("SEC"). Copies of this Annual Report on Form 10-K and each of our other periodic and current reports, and amendments to all such reports, that we file or furnish pursuant to Section 13(a) or 15(d) of the Securities Exchange Act of 1934 are available free of charge on our website (http://www.creativevistasinc.com/) as soon as reasonably practicable after the material is electronically filed with, or furnished to, the SEC. The information contained on our website is not incorporated by reference into this Annual Report on Form 10-K and should not be considered part of this Annual Report on Form 10-K.
In addition, you may read and copy any document we file with the SEC at the SEC's Public Reference Room at 100 F Street, N.E., Washington, D.C. 20549. Please call the SEC at 1-800-SEC-0330 for further information on the operation of the Public Reference Room. Our SEC filings are also available to the public at the SEC's web site at http://www.sec.gov, which contains reports, proxy and information statements, and other information regarding issuers that file electronically with the SEC.
|
ITEM 1B.
|
UNRESOLVED STAFF COMMENTS
|
Not applicable – None.
|
ITEM 2.
|
PROPERTIES
|
Our office is located at 2100 Forbes Street, Units 8-10, Whitby, Ontario, Canada L1N 9T3. The premises, which were purchased in 2002, consist of approximately 5,900 square feet on the ground floor and 2,200 square feet on the second floor. Additionally, we have another major office location at 2321 Fairview St. Burlington, Ontario L7R 2E3 which services the Cancable Group. The premises, which were rented in 2003, consist of approximately 7,600 square feet. We believe that these offices are adequate for our present purposes and planned expansion. Furthermore, we believe these offices are in good condition and adequately covered by insurance.
|
ITEM 3.
|
LEGAL PROCEEDINGS
|
By Notice of Application issued in the Federal Court of Appeal on September 17, 2010 by our Subsidiary, XL Digital Services Inc. ("XL Digital"), as applicant against Communications, Energy and Paperworkers Union of Canada ("CEP") as respondent, XL Digital has applied to the Federal Court of Appeal for judicial review of the decision of the Canada Industrial Relations Board (the "Board") dated August 23, 2010 wherein the Board concluded that it had jurisdiction over XL Digital, and found CEP to be a trade union within the meaning of the Canada Labour Code, and certified CEP to be the bargaining agent for all employees of XL Digital working in and out of its London, Ontario office.
The application for judicial review will be heard by the Federal Court of Appeal on Wednesday, May 18, 2011.
If the application for judicial review is successful then costs of the application will likely be awarded in favour of XL Digital.
If the application for judicial review is dismissed by the Court then costs of the application will likely be awarded in favour of CEP against XL Digital.
|
ITEM 4.
|
[Removed and Reserved]
|
18
PART II
ITEM 5. MARKET FOR THE REGISTRANT'S COMMON EQUITY, RELATED STOCKHOLDER MATTERS AND ISSUER PURCHASES OF EQUITY SECURITIES
Our common stock is quoted at the present time on the Pink Sheets website (www.pinksheets.com) under the symbol “CVAS” (prior to February 23, 2011, our common stock was quoted on the OTC Bulletin Board).The security is subject to Section 15(g) and Rule 15g-9 of the Securities Exchange Act of 1934, commonly referred to as the penny stock rule. See “Risk Factors—Penny Stock.” The following table shows the range of bid prices per share of common stock on the OTC Bulletin Board, as reported by Pink Sheets LLC, for the periods indicated. These quotations represent prices between dealers, do not include retail mark-ups, mark-downs or commissions, and do not necessarily represent actual transactions.
|
Quarter ended:
|
Low Bid Price
|
High Bid Price
|
||||||
|
March 31, 2009
|
$ | 0.08 | $ | 0.30 | ||||
|
June 30, 2009
|
$ | 0.08 | $ | 0.16 | ||||
|
September 30, 2009
|
$ | 0.08 | $ | 0.20 | ||||
|
December 31, 2009
|
$ | 0.06 | $ | 0.18 | ||||
|
March 31, 2010
|
$ | 0.07 | $ | 0.11 | ||||
|
June 30, 2010
|
$ | 0.07 | $ | 0.09 | ||||
|
September 30, 2010
|
$ | 0.07 | $ | 0.01 | ||||
|
December 31, 2010
|
$ | 0.00 | $ | 0.00 | ||||
Our securities may not qualify for listing on Nasdaq or any other national exchange. Even if our securities do qualify for listing, we may not be able to maintain the criteria necessary to ensure continued listing. Our failure to qualify our securities or to meet the relevant maintenance criteria after such qualification may result in the discontinuance of the inclusion of our securities on a national exchange. In such event, trading, if any, in our securities may then continue in the non-Nasdaq, over-the-counter market so long as we continue to file periodic reports with the SEC and there remain sufficient qualified market makers in our securities. As a result, a stockholder may find it more difficult to dispose of, or to obtain accurate quotations as to the market value of, our securities.
As of March 14, 2011 there were 264 holders of our Common Stock. We have 37,488,714 outstanding shares of Common Stock.
Our agreements with Laurus prohibit us from declaring or paying any dividends on our Common Stock.
For information regarding securities authorized for issuance under equity compensation plans (pursuant to Item 201(d) of Regulation S-K), please see the information provided under Item 12 of this Form, Security Ownership of Certain Beneficial Owners and Management and Related Stockholder Matters.
|
ITEM 6.
|
SELECTED FINANCIAL DATA
|
Not applicable.
ITEM 7. MANAGEMENT’S DISCUSSION AND ANALYSIS OF FINANCIAL CONDITION AND RESULTS OF OPERATIONS
The following discussion of the financial condition and results of operations should be read in conjunction with the consolidated financial statements and related notes thereto. The following discussion contains certain forward-looking statements that involve risks and uncertainties. Our actual results could differ materially from those discussed therein. Factors that could cause or contribute to such differences include, but are not limited to, risks and uncertainties related to the need for additional funds, the rapid growth of the operations and our ability to operate profitably a number of new projects. Except as required by law, we do not intend to publicly release the results of any revisions to those forward-looking statements that may be made to reflect any future events or circumstances.
19
Results of Operations
Comparison of Year Ended December 31, 2010 to Year Ended December 31, 2009
Revenue: Sales were $39,866,500 for the year ended December 31, 2010, compared to $39,768,800 in 2009, representing an increase of 0.2%. The increase in revenue was mainly due to the increase in the service revenue of Cancable Segment to $32,715,300 for Fiscal Year 2010 from $32,380,000 for Fiscal Year 2009.
(a) Cancable Segment – This segment includes Cancable Inc., Cancable, Inc., XL Digital and 2141306 Ontario Inc. (collectively, the “Cancable Group”). The principal activity is provisioning the deployment and servicing of broadband technologies in both residential and commercial markets. The Cancable Group’s service offering, network deployment, IT integration, and support services, enable the cable television and telecommunications industries to deliver a high quality broadband experience to their customers. The total revenue from the Cancable segment was $32,715,300 in 2010 as compared to $32,380,000 in 2009. The increase in revenue was primarily the result of an increase in revenue generated from our customer Rogers Cable Inc. The growth in revenue was offset by the decline in revenue in the United States. Rogers Cable Inc. is Cancable Group’s largest customer and the revenue from this customer for Fiscal Year 2010 was $22,406,500 or 68.5% of total Cancable revenue compared to $18,759,800 or 57.9% for Fiscal Year 2009. Last year revenue was lower mainly due to the exchange rate fluctuations as well as the weakened economy. Total revenue generated in the United States for the year ended December 31, 2010 was $5,790,500 compared to $6,936,400 for the year ended December 31, 2009. The decline in revenue was mainly due to the decrease in revenue generated from one of our customers to $1,811,700 for the year ended December 31, 2010 compared to $3,050,200 for the year ended December 31, 2009. (b) AC Technical segment - Total revenue of AC Technical segment was $7,090,100 for the year ended December 31, 2010 compared to $7,145,800 in 2009, with no material fluctuation. All revenue generated from AC Technical Segment was in Canadian dollars. Contract revenue was $5,626,300 for Fiscal Year 2010 compared to $5,812,700 for Fiscal Year 2009. The service revenue was $1,463,800 for the year ended December 31, 2010, compared to $1,333,100 in 2009.
Direct Expenses (excluding depreciation): Direct expenses were $29,431,200 or 73.8% of revenues for the year ended December 31, 2010, compared to $29,913,900 or 75.2% of revenues for the same period in 2009. The year-over-year decrease in direct expenses was mainly due to the cost reduction program introduced in2010.
(a) Cancable segment – Direct expenses of this segment were $25,501,600 for the year ended December 31, 2010, compared to $26,206,900 in 2009. The direct expenses in 2010 comprised principally of labor expenses $19,914,000, vehicle expenses $2,251,400 and material cost $1,560,400. The direct expenses in 2009 comprised principally of labor expenses $20,256,900, vehicle expenses $1,998,700 and material cost $1,850,300. The direct expenses in 2009 were higher which was driven predominantly by the initial training and set up cost of developing the business.
(b) AC Technical segment – Direct expenses of this segment were $3,840,700 in 2010, compared to $3,618,000 in 2009. The material cost was $2,300,500 or 32.4% of the AC Technical revenue for the year ended December 31, 2010 compared to $2,198,500 or 30.8% of revenues in the same period of fiscal 2009. Labor and subcontractor cost increased to $1,484,500 or 20.9% of AC Technical revenues for Fiscal Year 2010 compared to $1,355,100 or 18.9% of AC Technical revenues for fiscal 2009. The increase in direct expenses was mainly due to more labor and material required in connection with the increased contract revenue.
20
Project cost: Project cost was decreased to $983,300 or 2.5% of revenue for the year ended December 31, 2010, compared to $894,400 or 2.2% for the same period in 2009. Project cost was mainly related to the AC Technical segment. The balance mainly includes the salaries and benefits of indirect staff amounting to $620,800 in Fiscal Year 2010 compared to $589,800 for Fiscal Year 2009. The increase was mostly due to the increase in the number of indirect staff. Automobile and travel expenses increased to $275,400 for Fiscal Year 2010 compared to $215,500 for Fiscal Year 2009 due to more travel by our staff this year.
Selling expense: Selling expense was $911,500 or 2.3% of revenues for the year ended December 31, 2010 compared to $905,600 or 2.3% of revenues for the same period in 2009. Selling expenses were mainly related to AC Technical segment. Salaries and commission to salespersons for Fiscal Year 2010 was $396,300 compared to $432,900 for Fiscal Year 2009. The decrease was mainly due to the decrease in revenue on which commissions are based. The advertising and promotion and trade show expenses were $159,200 in Fiscal Year 2010 compared to $134,800 for Fiscal Year 2009.
General and administrative expenses: General and administrative expenses were $4,746,140 or 11.9% of revenues for the year ended December 31, 2010 compared to $5,571,000 or 14.0% for the same period in 2009. The balance for Fiscal Year 2010 is mainly comprised of $610,600 of professional fees related to preparation of the quarterly reports and other corporate matters compared to $473,800 for the same period in 2009. In addition, investor relations expenses amounted to $50,000 for Fiscal Year 2010 compared to $150,000 for Fiscal Year 2009. Total salaries and benefits to administrative staff were $2,149,300 for Fiscal Year 2010 compared to $2,242,600 for Fiscal Year 2009. The year-over-year decrease in general and administration expenses primarily reflected a focused cost reduction program across the Company.
Depreciation: Total depreciation of property plant and equipment was $2,225,600 for the year ended December 31, 2010 compared to $2,643,100 for the same period in 2009. The decrease in balance was primarily due to the disposal of capital assets incurred in 2009 in the amount of $300,000 and certain capital assets acquired in 2006 and 2007 was fully amortized during the year.
Amortization of Intangible Assets: Amortization of customer relationships and trade name was $231,200 for the year ended December 31, 2010, compared to $341,100 in 2009.
Interest and other Expenses: Interest and net other expenses for the year ended December 31, 2010 were $2,019,200 or 5.1% of revenues compared to net expenses of $1,098,800 or 2.8% of revenues for the same period in 2009. The balance for the current period is primarily comprised of the amortization of deferred charges amounting to $173,400 compared to $163,000 for Fiscal Year 2009. Additionally, net financing expenses decreased to $2,287,900 or 5.7% of revenues in 2010 compared to $2,382,800 or 6.0% of revenues for Fiscal Year 2009. The interest due with respect to the Company’s credit facility was $1,574,100 for the year ended December 31, 2010 compared to $1,488,400 for the same period in 2009. Additionally, the unrealized foreign currency translation gain was $442,100 in 2010, compared to foreign currency translation gain of $1,447,100 for Fiscal Year 2009. The change was related to the foreign currency translation of term notes which resulted because the Canadian dollar traded higher than the U.S. dollar as at December 31, 2010 as compared to the same period of 2009.
Income taxes: No income taxes were paid and/or owed during the year ended December 31, 2010 and 2009, which was mainly due to the Company’s losses carried forward to offset all income generated by the Company. Because of this and because we have fully reserved substantially all our deferred income tax assets, there was no provision and/or benefit for income taxes.
Net Income/Loss: Net loss for the year ended December 31, 2010 was $681,800 compared to net loss of $1,599,200 for the same period in 2009. The Company’s operating income was $1,337,400 for the year ended December 31, 2010 compared to operating loss of $500,400 for the year ended December 31, 2009. The year-over-year increase in operating income primarily reflected a focused cost reduction program across the Company and an increase in revenue.
21
Liquidity and Capital Resources
Since our inception, we have financed our operations through bank debt, loans and equity from our principals, loans from third parties and funds generated by our business. At December 31, 2010, we had $2,030,707 in cash. We believe that cash from operations and our credit facilities with Laurus will continue to be adequate to satisfy our ongoing working capital needs as we do not expect Laurus to demand acceleration of the loans extended to the Company. We do not currently have the ability to repay the notes in the event of a demand by the holder. Furthermore, we granted a security interest to Laurus and its related entities in substantially all of our assets and, accordingly, in the event of any default under our agreements with Laurus and its related entities, they could conceivably attempt to foreclose on our assets, which could cause us to terminate our operations. During Fiscal Year 2011, our primary objectives in managing liquidity and cash flows will be to ensure financial flexibility to support growth and entry into new markets and improve inventory management and to accelerate the collection of accounts receivable.
In addition, we have introduced cost cutting initiatives within the Administration, Project and Selling departments to improve efficiency and also to improve cash flow. We have also increased our rates for services provided by AC Technical to improve gross margins. This is in line with our competitors. Finally, we expect to realize additional benefits from our research and development efforts within the next 12 months as we start to introduce our own line of customized products to the industry. These products and technologies are expected to improve gross margins. We plan to seek additional capital in the future to fund operations, growth and expansion including through additional equity or debt financing or credit facilities. We have had early stage discussions with investors about potential investment in our company at a future date however no assurance can be made that such financing would be available, and if available that it would be on terms acceptable to us.
Net Cash Used in Operating Activities. Net cash used by operating activities amounted to $2,832,700 for Fiscal Year 2010. The changes in operating assets and liabilities resulted in net cash provided of $831,400, which included a $919,600 decrease in accounts receivable, a $131,600 decrease in inventory, a $42,000 decrease in prepaid expenses, a $370,300 increase in accounts payable, a $87,400 decrease in income taxes recoverable and a $21,100 decrease in deferred revenue.
Comparative balance sheet as at December 31, 2010 to December 31, 2009
Accounts Receivable
Our accounts receivable decreased to $3,039,700 as of December 31, 2010 from $4,292,100 as of December 31, 2009. Accounts receivable of Cancable as at December 31, 2010 was $1,909,800 compared to $2,959,800 as at December 31, 2009. The decrease was attributable to the timing of payment by our customers. Accounts receivable of the AC Technical segment was $1,207,800 as at December 31, 2010 compared to $1,269,200 as of December 31, 2009. The decrease was mostly due to the timing of payment by our customers.
Inventory
Inventory on hand on December 31, 2010 decreased to $692,900 compared to $789,000 as of December 31, 2009. Inventory of the AC Technical segment was $476,900 compared to $440,225 as of December 31, 2009. Inventory at the Cancable segment was decreased to $215,900 as at December 31, 2010 from $261,200 as at December 31, 2009. There was no material fluctuation of the balances.
Accounts Payable and Accrued Liabilities
Accounts payable and accrued liabilities decreased to $3,990,900 as of December 31, 2010 compared to $4,555,300 as of December 31, 2009. The balance for the AC Technical segment was $1,096,400 as of December 31, 2010 compared to $1,146,300 as of December 31, 2009. Accounts payable for Cancable Group was $2,242,300 as at December 31, 2010 compared to $3,029,000 as at December 31, 2009. The decrease in the balance was mainly due to the decrease in purchases of material in the last three months and the timing of payments to our suppliers.
Deferred Revenue
Deferred revenue increased to $110,500 at December 31, 2010 compared to the balance of $84,500 as at December 31, 2009. This increase was mainly due to the timing of payments by our customers. Deferred revenue primarily relates to payments associated with the contracts where revenue is recognized on a percentage of completion basis.
22
Incomes Taxes Recoverable
The income taxes recoverable were mainly due to the expected refund from losses carried back to prior years.
Net Cash provided by (used in) Investing Activities. Net cash used for investing activities was $124,200 for the twelve months ended December 31, 2010, compared to $83,200 received in investing activities for the twelve months ended December 31, 2009. The total purchase of property and equipment of the Company was $131,000 for the twelve months ending December 31, 2010 and $131,100 for the year ended December 31, 2009.
Net Cash Provided by (used in) Financing Activities. Net cash used for financing activities was $2,946,200 for Fiscal Year 2010 compared to net cash provided by financing activities of $1,806,000 for Fiscal Year 2009. The change was primarily because we had net outflows of approximately $1,366,300 for the twelve months ended December 31, 2010 under our line of credit and we borrowed approximately $120,100 in 2009. Moreover, our capital lease repayments during the current year were $1,479,900, compared to $1,683,700 in 2009.
Recent Accounting Pronouncements – The following Accounting Standards Codification Updates have been issued by the Financial Accounting Standards Board (“FASB”), or became effective, since the beginning of the current period covered by these financial statements:
|
Pronouncement
|
Issued
|
Title
|
||
|
ASU No. 2010-01
|
January 2010
|
Equity (Topic 505): Accounting for Distributions to Shareholders with Components of Stock and Cash – a consensus of the FASB Emerging Issues Task Force
|
||
|
ASU No. 2010-02
|
January 2010
|
Consolidation (Topic 810): Accounting and Reporting for Decreases in Ownership of a Subsidiary – a Scope Clarification
|
||
|
ASU No. 2012-03
|
January 2010
|
Extractive Activities – Oil and Gas (Topic 932): Oil and Gas Reserve Estimation and Disclosures
|
||
|
ASU No. 2010-04
|
January 2010
|
Accounting for Various Topics: Technical Corrections to SEC Paragraphs
|
||
|
ASU No. 2010-05
|
January 2010
|
Compensation - Stock Compensation (Topic718): Escrowed Share Arrangements and the Presumption of Compensation
|
||
|
ASU No. 2010-06
|
January 2010
|
Fair Value Measurements and Disclosures (Topic 820): Improving Disclosures about Fair Value Measurements
|
|
ASU No. 2010-07
|
January 2010
|
Not-for-Profit Entities (Topic 958): Not-for-Profit Entities – Mergers and Acquisitions
|
||
|
ASU No. 2010-08
|
February 2010
|
Technical Corrections to Various Topics
|
||
|
ASU No. 2010-09
|
February 2010
|
Subsequent Events (Topic 855): Amendments to Certain Recognition and Disclosure Requirements
|
||
|
ASU No. 2010-10
|
February 2010
|
Consolidation (Topic 810): Amendments for Certain Investment Funds
|
||
|
ASU No. 2010-11
|
March 2010
|
Derivatives and Hedging (Topic 815): Scope Exception Related to Embedded Credit Derivatives
|
||
|
ASU No. 2010-12
|
April 2010
|
Income Taxes (Topic 740): Accounting for Certain Tax Effects of the 2010 Health Care Reform Acts (SEC Update)
|
23
|
ASU No. 2010-13
|
April 2010
|
Compensation—Stock Compensation (Topic 718): Effect of Denominating the Exercise Price of a Share-Based Payment Award in the Currency of the Market in Which the Underlying Equity Security Trades—a consensus of the FASB Emerging Issues Task Force
|
||
|
ASU No. 2010-14
|
April 2010
|
Accounting for Extractive Activities—Oil & Gas—Amendments to Paragraph 932-10-S99-1 (SEC Update)
|
||
|
ASU No. 2010-15
|
April 2010
|
Financial Services—Insurance (Topic 944): How Investments Held through Separate Accounts Affect an Insurer’s Consolidation Analysis of Those Investments—a consensus of the FASB Emerging Issues Task Force
|
||
|
ASU No. 2010-16
|
April 2010
|
Entertainment—Casinos (Topic 924): Accruals for Casino Jackpot Liabilities—a consensus of the FASB Emerging Issues Task Force
|
||
|
ASU No. 2010-17
|
April 2010
|
Revenue Recognition—Milestone Method (Topic 605): Milestone Method of Revenue Recognition—a consensus of the FASB Emerging Issues Task Force
|
||
|
ASU No. 2010-18
|
April 2010
|
Receivables (Topic 310): Effect of a Loan Modification When the Loan is Part of a Pool That is Accounted for as a Single Asset—a consensus of the FASB Emerging Issues Task Force
|
To the extent appropriate, the guidance in the above “Accounting Standards Codification Updates” are already reflected in our condensed consolidated financial statements and did not have a material impact. The management does not anticipate that accounting pronouncements not yet adopted will have any future effect on our condensed consolidated financial statements.
There were no other accounting standards and interpretations recently issued by the FASB, which are expected to a have a material impact on the Company's financial position, results of operations or cash flows.
Off Balance Sheet Arrangements
None
DISCUSSION OF CRITICAL ACCOUNTING ESTIMATES
Critical accounting estimates are those that management deems to be most important to the portrayal of our financial condition and results of operations, and that require management’s most difficult, subjective or complex judgments, due to the need to make estimates about the effects of matters that are inherently uncertain. We have identified our critical accounting estimates which are discussed below.
Accounts receivable allowances are determined using a combination of historical experience, current information and management judgment. Actual collections may differ from our estimates.
We derive revenues from contract revenue and services revenue, which include assistance in implementation, integration, customization, maintenance, training and consulting. We recognize revenue for contract and services in accordance with Statement of Position (SOP) 81-1, “Accounting for Certain Construction Type and Certain Production Type Contracts,” and SEC Staff Accounting Bulletin (SAB) 104, “Revenue Recognition,” and EITF 00-21 Accounting for Revenue Arrangements with Multiple Deliverables. Contract revenue consists of fees generated from installation of security systems. Services revenue consists of fees generated by providing monitoring services, preventive maintenance and technical support, product maintenance and upgrades. Monitoring services and preventive maintenance and technical support are generally provided under contracts for terms varying from one to six years. A customer typically prepays monitoring services, preventive maintenance and technical support fees for an initial period. The related revenue is deferred and generally recognized over the term of such initial period. Rates for product maintenance and upgrades are generally provided under time and material contracts. Revenue for these services is recognized in the period in which the services are provided.
24
We record inventory at the lower of cost and net realizable value. Cost is determined on a first-in, first-out basis. We write down our inventory for obsolescence, and excess inventories based on assumptions about future demand and market conditions. The business environment in which we operate is subject to customer demand. If actual market conditions are less favorable than those estimated, additional material inventory write-down may be required. A 10% increase in inventory reserve would increase expenses by $0.1 million.
Convertible debt and equity instruments are reviewed to determine whether there are embedded derivative instruments, including the embedded conversion option, that are required to be bifurcated and accounted for separately as a derivative financial instrument. Generally, where the ability to physical or net-share settle the conversion option is deemed to be not within our control, the embedded conversion option is required to be bifurcated and accounted for as a derivative financial instrument liability.
In connection with the sale of convertible debt and equity instruments, we may also issue freestanding options or warrants. Additionally, we may issue options or warrants to non-employees in connection with consulting or other services they provide. Although the terms of the options and warrants may not provide for net-cash settlement, in certain circumstances, physical or net-share settlement is deemed to not be within the control of the company and, accordingly, we are required to account for these freestanding options and warrants as derivative financial instrument liabilities, rather than as equity.
Derivative financial instruments are initially measured at their fair value. For derivative financial instruments that are accounted for as liabilities, the derivative instrument is initially recorded at its fair value and is then re-valued at each reporting date, with changes in the fair value reported as charges or credits to income. For option-based derivative financial instruments, we use the Black-Scholes option pricing model to value the derivative instruments. Any discount from the face value of the convertible debt instrument is amortized over the life of the instrument through periodic charges to income, using the effective interest method. The classification of derivative instruments, including whether such instruments should be recorded as liabilities or as equity, is re-assessed at the end of each reporting period. Derivative instrument liabilities are classified in the balance sheet as current or non-current based on whether or not net-cash settlement of the derivative instrument is expected within 12 months of the balance sheet date. We currently do not have such liabilities.
Customer relationships and trade name represents the acquisition cost of acquired customer relationships and trade name of the business and are recorded at cost less accumulated amortization. Amortization for customer relationships and trade name is provided on a straight-line basis over the period of expected benefit of 5 and 3 years. The Company reviews the revenues from the customer list at each balance sheet date to determine whether circumstances indicate that the carrying amount of the assets should be assessed.
We periodically perform impairment tests on each of our long-lived assets, including other intangible assets. In doing so, we evaluate the carrying value of each intangible asset with respect to several factors, including historical revenue generated from each intangible asset, application of the assets in our current business plan, and projected cash flow to be derived from the asset.
For issuance of equity instruments for services, we record all stock-based compensation as an expense in the financial statements and that such cost be measured at the grant date fair value of the award. We record the grant date fair value of stock-based compensation awards as an expense over the vesting period of the related stock options. In order to determine the fair value of the stock options on the date of grant, we use the Black-Scholes-Merton option-pricing model. Inherent in this model are assumptions related to expected stock-price volatility, option life, risk-free interest rate and dividend yield. Although the risk-free interest rates and dividend yield are less subjective assumptions, typically based on factual data derived from public sources, the expected stock-price volatility, forfeiture rate and option life assumptions require a greater level of judgment which make them critical accounting estimates. We use an expected stock-price volatility assumption that is based on historical volatilities of our common stock and we estimate the forfeiture rate and option life based on historical data related to prior option grants.
25
Commitments
We have entered into contracts for certain consulting services providing for monthly payments and are required to repay the principal of our convertible notes and promissory notes due to Laurus and other parties. In addition, we have also entered into operating leases for our vehicles, computer and office equipment. The total minimum annual payments for the next five years and thereafter are as follows:
|
Payment due by Period
|
||||||||||||||||||||||||||||
|
Total
|
2011
|
2012
|
2013
|
2014
|
2015
|
Thereafter
|
||||||||||||||||||||||
|
Term notes
|
$ | 16,551,128 | $ | 14,051,128 | $ | - | $ | 2,500,000 | $ | - | $ | - | $ | - | ||||||||||||||
|
Note payable to related parties
|
1,500,000 | - | - | - | - | - | 1,500,000 | |||||||||||||||||||||
|
Capital leases*
|
3,822,062 | 1,813,382 | 1,989,358 | 19,322 | - | - | - | |||||||||||||||||||||
|
Operating leases
|
1,247,259 | 590,237 | 459,635 | 197,387 | - | - | - | |||||||||||||||||||||
|
Commitments related to consulting agreements
|
1,210,000 | 605,000 | 605,000 | - | - | - | - | |||||||||||||||||||||
| $ | 24,330,449 | $ | 17,059,747 | $ | 3,053,993 | $ | 2,716,709 | $ | - | $ | - | $ | 1,500,000 | |||||||||||||||
* The balance of capital leases represents monthly principal and interest payment.
The figures in the above table except with respect to capital leases do not include interest costs.
ITEM 7A. QUANTITATIVE AND QUALITATIVE DISCLOSURES ABOUT MARKET RISK
Not applicable.
26
|
ITEM 8.
|
FINANCIAL STATEMENTS AND SUPPLEMENTARY DATA
|
INDEX TO FINANCIAL STATEMENTS
Creative Vistas, Inc.
Consolidated Financial Statements
For the years ended December 31, 2010 and 2009
|
Report of Independent Registered Public Accounting Firm
|
F-1
|
|
|
Balance Sheets
|
F-2
|
|
|
Statements of Operations and Other Comprehensive (Loss)
|
F-3
|
|
|
Statement of Stockholders’ (Deficiency)
|
F-4
|
|
|
Statements of Cash Flows
|
F-5
|
|
|
Notes to Financial Statements
|
|
F-6
|
REPORT OF INDEPENDENT REGISTERED PUBLIC ACCOUNTING FIRM
Stockholders and Board of Directors
Creative Vistas, Inc.
We have audited the accompanying consolidated balance sheets of Creative Vistas, Inc. as of December 31, 2010 and 2009, and the related consolidated statements of operations and comprehensive (loss), stockholders’ (deficiency) and cash flows for the years then ended. These financial statements are the responsibility of the Company's management. Our responsibility is to express an opinion on these financial statements based on our audits.
We conducted our audits in accordance with the standards of the Public Company Accounting Oversight Board (United States). Those standards require that we plan and perform the audits to obtain reasonable assurance about whether the financial statements are free of material misstatement. The Company is not required to have, nor were we engaged to perform, an audit of its internal control over financial reporting. Our audits included consideration of internal control over financial reporting as a basis for designing audit procedures that are appropriate in the circumstances, but not for the purpose of expressing an opinion on the effectiveness of the Company’s internal control over financial reporting. Accordingly, we express no such opinion. An audit includes examining, on a test basis, evidence supporting the amounts and disclosures in the financial statements. An audit also includes assessing the accounting principles used and significant estimates by management, as well as evaluating the overall financial statement presentation. We believe that our audits provide a reasonable basis for our opinion.
In our opinion, the financial statements referred to above present fairly, in all material respects, the financial position of Creative Vistas, Inc. as of December 31, 2010 and 2009, and results of its operations and its cash flows for the years then ended, in conformity with accounting principles generally accepted in the United States of America.
The accompanying financial statements have been prepared assuming that the Company will continue as a going concern. As discussed in Note 1 to the financial statements, the Company has suffered recurring losses from operations and has working capital and stockholder deficiencies. These factors raise substantial doubt about the Company’s ability to continue as a going concern. Management’s plans in regard to this matter are also discussed in Note 1. The financial statements do not include any adjustments that might result from the outcome of this uncertainty.
Kingery & Crouse PA
Certified Public Accountants
Tampa, Florida
March 30, 2011
F-1
|
Creative Vistas, Inc.
|
||||||||
|
Consolidated Balance Sheets
|
||||||||
|
December 31
|
2010
|
2009
|
||||||
|
Assets
|
||||||||
|
Current Assets
|
||||||||
|
Cash and bank balances
|
$ | 2,030,707 | $ | 2,441,204 | ||||
|
Accounts receivable, net of allowance for doubtful accounts $253,714 (2009-$213,862)
|
3,039,739 | 4,292,071 | ||||||
|
Income tax recoverable
|
180,000 | 257,142 | ||||||
|
Inventory, net
|
692,881 | 789,005 | ||||||
|
Prepaid expenses
|
372,507 | 347,048 | ||||||
|
Total current assets
|
6,315,834 | 8,126,470 | ||||||
|
Property and equipment, net of depreciation and amortization
|
4,407,739 | 6,669,553 | ||||||
|
Deposits
|
228,434 | 282,359 | ||||||
|
Deferred financing costs, net
|
225,107 | 384,521 | ||||||
|
Intangible assets, net
|
56,316 | 284,286 | ||||||
|
Deferred income taxes
|
37,430 | 36,879 | ||||||
| $ | 11,270,860 | $ | 15,784,068 | |||||
|
Liabilities and Stockholders’ (Deficiency)
|
||||||||
|
Current Liabilities
|
||||||||
|
Bank indebtedness
|
$ | 650,744 | $ | 1,960,057 | ||||
|
Accounts payable
|
1,470,157 | 1,916,270 | ||||||
|
Accrued salaries and benefits
|
1,170,546 | 1,223,357 | ||||||
|
Accrued commodity taxes
|
320,664 | 194,258 | ||||||
|
Accrued liabilities
|
1,029,508 | 1,221,435 | ||||||
|
Current portion of obligation under capital leases
|
1,487,460 | 1,501,106 | ||||||
|
Deferred income
|
110,485 | 84,502 | ||||||
|
Deferred income taxes
|
25,858 | 25,858 | ||||||
|
Current portion of term notes
|
14,051,128 | 1,750,000 | ||||||
|
Total current liabilities
|
20,316,550 | 9,876,843 | ||||||
|
Term notes
|
1,702,218 | 13,913,252 | ||||||
|
Notes payable to related parties
|
1,500,000 | 1,500,000 | ||||||
|
Obligation under capital lease, net of current portion
|
1,899,524 | 3,543,801 | ||||||
|
Due to related parties
|
230,870 | 219,876 | ||||||
| 25,649,162 | 29,053,772 | |||||||
|
Stockholders’ (deficiency)
|
||||||||
|
Share capital
|
||||||||
|
Preferred stock no par value, 50,000,000 shares authorized, none issued or outstanding
|
||||||||
|
Common stock, no par value; 100,000,000 shares authorized
|
||||||||
|
Common stock
|
6,555,754 | 6,555,754 | ||||||
|
Additional paid-in capital
|
14,314,354 | 14,158,942 | ||||||
|
Accumulated (deficit)
|
(33,638,922 | ) | (32,957,115 | ) | ||||
|
Accumulated other comprehensive (losses)
|
(1,609,488 | ) | (1,027,285 | ) | ||||
| (14,378,302 | ) | (13,269,704 | ) | |||||
| $ | 11,270,860 | $ | 15,784,068 | |||||
The accompanying notes are an integral part of these financial statements.
F-2
|
Creative Vistas, Inc.
|
|
Consolidated Statement of Operations and Comprehensive (Loss)
|
| For the years ended December 31 |
2010
|
2009
|
||||||
|
Contract and service revenue
|
||||||||
|
Contract
|
$ | 5,683,974 | $ | 5,812,671 | ||||
|
Service
|
34,179,089 | 33,943,128 | ||||||
|
Others
|
3,422 | 12,998 | ||||||
| 39,866,485 | 39,768,797 | |||||||
|
Direct Expenses (excluding depreciation and amortization)
|
||||||||
|
Contract
|
3,433,858 | 3,165,704 | ||||||
|
Service
|
25,997,384 | 26,748,201 | ||||||
|
Project Expenses
|
983,294 | 894,400 | ||||||
|
Selling Expenses
|
911,514 | 905,646 | ||||||
|
General and administrative expenses
|
4,746,140 | 5,571,034 | ||||||
|
Depreciation expense
|
2,225,631 | 2,643,119 | ||||||
|
Amortization of intangible assets
|
231,247 | 341,131 | ||||||
| 38,529,068 | 40,269,235 | |||||||
|
Income (loss) from operations
|
1,337,417 | (500,438 | ) | |||||
|
Interest expenses and other expenses (income)
|
||||||||
|
Net financing expenses
|
2,287,879 | 2,382,811 | ||||||
|
Amortization of deferred charges
|
173,438 | 162,997 | ||||||
|
Foreign currency translation (gain)
|
(442,093 | ) | (1,447,054 | ) | ||||
| 2,019,224 | 1,098,754 | |||||||
|
Loss before income taxes
|
(681,807 | ) | (1,599,192 | ) | ||||
|
Income taxes
|
- | - | ||||||
|
Net (loss)
|
(681,807 | ) | (1,599,192 | ) | ||||
|
Other comprehensive gain (loss):
|
||||||||
|
Foreign currency translation adjustment
|
(582,203 | ) | (1,626,793 | ) | ||||
|
Comprehensive loss
|
$ | (1,264,010 | ) | $ | (3,225,985 | ) | ||
|
Basic weighted-average shares
|
37,488,714 | 37,440,870 | ||||||
|
Diluted weighted-average shares
|
37,488,714 | 37,440,870 | ||||||
|
Basic earnings (loss) per share
|
$ | (0.02 | ) | $ | (0.04 | ) | ||
|
Diluted earnings (loss) per share
|
$ | (0.02 | ) | $ | (0.04 | ) | ||
The accompanying notes are an integral part of these financial statements.
F-3
Creative Vistas, Inc.
Consolidated Statement of Stockholders’ (Deficiency)
|
Shares
|
Amount
|
Additional
paid-in
capital
|
Accumulated
(deficit)
|
Accumulated
Other
Comprehensive
gain (losses)
|
Total
Stockholders’
(deficiency)
|
|||||||||||||||||||
|
Balance, December 31, 2008
|
37,224,926 | $ | 6,488,137 | $ | 14,005,627 | $ | (31,357,923 | ) | $ | 599,508 | $ | (10,264,651 | ) | |||||||||||
|
Stock-based compensation
|
263,788 | 67,617 | (45,054 | ) | - | - | 22,563 | |||||||||||||||||
|
Option expenses
|
- | - | 10,524 | - | - | 10,524 | ||||||||||||||||||
|
Warrants issued to financial institution for deferred principal payment
|
- | - | 187,845 | - | - | 187,845 | ||||||||||||||||||
|
Net Loss
|
- | - | - | (1,599,192 | ) | - | (1,599,192 | ) | ||||||||||||||||
|
Translation adjustment
|
- | - | - | - | (1,626,793 | ) | (1,626,793 | ) | ||||||||||||||||
|
Balance, December 31, 2009
|
37,488,714 | 6,555,754 | 14,158,942 | (32,957,115 | ) | (1,027,285 | ) | (13,269,704 | ) | |||||||||||||||
|
Option expenses
|
- | - | 55,770 | - | - | 55,770 | ||||||||||||||||||
|
Warrants issued to financial institution for deferred principal payment and consulting fees
|
- | - | 99,642 | - | - | 99,642 | ||||||||||||||||||
|
Net loss
|
- | - | - | (681,807 | ) | - | (681,807 | ) | ||||||||||||||||
|
Translation adjustment
|
- | - | - | - | (582,203 | ) | (582,203 | ) | ||||||||||||||||
|
Balance, December 31, 2010
|
37,488,714 | $ | 6,555,754 | $ | 14,314,354 | $ | (33,638,922 | ) | $ | (1,609,488 | ) | $ | (14,378,302 | ) | ||||||||||
The accompanying notes are an integral part of these financial statements.
F-4
|
Creative Vistas, Inc.
|
||||||||
|
Consolidated Statements of Cash Flows
|
||||||||
|
For the year ended December 31,
|
2010
|
2009
|
||||||
|
Operating activities
|
||||||||
|
Net (loss)
|
$ | (681,807 | ) | $ | (1,599,192 | ) | ||
|
Adjustments to reconcile net (loss) to net cash provided by (used in) operating activities
|
||||||||
|
Depreciation and amortization of property and equipment
|
2,225,631 | 2,643,119 | ||||||
|
Amortization of intangible assets
|
231,247 | 341,131 | ||||||
|
Amortization of deferred financing cost
|
173,437 | 162,997 | ||||||
|
Loss on disposal of property and equipment
|
37,794 | 80,552 | ||||||
|
Bad debt expenses
|
78,584 | 105,650 | ||||||
|
Foreign exchange
|
(219,127 | ) | (1,197,750 | ) | ||||
|
Stock-based compensation and amortization of debts discount
|
99,642 | 210,408 | ||||||
|
Amortization of employee stock option
|
55,770 | 10,524 | ||||||
|
Changes in non-cash working capital balances
|
||||||||
|
Accounts receivable
|
919,689 | 67,632 | ||||||
|
Inventory
|
131,627 | 150,662 | ||||||
|
Prepaid expenses
|
41,973 | 170,219 | ||||||
|
Accounts payable and other accrued liabilities
|
(370,267 | ) | (1,164,001 | ) | ||||
|
Deferred revenue
|
21,124 | (50,320 | ) | |||||
|
Income tax recoverable
|
87,379 | (29,991 | ) | |||||
|
Net cash provided by (used in) operating activities
|
2,832,696 | (98,360 | ) | |||||
|
Investing activities
|
||||||||
|
Proceeds from sales of property and equipment
|
6,826 | 214,256 | ||||||
|
Purchase of property and equipment
|
(130,996 | ) | (131,073 | ) | ||||
|
Net cash provided by (used in) investing activities
|
(124,170 | ) | 83,183 | |||||
|
Financing activities
|
||||||||
|
Proceeds from (repayment of) bank indebtedness
|
(1,366,326 | ) | 120,084 | |||||
|
Due to related parties
|
- | (4,832 | ) | |||||
|
Repayment of capital leases
|
(1,479,893 | ) | (1,683,721 | ) | ||||
|
Repayment of term loans
|
(100,000 | ) | (237,500 | ) | ||||
|
Net cash (used in) financing activities
|
(2,946,219 | ) | (1,805,969 | ) | ||||
|
Effect of foreign exchange rate changes on cash
|
(172,804 | ) | (507,987 | ) | ||||
|
Net change in cash and cash equivalents
|
(410,497 | ) | (2,329,133 | ) | ||||
|
Cash and cash equivalents, beginning of period
|
2,441,204 | 4,770,337 | ||||||
|
Cash and cash equivalents, end of period
|
$ | 2,030,707 | $ | 2,441,204 | ||||
|
Supplemental Cash Flow Information
|
||||||||
|
Cash paid for the interest
|
$ | 2,193,859 | $ | 2,194,966 | ||||
|
Cash paid for income taxes
|
$ | - | $ | - | ||||
|
Loan interest or penalties paid with warrant
|
$ | 94,591 | $ | 187,845 | ||||
|
Capital assets purchase through capital leases
|
$ | - | $ | 1,866,573 | ||||
The accompanying notes are an integral part of these financial statements.
F-5
|
Creative Vistas, Inc.
|
|
Notes to Consolidated Financial Statements
|
|
For the years ended December 31, 2010 and 2009
|
|
1.
|
Summary of Accounting Policies
|
Basis of presentation
The accompanying consolidated financial statements as at and for the years ended December 31, 2010 and 2009, have been prepared by management in accordance with United States generally accepted accounting principles (“GAAP”) applicable to the respective periods.
The consolidated balance sheets as at December 31, 2010 and 2009, and statements of operations and cash flows for the years ended December 31, 2010 and 2009 include the accounts of Creative Vistas, Inc. (“CVAS”), Creative Vistas Acquisition Corp. (“AC Acquisition”), AC Technical Systems Ltd. (“AC Technical”), Cancable Holding Corp. (“Cancable Holding”), Cancable Inc., Cancable XL Inc., XL Digital Services Inc. (“XL Digital”), 2141306 Ontario Inc., Iview Holding Corp. (“Iview Holding”), Iview Digital Solutions Inc. (“Iview DSI”) and OSSIM View Inc.. (Collectively, the “Company”, or “we”, “us”, “our”). All material inter-company accounts, transactions and profits have been eliminated.
Liquidity and going concern
Our consolidated financial statements were prepared using accounting principles generally accepted in the United States of America applicable to a going concern, which contemplates the realization of assets and liquidation of liabilities in the normal course of business. We have incurred a loss of $681,807 for the year ended December 31, 2010, and have an accumulated deficit of $33,638,922, a stockholders’ deficit of $14,378,302 and a working capital deficit of $14,000,716 at December 31, 2010.
We have outstanding principal amount of term loans aggregating $16,551,128 which will be due in 2011 and 2013. We do not currently have the ability to repay the notes in the event of a demand by the holder. Furthermore, we granted a security interest to Laurus and its related entities in substantially all of our assets and, accordingly, in the event of any default under our agreements with Laurus and its related entities, they could conceivably attempt to foreclose on our assets, which could cause us to terminate our operations.
Over the next twelve months the Company believes that its existing capital will be sufficient to sustain its operations if we can refinance our debt due in 2011. Management plans to seek additional capital in the future to fund operations, growth and expansion through additional equity, debt financing or credit facilities. The Company has had early stage discussions with investors about potential investment in the Company at a future date. No assurance can be made that such financing would be available, and if available it may take either the form of debt or equity. In either case, the financing could have a negative impact on our financial condition and our shareholders. The Company has introduced cost cutting initiatives within the Administration, Project and Selling departments to improve efficiency within the Company and also improve cash flow. The Company has also increased its rates for service provided by AC Technical to improve gross margins. This is in line with our competitors. The Company also expects to see the benefits of its research and development efforts within the next 12 months as it starts to introduce its own line of customized products to the industry. These products and technologies are expected to improve gross margins. The Company believes that it will be eligible for research and development tax credits at year end for its research and development efforts during the year and these are additional sources of cash flow for the Company. The Company is also negotiating longer credit terms with its suppliers from 45 days to 60 to 75 days. For all the reasons mentioned above, we believe that we have adequate short term borrowing capability and that we will be able to sustain our operations and continue as a going concern for a reasonable period of time although there can be no assurance of this.
F-6
The financial statements do not include any adjustments to reflect the possible future effects on the recoverability and classification of assets or the amounts and classification of liabilities that may result from the possible inability of the Company to continue as a going concern.
Cash and Cash Equivalents
The Company considers all cash and highly liquid investments purchased with an initial maturity of three months or less to be cash and cash equivalents.
The Company maintains its cash in bank deposit accounts that, at times, may exceed federally insured limits. The Company has not experienced any losses in such accounts and believes it is not exposed to any significant credit risks on cash and cash equivalents.
Accounts Receivable
The Company extends credit to its customers based upon a written credit policy. Accounts receivable are recorded at the invoiced amount and do not bear interest. Accounts receivable are unsecured, as the Company does not require collateral. The allowance for doubtful accounts is the Company’s best estimate for the amount of probable credit losses in the Company’s existing accounts receivable. The Company establishes an allowance for doubtful accounts based upon factors surrounding the credit risk of specific customers, historical trends, and other information. Receivable balances are reviewed on an aged basis and account balances are charged off against the allowance after all means of collection have been exhausted and the potential for recovery is considered remote.
Investment Tax Credits
Investment tax credits are recorded when qualifying expenditures are made and there is reasonable assurance that the credits will be realized. Investment tax credits earned with respect to current expenditures for qualified research and development activities are included in the statement of operations as a reduction of expenses. Tax credits earned with respect to capital expenditures are applied to reduce the cost of the related capital assets. Certain tax credits earned are cash refundable.
Research and Development Expenditures
Research and development costs (other than capital expenditures) are expensed as incurred. Expenditures are reduced by any related investment tax credits. Our research and development expenses were approximately $860,000 in fiscal year 2010 and $590,000 in fiscal year 2009 and are included in general and administrative expenses in the accompanying consolidated statements of operations and comprehensive (loss).
Advertising cost
Advertising cost are expensed as incurred. Total advertising cost was approximately $40,000 and $46,000 for the year ended December 31, 2010 and 2009, respectively.
Inventory
Inventory consists of materials and supplies and is stated at the lower of cost and market value. Cost is generally determined on the first in, first out basis. The inventory is net of estimated obsolescence ($100,000 at December 31, 2010 and 2009), and excess inventory based upon assumptions about future demand and market conditions. Inventory consists principally of parts, materials and supplies.
Property and Equipment
Property and equipment is stated at original cost. Expenditures for improvements that significantly add to productive capacity or extend the useful life of an asset are capitalized. Expenditures for maintenance and repairs are expensed when incurred. Depreciation and amortization per annum is computed over the estimated useful life as follows:
|
Industrial condominium
|
4% declining balance basis
|
|
|
Leasehold improvements
|
lesser of 5 years or the term of the lease straight-line basis
|
|
|
Office equipment
|
20% declining balance basis or 3 years straight-line method
|
|
|
Office equipment under capital leases
|
3 years straight-line method
|
|
|
Furniture and fixtures
|
20% declining balance basis or 3 years straight-line method
|
|
|
Furniture and fixtures under capital leases
|
5 years straight-line method
|
|
|
Computer hardware and software
|
30% declining balance basis or 3 years straight-line method
|
|
|
Vehicles
|
4 years straight-line basis
|
|
|
Tools and equipment
|
|
3 years straight-line basis
|
F-7
Customer Relationships and Trade Name
Customer relationships and trade name represents the acquisition cost of acquired customer relationships and trade name of Cancable and XL Digital are recorded at cost less accumulated amortization. Amortization for customer relationships and trade name is provided on a straight-line basis over the period of expected benefit of 5 and 3 years. The Company reviews the revenues from the customer list at each balance sheet date to determine whether circumstances indicate that the carrying amount of the asset should be assessed. At December 31, 2010, we believe the carrying amounts re recoverable. Amortization charged to operations aggregated $231,247 in 2010 and $341,131 in 2009.
Long-Lived Assets
A long-lived asset should be tested for recoverability whenever events or changes in circumstances indicate that its carrying amount may not be recoverable. We follow the two-step process for determining if an impairment charge should be taken: (1) the expected undiscounted cash flows from a particular asset or asset group are compared with the carrying value; if the expected undiscounted cash flows are greater than the carrying value, no impairment is recognized, but if the expected undiscounted cash flows are less than the carrying value, then (2) an impairment charge is taken for the difference between the carrying value and the assets fair value. Where practicable, we will obtain an independent valuation of intangible assets, and place reliance on such valuation. Then on an ongoing basis, we use the weighted-average probability method, to estimate the fair value. This method requires significant management judgment to forecast the future operating results used in the analysis. The assumptions used in developing expected cash flow estimates are similar to those used in developing other information used by us for budgeting and other forecasting purposes. In instances where a range of potential future cash flows is possible, we use a probability-weighted approach to weigh the likelihood of those possible outcomes. For purposes of discounting cash flows, we use a discount rate equal to the yield on a zero-coupon US Treasury instrument with a life equal to the expected life of the intangible asset or asset group being tested. At December 31, 2010, we believe all of our long-lived assets are recoverable.
Deferred Financing Costs
Deferred financing costs represent costs directly related to obtaining financing. Deferred financing costs are amortized over the term of the related indebtedness using the effective interest method.
Issuance of Equity Instruments for Services
Stock-based compensation is recognized as an expense in the financial statements and such cost are measured at the grant date fair value of the award.
We record the grant date fair value of stock-based compensation awards as an expense over the vesting period of the related stock options. In order to determine the fair value of the stock options on the date of grant, we use the Black-Scholes-Merton option-pricing model. Inherent in this model are assumptions related to expected stock-price volatility, option life, risk-free interest rate and dividend yield. Although the risk-free interest rates and dividend yield are less subjective assumptions, typically based on factual data derived from public sources, the expected stock-price volatility, forfeiture rate and option life assumptions require a greater level of judgment which make them critical accounting estimates.
We use an expected stock-price volatility assumption that is based on historical volatilities of our common stock and we estimate the forfeiture rate and option life based on historical data related to prior option grants.
F-8
Revenue Recognition
Contract Revenue
Software Related Services – Software related services include services to customize or enhance the software so that the software performs in accordance with specific customer requirements. As these services are essential to provide the required functionality, revenue from these arrangements is recognized in accordance with ASC 605 “Revenue Recognition” using either the percentage-of-completion method or the completed contract method. The percentage-of-completion method is used when the required services are quantifiable, based on the estimated number of labor hours necessary to complete the project, and under that method revenues are recognized using labor hours incurred as the measure of progress towards completion but is limited to revenue that has been earned by the attainment of any milestones included in the contract. The completed contract method is used when the required services are not quantifiable, and under that method revenues are recognized only when we have satisfied all of our product and/or service delivery obligations to the customer.
Security Systems – Security systems revenue consists of fees generated from consulting, audit, review, planning, engineering and design, supply of hardware systems installation and project management. Revenue from contracts where performance extends beyond one or more accounting periods is recognized in accordance with ASC 605 “Revenue Recognition and SEC Staff Accounting Bulletin 104, “Update of Codification of Staff Accounting Bulletins”. The recognition of revenue reflects the degree of completeness based upon project drawings, project schedules, progress of actual installation and are further validated by visual observations by product managers, quality inspectors and construction advisors, if applicable. When the current estimated costs to complete indicate a loss, such losses are immediately recognized for accounting purposes. Some projects have the equipment and installation as separate elements specified in the contracts. The revenue is recognized when each element has been satisfied in accordance ASC 605 and SEC Staff Accounting Bulletin 104, which are the delivery of the equipment and completion of installation process. The fair value of each element is based on the price charged when it is sold on a standalone basis.
For contracts of shorter duration, revenue is generally recognized when services are performed. Contractual terms may include the following payment arrangements: fixed fee, full-time equivalent, milestone, and time and material. In order to recognize revenue, the following criteria must be met:
|
|
·
|
Signed agreement — The agreement must be signed by the customer.
|
|
|
·
|
Fixed Fee — The signed agreement must specify the fees to be received for the services.
|
|
|
·
|
Delivery has occurred — Delivery is substantiated by time cards and where applicable, supplemented by an acceptance from the customer that milestones as agreed in the statement have been met.
|
|
|
·
|
Collectibility is probable — The Company conducts a credit review for significant transactions at the time of the engagement to determine the credit-worthiness of the customer. Generally, collaterial is not required. Collections are monitored over the term of each project, and if a customer becomes delinquent, the revenue may be deferred.
|
Service Revenue
Service revenue consists of fees generated by providing monitoring services, preventive maintenance and technical support, product maintenance and upgrades and regional broadband and cable service. Monitoring services, preventive maintenance and technical support are generally provided under contracts for terms varying from one to six years. A customer typically prepays monitoring services and preventive maintenance and technical support fees for an initial period, and the related revenue is deferred and generally recognized over the term of such initial period. Rates for product maintenance and upgrades are generally provided under time and material contracts. Revenue for other services is recognized in the period in which the services are provided
Warranty
The Company carries a reserve based upon historical warranty claims experience. Additionally, warranty accruals are established on the basis of anticipated future expenditures as specific warranty obligations are identified and they are charged against the accrual. Expenditures exceeding such accruals are expensed directly to cost of sales.
F-9
Earning (loss) per share
Basic earning (loss) per share (“EPS”) is computed using the weighted average number of common shares outstanding during the period. Diluted EPS is computed using the weighted average number of common and dilutive potential common shares outstanding during the period. Dilutive potential common shares consist of common stock issuable upon exercise of stock options and warrants and conversion of debt using the treasury stock method. Adjustments to earnings per share calculation include reversing interest related to the convertible debts and changes in derivative instruments. During periods when losses are incurred dilutive common shares are not considered in the computation as their effect would be anti-dilutive.
Financial Instruments
The carrying value of the Company’s financial instruments, including cash and cash equivalents, accounts receivable, accounts payable and accrued liabilities approximate fair value because of the short maturities of those instruments. Based on borrowing rates currently available to the Company for loans with similar terms, the carrying value of term notes, convertible notes and notes payable are also approximate fair value except notes payable due to The Malar Trust and related party balances for which it was not practicable to determine fair value.
We review the terms of convertible debt and equity instruments we issue to determine whether there are embedded derivative instruments, including the embedded conversion option, that are required to be bifurcated and accounted for separately as a derivative financial instrument. Generally, where the ability to physical or net-share settle the conversion option is deemed to be not within the control of the company, the embedded conversion option is required to be bifurcated and accounted for as a derivative financial instrument liability.
In connection with the sale of convertible debt and equity instruments, we may also issue freestanding options or warrants. Additionally, we may issue options or warrants to non-employees in connection with consulting or other services they provide. Although the terms of the options and warrants may not provide for net-cash settlement, in certain circumstances, physical or net-share settlement is deemed not be within the control of the company and, accordingly, we are required to account for these freestanding options and warrants as derivative financial instrument liabilities, rather than as equity.
Derivative financial instruments, in the event that we have any, are initially measured at their fair value. For derivative financial instruments that are accounted for as liabilities, the derivative instrument is initially recorded at its fair value and is then re-valued at each reporting date, with changes in the fair value reported as charges or credits to income. For option-based derivative financial instruments, we use the Black-Scholes option pricing model to value the derivative instruments.
Any discount from the face value of the convertible debt instrument resulting from the allocation of part of the proceeds to embedded derivative instruments and/or freestanding options or warrants is amortized over the life of the instrument through periodic charges to income, using the effective interest method.
Credit Risk
The Company’s financial assets that are exposed to credit risk consist primarily of cash and equivalents and accounts receivable. Concentrations of credit risk with respect to accounts receivable are limited due to the generally short payment terms. See above and Note 14.
Foreign Currency Translation
The U.S. dollar is the functional currency of our operations, except for our operations located in Canada, which use the Canadian Dollar as their functional currency. Foreign currency transaction gains and losses are reflected in income. Gains and losses resulting from any inter company balances with different functional currencies are recognized in the statement of operations.
Comprehensive Income
We report comprehensive income in accordance with the Comprehensive Income subtopic of the Financial Accounting Standards Board Standards Codification. This statement requires the disclosure of accumulated other comprehensive income or loss (excluding net income or loss) as a separate component of shareholders’ equity. Translation gains and losses arising from translating the financial statements of the Canadian subsidiaries into U.S. dollars for reporting purposes are included in “Accumulated other comprehensive income (loss).”
F-10
Income Taxes
We account for income taxes under the provisions of ASC 740, Accounting for Income Taxes, which requires recognition of deferred tax liabilities and assets for the expected future tax consequences of events that have been included in the financial statements or tax returns. Under this method, deferred tax liabilities and assets are determined based on the difference between the financial statement and tax basis of assets and liabilities using enacted tax rates in effect for the year in which the difference is expected to reverse. Deferred tax assets are reduced by a valuation allowance when, in the opinion of management, it is more likely than not that some portion or all of the deferred tax assets will not be realized. We have recorded a 100% valuation allowance as of December 31, 2010 and 2009 for substantially all of our deferred income tax assets.
Beginning January 1, 2007, we adopted the ASC 740-10-05 Accounting for Uncertainty in Income Taxes subtopic of the Financial Accounting Standards Board Standards Codification. Under this standard, we are required to evaluate each of our tax positions to determine whether they are more likely than not to be sustained if the taxing authority examines the respective position. A tax position includes an entity’s decision not to file a tax return. The Company has not taken any uncertain tax positions on any of its open income tax returns filed through the year ended December 31, 2010 that would have materially affected its financial statements. The Company follows the methods of accounting for taxes based on established income tax principles approved by the taxing authorities in Canada and the United States and believes that such methods are properly calculated and reflected within its income tax returns. In addition, the Company has filed income tax returns in all applicable jurisdictions in which it had a material nexus warranting an income tax filing. The validity of the Company's conclusions are re-assessed at least annually to determine if facts or circumstances have arisen that might cause the Company to change its judgment regarding the likelihood of a tax position's sustainability under audit. The Company has determined that there were no uncertain tax positions for the years ended December 31, 2010 and 2009; therefore, the adoption of this standard did not materially impact the Company’s results of operations, financial condition, or liquidity. Since inception, we have been subject to tax by both federal, provincial and state taxing authorities. Until the respective statutes of limitations expire (which maybe as much as 20 years while we have unused NOL’s), we are subject to income tax audits in the jurisdictions in which we operate.
Use of Estimates
The Company prepares its financial statements in accordance with accounting principles generally accepted in the United States of America, which require management to make estimates and assumptions that affect the reported amounts of assets, liabilities, revenues and expenses and disclosure of contingent assets and liabilities. The reported amounts of revenues and expenses may be affected by the estimates we are required to make. Estimates and assumptions used in the accompanying financial statements are based upon management’s evaluation of the relevant facts and circumstances as of the date of the financial statements. Estimates that are critical to the accompanying consolidated financial statements relate principally to the adequacy of inventory reserves, the allowance for uncollectible accounts, the recoverability of long-lived assets, and our ability to continue as a going concern. In addition, stock-based compensation expense represents a significant estimate as the determination of such expense is partially dependent on certain assumptions the Company has made regarding the future value of its common stock. Actual results may differ from the estimates and assumptions used in preparing the accompanying financial statements.
Recent Accounting Pronouncements
Recent Accounting Pronouncements – The following Accounting Standards Codification Updates have been issued by the Financial Accounting Standards Board (“FASB”), or became effective, since the beginning of the current period covered by these financial statements:
F-11
|
Pronouncement
|
Issued
|
Title
|
||
|
ASU No. 2010-01
|
January 2010
|
Equity (Topic 505): Accounting for Distributions to Shareholders with Components of Stock and Cash – a consensus of the FASB Emerging Issues Task Force
|
||
|
ASU No. 2010-02
|
January 2010
|
Consolidation (Topic 810): Accounting and Reporting for Decreases in Ownership of a Subsidiary – a Scope Clarification
|
||
|
ASU No. 2012-03
|
January 2010
|
Extractive Activities – Oil and Gas (Topic 932): Oil and Gas Reserve Estimation and Disclosures
|
||
|
ASU No. 2010-04
|
January 2010
|
Accounting for Various Topics: Technical Corrections to SEC Paragraphs
|
||
|
ASU No. 2010-05
|
January 2010
|
Compensation - Stock Compensation (Topic718): Escrowed Share Arrangements and the Presumption of Compensation
|
||
|
ASU No. 2010-06
|
January 2010
|
Fair Value Measurements and Disclosures (Topic 820): Improving Disclosures about Fair Value Measurements
|
||
|
ASU No. 2010-07
|
January 2010
|
Not-for-Profit Entities (Topic 958): Not-for-Profit Entities – Mergers and Acquisitions
|
||
|
ASU No. 2010-08
|
February 2010
|
Technical Corrections to Various Topics
|
||
|
ASU No. 2010-09
|
February 2010
|
Subsequent Events (Topic 855): Amendments to Certain Recognition and Disclosure Requirements
|
||
|
ASU No. 2010-10
|
February 2010
|
Consolidation (Topic 810): Amendments for Certain Investment Funds
|
||
|
ASU No. 2010-11
|
March 2010
|
Derivatives and Hedging (Topic 815): Scope Exception Related to Embedded Credit Derivatives
|
||
|
ASU No. 2010-12
|
April 2010
|
Income Taxes (Topic 740): Accounting for Certain Tax Effects of the 2010 Health Care Reform Acts (SEC Update)
|
||
|
ASU No. 2010-13
|
April 2010
|
Compensation—Stock Compensation (Topic 718): Effect of Denominating the Exercise Price of a Share-Based Payment Award in the Currency of the Market in Which the Underlying Equity Security Trades—a consensus of the FASB Emerging Issues Task Force
|
||
|
ASU No. 2010-14
|
April 2010
|
Accounting for Extractive Activities—Oil & Gas—Amendments to Paragraph 932-10-S99-1 (SEC Update)
|
||
|
ASU No. 2010-15
|
April 2010
|
Financial Services—Insurance (Topic 944): How Investments Held through Separate Accounts Affect an Insurer’s Consolidation Analysis of Those Investments—a consensus of the FASB Emerging Issues Task Force
|
||
|
ASU No. 2010-16
|
April 2010
|
Entertainment—Casinos (Topic 924): Accruals for Casino Jackpot Liabilities—a consensus of the FASB Emerging Issues Task Force
|
||
|
ASU No. 2010-17
|
April 2010
|
Revenue Recognition—Milestone Method (Topic 605): Milestone Method of Revenue Recognition—a consensus of the FASB Emerging Issues Task Force
|
||
|
ASU No. 2010-18
|
April 2010
|
Receivables (Topic 310): Effect of a Loan Modification When the Loan is Part of a Pool That is Accounted for as a Single Asset—a consensus of the FASB Emerging Issues Task Force
|
F-12
To the extent appropriate, the guidance in the above “Accounting Standards Codification Updates” are already reflected in our condensed consolidated financial statements and did not have a material impact and management does not anticipate that accounting pronouncements not yet adopted will have any future effect on our condensed consolidated financial statements.
There were no other accounting standards and interpretations recently issued by the FASB, which are expected to have a material impact on the Company's financial position, results of operations or cash flows.
2. Prepaid Expenses
The balance consists of the following:
|
2010
|
2009
|
|||||||
|
Prepaid insurance
|
$ | 260,365 | $ | 228,293 | ||||
|
Prepaid rent
|
- | 13,548 | ||||||
|
Prepaid leases
|
19,724 | 20,848 | ||||||
|
Others
|
92,418 | 84,359 | ||||||
| $ | 372,507 | $ | 347,048 | |||||
3. Related Party Transactions
Balances due to related parties are as follows:
|
2010
|
2009
|
|||||||
|
Advances from the Chairman of the Company, non-interest bearing with no fixed terms of repayment. The loan is subordinated to the Laurus loans
|
$ | 64,865 | $ | 61,777 | ||||
|
Subordinated loan - advances from the Chairman secured by a promissory note, a third ranking general security agreement, assignment of insurance policy, a second mortgage on the industrial condominium up to $269,955, personal guarantee of the president and his spouse up to $539,910 and a collateral second mortgage on the president's principal residence up to $77,130, bearing interest at 6% per annum, repayable in blended monthly payments of $10,155. The loan matured on February 14, 2005. However, the loan is subordinated to Laurus with no fixed terms of repayment and no interest has been charged from September 30, 2004. .
|
68,085 | 64,841 | ||||||
|
Loan payable to the president of the Company, non-interest bearing with no fixed terms of repayment. The loan is subordinated to Laurus loans
|
97,920 | 93,258 | ||||||
| 230,870 | 219,876 | |||||||
|
Less current portion
|
- | - | ||||||
| $ | 230,870 | $ | 219,876 | |||||
|
Note payable to related parties is as follows:
|
||||||||
|
Note payable to the Malar Trust (the Chairman is one of the beneficiaries of the trust), bearing interest at 3% per annum with no fixed terms of repayment. The loan is subordinated to the Laurus loan. Total interest for the year was $53,240 (2009: $51,673)
|
$ | 1,500,000 | $ | 1,500,000 | ||||
F-13
During 2010, $320,388 (2009 - $289,875) in consulting fees were paid to a company controlled by the Chairman of the Board. In addition, $266,990 (2009 - $241,563) in consulting fees was paid to a Company controlled by the president’s spouse.
4. Property and Equipment
| 2010 | 2009 | |||||||||||||||
|
Accumulated
|
Accumulated
|
|||||||||||||||
|
Cost
|
Depreciation
|
Cost
|
Depreciation
|
|||||||||||||
|
Land
|
$ | 99,255 | - | $ | 94,529 | - | ||||||||||
|
Industrial condominium
|
855,994 | 248,521 | 815,232 | 213,046 | ||||||||||||
|
Leasehold improvement
|
461,782 | 373,721 | 470,594 | 327,462 | ||||||||||||
|
Office equipment
|
485,585 | 447,414 | 464,410 | 384,769 | ||||||||||||
|
Office equipment under capital leases
|
55,306 | 53,306 | 52,958 | 48,958 | ||||||||||||
|
Furniture and fixtures
|
463,527 | 405,510 | 428,808 | 298,626 | ||||||||||||
|
Furniture and fixtures under capital leases
|
- | - | 21,251 | 21,251 | ||||||||||||
|
Computer hardware and software
|
1,439,189 | 1,285,167 | 1,524,896 | 1,126,391 | ||||||||||||
|
Computer hardware and software under capital leases
|
- | - | 89,564 | 89,564 | ||||||||||||
|
Vehicles
|
578,033 | 550,949 | 216,841 | 168,374 | ||||||||||||
|
Vehicles under capital leases
|
6,265,327 | 3,065,551 | 6,989,051 | 2,106,599 | ||||||||||||
|
Tools & equipment
|
1,468,265 | 1,334,385 | 1,412,879 | 1,126,420 | ||||||||||||
| $ | 12,172,263 | 7,764,524 | $ | 12,581,013 | 5,911,460 | |||||||||||
|
Net book value
|
$ | 4,407,739 | $ | 6,669,553 | ||||||||||||
Total accumulated amortization on property and equipment leased under capital leases approximated $3,119,000 and $2,266,000 as of December 31, 2010 and 2009 respectively. Amortization expense under such leases, which is included in depreciation and amortization in the accompanying consolidated statements of cash flows, approximated $1,471,000 and $1,886,200 during the years ended December 31, 2010 and 2009, respectively.
5. Intangible Assets
| 2010 | 2009 | |||||||||||||||
|
Cost
|
Accumulated
amortization
|
Net book
value
|
Net book
value
|
|||||||||||||
|
Customer relationships
|
$ | 1,390,000 | $ | 1,333,684 | $ | 56,316 | $ | 284,286 | ||||||||
For the year ended December 31, 2010, the amortization of intangible assets was $231,247 (2009 - $341,131). The amortizations for the next two years is as follows:
F-14
|
Year
|
Amount
|
|||
|
2011
|
$ | 32,182 | ||
|
2012
|
24,134 | |||
| $ | 56,316 | |||
6. Deferred Financing Costs, Net
Deferred financing costs are associated with the Company’s term notes. For the year ended December 31, 2010, the amortization of deferred financing cost was $173,438 (2009 - $162,997).
|
2010
|
2009
|
|||||||
|
Cost
|
$ | 1,181,881 | $ | 1,130,892 | ||||
|
Accumulated amortization
|
956,774 | 746,371 | ||||||
| $ | 225,107 | $ | 384,521 | |||||
The estimated amortization expense for each of the next three fiscal years is as follows:
|
Year
|
Amount
|
|||
|
2011
|
$ | 154,041 | ||
|
2012
|
47,444 | |||
|
2013
|
23,622 | |||
| $ | 225,107 | |||
7. Bank Indebtedness and Letter of Credit
In 2008, the Company established credit facilities with a Canadian chartered bank to provide for borrowings by its subsidiaries, AC Technical and Cancable Inc. The credit facilities for AC Technical and Cancable were $500,000 and $3,500,000 respectively and bear interest at the bank’s domestic prime rate plus 1.5% to 3.4% for Canadian dollar amounts. Interest is payable monthly. The facilities are secured by a first security interest in book debts, inventory, certain other assets and life insurance. As at December 31, 2010, the interest rate of the Canadian dollar amount was 4.0% to 5.9%. At December 31, 2010, the borrowings outstanding under both facilities were $650,744 and the average borrowing outstanding during the twelve months ended December 31, 2010 was $1,305,400. The Company banking facility agreements contain financial covenants pertaining to maintenance of tangible net worth and debt service coverage ratio. In the event of default, the bank could at its discretion cancel the facilities and demand immediate repayment of all outstanding amounts.
At December 31, 2010, the Company was contingently liable under an irrevocable letter of credit issued by our bank in November 2010 in the amount of $150,000, which will expire in November 2011. The letter of credit was issued to a customer as a security for the performance of a preventive maintenance contract award to AC Technical.
|
8.
|
Term Notes
|
In January 2006, concurrently with the closing of the acquisition of Cancable Inc., the Company entered into a series of agreements with Laurus whereby Cancable issued to Laurus a secured term note (the “Cancable Note”) in the amount of $6,865,000 and Cancable Holding issued to Laurus a related option to purchase up to 49 shares of common stock of Cancable Holding (up to 49% of the outstanding shares of Cancable Holding) at a price of $0.01 per share (the “Option”). The loan is secured by substantially all of the assets of the Company and its subsidiaries, subject to the bank’s security interest (See Note 7).
The Cancable Note bears interest at the prime rate plus 1.75% with a minimum rate of 7%, and requires minimum monthly payments of $81,726 until the indebtedness is paid in full except that the Company is not obligated, except upon an event of default, to pay more than 25% of the original principal amount prior to December 31, 2011.
F-15
In February 2006, the Company and its subsidiaries, Iview Holding and Iview DSI entered into a series of agreements with Laurus pursuant to a refinancing transaction whereby the Company issued to Laurus a secured term note (the “Company Note”) in the amount of $8,250,000 and Iview DSI issued to Laurus a secured term note (the “Iview Note”) in the amount of $2,000,000. Concurrently, the Company issued to Laurus a related warrant to purchase up to 2,411,003 shares of common stock of the Company (up to 7.5% of the outstanding shares of the Company) at a price of $0.01 per share (the “Warrant”) and Iview Holding issued to Laurus a related option to purchase up to 20 shares of common stock of Iview Holding (up to 20% of the outstanding shares of Iview Holding) at a price of $0.01 per share (the “Option”). The loans are secured by substantially all of the assets of the Company (exclusive of those under capital lease, which are subject to the obligor's security interest in such assets) and its subsidiaries. Simultaneously with the closing of this refinancing transaction, the Company paid off the entire outstanding principal amount and all obligations due to Laurus under a Secured Convertible Term Note, a Secured Convertible Minimum Borrowing Note and a Secured Revolving Note, all dated September 30, 2004 (collectively, the “2004 Notes”) and such 2004 Notes were cancelled.
The options held by Laurus to acquire 49% of Cancable Holding and 20% of Iview Holding are accounted for as noncontrolling interests. Because the options have not been exercised and because Cancable Holding and Iview Holding have incurred losses, no noncontrolling interests have been recognized at December 31, 2010.
The Company Note bears interest at the prime rate plus 2% with a minimum rate of 7%. Interest is calculated on the basis of a 360 day year. The minimum monthly payment on the term note is $137,500 commencing March 1, 2007 to February 1, 2011, with a balance of $4,950,000 payable on the maturity date. Through December 31, 2010, the Company has issued warrants to purchase up to 4,212,000 shares of common stock of the Company at prices from $0.03 to $2.84 per share to defer until maturity the principal repayments that were due from March 1, 2007 to December 1, 2010.
The Iview Note bears interest at the prime rate plus 2% with a minimum rate of 7%. Interest is calculated on the basis of a 360 day year. The minimum monthly payment on the term note is $8,333 through February 1, 2011, with the balance of $1,600,000 payable on the maturity date. The Company is not obligated, except upon an event of default, to pay more than 25% of the original principal amount prior to June 30, 2011 (extended from February 13, 2011 as of March 28, 2011).
In June 2008, the Company and its subsidiary, Cancable Inc., entered into a financing transaction whereby the Company issued to Valens Offshore SPV II, Corp. (“Valens Offshore”) and Valens U.S. SPV I, LLC (“Valens U.S.”) secured term notes in the amount of $1,700,000 and $800,000, respectively (collectively, the “Company Second Notes”). Valens Offshore and Valens U.S. are entities related to Laurus. The Company also issued to Valens Offshore and Valens U.S. warrants to purchase up to 1,333,333 and 627,451 shares, respectively, of common stock of the Company at a price of $0.01 per share. The loans are secured by substantially all of the assets of the Company and all its subsidiaries, subject to the bank’s security interest (See Note 7).
Interest on the term notes for the year ended December 31, 2010 was $1,574,736 (2009: $1,488,439).
|
2010
|
2009
|
|||||||
|
Cancable Note interest at prime plus 1.75% (minimum of 7%), due December 31, 2011
|
$ | 5,148,754 | $ | 5,148,754 | ||||
|
Company Note interest at prime plus 2% (minimum of 7%), due June 30, 2011
|
7,287,500 | 7,287,500 | ||||||
|
Iview Note interest at prime plus 2% (minimum of 7%), due on June 30, 2011
|
1,614,874 | 1,714,874 | ||||||
|
Company Second Notes. interest at 12%, due on June 24, 2013
|
2,500,000 | 2,500,000 | ||||||
|
Less: unamortized discount
|
(797,782 | ) | (987,876 | ) | ||||
| 15,753,346 | 15,663,252 | |||||||
|
Less: current portion
|
14,051,128 | 1,750,000 | ||||||
| $ | 1,702,218 | $ | 13,913,252 | |||||
F-16
Scheduled maturities for the next three fiscal years are as follows:
|
Amount
|
||||
|
2011
|
$ | 14,051,128 | ||
|
2012
|
- | |||
|
2013
|
2,500,000 | |||
| $ | 16,551,128 | |||
9. Net Financing Expenses
|
2010
|
2009
|
|||||||
|
Capital leases
|
$ | 565,912 | $ | 654,854 | ||||
|
Interest on credit facility
|
1,574,136 | 1,488,439 | ||||||
|
Interest on deferred principal repayment on term notes –warrants
|
94,591 | 187,845 | ||||||
|
Other
|
53,240 | 51,673 | ||||||
| $ | 2,287,879 | $ | 2,382,811 | |||||
F-17
10. Obligations Under Capital Leases
|
2010
|
2009
|
|||||||
|
Obligation under capital lease – 6.5%, due April 2011, repayable $545 per vehicle principal and interest monthly, secured by 8 vehicles
|
$ | 50,244 | $ | 116,398 | ||||
|
Obligation under capital lease – 8.5%, due May 2011, repayable $478 per vehicle principal and interest monthly, secured by 1 vehicle
|
5,868 | 10,371 | ||||||
|
Obligation under capital lease – 14%, due September 2011, repayable $389 per vehicle principal and interest monthly, secured by 21 vehicles
|
69,724 | 145,378 | ||||||
|
Obligation under capital lease – 7.7%, due July 2012, repayable $543 per vehicle principal and interest monthly, secured by 2 vehicles
|
29,092 | 38,427 | ||||||
|
Obligation under capital lease – 7.9%, due March 2012, repayable $537 to $543 per vehicle principal and interest monthly, secured by 18 vehicles
|
236,467 | 350,647 | ||||||
|
Obligation under capital lease – 9.1%, due July 2012, repayable $425 per vehicle principal and interest monthly, secured by 12 vehicles
|
127,580 | 168,172 | ||||||
|
Obligation under capital lease – 7.8%, due July 2012, repayable $543 per vehicle principal and interest monthly, secured by 6 vehicles
|
87,276 | 115,281 | ||||||
|
Obligation under capital lease – 9.4%, due October 2012, repayable $471 per vehicle principal and interest monthly, secured by 2 vehicles
|
25,624 | 34,205 | ||||||
|
Obligation under capital lease – 15.6%, due January 2012, repayable $477 to $482 per vehicle principal and interest monthly, secured by 6 vehicles
|
52,448 | 77,207 | ||||||
|
Obligation under capital lease – 15.7%, due March 2012, repayable $462 to $479 per vehicle principal and interest monthly, secured by 20 vehicles
|
177,377 | 256,580 | ||||||
|
Obligation under capital lease – 15.6%, due February to March 2012, repayable $463 to $482 per vehicle principal and interest monthly, secured by 14 vehicles
|
127,365 | 196,677 | ||||||
|
Obligation under capital lease – 15.0%, due March 2012, repayable $493 per vehicle principal and interest monthly, secured by 6 vehicles
|
58,244 | 83,507 | ||||||
|
Obligation under capital lease – 15.6%, due April 2012, repayable $504 per vehicle principal and interest monthly, secured by 22 vehicles
|
224,542 | 331,743 | ||||||
|
Obligation under capital lease – 7.6% to 8.4%, due May 2012, repayable $372 to $433 per vehicle principal and interest monthly, secured by 2 vehicles
|
20,030 | 27,808 | ||||||
|
Obligation under capital lease – 15.6% to 15.9%, due May 2012, repayable $511 to $521 per vehicle principal and interest monthly, secured by 7 vehicles
|
74,949 | 119,210 | ||||||
|
Obligation under capital lease – 7.8%, due July 2012, repayable $543 per vehicle principal and interest monthly, secured by 7 vehicles
|
104,987 | 134,495 | ||||||
|
Obligation under capital lease – 7.9% to 10.3%, due July 2012, repayable $407 to $422 per vehicle principal and interest monthly, secured by 6 vehicles
|
58,744 | 96,246 | ||||||
|
Obligation under capital lease – 9.5% to 10.2%, due August 2012, repayable $455 to $468 per vehicle principal and interest monthly, secured by 4 vehicles
|
48,959 | 65,680 | ||||||
|
Obligation under capital lease – 8.9% to 10.2%, due September 2012, repayable $437 to $468 per vehicle principal and interest monthly, secured by 30 vehicles
|
360,385 | 500,744 | ||||||
|
Obligation under capital lease – 9.1%, due July 2012, repayable $425 per vehicle principal and interest monthly, secured by 14 vehicles
|
148,843 | 233,205 | ||||||
|
Obligation under capital lease – 32.3%, due January 2012, repayable $243 principal and interest monthly, secured by certain office equipment
|
2,333 | 4,282 | ||||||
|
Obligation under capital lease – 12.7%, due August 2013, repayable $2,415 principal and interest monthly, secured by certain office equipment
|
65,863 | 81,556 | ||||||
|
Obligation under capital lease – 13.4%, due July 2012, repayable $377 per vehicle principal and interest monthly, secured by 79 vehicles
|
820,618 | 1,033,455 | ||||||
|
Obligation under capital lease – 18.8%, due July 2012, repayable $323 per vehicle principal and interest monthly, secured by 32 vehicles
|
202,209 | 312,064 | ||||||
|
Obligation under capital lease – 21.7%, due July 2012, repayable $311 per vehicle principal and interest monthly, secured by 40 vehicles
|
207,213 | 413,806 | ||||||
|
Obligation under capital lease – 10.9%, due June 2010, repayable $540 per vehicle principal and interest monthly, secured by 1 vehicle
|
- | 8,782 | ||||||
|
Obligation under capital lease – 12.4%, due August 2010, repayable $371 per vehicle principal and interest monthly, secured by 4 vehicles
|
- | 10,817 | ||||||
|
Obligation under capital lease – 13.4%, due August 2010, repayable $371 per vehicle principal and interest monthly, secured by 4 vehicles
|
- | 10,785 | ||||||
|
Obligation under capital lease – 13.31%, due August 2010, repayable $371 per vehicle principal and interest monthly, secured by 6 vehicles
|
- | 16,178 | ||||||
|
Obligation under capital lease – 10.9%, due August 2010, repayable $572 per vehicle principal and interest monthly, secured by 1 vehicle
|
- | 9,292 | ||||||
|
Obligation under capital lease – 10.7%, due March 2011, repayable $507 per vehicle principal and interest monthly, secured by 1 vehicle
|
- | 6,769 | ||||||
|
Obligation under capital lease – 16.3%, due April 2011, repayable $604 principal and interest monthly, secured by certain office equipment
|
- | 8,642 | ||||||
|
Obligation under capital lease – 16.2%, due April 2011, repayable $466 principal and interest monthly, secured by certain office equipment
|
- | 4,689 | ||||||
|
Obligation under capital lease – 14.9%, due March 2010, repayable $361 per vehicle principal and interest monthly, secured by 17 vehicles
|
- | 21,809 | ||||||
| 3,386,984 | 5,044,907 | |||||||
|
Less amount due within one year included in current liabilities
|
1,487,460 | 1,501,106 | ||||||
| $ | 1,899,524 | $ | 3,543,801 | |||||
F-18
The future minimum lease payments are as follows:
|
2011
|
$ | 1,813,382 | ||
|
2012
|
1,989,358 | |||
|
2013
|
19,322 | |||
| 3,822,062 | ||||
|
Less imputed interest
|
435,078 | |||
| $ | 3,386,984 | |||
|
|
Interest expense for the year related to capital assets was $565,912 (2009 - $654,854).
|
11. Incomes Taxes
The Company's provision for (recovery of) income taxes is comprised as follows:
|
2010
|
2009
|
|||||||
|
U.S.
|
$ | - | $ | - | ||||
|
Canadian
|
||||||||
|
Current
|
- | - | ||||||
|
Deferred
|
- | - | ||||||
| $ | - | $ | - | |||||
Reconciliation to statutory rates is as follows:
|
2010
|
2009
|
|||||||
|
Income (loss) before income taxes
|
||||||||
|
Income (loss) from U.S. sales
|
$ | (841,569 | ) | $ | (1,927,193 | ) | ||
|
Income (loss) from Canadian sales
|
159,762 | 328,001 | ||||||
| (681,807 | ) | (1,599,192 | ) | |||||
|
Statutory tax rates for U.S.
|
41.0 | % | 41.00 | % | ||||
|
Statutory tax rates for Canadian Federal
|
30.0 | % | 33.0 | % | ||||
The Company has unutilized taxable losses in the United States available for carry forward to reduce net income of approximately $27,000,000, which expire in various years between 2021 and 2030. In addition, the Company has unutilized taxable losses in the Canadian taxes available for carry forward to reduce net income of approximately $4,100,000 otherwise payable in future years which begin to expire in 2014 through 2030.
|
2010
|
2009
|
|||||||||||||||
|
Expected income tax expense (recovery)
|
$ | (296,903 | ) | (43.6 | )% | $ | (740,742 | ) | (46.3 | )% | ||||||
|
Increase (decrease) in taxes resulting from:
|
||||||||||||||||
|
Valuation allowances
|
147,249 | 21.6 | % | 834,966 | 52.2 | % | ||||||||||
|
Permanent differences
|
106,388 | 15.6 | % | 87,470 | 5.5 | % | ||||||||||
|
Small business and other tax rate reductions
|
43,266 | 6.4 | % | (181,694 | ) | (11.4 | )% | |||||||||
|
Income tax expenses (recovery)
|
$ | - | - | $ | - | - | ||||||||||
F-19
The tax effects of temporary differences that give rise to significant portions of the deferred tax assets and deferred tax liabilities as of December 31, 2010 and 2009 are presented below:
|
2010
|
2009
|
|||||||
|
Assets
|
||||||||
|
Tax benefits on losses carried forward under U.S. tax rate
|
10,020,000 | 10,927,734 | ||||||
|
Tax benefits on losses carried forward under Canadian tax rate
|
1,345,000 | 1,266,264 | ||||||
|
Accounting depreciation in excess of tax depreciation
|
37,430 | 35,343 | ||||||
|
Other
|
- | - | ||||||
| 11,402,430 | 12,229,341 | |||||||
|
Less: valuation allowance
|
(11,365,000 | ) | (12,193,998 | ) | ||||
| 37,430 | 35,343 | |||||||
|
Less: current portion
|
- | - | ||||||
| $ | 37,430 | $ | 35,343 | |||||
|
Liabilities
|
||||||||
|
Income tax depreciation in excess of accounting depreciation
|
$ | - | $ | - | ||||
|
Other
|
25,858 | 25,858 | ||||||
| 25,858 | 25,858 | |||||||
|
Less: current portion
|
(25,858 | ) | (25,858 | ) | ||||
| $ | - | $ | - | |||||
|
Net deferred income taxes
|
||||||||
|
2010
|
2009
|
|||||||
|
Current
|
||||||||
|
Assets
|
$ | - | $ | - | ||||
|
Liabilities
|
(25,858 | ) | (25,858 | ) | ||||
| $ | (25,858 | ) | $ | (25,858 | ) | |||
|
Long-term
|
||||||||
|
Assets
|
$ | 37,430 | $ | 35,343 | ||||
|
Liabilities
|
- | - | ||||||
| $ | 37,430 | $ | 35,343 | |||||
| $ | 11,572 | $ | 9,485 | |||||
12. Warranty
As part of an installation, the Company has provides its customers with warranties. The warranties generally extend ninety days labor and one year on equipment from the date of project completion. The provision for warranty liabilities which is included in accrued expenses is as follows:
|
2010
|
2009
|
|||||||
|
Balance, beginning of year
|
$ | 38,095 | $ | 32,787 | ||||
|
Expenses incurred
|
(29,000 | ) | (32,000 | ) | ||||
|
Provision made
|
30,905 | 37,308 | ||||||
|
Balance, end of year
|
$ | 40,000 | $ | 38,095 | ||||
F-20
13. Shareholders’ (Deficit)
Options
In conjunction with the issuance of the Cancable Note and Iview Notes in 2006, the Company had granted Laurus options to purchase up to 49% of Cancable Holding Corp. and 20% of Iview Holding Corp. The financial statements of Cancable Holding Corp. and Iview Holding Corp. have negative equity on a stand alone basis. At such time when these entities have positive equity and generate net income, the Company will account for the options granted to Laurus as non-controlling interests.
The Company’s Stock Option Plan is intended to provide incentives for key employees, directors, consultants and other individuals providing services to the Company by encouraging their ownership of the common stock of the Company and to aid the Company in retaining such key employees, directors, consultants and other individuals upon whose efforts the Company’s success and future growth depends and in attracting other such employees, directors, consultants and individuals.
The Plan is administered by the Board of Directors, or its Compensation Committee. Under the Plan, options on a total of 4,000,000 shares of common stock may be issued. Shares of common stock covered by options which have terminated or expired prior to exercise are available for further options under the Plan. The maximum aggregate number of shares of Stock that may be issued under the Plan as “incentive stock options” is 3,500,000 shares. No options may be granted under the Plan after June 30, 2011; provided, however, that the Board of Directors may at any time prior to that date amend the Plan.
Options under the Plan may be granted to key employees of the Company, including officers or directors of the Company, and to consultants and other individuals providing services to the Company. Options may be granted to eligible individuals whether or not they hold or have held options previously granted under the Plan or otherwise granted or assumed by the Company. In selecting individuals for options, the Committee may take into consideration any factors it may deem relevant, including its estimate of the individual’s present and potential contributions to the success of the Company.
The Committee may, in its discretion, prescribe the terms and conditions of the options to be granted under the Plan, which terms and conditions need not be the same in each case, subject to the following:
|
a.
|
Option Price. The price at which each share of common stock covered by an option granted under the Plan may not be less than the market value per share of the common stock on the date of grant of the option. The date of the grant of an option shall be the date specified by the Committee in its grant of the option, which date will normally be the date the Committee determines to make such grant.
|
|
b.
|
Option Period. The period for exercise of an option shall in no event be more than five years from the date of grant. Options may, in the discretion of the Committee, be made exercisable in installments during the option period.
|
|
c.
|
Exercise of Options. For the purpose of assisting an Optionee to exercise an option, the Company may make loans to the Optionee or guarantee loans made by third parties to the Optionee, on such terms and conditions as the Board of Directors may authorize.
|
|
d.
|
Lock-Up Period. Without the consent of the Company, an Optionee may not sell more than fifty percent of the shares issued under the Plan for a period of two years from the date that the Optionee exercises the option. The Committee may also impose other terms and conditions, not inconsistent with the terms of the Plan, on the grant or exercise of options, as it deems advisable.
|
F-21
The fair value of each option award is estimated on the date of grant using the Black-Scholes option valuation model, using the assumptions noted in the following table. Expected volatility is based on the historical volatility of the Company’s stock, and other factors. The Company uses historical data to estimate employee termination within the valuation model. The Company has assumed that the life of the options will be equal to one-half of the combined vesting period and contractual life (i.e., that employees will exercise the options at the midpoint between the vesting and expiry date of the options). The risk-free rates used to value the options are based on the U.S. Treasury yield curve in effect at the time of grant.
At December 31, 2010, options to purchase 1,600,000 shares of common stock were outstanding. These options vest ratably in annual installments, over the four year period from the date of grant. As of December 31, 2010, there was $23,483 of total unrecognized compensation cost related to non-vested share-based compensation arrangements granted under the Plan. That cost is expected to be recognized over a remaining weighted average period of 1.04 years. At December 31, 2010, 1,382,500 options were vested. The cost recognized for the twelve months period ended December 31, 2010 was $55,770 (2009: $10,524) which was recorded as general and administrative expenses.
In valuing the options issued, the following assumptions were used;
|
2009
|
||||
|
Expected volatility
|
140 | % | ||
|
Expected dividends
|
0 | % | ||
|
Expected term (in years)
|
4.0 | |||
|
Risk-free rate
|
1.35% - 1.82 | % | ||
A summary of option activity under the Plan during the period ended December 31, 2010 and 2009 is presented below:
|
Shares
|
Weighted-Average
Exercise
Price
|
Weighted-Average
Remaining
Contractual
Term
|
Intrinsic
Value
|
|||||||||||||
|
Outstanding at December 31, 2008
|
2,939,000 | $ | 1.22 | 4.75 | - | |||||||||||
|
Granted
|
500,000 | $ | 0.70 | 4.23 | - | |||||||||||
|
Exercised
|
- | - | - | - | ||||||||||||
|
Forfeited or expired
|
(1,434,000 | ) | $ | 2.07 | 2.69 | - | ||||||||||
|
Outstanding at December 31, 2009
|
2,005,000 | $ | 0.65 | 4.75 | - | |||||||||||
|
Granted
|
- | - | - | - | ||||||||||||
|
Exercised
|
- | - | - | - | ||||||||||||
|
Forfeited or expired
|
(405,000 | ) | $ | 0.63 | 0.96 | - | ||||||||||
|
Outstanding at December 31, 2010
|
1,600,000 | $ | 0.65 | 1.04 | - | |||||||||||
|
Exercisable at December 31, 2010
|
1,382,500 | $ | 0.65 | 0.68 | - | |||||||||||
As of December 31, 2010, the aggregate intrinsic value of all stock options outstanding and expected to vest was approximately $0.00 and the aggregate intrinsic value of currently exercisable stock options was approximately $0.00. The intrinsic value of each option is the difference between the fair market value of the common stock and the exercise price of such option to the extent it is “in-the-money”. Aggregate intrinsic value represents the value that would have been received by the holders of in-the-money options had they exercised their options on the last trading day of the year and sold the underlying shares at the closing stock price on such day. The intrinsic value calculation is based on the $0.03 closing stock price of the common stock on December 31, 2010, the last trading day of the second quarter of fiscal 2010. There were no in-the-money options outstanding and exercisable as of December 31, 2010.
Since there were no options exercised during the year ended December 31, 2009 or 2010, there was no intrinsic value of options exercised.
F-22
The total fair value of options granted during the year ended December 31, 2010 and 2009 was approximately $0 (none were granted in 2010) and $120,153, respectively.
The following table summarizes information about fixed price stock options at December 31, 2010:
|
Exercise
Price
|
Weighted Average
Number Outstanding
|
Weighted
Average
Contractual
Lives
|
Weighted
Average
Exercise Prices
|
Number
Exercisable
|
Exercise
Prices
|
|||||||||||||||||
| $ | 0.63 | 1,490,000 | 1.03 | $ | 0.63 | 1,302,500 | $ | 0.63 | ||||||||||||||
| $ | 0.90 | 100,000 | 1.17 | $ | 0.90 | 75,000 | $ | 0.90 | ||||||||||||||
| $ | 1.12 | 10,000 | 2.48 | $ | 1.12 | 5,000 | $ | 1.12 | ||||||||||||||
| 1,600,000 | 1,382,500 | |||||||||||||||||||||
The number and weighted average grant-date fair value of options non-vested at the beginning of the year, non-vested at the end of the year and granted, vested or canceled during the year ended December 31, 2010 was as follows:
|
Number of Options
|
Weighted-Average
Grant Date Fair Values
|
|||||||
|
Non-vested at January 1, 2010
|
717,750 | $ | 0.21 | |||||
|
Granted
|
- | - | ||||||
|
Vested
|
(399,000 | ) | $ | 0.22 | ||||
|
Canceled
|
(101,250 | ) | $ | 0.23 | ||||
|
Non-vested at December 31, 2010
|
217,500 | $ | 0.17 | |||||
Warrants
The Company uses the Black-Scholes option pricing model to value warrants issued to non-employees, based on the market price of our common stock at the time the warrants are issued. All outstanding warrants may be exercised by the holder at any time. During the twelve months ended December 31, 2010, in connection with financing, the Company issued warrants to purchase 1,496,000 shares of common stock. The warrants are fixed and contain standard antidilution provision with no ratchet provisions. The fair value of the warrants of $99,642 was measured using the Black-Scholes option pricing model using the following assumptions: risk free interest rate of 0.84% to 2.20%, expected dividend yield of 0%, volatility of 140% to 150%, exercise prices of $0.03 to $0.28 and the life of the warrants 4 years.
As of December 31, 2010, we had the following common stocks warrants outstanding:
F-23
|
Issue Date
|
Expiry Date
|
Number of
warrants
|
Exercise Price
Per share
|
Value-issue
date
|
Issued for
|
|||||||||||
|
09-30-2004
|
09-30-2016 | 2,250,000 | $ | 1.15 | $ | 1,370,000 |
Financing
|
|||||||||
|
03-31-2005
|
03-31-2012 | 100,000 | $ | 1.20 | $ | 60,291 |
Financing
|
|||||||||
|
04-30-2005
|
04-30-2017 | 100,000 | $ | 1.01 | $ | 44,309 |
Financing
|
|||||||||
|
05-31-2005
|
05-31-2012 | 100,000 | $ | 1.01 | $ | 56,614 |
Financing
|
|||||||||
|
06-22-2005
|
06-22-2017 | 313,000 | $ | 1.00 | $ | 137,703 |
Financing
|
|||||||||
|
06-30-2005
|
06-30-2017 | 100,000 | $ | 0.90 | $ | 50,431 |
Financing
|
|||||||||
|
07-31-2005
|
07-31-2012 | 100,000 | $ | 1.05 | $ | 56,244 |
Financing
|
|||||||||
|
08-31-2005
|
08-31-2012 | 100,000 | $ | 1.05 | $ | 22,979 |
Financing
|
|||||||||
|
09-30-2005
|
09-30-2012 | 100,000 | $ | 0.80 | $ | 36,599 |
Financing
|
|||||||||
|
10-31-2005
|
10-31-2012 | 100,000 | $ | 0.80 | $ | 27,367 |
Financing
|
|||||||||
|
11-30-2005
|
11-30-2012 | 100,000 | $ | 0.80 | $ | 16,392 |
Financing
|
|||||||||
|
12-31-2005
|
12-31-2012 | 100,000 | $ | 0.80 | $ | 10,270 |
Financing
|
|||||||||
|
02-13-2006
|
02-13-2016 | 1,927,096 | $ | 0.01 | $ | 1,529,502 |
Financing
|
|||||||||
|
03-01-2007
|
03-01-2016 | 108,000 | $ | 0.90 | $ | 39,519 |
Financing
|
|||||||||
|
04-01-2007
|
04-01-2016 | 108,000 | $ | 1.15 | $ | 50,529 |
Financing
|
|||||||||
|
05-01-2007
|
05-01-2011 | 108,000 | $ | 1.25 | $ | 54,941 |
Financing
|
|||||||||
|
06-01-2007
|
06-01-2011 | 108,000 | $ | 2.28 | $ | 101,470 |
Financing
|
|||||||||
|
07-01-2007
|
07-01-2011 | 108,000 | $ | 2.10 | $ | 93,307 |
Financing
|
|||||||||
|
08-01-2007
|
08-01-2011 | 108,000 | $ | 2.55 | $ | 112,117 |
Financing
|
|||||||||
|
09-01-2007
|
09-01-2011 | 108,000 | $ | 2.73 | $ | 118,647 |
Financing
|
|||||||||
|
10-01-2007
|
10-01-2011 | 108,000 | $ | 2.43 | $ | 105,362 |
Financing
|
|||||||||
|
11-01-2007
|
11-01-2011 | 108,000 | $ | 2.60 | $ | 111,868 |
Financing
|
|||||||||
|
12-01-2007
|
12-01-2011 | 108,000 | $ | 2.55 | $ | 107,284 |
Financing
|
|||||||||
|
01-01-2008
|
01-01-2012 | 108,000 | $ | 2.84 | $ | 108,331 |
Financing
|
|||||||||
|
01-22-2008
|
01-22-2058 | 812,988 | $ | 0.01 | $ | 1,470,687 |
Acquisition
|
|||||||||
|
01-22-2008
|
01-22-2058 | 1,738,365 | $ | 0.01 | $ | 3,144,685 |
Financing
|
|||||||||
|
01-30-2008
|
01-30-2058 | 506,250 | $ | 0.01 | $ | 1,001,909 |
Financing
|
|||||||||
|
01-30-2008
|
01-30-2058 | 292,500 | $ | 0.01 | $ | 578,880 |
Financing
|
|||||||||
|
02-01-2008
|
02-01-2012 | 108,000 | $ | 2.09 | $ | 85,612 |
Financing
|
|||||||||
|
03-01-2008
|
03-01-2012 | 108,000 | $ | 2.04 | $ | 80,253 |
Financing
|
|||||||||
|
04-01-2008
|
04-01-2012 | 108,000 | $ | 1.09 | $ | 162,748 |
Financing
|
|||||||||
|
05-01-2008
|
05-01-2012 | 108,000 | $ | 1.19 | $ | 103,180 |
Financing
|
|||||||||
|
06-01-2008
|
06-01-2012 | 108,000 | $ | 1.02 | $ | 88,114 |
Financing
|
|||||||||
|
06-23-2008
|
06-23-2018 | 627,451 | $ | 0.01 | $ | 560,736 |
Financing
|
|||||||||
|
06-23-2008
|
06-23-2018 | 1,333,333 | $ | 0.01 | $ | 1,211,168 |
Financing
|
|||||||||
|
02-01-2009
|
02-01-2013 | 108,000 | $ | 0.25 | $ | 22,728 |
Financing
|
|||||||||
|
03-01-2009
|
03-01-2013 | 108,000 | $ | 0.19 | $ | 17,277 |
Financing
|
|||||||||
|
04-01-2009
|
04-01-2013 | 108,000 | $ | 0.18 | $ | 15,868 |
Financing
|
|||||||||
|
05-01-2009
|
05-01-2013 | 108,000 | $ | 0.16 | $ | 14,557 |
Financing
|
|||||||||
|
06-01-2009
|
06-01-2013 | 108,000 | $ | 0.27 | $ | 24,105 |
Financing
|
|||||||||
|
07-01-2009
|
07-01-2013 | 108,000 | $ | 0.27 | $ | 24,105 |
Financing
|
|||||||||
|
08-01-2009
|
08-01-2013 | 108,000 | $ | 0.25 | $ | 22,786 |
Financing
|
|||||||||
|
09-01-2009
|
09-01-2013 | 108,000 | $ | 0.16 | $ | 14,567 |
Financing
|
|||||||||
|
10-01-2009
|
10-01-2013 | 108,000 | $ | 0.12 | $ | 10,921 |
Financing
|
|||||||||
|
11-01-2009
|
11-01-2013 | 108,000 | $ | 0.15 | $ | 13,656 |
Financing
|
|||||||||
|
12-01-2009
|
12-01-2013 | 108,000 | $ | 0.08 | $ | 7,275 |
Financing
|
|||||||||
|
01-01-2010
|
01-01-2014 | 108,000 | $ | 0.08 | $ | 7,292 |
Financing
|
|||||||||
|
02-01-2010
|
02-01-2014 | 108,000 | $ | 0.12 | $ | 10,925 |
Financing
|
|||||||||
|
03-01-2010
|
03-01-2014 | 108,000 | $ | 0.08 | $ | 25,484 |
Financing
|
|||||||||
|
04-01-2010
|
04-01-2014 | 108,000 | $ | 0.09 | $ | 8,461 |
Financing
|
|||||||||
|
05-01-2010
|
05-01-2014 | 108,000 | $ | 0.07 | $ | 8,457 |
Financing
|
|||||||||
|
06-01-2010
|
06-01-2014 | 108,000 | $ | 0.07 | $ | 6,572 |
Financing
|
|||||||||
|
07-01-2010
|
07-01-2014 | 108,000 | $ | 0.07 | $ | 6,566 |
Financing
|
|||||||||
|
08-01-2010
|
08-01-2014 | 108,000 | $ | 0.07 | $ | 6,562 |
Financing
|
|||||||||
|
09-01-2010
|
09-01-2014 | 108,000 | $ | 0.05 | $ | 4,615 |
Financing
|
|||||||||
|
10-01-2010
|
10-01-2014 | 108,000 | $ | 0.05 | $ | 4,613 |
Financing
|
|||||||||
|
11-01-2010
|
11-01-2014 | 108,000 | $ | 0.04 | $ | 1,844 |
Financing
|
|||||||||
|
12-01-2010
|
12-01-2014 | 108,000 | $ | 0.04 | $ | 3,200 |
Financing
|
|||||||||
|
12-31-2010
|
12-31-2014 | 200,000 | $ | 0.03 | $ | 5,051 |
Consulting
|
|||||||||
| 15,212,983 | ||||||||||||||||
F-24
During the year ended December 31, 2010, the Company derived 56.2% (2009 – 47.2%) of its revenue from a single customer. The accounts receivable from this customer comprises 34.8% (2009: 33.9%) of the total trade receivables.
15. Segment Information
We determine and disclose our segments in accordance with The “Segment Reporting” topic of the Financial Accounting Standards Board Standards Codification, which uses a “management” approach for determining segments. The management approach designates the internal organization that is used by management for making operating decisions and assessing performance as the source of the reportable segments. Our management reporting structure provides for the following segments:
Cancable
Cancable Inc. and its wholly owned subsidiaries XL Digital Services, Inc. and 2141306 Ontario Inc are Canadian based entities. Cancable, Inc. is a US based entity which is also the wholly owned subsidiary of Cancable Inc. (collectively, “Cancable”). Cancable is in the business of providing deployment and servicing of broadband technologies in both residential and commercial markets. The Cancable service offering, network deployment, IT integration, and support services, enable the cable television and telecommunications industries to deliver a high quality broadband experience to their customers. Cancable’s clients rely on Cancable’s knowledge and expertise to rapidly deploy the latest technologies to support advanced cable services, cable broadband Internet access and DSL. Services provisioned include new installations, reconnections, disconnections, service upgrades and downgrades, inbound technical call center sales and trouble resolution for cable Internet subscribers, and network servicing for broadband video, data, and voice services for residential, business, and commercial marketplaces.
F-25
AC Technical
A.C. Technical Systems Ltd. (“AC Technical”), a corporation incorporated under the laws of the Province of Ontario, is engaged in the engineering, design, installation, integration and servicing of various types of security systems.
Iview DSI
Iview Digital Video Solutions Inc. (“Iview DSI”) and its wholly owned subsidiary OSSIM View Inc. are corporations incorporated under the laws of the Province of Ontario, provide video surveillance products and technologies to the market.
|
December 31,
2010
|
December 31,
2009
|
|||||||
|
SALES:
|
||||||||
|
Cancable
|
$ | 32,715,322 | $ | 32,380,035 | ||||
|
AC Technical
|
7,090,054 | 7,145,760 | ||||||
|
Iview
|
58,699 | 140,996 | ||||||
|
Creative Vistas, Inc.
|
2,410 | 102,006 | ||||||
|
Consolidated Total
|
$ | 39,866,485 | $ | 39,768,797 | ||||
|
DEPRECIATION AND AMORTIZATION:
|
||||||||
|
Cancable
|
$ | 2,143,166 | $ | 2,569,724 | ||||
|
AC Technical
|
41,863 | 37,002 | ||||||
|
Iview
|
40,602 | 36,393 | ||||||
|
Consolidated Total
|
$ | 2,225,631 | $ | 2,643,119 | ||||
|
INTEREST EXPENSE:
|
||||||||
|
Cancable
|
$ | 1,503,717 | $ | 1,501,388 | ||||
|
Iview
|
119,122 | 124,378 | ||||||
|
AC Acquisition
|
53,240 | 51,673 | ||||||
|
Creative Vistas, Inc.
|
611,800 | 705,372 | ||||||
|
Consolidated Total
|
$ | 2,287,879 | 2,382,811 | |||||
|
NET INCOME (LOSS):
|
||||||||
|
Cancable
|
$ | (25,745 | ) | $ | (1,473,085 | ) | ||
|
AC Technical
|
293,583 | 441,443 | ||||||
|
Iview
|
(273,297 | ) | (27,375 | ) | ||||
|
AC Acquisition
|
(53,240 | ) | (51,676 | ) | ||||
|
Corporate (1)
|
(623,108 | ) | (458,499 | ) | ||||
|
Consolidated Total
|
$ | (681,807 | ) | $ | (1,599,192 | ) | ||
|
TOTAL ASSETS
|
||||||||
|
Cancable
|
$ | 6,836,877 | $ | 10,288,086 | ||||
|
AC Technical
|
2,927,750 | 2,769,277 | ||||||
|
Iview
|
511,857 | 918,761 | ||||||
|
Creative Vistas, Inc.
|
994,376 | 1,807,944 | ||||||
|
Consolidated Total
|
$ | 11,270,860 | $ | 15,784,068 | ||||
|
CAPITAL ASSETS
|
||||||||
|
Cancable
|
$ | 3,616,864 | $ | 5,841,698 | ||||
|
AC Technical
|
768,918 | 767,117 | ||||||
|
Iview
|
21,957 | 60,738 | ||||||
|
Consolidated Total
|
$ | 4,407,739 | $ | 6,669,553 | ||||
|
Capital Expenditures
|
||||||||
|
Cancable
|
$ | 124,621 | $ | 1,973,482 | ||||
|
AC Technical
|
6,375 | 19,759 | ||||||
|
Iview
|
- | 4,405 | ||||||
|
AC Acquisition
|
- | - | ||||||
|
Consolidated Total
|
$ | 130,996 | $ | 1,997,646 | ||||
F-26
|
(1)
|
Corporate expenses primarily include certain stock-based compensation for consulting and advisory services, the amortization of the discount on debt, and amortization of intangible assets, which we do not internally allocate to our segments because they are related to our common stock and are non-cash in nature.
|
Revenues by geographic destination and product group were as follows:
|
December 31,
2010
|
December 31,
2009
|
|||||||
|
Contract
|
$ | 5,683,974 | $ | 5,812,671 | ||||
|
Service
|
34,179,089 | 33,943,128 | ||||||
|
Others
|
3,422 | 12,998 | ||||||
|
Total sales to external customers
|
$ | 39,866,485 | $ | 39,768,797 | ||||
Revenue generated by the Company in Canada and the United States was $34,035,470 (2009: $32,696,096) and $5,790,500 (2009: $7,072,701), respectively.
18. Commitments
The Company has entered into contracts for certain consulting services providing for monthly payments with the Companies controlled by the CEO and the president’s spouse. In addition, the Company has also entered into an operating lease for its premises, vehicles, computers and office equipment. The total minimum annual payments for the next five years are as follows:
|
Total
|
2011
|
2012
|
2013
|
|||||||||||||
|
Operating leases
|
$ | 1,247,259 | $ | 590,237 | $ | 459,635 | $ | 197,387 | ||||||||
|
Commitments related to consulting agreements
|
1,210,000 | 605,000 | 605,000 | - | ||||||||||||
| $ | 2,457,259 | $ | 1,195,237 | $ | 1,064,635 | $ | 197,387 | |||||||||
19. Subsequent Events
Subsequent to year end, the Company issued 324,000 warrants to Laurus to defer the monthly principal repayment from January to March 2011. The warrants are exercisable at $0.03 per share and have a 4 year term.
F-27
ITEM 9. CHANGES IN AND DISAGREEMENTS WITH ACCOUNTANTS ON ACCOUNTING AND FINANCIAL DISCLOSURE
None.
|
ITEM 9A.
|
CONTROLS AND PROCEDURES
|
Evaluation of Disclosure Controls and Procedures We maintain disclosure controls and procedures that are designed to ensure that information required to be disclosed in our filings under the Securities Exchange Act of 1934, as amended, is recorded, processed, summarized and reported within the periods specified in the rules and forms of the SEC. This information is accumulated to allow timely decisions regarding required disclosure. As of December 31, 2010, the end of the period covered by this annual report on Form 10K, our management, including our Chief Executive Officer and Chief Financial Officer, assessed the effectiveness of our disclosure controls and procedures, as such terms are defined under rules 13a-15(e) and 15d-15(e) promulgated under the Securities Exchange Act of 1934, as amended. Based on this assessment, our management concluded that our disclosure controls and procedures were effective as of the end period covered by this annual report.
Management’s Annual Report on Internal Control over Financial Reporting Our management is responsible for establishing and maintaining adequate internal control over financial reporting (as defined in Rule 13a-15(f) under the Securities Exchange Act of 1934, as amended). Our management assessed the effectiveness over internal control over financial reporting as of December 31, 2010. In making this assessment, our management used the criteria set forth by the Committee of Sponsoring Organizations of the Treadway Commission (“COSO”) in Internal Control - Integrated Framework issued in 1992, to evaluate the effectiveness of our internal control over financial reporting. Based upon that framework management has determined that our internal control over financial reporting is effective.
This annual report does not include an attestation report of the company’s registered public accounting firm regarding internal control over financial reporting. Management’s report was not subject to attestation by the company’s registered public accounting firm pursuant to temporary rules of the Securities and Exchange Commission that permit the company to provide only management’s report in this annual report.
Changes in Internal Control Over Financial Reporting There has not been any change in our internal control over financial reporting (as such term is defined in Rules 13a-15(f) and 15d-15(f) under the Exchange Act) during our fourth fiscal quarter that has materially affected, or is reasonably likely to materially affect, our internal control over financial reporting.
|
ITEM 9B.
|
OTHER INFORMATION
|
None
|
ITEM 10.
|
DIRECTORS, EXECUTIVE OFFICERS, PROMOTERS AND CORPORATE GOVERNANCE
|
Directors and Executive Officers
|
Name
|
Age
|
Position
|
||
|
Sayan Navaratnam
|
36
|
Chairman of the Board, and Director
|
||
|
Dominic Burns
|
51
|
Chief Executive Officer, President and Director
|
||
|
Heung Hung Lee
|
|
42
|
|
Chief Financial Officer, Secretary and Director
|
27
Sayan Navaratnam–Director and Chairman of the Board: Mr. Navaratnam serves as our Chairman of the Board and Director. He has been a Director of our company since 2004. He served as Chief Executive Officer of our company from 2004 until he resigned from the position on May 5, 2008, remaining Chairman and Director. Mr. Navaratnam joined AC Technical Systems in 2003 as Chief Executive Officer. He has eight years of experience in technology development and integration specific to the security industry. He also has three years of experience in telecommunications with Bell Canada. From 1997 to 2000, he was the Chief Executive Officer of Satellite Communications Inc., and its research arm Satellite Advanced Technologies. Mr. Navaratnam was responsible for coordinating and financing research and development projects and played a key role in strategic partnerships, mergers, and licensing technologies. From 2000 to 2003, Mr. Navaratnam was the Chief Operating Officer in ASPRO Technologies Ltd.. Since March 1, 2009, Mr. Navaratnam has been a Senior Managing Director of Laurus Capital Management, LLC and a Senior Managing Director of Valens Capital Management, LLC, entities affiliated with our principal lender. Mr. Navaratnam currently serves on the board of a number of privately-held companies including our subsidiaries, AC Technical Systems and Iview Digital Video Solutions, and Cygnal Technologies, White Radio, and Thinkpath. Mr. Navaratnam also servies on the board of Petroalgae Inc., a public company. Mr. Navaratnam graduated from the University of Toronto with an Honors Double Specialist degree in economics and political science.
Dominic Burns–Director, President and Chief Executive Officer: Mr. Burns is our CEO and Director. He founded AC Technical in 1991. He completed his Electrical Apprenticeship program at one of the premier firms in Northern Ireland. He graduated from Belfast College of Technology with honors in City and Guilds Electrical Theory and Regulations. Mr. Burns also holds a diploma in radio and navigation systems. He has an extensive understanding of quality controls in the avionics industry and has been a pioneer in transferring some of the high standards and controls set in the avionics industry to the security integration market. He has been the President of AC Technical since its inception. He has been primarily responsible for expanding the firm's presence in Canada. Mr. Burns has also designed a number of internal technical and marketing programs to expand AC Technical's sales and technical capabilities. Mr. Burns has over 20 years of experience in the security integration industry. Mr. Burns has been a director and President of our company since September 30, 2004. He was appointed Chief Executive Officer on May 5, 2008.
Heung Hung Lee–Director, Chief Financial Officer and Secretary: Ms. Lee joined AC Technical in July 2004 and she has more than 10 years experience in international public accounting primarily with large international accounting firms. She has advanced knowledge in financial statements disclosure and audit issues and has extensive international business experience in countries such as the United States, Hong Kong SAR and the Peoples' Republic of China. She was a manager at BDO Dunwoody LLP from 1999 to 2004. Ms. Lee holds a Bachelor of Business degree from Monash University in Australia. She is a Chartered Accountant in Canada and qualified CPA in Australia. Ms. Lee has been the Chief Financial Officer of our company since September 30, 2004. Ms. Lee was appointed a director of our company on November 1, 2008. Ms. Lee is responsible for review of financials of subsidiaries and creating and implementing strong financial systems within the group of companies. Ms. Lee is also an important member in our growth strategy as she is highly involved in creating a platform for growth within Creative Vistas, Inc.
Board of Directors and Officers
Each director is elected until the next annual meeting of the registrant and until his or her successor is duly elected and qualified. Officers are elected by, and serve at the discretion of, the board of directors. The board of directors may also appoint additional directors up to the maximum number permitted under our by-laws. A director so chosen or appointed will hold office until the next annual meeting of stockholders.
Each executive officer serves at the discretion of the board of directors and holds office until his or her successor is elected or until his or her earlier resignation or removal in accordance with our certificate of incorporation and by-laws.
Committees of the Board of Directors
We do not have standing audit, nominating or compensation committees, or committees performing similar functions. Our board of directors believes that it is not necessary to have standing audit, nominating or compensation committees at this time because the functions of such committees are adequately performed by our board of directors.
28
Code of Ethics
The Company has adopted a code of ethics for officers and employees, which applies to, among others, the Company’s principal executive officer, principal financial officer, and controller, and which is known as the code of ethics. The Company has also adopted certain ethical principles and policies for its directors, which are set forth in the code of ethics. The Company will provide copies of the code of ethics without charge upon request made to Creative Vistas, 2100 Forbes Street, Unit 8-10 Whitby, Ontario, Canada L1N 9T3 or by calling (905) 666-8676.
|
ITEM 11.
|
EXECUTIVE COMPENSATION
|
The following summary compensation table set forth all compensation paid by us during the two years ended December 31, 2010 for services rendered in all capacities by the Chief Executive Officer and Chief Financial Officers of the Company and the only other executive officer who received total salary and bonus exceeding $100,000 in any of such years.
|
Annual Compensation
|
||||||||||||||
|
Name and Principal
Company/Subsidiary Position
|
Year
|
Salary ($)
|
Other Annual
Compensation ($)
|
Bonus ($)
|
||||||||||
|
Sayan Navaratnam – Chairman
|
2010
|
320,388 | 1 | – | – | |||||||||
|
|
2009
|
289,875 | 1 | – | – | |||||||||
|
Dominic Burns – Chief Executive Officer
|
2010
|
266,990 | 2 | – | – | |||||||||
|
2009
|
241,563 | 2 | – | – | ||||||||||
|
Heung Hung Lee – Chief Financial Officer
|
2010
|
145,631 | – | – | ||||||||||
|
2009
|
126,700 | – | – | |||||||||||
1 Balance was payable to Nationwide Solutions Inc. for consulting fees.
2Balance was payable to 1608913 Ontario Inc. for consulting fees.
Employment Agreements
On July 16, 2008, the Company entered into a Consulting Agreement (the “Consulting Agreement”) with Nationwide Solutions Inc. (“Nationwide”) pursuant to which Nationwide will provide general business consulting services including business development, formalizing reports and negotiating or preparing sales agreements, vendor agreements, business plans, budgets, business presentations, finance agreements and equity agreements. The Consulting Agreement will terminate on July 16, 2012 unless extended or earlier terminated pursuant to the terms of the Consulting Agreement. We will pay to Nationwide an annual consulting fee of CAD$325,000 for each calendar year during the term of the Consulting Agreement. The chairman of the board of Nationwide, Sayan Navaratnam, is also the chairman of the board of the Registrant.
On January 1, 2010, the Company entered into a Consulting Agreement (the “Consulting Agreement”) with 1608913 Ontario Inc. pursuant to which 1608913 Ontario Inc. will provide general business consulting services including business development, formalizing reports and negotiating or preparing sales agreements, vendor agreements, business plans, budgets, business presentations, finance agreements and equity agreements. The Consulting Agreement will terminate on December 31, 2012 unless extended or earlier terminated pursuant to the terms of the Consulting Agreement. We will pay to 1608913 Ontario Inc. an annual consulting fee of CAD$275,000 for each calendar year during the term of the Consulting Agreement. Dominic Burn’s spouse is the only beneficial owner of 1608913 Ontario Inc. and Dominic Burns is also the Chief Executive Officer, President and Director of the Registrant.
1608913 Ontario Inc. and Nationwide Solutions Inc. were structured for the personal tax benefit of Mr. Burns and Mr. Navaratnam, respectively. Under Canadian tax law, there are potential income tax benefits to Mr. Burns and Mr. Navaratnam from structuring their relationship to us as Consulting Agreements between us and each of 1608913 Ontario Inc. and Nationwide Solutions Inc. instead of them being employed directly by us. This structure does not have any effect on Creative Vistas.
29
The consulting services provided to us by Mr. Navaratnam and Mr. Burns relate to the management of the Company including sales and marketing, project management, technology development, finance, operations, mergers and acquisitions, engineering design and other management services required by us.
We have a standard employment contract with our employee that is reviewed on an annual basis. Of the persons who currently are parties to this employment agreement, only Ms. Lee currently falls under the category of executive staff. There are no employment contracts with the CEO and the President. In each standard employment contract, we have included the terms of employment, remuneration, fringe benefits, vacation, confidentiality, non-solicitation and termination of employment.
We have a stock option plan which was adopted during the second quarter of 2006 however no options were granted in 2010.
|
ITEM 12.
|
SECURITY OWNERSHIP OF CERTAIN BENEFICIAL OWNERS AND MANAGEMENT AND RELATED STOCKHOLDER MATTERS
|
The following table sets forth information with respect to the beneficial ownership of our common stock as of December 31, 2010 of each executive officer, each director, and each shareholder in addition to any shareholders known to be the beneficial owner of 5% or more of our Common Stock and all officers and directors as a group. As of December 31, 2010, Laurus Master Fund, Ltd. beneficially owned 1,298,449 shares of our Common Stock. The securities owned by Laurus Master Fund, Ltd. contain a provision that Laurus may not, subject to certain exceptions, at any time beneficially own more than 4.99% of our outstanding common stock. We and Laurus have agreed that, other than on 75 days’ notice or upon the occurrence of an event of default, this provision may not be waived. Absent this limitation, Laurus and its related companies would beneficially own an additional 15,142,138 shares of our common stock, which is comprised of 129,155 shares under the option and 15,012,983 shares under the warrant.
|
Name and Address of Beneficial Owner
|
Shares of Common
Stock Beneficially
Owned
|
Percentage of Common
Stock Beneficially
Owned
|
||||||
|
Sayan Navaratnam
Toronto, Ontario
|
21,410,986 | 57.3 | % | |||||
|
Dominic Burns
Hampton, Ontario
|
7,036,607 | 18.8 | % | |||||
|
Heung Hung Lee
Markham, Ontario
|
50,000 | 0.1 | % | |||||
|
All officers and directors as a group (3 persons)
|
28,497,593 | 76.2 | % | |||||
The address of the above listed persons is c/o Creative Vistas, 2100 Forbes Street, Unit 8-10 Whitby, Ontario, Canada L1N 9T3.
Securities Authorized For Issuance Under Equity Compensation Plans
The following table sets forth certain information relating to our option plans as of December 31, 2010:
|
Plan Category
|
Nam of Plan
|
Number of
Common
Shares to be
Issued upon
Exercise of
Outstanding
Options
|
Range of
Exercise Price
of Outstanding
Options
|
Number of Securities Remaining
Available for Future Issuance
under Stock Option Plan
|
||||||||||
|
Option Plans approved by our Shareholders
|
Stock Option Plan
|
1,600,000 | $ | 0.63 to 1.12 | 2,400,000 | |||||||||
|
Total
|
1,600,000 | $ | 0.63 to 1.12 | 2,400,000 | ||||||||||
30
Share Option and Other Compensation Plans
Stock Option Plan
Our Stock Option plan (“the Plan”) was adopted by our Board and approved by our shareholders on June 30, 2006. Our Stock Option Plan provides for the grant of options to key employees of the Company, including officers or directors of the Company, and to consultants and other individuals providing services to the Company.
Share Reserve. A total of 4,000,000 shares of common stock, no par value, of the Company (the “Stock”) are authorized for issuance under the Stock Option plan as of December 31, 2007. Shares of Stock used for purposes of the Plan may be either authorized and unissued shares, or previously issued shares held in the treasury of the Company, or both. Shares of Stock covered by options which have terminated or expired prior to exercise shall be available for further options hereunder. The maximum aggregate number of shares of Stock that may be issued under the Plan under “incentive stock options” is 3,500,000 shares. No options may be granted under the Plan after June 30, 2011; provided that the Board of Directors may amend the Plan at any time.
Administration of Awards. The Plan shall be administered by the Board of Directors, or Compensation Committee of the Board of Directors or a subcommittee of the Compensation Committee appointed by the Compensation Committee, or by any other committee designated by the Board of Directors to administer the Plan (the committee or subcommittee administering the Plan is hereinafter referred to as the “Committee”). For purposes of administration, the Committee, subject to the terms of the Plan, shall have plenary authority to establish such rules and regulations, to make such determinations and interpretations, and to take such other administrative actions as it deems necessary or advisable. All determinations and interpretations made by the Committee shall be final, conclusive and binding on all persons, including all Optionees, any other holders of options and their legal representatives and beneficiaries.
Options may be granted to eligible individuals whether or not they hold or have held options previously granted under the Plan or otherwise granted or assumed by the Company. In selecting individuals for options, the Committee may take into consideration any factors it may deem relevant, including its estimate of the individual’s present and potential contributions to the success of the Company. Service as an employee, director, officer or consultant of or to the Company shall be considered employment for purposes of the Plan (and the period of such service shall be considered the period of employment for purposes of Section 5(d) of this Plan); provided, however, that incentive stock options may be granted under the Plan only to an individual who is an “employee” (as such term is used in Section 422 of the Code) of the Company.
Stock options. The Committee shall, in its discretion, prescribe the terms and conditions of the options to be granted hereunder, which terms and conditions need not be the same in each case, subject to the following:
(a)Option Price . The price at which each share of Stock covered by an option granted under the Plan may be purchased shall not be less than the Market Value (as defined in Section (c) hereof) per share of Stock on the date of grant of the option. The date of the grant of an option shall be the date specified by the Committee in its grant of the option.
(b)Option Period. The period for exercise of an option shall in no event be more than five years from the date of grant. Options may, in the discretion of the Committee, be made exercisable in installments during the option period. Any shares not purchased on any applicable installment date may be purchased thereafter at any time before the expiration of the option period.
(c)Exercise of Options. In order to exercise an option, the Optionee shall deliver to the Company written notice specifying the number of shares of Stock to be purchased, together with cash or a certified or bank cashier’s check payable to the order of the Company in the full amount of the purchase price therefore; provided that, for the purpose of assisting an Optionee to exercise an option, the Company may make loans to the Optionee or guarantee loans made by third parties to the Optionee, on such terms and conditions as the Board of Directors may authorize. For purposes of the Plan, the Market Value per share of Stock shall be the last sale price on the date of reference, or, if no sale takes place on such date, the average of the closing high bid and low asked prices, in either case on the principal national securities exchange on which the Stock is listed or admitted to trading, or if the Stock is not listed or admitted to trading on any national securities exchange, the last sale price reported on the National Market System of the National Association of Securities Dealers Automated Quotation System (“NASDAQ”) on such date, or the last sale price reported on the NASDAQ SmallCap Market on such date, or the average of the closing high bid and low asked prices in the over-the-counter market on such date, whichever is applicable, or if there are no such prices reported on NASDAQ or in the over-the-counter market on such date, as furnished to the Committee by any New York Stock Exchange member selected from time to time by the Committee for such purpose. If there is no bid or asked price reported on any such date, the Market Value shall be determined by the Committee in accordance with the regulations promulgated under Section 2031 of the Code, or by any other appropriate method selected by the Committee. If the Optionee so requests, shares of Stock purchased upon exercise of an option may be issued in the name of the Optionee or another person. An Optionee shall have none of the rights of a stockholder until the shares of Stock are issued to him.
31
(d) Effect of Termination of Employment. An option may not be exercised after the Optionee has ceased to be in the employ of the Company, except in the following circumstances:
(i) If the Optionee’s employment is terminated by action of the Company, or by reason of disability or retirement under any retirement plan maintained by the Company, the option may be exercised by the Optionee within three months after such termination, but only as to any shares exercisable on the date the Optionee’s employment so terminates;
(ii) In the event of the death of the Optionee during the three month period after termination of employment covered by (i) above, the person or persons to whom his rights are transferred by will or the laws of descent and distribution shall have a period of one year from the date of his death to exercise any options which were exercisable by the Optionee at the time of his death; and
(iii) In the event of the death of the Optionee while employed, the option shall thereupon become exercisable in full, and the person or persons to whom the Optionee’s rights are transferred by will or the laws of descent and distribution shall have a period of one year from the date of the Optionee’s death to exercise such option. In no event shall any option be exercisable more than five years from the date of grant thereof. Nothing in the Plan or in any option granted pursuant to the Plan (in the absence of an express provision to the contrary) shall confer on any individual any right to continue in the employ of the Company or continue as a consultant or interfere in any way with the right of the Company to terminate his employment or consulting arrangement at any time.
(e) Limitation on Transferability of Options. Except as provided in this Section (e), during the lifetime of an Optionee, options held by such Optionee shall be exercisable only by him and no option shall be transferable other than by will or the laws of descent and distribution. The Committee may, in its discretion, provide that options held by an Optionee, other than incentive stock options, may be transferred to or for the benefit of a member of his immediate family. For purposes hereof, the term “immediate family” shall mean an Optionee’s spouse and children (both natural and adoptive), and the direct lineal descendants of his children.
(f) Adjustments for Change in Stock Subject to Plan. In the event of a reorganization, recapitalization, stock split, stock dividend, combination of shares, merger, consolidation, rights offering, or any other change in the corporate structure or shares of the Company, the Committee shall make such adjustments, if any, as it deems appropriate in the number and kind of shares subject to the Plan, in the number and kind of shares covered by outstanding options, or in the option price per share, or both, and, in the case of a merger, consolidation or other transaction pursuant to which the Company is not the surviving corporation or pursuant to which the holders of outstanding Stock shall receive in exchange therefore shares of capital stock of the surviving corporation or another corporation, the Committee may require an Optionee to exchange options granted under the Plan for options issued by the surviving corporation or such other corporation.
(g )Treatment of Options Upon Occurrence of Certain Events. The Committee may, in its discretion, provide in the case of any option granted under the Plan that, in connection with any merger or consolidation which results in the holders of the outstanding voting securities of the Company (determined immediately prior to such merger or consolidation) owning, directly or indirectly, less than a majority of the outstanding voting securities of the surviving corporation (determined immediately following such merger or consolidation), or any sale or transfer by the Company of all or substantially all its assets or any tender offer or exchange offer for or the acquisition, directly or indirectly, by any person or group of all or a majority of the then outstanding voting securities of the Company, such option shall terminate within a specified number of days after notice to the Optionee thereunder, and each such Optionee shall receive, with respect to each share of Stock subject to such option, an amount equal to the excess, if any, of the Market Value of such shares immediately prior to such merger, consolidation, sale, transfer or exchange over the exercise price per share of such option; and that such amount shall be payable in cash, in one or more kinds of property (including the property, if any, payable in the transaction) or a combination thereof, as the Committee shall determine in its sole discretion.
32
(h) Registration, Listing and Qualification of Shares of Stock. Each option shall be subject to the requirement that if at any time the Board of Directors shall determine that the registration, listing or qualification of the shares of Stock covered thereby upon any securities exchange or under any federal or state law, or the consent or approval of any governmental regulatory body is necessary or desirable as a condition of, or in connection with, the granting of such option or the purchase of shares of Stock thereunder, no such option may be exercised unless and until such registration, listing, qualification, consent or approval shall have been effected or obtained free of any conditions not acceptable to the Board of Directors. The Company may require that any person exercising an option shall make such representations and agreements and furnish such information as it deems appropriate to assure compliance with the foregoing or any other applicable legal requirement.
(i) Lock-Up Period - Without the consent of the Company an Optionee may not sell more than fifty percent of the shares issued under the Plan for a period of two years from the date that the optionee exercises the option. The Committee may impose such other terms and conditions, not inconsistent with the terms hereof, on the grant or exercise of options, as it deems advisable.
Additional Provisions Applicable to Stock Option Plan. The Committee may, in its discretion, grant options under the Plan to eligible employees which constitute “incentive stock options” within the meaning of Section 422 of the Code; provided, however, that (a) the aggregate Market Value of the Stock with respect to which incentive stock options are exercisable for the first time by the Optionee during any calendar year shall not exceed the limitation set forth in Section 422(d) of the Code; and (b) notwithstanding anything to the contrary in Section 5, if the Optionee owns on the date of grant securities possessing more than 10% of the total combined voting power of all classes of securities of the Company or of any parent or subsidiary of the Company, the price per share shall not be less than 110% of the Market Value per share on the date of grant and the period of exercise shall not be longer than five years from the date of grant.
Amendment and Termination. No option shall be granted hereunder after June 30, 2011; provided, however, that the Board of Directors may at any time prior to that date terminate the Plan. The Board of Directors may at any time amend the Plan or any outstanding options. No termination or amendment of the Plan may, without the consent of an Optionee, adversely affect the rights of such Optionee under any option held by such Optionee.
|
ITEM 13.
|
CERTAIN RELATIONSHIPS AND RELATED TRANSACTIONS, AND DIRECTOR INDEPENDENCE
|
On September 29, 2004, pursuant to a Stock Purchase Agreement with The Burns Trust (our president is one of the beneficiaries of the trust) and The Navaratnam Trust (our CEO is one of the beneficiaries of the trust), as sellers, A.C. Technical Systems Ltd. and A.C. Technical Acquisition Corp., as purchasers, AC Acquisition acquired all of the issued and outstanding shares of AC Technical from The Burns Trust and The Navaratnam Trust for consideration consisting of promissory notes in the aggregate amount of $3,300,000. AC Technical became an indirect subsidiary of the Company and a wholly owned direct subsidiary of AC Acquisition. $1,800,000 has been paid to The Burns Trust and The Navaratnam Trust through part of the funding from Laurus. At December 31, 2010, we have two 3% notes payable to Malar Trust Inc. (an entity of which our Chairman is a beneficially of) which is due on demand.
Director Independence: None of our directors are independent.
|
ITEM 14.
|
PRINCIPAL ACCOUNTANT FEES AND SERVICES
|
The following table sets forth the aggregate fees for professional services rendered to us for the years ended December 31, 2010 and 2009. Our principal accounting firm for the years ended December 31, 2009 and 2010 is Kingery and Crouse P.A.:
|
2010
|
2009
|
|||||||
|
Audit Fees (a)
|
$ | 150,000 | $ | 140,000 | ||||
|
Audit Related Fees (b)
|
- | - | ||||||
|
Tax Fees (c)
|
- | - | ||||||
|
All Other Fees (d)
|
- | - | ||||||
|
Total
|
$ | 150,000 | $ | 140,000 | ||||
33
|
(a)
|
Audit Fees. Fees for audit services billed in 2010 and 2009 consisted of the audit of our annual consolidated financial statements, reviews of our quarterly consolidated financial statements, statutory audits, consents and services that are normally provided in connection with statutory and regulatory filing or engagement. All fees were payable to Kingery and Crouse P.A. for both fiscal years.
|
|
(b)
|
Audit-Related Fees. There are no material audit-related fees in 2010 and 2009.
|
|
(c)
|
The Company has retained a different firm to provide tax services.
|
|
(d)
|
All Other Fees. No material other fees were billed in 2010 and 2009.
|
We do not have an audit committee; however, our board of directors is required to provide advance approval of any non-audit services, other than those of a de minimus nature, to be performed by our auditors, provided that such services are not otherwise prohibited by law. We do not have a formal pre-approval policy.
|
|
All the fees for 2010 and 2009 were pre-approved by the board of directors prior to the auditors’ engagement for these services.
|
|
ITEM 15.
|
EXHIBITS AND FINANCIAL STATEMENT SCHEDULES
|
|
3.1*
|
Articles of Incorporation, as amended to date, incorporated by reference to the Registrant’s Form 8-K/A filed February 2, 2005
|
|
|
3.2*
|
By-laws of the Registrant incorporated by reference to the Registrant’s Form 10-SB filed May 10, 2000
|
|
|
4.1*
|
Securities Purchase Agreement, dated February 13, 2006, by and among Laurus Master Fund, Ltd., Creative Vistas, Inc., Iview Holding Corp. and Iview Digital Video Solutions Inc. incorporated by reference to the Registrant’s Form 8-K filed February 17, 2006.
|
|
|
4.2*
|
Secured Term Note, dated February 13, 2006, issued by Creative Vistas, Inc. to Laurus Master Fund, Ltd. incorporated by reference to the Registrant’s Form 8-K filed February 17, 2006.
|
|
|
4.3*
|
Secured Term Note, dated February 13, 2006, issued by Iview Digital Video Solutions Inc. to Laurus Master Fund, Ltd. incorporated by reference to the Registrant’s Form 8-K filed February 17, 2006.
|
|
|
4.4*
|
Option, dated February 13, 2006, issued by Iview Holding Corp. to Laurus Master Fund, Ltd. incorporated by reference to the Registrant’s Form 8-K filed February 17, 2006.
|
|
|
4.5*
|
Warrant, dated February 13, 2006, issued by Creative Vistas, Inc. to Laurus Master Fund, Ltd. incorporated by reference to the Registrant’s Form 8-K filed February 17, 2006.
|
|
|
4.6*
|
Amended and Restated Guaranty, dated February 13, 2006 by and among Creative Vistas, Inc., Cancable Inc., Cancable Holding Corp., Cancable, Inc., A.C. Technical Systems Ltd., Creative Vistas Acquisition Corp., Iview Holding Corp. and Iview Digital Video Solutions Inc. incorporated by reference to the Registrant’s Form 8-K filed February 17, 2006.
|
|
|
4.7*
|
Amended and Restated Guaranty, dated February 13, 2006 between Brent W. Swanick and Laurus Master Fund, Ltd. incorporated by reference to the Registrant’s Form 8-K filed February 17, 2006.
|
|
|
4.8*
|
Side Agreement, dated February 13, 2006 between Iview Digital Video Solutions, Inc., Iview Holding Corp., Creative Vistas Acquisition Corp. and Laurus Master Fund, Ltd incorporated by reference to the Registrant’s Form 8-K filed February 17, 2006.
|
34
|
4.9*
|
Joinder and Confirmation of Security Agreement, dated February 13, 2006 among Iview Holding Corp., Cancable Inc., Cancable Holding Corp., Cancable, Inc., A.C. Technical Systems Ltd., Creative Vistas Acquisition Corp., Iview Digital Video Solutions Inc., and Creative Vistas, Inc. delivered to Laurus Master Fund, Ltd. incorporated by reference to the Registrant’s Form 8-K filed February 17, 2006.
|
|
|
4.10*
|
First Amendment to Securities Purchase Agreement, dated February 13, 2006, by and among Cancable Inc., Cancable Holding Corp. and Laurus Master Fund, Ltd. for the purpose of amending the terms of that certain Securities Purchase Agreement by and among Cancable Inc., Cancable Holding Corp. and Laurus, dated as of December 31, 2005 incorporated by reference to the Registrant’s Form 8-K filed February 17, 2006.
|
|
|
4.11*
|
Registration Rights Agreement, dated as of February 13, 2006, by and between Creative Vistas, Inc. and Laurus Master Fund, Ltd. incorporated by reference to the Registrant’s Form 8-K filed February 17, 2006.
|
|
|
4.12*
|
Securities Purchase Agreement, dated June 24, 2008, by and among LV Administrative Services, Inc., the purchasers from time to time a party thereto, Creative Vistas, Inc., and Cancable Inc. incorporated by reference to the Registrant's Form 8-K filed July 1, 2008
|
|
|
4.13*
|
Secured Term Note, dated June 24, 2008, issued by Creative Vistas, Inc. and Cancable Inc. to Valens Offshore SPV II, Corp. incorporated by reference to the Registrant's Form 8-K filed July 1, 2008
|
|
|
4.14*
|
Secured Term Note, dated June 24, 2008, issued by Creative Vistas, Inc. and Cancable Inc. to Valens U.S. SPV I, LLC incorporated by reference to the Registrant's Form 8-K filed July 1, 2008
|
|
|
4.15*
|
Warrant, dated June 24, 2008, issued by Creative Vistas, Inc. to Valens U.S. SPV I, LLC incorporated by reference to the Registrant's Form 8-K filed July 1, 2008
|
|
|
4.16*
|
Warrant, dated June 24, 2008, issued by Creative Vistas, Inc. to Valens Offshore SPV II, Corp. incorporated by reference to the Registrant's Form 8-K filed July 1, 2008
|
|
|
4.17*
|
Guaranty, dated June 24, 2008, by and among Creative Vistas, Inc., Cancable Inc., A.C. Technical Systems Ltd., Creative Vistas Acquisition Corp., Cancable Holding Corp., Iview Holding Corp., Iview Digital Video Solutions Inc., Cancable, Inc., 2141306 Ontario Inc., Cancable XL Inc., and XL Digital Services Inc. incorporated by reference to the Registrant's Form 8-K filed July 1, 2008
|
|
|
4.18*
|
Master Security Agreement, dated June 24, 2008, by and among Creative Vistas, Inc., Cancable Inc., A.C. Technical Systems Ltd., Creative Vistas Acquisition Corp., Cancable Holding Corp., Iview Holding Corp., Iview Digital Video Solutions Inc., Cancable, Inc., 2141306 Ontario Inc., Cancable XL Inc., and XL Digital Services Inc. incorporated by reference to the Registrant's Form 8-K filed July 1, 2008
|
|
|
4.19*
|
Pledge Agreement, dated June 24, 2008, by and among LV Administrative Services, Inc., the purchasers from time to time a party thereto, Cancable Inc., Creative Vistas, Inc., Cancable Holding Corp., Creative Vistas Acquisition Corp., Cancable XL Inc., Iview Holding Corp., and Brent Swanick incorporated by reference to the Registrant's Form 8-K filed July 1, 2008
|
|
|
4.20*
|
Guaranty, dated June 24, 2008, of Brent Swanick incorporated by reference to the Registrant's Form 8-K filed July 1, 2008
|
|
|
10.1*
|
Stock Option Plan, incorporated by reference to the Registrant’s Form S-8 filed October 6 2006
|
|
|
10.2^
|
Rogers Cable Communications Inc. and Cancable Inc. for the provision of installation activities and service activities.
|
|
|
10.3*
|
Common Stock Purchase Warrant, dated January 22, 2008, issued by Creative Vistas, Inc. to Erato Corporation for the Right to Purchase 812,988 Shares of Common Stock of Creative Vistas, Inc. incorporated by reference to the Registrant’s Form 8-K filed February 28, 2008.
|
|
|
10.4*
|
Stock Purchase Agreement, dated January 22, 2008, between Creative Vistas, Inc. and Erato Corporation. incorporated by reference to the Registrant’s Form 8-K filed February 28, 2008.
|
|
|
10.5*
|
Common Stock Purchase Warrant, dated January 22, 2008, issued by Creative Vistas, Inc. to Erato Corporation for the Right to Purchase 1,738,365 Shares of Common Stock of Creative Vistas, Inc. incorporated by reference to the Registrant’s Form 8-K filed February 28, 2008.
|
|
|
10.6*
|
Letter Agreement dated January 22. 2008 between Creative Vistas, Inc. and Erato Corporation.
|
|
|
10.7*
|
Warrant Purchase Agreement, dated January 30, 2008 between Creative Vistas, Inc., Laurus Master Fund, Ltd., Erato Corporation, Valens U.S. Fund, LLC and Valens Offshore SPV I, Ltd. incorporated by reference to the Schedule 13 D filed by the Registrant with respect to 180 Connect Inc. dated February 1, 2008.
|
35
|
10.8*
|
Amended and Restated Common Stock Purchase Warrant dated July 2, 2007 issued to Laurus Master Fund, Ltd. by 180 Connect Inc. incorporated by reference to the Schedule 13 D filed by the Registrant with respect to 180 Connect Inc. dated February 1, 2008.
|
|
|
10.9*
|
Common Stock Purchase Warrant, dated January 30, 2008, issued by Creative Vistas, Inc. to Erato Corporation for the Right to Purchase 2,350 Shares of Common Stock of Creative Vistas, Inc. incorporated by reference to the Schedule 13 D filed by the Registrant with respect to 180 Connect Inc. dated February 1, 2008.
|
|
|
10.10*
|
Common Stock Purchase Warrant, dated January 30, 2008, issued by Creative Vistas, Inc. to Valens U.S. SPV I, LLC for the Right to Purchase 214,033 Shares of Common Stock of Creative Vistas, Inc. incorporated by reference to the Schedule 13 D filed by the Registrant with respect to 180 Connect Inc. dated February 1, 2008.
|
|
|
10.11*
|
Common Stock Purchase Warrant, dated January 30, 2008, issued by Creative Vistas, Inc. to Valens Offshore SPV I, Ltd. for the Right to Purchase 582,367 Shares of Common Stock of Creative Vistas, Inc. incorporated by reference to the Schedule 13 D filed by the Registrant with respect to 180 Connect Inc. dated February 1, 2008.
|
|
|
10.12*
|
Non-binding Letter of Intent between Creative Vistas, Inc. and Valens U.S. Fund, LLC
|
|
|
10.13*
|
Letter of Intent dated February 13, 2008 incorporated by reference to the Schedule 13D Amendment filed by the Registrant with respect to 180 Connect Inc. dated February 19, 2008
|
|
|
10.14*
|
Consulting Agreement, dated July 16, 2008, between Creative Vistas, Inc. and Nationwide Solutions Inc. incorporated by reference to the Registrant's Form 8-K filed July 18, 2008
|
|
|
10.15*
|
Termination and Release Agreement, dated July 16, 2008, between AC Technical Systems Ltd., Nationwide Solutions Inc. and Sayan Navaratnam
|
|
| 10.16+ | Consulting Agreement, dated January 1, 2010, between Creative Vistas, Inc. and 1608913 Ontario Inc. | |
|
21.1+
|
List of all subsidiaries
|
|
|
31.1+
|
Rule 13a-14(a) Certification of the Principal Executive Officer
|
|
|
31.2+
|
Rule 13a-14(a) Certification of the Principal Financial Officer
|
|
|
32.1+
|
Chief Executive Officer certification pursuant to 18 U.S.C. Section 1350, as adopted pursuant to Section 906 of the Sarbanes-Oxley Act of 2002
|
|
|
32.2+
|
|
Chief Financial Officer certification pursuant to 18 U.S.C. Section 1350, as adopted pursuant to Section 906 of the Sarbanes-Oxley Act of 2002
|
* Previously filed and incorporated by reference
+ Filed herewith
^ Portions of this exhibit have been omitted pursuant to a request for confidential treatment.
36
SIGNATURES
Pursuant to the requirements of Section 13 or 15(d) of the Securities Exchange Act of 1934, the registrant has duly caused this report to be signed on its behalf by the undersigned, thereunto duly authorized.
|
CREATIVE VISTAS, INC.
|
|
|
By:
|
/s/ Dominic Burns
|
|
Dominic Burns
Chief Executive Officer, President and Director
|
|
|
Date:
|
March 31, 2011
|
Pursuant to the requirements of the Securities Exchange Act of 1934, this report has been signed below by the following person on behalf of the registrant and in the capacities and on the dates indicated.
|
Signature
|
Title
|
Date
|
||
|
/s/ Dominic Burns
|
Chief Executive Officer, President and Director
|
March 31, 2011
|
||
|
Dominic Burns
|
||||
|
/s/ Heung Hung Lee
|
Chief Financial Officer, Secretary and Director
|
March 31, 2011
|
||
|
Heung Hung Lee
|
37