Attached files
| file | filename |
|---|---|
| 8-K - FORM 8-K - CAPSTEAD MORTGAGE CORP | d8k.htm |
 CAPSTEAD
Information as of December 31, 2010
Investor Presentation
Exhibit 99.1 |
 Safe
Harbor Statement - Private Securities Litigation Reform Act of 1995
Cautionary Statement Concerning Forward-looking Statements
This
document
contains
“forward-looking
statements”
within
the
meaning
of
the
Private
Securities
Litigation
Reform
Act
of
1995.
Forward-looking statements include, without limitation, any statement that may
predict, forecast, indicate or imply future results, performance
or
achievements,
and
may
contain
the
words
“believe,”
“anticipate,”
“expect,”
“estimate,”
“intend,”
“project,”
“will
be,”
“will
likely continue,”
“will likely result,”
or words or phrases of similar meaning. These forward-looking statements are
based largely on the expectations of management and are subject to a number
of risks and uncertainties including, but not limited to, the following: In
addition to the above considerations, actual results and liquidity are affected by other risks and uncertainties which could cause
actual results to be significantly different from those expressed or implied by
these forward-looking statements. It is not possible to identify
all of the risks, uncertainties and other factors that may affect future results. In light of these risks and uncertainties, the
forward-looking events and circumstances discussed herein may not occur and
actual results could differ materially from those anticipated or implied in
the forward-looking statements. Any forward-looking statements speak only as of the date the statement is
made and the Company undertakes no obligation to update or revise any
forward-looking statements, whether as a result of new information,
future events or otherwise. Accordingly, readers of this document are cautioned not to place undue reliance on the
forward-looking statements.
–
changes in general economic conditions;
–
fluctuations in interest rates and levels of mortgage
prepayments;
–
the effectiveness of risk management strategies;
–
the impact of differing levels of leverage employed;
–
liquidity of secondary markets and credit markets;
–
the availability of financing at reasonable levels and terms to
support investing on a leveraged basis;
–
the availability of new investment capital;
–
increases in costs and other general competitive factors;
–
the availability of suitable qualifying investments from both
an investment return and regulatory perspective;
–
changes in legislation or regulation affecting Fannie Mae
and Freddie Mac (the “GSEs”) and similar federal
government agencies and related guarantees; and
–
deterioration in credit quality and ratings of existing or future
issuances
of
GSE
or
Ginnie
Mae
Securities.
2 |
 Proven Strategy
Experienced
Management Team
Company Overview
•
We were founded in 1985 and are the oldest publicly-traded agency mortgage
REIT.
•
At December 31, 2010, we had a total investment portfolio of $8.52 billion,
supported by long-term investment capital of $1.13 billion levered 6.91
times.* •
Our three-year compound annual growth rate of 15.5% exceeds that of most of
our peers.**
•
We invest in residential adjustable-rate mortgage (ARM) securities issued and
guaranteed by Fannie Mae, Freddie Mac or Ginnie Mae.
•
Our
prudently
leveraged
portfolio
provides
financial
flexibility
to
manage
changing
market conditions.
•
Our focus on ARM securities differentiates Capstead from our peers and is
recognized as the most defensively-positioned Agency mortgage REIT.
•
We are self-managed with low operating costs and a conservative incentive
compensation structure.
•
We have over 80 years of combined mortgage finance industry experience,
including nearly 75 years at Capstead.
3
* Long-term investment capital includes stockholders’ equity and unsecured
borrowings, net of investments in related unconsolidated affiliates.
** Compound annual growth rate is based on cumulative total returns assuming an investment
in Capstead was made December 31, 2007 and dividends were reinvested.
Company Summary |
 Market
Snapshot (dollars in thousands, except per share amounts)
Perpetual Preferred
Trust
Total Long-Term
Common
Series A
Series B
Preferred
Investment Capital
NYSE Stock Ticker
CMO
CMOPRA
CMOPRB
Shares outstanding
70,259
187
15,819
Cost of preferred capital
11.44%
11.28%
8.49%
10.28%
Price as of March 24, 2011
$13.32
$21.79
$14.09
Book Value per common share
$12.02
Price as a multiple of December 31, 2010
book value
110.8%
Recorded value
$848,102
$2,620
$176,703
$99,978
$1,127,403
Market cap as of March 24, 2011
$935,850
$4,075
$222,890
$99,978
$1,262,793
(a) As of December 31, 2010.
(b) Excludes common shares issued subsequent to year-end. Our Form
10-K discloses that we issued 1.4 million shares under our at-the-market continuing offering program in January and
February 2011 with net proceeds of over $17 million.
4
(b)
(a)
(a)
(a) |
 36%
64%
12%
88%
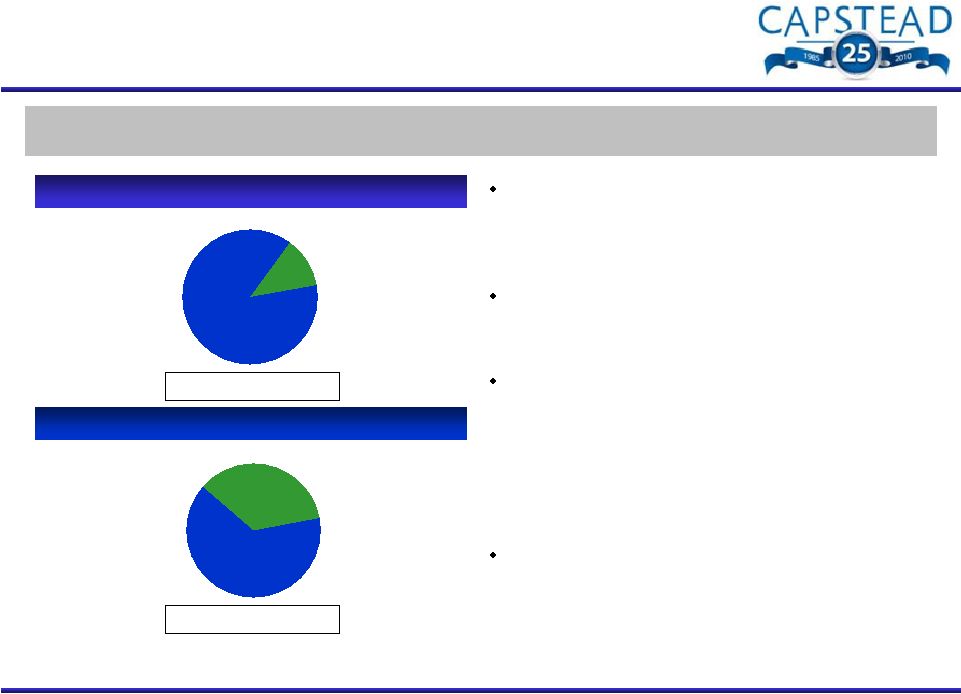
Proven Investment & Financing Strategy
5
Low
risk
agency-guaranteed
residential
ARM
securities
financed
primarily
with
30-90
day
“repo”
borrowings,
augmented with two-year interest rate swap agreements for hedging purposes.
Residential ARM Securities Portfolio
Repurchase Arrangements & Similar Borrowings
Total: $7.79 billion
* Based on fair market value as of the indicated balance sheet date.
Total: $8.52 billion*
Over 99.8% of our securities are backed by well-
seasoned mortgage loans with coupon interest rates
that reset at least annually or begin doing so after
an initial fixed-rate period of five years or less.
We have long-term relationships with numerous
lending counterparties, including 21 active
counterparties at December 31, 2010.
At December 31, 2010 we held $2.8 billion notional
amount of currently-paying two-year interest rate
swaps with average fixed rates of 1.17% and
average terms of 10 months. An additional $500
million notional amount of two-year swaps with
average fixed-rates of 0.69% were held at year-end
that began paying in January 2011.
The duration of our investment portfolio and related
‘repo’
borrowings was approximately 8½
months
and 5¼
months, respectively, at December 31,
2010. This resulted in a net duration gap of
approximately 3¼
months.
Longer-to-Reset
ARMs
$1.04 Billion
Current-Reset
ARMs
$7.48 Billion
Borrowings Hedged with
Currently-Paying
Interest Rate Swaps
$2.80 Billion
Unhedged
Borrowings
$4.99 Billion
As of December 31, 2010
As of December 31, 2010 |
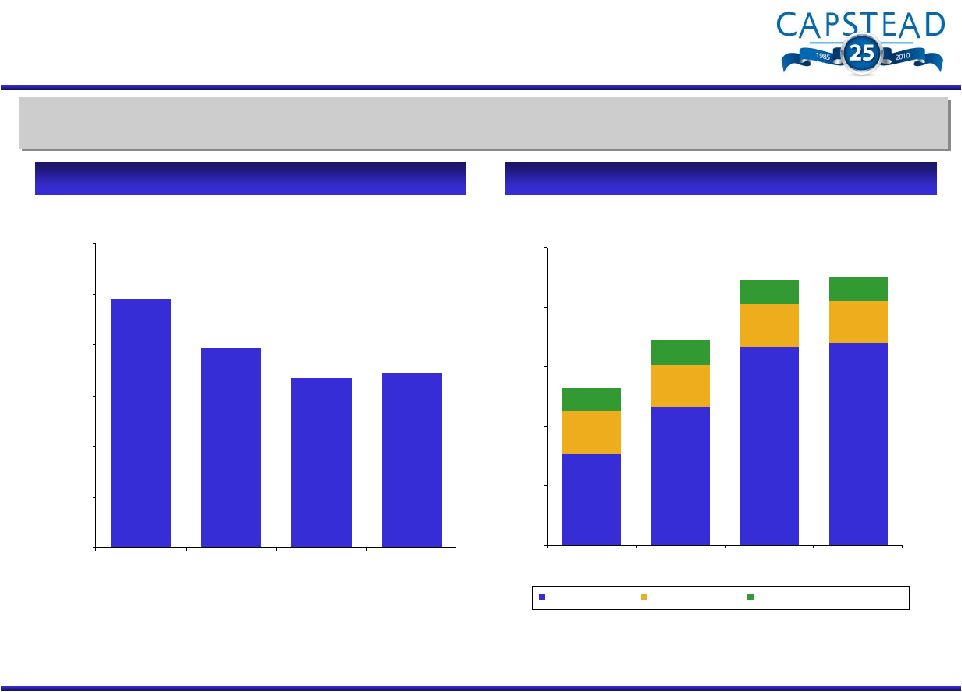 Portfolio Leverage &
Long-Term Investment Capital
6
From 12/31/07 to 12/31/10, our portfolio leverage has decreased 30% and long-term
investment capital has increased 70%. We anticipate increasing both
portfolio leverage and common stockholders’ equity in 2011.
$ in millions
Portfolio Leverage*
Long-Term Investment Capital
$661
$860
$1,114
$1,127
75%
75%
68%
58%
16%
16%
21%
27%
15%
12%
9%
9%
$
$250
$500
$750
$1,000
$1,250
12/31/07
12/31/08
12/31/09
12/31/10
Common Stock
Preferred Stock
Trust Prefered Securities, net
9.84x
7.85x
6.67x
6.91x
0.0x
2.0x
4.0x
6.0x
8.0x
10.0x
12.0x
12/31/07
12/31/08
12/31/09
12/31/10
$100
$179
$848
Common Stock
Preferred Stock
Trust Preferred Securities, net
*
Borrowings under repurchase arrangements divided by long-term investment capital, which includes
stockholders’ equity and unsecured borrowings, net of investments in
related unconsolidated affiliates. |
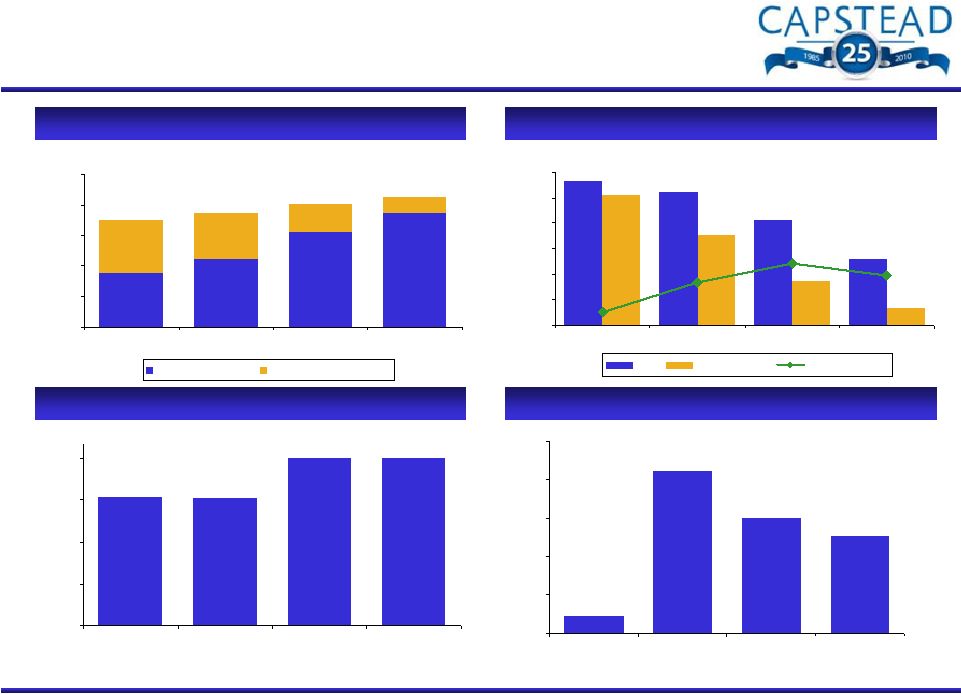 5.64%
5.22%
4.13%
2.60%
0.66%
1.73%
5.12%
3.53%
1.94%
2.40%
1.69%
0.52%
0.00%
1.00%
2.00%
3.00%
4.00%
5.00%
6.00%
12/31/07
12/31/08
12/31/09
12/31/10
Yield
Borrowing Rate
Financing Spread
$7.04
$8.07
$8.52
51%
60%
77%
88%
49%
40%
23%
12%
$7.44
$0.00
$2.00
$4.00
$6.00
$8.00
$10.00
12/31/07
12/31/08
12/31/09
12/31/10
Current-Reset ARMs
Longer-to-Reset ARMs
Historical Financial Overview
7
* See pages 15 and 16 for discussion of use of financing spread on mortgage
assets, a non-GAAP financial measure. ** Defined as annualized net
income available to common stockholders divided by average common equity capital.
$ in billions
Residential ARM Securities Portfolio
Financing Spread on Mortgage Assets*
Book Value Per Common Share
Annualized Return on Average Common Equity**
$9.25
$9.14
$11.99
$12.02
$0.00
$3.00
$6.00
$9.00
$12.00
12/31/07
12/31/08
12/31/09
12/31/10
2.3%
21.0%
14.9%
12.7%
0.0%
5.0%
10.0%
15.0%
20.0%
25.0%
12/31/07
12/31/08
12/31/09
12/31/10
Yield
Borrowing Rate
Financing
Spread
Current-Reset ARMs
Longer-to-Reset
ARMs |
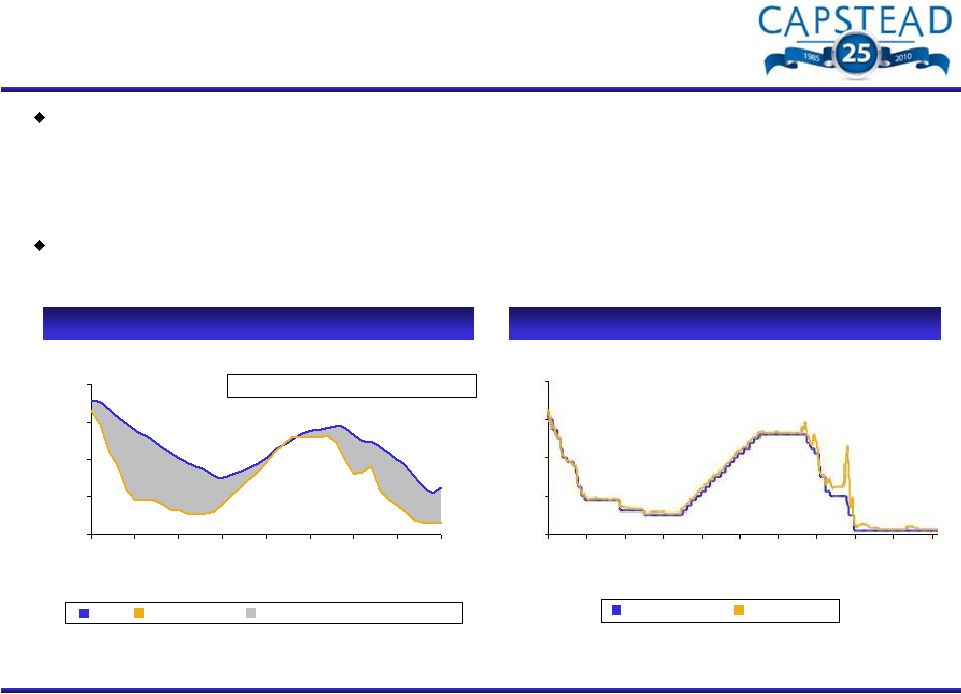 Financing Spreads
Our portfolio yields and financing spreads have rebounded considerably after being
adversely affected between March and July 2010 by the buyout of a backlog of
seriously delinquent loans by the GSEs, as evidenced by 39 cent and 41 cent
dividends declared for the fourth quarter of 2010 and first quarter of 2011,
respectively. Our
repo
borrowing
rates
remain
at
favorable
levels
with
average
repo
borrowing
rates
of
0.30% at December 31, 2010 (0.63% including interest rate swaps).
* See pages 15 and 16 for discussion of use of financing spread
on mortgage assets, a non-GAAP financial measure. **
Source: Bloomberg.
8
Yields on Mortgage Assets vs. Borrowing Rates
Fed Funds vs. 1-Month LIBOR**
Financing Spread on Mortgage Assets*
Yield
Borrowing Rate
Fed Funds Rate
1-Month LIBOR
0.0%
2.0%
4.0%
6.0%
8.0%
12/00
3/02
6/03
9/04
12/05
3/07
6/08
9/09
12/10
Avg. Spread on mortgage assets: 1.89%*
0.0%
2.0%
4.0%
6.0%
8.0%
12/00
12/01
12/02
12/03
12/04
12/05
12/06
12/07
12/08
12/09
12/10 |
 Fourth
Quarter Highlights Our earnings increased to $33 million or $0.40 per diluted
common share. Our total
financing
spreads
increased
31
basis
points
to
average
1.71%,
reflecting lower
levels of portfolio runoff and continued low borrowing rates.
Our book value increased $0.25 to $12.02 per common share.
Our investment portfolio increased $573 million to $8.52 billion.
Comment from our February 2, 2011 earnings press release:
“Net interest margins improved considerably during the fourth quarter
following the conclusion
of
GSE
buyout
programs
in
July.
Portfolio
runoff
was
considerably
lower
quarter
over quarter and declined further still in January 2011 to an annualized rate of
18.3% (a 15.8%
CPR),
which
should
benefit
our
portfolio
yields
into
2011.
With
acquisitions
during
the fourth quarter totaling almost $1 billion, we were able to more than replace
all of this year’s accelerated runoff resulting from the GSE buyout
programs contributing to an increase for the year in portfolio leverage to
6.91 times our long-term investment capital. This success in
re-leveraging our investment capital, together with the favorable prepay
characteristics of our seasoned portfolio of agency-guaranteed ARM securities
as well as the continued low borrowing rate environment, contributed to
significantly improved operating results for the fourth quarter and bolsters
our expectations that we will continue to produce strong financial results
in 2011.” 9 |
 CAPSTEAD
Appendix
CAPSTEAD
10 |
 Comparative Balance Sheet
(dollars in thousands, except per share amounts)
11
December 31,
December 31,
December 31,
December 31,
Assets
Mortgage securities and similar investments
8,515,691
$
8,091,103
$
7,499,530
$
7,108,719
$
Cash collateral receivable from interest rate swap counterparties
35,289
30,485
53,676
1,800
Interest rate swap agreements at fair value
9,597
1,758
Cash and cash equivalents
359,590
409,623
96,839
6,653
Receivables and other assets
76,078
92,817
76,200
88,637
Investments in unconsolidated affiliates
3,117
3,117
3,117
3,117
8,999,362
$
8,628,903
$
7,729,362
$
7,208,926
$
Liabilities
Repurchase arrangements and similar borrowings
7,792,743
$
7,435,256
$
6,751,500
$
6,500,362
$
Cash collateral payable to interest rate swap counterparties
9,024
Interest rate swap agreements at fair value
16,337
9,218
46,679
2,384
Unsecured borrowings
103,095
103,095
103,095
103,095
Common stock dividend payable
27,401
37,432
22,728
9,786
Accounts payable and accrued expenses
23,337
29,961
44,910
32,382
7,971,937
7,614,962
6,968,912
6,648,009
Stockholders' Equity
Perpetual preferred stock
179,323
179,333
179,460
179,533
Common stock
674,202
661,724
618,369
344,423
Accumulated other comprehensive income (loss)
173,900
172,884
(37,379)
36,961
1,027,425
1,013,941
760,450
560,917
8,999,362
$
8,628,903
$
7,729,362
$
7,208,926
$
Book value per common share
liquidation preferences for the Series A and B preferred stock)
$12.02
$11.99
$9.14
$9.25
Long-term investment capital
unsecured borrowings, net of investments in related
unconsolidated affiliates)
$1,127,403
$1,113,919
$860,428
$660,895
Portfolio leverage
divided by long-term investment capital)
6.91:1
6.67:1
7.85:1
9.84:1
2010
2009
2008
2007
(calculated assuming
(stockholders’
equity and
(borrowings under repurchase arrangements
-
-
-
-
- |
 Comparative Income
Statement (dollars in thousands, except per share amounts) (unaudited)
12
Year Ended
December
December
September
June
March
Interest income:
Mortgage securities and similar investments
199,300
$
50,902
$
40,614
$
47,634
$
60,150
$
Other
478
140
111
135
92
199,778
51,042
40,725
47,769
60,242
Interest expense:
Repurchase arrangements and similar borrowings
(47,502)
(11,892)
(11,096)
(11,146)
(13,368)
Unsecured borrowings
(8,747)
(2,187)
(2,186)
(2,187)
(2,187)
Other
(2)
(2)
-
-
-
(56,251)
(14,081)
(13,282)
(13,333)
(15,555)
Net interest income
143,527
36,961
27,443
34,436
44,687
Other revenue (expense):
Miscellaneous other revenue (expense)
(904)
(174)
(427)
(98)
(205)
Incentive compensation expense
(5,055)
(1,327)
(983)
(1,330)
(1,415)
General and administrative expense
(10,931)
(2,498)
(2,424)
(3,314)
(2,695)
(16,890)
(3,999)
(3,834)
(4,742)
(4,315)
Income before equity in earnings of unconsolidated affiliates
126,637
32,962
23,609
29,694
40,372
Equity in earnings of unconsolidated affiliates
259
65
64
65
65
Net income
126,896
$
33,027
$
23,673
$
29,759
$
40,437
$
Net income per diluted common share
$1.52
$0.40
$0.27
$0.35
$0.51
Average balance of mortgage assets
7,665,796
$
8,110,095
$
7,313,810
$
7,460,379
$
7,779,081
$
Investment premium amortization
57,595
11,098
17,689
15,342
13,466
Portfolio runoff *
Average financing spread on mortgage assets**
Quarter Ended
* Represents total runoff (scheduled payments and prepayments). The constant
prepayment rate, or CPR, representing only prepayments, will typically be 150 to 250 basis
points lower during any given period. ** See pages 15 and 16 for discussion of use
of financing spread on mortgage assets, a non-GAAP financial measure. 2010
2010
2010
2010
2010
31.2%
1.94
19.4%
31.8%
35.6%
37.9%
1.56
2.35
1.91
1.89 |
 Yield
/ Cost Analysis (dollars in thousands)
$
766,1628
13
Basis
Yield/Cost
Runoff
Basis
Yield/Cost
Runoff
Agency-guaranteed securities:
Fannie Mae/Freddie Mac:
Fixed-rate
$ 5,769
6.49%
24.2%
6.60%
18.3%
ARMs
7,246,000
2.56
31.8
7,600,085
2.49
19.4
Ginnie Mae ARMs
390,626
3.00
14.4
486,215
2.57
12.7
7,642,395
2.59
31.1
8,086,300
2.50
19.0
Unsecuritized residential mortgage loans:
Fixed-rate
3,577
7.01
6.2
3,491
7.03
6.4
ARMs
7,660
3.87
9.0
7,353
3.79
7.6
11,237
4.87
8.2
10,844
4.83
7.2
Commercial loans
8,610
9.45
100.0
4,339
8.75
100.0
3,554
8.11
3.5
3,506
8.07
3.5
7,665,796
2.60
31.2
8,104,989
2.51
19.4
Other interest-earning assets
255,412
0.19
273,016
0.20
7,921,208
2.52
8,378,005
2.44
30-day to 90-day interest rates, as adjusted
for hedging results
7,046,841
0.66
7,465,108
0.62
Structured financings
3,554
8.11
3,506
8.07
7,050,395
0.66
7,468,614
0.62
Other interest-paying liabilites
1,090
0.19
4,323
0.19
Unsecured borrowings
103,095
8.49
103,095
8.49
7,154,580
0.78
7,576,032
0.73
Capital employed/Total financing spread
1.74
1.71
Financing spread on mortgage assets*
1.94
1.89
Secured borrowings based on:
Fourth Quarter 2010 Average
Collateral for structured financings
Year Ended 2010 Average
* See pages 15 and 16 for discussion of use of financing spread on
mortgage assets, a non-GAAP financial measure. $
807,079
$
5,106 |
 Fully indexed net weighted average coupon, or WAC, represents the coupon upon one or more resets using
interest rates indices as of December 31, 2010 and the applicable net margin. Fully
Indexed
Average
Months
Principal
Cost
Basis Fair Market
Net
Net
Net
to
Balance
Premiums
($)
%
Value
WAC
WAC*
Margins
Roll
Current-reset ARMs:
Fannie Mae Agency Securities
$
5,305,418
$
105,877
$5,411,295
102.00
$
5,526,940
2.83%
2.31%
1.72%
5.0
Freddie Mac Agency Securities
1,511,891
31,338
1,543,229
102.07
1,582,770
3.27
2.44
1.94
6.5
Ginnie Mae Agency Securities
339,149
2,844
341,993
100.84
349,626
3.01
1.82
1.53
5.9
Residential Mortgage Loans
7,235
24
7,259
100.33
7,239
3.45
2.43
2.06
5.4
7,163,693
140,083
7,303,776
101.96
7,466,575
2.93
2.31
1.76
5.4
Longer-to-reset ARMs:
Fannie Mae Agency Securities
573,129
15,852
588,981
102.77
597,196
4.10
2.48
1.71
38.3
Freddie Mac Agency Securities
269,831
5,193
275,024
101.92
284,216
5.04
2.54
1.78
32.0
Ginnie Mae Agency Securities
150,430
5,186
155,616
103.45
155,750
3.38
1.81
1.50
36.9
993,390
26,231
1,019,621
102.64
1,037,162
4.24
2.39
1.70
36.4
$
8,157,083
$166,314
$8,323,397
102.04
$
8,503,737
3.09
2.32
1.75
9.2
Residential ARM Portfolio Statistics
As of December 31, 2010 (dollars in thousands)
14
NOTE: Excludes $12 million of fixed-rate investments.
|
 Financing Spread on
Mortgage Assets,
Total Financing Spread,
a
Non-GAAP
a
GAAP Measure
Financial Measure
*
Interest
Income
(Expense)
Yield/Cost
Difference
Interest
Income
(Expense)
Yield/Cost
Interest income:
Mortgage assets
$
199,300
2.60%
$
–
$199,300
2.60%
Other interest-earning assets
**
478
0.19
(478)
–
–
199,778
2.52
(478)
199,300
2.60
Interest expense:
Secured borrowings (borrowings under
repurchase arrangements)
(47,502)
0.66
–
(47,502)
0.66
Unsecured borrowings
***
(8,747)
8.49
8,747
–
–
Other interest-paying liabilities ****
(2)
0.19
2
–
–
(56,251)
0.78
8,749
(47,502)
0.66
Net interest margin/financing spread
$
143,527
1.74
$
8,271
$
151,798
1.94
*
Net interest margin on mortgage assets
and Financing spread on mortgage assets
on interest income and yields on the Company’s portfolio of mortgage securities,
net of borrowings under repurchase agreements). These measures are similar to the
all-inclusive GAAP measures, Total net interest margin and Total financing spread (based
on all interest-earning assets and all interest-bearing liabilities).
**
Other interest-earning assets consist of overnight investments and cash collateral receivable from
interest rate swap counterparties. ***
Unsecured borrowings consist of junior subordinated notes with original terms of 30 years issued in
2005 and 2006 by Capstead to statutory trusts formed to issue $3.1 million of the trusts’
common securities to Capstead and to privately place $100.0 million of preferred securities to
unrelated third party investors. Capstead reflects its investment in the trusts as unconsolidated affiliates and
considers the unsecured borrowings, net of these affiliates, a component of its long-term
investment capital. ****
Other interest-paying liabilities consist of cash collateral payable to interest rate swap
counterparties. Use of Financial Spread on Mortgage Assets,
a Non-GAAP Financial Measure
Year Ended December 31, 2010 (dollars in thousands)
15
are non-GAAP financial measures (based solely |
 Financing Spread on
Mortgage Assets,
Total Financing Spread,
a
Non-GAAP
a
GAAP Measure
Financial Measure
Interest
Income
(Expense)
Yield/Cost
Difference
Interest
Income
(Expense)
Yield/Cost
Corresponding
Third Quarter
2010
Yield/Cost
Interest income:
Mortgage assets
$
50,902
2.51%
$
–
$
50,902
2.51%
2.22%
Other interest-earning assets
**
140
0.20
(140)
–
–
0.26
51,042
2.44
(140)
50,902
2.51
2.18
Interest expense:
Secured borrowings (borrowings under
repurchase arrangements)
(11,892)
0.62
–
(11,892)
0.62
0.66
Unsecured borrowings
***
(2,187)
8.49
2,187
–
–
8.49
Other interest-paying liabilities
****
(2)
0.19
2
–
–
–
(14,081)
0.73
2,189
(11,892)
0.62
0.78
Net interest margin/financing spread
$
36,961
1.71
$
2,049
$
39,010
1.89
1.40
*
Net interest margin on mortgage assets and Financing spread on mortgage assets
on interest income and yields on the Company’s portfolio of mortgage securities, net of
borrowings under repurchase agreements). These measures are similar to the
all-inclusive GAAP measures, Total net interest margin and Total financing spread (based
on all interest-earning assets and all interest-bearing liabilities).
**
Other interest-earning assets consist of overnight investments and cash collateral receivable from
interest rate swap counterparties. ***
Unsecured borrowings consist of junior subordinated notes with original terms of 30 years issued in
2005 and 2006 by Capstead to statutory trusts formed to issue $3.1 million of the trusts’
common securities to Capstead and to privately place $100.0 million of preferred securities to
unrelated third party investors. Capstead reflects its investment in the trusts as unconsolidated affiliates and
considers the unsecured borrowings, net of these affiliates, a component of its long-term
investment capital. ****
Other interest-paying liabilities consist of cash collateral payable to interest
rate swap counterparties. Use of Financial Spread on Mortgage Assets,
a Non-GAAP Financial Measure
Fourth Quarter 2010 (dollars in thousands)
16
are non-GAAP financial measures (based solely
* |
 Experienced Management Team
17
Over 80 years of combined mortgage finance industry experience, including nearly 75
years at Capstead Andrew
F.
Jacobs
–
President
and
Chief
Executive
Officer,
Director
–
Has served as president and chief executive officer since 2003 and has held various
executive positions at Capstead since 1988 –
Certified Public Accountant (“CPA”), member of the Board of Governors of
the National Association of Real Estate Investment Trusts
(“NAREIT”), chairman of NAREIT’s Council of Mortgage REITs, member
of the executive committee of the Chancellors Council of the University of
Texas System, the Executive Council of the Real Estate Finance and Investment Center at the University of Texas
at Austin, the American Institute of Certified Public Accountants
(“AICPA”), and the Financial Executive International (“FEI”)
Phillip A. Reinsch
–
Executive Vice President and Chief Financial Officer, Secretary
–
Has
held
various
financial
accounting
and
reporting
positions
at
Capstead
since
1993
–
Formerly employed by Ernst & Young LLP as an audit senior manager focusing on
mortgage banking and asset securitization –
CPA, Member AICPA, FEI
Robert A. Spears
–
Executive Vice President, Director of Residential Mortgage Investments
–
Has served in asset and liability management positions at Capstead since 1994
–
Formerly Vice President of secondary marketing with NationsBanc Mortgage
Corporation Michael
W.
Brown
–
Senior
Vice
President,
Asset
and
Liability
Management,
Treasurer
–
Has served in asset and liability management positions at Capstead since 1994
–
MBA, Southern Methodist University, Dallas, Texas |