Attached files
| file | filename |
|---|---|
| EX-23.2 - EXHIBIT 23.2 - P10 Industries, Inc. | ex23_2.htm |
| EX-23.1 - EXHIBIT 23.1 - P10 Industries, Inc. | ex23_1.htm |
| EX-32.2 - EXHIBIT 32.2 - P10 Industries, Inc. | ex32_2.htm |
| EX-31.2 - EXHIBIT 31.2 - P10 Industries, Inc. | ex31_2.htm |
| EX-31.1 - EXHIBIT 31.1 - P10 Industries, Inc. | ex31_1.htm |
| EX-21.1 - EXHIBIT 21.1 - P10 Industries, Inc. | ex21_1.htm |
| EX-32.1 - EXHIBIT 32.1 - P10 Industries, Inc. | ex32_1.htm |
UNITED STATES
SECURITIES AND EXCHANGE COMMISSION
WASHINGTON, D.C. 20549
FORM 10-K
|
x
|
ANNUAL REPORT PURSUANT TO SECTION 13 OR 15(d) OF THE SECURITIES EXCHANGE ACT OF 1934
|
For the fiscal year ended December 31, 2010
OR
|
¨
|
TRANSITION REPORT PURSUANT TO SECTION 13 OR 15(d) OF THE SECURITIES EXCHANGE ACT OF 1934
|
For the transition period from to
Commission file number: 000-30939
ACTIVE POWER, INC.
(Exact name of registrant as specified in its charter)
|
Delaware
|
74-2961657
|
|
|
(State or other jurisdiction of incorporation or organization)
|
(I.R.S. Employer Identification No.)
|
|
|
2128 W. Braker Lane, BK 12, Austin, Texas
|
78758
|
|
|
(Address of principal executive offices)
|
(Zip Code)
|
|
|
(512) 836-6464
(Registrant’s telephone number, including area code)
Securities registered pursuant to Section 12(b) of the Act:
|
||
|
Title of Class
|
Name of Exchange on Which Registered
|
|
|
Common Stock, $0.001 per share
|
The Nasdaq Stock Market LLC
|
|
|
(Nasdaq Global Market)
|
||
Securities registered pursuant to Section 12(g) of the Act:
Preferred Share Purchase Rights
(Title of Class)
Indicate by check mark if the registrant is a well-known seasoned issuer, as defined in Rule 405 of the Securities Act. ¨ Yes þ No
Indicate by check mark if the registrant is not required to file reports pursuant to Section 13 or Section 15(d) of the Exchange Act. ¨ Yes þ No
Indicate by check mark whether the registrant (1) has filed all reports required to be filed by Section 13 or 15(d) of the Securities Exchange Act of 1934 during the preceding 12 months (or for such shorter period that the registrant was required to file such reports), and (2) has been subject to such filing requirements for the past 90 days. þ Yes ¨ No
Indicate by check mark whether the registrant has submitted electronically and posted on its corporate Web site, if any, every Interactive Data File required to be submitted and posted pursuant to Rule 405 of Regulation S-T (§ 232.405 of this chapter) during the preceding 12 months (or for such shorter period that the registrant was required to submit and post such files). ¨ Yes ¨ No
Indicate by check mark if disclosure of delinquent filers pursuant to Item 405 of Regulation S-K is not contained herein, and will not be contained, to the best of registrant’s knowledge, in definitive proxy or information statements incorporated by reference in Part III of this Form 10-K or any amendment to this Form 10-K. o
1
Indicate by check mark whether the registrant is a large accelerated filer, an accelerated filer, a non-accelerated filer, or a smaller reporting company. See the definitions of “large accelerated filer,” “accelerated filer,” and “smaller reporting company” in Rule 12b-2 of the Exchange Act. (Check one)
|
Large accelerated filer ¨
|
Accelerated filer þ
|
Non-accelerated filer ¨
|
Smaller reporting company ¨
|
|
(Do not check if a smaller reporting company)
|
|||
Indicate by check mark whether the registrant is a shell company (as defined in Rule 12b-2 of the Exchange Act) ¨ Yes þ No
The aggregate market value of the voting and non-voting common equity held by non-affiliates of the registrant, based upon the closing sale price of its common stock on the last day of registrant’s most recently completed second fiscal quarter, June 30, 2010, as reported on The Nasdaq Stock Market, was approximately $56.6 million (affiliates being, for these purposes only, directors and executive officers).
As of February 28, 2011, the registrant had 79,925,254 shares of common stock outstanding.
Documents Incorporated by Reference
Certain information required by Part III of Form 10-K is incorporated by reference to the registrant’s proxy statement for the 2011 Annual Meeting of Stockholders, which will be filed with the Securities and Exchange Commission within 120 days after the close of the registrant’s fiscal year ended December 31, 2010.
2
Active Power, Inc.
Unless otherwise indicated, “we,” “us,” “our,” and “Active Power” mean Active Power, Inc., including our predecessor Texas corporation and our subsidiary companies. References in this report to “$” or “dollars” are to United States of America currency.
Table of Contents
|
PART I
|
||
|
ITEM 1.
|
5
|
|
|
ITEM 1A
|
17
|
|
|
ITEM 1B.
|
24
|
|
|
ITEM 2.
|
24
|
|
|
ITEM 3.
|
24
|
|
|
ITEM 4.
|
24
|
|
|
PART II
|
||
|
ITEM 5.
|
25
|
|
|
ITEM 6.
|
27
|
|
|
ITEM 7.
|
28
|
|
|
ITEM 7A.
|
45
|
|
|
ITEM 8.
|
45
|
|
|
ITEM 9.
|
45
|
|
|
ITEM 9A.
|
45
|
|
|
ITEM 9B.
|
46
|
|
|
PART III
|
||
|
ITEM 10.
|
47
|
|
|
ITEM 11.
|
49
|
|
|
ITEM 12.
|
49
|
|
|
ITEM 13.
|
50
|
|
|
ITEM 14.
|
50
|
|
|
PART IV
|
||
|
ITEM 15.
|
51
|
Special Note Regarding Forward-Looking Statements
This report on Form 10-K contains forward-looking statements within the meaning of Section 27A of the Securities Act of 1933, as amended, and Section 21E of the Securities Exchange Act of 1934, as amended. All statements other than statements about historical or current facts, including, without limitation, statements about our business strategy, plans and objectives of management and our future prospects, are forward-looking statements. Although we believe that the expectations reflected in such forward-looking statements are reasonable, such forward-looking statements are subject to risks and uncertainties that could cause actual results to differ materially from these expectations. Such risks and uncertainties include, without limitation, the following:
|
|
•
|
strategic relationships with third parties, including suppliers and channel partners;
|
|
|
•
|
customer demand for our products;
|
|
|
•
|
customer adoption of new products;
|
|
|
•
|
growth and future operating results;
|
|
|
•
|
developments in our markets;
|
|
|
•
|
expansion of our product offerings and sales channels;
|
|
|
•
|
customer benefits attributable to our products;
|
|
|
•
|
technologies and operations;
|
|
|
•
|
industry trends; and
|
|
|
•
|
future economic, business and regulatory conditions.
|
You can identify these statements by forward-looking words such as “may,” “will,” “expect,” “intend,” “anticipate,” “believe,” “estimate,” “continue” and other similar words. You should read statements that contain these words carefully because they discuss our future expectations, make projections of our future results of operations or financial condition, or state other “forward-looking” information. We believe that it is important to communicate our future expectations to our investors. However, there may be events in the future that we are not able to accurately predict or control. The factors listed in the section captioned “Risk Factors” in Item 1A of this report, as well as any cautionary language in this report, provide examples of risks, uncertainties and events that may cause our actual results to differ materially from the expectations we described in our forward-looking statements.
PART I.
|
ITEM 1.
|
Business.
|
Overview and Strategy
Active Power is headquartered in Austin, Texas, where we manufacture our patented flywheel uninterruptible power supply (“UPS”) systems and continuous power and infrastructure solutions. These solutions ensure continuity for business and IT operations for enterprises, data center operations and IT service providers in the event of power disturbances.
Our products and solutions are designed to deliver continuous clean power during power disturbances and outages, voltage sags and surges and provide ride-through power in the event of utility failure supporting operations until utility power is restored or a longer term alternative power source, such as a diesel generator is started. We believe that our products offer an advantage over those of our competitors in the areas of space and energy efficiency, total cost of ownership, system reliability, modular design and the economically green benefits of our solutions.
As of December 31, 2010, we have shipped more than 2,800 flywheels in UPS system installations, delivering more than 700 megawatts of power to customers in 42 countries around the world with more than 100 million runtime hours of operation. We are headquartered in Austin, Texas, with international offices in the United Kingdom, Germany, China and Japan.
We believe a number of underlying macroeconomic trends place Active Power in a strong position to be one of the leading providers of critical power protection. These trends include:
|
|
•
|
ever-increasing demands placed on the public utility infrastructure;
|
|
|
•
|
an inadequate investment in global utility infrastructure;
|
|
|
•
|
rising costs of energy worldwide;
|
|
|
•
|
rising volume of energy used worldwide;
|
|
|
•
|
increasing business costs of downtime;
|
|
|
•
|
a rapidly expanding need for data center infrastructure; and
|
|
|
•
|
an increasing demand for economically green solutions.
|
We have evolved significantly since our founding in 1992 as an engineering business focused on research, development and invention. The technological foundation of Active Power has yielded more than 100 worldwide patents and a highly differentiated, cost-efficient product platform. In 2005, Active Power’s board of directors brought in a new management team which set into motion a commercialization strategy focused on:
|
|
•
|
building the Active Power brand in the marketplace;
|
|
|
•
|
expanding our distribution channels;
|
|
|
•
|
creating innovative solutions; and
|
|
|
•
|
focusing on operating and product cost reduction.
|
Go–to-Market Strategy
We have developed and implemented a go-to-market strategy to set the direction for our sales and marketing initiatives and plans around the following components:
|
|
·
|
Brand Awareness;
|
|
|
·
|
Products and Services;
|
|
|
·
|
Target Markets;
|
|
|
·
|
Market Drivers;
|
|
|
·
|
Value Proposition;
|
|
|
·
|
Distribution Strategy;
|
|
|
·
|
Market Focus and Key Customers; and
|
|
|
·
|
Competitive Landscape.
|
Brand Awareness
Active Power deploys a variety of initiatives to build awareness and interest in Active Power and our solutions. Our broad mix of programs includes market research, product and strategy updates with industry analysts, public relations activities, advertising, Web-based marketing and relationship marketing programs, seminars, Webinars, customer events, user group meetings, trade shows and speaking engagements. We deliver a variety of materials to support these efforts including original research, case studies, white papers, collateral, engineering documentation, position papers, presentations, sales tools, editorial materials and product demonstration capabilities. All of these efforts are geared to support our global sales team and partners.
Products and Services
CleanSource UPS and DC Products
Active Power introduced the world’s first integrated flywheel UPS system, which integrates UPS power electronics with flywheel energy storage technology. The flywheel stores kinetic energy – energy produced by motion – by constantly spinning a compact rotor in a low friction environment. When short-term backup power is required due to utility power fluctuations or losses, the rotor’s inertia allows it to continue spinning and the resulting kinetic energy is converted to electricity. The UPS draws upon the stored kinetic energy of the spinning flywheel to generate electricity to the load until the utility power returns, or in the event of a longer interruption, the generator comes online as a power source. The flywheel immediately supports the critical load upon loss of utility power. Within seconds of an extended outage occurring, the UPS signals the generator to start via the automatic transfer switch. The generator then carries the load until utility is restored.
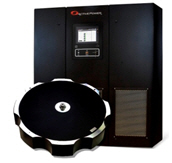
We market our flywheel-based UPS under the brand name CleanSource UPS®. CleanSource UPS is a battery-free UPS system that integrates normal UPS electronics and our flywheel energy storage system into one compact cabinet lineup. We currently offer CleanSource UPS products in power configurations ranging from 130kVA up to 1.5 MVA, with the ability to parallel these products to provide more than eight megawatts of load protection. Combining CleanSource UPS with a generator provides customers with complete short- and long-term protection in the event of a power disturbance. UPS products, branded by Active Power or our original equipment manufacturer (“OEM”) partners, represent a majority of our current revenues and represented 67%, 60% and 48% of our total revenue for the years ended December 31, 2008, 2009 and 2010, respectively.
CleanSource DC is a battery-free replacement for lead acid batteries used for bridging power. Using our flywheel energy storage technology, CleanSource DC is a stand-alone direct current (“DC”) product compatible with all major brands of UPS systems. Since 2010 we have ceased active marketing and sales of CleanSource DC due to limited customer demand for the product.
PowerHouse Systems
For customers looking for a complete, integrated continuous power system, we package our CleanSource UPS along with a generator, switch gear, monitoring and controls software, our generator starting module (known as “GenSTART”), an optional cooling system, and a comprehensive maintenance package all into a containerized solution offering we call PowerHouse TM. PowerHouse is packaged in a purpose-built enclosure with size and features depending upon the customer’s power load requirements and local and national regulatory requirements. These systems are specifically designed to handle the demands of data center facilities requiring the highest power integrity available while maximizing up time, useable floor space and operational efficiency. Designed to offer a highly flexible architecture to a customer’s constantly changing environment, our systems are offered in eight standard modular power configurations, enabling sizing for infrastructure on demand. These systems are highly differentiated as they offer flexibility in placement, space savings, fast deployment time after receipt of order, high energy efficiency, and prompt capital deployment to meet current demands. They also deliver significant value to customers as the entire system is integrated and tested prior to delivery for a repeatable and simple solution. PowerHouse, introduced as a product in 2009, represented 20% of total revenue in 2010.
Continuous Infrastructure
Leveraging our expertise in containerization and power distribution, in 2010 we began to manufacture continuous infrastructure solutions, designed to specification for select business partners. These solutions serve as the infrastructure for modular data centers, which are self-contained fully-functional data centers. Modular data centers may be rapidly deployed with other modular data centers as a cost-effective alternative to traditional raised-floor data centers. Active Power designs and delivers the exterior shell and a fully fitted-out interior – including electrical, cooling, monitoring, and other elements – ready for the customer to add their IT racks and servers. After the customer adds their IT equipment to our continuous infrastructure solution, the customer has a functional data center. Continuous infrastructure solutions represented 18% of revenue in 2010. We expect revenue to grow in coming years from current and future customers as modular data center infrastructure continues to gain acceptance in the market.
GenSTART
GenSTART is a battery-free, starting modular system designed to ensure that a customer’s diesel generator will start. Diesel failure is a common cause of UPS system failure when there is a power disturbance. This unique and patented product takes energy from the flywheel of the CleanSource UPS and provides 1725 cold cranking amps to the generator set starting motor, so the customer can be assured starting power is available when it is most critical – at start-up. GenSTART is sold in conjunction with our CleanSource UPS system and is also a critical component in our PowerHouse solution. It can also be sold independently of our UPS product and works with third-party UPS systems.
Service
We deliver worldwide customer support through our technical services division that offers clients assessment, implementation and lifecycle support services for all Active Power systems. Building a portfolio of services to work with clients through the lifecycle of their power assessment design and implementation process is a key element of our service growth strategy. We offer the following services to our customers:
|
|
•
|
Infrastructure Needs Assessment. We work locally through our global network of mission critical infrastructure engineers and project managers to assess the power and cooling needs of a client’s facility;
|
|
|
•
|
Vetting and Validation. Our teams of experienced application engineers use comprehensive assessments to vet and validate the most optimal solution that complements a client’s business continuity plan;
|
|
|
•
|
Alignment with Business Objectives. Through continuous communication, our teams ensure the solution accurately aligns with the original needs assessment and a client’s short-term and projected future business objectives;
|
|
|
•
|
System Design. We design client solutions to ensure all components are optimized, with a particular focus on reliability, efficiency and cost effectiveness in determining the correct match and interoperability between components;
|
|
|
•
|
Deployment. Our experienced group of project managers will work with a client to develop a timely deployment schedule with the least impact on day-to-day business. We ensure expectations are clearly defined through the deployment phase;
|
|
|
•
|
Start-Up and Commissioning. Once the system is deployed, our team takes the system through a rigorous commissioning process to ensure the system is working to specification. Our engineers work closely with the client’s team to make certain they are educated and trained on the successful operation of the system; and
|
|
|
•
|
Service, Support and Monitoring. Clients can choose from a variety of comprehensive service and support offerings, tiered to match an organization’s internal capabilities and requirements. We offer four tiers of maintenance programs specifically designed to deliver on both the long-term preventive maintenance requirements for the system and a client’s need for support. Level of support is at the client’s discretion. Ensuring a reliable and efficient operation requires accurate monitoring, which we offer as a hands-off remote monitoring service in our center, locally at the client’s facility, or as a combination of both.
|
Target Markets - Global Power and Infrastructure
According to a 2010 report on the world UPS market by IMS Research, the global UPS market was estimated to be more than $7 billion in 2010. IMS Research projects the market will increase to nearly $9 billion in 2012 and is expected to grow to more than $10 billion by 2014 with a compound annual growth rate of nearly 10%.
UPS products can be classified into single phase and three phase systems. Active Power is engaged in the higher power, three phase market and does not offer any systems in the lower power, single phase range. The market for three phase systems is typically stratified by kVA (kilo-Volt-Amps or power level) and by geography. Active Power has refined its focus on customers in the 100 kVA and higher category. In 2010, this category of the UPS market was estimated to be $1.8 billion of the global market and is forecasted to be nearly $3.0 billion of the total market opportunity in 2014 according to the 2010 IMS Research report. This is one of the fastest growing segments of the UPS market according to IMS Research.
UPS products serve two primary functions. First, during normal operations they are continuously “cleaning” the incoming power from the utility and delivering “conditioned” power to the client’s mission critical load (i.e., IT equipment). In this mode, the UPS specifically regulates incoming utility power fluctuations in voltage and frequency. Second, if there is any interruption in the utility source, the UPS will provide temporary, or bridging, power until either the utility power is restored, or an alternative generating source, such as a diesel or gas generator, begins to provide power. This role of the UPS in the context of a continuous power application is illustrated below:
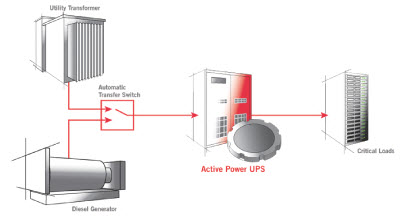
The continuous power solutions market for products like PowerHouse significantly expands our addressable market. These solutions typically contain all the components of a continuous power system, UPS, generator, switchgear, monitoring system, integrated and housed in a 20- or 40-foot custom container for standalone outside building applications or alternatively delivered on an integrated skid for standalone inside building applications. We believe that the additional products, integration and services significantly expand the market opportunity and revenue contribution for us.
UPS, Continuous Power and Infrastructure Market Drivers
We believe that there are several market dynamics fueling the growth of the UPS, continuous power and infrastructure markets and the need for energy efficient, reliable and green backup power. These include:
Increase in global energy consumption:
|
|
•
|
Rapid industrialization of highly populated world regions is increasing global energy demand
|
|
|
•
|
An increasing cost to produce and consume electricity due to rapid depletion of finite fossil fuel sources, instability in oil-producing regions and a preference for green energy sources.
|
Increase in data usage and data center floor space:
|
|
•
|
Growth of enterprise data, social networking sites, Web-based applications, cloud computing and other similar technologies requires data centers to invest in more IT and physical infrastructure equipment to support growth; and
|
|
|
•
|
Deployment of additional IT and infrastructure requires more floor space.
|
More awareness of energy efficiency from both a corporate social responsibility and financial perspective:
|
|
•
|
More investment in highly efficient, sustainable technologies to keep electricity costs down, but also to stay competitive in the marketplace;
|
|
|
•
|
Government legislation like the United Kingdom Carbon Reduction Commitment Energy Scheme and other cap and trade programs are becoming more prominent to help eliminate carbon emissions; and
|
|
|
•
|
Electricity costs are the highest single operating costs for many organizations due to substantial amount of power needed to support their data center facilities.
|
Containerized, modular datacenters are becoming more commonplace, not solely for specific niche applications like military and high density computing environments:
|
|
•
|
Collocation sites that house containerized datacenters are becoming more prevalent due to performance and tangible economic benefits;
|
|
|
•
|
Short lead times and rapid deployment capability will increase demand for containerized, modular datacenter products, particularly for those organizations that do not have capital readily available to commit to building a brick and mortar facility; and
|
|
|
•
|
Modular design-build approach is a more capital efficient model, enabling organizations to deploy IT and infrastructure as business and IT needs evolve, preventing underutilization.
|
Customers focused on convenience and improving margins:
|
|
•
|
More mission critical organizations are moving towards innovatively designed, turnkey datacenter and infrastructure solutions that involve less risk, cost and complexity and more automation; and
|
|
|
•
|
Organizations want the ability to rapidly deploy datacenter and associated power and cooling infrastructure.
|
Increasing economic impact of power interruption to users:
|
|
•
|
The financial cost of power interruption through loss of products, manufacturing down time, and computer processing interruptions; and
|
|
|
•
|
Reputational cost of power interruption to businesses.
|
Value Proposition and Differentiation
We believe our key areas of differentiation across all product lines align very well with market drivers and customer demand. The core differentiators for all Active Power’s solutions are the following:

|
|
§
|
Engineered to deliver industry leading energy efficiency performance reducing losses therefore using less energy; and
|
|
|
§
|
Power delivered in half the space of competitive systems.
|

|
|
§
|
Unique patented design delivers predictable consistent and continuous operation; and
|
|
|
§
|
Proven to be less likely to fail versus conventional systems.
|

|
|
§
|
Reduces operating expenses, carbon footprint and impact on the environment; and
|
|
|
§
|
Delivers significant total cost of ownership savings to our customers in the near term.
|
Distribution Strategy
We continue to develop client relationships by selling directly and through our network partners. Specifically, we bring products to market through the following distribution methods:
|
|
•
|
sales made directly by Active Power;
|
|
|
•
|
manufacturer’s representatives;
|
|
|
•
|
distributors;
|
|
|
•
|
OEM partners; and
|
|
|
•
|
strategic IT partners
|
Sales made directly by Active Power. Our direct sales teams are located in North America, Europe and Asia markets and are supported by five regional offices in the US, United Kingdom, Germany, Japan and China. Our direct sales teams are securing and establishing local presence and brand awareness, winning large customer orders and developing the foundation for the long-term client relationships in their local markets.
Manufacturer’s Representatives. We have both exclusive and non-exclusive relationships in place with a group of manufacturer’s representatives primarily in North America. An exclusive representative has been granted exclusive rights to sell Active Power products in a specific geographic territory. In exchange, the representative has agreed to sell a specific volume of our products and not sell any competitive products, all in exchange for compensation at a specified rate that is tied to the profitability of the underlying sales. We also maintain a group of non-exclusive representatives who have each been designated a territory in which to sell our products on a non-exclusive basis for a lower specified commission rate. The manufacturer’s representative channel remains integral to the distribution of our products in North America and increases our geographic sales coverage without the necessity of adding direct sales personnel. Products are marketed and sold under the Active Power brand through this channel.
Distributors. In certain markets, primarily overseas, we have elected to recruit and retain specific distributors to market our products and services into a designated geographic market. The distributor buys products from us and resells them to the end user, often with other products or services. Distributors may also perform service and warranty work for us under contract. This strategy has been successful for us in markets where we do not choose to deploy direct sales resources.
OEM Partners. OEM partners are our longest standing method of distribution and remain key to our overall business strategy. We continue to invest in this distribution channel and have experienced significant performance improvements in this channel in 2010. Our primary OEM partner and one of our largest customers is Caterpillar, Inc. (“Caterpillar”). Caterpillar markets Active Power’s UPS products under the Caterpillar brand name “CAT UPS” and as a complement to its electric power product lines of diesel engines and switchgear. Caterpillar is a global market leader in new generator sales and has the largest installed base of existing standby generators in the world. By offering the CAT UPS with a standby generator and switchgear, Caterpillar can transform a standby power system into a continuous power system. We believe this total solution gives both Caterpillar and Active Power significant competitive advantages in the power quality market. In 2008, we signed a three-year distribution agreement with Caterpillar to continue this important relationship that dates back to 1999. Our sales to Caterpillar represented 40%, 24% and 19% of our total revenue for the years ended December 31, 2008, 2009 and 2010, respectively.
Strategic IT Partners. We have entered into a number of agreements since 2007 with leading global organizations in the data center market who have the ability to collaborate with Active Power on new sales opportunities. These relationships help us expand potential opportunities to market our products and services through all of our distribution channels. Some of the major partnerships we have entered into include the following:
|
|
•
|
Hewlett Packard (“HP”). We are a member of HP’s Data Center Solution Builders Program. This program is designed to develop and deliver new technologies and products and services that are targeted towards energy conservation and other operational improvements in data center design or operation. The program allows Active Power to promote its PowerHouse solution jointly with HP on a global basis and to support the power infrastructure requirements of HP’s Performance Optimized Data Center products. We saw significant results from this channel in 2010. We have also entered into a Master Services Agreement with HP that allows HP to purchase any of our products, including CleanSource UPS and PowerHouse, for their own use or to resell our products to their customers.
|
|
|
•
|
Sun Microsystems, Inc. / Oracle. We have entered into a strategic relationship with Sun whereby we jointly market and promote our PowerHouse and CleanSource UPS products and their Sun Modular Datacenter product on a global basis. We have also entered into global supply and service agreements with Sun to allow Sun to purchase any of our products and services and resell them to Sun’s customers on a global basis. Since the acquisition by Oracle, we have seen very little activity with Sun.
|
Market Focus and Key Customers
Active Power is focusing its marketing and customer acquisition efforts in 13 global regions supported by five regional offices or operations centers. Our operations centers are located in Austin, Texas; Osterode Germany; Evesham, United Kingdom; Beijing, China; and Tokyo, Japan. The 13 global regions we are pursuing represent 76% of the addressable global UPS market. Our global operations centers are planned to provide local sales and service, applications engineering, containerization, integration and product testing for our continuous power and infrastructure solutions. Sales outside of the U.S. accounted for approximately 39%, 31% and 29% of our revenues in 2008, 2009 and 2010, respectively. We expect that a significant portion of our total revenue will continue to be derived from international sales.
Caterpillar and its dealer network is our primary OEM customer and our largest single customer for our flywheel-based products. Caterpillar and its dealer network accounted for 40%, 24% and 19% of our total revenue during 2008, 2009 and 2010, respectively. Hewlett Packard Corporation is our largest IT channel partner and accounted for 12% and 25% of our revenue during 2009 and 2010, respectively. One other US-based IT customer represented 8% and 16% of revenue in 2009 and 2010, respectively.
The focus of Active Power’s go-to-market strategy is on customer applications, not individual vertical markets. We deliver products and solutions that support and enable mission critical IT and data center focused applications. These applications can be found in a breadth of vertical markets. The vertical markets where our products and solutions are uniquely suited include service provider/collocation, healthcare, financial, government/military and telecommunications. On a more opportunistic basis, we are focused on delivering power quality solutions to a set of vertical markets including broadcast, airports and industrial.
The following list provides a representative sample of end user customers that utilize our products and solutions to support and enable their operations. The list includes customers to whom such products and solutions have been sold directly by Active Power or via our OEM partners, manufacturing representatives, distributors or strategic IT partners:
|
Representative Customers
|
Industry
|
|
Andrews Federal Credit Union
|
Financial
|
|
AT&T
|
Telecommunications
|
|
Baptist Medical System
|
Healthcare
|
|
Barclay's PLC
|
Financial
|
|
Boone Hospital
|
Healthcare
|
|
Brookhaven National Laboratory
|
Government / Military
|
|
Budapest Ferihegy International Airport
|
Airports
|
|
Christian Television Network
|
Broadcast
|
|
Community Health Network
|
Healthcare
|
|
Data Bank
|
Service Provider / Collocation
|
|
Data Cave
|
Service Provider / Collocation
|
|
DigiPlex
|
Service Provider / Collocation
|
|
Dubai Stock Exchange
|
Financial
|
|
Erdemir
|
Industrial
|
|
French Army
|
Government / Military
|
|
Hitachi Computer Products America
|
Industrial
|
|
Huawei Technologies
|
Telecommunications
|
|
Kosice Airport
|
Airports
|
|
KVVU-TV (FOX)
|
Broadcast
|
|
Level 3
|
Telecommunications
|
|
LightBound
|
Service Provider / Collocation
|
|
MBNA
|
Financial
|
|
New York Police Department
|
Government / Military
|
|
Pemex Refinacion
|
Industrial
|
|
Profitability.net
|
Service Provider / Collocation
|
|
Royal Bank of Scotland
|
Financial
|
|
St. Luke's Hospital
|
Healthcare
|
|
Suvarnabhumi Airport (Bangkok)
|
Airports
|
|
Terremark Worldwide
|
Service Provider / Collocation
|
|
TierPoint
|
Service Provider / Collocation
|
|
T-Mobile
|
Telecommunications
|
|
Tracfone Wireless
|
Telecommunications
|
|
U.S. Air Force
|
Government / Military
|
|
U.S. Army
|
Government / Military
|
|
U.S. Navy
|
Government / Military
|
|
U.S. State Department
|
Government / Military
|
|
VISI
|
Service Provider / Collocation
|
|
Wacker Chemie AG
|
Industrial
|
|
WGTE-TV (PBS)
|
Broadcast
|
|
WTVF-TV (CBS)
|
Broadcast
|
|
WXYZ-TV (ABC)
|
Broadcast
|
Competitive Landscape
Active Power competes in three primary product areas: UPS systems, continuous power solutions, and continuous infrastructure solutions.
UPS Systems. CleanSource UPS competes primarily against conventional battery-based UPS systems from vendors such as Emerson/Liebert, Eaton/Powerware and APC/MGE and rotary UPS systems from vendors such as Piller, Eurodiesel, and Hitec. For applications requiring less than one megawatt of critical load, we largely compete against the battery-based competitors and for applications greater than one megawatt we tend to compete against the rotary (battery-free) systems. There is greater market acceptance of battery-free solutions compared to battery-based solutions in the one-megawatt and larger power range, making this an ideal segment for our CleanSource UPS products. Several of the leading conventional UPS battery vendors have begun offering flywheel-based energy storage to replace batteries. Vycon is the principal manufacturer of these solutions.
Our primary basis of competition in UPS systems is product differentiation and our advantage in space and power efficiencies, reliability, and total cost of ownership.
Continuous Power Solutions. Continuous power solutions are a growing sector of our business that enables us to leverage the strengths and key benefits of our core product, CleanSource UPS. PowerHouse is the brand name for our prepackaged continuous power systems which are delivered in purpose-built enclosures for fast deployment to space constrained operations and disaster recovery or temporary applications, or to provide power and cooling infrastructure for a modular data center. We also offer complete continuous power systems designed for use in traditional data center environments.
There are a variety of competitors with similar capabilities including system integrators and value added service providers who may procure required system components and assemble custom solutions. We believe that Active Power is one of only a few UPS manufacturers in the world also offering pre-packaged standard systems for quick delivery globally. The power density advantages we enjoy with our UPS products allow us to offer higher continuous power levels within the physical constraints of the containerized space compared to our competitors, which we believe is a barrier to entry for them and will lead to higher revenues from turnkey systems for Active Power in the future. Also, our product’s ability to operate in temperatures of up to 40 degrees Centigrade in non-air conditioned environments (such as a shell building or open-air facility) acts as a competitive barrier to entry for battery UPS systems which must have sufficient air conditioning to operate properly. Since early 2008, we have entered into agreements to jointly market and sell PowerHouse and related services in conjunction with Sun Microsystems and Hewlett Packard. Active Power will support the modular or containerized data center products of each of these partners. We believe our ability to jointly market and leverage the activities of our mutual sales channels increases the revenue potential of PowerHouse for Active Power in future periods.
Continuous Infrastructure Solutions. Continuous infrastructure solutions refers to the components of a containerized / modular data center. In 2010, Active Power began designing and manufacturing continuous infrastructure solutions for select business partners on a contract basis. Active Power designs to specification and manufactures the modular shell and outfits the interior infrastructure (electrical, cooling, monitoring, etc.). Our clients will then add the IT servers and racks, resulting in a self-contained modular data center that our partners sell to end users.
As with PowerHouse, there are a variety of competitors around the globe with similar capabilities to manufacture these systems. We believe that Active Power’s experience with the power and cooling requirements of the infrastructure provides us with a competitive advantage in the design and manufacturing of these products. Further, the joint offering of our PowerHouse continuous power solutions with the continuous infrastructure solutions provides efficiencies, scale, and advantages in sales, marketing, and engineering that we expect customers to find compelling over time.
Many of our current competitors have longer operating histories, greater financial, technical, marketing and other resources, broader name and brand recognition, and a larger installed base of customers and service infrastructure than we do. As a result, these competitors may have greater credibility with our existing and potential customers. They also may be able to adopt more aggressive pricing policies and devote greater resources to the development, promotion and sale of their products than we can, which would allow them to respond more quickly to new or emerging technologies or changes in customer requirements. In addition, some of our current competitors have established supplier or joint development relationships with our current or potential customers and channel partners. These competitors may be able to leverage their existing relationships to discourage these customers from purchasing products from us or to persuade them to replace our products with their products. Increased competition could decrease our prices, reduce our sales, lower our margins or decrease our market share. These and other competitive pressures could prevent us from competing successfully against current or future competitors and could materially harm our business.
Intellectual Property and Assets
We rely upon a combination of patents, trademarks, confidentiality agreements and other contractual restrictions with employees and third parties to establish and protect our proprietary rights. We have filed dozens of applications before the U.S. Patent and Trademark Office, of which 51 have been issued as patents, 39 of those patents are currently active. Additionally, we are attempting to strengthen our patent protection abroad for our technology by continuing to file patent applications and receive patents in Europe and Asia. These efforts have resulted in 76 foreign patents being issued, of which 34 are active. Our patent strategy is critical for preserving our rights in and to the intellectual property embedded in our CleanSource and PowerHouse product lines and in newer technologies. As a manufactured, tangible device that is sold, rather than licensed, our products do not qualify for copyright or trade secret protection. To enforce ownership of such technology, we principally rely on the protection obtained through the patents we own and unfair competition laws. We intend to aggressively protect our patents, which would include bringing legal actions if we deem it advisable.
We own the registered trademarks ACTIVE POWER, CLEANSOURCE and COOLAIR in the United States and abroad. All other trademarks, service marks or trade names referred to in this report are the property of their respective owners.
Research and Development
We believe research and development efforts are essential to our ability to successfully deliver innovative products that address the current and emerging customer, particularly as the power management/infrastructure market evolves. Our research and development team works closely with our marketing and sales teams, IT channel partners and OEMs to define product requirements that address specific market needs. Our research and development expenses were $5.1 million, $4.2 million and $3.4 million in 2008, 2009 and 2010, respectively. We anticipate our research and development expenditures in 2011 will increase compared to 2010 as we increase development efforts on our next-generation UPS products but will decrease as a percentage of sales in the future as our revenues grow. As of December 31, 2010, our research, development and engineering teams consisted of 18 engineers and technicians.
Manufacturing
We manufacture our products at our headquarters in Austin, Texas. We are an ISO 9001:2008 quality certified operation which attests to the quality in product and process used to manufacture and deliver products and services to our clients. We source the majority of our components from contract manufacturers to enhance our ability to scale our operations and minimize cost. This approach allows us to respond quickly to customer orders while maintaining high quality standards and optimizing inventory.
Our internal manufacturing process consists of the fabrication of certain critical components within the flywheel energy storage system and the assembly, functional testing and quality control of our finished products. We also test components, parts and subassemblies obtained from suppliers for quality control purposes.
We have entered into long-term agreements with some of our key suppliers, but we currently purchase most of our components on a purchase order basis. Although we use standard parts and components for our products where possible, we currently purchase the flywheel rotor from Canton Drop Forge Inc. and have successfully qualified an alternate supplier for rotors. Lead times for ordering materials and components vary significantly and depend on factors such as specific supplier requirements, contract terms, production time required and current market demand for such components or commodities.
The growth in our revenue stream has enabled a higher level of utilization of our manufacturing facility. In addition, the expansion of our product lines has allowed us to increase production capabilities and gain more extended use of our existing factory. We believe our current workforce, facilities and inventory levels will be sufficient to handle our near-term projected sales demand. Over time, we will need to hire additional manufacturing personnel to address sales volume increases.
Local Assembly
A key component of our strategy is to perform local integration, assembly and testing of our continuous power and infrastructure solutions. Our first facility of this type is located in Evesham, United Kingdom. We have been integrating and testing our PowerHouse systems locally in the UK for the last two years. We recently added in-house and supplier capabilities to support the final electrical and mechanical assembly for our containerized products. We are working towards ISO certification for this facility. We also perform local integration and testing for our PowerHouse solutions in both Beijing, China, and Osterode, Germany, in conjunction with local partner relationships.
Employees
As of December 31, 2010, we had 181 total employees in the following areas:
|
|
•
|
18 in research and development;
|
|
|
•
|
91 in manufacturing, sourcing and service;
|
|
|
•
|
52 in sales and marketing; and
|
|
|
•
|
20 in administration, information technology and finance.
|
None of our employees are represented by a labor union. We have not experienced any work stoppages and consider our relations with our employees to be good.
Seasonality
Our business has experienced seasonal customer buying patterns for a number of years. In recent years, both the UPS industry generally and our business experienced relatively weaker demand in the first calendar quarter of the year and a sequential decrease in revenue from the fourth quarter. We believe this pattern, which we attribute to annual capital budgeting procedures, will continue. We also anticipate demand for our products in Europe and Africa may decline in the summer months as compared to other regions because of reduced corporate buying patterns during the vacation season.
Where You Can Find Other Information
Active Power is a Delaware corporation originally founded in 1992 as a Texas corporation. We file annual, quarterly, current and other reports, proxy statements and other information with the Securities and Exchange Commission (“SEC”) pursuant to the Securities Exchange Act of 1934, as amended, or the Exchange Act. You may read and copy any materials the company files with the SEC at the SEC’s Public Reference Room at 100 F Street, N.E., Washington, D.C. 20549. You may obtain information on the operation of the SEC’s Public Reference Room by calling the SEC at 1-800-SEC-0330. The SEC maintains an Internet site that contains reports, proxy and other information statements, and other information regarding issuers, including Active Power, that file electronically with the SEC. The address of that site is www.sec.gov.
We maintain a Web site at www.activepower.com. We make available free of charge through this site our Annual Report on Form 10-K, quarterly reports on Form 10-Q, current reports on Form 8-K and amendments to those reports filed or furnished pursuant to Section 13(a) or 15(d) of the Exchange Act as soon as reasonably practicable after we electronically file such material with, or furnish it to, the SEC. This information can be found under the heading “Financial Reports” in the “Investor Relations” subsection of the “About Us” section of our Web site. The Web site and the information contained therein or connected thereto are not intended to be incorporated in this Annual Report on Form 10-K.
|
ITEM 1A.
|
Risk Factors
|
You should carefully consider the risks described below before making a decision to invest in our common stock or in evaluating Active Power and our business. The risks and uncertainties described below are not the only ones we face. Additional risks and uncertainties not currently known to us, or that we currently view as immaterial, may also impair our business operations. The actual occurrence of any of the following risks could materially harm our business, financial condition and results of operations. In that case, the trading price of our common stock could decline. This report is qualified in its entirety by these risk factors.
This Form 10-K also contains forward-looking statements that involve risks and uncertainties. Our results could materially differ from those anticipated these forward-looking statements as a result of certain factors, including the risks described below and elsewhere. See “Special Note Regarding Forward-Looking Statements.”
We have a history of significant operating losses.
We have incurred operating losses since our inception in 1992. Although we have recently achieved operating profitability on a quarterly basis, we have not yet achieved annual operating profitability. As of December 31, 2010, we had an accumulated deficit of $253.8 million. To date, we have funded our operations principally through the public and private sales of our stock, from our credit facility, from product and service revenue and from development funding. We will need to generate significant additional revenue while maintaining our current margins in order to achieve annual profitability, and we cannot assure you that we will ever realize such revenue levels or achieve profitability on a consistent basis.
Our increased emphasis on larger and more complex system solutions and customer concentration may affect our ability to accurately predict the timing of revenues and to meet short-term expectations of operating results.
Our increased emphasis on larger and more complex system solutions has increased the effort and time required by us to complete sales to customers. Further, a larger portion of our quarterly revenue is derived from relatively few large transactions with relatively few customers. For example, in 2010, our three largest customers contributed 60% of our revenue. Any delay in completing these large sales transactions or reduction in the number of customers or large transactions, may result in significant fluctuations in our quarterly revenue. Further, we use anticipated revenues to establish our operating budgets and a large portion of our expenses, particularly rent and salaries are fixed in the short term. As a result, any shortfall or delay in revenue could result in increased losses and would likely cause our operating results to be below public expectations. The occurrence of any of these events would likely materially adversely affect our results of operations and likely cause the market price of our common stock to decline.
Our business may be affected by general economic conditions and uncertainty that may cause customers to defer or cancel sales commitments previously made to us.
Recent economic difficulties in the Unites States credit markets and certain international markets have led to an economic recession and lower capital spending and credit availability in some or all of the markets in which we operate. A recession or even the risk of a potential recession or uneven economic growth conditions may be sufficient reason for customers to delay, defer or cancel purchase decisions, including decisions previously made. This risk is magnified for capital goods purchases such as the UPS products and Continuous Power Systems (“CPS”) solutions that we supply. Although we believe that our competitive advantage and our efforts to broaden the number of different markets in which we sell will help mitigate the economic risk associated with any one country or market vertical, any customer delays or cancellation in sales orders could materially adversely affect our level of revenues and operating results. Should our financial results not meet the expectations of public market analysts or investors, the market price of our stock would most likely decline.
Our financial results may vary significantly from quarter to quarter.
Our product revenue, operating expenses and quarterly operating results have varied in the past and may fluctuate significantly from quarter to quarter in the future due to a variety of factors, many of which are outside of our control. As a result you should not rely on our operating results during any particular quarter as an indication of our future performance in any quarterly period or fiscal year. These factors include, among others:
|
|
•
|
timing of orders from our customers and the possibility that customers may change their order requirements with little or no notice to us;
|
|
|
•
|
rate of adoption of our flywheel-based energy storage system as an alternative to lead-acid batteries and our continuous power and infrastructure solutions;
|
|
|
•
|
ongoing need for short-term power outage protection in traditional UPS systems;
|
|
|
•
|
deferral of customer orders in anticipation of new products from us or other providers of power quality systems;
|
|
|
•
|
limited visibility into customer spending plans;
|
|
|
•
|
timing of deferred revenue components associated with large orders;
|
|
|
•
|
timing and execution of new product introductions;
|
|
|
•
|
new product releases, licensing or pricing decisions by our competitors;
|
|
|
•
|
commodity and raw material component prices;
|
|
|
•
|
lack of order backlog;
|
|
|
•
|
loss of a significant customer or distributor;
|
|
|
•
|
impact of changes to our product distribution strategy and pricing policies;
|
|
|
•
|
impact of changes to the product distribution strategy and pricing policies of our distributors;
|
|
|
•
|
changes in the mix of domestic and international sales;
|
|
|
•
|
rate of growth of the markets for our products; and
|
|
|
•
|
other risks described below.
|
The market for power quality products is evolving and it is difficult to predict its potential size or future growth rate. Most of the organizations that may purchase our products have invested substantial resources in their existing power systems and, as a result, have been reluctant or slow to adopt a new technological approach, particularly during a period of reduced capital expenditures. Moreover, our current products are alternatives to existing UPS and battery-based systems and may never be accepted by our customers or may be made obsolete by other advances in power quality technologies.
Significant portions of our expenses are not variable in the short term and cannot be quickly reduced to respond to decreases in revenue. Therefore, if our revenue is below our expectations, our operating results are likely to be adversely and disproportionately affected. In addition, we may change our prices, modify our distribution strategy and policies, accelerate our investment in research and development, sales or marketing efforts in response to competitive pressures or to pursue new market opportunities. Any one of these activities may further limit our ability to adjust spending in response to revenue fluctuations. We use forecasted revenue to establish our expense budget. Because most of our expenses are fixed in the short term or incurred in advance of anticipated revenue, any shortfall in revenue may result in significant losses.
We derive a substantial portion of our revenues from international markets and plan to continue to expand such efforts, which subjects us to additional business risks including increased logistical and financial complexity, managing internal controls and processes, political instability and currency fluctuations.
The percentage of our product revenue derived from customers located outside of the United States was 39%, 31% and 29% in 2008, 2009 and 2010, respectively. Our international operations are subject to a number of risks, including:
|
|
•
|
foreign laws and business practices that favor local competition;
|
|
|
•
|
dependence on local channel partners;
|
|
|
•
|
compliance with multiple, conflicting and changing government laws and regulations;
|
|
|
•
|
longer sales cycles;
|
|
|
•
|
difficulties in managing and staffing foreign operations;
|
|
|
•
|
foreign currency exchange rate fluctuations and the associated effects on product demand and timing of payment;
|
|
|
•
|
political and economic stability, particularly in the Middle East and North Africa;
|
|
|
•
|
greater difficulty in the contracting and shipping process and in accounts receivable collection including longer collection periods;
|
|
|
•
|
greater difficulty in hiring qualified technical sales and application engineers; and
|
|
|
•
|
difficulties with financial reporting in foreign countries.
|
To date, the majority of our sales to international customers and purchases of components from international suppliers have been denominated in U.S. dollars, Euros and British Pounds. All of our UPS systems are manufactured in the United States and then sold to our foreign subsidiaries and customers, normally in U.S. dollars. We have generally benefited from the decline in value of the U.S. dollar relative to foreign currencies over the last several years, which has made our UPS systems more price competitive in foreign markets. However, the value of the dollar will likely fluctuate, and an increase in the value of the U.S. dollar relative to foreign currencies could make our UPS systems more expensive for our international customers to purchase, thus rendering our products less competitive. We also source the non-UPS components for our CPS products locally where possible and pay for these components in local currencies as a way to mitigate the impact of fluctuations in foreign currencies and lessen the impact of any unfavorable fluctuations with the U.S. dollar. Because the UPS system is a small part of the total cost of a CPS solution, this strategy will minimize the effect of currency fluctuations on the pricing of our CPS solutions. As our business expands internationally, many of our subsidiaries are selling products outside of their country of incorporation, and often in foreign currencies. To the extent that we record sales in other than our local currency, this can result in translation gains and losses. Currently, we do not engage in hedging activities for our international operations to offset this currency risk. However, we may engage in hedging activities in the future.
We are subject to risks relating to product concentration and lack of revenue diversification.
We derive a substantial portion of our revenue from a limited number of products, particularly our 250-900 kVA UPS product family. These UPS products are also an integral component part of many of our newer products such as PowerHouse and our infrastructure solutions. We expect these products to continue to account for a large percentage of our revenues in the near term. Continued market acceptance of these products is therefore critical to our future success. Our future success will also depend in part on our ability to reduce our dependence on these few products by developing and introducing new products and product or feature enhancements in a timely manner. Specifically, our ability to capture significant market share depends on our ability to develop and market extensions to our existing product lines at higher and lower power range offerings and as containerized solutions. Even if we are able to develop and commercially introduce new products and enhancements, they may not achieve market acceptance, which would substantially impair our revenue, profitability and overall financial prospects. Successful product development and market acceptance of our existing and future products depend on a number of factors, including:
|
|
•
|
changing requirements of customers;
|
|
|
•
|
accurate prediction of market and technical requirements;
|
|
|
•
|
timely completion and introduction of new designs;
|
|
|
•
|
quality, price and performance of our products;
|
|
|
•
|
availability, quality, price and performance of competing products and technologies;
|
|
|
•
|
our customer service and support capabilities and responsiveness;
|
|
|
•
|
successful development of our relationships with existing and potential customers; and
|
|
|
•
|
changes in technology, industry standards or end-user preferences.
|
We must expand our distribution channels and manage our existing and new product distribution relationships to continue to grow our business.
The future growth of our business will depend in part on our ability to expand our existing relationships with distributors, to identify and develop additional channels for the distribution and sale of our products and to manage these relationships. As part of our growth strategy, we may expand our relationships with distributors and develop relationships with new distributors. We will also look to identify and develop new relationships with additional parties that could serve as outlets for our products, or that could provide additional opportunities for our existing sales channels, such as the relationships that we have developed with IT hardware manufacturers such as Hewlett Packard. Our inability to execute this strategy successfully and to integrate and manage our existing OEM channel partners and our new distributors and manufacturer’s representatives could impede our future growth.
We must continue to hire and retain skilled personnel.
We believe our future success will depend in large part upon our ability to attract, motivate and retain highly skilled managerial, engineering and sales and product marketing personnel. There is a limited supply of skilled employees in the power quality marketplace particularly. Our small size relative to our competitors and lack of brand equity, particularly in foreign markets, makes it very difficult for us to attract personnel in foreign markets. Our failure to attract and retain the highly trained technical personnel who are essential to our product development, marketing, sales, service and support teams may limit the rate at which we can develop new products or generate revenue, particularly in foreign markets. If we are unable to attract the new personnel we desire, retain the personnel we currently employ, or if we are unable to replace departing employees quickly, our operations and new product development may suffer.
We are significantly dependent on our relationships with Hewlett Packard and Caterpillar. If these relationships are unsuccessful, for whatever reason, our business and financial prospects would likely suffer.
Caterpillar including its dealer network is our primary OEM customer and our largest single customer for our flywheel-based products. Caterpillar and its dealer network accounted for 40%, 24% and 19% of our revenue in 2008, 2009 and 2010, respectively. Hewlett Packard Corporation is our largest IT channel partner and accounted for 12% and 25% of our revenue in 2009 and 2010, respectively. A number of factors could cause these customers to cancel or defer orders, including interruptions to their operations due to a downturn in their industries, delays or changes in their product offerings or securing other sources for the products that we manufacture, or developing such products internally. If our relationships with Hewlett Packard or with Caterpillar are not successful or suffers a material adverse change, such as a material reduction in the level of orders, our business and operating results would likely suffer.
A significant increase in sales of our PowerHouse product and infrastructure solutions may materially increase the amount of liquidity required to fund the Company’s operations.
Because of the significant up-front investment required, and a longer period between order and delivery relative to our UPS products a significant increase in sales of our PowerHouse product and infrastructure solutions may materially increase the amount of liquidity required to fund out operations. The amount of time between the receipt of payment from our customers and our expenditures for raw materials, manufacturer and shipment of products (the sales cycle) for sales of our standard UPS product can be as short as 45 days, and is typically 60 days. However, this cash cycle on a PowerHouse or infrastructure solution sale can be as much as 210 days, depending on customer payment terms. We intend to mitigate the financial impact of this longer cash cycle by requiring customer deposits and periodic payments where possible from our customers. This is not always commercially feasible, and in order to increase our PowerHouse or infrastructure solution sales, we may be required to make larger investments in inventory and receivables to fund these sales opportunities. During 2010 we obtained a new bank line of credit with borrowing capabilities tailored to help us finance growth of our PowerHouse or infrastructure solutions business. However, if we get a substantial increase in the size or number of PowerHouse or infrastructure solutions orders, we may need to obtain additional sources of working capital, debt or equity financing in order to fund this business. If we are unsuccessful at obtaining additional sources of working capital, we may be required to curtail our level of PowerHouse and infrastructure solutions sales or we may lose potential customers, both of which may cause our financial results not to meet the expectations of public market analysts or investors and adversely impact our results of operations.
We have underutilized manufacturing capacity and have no experience manufacturing our products in large quantities.
In 2001, we leased and equipped a 127,000 square foot facility used for manufacturing and testing of our three-phase product line, including our DC and UPS products. To be financially successful, and to utilize fully the capacity of this facility and allocate its associated overhead, we must achieve significantly higher sales volumes. We must accomplish this while also preserving the quality levels we achieved when manufacturing these products in more limited quantities. To date, we have not been successful at increasing our sales volume to a level that fully utilizes the capacity of the facility and we may never increase our sales volume to necessary levels. During 2007, we subleased approximately 31,000 feet of our manufacturing facility to help lower our operating costs and to take advantage of surplus space that we leased but were not using. If we do not reach these necessary sales volume levels, or if we cannot sell our products at our suggested prices, our ability to reach profitability on an annual basis will be materially limited.
Achieving the necessary production levels to absorb the capacity of our manufacturing facility efficiently presents a number of technological and engineering challenges for us. We have not previously manufactured our products in high volume. We do not know whether or when we will be able to develop efficient, low-cost manufacturing capability and processes that will enable us to meet the quality, price, engineering, design and product standards or production volumes required to manufacture large quantities of our products successfully. Even if we are successful in developing our manufacturing capability and processes, we do not know whether we will do so in time to meet our product commercialization schedule or to satisfy the requirements of our customers.
We must build quality products to ensure acceptance of our products.
The market perception of our products and related acceptance of the products is highly dependent upon the quality and reliability of the products that we build. Any quality problems attributable to the CleanSource DC, CleanSource UPS, PowerHouse or containerized infrastructure solution product lines may substantially impair our revenue and operating results. Moreover, quality problems for our product lines could cause us to delay or cease shipments of products or have to recall or field upgrade products, thus adversely affecting our ability to meet revenue or cost targets. In addition, while we seek to limit our liability as a result of product failure or defects through warranty and other limitations, if one of our products fails, a customer could suffer a significant loss and seek to hold us responsible for that loss.
We currently operate without a substantial backlog.
We generally operate our business, without sufficient backlog of orders from our customers. Normally our products are shipped and revenue is recognized shortly after the order is received and usually within two quarters of the date of the order. Because historically our backlog has not always been sufficient to provide all of the next quarter’s revenue, revenue in any quarter is often dependent on orders booked and shipped throughout that quarter. We are attempting to increase the size of our backlog to allow greater efficiency in production and to facilitate business planning and to improve revenue visibility. During periods of economic uncertainty, the rate of customer orders can quickly decrease, limiting our ability to build a substantial backlog. Therefore, there can be no guarantee that we can successfully build and maintain a meaningful level of backlog.
Seasonality may contribute to fluctuations in our quarterly operating results.
Our business has experienced seasonal customer buying patterns. In recent years, the UPS industry and our business have generally experienced relatively weaker demand in the first calendar quarter of the year, including a sequential decrease in revenue compared to the fourth quarter. We believe this pattern, which we attribute to annual capital budgeting procedures, will continue. In addition, we anticipate that demand for our products in Europe and Africa may decline in the summer months, as compared to other regions, because of reduced corporate buying patterns during the vacation season.
We depend on sole and limited source suppliers, and outsource selected component manufacturing.
We purchase several component parts from sole source and limited source suppliers. As a result of our current production volumes, we lack significant leverage with these and other suppliers especially when compared to some of our larger competitors. If our suppliers receive excess demand for their products, we may receive a low priority for order fulfillment as large volume customers may receive priority that may result in delays in our acquiring components. If we are delayed in acquiring components for our products, the manufacture and shipment of our products could be delayed. We are, however, continuing to enter into long-term agreements with our sole suppliers and other key suppliers, when available, using a rolling sales volume forecast to stabilize component availability. Lead times for ordering materials and components vary significantly and depend on factors such as specific supplier requirements, contract terms, the extensive production time required and current market demand for such components. Some of these delays may be substantial. As a result, we purchase several critical, long lead time or single sourced components in large quantities to protect our ability to deliver finished products. If we overestimate our component requirements, we may have excess inventory, which will increase our costs. If we underestimate our component requirements, we will have inadequate inventory, which will delay our manufacturing and render us unable to deliver products to customers on scheduled delivery dates. If we are unable to obtain a component from a supplier or if the price of a component has increased substantially, we may be required to manufacture the component internally, which will also result in delays, or be required to absorb price increases. Manufacturing delays could negatively impact our ability to sell our products and could damage our customer relationships.
To assure the availability of our products to our customers, we outsource the manufacturing of selected components prior to the receipt of purchase orders from customers based on their forecasts of their product needs and internal product sales revenue forecasts. However, these forecasts do not represent binding purchase commitments from our customers. We do not recognize revenue for such products until we receive an order from the customer and the product is shipped to the customer. As a result, we incur inventory and manufacturing costs in advance of anticipated revenue. As demand for our products may not materialize, this product delivery method subjects us to increased risks of high inventory carrying costs, obsolescence and excess, and may increase our operating costs. In addition, we may from time to time make design changes to our products, which could lead to obsolescence of inventory.
Our manufacturing operations are concentrated in a small number of nearby facilities.
Our manufacturing, research and development and administrative activities are concentrated in a small number of nearby facilities, and all of our UPS systems are manufactured in our Austin, Texas facility. If, for any reason, including as a result of a natural disaster, act of terrorism or other similar event, any of these facilities should be damaged or destroyed or become inoperable or inaccessible, our ability to conduct our business could be adversely affected or interrupted entirely.
We face significant competition from other companies.
The markets for power quality and power reliability are intensely competitive. There are many companies engaged in all areas of traditional and alternative UPS and backup systems in the United States and abroad, including, among others, major electric and specialized electronics firms, as well as universities, research institutions and foreign government-sponsored companies. There are many companies that are developing flywheel-based energy storage systems and flywheel-based power quality systems. We may face future competition from companies that are developing other types of emerging power technologies, such as high-speed composite flywheels, ultra capacitors and superconducting magnetic energy storage.
Many of our current and potential competitors have longer operating histories, significantly greater financial, technical, service, marketing and other resources, broader name and brand recognition and a larger installed base of customers. As a result, these competitors may have greater credibility with our existing and potential customers and greater service infrastructure than we do. They also may be able to adopt more aggressive pricing policies and devote greater resources to the development, promotion and sale of their products than we can to ours, which would allow them to respond more quickly than us to new or emerging technologies or changes in customer requirements. In addition, some of our current and potential competitors have established supplier or joint development relationships with our current or potential customers. These competitors may be able to leverage their existing relationships to discourage these customers from purchasing products from us or to persuade them to replace our products with their products. Increased competition could decrease our prices, reduce our sales, lower our margins, or decrease our market share. These and other competitive pressures could prevent us from competing successfully against current or future competitors and could materially harm our business.
We may be unable to protect our intellectual property and proprietary rights.
Our success depends to a significant degree upon our ability to protect our proprietary technology, and we expect that future technological advancements made by us will be critical to sustain market acceptance of our products. We rely on a combination of patent, copyright, trademark and trade secret laws and restrictions on disclosure to protect our intellectual property rights. We also enter into confidentiality or license agreements with our employees, consultants and business partners and control access to and distribution of our software, documentation and other proprietary information. Despite these efforts, unauthorized parties may attempt to copy or otherwise obtain and use our products or technology. Monitoring unauthorized use of our products is difficult, and we cannot be certain that the steps we have taken will prevent unauthorized use of our technology, particularly in foreign countries where applicable laws may not protect our proprietary rights as fully as in the United States. In addition, the measures we undertake may not be sufficient to protect our proprietary technology adequately and may not preclude competitors from independently developing products with functionality or features similar to those of our products.
We may be subject to claims by others that we infringe on their proprietary technology.
In recent years, there has been significant litigation in the United States involving patents, trademarks and other intellectual property rights. We may become involved in litigation in the future to protect our intellectual property or defend allegations of infringement asserted by others. Legal proceedings could subject us to significant liability for damages or invalidate our intellectual property rights. Any litigation, regardless of its merits or its outcome, would likely be time consuming and expensive to resolve and would divert management’s time and attention. Any potential intellectual property litigation also could force us to take specific actions, including:
|
|
•
|
cease selling our products that use the challenged intellectual property;
|
|
|
•
|
obtain from the owner of the infringed intellectual property right a license to sell or use the relevant technology or trademark, which license may not be available on reasonable terms, or at all;
|
|
|
•
|
redesign those products that use infringing intellectual property; or
|
|
|
•
|
cease to use an infringing trademark.
|
Our involvement in any such litigation will cause us to incur unexpected litigation costs, require modifications to or limit our ability to sell our products, and adversely impact our business and reputation.
We have anti-takeover provisions that could discourage, delay or prevent our acquisition.
Provisions of our certificate of incorporation and bylaws could have the effect of discouraging, delaying or preventing a merger or acquisition that a stockholder may consider favorable. Additionally, in December 2001, our board of directors approved a stockholder rights plan, which would require a potential acquirer to negotiate directly with our board of directors regarding any planned acquisition. We also are subject to the anti-takeover laws of the State of Delaware, which may further discourage, delay or prevent someone from acquiring or merging with us. In addition, our agreement with Caterpillar for the distribution of CleanSource UPS provides that Caterpillar may terminate the agreement in the event we are acquired or undergo a change in control. The possible loss of our most significant customer could be a significant deterrent to possible acquirers and may substantially limit the number of possible acquirers. All of these factors may decrease the likelihood that we would be acquired, which may depress the market price of our common stock.
The trading price of our common stock has been volatile and is likely to be volatile in the future.
Historically, the market price of our common stock has fluctuated significantly. In 2010, the sales price of our common stock ranged from $.70 to $2.71. In addition to those risks described earlier in this section, the market price of our common stock can be expected to fluctuate significantly in response to numerous other factors, many of which are beyond our control, including the following:
|
|
•
|
actual or anticipated fluctuations in our operating results;
|
|
|
•
|
changes in financial estimates by securities analysts or our failure to perform in line with such estimates;
|
|
|
•
|
changes in market valuations of other technology companies, particularly those that sell products used in power quality systems;
|
|
|
•
|
announcements by us or our competitors of significant sales, technical innovations, acquisitions, strategic partnerships, joint ventures or capital commitments;
|
|
|
•
|
introduction of technologies or product enhancements that reduce the need for flywheel energy storage systems and continuous power solutions;
|
|
|
•
|
the loss of one or more key OEM customers or channel partners;
|
|
|
•
|
inability to expand our distribution channels successfully;
|
|
|
•
|
departures of key personnel; and
|
|
|
•
|
changing external capital market conditions.
|
If the market for technology stocks or the stock market in general experiences loss of investor confidence, the trading price of our common stock could decline for reasons unrelated to our business, operating results or financial condition. The trading price of our common stock might also decline in reaction to events that affect other companies in our industry or the stock market generally even if these events do not directly affect us. Each of these factors, among others, could cause our stock price to decline. Some companies that have had volatile market prices for their securities have had securities class actions filed against them. If a suit were filed against us, regardless of its merits or outcome, it could result in substantial costs and divert management’s attention and resources.
Securities or industry analysts may not publish research or may publish inaccurate or unfavorable research about our business.
The trading market for our common stock will continue to depend in part on the research and reports that securities or industry analysts publish about us or our business. If we do not continue to maintain adequate research coverage or if one or more of the analysts who covers us downgrades our stock or publishes inaccurate or unfavorable research about our business, our stock price would likely decline. Although we were able to secure three additional analysts to provide research coverage on our company during 2010, there can be no guarantee that these research analysts will continue to provide coverage of our company. If one or more of these analysts ceases coverage of our company or fails to publish reports on us regularly, demand for our stock could decrease, which could cause our stock price and trading volume to decline.
Our internal control over financial reporting may not prevent or detect misstatements because of its inherent limitations.
Pursuant to the Sarbanes-Oxley Act of 2002, we are required to provide a report by management on internal control over financial reporting, including management’s assessment of the effectiveness of such control. Internal control over financial reporting may not prevent or detect misstatements because of its inherent limitations, including the possibility of human error, the circumvention or overriding of controls, or fraud. Therefore, even effective internal controls can provide only reasonable assurance with respect to the preparation and fair presentation of financial statements. In addition, projections of any evaluation of effectiveness of internal control over financial reporting to future periods are subject to the risk that the control may become inadequate because of changes in conditions, or that the degree of compliance with the policies or procedures may deteriorate. If we fail to maintain the adequacy of our internal controls, including any failure to implement required new or improved controls, or if we experience difficulties in their implementation, our business and operating results could be harmed, we could fail to meet our reporting obligations, and there could be a material adverse effect on our stock price.
If we need additional capital in the future, it may not be available to us on favorable terms, or at all.
We have historically relied on outside financing and cash flow from operations to fund our operations, capital expenditures and expansion. We may require additional capital from equity or debt financing in the future to fund our operations or respond to competitive pressures or strategic opportunities. We may not be able to secure timely additional financing on favorable terms, or at all. The terms of any additional financing may place limits on our financial and operating flexibility. If we raise additional funds through further issuances of equity, convertible debt securities or other securities convertible into equity, our existing stockholders could suffer significant dilution in their percentage ownership of our company, and any new securities we issue could have rights, preferences and privileges senior to those of holders of our common stock. If we are unable to obtain adequate financing or financing on terms satisfactory to us, if and when we require it, our ability to grow or support our business and to respond to business challenges could be significantly limited. Should additional funding be required, we may need to raise the required funds through borrowings or public or private sales of debt or equity securities. If we raise additional funds through the issuance of debt or equity securities, the percentage ownership of our stockholders could be significantly diluted. If we obtain additional debt financing, a substantial portion of our operating cash flow may be dedicated to the payment of principal and interest on such indebtedness, and the terms of the debt securities issued could impose significant restrictions on our operations. We do not know whether we will be able to secure additional funding, or funding on terms acceptable to us, to continue our operations as planned. If financing is not available, we may be required to reduce, delay or eliminate certain activities or to license or sell to others some of our proprietary technology.
|
ITEM 1B.
|
Unresolved Staff Comments.
|
None.
|
ITEM 2.
|
Our corporate headquarters facility is a 127,000 square foot building that we lease in Austin, Texas. We lease this building pursuant to a lease agreement that expires in December 2011. Our manufacturing, administrative, information systems, sales and service groups currently utilize 96,000 square feet of this facility. We sublease the remaining 31,000 square feet of our corporate headquarters facility pursuant to sublease agreements that we entered into during 2007. The sublease agreements have options to extend through December 2011. Our engineering, marketing and administration facility of approximately 19,600 square feet is also located in Austin, Texas and is leased pursuant to a lease agreement that expires in March 2012. In addition to these properties, we lease facilities totaling 18,304 square feet in the United Kingdom, Germany, China and Japan for sales and service activities.
Our current manufacturing and test facilities located at our corporate headquarters can support a business volume significantly in excess of our current revenues with the addition of direct labor only and no need for additional significant capital investment. We believe our existing facilities are adequate to meet our current needs and plans.
|
ITEM 3.
|
Legal Proceedings.
|
We are, from time to time, subject to various legal proceedings, claims and litigation arising in the ordinary course of business. We do not believe we are party to any currently pending legal proceedings the outcome of which may have a material adverse effect on our operations or consolidated financial position. There can be no assurance that existing or future legal proceedings arising in the ordinary course of business or otherwise will not have a material adverse affect on our financial position, results of operations or cash flows.
|
ITEM 4.
|
(Removed and Reserved).
|
PART II.
|
ITEM 5.
|
Market for Registrant’s Common Equity, Related Stockholder Matters and Issuer Purchases of Equity Securities.
|
Our common stock is traded on The Nasdaq Stock Market under the symbol “ACPW.” The following table lists the high and low per share sales prices for our common stock as reported by The Nasdaq Stock Market for the periods indicated:
|
High
|
Low
|
|||||||
|
2010
|
||||||||
|
Fourth Quarter
|
$ | 2.71 | $ | 1.26 | ||||
|
Third Quarter
|
1.51 | 0.78 | ||||||
|
Second Quarter
|
0.89 | 0.70 | ||||||
|
First Quarter
|
1.26 | 0.75 | ||||||
|
2009
|
||||||||
|
Fourth Quarter
|
$ | 1.50 | $ | 0.76 | ||||
|
Third Quarter
|
0.92 | 0.66 | ||||||
|
Second Quarter
|
0.95 | 0.46 | ||||||
|
First Quarter
|
0.66 | 0.28 | ||||||
As of February 28, 2011, there were 79,925,254 shares of our common stock outstanding held by 216 stockholders of record.
We have never declared or paid cash dividends on our capital stock. We currently intend to retain any earnings for use in our business and do not anticipate paying any cash dividends in the foreseeable future. Future dividends, if any, will be determined by our board of directors.
We did not repurchase any of our securities during 2010.
Sale of Unregistered Securities
None.
Stock Performance Graph
The graph depicted below shows a comparison of cumulative total stockholder returns for an investment in our common stock, The Nasdaq Stock Market (US) Composite Index, and a peer group of power technology companies having similar market capitalizations.
COMPARISON OF CUMULATIVE TOTAL RETURN
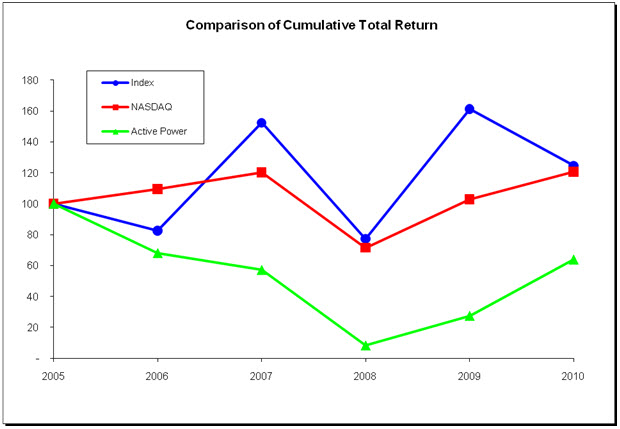
|
(1)
|
The Power Index peer group consists of an equal weighting of the following companies, all traded on The Nasdaq Global Market: Active Power, Inc. (ACPW), American Superconductor Corp. (AMSC), Beacon Power Corp. (BCON), Capstone Turbine, Inc. (CPST), FuelCell Energy, Inc. (FCEL), Plug Power, Inc. (PLUG), and Satcon Technology Corp. (SATC).
|
|
(2)
|
The graph covers the period from December 31, 2005, the last trading day before the beginning of our fifth preceding fiscal year, through December 31, 2010, the last trading day of our most recently completed fiscal year.
|
|
(3)
|
The graph assumes that $100 was invested in our common stock on December 31, 2005 at the closing price on that date of $3.85 per share, in The Nasdaq Stock Market Composite Index and the peer group Power Index, and that all dividends, if any, were reinvested. No cash dividends have been declared or paid on our common stock.
|
|
(4)
|
Stockholder returns over the indicated period should not be considered indicative of future stockholder returns.
|
|
ITEM 6.
|
Selected Consolidated Financial Data.
|
The following tables include selected consolidated financial data for each of our last five years. The consolidated statement of operations data for the years ended December 31, 2010, 2009 and 2008 and consolidated balance sheet data as at December 31, 2010 and 2009 have been derived from the audited consolidated financial statements appearing elsewhere in this document. The consolidated statement of operations data for the years ended December 31, 2007 and 2006 and the consolidated balance sheet data as at December 31, 2008, 2007 and 2006 have been derived from audited consolidated financial statements not appearing in this document. This data should be read in conjunction with the consolidated financial statements and notes thereto, with “Management’s Discussion and Analysis of Financial Condition and Results of Operations” in Item 7 and with the other financial data set forth elsewhere in this report. Our historical results of operations are not necessarily indicative of results of operations to be expected for future periods.
|
Consolidated Statement of Operations Data
|
Year Ended December 31,
|
|||||||||||||||||||
|
In thousands except per share data
|
2010
|
2009
|
2008
|
2007
|
2006
|
|||||||||||||||
|
Total revenue
|
$ | 64,955 | $ | 40,311 | $ | 42,985 | $ | 33,601 | $ | 25,029 | ||||||||||
|
Total cost of goods sold
|
46,935 | 31,081 | 34,997 | 30,375 | 24,343 | |||||||||||||||
|
Gross profit
|
18,020 | 9,230 | 7,988 | 3,226 | 686 | |||||||||||||||
|
Total operating expenses
|
21,824 | 20,193 | 22,074 | 24,579 | 23,545 | |||||||||||||||
|
Operating loss
|
(3,804 | ) | (10,963 | ) | (14,086 | ) | (21,353 | ) | (22,859 | ) | ||||||||||
|
Net loss
|
(3,925 | ) | (11,033 | ) | (13,442 | ) | (20,492 | ) | (21,149 | ) | ||||||||||
|
Basic and diluted net loss per share
|
$ | (0.05 | ) | $ | (0.17 | ) | $ | (0.22 | ) | $ | (0.38 | ) | $ | (0.43 | ) | |||||
|
Consolidated Balance Sheet Data
|
Year Ended December 31,
|
|||||||||||||||||||
|
In thousands
|
2010
|
2009
|
2008
|
2007
|
2006
|
|||||||||||||||
|
Cash and investments
|
$ | 15,550 | $ | 7,489 | $ | 11,171 | $ | 22,492 | $ | 20,711 | ||||||||||
|
Working capital
|
19,082 | 11,681 | 16,451 | 27,526 | 31,673 | |||||||||||||||
|
Total assets
|
39,518 | 29,344 | 32,671 | 43,326 | 46,737 | |||||||||||||||
|
Long-term obligations
|
579 | 468 | 521 | 604 | 468 | |||||||||||||||
|
Total stockholders’ equity
|
20,822 | 14,492 | 20,821 | 33,248 | 38,778 | |||||||||||||||
|
ITEM 7.
|
Management’s Discussion and Analysis of Financial Condition and Results of Operations.
|
The following discussion should be read in conjunction with the financial statements appearing elsewhere in this Form 10-K. This report contains forward-looking statements, within the meaning of Section 27A of the Securities Act of 1933 and Section 21E of the Securities Exchange Act of 1934, that involve risks and uncertainties. Our expectations with respect to future results of operations that may be embodied in oral and written forward-looking statements, including any forward looking statements that may be included in this report, are subject to risks and uncertainties that must be considered when evaluating the likelihood of our realization of such expectations. Our actual results could differ materially. The words “believe,” “expect,” “intend,” “plan,” “project,” “will” and similar phrases as they relate to us are intended to identify such forward-looking statements. In addition, please see the risk factors section above for a discussion of items that may affect our future results.
Executive Level Overview
Active Power is headquartered in Austin, Texas, where we manufacture our patented flywheel uninterruptible power supply (“UPS”) systems and continuous power and infrastructure solutions. These solutions ensure continuity for business and IT operations for enterprises, data center operations and IT service providers in the event of power disturbances.
Our products and solutions are designed to deliver continuous clean power during power disturbances and outages, voltage sags and surges and provide ride-through power in the event of utility failure supporting operations until utility power is restored or a longer term alternative power source, such as a diesel generator is started. We believe that our products offer an advantage over those of our competitors in the areas of space and energy efficiency, total cost of ownership, system reliability, modular design and the economically green benefits of our solutions.
As of December 31, 2010, we have shipped more than 2,800 flywheels in UPS system installations, delivering more than 700 megawatts of power to customers in 42 countries around the world. We are headquartered in Austin, Texas, with international offices in the United Kingdom, Germany, China and Japan.
Our patented flywheel-based UPS systems store kinetic energy by constantly spinning a compact steel wheel (“flywheel”) driven from utility power in a low friction environment. When the utility power used to spin the flywheel fluctuates or is interrupted, the flywheel’s inertia causes it to continue spinning. The resulting kinetic energy of the spinning flywheel generates electricity known as “bridging power” for short periods, until either utility power is restored or a backup electric generator starts and takes over generating longer-term power in the case of an extended electrical outage. We believe our flywheel products provide many competitive advantages over conventional battery-based UPS systems, including substantial space savings, higher power densities, “green” energy storage, and higher power efficiencies up to 98%. This high energy efficiency reduces operating costs and provides customers a lower total cost of ownership. We offer our flywheel products with load capabilities from 130kVA to 8,400kVA. We typically target higher power applications of 200kVA and above, largely because the majority of customers in this market segment have backup generators. Our flywheel-based UPS systems are marketed under the brand name CleanSource®.
We also sell continuous power systems (“CPS”), which incorporate our UPS products with switchgear and a generator to provide complete short- and long-term protection in the event of a power disturbance. Where the CPS is sold in a containerized package, it is marketed under the brand name PowerHouseTM . PowerHouse can be deployed in either a 20-foot or 40-foot-long ISO container depending upon the customer’s power load requirements. These systems are specifically designed to handle the demands of high-tech facilities requiring the highest power integrity available while maximizing up time, useable floor space and operational efficiency. Designed to offer a highly flexible architecture to a customer’s constantly changing environment, our PowerHouse systems are offered in four standard modular power configurations, enabling sizing for infrastructure on demand. These systems are highly differentiated as they offer flexibility in placement, space savings, fast deployment time after receipt of order, high energy efficiency, and prompt capital deployment to meet current demands. They also deliver significant value to customers as the entire system is integrated and tested prior to delivery for a repeatable simple solution. We also sell CPS solutions to customers in a non-containerized format, typically deploying such solutions inside buildings.
Leveraging our expertise in containerization and power distribution, in 2010 we began to manufacture continuous infrastructure solutions, designed to specification for select business partners. These solutions serve as the infrastructure for modular data centers, which are self-contained fully-functional data centers. Modular data centers may be rapidly deployed with other modular data centers as a cost-effective alternative to traditional raised-floor data centers. Active Power designs and delivers the exterior shell and a fully fitted-out interior – including electrical, cooling, monitoring, and other elements – ready for the customer to add their IT racks and servers. After the customer adds their IT equipment to our continuous infrastructure solution, the customer has a functional data center. Continuous infrastructure solutions represented 18% of 2010 revenue. We expect revenue to grow in coming years from current and future customers as modular data center infrastructure continues to gain acceptance in the market.
Our total revenue in 2010 increased by $24.6 million, or 61%, from 2009, primarily driven by an increase in the global demand for new data center construction and increased market acceptance of our products and solutions. Sales of our CPS systems and containerized infrastructure solution products increased by approximately $17.6 million, or 251%, compared to 2009 as a number of global customers made repeated purchases of our CPS products, reflecting growing acceptance of, and validation of the improved performance characteristics of our CPS solutions and containerized infrastructure solution products. Our UPS product revenues also increased by $6.8 million, or 28%, from 2009 reflecting better global demand and acceptance of our battery-free UPS systems.
We sell our products to a wide array of commercial and industrial customers across a variety of vertical markets, including data centers, manufacturing, technology, broadcast and communications, financial, utilities, healthcare, government and airports. We have expanded our global sales channels and direct sales force, selling in major geographic regions of the world, but particularly in North America, Europe and Asia. We sell our products through the following distribution methods:
|
|
•
|
Sales made directly by Active Power;
|
|
|
•
|
Manufacturer’s representatives;
|
|
|
•
|
Distributors;
|
|
|
•
|
OEM partners; and
|
|
|
•
|
Strategic IT partners
|
Our revenue derived from North America was $27.1 million, $28.7 million and $47.5 million in 2008, 2009 and 2010, respectively, representing 63%, 71% and 73%, respectively, of our total revenues. Our revenue derived from customers located in Europe was $12.0 million, $9.2 million and $13.0 million in 2008, 2009 and 2010, respectively, representing 28%, 23% and 20%, respectively, of our total revenues. Our revenue derived from customers located in Asia was $3.8 million, $2.4million and $4.4 million in 2008, 2009 and 2010, respectively, representing 9%, 6% and 7%, respectively, of our total revenues. We achieved growth in all of our primary markets during 2010. Our largest revenue growth occurred in the North America market, where our revenues increased by $18.8 million or 66% over 2009. Our largest UPS customers and a majority of our PowerHouse and containerized infrastructure solution product customers are located in North America. After a disappointing performance in 2009, our business in Europe increased by $3.8 million or 42% as our efforts to build our sales organization took effect. Our revenues in Asia increased by $2.0 million or 82% from 2009 as we opened a sales office in China and continued to build our sales organization in this region.
We believe total revenue will continue to grow in 2011 from all of our products and as we continue to focus on selling more complete systems rather than just products. In particular, we expect continuing market acceptance of containerized solutions to drive higher sales of our PowerHouse and containerized infrastructure solution products globally. We also believe that the global growth in data center demand will also lead to higher sales of our UPS products. We are specifically targeting those customers with large IT and power needs who have the ability to make frequent and large UPS purchases as their global operations expand.
Our increase in revenue in 2010 helped drive further improvement in our gross profit, and for the fifth consecutive year we have reported improved gross margins. Our margins still fluctuate on a quarterly basis depending on the product mix of our revenues and were as high as 30% during our third quarter of 2010. On an annual basis the gross profit margin increased to 28% from 23% in 2009 and compares favorably to the 19% we had in 2008. The increased volume allows for more efficient utilization of our manufacturing capacity, and this combined with higher pricing drove the improvement in margins. Our direct sales typically generate higher margins for us than sales that are made through our OEM or distribution channels which is one of the reasons we continue to expand our direct sales capabilities. Nonetheless, our partners provide a significant contribution to our distribution strategy as they offer the potential to leverage their customer relationships to help bring sales volume to our operations. Our gross margin in the fourth quarter of 2010 was 28%. This was an improvement from the 19% we recorded in the fourth quarter of 2009 due not only to the higher flywheel volumes, but also due to improved margins on our PowerHouse products compared to 2009, as we improve the efficiency and profitability of this product family.
Our operating losses were $3.8 million, $11.0 million and $14.1 million in 2010, 2009 and 2008, respectively. Our operating losses include non-cash stock based compensation expenses of $1.1 million, $1.3 million and $1.7 million in 2010, 2009 and 2008 respectively. In 2010 we were able to decrease our operating losses by 65% or $7.2 million, compared to 2009. This reduction in losses is primarily due to the gross margin improvements that were driven by the higher revenue levels and by our efforts to control operating expenses. Our operating costs increased by 8% compared to 2009, primarily due to higher sales compensation and performance-based compensation expenses despite a 61% increase in revenues. For the first time in our 18-year history we were able to achieve quarterly operating profitability during the third and fourth quarters of 2010 as our revenue levels increased to a level sufficient to achieve this milestone.
The improved operating results and lower losses have also resulted in a decrease in the net cash used in operating activities. In 2010, for the first time in our history we generated positive cash flows from operations of $0.07 million. This compares to net cash used in operating activities of $6.9 million and $11.8 million in 2009 and 2008, respectively.
The larger sales price of our PowerHouse and containerized infrastructure orders can cause large quarterly fluctuations in our inventory, receivables and payables balances, depending on the number of such orders in progress at any point in time. This can cause material fluctuations in the level of working capital we require. If the number of such orders increases rapidly or any of these orders have payment terms that are less favorable, we may need access to more liquidity to fund the growth of our business and to fulfill these orders. We increased our bank revolving line of credit in 2010 to provide a source of funding for this scenario, and now have up to $12.5 million of credit available to help fund our growth and manage our working capital requirements.
We have a history of annual operating losses and have not yet reached sustained operating profitability on an annual basis. We believe that the success of our flywheel products and our PowerHouse and continuous infrastructure solutions, combined with our focus on direct sales to customers, will help us to further increase our revenues and reduce our level of operating losses and the amount of cash that we consume in our operations. We will need to continue to focus on management of cash and working capital in 2011 in order to manage the level of funds we use in our operating activities. Our total cash and investments at December 31, 2010 were $15.6 million, compared to $7.5 million at December 31, 2009. The increase in 2010 was primarily due to a sale of equity in 2010 that raised approximately $9 million. Due to the improvements in our operations in the second half of 2010, as well as our fundraising in February 2010 and the new bank credit facilities we put in place in August 2010, we believe that our cash and investments and available liquidity are sufficient to meet our operational needs for at least the next twelve months.
Critical Accounting Policies and Estimates
We consider an accounting policy to be critical if:
|
|
•
|
the accounting estimate requires us to make assumptions about matters that are highly uncertain or require the use of judgment at the time we make that estimate; and
|
|
|
•
|
changes in the estimate that are reasonably likely to occur from period to period, or use of different estimates that we could have reasonably used instead in the current period, would have a material impact on our financial condition or results of operations.
|
Management has reviewed the development and selection of these critical accounting estimates with the Audit Committee of our Board of Directors, and the Audit Committee has reviewed these disclosures. In addition, there are other items within our financial statements that require estimation, but are not deemed critical as defined above. Changes in these and other items could still have a material impact upon our financial statements.
Allowance for doubtful accounts
Trade receivables are recorded at the stated amount, less an allowance for doubtful accounts. The allowance represents estimated uncollectible receivables associated with potential customer defaults on contractual obligations, usually due to the customer’s potential insolvency. The allowance includes amounts for certain customers where a risk of default has been specifically identified. In addition, the allowance includes a provision for customer defaults on a general formula basis when it is determined the risk of some default is probable and estimable, but cannot yet be associated with certain customers. The assessment of the likelihood of customer defaults is based on various factors, including the length of time the receivables are past due, risks unique to particular geographic regions, historical experience and existing economic conditions. Historically, a large portion of our sales have been made through OEM channels to a few large customers, and so our credit losses have been minimal. As we integrate additional distribution channels into our business and increase our direct sales to more and smaller customers, the risk of credit loss may increase.
Inventories
Inventories are priced at the lower of cost (using the first-in, first-out method) or market. We estimate inventory reserves on a quarterly basis and record reserves for obsolescence or slow-moving inventory based on assumptions about future demand and marketability of products, the impact of new product introductions, inventory turns and specific identification of items, such as product discontinuance, damaged goods or engineering/material changes.
Warranty liability
The estimated warranty liability costs are accrued for each of our products at the time of sale. Our estimates are principally based on assumptions regarding the lifetime warranty costs of each product, including where little or no claims experience may exist. Due to the uncertainty and potential volatility of these estimates, changes in our assumptions could have a material effect on our reported operating results. Our estimate of warranty liability is reevaluated on a quarterly basis. Experience has shown that initial data for a new product can be very volatile due to factors such as product and component failure rates, material usage and service delivery costs in correcting product failures; therefore our process relies upon long-term historical averages until sufficient data is available. As actual experience becomes available, it is used to modify the historical averages to ensure that the forecast is within the range of likely outcomes. The resulting balances are then compared to current spending rates to ensure that the accruals are adequate to meet expected future obligations.
Revenue recognition
We recognize revenue when four criteria are met: (i) persuasive evidence that an arrangement exists; (ii) delivery has occurred or services have been rendered; (iii) the sales price is fixed or determinable; and (iv) collectability is reasonably assured. Revenue-generating transactions generally fall into one of the following categories of revenue recognition:
|
|
•
|
We recognize product revenue at the time of shipment for substantially all products sold directly to customers and through distributors because title and risk of loss pass on delivery to the common carrier. Our customers and distributors do not have the right to return products. If title and risk of loss pass at some other point in time, we recognize such revenue for our customers when the product is delivered to the customer and title and risk of loss has passed.
|
|
|
•
|
We recognize installation and service and maintenance revenue at the time the service is performed.
|
|
|
•
|
We recognize revenue associated with extended maintenance agreements (“EMAs”) over the life of the contracts using the straight-line method, which approximates the expected timing in which applicable services are performed. Amounts collected in advance of revenue recognition are recorded as a current or long-term liability based on the time from the balance sheet date to the future date of revenue recognition.
|
|
|
•
|
We recognize revenue on certain rental programs over the life of the rental agreement using the straight-line method. Amounts collected in advance of revenue recognition are recorded as a current or long-term liability based on the time from the balance sheet date to the future date of revenue recognition.
|
|
|
•
|
Shipping costs reimbursed by the customer are included in revenue.
|
Multiple element arrangements (“MEAs”). Arrangements to sell products to customers frequently include multiple deliverables. Our most significant MEAs include the sale of one or more of our CleanSource UPS or PowerHouse products, combined with one or more of the following products: design services, project management, commissioning and installation services, spare parts or consumables, and EMA’s. Delivery of the various products or performance of services within the arrangement may or may not coincide. Certain services related to design and consulting may occur prior to delivery of product and commissioning and installation typically take place within 6 months of product delivery, depending upon customer requirements. EMAs, consumables, and repair, maintenance or consulting services generally are delivered over a period of one to five years. In certain arrangements revenue recognized is limited to the amount invoiced or received that is not contingent on the delivery of future products and services.
When arrangements outside of the scope of software revenue recognition guidance include multiple elements, we allocate revenue to each element based on the relative selling price and recognize revenue when the elements have standalone value and the four criteria for revenue recognition have been met for each element. We establish the selling price of each element based on Vendor Specific Objective Evidence (“VSOE”) if available, Third Party Evidence (“TPE”) if VSOE is not available, or Best Estimate of Selling Price if neither VSOE nor TPE is available. We generally determine selling price based on amounts charged separately for the delivered and undelivered elements to similar customers in standalone sales of the specific elements. When arrangements include an EMA, we recognize revenue related to the EMA at the stated contractual price on a straight-line basis over the life of the agreement.
Any taxes imposed by governmental authorities on our revenue-producing transactions with customers are shown in our consolidated statement of operations on a net-basis; that is excluded from our reported revenues
Stock-based compensation
We account for stock-based compensation using a fair-value based recognition method. Stock-based compensation cost is estimated at the grant date based on the fair value of the award and is recognized as an expense ratably over the requisite service period of the award. Determining the appropriate fair-value model and calculating the fair value of stock-based awards at the grant date requires considerable judgment, including estimating stock price volatility, expected option life and forfeiture rates. We develop our estimates based on historical data and market information that can change significantly over time. A small change in estimates used can have a relatively large change in the estimated valuation.
We use the Black-Scholes option valuation model to value employee stock awards. We estimate stock price volatility based upon our historical volatility. Estimated option life and forfeiture rate assumptions are derived from historical data. For stock-based compensation awards with graded vesting, we recognize compensation expense using the straight-line amortization method.
Results of Operations
Comparison of 2010 to 2009
Product revenue
Product revenue primarily consists of sales of our UPS products and our CPS infrastructure solutions.
The following table summarizes for the periods indicated, a year-over-year comparison of our product revenue (in thousands):
|
Year
|
Annual Amount
|
Change from
Prior Year
|
Percent
Change
|
|||||||||
|
2010
|
$ | 55,647 | $ | 22,810 | 69 | % | ||||||
|
2009
|
32,837 | (2,935 | ) | (8 | )% | |||||||
|
2008
|
35,772 | — | — | |||||||||
Our product revenue represented 86% and 81% of total revenue for 2010 and 2009, respectively. Our product revenue was derived from the following sources (in thousands):
|
2010
|
2009
|
Change from Prior Year
|
Percent Change
|
|||||||||||||
|
Product revenue:
|
||||||||||||||||
|
UPS product revenue
|
$ | 31,072 | $ | 25,837 | $ | 5,235 | 20 | % | ||||||||
|
Continuous Power Systems
|
13,155 | 6,075 | 7,080 | 117 | % | |||||||||||
|
Data center infrastructure solutions
|
11,420 | 925 | 10,495 | 1135 | % | |||||||||||
|
Total product revenue
|
$ | 55,647 | $ | 32,837 | $ | 22,810 | 69 | % | ||||||||
The majority of our product revenue growth in 2010 came from the sale of our CPS and infrastructure solutions. We were able to significantly increase volume for these products through our IT channel partners and also with our direct sales organization, particularly in the North America market. We have been able to capitalize on an emerging trend of modularized data center solutions, where our CPS systems are able to offer higher power density and lower operating costs to provide a complimentary power and infrastructure solution for IT companies when they sell such modularized products. We introduced the containerized data center infrastructure solutions during 2010 as a way to provide complimentary products for, and to help in sale of our PowerHouse products into the modular data center market. We have also been successful at selling our PowerHouse product directly to military, utility and data center customers during 2010. Our efforts to grow CPS and infrastructure solution sales reflects our strategy of focusing on selling total solutions and not just UPS products to our customers. This strategy has also led to a decrease in the growth in UPS products compared to our other product categories.
In 2010 we sold 408 flywheel product units, a 30% increase from the 315 units sold in 2009, reflecting the higher volume of UPS and CPS products. The average selling price per flywheel unit increased to $84,000 in 2010 compared to approximately $81,000 in 2009, due to the higher proportion of wheels sold through our direct sales channel. We typically generate higher prices and profit margins from our direct sales compared to sales made through our OEM channel as we do not have to offer channel discounts on our direct sales. As our business evolves from selling stand alone UPS systems to delivering complete PowerHouse and continuous infrastructure solutions, a metric such as the number of flywheels sold and average selling price per flywheel unit becomes less indicative of our overall company performance.
Our CPS and infrastructure products tend to be larger in value and from a smaller number of customers compared to sales of our UPS products. This smaller number of customers with greater transaction value can contribute to large quarterly fluctuations in revenue from each product family, due to the timing of orders and shipments in any particular accounting period. Individual CPS sales have been as high as $6 million in 2010, as we have delivered multiple CPS products to single customers and our single largest order for continuous infrastructure products was over $7 million in 2010. A small number of transactions can therefore lead to significant revenue, but cause greater volatility in our quarterly results and increase liquidity risk for us as we continue to refine and improve the payment terms of these opportunities as part of our working capital management.
Product sales from our OEM channels represented 20% of our total revenue for 2010 compared to 26% in 2009 and are primarily from the sale of UPS systems. The decrease in the percentage of total revenues derived from our OEM channels occurred despite an actual increase in sales by our OEM partners, as our IT channel and direct sales businesses grew at much faster rates. Sales of our UPS products are a much smaller part of our OEM partner’s total business and subject to more volatility in quarterly sales, particularly during difficult economic periods as the OEM partner focuses on its core business. Product revenue from our OEM channels did increase by 30% in 2010 over 2009, after declining by 44% in 2009 compared to 2008, reflecting improved performance from our OEM partner. We do believe that sales from this channel will continue to increase as general business conditions improve and due to an increased commitment to marketing by our OEM partners to promote our UPS products. Caterpillar remains our largest OEM customer but is no longer our largest single customer.
Product sales from our IT channel partners represented 27% of our product revenues for 2010 compared to 15% of product revenues in 2009. This growth reflects the increased sales of CPS and infrastructure solutions during 2010 by our IT channel partners for their end-customers.
North America sales were 73% of our total revenue for 2010, compared to 71% for 2009. In total, our North America sales increased by 66% in 2010 compared to 2009, reflecting the overall growth in the market for our products in total and in particular for our data center infrastructure solutions and the improvement in overall market conditions within the U.S. data center market.
Sales of Active Power branded products through our direct and manufacturer’s representative channels were 55% of our total revenue for 2010, compared to 76% for 2009. As direct sales typically have higher profit margins than sales through our OEM and IT channels, we will continue to focus on building our direct sales channel to increase revenue and improve profit margins and to decrease our dependency upon any particular channel partner. We believe sales of our Active Power branded products in markets that were not covered by our OEMs will continue to increase over time and will continue to become a larger percentage of our total revenue.
We also sell products directly to customers in Asia and Europe and we have a network of international distributors in other territories to sell our products. In these markets, customers are more likely to purchase a total power solution such as PowerHouse from us rather than a stand-alone UPS system. This usually results in a longer selling cycle and makes quarterly results from these regions more inconsistent and dependent upon a smaller number of larger value transactions. Thus the amount of revenue from our international markets can fluctuate significantly on a quarterly basis, but continue to increase when evaluated on an annual basis. Our sales in Europe increased by 42% in 2010 to $13.0 million as we continue to expand our sales force and operations in Germany and the UK in particular. Our sales in Asia increased by 82% in 2010 to $4.4 million highlighted by stronger PowerHouse sales in China. In August we opened our first sales office in China as part of our effort to add sales and service capabilities to this market. China represents the second largest UPS market in the world and has the potential to become a substantial market for our products. There is usually a gap between adding sales and service capability and generating meaningful revenue from a new territory. As a result, we would expect that the investments that we have made during 2009 and 2010 in Europe and Asia will generate higher revenues from these regions in 2011. We continue to invest in sales, service and marketing capabilities in each of these regions as well as building brand awareness for our company and products globally.
Our products perform well in harsh environments where power quality or reliability is particularly poor, which makes them a good fit for countries with a poor power infrastructure or in harsh manufacturing or process environments, or situations where reliability is paramount, such as mission-critical business applications, particularly data center applications. Therefore we have traditionally focused our direct sales efforts on these types of customer situations.
Service and other revenue
Service and other revenue primarily relates to revenue generated from both traditional (after-market) service work and from customer-specific system engineering. This includes revenue from design, installation, startup, repairs or reconfigurations of our products and the sale of spare or replacement parts to our OEM and end-user customers. It also includes revenue associated with the costs of travel of our service personnel and revenues or fees received upon contract deferment or cancellation. Revenue from extended maintenance contracts with our customers is also included in this revenue category. The following table summarizes for the periods indicated a year-over-year comparison of our service and other revenue (in thousands):
|
Year
|
Annual Amount
|
Change from Prior Year
|
Percent Change
|
|||||||||
|
2010
|
$ | 9,308 | $ | 1,834 | 25 | % | ||||||
|
2009
|
7,474 | 261 | 4 | % | ||||||||
|
2008
|
7,213 | — | — | |||||||||
Service and other revenue increased by 25% for 2010, compared to 2009. This increase is primarily due to higher levels of service and contract work from direct product sales and from professional fees associated with PowerHouse and other continuous power system sales. For these customers we provide a full power solution, including site preparation, installation of an entire power solution and provision of all products required to provide a turnkey product to the end user often including maintenance services. We also had increased service revenues from maintenance contracts and repair related activities as our increasing install base of UPS customers provides greater opportunities to generate such revenues. Where we make sales through our OEM channel, it is typical for the OEM to provide these types of services to their end-user customers so these revenue sources do not exist on our OEM sales. We anticipate that service and other revenue will continue to grow with product revenue, particularly as our PowerHouse system revenue grows, and as our installed base of UPS product expands, because as more units are sold to customers, more installation, startup and maintenance services will be required.
Cost of product revenue
Cost of product revenue includes the cost of component parts of our products, ancillary equipment that is sourced from external suppliers, personnel, equipment and other costs associated with our assembly and test operations, including costs from having underutilized facilities, depreciation of our manufacturing property and equipment, shipping costs, warranty costs, and the costs of manufacturing support functions such as logistics and quality assurance. The following table summarizes for the periods indicated, a year-over-year comparison of our cost of product revenue (in thousands):
|
Year
|
Annual Amount
|
Change from
Prior Year
|
Percent
Change
|
Gross
Margin
|
||||||||||||
|
2010
|
$ | 40,045 | $ | 14,218 | 55 | % | 28 | % | ||||||||
|
2009
|
25,827 | (3,553 | ) | (12 | )% | 21 | % | |||||||||
|
2008
|
29,380 | — | — | 18 | % | |||||||||||
The 55% increase in cost of product revenue was driven by the 69% increase in product revenues that we experienced in 2010, and the impact of our continuous cost reduction efforts. Cost of product revenue also included $146,000 and $169,000 of stock-based compensation expense in 2010 and 2009, respectively. The cost of product revenue as a percentage of total product revenue was 72% in 2010, as compared to 79% for 2009. This decrease in cost as a percentage of revenue compared to 2009 is due primarily to increased sales volumes, which resulted in more efficient utilization of our manufacturing facility and a lower level of unabsorbed overhead costs. We continue to operate a manufacturing facility that has a manufacturing and testing capacity significantly greater than our current product revenue levels. We continue to work on reducing our product costs through design enhancements and modifications, and vendor management programs and increasing our sales volume to absorb these expenses.
We have been able to improve our gross product margins by increasing the average selling price of our products that we sell as well as by lowering our product cost. This has been partially offset by the impact of increased sales of our CPS, such as PowerHouse and our infrastructure solutions. Our margins on PowerHouse and infrastructure solutions sales are lower compared to the margins realized on our UPS sales because we realize lower margins on the third party equipment that we purchase and include in our containerized product offerings. We do not yet have a consistent volume of quarterly business from these new product offerings that would enable us to realize benefits from economies of scale, standardization of design, planning and purchasing, which we believe will lead to higher margins in the future for these products. However, we continue to implement our strategy to improve the profitability of individual transactions and the profitability of the company as a whole. We believe that as our direct sales and our total revenues continue to increase, our product margins will continue to improve.
We have also continued to improve the efficiency and utilization of our manufacturing facility, which has a large portion of fixed costs. We incur approximately $5.3 million per year in fixed costs for our manufacturing facility that has a capacity in excess of our current business requirements. We expense the excess costs of the underutilization of this facility as part of our cost of product revenues. We now produce more goods with less overhead than in previous years. Some of this efficiency is driven by higher product volumes that allow for better utilization of our test facility and our manufacturing space. We also have ongoing programs within our engineering and manufacturing departments to lower product costs, to identify alternative and cheaper vendors if possible, without impacting quality levels, to reduce our absolute level of overhead spending and headcount, and to improve the manufacturability of our products. During 2010 these efforts have helped reduce our cost of product revenue in spite of the pressures of higher raw material and commodity price increases. We have also been able to utilize manufacturing personnel in the manufacture of our PowerHouse and infrastructure solution products, which has further improved the efficiency of our manufacturing operations. For 2011 we anticipate further cost reductions from these ongoing programs.
Cost of service and other revenue
Cost of service and other revenue includes the cost of component parts that we use in service or sell as spare parts, as well as labor and overhead costs of our service organization, including travel and related costs incurred in fulfilling our service obligations to our customers and the costs of third party contractors used in completion of some of our professional services. The following table summarizes for the periods indicated a year-over-year comparison of our cost of service and other revenue (in thousands):
|
Year
|
Annual Amount
|
Change from Prior Year
|
Percent Change
|
Gross Margin
|
||||||||||||
|
2010
|
$ | 6,890 | $ | 1,636 | 31 | % | 26 | % | ||||||||
|
2009
|
5,254 | (363 | ) | (6 | )% | 30 | % | |||||||||
|
2008
|
5,617 | — | — | 22 | % | |||||||||||
The cost of service and other revenue increased by 31% in 2010 while our service and other revenues increased by 25%. As a percentage of service and other revenues, our costs were 74% of revenue in 2010, compared to 70% in 2009. This increase reflects higher costs relative to the increase in service and other revenues as we continue to expand our service team to broaden the geographic regions where we have service capability as our total business grows. Operationally we are challenged to manage the growth of our service organization congruent with the growth in total revenues so that we can meet customer requirements without growing our service organization cost structure too rapidly. The utilization of our service personnel will also be affected by the number of PowerHouse and infrastructure solution products implemented in a particular period and in periods where we have a low number of installation projects, our costs as a percentage of revenue would be expected to increase. A large portion of the costs involved in operating our service organization are fixed in nature and we incur approximately $300,000 to $600,000 in unabsorbed overhead each quarter. We continue to work on reducing our service overhead through better utilization of our service employees and cost control measures. This infrastructure also means that we can leverage this investment and grow our service capabilities substantially by adding direct technical labor only as required.
Gross profit
The following table summarizes for the periods indicated a year-over-year comparison of our gross profit (in thousands):
|
Year
|
Annual Amount
|
Change from
Prior Year
|
Percent
Change
|
Gross
Margin
|
||||||||||||
|
2010
|
$ | 18,020 | $ | 8,790 | 95 | % | 28 | % | ||||||||
|
2009
|
9,230 | 1,242 | 16 | % | 23 | % | ||||||||||
|
2008
|
7,988 | — | — | 19 | % | |||||||||||
The 95% increase in our gross profit for 2010 was primarily driven by the 61% increase in total revenues, higher average selling prices for all of our products, and better utilization of our manufacturing capacity, which resulted in lower unabsorbed overhead costs. The introduction and higher sales of new products such as the data center infrastructure solutions also generate higher absolute profits than sales of UPS systems only because of the higher transaction values. Our ability to continue to improve our gross profit will depend, in part, on our ability to continue to reduce material costs, improve our sales channel mix in favor of direct sales versus OEM, increase sales of higher margin products such as our UPS products, increase product prices and increasing our total revenues to a level that will allow us to improve the utilization of our manufacturing and service operations.
Research and development
Research and development expense primarily consists of compensation and related costs for employees engaged in research, development and engineering activities, third party consulting and development activities, as well as an allocated portion of our occupancy costs. The following table summarizes for the periods indicated, a year-over-year comparison of our research and development expense (in thousands):
|
Year
|
Annual Amount
|
Change from
Prior Year
|
Percent
Change
|
|||||||||
|
2010
|
$ | 3,412 | $ | (758 | ) | (18 | )% | |||||
|
2009
|
4,170 | (946 | ) | (18 | )% | |||||||
|
2008
|
5,116 | — | — | |||||||||
Overall our research and development expenses were approximately $758,000, or 18%, lower in 2010 compared to 2009. Our research and development efforts in 2010 were largely focused on new configurations of our existing flywheel technology, as well as refinements and enhancements to the standardization of our PowerHouse and containerized infrastructure solution products. During 2010 a number of our engineering employees also worked directly on specific customer projects for customization and enhancement of modular products, and $177,000 of research and development expenses were charged to Cost of Product Revenues to reflect the time and expense incurred in generating such revenues. Absent this, our research and development costs would have decreased by $581,000 or 14%. This decrease in spending compared to 2009 reflects lower project related development costs this year as well as lower headcount costs. The prior year expenses also included higher prototype and development costs from paralleling our megawatt-class UPS products. Research and development expenses included approximately $80,000 and $171,000 of stock-based compensation expense in 2010 and 2009, respectively. We believe research and development expenses will increase in 2011 as we increase development and prototype efforts on our next-generation UPS product during 2011.
Selling and marketing
Selling and marketing expense primarily consists of compensation, including variable sales compensation, and related costs, for sales and marketing personnel, and related travel, selling and marketing expenses, compensation paid to resellers and agents, as well as an allocated portion of our occupancy costs and the cost of our foreign sales operations. The following table summarizes for the periods indicated, a year-over-year comparison of our selling and marketing expense (in thousands):
|
Year
|
Annual Amount
|
Change from
Prior Year
|
Percent
Change
|
|||||||||
|
2010
|
$ | 13,093 | $ | 1,662 | 15 | % | ||||||
|
2009
|
11,431 | (408 | ) | (3 | )% | |||||||
|
2008
|
11,839 | — | — | |||||||||
Selling and marketing costs were approximately $1.7 million, or 15%, higher in 2010 compared to 2009. The increase from 2009 primarily reflects higher variable sales compensation, including payments made to third-party representatives, and performance-based compensation as a result of higher revenue and improving results. The increase also reflects increased headcount as we focus on building and improving the Active Power brand and expanding our sales organization, particularly in Europe and Asia, to support our direct selling and channel sales activities. We added specific sales resources to support each of our OEM and IT sales channels during 2010, which we believe contributed to the improved performance from each of these channels in 2010. Selling and marketing expenses also include approximately $304,000 and $313,000 of stock-based compensation expense in 2010 and 2009, respectively. We anticipate that our selling and marketing expenses will continue to increase as our revenues grow, due to higher variable compensation expense, and as we continue to invest in marketing to grow our global brand awareness.
General and administrative
General and administrative expense is primarily comprised of compensation and related costs for board, executive and administrative personnel, professional fees, and taxes, including sales, property and franchise taxes and the allowance for doubtful accounts expense. The following table summarizes for the periods indicated, a year-over-year comparison of our selling, general and administrative expense (in thousands):
|
Year
|
Annual Amount
|
Change from
Prior Year
|
Percent
Change
|
|||||||||
|
2010
|
$ | 5,319 | $ | 727 | 16 | % | ||||||
|
2009
|
4,592 | (527 | ) | (10 | )% | |||||||
|
2008
|
5,119 | — | — | |||||||||
General and administrative expenses for 2010 increased approximately $727,000, or 16%, compared to 2009. This increase primarily reflects higher performance-based compensation expenses incurred as our overall financial results have improved, which were partially offset by lower professional and consulting services fees in 2010. General and administrative expenses included approximately $558,000 and $573,000 in stock-based compensation expense in 2010 and 2009, respectively. We anticipate that the level of general and administrative expenses in 2011 should remain at similar levels to those in 2010.
Interest income(expense)
The following table summarizes the yearly changes in our interest (expense) income (in thousands):
|
Year
|
Annual
Amount
|
Change from
Prior Year
|
Percent
Change
|
|||||||||
|
2010
|
$ | (122 | ) | $ | 53 | 77 | % | |||||
|
2009
|
(69 | ) | (417 | ) | (120 | )% | ||||||
|
2008
|
348 | — | — | |||||||||
The increase in net interest expense in 2010 primarily reflects lower interest income earned on lower interest rates, as well as a lower level of average cash invested compared to 2009. We also incurred higher interest expense as we had a larger average outstanding balance on our revolving credit facility in 2010. We negotiated a new $12.5 million revolving credit facility with our bank in August 2010 that incurs a minimum monthly interest charge that also resulted in higher interest expense. Our average cash and investments balance over 2010 has increased by $2.2 million, or 23%, compared to the average balance over 2009.
Other expense, net
Net other expense in the years ended 2010 and 2009 reflects foreign exchange gains (losses) on a bank account held in foreign currencies by our subsidiary companies.
Income tax expense
Due to operating losses, we have not recorded any income tax expenses, other than minimum or statutory costs. During 2010 we recorded a net tax benefit due to certain tax credits that we earned. As of December 31, 2010, our accumulated net operating loss carryforward was $209.0 million and our research and development credit carry-forwards were $3.1 million. We anticipate that these loss carry-forward amounts may offset future taxable income that we may achieve and future tax liabilities. However, because of uncertainty regarding our ability to use these carry-forwards and the potential limitations due to ownership changes, we have established a valuation allowance for the full amount of our net deferred tax assets
Comparison of 2009 to 2008
Product revenue
Product revenue represented 83% and 81% of total revenue for 2008 and 2009, respectively. Although product revenues decreased overall from 2008, revenues attributable to PowerHouse, a new revenue source in 2009, were $6.1 million. We also saw a $0.5 million increase in sales of our 65-150 kVA product line. These increases were offset by a decrease in sales of our other product lines, including our 250-900 kVA product line and our megawatt-class product line, which decreased by $3.1 million and $1.9 million, respectively, from 2008. The decrease in product revenue was primarily driven by a decrease in product sales from our OEM channels, where UPS sales decreased by 44%, or $7.7 million, compared to 2008, which was offset by the increase in PowerHouse revenues.
In 2009, we sold 315 flywheel product units, a 13% decrease over the 363 units that we sold in 2008 due primarily to the decrease in OEM product volume. However, the average sales price per flywheel increased slightly to approximately $81,000 in 2009 from approximately $80,000 in 2008, due largely to the higher proportion of wheels sold through our direct sales channels. Our direct sales channel typically has higher sales prices and profit margins compared to our OEM channel as we do not have to offer channel discounts on our direct sales. The 13% decrease in wheels sold was greater than the overall decline in revenue in 2009, with the difference attributable to sales of our CPS.
North America sales were 69% of our total revenue for 2009, compared to 61% for 2008. This was due in part to the success with some of our IT channel partners, including Sun and Hewlett Packard, of our PowerHouse product that we introduced into the North American market during 2009. We continued to expand the sales territories where we sell our Active Power branded products in 2009 as we increased our sales distribution capabilities, particularly in Europe and Asia. We also increased the size of our sales and service organization in the U.K. and Germany. Although we saw sales decreases in Europe and Asia, we were encouraged as our 2009 second half performance in Europe increased by 175% over the first half of the year.
Sales to Caterpillar represented 25% of our product revenue in 2009, as compared to 40% of our product revenue in 2008. Caterpillar remains our largest single customer as well as our largest OEM customer. However, our revenue from Caterpillar decreased by 47% in 2009 and in the fourth quarter of 2009 Caterpillar was 8% of our quarterly revenue. Some of this decrease is attributable to the timing of larger orders from Caterpillar for its customers. We believe that this channel has been negatively influenced by external economic conditions that have caused its customers to delay product purchase decisions due to uncertainty or lack of liquidity. Sales of our UPS products are also a much smaller part of Caterpillar’s total business and subject to more volatility in quarterly sales, particularly during difficult economic periods as Caterpillar focuses on its core business.
Service and other revenue
Service and other revenue increased 4% in 2009. Although our larger installed base of customers that purchased products directly from us resulted in a higher level of customers with recurring maintenance contract agreements, our revenues from project installation and commissioning decreased as compared to 2008 due to a smaller number of large projects in 2009. However, in the fourth quarter of 2009, service and other revenue increased 81% from the prior quarter, which was primarily attributable to the higher level of project-related services in connection with increased sales and installation of our PowerHouse product and related services.
Our service and other revenue in 2009 was also helped by our improved level of direct sales and large multi-megawatt sales that affords us the ability to generate higher startup service revenues. In 2008 we recorded $0.4 million of fees related to contract cancellation by one customer but we had no cancellations during 2009. We anticipate that service and other revenue will continue to grow as our product revenue increases and as our installed base of product expands because as more units are sold to customers, more installation, startup and maintenance services will be required. In addition, because our OEM partners typically provide these services to their end-user customers, an increase in direct sales as a percentage of our total revenue would likely lead to a further increase in our service and other revenue.
Cost of product revenue
The 12% decrease in cost of product revenue was driven by the 8% decrease in product revenues that we experienced in 2009, as well as the absence of inventory impairment charges and lower product cost levels in 2009, reflecting the results of product cost reduction programs we implemented. The 2008 cost of product revenue included a $1.5 million charge for excess inventory and impairment of manufacturing assets related to our CoolAir product family, which, net of current product sales backlog and future spares and support requirements, was reduced to its salvageable value. Cost of product revenue included approximately $275,000 and $169,000 of stock-based compensation for 2008 and 2009, respectively.
We have been able to improve our gross product margins by increasing the average selling price of our products that we sell as well as by lowering our product cost. This has been partially offset by the impact of increased sales of our CPS, such as PowerHouse. Our margins on PowerHouse sales are lower compared to our UPS sales because we realize lower margins on the third party equipment that we purchase and include in our PowerHouse product. We also scaled back our production levels in the fourth quarter of 2009 deliberately to reduce our inventory levels and to improve overall company liquidity. As a result, we experienced higher excess capacity costs, which decreased our gross margins because of the higher unabsorbed overhead in the factory.
Cost of service and other revenue
Cost of service and other revenue decreased 6% in 2009 while service and other revenue increased 4%. This decrease reflects better utilization of our service personnel in 2009, improved pricing for services and higher margin contract work, as well as higher service volume. In 2008 we saw a 41% increase due to higher headcount and related expenses that we put in place during the year to expand our service capabilities around the world that supported the 51% increase in service revenues we recorded in 2008. Cost of service and other revenue included approximately $36,000 and $46,000 of stock-based compensation for 2008 and 2009, respectively.
Research and development
Our research and development efforts in 2009 were largely focused on new configurations of our existing flywheel technology under development, as well as enhancements to our megawatt-class UPS products and refinement and standardization of our containerized product solutions. The decrease in spending compared to 2008 is primarily a result of lower headcount and lower prototype expenses. The prior year expenses included higher prototype and development costs for paralleling our megawatt-class UPS products. Research and development expense included approximately $384,000 and $171,000 of stock-based compensation in 2008 and 2009, respectively.
Selling and marketing
The decrease in selling and marketing expenses in 2009 largely reflects spending controls and lower variable selling expenses on lower sales levels. Although the total headcount has not changed significantly since 2008, we have changed the composition of our sales organization from supporting OEM partners to supporting more direct selling. We have also increased our marketing department staffing as we concentrate on developing and improving the Active Power brand, and supporting our direct selling activities. Selling and marketing expense included approximately $343,000 and $313,000 of stock-based compensation for 2008 and 2009, respectively.
General and administrative
The decrease in general and administrative expense from 2008 to 2009 reflects lower expenses for executive incentive compensation and lower bad debt allowances in 2009. These lower expenses were offset by higher professional fees incurred in connection with the private placement of securities that we made in the second quarter of 2009 and with the employee stock option exchange program that we completed in the third quarter of 2009. General and administrative expense included approximately $663,000 and $573,000 of stock-based compensation for 2008 and 2009, respectively..
Interest income
The decrease in interest income from 2008 to a net expense in 2009 is primarily attributable to the decrease in the amount of available funds that we had for investment during 2009 as our operating losses decreased our cash reserves, the decline in interest rates during 2009 that lowered our investment returns, and interest expense paid on balances outstanding under our revolving credit arrangement. We expect interest income to fluctuate depending on cash and investment balances and trends in interest rates.
Income tax expense
Due to operating losses, we have not recorded any income tax expenses, other than minimum or statutory costs. During 2009 we recorded a net tax benefit due to certain tax credits that we earned.
Liquidity and Capital Resources
Our primary sources of liquidity at December 31, 2010 are our cash and investments on hand, our bank credit facilities and projected cash flows from operating activities. If we meet our cash flow projections in our current business plan, we expect that we have adequate capital resources in order to continue operating our business for at least the next 12 months. Our business plan and our assumptions around the adequacy of our liquidity are based on estimates regarding expected revenues and future costs. However, there are scenarios in which our revenues may not meet our projections, our costs may exceed our estimates or our working capital needs may be greater than anticipated. Further, our estimates may change and future events or developments may also affect our estimates. Any of these factors may change our expectation of cash usage in 2011 and beyond or significantly affect our level of liquidity.
In February 2010, we sold approximately 13.25 million shares of common stock at a purchase price of $0.75 per share, for proceeds, net of fees and expenses, of approximately $9.0 million, in a firm-commitment underwritten offering made under a shelf registration statement that we had filed with the Securities and Exchange Commission and that had been declared effective in December 2009. The proceeds from this offering were designed to strengthen our balance sheet, to help fund our working capital requirements during 2010 and beyond, and for general corporate purposes.
In August 2010, we entered into a Second Amended and Restated Loan and Security Agreement (the “Loan Agreement” with our existing bank, Silicon Valley Bank (“SVB”) which increased the total availability from $6.0 million to $12.5 million subject to certain borrowing bases. This new facility expanded our ability to borrow funds from U.S. receivables to include qualifying receivables from our U.K. operations also, increased our ability to use inventory as collateral for borrowing against, and also added an ability to borrow against purchase orders. These additional bases of borrowing were designed to allow us to use the credit facility to fund inventory purchases in the event we received large or multiple sales orders that would require a major investment in inventory and work in progress such as our PowerHouse and infrastructure solutions business, and to help fund continued growth in our business.
This new two-year loan facility provides for a secured revolving line of credit in an aggregate amount of up to eighty percent (80%) of the facility amount of $15.625 million, or $12.5 million, subject to certain borrowing bases. In the event we have maintained unrestricted cash and cash equivalents of at least $6.25 million with SVB for at least 30 consecutive days, which is referred to as being in a “Streamline Period”, the borrowing base formula is based on eligible accounts receivable, eligible purchase orders and eligible inventory, subject to a sublimit of $5 million for U.K. accounts receivable, $3.5 million for inventory and $1.5 million for purchase orders. When we are not in a Streamline Period, our borrowings are limited based on accounts receivable and purchase orders that SVB has specifically agreed to finance and a borrowing base for eligible inventory. We may also request that SVB issue letters of credit on our behalf, of up to $1.5 million, as a portion of our total loan facility.
On August 5, 2010, the Company borrowed approximately $2.5 million in revolving loans, all of which was used to refinance all indebtedness owing from the Company to SVB under our previous credit facility. The new credit facility increases the total credit available from our previous loan facility with SVB, which was $6.0 million, and enables us to borrow against eligible inventory, foreign receivables and customer purchase orders in addition to eligible accounts receivable.
During 2010 we have borrowed and repaid amounts under this credit facility based on our short term liquidity requirements. Based on the borrowing base formula, we had an additional $9.4 million available for use at December 31, 2010 under this credit facility.
When a Streamline Period is in effect, each advance based upon accounts receivable and inventory accrues interest at a per annum rate equal to SVB’s prime rate, subject to a minimum prime rate of four percent (4.00%), plus one and one-half percent (1.50%) and each advance based upon a purchase order inventory accrues interest at a per annum rate equal to SVB’s prime rate, subject to a minimum prime rate of four percent (4.00%), plus two percent (2.00%). When a Streamline Period is not in effect, each advance based upon accounts receivable and inventory accrues interest at a per annum rate equal to SVB’s prime rate, subject to a minimum prime rate of four percent (4.00%), plus three and five-eighths percent (3.625%) and each advance based upon a purchase order accrues interest at a per annum rate equal to SVB’s prime rate, subject to a minimum prime rate of four percent (4.00%), plus six and one-half percent (6.50%). Finance charges and interest are payable monthly, and all principal and interest is due on the maturity date of August 5, 2012. However, when we are not in a Streamline Period, we must repay advances based on receivables when we receive payment on the receivable that has been financed, and we must repay advances based on purchase orders within 120 days of the date of the purchase order, together with all finance charges on such advances.
The revolving loans made to us under this loan facility will be secured by a lien on substantially all of our assets. In addition, on August 5, 2010, Active Power Solutions Limited, a wholly-owned United Kingdom subsidiary of the Company, entered into a Guarantee and Debenture with SVB (the “Guarantee and Debenture”), pursuant to which Active Power Solutions Limited guarantied all of the obligations of the Company under the Loan Agreement and secured its obligations under the Guarantee and Debenture with a security interest on substantially all of its assets.
The Loan Agreement includes customary affirmative covenants for a credit facility of this size and type, including delivery of financial statements, compliance with laws, maintenance of insurance and protection of intellectual property rights. Further, the Loan Agreement contains customary negative covenants for a credit facility of this size and type, including covenants that limit or restrict the Company’s ability, among other things, to dispose of assets, change its business, change its CEO or CFO without replacing such person within 120 days, have a change in control, make acquisitions, be acquired, incur indebtedness, grant liens, make investments, make distributions, repurchase stock, and enter into certain transactions with affiliates. The Loan Agreement also requires the Company to maintain a minimum liquidity ratio of 1.25:1. The liquidity ratio is defined as the ratio of unrestricted cash and cash equivalents and marketable securities plus eligible accounts receivable to all indebtedness owed by the Company to SVB. The Company is currently in compliance with all loan covenants under the Loan Agreement.
The Loan Agreement contains customary events of default that include, among other things, non-payment defaults, covenant defaults, material adverse change defaults, insolvency defaults, material judgment defaults and inaccuracy of representations and warranty defaults. The occurrence of an event of default could result in the acceleration of obligations under the Loan Agreement, in which case the Company must repay all loans and related charges, fees and amounts then due and payable, and our subsidiary may be required to pay any such amounts under the Guarantee and Debenture. At the election of SVB, upon the occurrence and during the continuance of an event of default, finance charges or interest rates, as applicable, will increase an additional five percentage points (5.00%) per annum above the rate that is otherwise applicable thereto upon the occurrence of such event of default, and the collateral handling fees will increase by one-half percent (0.50%).
A substantial increase in sales of our PowerHouse or our infrastructure solutions products or a substantial increase in UPS sales may materially impact the amount of liquidity required to fund our operations. The amount of time between the receipt of payment from our customers and our expenditures for raw materials, manufacturing and shipment of products (the cash cycle) for sales of our CleanSource UPS product can be as short as 45 days, and is typically 60 days. However, the cash cycle on a PowerHouse sale can be as much as 210 days, depending upon customer payment terms. We intend to mitigate the financial impact of this longer cash cycle by requiring customer deposits and periodic payments where possible from our customers. This is not always commercially feasible, and in order to increase our PowerHouse sales, we may be required to make larger investments in inventory and receivables. These larger investments may require us to obtain additional sources of working capital, debt or equity financing in order to fund this business.
Should additional funding be required, we would expect to raise the required funds through borrowings or public or private sales of debt or equity securities. If we raise additional funds through the issuance of debt or equity securities, the ownership of our stockholders could be significantly diluted. If we obtain additional debt financing, a substantial portion of our operating cash flow may be dedicated to the payment of principal and interest on such indebtedness, and the terms of the debt securities issued could impose significant restrictions on our operations. We do not know whether we will be able to secure additional funding, or funding on terms acceptable to us, to continue our operations as planned. If financing is not available, we may be required to reduce, delay or eliminate certain activities or to license or sell to others some of our proprietary technology.
Significant uses of cash
Operating Activities
The following table summarizes the yearly changes in cash provided by (used in) operating activities (in thousands):
|
Year
|
Annual Amount
|
Change from
Prior Year
|
Percent
Change
|
|||||||||
|
2010
|
$ | 68 | $ | (6,984 | ) | (101 | )% | |||||
|
2009
|
(6,916 | ) | (4,914 | ) | (42 | )% | ||||||
|
2008
|
(11,830 | ) | — | — | ||||||||
Cash provided by operating activities was $.07 million in 2010 compared to cash used in operating activities of $6.9 million in 2009, a decrease of 101%, or $7.0 million. This change in cash used in operating activities was primarily due to lower operating losses. In addition, changes in operating assets and liabilities, or our net working capital, resulted in cash provided of $0.8 million in 2010, compared to cash provided from such working capital of $0.4 million in 2009.
As our business continues to grow, we have had to finance a larger level of inventory and receivables to support this higher level of activity, particularly with our PowerHouse and infrastructure solutions. Our receivables increased by $3.2 million or 28% during 2010, primarily as a result of a 38% increase in fourth quarter sales compared to the fourth quarter of 2009. Our inventory decreased by $0.2 million during 2010, primarily during the fourth quarter as a result of lower work-in-progress and finished goods inventory on hand. This, combined with an increase in trade payables of $0.9 million during 2010 and an acceleration of customer payments, allowed us to finance our revenue growth from the second quarter of 2010 to the fourth quarter without significant depletion of our available cash and investments. On an annual basis, the increase in trade payables offset the increase in receivables, and our inventory levels did not increase as they had in 2008, which combined with lower operating losses resulted in the decrease in funds used in operations.
Our top five customers represent 67% of our total revenue during 2010. In addition, as of December 31, 2010, our five largest receivables were 72% of our total receivables. As a result of this customer concentration, our failure to collect receivables from any of these customers in a timely manner could have a significant adverse effect on our liquidity. This risk may potentially increase as we sell more PowerHouse products due to their higher average selling price. We do continue to request deposits and periodic payments from large customers where commercially possible, particularly for projects with multiple deliverables. However, the amount of such advance payments can fluctuate significantly on a quarterly basis, depending on the size and scope of customer orders at any point in time. As a result, we will need to continue to focus on management of cash and working capital in 2011 in order to manage the level of funds we use in our operating activities. This concentration is evidenced by the fact that at December 31, 2010 our five largest receivables were 72% of our total receivables.
We used $6.9 million of cash to fund our operating activities in 2009, which was $4.9 million or 42% lower than in 2008. This change in cash used in operating activities was primarily due to lower operating losses. In addition, changes in operating assets and liabilities, or our net working capital, resulted in cash provided of $0.4 million in 2009, compared to cash used in such working capital of $3.7 million in 2008.
Investing Activities
Investing activities primarily consist of sales and purchases of investments and purchases of property and equipment. Fluctuations in the sale and purchase of investments generally reflect our use of these investment funds to finance our ongoing operations. The cash used in investing activities increased from $54,000 in 2009 to $1.2 million in 2010 as we had less short-term investments available to liquidate to fund our business and due to increased capital expenditures in 2010 as we supported our sales and marketing programs. Capital expenditures during 2009 decreased slightly from 2008 by approximately $0.2 million and primarily related to equipment to support our sales and marketing activities. We historically invested in our manufacturing infrastructure and with a production capacity far in excess of our current revenue level we can substantially increase our production levels without needing to make any material capital investments. Our capital expenditures therefore will primarily support expansion of our sales and service capabilities and our marketing and administrative efforts as required.
Financing Activities
Funds provided by financing activities during 2010 and 2009 primarily reflect the sale of common stock by the Company. In February 2010 we sold approximately 13.25 million shares of common stock in a firm-commitment underwritten offering at a purchase price of $0.75 per share, for proceeds, net of fees and expenses, of $9.0 million. These proceeds were designed to strengthen our balance sheet and used to help fund our working capital requirements and for general corporate purposes. Funds provided by financing activities in 2009 reflect the sale of common stock through a private placement to an institutional investor pursuant to which we sold 6.0 million shares of common stock at $0.50 per share through a private placement to an institutional investor, which generated $3.0 million in proceeds.
We expect the level of capital investments to increase in 2011 compared to 2010. We currently intend to invest in several PowerHouse systems to use for demonstration purposes in the U.S., China and the U.K. to help our sales efforts.
Contractual Commitments
In our day-to-day operations, we incur commitments to make future payments for goods and services. These arise from entering into operating leases and as we make commitments to vendors to provide us materials and services. The following table summarizes our significant contractual obligations and commitments at December 31, 2010 (in thousands):
|
Payment due by period
|
||||||||||||||||||||
|
Total
|
Less than 1 year
|
1-3 years
|
3-5 years
|
More than 5
years
|
||||||||||||||||
|
Operating lease obligations
|
$ | 2,062 | $ | 1,341 | $ | 434 | $ | 133 | $ | 154 | ||||||||||
|
Purchase obligations
|
6,728 | 6,728 | — | — | — | |||||||||||||||
|
Other long-term obligations
|
175 | 25 | 50 | 50 | 50 | |||||||||||||||
Our principal lease commitments consist of our leases for our corporate headquarters and engineering and administration facilities and our global sales offices.
In 2007, we entered into a secured revolving line of credit facility of up to $5 million, subject to a borrowing base formula, with SVB. This facility was modified in 2008 to increase the limit to $6 million. In August 2010, we entered into a Second Amended and Restated Loan and Security Agreement with SVB. This new credit facility increased the total liquidity available from $6.0 million to $12.5 million subject to certain borrowing bases. There was $2.5 million and $2.6 million outstanding under this facility at December 31, 2010 and 2009, respectively.
Future uses of cash
We believe that our cash and investments will be sufficient to fund our operations for at least the next 12 months. Our sales cycle is such that we generally have visibility 2-3 quarters in advance for future orders that allows us to predict revenues over this period of time with some degree of confidence. However, a sudden change in business volume, positive or negative, from any of our business or channel partners or in our direct business could significantly impact our expected revenues. The recent global economic downturn has reduced our confidence at predicting future revenues, and even with improving economic conditions, there is still uncertainty and risk in our forecasting. This 2-3 quarter window of sales visibility does provide us with some opportunity to adjust expenditures or take other measures to reduce our cash consumption if we can see and anticipate a shortfall in revenue or give us time to identify additional sources of funding if we anticipate an increase in our working capital requirements due to increased revenues or changes in our revenue mix. A significant increase in sales, especially in our PowerHouse or our infrastructure solutions business, would likely increase our working capital requirements, due to the longer production time and cash cycle of sales of these products.
We expect the level of capital investments to increase in 2011 compared to 2010. We currently intend to invest in multiple PowerHouse systems to use for demonstration purposes in the U.S., Europe and Asia to enhance our sales activities and for use as customer rentals. We also intend to invest further in our facilities in Europe and Asia to allow us to assemble PowerHouse and CPS solutions supporting the expansion of our expanding global sales efforts.
Other factors that may affect liquidity
Beyond the next twelve months, our cash requirements will depend on many factors, including the rate of sales growth, the market acceptance of our products, the gross profit we are able to generate with our sales, the timing and level of development funding, the rate of expansion of our sales and marketing activities, the rate of expansion of our manufacturing processes, and the timing and extent of research and development projects. Although we are not a party to any agreement or letter of intent with respect to a potential acquisition or merger, we may enter into acquisitions or strategic arrangements in the future to help accelerate our growth, which could also require us to seek additional equity or debt financing. Should additional funding be required, we may need to raise the required funds through borrowings or public or private sales of debt or equity securities. If we raise additional funds through the issuance of debt or equity securities, the percentage ownership of our stockholders could be significantly diluted. If we obtain additional debt financing, a substantial portion of our operating cash flow may be dedicated to the payment of principal and interest on such indebtedness, and the terms of the debt securities issued could impose significant restrictions on our operations. We do not know whether we will be able to secure additional funding, or funding on terms acceptable to us, to continue our operations as planned. If financing is not available, we may be required to reduce, delay or eliminate certain activities or to license or sell to others some of our proprietary technology.
Off-Balance Sheet Arrangements
During the years ended December 31, 2008, 2009 and 2010, we did not have any relationships with unconsolidated entities or financial partnerships, such as entities often referred to as structured finance or special purpose entities, which would have been established for the purpose of facilitating off-balance sheet arrangements or other contractually narrow or limited purposes.
New Accounting Pronouncements
On January 1, 2010, we adopted amendments to authoritative literature that modifies the revenue recognition guidance for establishing separate units of accounting in a multiple element arrangement and requires the allocation of arrangement consideration to each deliverable in the arrangement based on relative selling price of the elements. The selling price for each deliverable is based on vendor-specific objective evidence (“VSOE”) if available, third-party evidence (“TPE”) if VSOE is not available, or best estimate of selling price (“BESP”) if neither VSOE nor TPE is available. BESP must be determined in a manner that is consistent with that used to determine the price to sell the specific elements on a standalone basis. The authoritative literature permits prospective or retrospective adoption, and we elected prospective adoption. Other than the increased disclosure requirements of adoption of this policy, the adoption of these amendments did not change our units of accounting, allocation of arrangement consideration, or pattern or timing of revenue recognition. It also did not have a significant impact on our financial position, results of operations, or cash flows for the year ended December 31, 2010.
|
ITEM 7A.
|
Quantitative and Qualitative Disclosures About Market Risk.
|
We invest our cash in a variety of financial instruments, including bank time deposits, and taxable variable rate and fixed rate obligations of corporations, municipalities, and local, state and national government entities and agencies. These investments are denominated in U.S. dollars.
Our interest income is sensitive to changes in the general level of U.S. interest rates, particularly since the majority of our investments are in short-term instruments. We believe that our investment policy is conservative, both in terms of the average maturity of investments that we allow and in terms of the credit quality of the investments we hold. Because of the nature of the majority of our investments, we do not believe a 1% decline in interest rates would have a material effect on interest income or their fair value.
Our international sales were historically made in U.S. dollars. As we have increased sales in foreign markets and opened operations in multiple foreign countries, we have executed more transactions that are denominated in other currencies, primarily Euro and British pounds. Those sales and expenses in currencies other than U.S. dollars can result in translation gains and losses which have not been significant to date. Currently, we do not engage in hedging activities for our international operations other than an increasing amount of sales and support expenses being incurred in foreign currencies as a natural hedge. However, recent volatility in currencies, particularly with the pound and Euro, is increasing the amount of potential translation gains and losses and we may engage in hedging activities in the future to mitigate the risks caused by such currency volatility.
Our international business is subject to the typical risks of any international business, including, but not limited to, the risks described in Item 1A, “Risk Factors.” Accordingly, our future results could be materially harmed by the actual occurrence of any of these or other risks.
|
ITEM 8.
|
Financial Statements and Selected Quarterly Financial Data.
|
The Financial Statements and Selected Quarterly Financial Data required by this item are included in Part IV, Item 15(a)(1) and are presented beginning on Page 58.
|
ITEM 9.
|
Changes in and Disagreements with Accountants on Accounting and Financial Disclosure.
|
None.
|
ITEM 9A.
|
Controls and Procedures.
|
Effectiveness of Disclosure Controls and Procedures.
Our Chief Executive Officer and our Chief Financial Officer, based on the evaluation of our disclosure controls and procedures (as defined in Rule 13a-15(e) or 15d-15(e) under the Securities Exchange Act of 1934, as amended) required by paragraph (b) of Rule 13a-15 or Rule 15d-15, have concluded that, as of December 31, 2010, our disclosure controls and procedures were effective to ensure that the information we are required to disclose in reports that we file or submit under the Securities Exchange Act of 1934, as amended, (i) is recorded, processed, summarized and reported within the time periods specified in Securities and Exchange Commission rules and forms, and (ii) is accumulated and communicated to our management, including our Chief Executive Officer and our Chief Financial Officer, as appropriate to allow timely decisions regarding required disclosure.
Management’s Report on Internal Control over Financial Reporting.
Management is responsible for establishing and maintaining adequate internal control over financial reporting, as such term is defined in Exchange Act rules 13a-15(f) and 15d-15(f). Internal control over financial reporting is a process, designed by, or under the supervision of, our Chief Executive Officer and Chief Financial Officer, and effected by our Board, management and other personnel, to provide reasonable assurance regarding the reliability of financial reporting, and the preparation of financial statements for external purposes in accordance with generally accepted accounting principles.
Internal control over financial reporting includes those policies and procedures that (1) pertain to the maintenance of records that, in reasonable detail, accurately and fairly reflect the transactions and dispositions of the assets of the company; (2) provide reasonable assurance that transactions are recorded as necessary to permit preparation of financial statements in accordance with generally accepted accounting principles, and that our receipts and expenditures are being made only in accordance with the authorizations of our management and directors; and (3) provide reasonable assurance regarding prevention or timely detection of unauthorized acquisition, use, or disposition of our assets that could have a material effect on our financial statements.
Management assessed the effectiveness of our internal control over financial reporting as of December 31, 2010. In making this assessment, management used the criteria set forth in Internal Control – Integrated Framework issued by COSO. A material weakness is a control deficiency, or combination of control deficiencies, that results in more than a remote likelihood that a material misstatement of the annual or interim financial statements will not be prevented or detected. Based on our assessment, management concluded that, as of December 31, 2010, our internal control over financial reporting was effective to provide reasonable assurance regarding the reliability of financial reporting and the preparation of financial statements for external purposes in accordance with U.S. generally accepted accounting principles.
Our independent registered public accounting firm, Grant Thornton LLP, audited our consolidated financial statements, and independently assessed the effectiveness of our internal control over financial reporting. Grant Thornton LLP has issued their report, which is included in Part IV of this Form 10-K.
Changes in Internal Control over Financial Reporting.
There have been no changes in our internal control over financial reporting during the quarter ended December 31, 2010 that have materially affected, or are reasonably likely to materially affect, our internal control over financial reporting.
Because of its inherent limitations, internal control over financial reporting may not prevent or detect misstatements. Forward looking statements regarding the effectiveness of internal controls during future periods are subject to the risk that controls may become inadequate because of change in conditions, or that the degree of compliance with the policies and procedures may deteriorate.
|
ITEM 9B.
|
Other Information.
|
None.
PART III.
|
ITEM 10.
|
Directors and Executive Officers of the Registrant.
|
The following table sets forth certain biographical information concerning our current directors, and executive officers:
|
Name
|
Age
|
Position(s)
|
||
|
James A. Clishem
|
54
|
President, Chief Executive Officer and Director
|
||
|
John K. Penver
|
48
|
Vice President of Finance, Chief Financial Officer and Secretary
|
||
|
Dietmar Papenfort
|
45
|
Vice President Sales—EMEA & Asia Pacific
|
||
|
Lisa M. Brown
|
45
|
Vice President—Marketing & Sales Operations
|
||
|
Uwe Schrader-Hausmann
|
56
|
Chief Technical Officer
|
||
|
Jason P. Rubin
|
45
|
Vice President—Manufacturing
|
||
|
Martin T. Olsen
|
49
|
Vice President—Global Sales
|
||
|
Ake Almgren
|
64
|
Director
|
||
|
Rodney S. Bond
|
66
|
Director
|
||
|
James E.deVenny III
|
63
|
Director
|
||
|
Robert S. Greenberg
|
57
|
Director
|
||
|
Jan H. Lindelow
|
66
|
Director
|
||
|
Benjamin L. Scott
|
61
|
Director
|
Executive Officers
James A. Clishem has been our President and CEO since May 2006. Mr. Clishem joined Active Power in June 2005 as our Vice President of Business Development and was promoted to be our President and Chief Operating Officer in November 2005 before his promotion to Chief Executive Officer. He became one of our directors in June 2006. Mr. Clishem came to Active Power from Peregrine Systems, Inc., a publicly traded enterprise software company, where he served as Vice President of Business Development focusing on global alliances since 2004. From 1999 until it was sold in 2004, he was founder, President and CEO of Xodiax, a profitable managed IT services business, which was recognized by Inc Magazine as one of the fastest growing privately held companies in the country. Mr. Clishem also served as Vice President of Data Services for Broadwing Communications, where he had responsibility for a $150 million business unit. He has also held various executive roles at ntr.net, MCI, Ericsson, and Tandem Computers. Mr. Clishem holds a B.S. and M.S. in Electrical Engineering from the University of Louisville in Kentucky and an M.B.A from Southern Methodist University in Dallas, Texas.
John K. Penver was hired in February 2005 as Chief Financial Officer and Vice President of Finance and oversees all of our accounting, finance, treasury, investor relations, human resources and IT operations. Prior to joining Active Power, Mr. Penver served as Chief Financial Officer or Vice President Finance for a number of public and private technology and manufacturing-based organizations including PerformanceRetail, Inc. a privately held retail management software company, Factory Logic, Inc., a privately held enterprise-application software company, Yclip Corporation, a privately held internet-marketing software company, and Silicon Gaming, Inc., a publicly traded manufacturer of high-technology slot machines for the gaming industry. Mr. Penver also had 12 years of audit experience with the international accounting firm of Deloitte & Touche LLP in both the U.S. and Australia. Mr. Penver is a Certified Public Accountant and a Chartered Accountant, and holds a Bachelor of Business in Accounting from Monash University in Australia and an M.B.A. from Santa Clara University in California.
Dietmar Papenfort joined Active Power in October 2009 as Vice President Sales—EMEA and Asia Pacific. He is responsible for managing Active Power’s direct sales strategy to drive sales growth and market penetration in Europe, Middle East, Africa and Asia Pacific. Prior to joining Active Power, Mr. Papenfort most recently worked for AEG Power Solutions, a German-based manufacturer of UPS products, for 16 years in a combination of engineering, product marketing and sales roles and where he most recently was Vice President of Sales for North East Europe since July 2000. Mr. Papenfort holds a Diploma of Electrical Engineering from University Paperbron in Germany. Mr. Papenfort has resigned from the Company effective March 31, 2011.
Lisa M. Brown was hired in December 2005 as our Vice President of Marketing and Sales Operations. In this role she is responsible for all of our product and corporate marketing, product development, public relations and sales operations functions. Prior to joining Active Power Ms. Brown spent 14 years with Broadwing Communications, a telecommunications infrastructure provider where she held executive positions including Vice President of Marketing, Sales Operations and Customer Operations. Ms. Brown holds a Bachelor of Science degree in Business Administration, Finance, from Bloomsburg University in Pennsylvania.
Uwe Schrader-Hausmann joined Active Power in August 2005 and held various positions in our EMEA sales engineering group and as Managing Director of Active Power (Germany) GmbH before being promoted to Vice President—Technical Services in October 2007 and then to Chief Technical Officer in January 2009. In this role he is responsible for all customer-facing technical service functions including applications engineering, project management, and project implementation, as well as for all of our product development activities. Mr. Schrader-Hausmann has over 29 years of experience in the UPS industry. Prior to joining Active Power, he spent 26 years with Piller Power Systems GmbH, a German-based rotary UPS manufacturer, most recently as Chief Technical Officer. He also has UPS experience with Max Mueller Gildemeister GmbH in Germany. Mr. Schrader-Hausman holds a Diplom-Ingeneur (the German equivalent of a Master of Science degree) from The University of Applied Science in Hanover, Germany.
Jason P. Rubin joined Active Power in March 2000 as a production planner and held various positions in our manufacturing group before being promoted to Vice President of Manufacturing in October 2005. In this role Mr. Rubin is responsible for the manufacture and testing of all Active Power products as well as managing all material and logistic requirements to support production and our customer service activities. Mr. Rubin has over 20 years of manufacturing experience in multiple industries and immediately prior to joining Active Power was involved in managing operations and manufacturing systems for Windsport, Inc., a fabricated textile manufacturer. Mr. Rubin holds a Bachelor of Science degree in Industrial Engineering from the University of Oklahoma in Norman, Oklahoma.
Martin T. Olsen joined Active Power in April 2007 as a Director of Product Management before being promoted in May 2008 to Vice President of Business Development. In January 2010 Mr. Olsen was promoted to Vice President—Channel Sales & Business Development. In December 2010, Mr. Olsen was promoted to Vice President – Global Sales. In this role Mr. Olsen is responsible for our global sales activity, including channel sales business for our OEM partners and our IT Channel sales partners, as well as our business development activities to expand our product and sales distribution channels. Prior to joining Active Power, Mr. Olsen was the Director for the data center group at Wright Line LLC, a global data center infrastructure provider for 4 years, and prior to that was a product marketing manager with American Power Conversion Corp., a global UPS manufacturer in both the USA and Europe and Asia. He also has prior product management experience with Siligen AS, a manufacturer of power availability products in Denmark. A US patent holder, Mr. Olsen holds a Bachelor of Science degree in Marketing from the International Business College at Kolding, Denmark, and diplomas in Logistics and International Business Law from the International Business College at Kolding, Denmark.
Directors
Ake Almgren has served as a member of our Board of Directors since March 2004. Since June 2009, Dr. Almgren has served as the Chief Executive Officer and President of International Battery, a manufacturer of lithium ion cells and batteries. Since May 2003 Dr. Almgren has also served as President of his consultant company, ORKAS Corp. From July 1998 to May 2003, Dr. Almgren served as Chairman and Chief Executive Officer of Capstone Turbine Corp. Prior to his employment at Capstone, Dr. Almgren had a 26-year career at ASEA Brown Boveri Limited (“ABB”), a worldwide power solutions company, where he held the position of worldwide Business Area Manager for Distribution Transformers and managed the operation of 36 plants in 28 countries. He also was President of ABB Power T&D Company, President of ABB Power Distribution, and President of ABB Power Systems during his tenure at ABB. Dr. Almgren also serves on the board of managers of PJM Interconnect LLC and on the advisory board of Infinia Corporation. Dr. Almgren holds a Ph.D. in Engineering from Linkopings Tekniska Hogskola in Sweden and a Masters of Mechanical Engineering from the Royal Institute of Technology in Stockholm, Sweden.
Rodney S. Bond has served as a member of our Board of Directors since September 1994. From October 2000 to the present, Mr. Bond has served as a principal engaged in financial and strategic planning consulting at Sherman Partners, and was the Executive Vice President—Finance for Up Link Corporation, a privately held supplier of GPS business solutions for the golf industry, until its sale in 2009. From May 1990 to October 2000, Mr. Bond served in various capacities, including as Chief Strategic Officer and Chief Financial Officer, with VTEL Corporation, a publicly traded digital video communications company. Mr. Bond also serves on several private company boards and holds a B.S. in Metallurgical Engineering from the University of Illinois and an M.B.A. from Northwestern University in Illinois.
James E. deVenny III has served as a member of our Board of Directors since March 2008. From 1999 until March 2008, Mr. deVenny served as the co-founder, President and Chief Executive Officer of Dataside LLC, a Texas-based provider of enterprise data center space and managed network services. Mr. deVenny is now an independent consultant through his business, JD Investments. Prior to founding Dataside, Mr. deVenny co-founded Computex Support Systems where he was involved for 15 years in the design and development of mission critical data centers and telecommunications sites. Prior to this he spent five years as Vice President of Sales and Marketing for International Power Machines, a manufacturer of uninterruptible power supply systems. Mr. deVenny also serves on the Board of Directors of Lumenate, a private technology consulting services company. He holds a Bachelor of Science degree in Journalism and Communications from the University of Florida.
Robert S. Greenberg has served as a member of our Board of Directors since March 2009. Since January 2009, Mr. Greenberg has been the Chief Information Officer and Vice President for Agco Corporation, a global manufacturer and distributor of agricultural equipment. Prior to joining Agco Corporation, Mr. Greenberg was Vice President and Chief Information Officer for five years with Nissan Americas, the U.S. subsidiary of Nissan Motor Ltd, a global automotive manufacturer. Mr. Greenberg also served in executive and CIO capacities over 20 years with Avaya, Inc., a global enterprise communications provider, Dell Computer, Inc and Exxon Mobil, including time spent in Asia Pacific. Mr. Greenberg holds both a Bachelor of Science and Masters of Engineering degrees in Operations Science and Industrial Engineering from Cornell University in New York and an M.B.A. in Finance from the University of Maryland.
Jan H. Lindelow has served as a member of our Board of Directors since February 1998. Mr. Lindelow joined Tivoli, a unit of the IBM Software Group, in June 1997 and served as Chairman and Chief Executive Officer of Tivoli until the spring of 2001. He then became Vice President, Emerging Business Development for IBM until his retirement in 2002. Mr. Lindelow has executive experience in key markets and core technologies critical to the Company’s future success. From 1994 to 1995, Mr. Lindelow was President and Chief Operating Officer of Symbol Technologies, a leader in handheld computing and scanning technologies. He also served in several senior executive positions with Asea Brown Boveri (“ABB”), a global company delivering power, energy and automation technologies from 1988 to 1994. Prior to ABB, Mr. Lindelow was President of Worldwide Sales and Service at Unisys/Sperry Computer Systems, a worldwide information technology services and solutions company. Mr. Lindelow joined Unisys/Sperry in his native Sweden where he subsequently became President of Sperry’s Nordic Group. Mr. Lindelow holds a M.S. in Electrical Engineering from the Royal Institute of Technology in Stockholm, Sweden. During 2010, Mr. Lindelow served on the board of directors of the following private companies: Credant Technologies, HyPerformix (Chairman) and Troux Technologies.
Benjamin L. Scott has served as a member of our Board of Directors since March 2002 and as Chairman of the Board of Directors since February 2007. During 2009 Mr. Scott co-founded LiveOak Venture Partners, a venture capital firm. Prior to this, Mr. Scott served as a Venture Partner with Austin Ventures, a venture capital firm, from May 2002 until June 2009. From January 2000 to May 2002, Mr. Scott served as a Partner with Quadrant Management, a venture capital firm. From October 1997 to November 1999, Mr. Scott served as the Chairman and Chief Executive Officer of IXC Communications, a public provider of data and voice communications services that was subsequently sold to Cincinnati Bell and is now known as Broadwing Communications. Mr. Scott has served as a senior executive with AT&T, PrimeCo and Bell Atlantic. Mr. Scott also serves on the boards of directors of several private companies and holds a B.S. in Psychology from Virginia Polytechnic Institute and State University.
The other information also required under Item 10, including disclosure of delinquent Section 16 filings, our Code of Ethics and matters relating to our audit committee and its members will be included under the sections captioned “Compliance with Section 16(a) of the Securities Exchange Act of 1934,” “Corporate Governance” and Meetings and Committees of the Board, respectively,” in our Proxy Statement for the 2011 Annual Meeting of Stockholders, which information is incorporated into this Annual Report by reference.
|
ITEM 11.
|
Executive Compensation.
|
The information required by this Item will be included under the sections captioned “Executive Compensation, “Compensation Committee Interlocks and Insider Participation,”“Compensation Committee Report” and “Certain Transactions” in our Proxy Statement for the 2011 Annual Meeting of Stockholders, which information is incorporated into this Annual Report by reference.
|
ITEM 12.
|
Security Ownership of Certain Beneficial Owners and Management and Related Stockholder Matters.
|
The information required by this Item will be included under the sections captioned “Ownership of Securities, “Equity Compensation Plan Information” and “Potential Payments upon Termination or Change of Control” in our Proxy Statement for the 2011 Annual Meeting of Stockholders, which information is incorporated into this Annual Report by reference.
|
ITEM 13.
|
Certain Relationships and Related Transactions.
|
The information required by this Item will be included under the sections captioned “Certain Transactions” and “Director Independence” in our Proxy Statement for the 2011 Annual Meeting of Stockholders, which information is incorporated into this Annual Report by reference.
|
ITEM 14.
|
Principal Accountant Fees and Services.
|
The information required by this Item will be included under the section captioned “Proposal Three: Ratification of Independent Auditors” in our Proxy Statement for the 2011 Annual Meeting of Stockholders, which information is incorporated into this Annual Report by reference.
PART IV.
|
ITEM 15.
|
Exhibits and Financial Statement Schedules.
|
(a)
1. Financial Statements.
The following financial statements of Active Power, Inc. were filed as a part of the original Annual Report on Form 10-K for the fiscal year ending December 31, 2010, that was filed with the Securities and Exchange Commission on March 1, 2011:
|
Page
|
|
|
Reports of Independent Registered Public Accounting Firm
|
55
|
|
Financial Statements:
|
|
|
Consolidated Balance Sheets
|
58
|
|
Consolidated Statements of Operations and Comprehensive Loss
|
59
|
|
Consolidated Statements of Stockholders’ Equity
|
60
|
|
Consolidated Statements of Cash Flows
|
61
|
|
Notes to Financial Statements
|
62
|
2. Schedules.
All schedules have been omitted since the information required by the schedule is not applicable, or is not present in amounts sufficient to require submission of the schedule, or because the information required is included in the Financial Statements and notes thereto.
3. Exhibits.
The exhibits listed on the accompanying index to exhibits immediately following the financial statements are filed herewith, or are incorporated by reference as indicated below.
(b) Exhibits
|
Exhibit
Number
|
Description
|
|
|
3.1*
|
Restated Certificate of Incorporation (filed as Exhibit 3.1 to Active Power’s Quarterly Report on Form 10-Q filed on July 28, 2006)
|
|
|
3.2*
|
Second Amended and Restated Bylaws (filed as Exhibit 3.2 to Active Power’s Current Report on Form 8-K filed on February 2, 2007)
|
|
|
3.3*
|
Amendment to Second Amended and Restated Bylaws (filed as Exhibit 3.01 to Active Power’s Current Report on Form 8-K filed on December 7, 2007)
|
|
|
4.1*
|
Specimen certificate for shares of Common Stock (filed as Exhibit 4.1 to Active Power’s IPO Registration Statement on Form S-1 (SEC File No. 333-36946) (the “IPO Registration Statement))
|
|
|
4.2*
|
Rights Agreement, dated as of December 13, 2001, between the Active Power and EquiServe Trust N.A., which includes the form of Certificate of Designation for the Series A Junior Participating Preferred Stock as Exhibit A, the form of Rights Certificate as Exhibit B and the Summary of Rights to Purchase Series A Preferred Stock as Exhibit C (filed as Exhibit 4 to Active Power’s Current Report on Form 8-K filed on December 14, 2001)
|
|
|
4.3
|
See Exhibits 3.1 and 3.2 for provisions of the Certificate of Incorporation and Bylaws of the registrant defining the rights of holders of common stock
|
|
|
10.1*
|
Form of Indemnity Agreement (filed as Exhibit 10.1 to the IPO Registration Statement)
|
|
| 10.2* |
Active Power, Inc. 2000 Stock Incentive Plan (filed as Exhibit 10.2 to the IPO Registration Statement) †
|
|
|
10.3*
|
Second Amended and Restated Investors’ Rights Agreement by and between Active Power, Inc. and certain of its stockholders (filed as Exhibit 10.4 to the IPO Registration Statement)
|
|
Exhibit
Number
|
Description
|
|
10.4*
|
Lease Agreement by and between Active Power, Inc. and Braker Phase III, Ltd. (filed as Exhibit 10.9 to the IPO Registration Statement)
|
|
|
10.5*
|
First Amendment to Lease Agreement by and between Active Power, Inc. and Braker Phase III, Ltd. (filed as Exhibit 10.10 to the IPO Registration Statement)
|
|
|
10.6*
|
Second Amendment to Lease Agreement by and between Active Power, Inc. and Braker Phase III, Ltd. (filed as Exhibit 10.11 to the IPO Registration Statement)
|
|
|
10.7*
|
Third Amendment to Lease Agreement by and between Active Power, Inc. and Braker Phase III, Ltd. (filed as Exhibit 10.12 to the IPO Registration Statement)
|
|
|
10.8*
|
Fourth Amendment to Lease Agreement by and between Active Power, Inc. and Metropolitan Life Insurance Company (filed as Exhibit 10.13 to the IPO Registration Statement)
|
|
|
10.9*
|
Fifth Amendment to Lease Agreement by and between Active Power, Inc. and Metropolitan Life Insurance Company (filed as Exhibit 10.14 to the IPO Registration Statement)
|
|
|
10.10*
|
Sixth Amendment to Lease Agreement by and between Active Power, Inc. and Metropolitan Life Insurance Company (filed as Exhibit 10.18 to Active Power’s Annual Report on Form 10-K for the fiscal year ended December 31, 2000 (the “2000 10-K”))
|
|
|
10.11*
|
Seventh Amendment to Lease Agreement by and between Active Power, Inc. and Metropolitan Life Insurance Company (filed as Exhibit 10.19 to the 2000 10-K)
|
|
|
10.12*
|
Lease Agreement by and between Active Power, Inc. and BC12 99, Ltd. (filed as Exhibit 10.17 to the 2000 10-K)
|
|
|
10.13*
|
Stock Issuance Agreement with Jim Clishem (filed as Exhibit 99.1 to Active Power’s Current Report on Form 8-K filed on March 14, 2006) †
|
|
|
10.14*
|
Stock Issuance Agreement with Jim Clishem (filed as Exhibit 99.2 to Active Power’s Current Report on Form 8-K filed on March 14, 2006) †
|
|
|
10.15*
|
Securities Purchase Agreement dated August 13, 2007 (filed as Exhibit 10.19 to Active Power’s Registration Statement on Form S-1 filed on September 12, 2007)
|
|
|
10.16*+
|
Purchase Agreement effective as of January 1, 2008 between Active Power, Inc. and Caterpillar, Inc. (filed as Exhibit 10.1 to Active Power’s Quarterly Report on Form 10-Q for the quarter ended March 31, 2008)
|
|
|
10.17*
|
Underwriting Agreement with Thomas Weisel Partners LLC, dated February 19, 2010 (filed as Exhibit 1.1 to Active Power's Current Report on Form 8-K filed on February 22, 2010) | |
| 10.18* | Form of Severance Benefits Agreement (filed as Exhibit 10.4 to Active Power's Quarterly Report on Form 10-Q filed on April 27, 2010) | |
|
10.19*
|
Severance Benefits Agreement with Jim Clishem dated October 29, 2008 (filed as Exhibit 10.22 to Active Power’s Annual Report on Form 10-K for the fiscal year ended December 31, 2008)†
|
|
|
10.20*
|
Severance Benefits Agreement with John Penver dated October 29, 2008 (filed as Exhibit 10.23 to Active Power’s Annual Report on Form 10-K for the fiscal year ended December 31, 2008)†
|
|
|
10.21*
|
Securities Purchase Agreement, dated as of May 29, 2009 (filed as Exhibit 10.1 to Active Power’s Current Report on Form 8-K filed on June 1, 2009)
|
|
| 10.22* | Active Power, Inc. 2010 Equity Incentive Plan (filed as Exhibit 10.1 to Active Power's current Report on Form 8-K filed on May 18, 2010)† | |
| 10.23* | Form of Standard Stock Option Agreement (filed as Exhibit 10.2 to Active Power's Current Report on Form 8-K filed on May 18, 2010) | |
| 10.24* | Form of Standard Restricted Stock Agreement Stock Agreement (filed as Exhibit 10.3 to Active Power's Current Report on Form 8-K filed on May 18, 2010) | |
| 10.25* | Form of Standard Restricted Stock Unit Agreement (filed as Exhibit 10.4 to Active Power's Current Report on Form 8-K filed on May 18, 2010) | |
| 10.26* | Second Amended and Restated Loan and Security Agreement with Silicon Valley Bank, dated as of August 5, 2010 (filed as Exhibit 10.1 to Active Power's Quarterly Report on Form 10-Q filed on October 27, 2010) | |
| 10.27* | Guarantee and Debenture Agreement with Silicon Valley Bank, dated as of August 5, 2010 (filed as Exhibit 10.2 to Active Power's Quarterly Report on Form 10-Q filed on October 27, 2010) | |
| 14.1* | Active Power, Inc. Code of Business Conduct and Ethics (filed as Exhibit 14.1 to Active Power's Current Report on Form 8-K filed on November 8, 2010) | |
|
Subsidiaries of the Registrant
|
|
Exhibit
Number
|
Description
|
|
|
Consent of Grant Thornton LLP
|
||
|
Consent of Ernst & Young LLP
|
||
|
24.1
|
Power of Attorney, pursuant to which amendments to this Form 10-K may be filed, is included on the signature page contained in Part IV of this Form 10-K
|
|
|
Certification of Principal Executive Officer as required by Section 302 of the Sarbanes-Oxley Act of 2002
|
||
|
Certification of Principal Financial Officer as required by Section 302 of the Sarbanes-Oxley Act of 2002
|
||
|
Certification of Principal Executive Officer as required by Section 906 of the Sarbanes-Oxley Act of 2002
|
||
|
Certification of Principal Financial Officer as required by Section 906 of the Sarbanes-Oxley Act of 2002
|
_______________________________
|
*
|
Incorporated by reference to the indicated filing.
|
|
+
|
Portions of this exhibit have been omitted pursuant to a confidential treatment previously granted.
|
|
†
|
Management contract or compensatory plan or arrangement.
|
SIGNATURES
Pursuant to the requirements of Section 13 or 15(d) of the Securities Exchange Act of 1934, the registrant has duly caused this report to be signed on its behalf by the undersigned, thereunto duly authorized.
|
ACTIVE POWER, INC.
|
||
|
Dated: March 1, 2011
|
By:
|
/s/ JAMES A. CLISHEM
|
|
James A. Clishem
|
||
|
Chief Executive Officer and Director
|
||
Power of Attorney
KNOW ALL PERSONS BY THESE PRESENTS, that each person whose signature appears below hereby severally constitutes and appoints, James A. Clishem and John K. Penver, and each or any of them, his true and lawful attorney-in-fact and agent, each with the power of substitution and resubstitution, for him in any and all capacities, to sign any and all amendments to this Annual Report on Form 10-K and to file the same, with exhibits thereto and other documents in connection therewith, with the Securities and Exchange Commission, hereby ratifying and confirming all that each said attorney-in-fact and agent, or his substitute or substitutes, may lawfully do or cause to be done by virtue hereof.
Pursuant to the requirements of the Securities Exchange Act of 1934, this report has been signed below by the following persons on behalf of the registrant and in the capacities and on the dates indicated.
|
Name
|
Title
|
Date
|
||
|
/s/ JAMES A. CLISHEM
|
Chief Executive Officer and Director
|
March 1, 2011
|
||
|
James A. Clishem
|
(principal executive officer)
|
|||
|
/s/ JOHN K. PENVER
|
Vice President—Finance, Chief Financial
|
March 1, 2011
|
||
|
John K. Penver
|
Officer and Secretary (principal financial and accounting officer)
|
|||
|
/s/ BENJAMIN L. SCOTT
|
Chairman of the Board, Director
|
March 1, 2011
|
||
|
Benjamin L. Scott
|
||||
|
/s/ AKE ALMGREN
|
Director
|
March 1, 2011
|
||
|
Ake Almgren
|
||||
|
/s/ RODNEY S. BOND
|
Director
|
March 1, 2011
|
||
|
Rodney S. Bond
|
||||
|
/s/ JAMES E. DEVENNY III
|
Director
|
March 1, 2011
|
||
|
James E. deVenny III
|
||||
|
/s/ ROBERT S. GREENBERG
|
Director
|
March 1, 2011
|
||
|
Robert S. Greenberg
|
||||
|
/s/ JAN H. LINDELOW
|
Director
|
March 1, 2011
|
||
|
Jan H. Lindelow
|
REPORT OF INDEPENDENT REGISTERED PUBLIC ACCOUNTING FIRM
Board of Directors and Shareholders
Active Power, Inc.
We have audited Active Power, Inc.’s (a Delaware corporation) internal control over financial reporting as of December 31, 2010, based on criteria established in Internal Control—Integrated Framework issued by the Committee of Sponsoring Organizations of the Treadway Commission (COSO). Active Power, Inc.’s management is responsible for maintaining effective internal control over financial reporting and for its assessment of the effectiveness of internal control over financial reporting, included in the accompanying Management’s Report on Internal Control over Financial Reporting. Our responsibility is to express an opinion on Active Power, Inc.'s internal control over financial reporting based on our audit.
We conducted our audit in accordance with the standards of the Public Company Accounting Oversight Board (United States). Those standards require that we plan and perform the audit to obtain reasonable assurance about whether effective internal control over financial reporting was maintained in all material respects. Our audit included obtaining an understanding of internal control over financial reporting, assessing the risk that a material weakness exists, testing and evaluating the design and operating effectiveness of internal control based on the assessed risk, and performing such other procedures as we considered necessary in the circumstances. We believe that our audit provides a reasonable basis for our opinion.
A company’s internal control over financial reporting is a process designed to provide reasonable assurance regarding the reliability of financial reporting and the preparation of financial statements for external purposes in accordance with generally accepted accounting principles. A company’s internal control over financial reporting includes those policies and procedures that (1) pertain to the maintenance of records that, in reasonable detail, accurately and fairly reflect the transactions and dispositions of the assets of the company; (2) provide reasonable assurance that transactions are recorded as necessary to permit preparation of financial statements in accordance with generally accepted accounting principles, and that receipts and expenditures of the company are being made only in accordance with authorizations of management and directors of the company; and (3) provide reasonable assurance regarding prevention or timely detection of unauthorized acquisition, use, or disposition of the company’s assets that could have a material effect on the financial statements.
Because of its inherent limitations, internal control over financial reporting may not prevent or detect misstatements. Also, projections of any evaluation of effectiveness to future periods are subject to the risk that controls may become inadequate because of changes in conditions, or that the degree of compliance with the policies or procedures may deteriorate.
In our opinion, Active Power, Inc. maintained, in all material respects, effective internal control over financial reporting as of December 31, 2010, based on criteria established in Internal Control-Integrated Framework issued by COSO.
We also have audited, in accordance with the standards of the Public Company Accounting Oversight Board (United States), the consolidated balance sheet of Active Power, Inc. as of December 31, 2010, and the related consolidated statements of operations and comprehensive loss, stockholders’ equity, and cash flows for the year then ended and our report dated March 1, 2011 expressed an unqualified opinion.
|
/s/ Grant Thornton LLP
|
Dallas, Texas
March 1, 2011
REPORT OF INDEPENDENT REGISTERED PUBLIC ACCOUNTING FIRM
Board of Directors and Shareholders
Active Power, Inc.
We have audited the accompanying consolidated balance sheet of Active Power, Inc. (a Delaware corporation) as of December 31, 2010, and the related consolidated statements of operations and comprehensive loss, stockholders’ equity, and cash flows for the year then ended. These financial statements are the responsibility of the Company’s management. Our responsibility is to express an opinion on these financial statements based on our audit.
We conducted our audit in accordance with the standards of the Public Company Accounting Oversight Board (United States). Those standards require that we plan and perform the audit to obtain reasonable assurance about whether the financial statements are free of material misstatement. An audit includes examining, on a test basis, evidence supporting the amounts and disclosures in the financial statements. An audit also includes assessing the accounting principles used and significant estimates made by management, as well as evaluating the overall financial statement presentation. We believe that our audit provides a reasonable basis for our opinion.
In our opinion, the consolidated financial statements referred to above present fairly, in all material respects, the financial position of Active Power, Inc. as of December 31, 2010, and the results of their operations and their cash flows for the year then ended, in conformity with accounting principles generally accepted in the United States of America.
We also have audited, in accordance with the standards of the Public Company Accounting Oversight Board (United States), Active Power, Inc.’s internal control over financial reporting as of December 31, 2010, based on criteria established in Internal Control—Integrated Framework issued by the Committee of Sponsoring Organizations of the Treadway Commission (COSO) and our report dated March 1, 2011 expressed an unqualified opinion.
|
/s/ Grant Thornton LLP
|
Dallas, Texas
March 1, 2011
REPORT OF INDEPENDENT REGISTERED PUBLIC ACCOUNTING FIRM
The Board of Directors and Shareholders of
Active Power, Inc.
We have audited the accompanying consolidated balance sheets of Active Power, Inc. (the Company) as of December 31, 2009 , and the related consolidated statement of operations and comprehensive loss, stockholders’ equity and cash flows for each of the two years in the period ended December 31, 2009. These financial statements are the responsibility of the Company’s management. Our responsibility is to express an opinion on these consolidated financial statements based on our audits.
We conducted our audits in accordance with the standards of the Public Company Accounting Oversight Board (United States). Those standards require that we plan and perform the audit to obtain reasonable assurance about whether the financial statements are free of material misstatement. An audit includes examining, on a test basis, evidence supporting the amounts and disclosures in the financial statements. An audit also includes assessing the accounting principles used and significant estimates made by management, as well as evaluating the overall financial statement presentation. We believe that our audits provide a reasonable basis for our opinion.
In our opinion, the consolidated financial statements referred to above present fairly, in all material respects, the consolidated financial position of Active Power, Inc. at December 31, 2009 and the consolidated results of its operations and its cash flows for each of the two years in the period ended December 31, 2009, in conformity with U.S. generally accepted accounting principles.
|
/s/ Ernst & Young LLP
|
Austin, Texas
March 4, 2010
ACTIVE POWER, INC.
CONSOLIDATED BALANCE SHEETS
(In thousands)
|
December 31,
|
||||||||
|
2010
|
2009
|
|||||||
|
ASSETS
|
||||||||
|
Current assets:
|
||||||||
|
Cash and cash equivalents
|
$ | 15,416 | $ | 7,489 | ||||
|
Short-term investments in marketable securities
|
134 | — | ||||||
|
Accounts receivable, net of allowance for doubtful accounts of $330 and $353 at December 31, 2010 and 2009, respectively
|
14,708 | 11,529 | ||||||
|
Inventories
|
6,430 | 6,629 | ||||||
|
Prepaid expenses and other
|
511 | 418 | ||||||
|
Total current assets
|
37,199 | 26,065 | ||||||
|
Property and equipment, net
|
2,005 | 2,903 | ||||||
|
Deposits and other
|
314 | 376 | ||||||
|
Total assets
|
$ | 39,518 | $ | 29,344 | ||||
|
LIABILITIES AND STOCKHOLDERS’ EQUITY
|
||||||||
|
Current liabilities:
|
||||||||
|
Accounts payable
|
$ | 6,022 | $ | 5,155 | ||||
|
Accrued expenses
|
7,068 | 4,957 | ||||||
|
Deferred revenue
|
2,492 | 1,713 | ||||||
|
Revolving line of credit
|
2,535 | 2,559 | ||||||
|
Total current liabilities
|
18,117 | 14,384 | ||||||
|
Long term liabilities
|
579 | 468 | ||||||
|
Stockholders’ equity:
|
||||||||
|
Preferred Stock
|
— | — | ||||||
|
Common Stock—$0.001 par value; 150,000 shares authorized; 79,860 and 66,502 shares issued and 79,736 and 66,410 shares outstanding in 2010 and 2009, respectively
|
80 | 66 | ||||||
|
Treasury stock, at cost; 124 and 92 shares in 2010 and 2009, respectively
|
(103 | ) | (73 | ) | ||||
|
Additional paid-in capital
|
274,807 | 264,554 | ||||||
|
Accumulated deficit
|
(253,801 | ) | (249,876 | ) | ||||
|
Other accumulated comprehensive loss
|
(161 | ) | (179 | ) | ||||
|
Total stockholders’ equity
|
20,822 | 14,492 | ||||||
|
Total liabilities and stockholders’ equity
|
$ | 39,518 | $ | 29,344 | ||||
See accompanying notes.
ACTIVE POWER, INC.
CONSOLIDATED STATEMENTS OF OPERATIONS
AND COMPREHENSIVE LOSS
(In thousands, except per share amounts)
|
Year ended December 31,
|
||||||||||||
|
2010
|
2009
|
2008
|
||||||||||
|
Revenues:
|
||||||||||||
|
Product revenue
|
$ | 55,647 | $ | 32,837 | $ | 35,772 | ||||||
|
Service and other revenue
|
9,308 | 7,474 | 7,213 | |||||||||
|
Total revenue
|
64,955 | 40,311 | 42,985 | |||||||||
|
Cost of goods sold:
|
||||||||||||
|
Cost of product revenue
|
40,045 | 25,827 | 29,380 | |||||||||
|
Cost of service and other revenue
|
6,890 | 5,254 | 5,617 | |||||||||
|
Total cost of goods sold
|
46,935 | 31,081 | 34,997 | |||||||||
|
Gross profit
|
18,020 | 9,230 | 7,988 | |||||||||
|
Operating expenses:
|
||||||||||||
|
Research and development
|
3,412 | 4,170 | 5,116 | |||||||||
|
Selling and marketing
|
13,093 | 11,431 | 11,839 | |||||||||
|
General and administrative
|
5,319 | 4,592 | 5,119 | |||||||||
|
Total operating expenses
|
21,824 | 20,193 | 22,074 | |||||||||
|
Operating loss
|
(3,804 | ) | (10,963 | ) | (14,086 | ) | ||||||
|
Interest income (expense), net
|
(122 | ) | (69 | ) | 348 | |||||||
|
Other income (expense), net
|
(40 | ) | (45 | ) | 296 | |||||||
|
Loss before income taxes
|
(3,966 | ) | (11,077 | ) | (13,442 | ) | ||||||
|
Income tax benefit
|
41 | 44 | — | |||||||||
|
Net loss
|
$ | (3,925 | ) | $ | (11,033 | ) | $ | (13,442 | ) | |||
|
Net loss per share, basic & diluted
|
$ | (0.05 | ) | $ | (0.17 | ) | $ | (0.22 | ) | |||
|
Shares used in computing net loss per share, basic & diluted
|
77,677 | 63,854 | 60,124 | |||||||||
|
Comprehensive loss:
|
||||||||||||
|
Net loss
|
$ | (3,925 | ) | $ | (11,033 | ) | $ | (13,442 | ) | |||
|
Translation gain (loss) on subsidiaries in foreign currencies
|
18 | 502 | (640 | ) | ||||||||
|
Change in unrealized gain (loss) on investments in marketable securities
|
— | — | (5 | ) | ||||||||
|
Comprehensive loss
|
$ | (3,907 | ) | $ | (10,531 | ) | $ | (14,087 | ) | |||
See accompanying notes.
ACTIVE POWER, INC.
CONSOLIDATED STATEMENTS OF STOCKHOLDERS’ EQUITY
(In thousands)
|
Common Stock
|
Treasury Stock
|
|||||||||||||||||||||||||||||||
|
Number
of Shares
|
Par
Value
|
Number
of Shares
|
At
Cost
|
Additional
Paid-In
Capital
|
Accumulated
Deficit
|
Other
Accumulated
Comprehensive
Loss
|
Total
Stockholders’
Equity
|
|||||||||||||||||||||||||
|
Balance at December 31, 2007
|
60,395 | $ | 60 | 36 | $ | (5 | ) | $ | 258,630 | $ | (225,401 | ) | $ | (36 | ) | $ | 33,248 | |||||||||||||||
|
Employee stock purchases
|
15 | — | — | — | 18 | — | — | 18 | ||||||||||||||||||||||||
|
Shares held in treasury
|
72 | — | 25 | (54 | ) | — | — | (54 | ) | |||||||||||||||||||||||
|
Change in unrealized loss on investments
|
— | — | — | — | — | — | (5 | ) | (5 | ) | ||||||||||||||||||||||
|
Net translation loss on foreign subsidiaries
|
— | — | — | — | — | — | (640 | ) | (640 | ) | ||||||||||||||||||||||
|
Stock-based compensation
|
— | — | — | — | 1,696 | — | — | 1,696 | ||||||||||||||||||||||||
|
Net loss
|
— | — | — | — | — | (13,442 | ) | — | (13,442 | ) | ||||||||||||||||||||||
|
Balance at December 31, 2008
|
60,482 | $ | 60 | 61 | $ | (59 | ) | $ | 260,344 | $ | (238,843 | ) | $ | (681 | ) | $ | 20,821 | |||||||||||||||
|
Employee stock purchases
|
20 | — | — | — | 11 | — | — | 11 | ||||||||||||||||||||||||
|
Sale of common stock, less $67 in issuance costs
|
6,000 | 6 | 2,927 | 2,933 | ||||||||||||||||||||||||||||
|
Shares held in treasury
|
— | — | 31 | (14 | ) | — | — | (14 | ) | |||||||||||||||||||||||
|
Net translation gain on foreign subsidiaries
|
— | — | — | — | — | — | 502 | 502 | ||||||||||||||||||||||||
|
Stock-based compensation
|
— | — | — | — | 1,272 | — | — | 1,272 | ||||||||||||||||||||||||
|
Net loss
|
— | — | — | — | — | (11,033 | ) | — | (11,033 | ) | ||||||||||||||||||||||
|
Balance at December 31, 2009
|
66,502 | $ | 66 | 92 | $ | (73 | ) | $ | 264,554 | $ | (249,876 | ) | $ | (179 | ) | $ | 14,492 | |||||||||||||||
|
Employee stock purchases
|
128 | 1 | — | — | 101 | — | — | 102 | ||||||||||||||||||||||||
|
Sale of common stock, less $886 in issuance costs
|
13,230 | 13 | 9,023 | 9,036 | ||||||||||||||||||||||||||||
|
Shares held in treasury
|
— | — | 32 | (30 | ) | — | — | (30 | ) | |||||||||||||||||||||||
|
Net translation gain on foreign subsidiaries
|
— | — | — | — | — | — | 18 | 18 | ||||||||||||||||||||||||
|
Stock-based compensation
|
— | — | — | — | 1,129 | — | — | 1,129 | ||||||||||||||||||||||||
|
Net loss
|
— | — | — | — | — | (3,925 | ) | — | (3,925 | ) | ||||||||||||||||||||||
|
Balance at December 31, 2010
|
79,860 | $ | 80 | 124 | $ | (103 | ) | $ | 274,807 | $ | (253,801 | ) | $ | (161 | ) | $ | 20,822 | |||||||||||||||
ACTIVE POWER, INC.
CONSOLIDATED STATEMENTS OF CASH FLOWS
(In thousands)
|
Year ended December 31,
|
||||||||||||
|
2010
|
2009
|
2008
|
||||||||||
|
Operating activities
|
||||||||||||
|
Net loss
|
$ | (3,925 | ) | $ | (11,033 | ) | $ | (13,442 | ) | |||
|
Adjustments to reconcile net loss to cash used in operating activities:
|
||||||||||||
|
Depreciation expense
|
1,887 | 1,950 | 1,895 | |||||||||
|
Charge to allowance for doubtful accounts
|
35 | 91 | 272 | |||||||||
|
Accretion of premium / discount on investments
|
— | 2 | (41 | ) | ||||||||
|
Loss on disposal of fixed assets
|
120 | 395 | (61 | ) | ||||||||
|
Impairment of inventory and related assets
|
— | — | 1,554 | |||||||||
|
Stock-based compensation
|
1,131 | 1,272 | 1,696 | |||||||||
|
Changes in operating assets and liabilities:
|
||||||||||||
|
Accounts receivable
|
(3,214 | ) | (2,171 | ) | (4,544 | ) | ||||||
|
Inventories
|
197 | 60 | 1,009 | |||||||||
|
Prepaid expenses and other assets
|
(31 | ) | 75 | 60 | ||||||||
|
Accounts payable
|
867 | 2,741 | 72 | |||||||||
|
Accrued expenses
|
2,111 | (468 | ) | (83 | ) | |||||||
|
Deferred revenue
|
779 | 223 | (134 | ) | ||||||||
|
Long term liabilities
|
111 | (53 | ) | (83 | ) | |||||||
|
Net cash provided by (used in) operating activities
|
68 | (6,916 | ) | (11,830 | ) | |||||||
|
Investing activities
|
||||||||||||
|
Purchases of marketable securities
|
(134 | ) | — | (2,631 | ) | |||||||
|
Sales/maturities of marketable securities
|
— | 701 | 8,951 | |||||||||
|
Purchases of property and equipment
|
(1,109 | ) | (755 | ) | (948 | ) | ||||||
|
Sales of property and equipment
|
— | — | 105 | |||||||||
|
Net cash (used in) provided by investing activities
|
(1,243 | ) | (54 | ) | 5,477 | |||||||
|
Financing activities
|
||||||||||||
|
Proceeds from private placement of common stock
|
9,922 | 3,000 | — | |||||||||
|
Issuance costs of private placement
|
(886 | ) | (67 | ) | — | |||||||
|
Proceeds from employee stock purchases
|
102 | 11 | 18 | |||||||||
|
Purchases of treasury stock
|
(30 | ) | (14 | ) | (54 | ) | ||||||
|
Proceeds from draw on revolving line of credit
|
1,008 | 559 | 2,000 | |||||||||
|
Payments on revolving line of credit
|
(1,032 | ) | — | — | ||||||||
|
Net cash provided by financing activities
|
9,084 | 3,489 | 1,964 | |||||||||
|
Translation gain (loss) on subsidiaries in foreign currencies
|
18 | 502 | (647 | ) | ||||||||
|
Total change in cash and cash equivalents
|
7,927 | (2,979 | ) | (5,036 | ) | |||||||
|
Cash and cash equivalents, beginning of period
|
7,489 | 10,468 | 15,504 | |||||||||
|
Cash and cash equivalents, end of period
|
$ | 15,416 | $ | 7,489 | $ | 10,468 | ||||||
|
Supplemental Cash Flow Information:
|
||||||||||||
|
Interest paid
|
$ | 145 | $ | 104 | $ | 9 | ||||||
|
Income tax paid
|
$ | — | $ | — | $ | — | ||||||
See accompanying notes.
ACTIVE POWER, INC.
NOTES TO CONSOLIDATED FINANCIAL STATEMENTS
December 31, 2010
(in thousands, except share and per share amounts)
1. Summary of Significant Accounting Policies
Description of Business
Active Power, Inc. and its subsidiaries (hereinafter referred to as “we”, “us”, “Active Power” or the “Company”) manufacture and provide critical power quality solutions that provide business continuity and protect customers in the event of an electrical power disturbance. Our products are designed to deliver continuous clean power, protecting customers from voltage fluctuations, such as surges and sags and frequency fluctuations, and also to provide ride-through, or temporary, power to bridge the gap between a power outage and the restoration of utility power. Our target customers are those global enterprises requiring “power insurance” because they have zero tolerance for downtime in their mission critical operations. The Uninterruptible Power Supply (“UPS”) products we manufacture use kinetic energy to provide short-term power as a cleaner alternative to electro-chemical battery-based energy. We sell stand alone UPS products as well as complete continuous power and infrastructure solutions, including containerized continuous power systems that we brand as PowerHouse. We sell our products globally through direct, manufacturer’s representatives, Original Equipment Manufacturer (“OEM”) channels and IT partners. Our current principal markets are Europe, Middle East and Africa (“EMEA”), Asia and North America.
We were founded as a Texas Corporation in 1992 and reincorporated in Delaware in 2000 prior to our initial public offering. Our headquarters are in Austin, Texas with international offices in the UK, Germany, China and Japan.
The accompanying consolidated financial statements have been prepared in accordance with U.S. generally accepted accounting principles and include the accounts of the Company and its consolidated subsidiaries. All significant intercompany transactions and balances have been eliminated upon consolidation.
Use of Estimates
The preparation of financial statements in conformity with U.S. generally accepted accounting principles requires management to make estimates and assumptions that affect the amounts reported in the financial statements and accompanying notes. Actual results could differ from those estimates. Changes in the estimates or assumptions used by management could have a material impact upon reported amounts and our results of operations.
Revenue Recognition
In general, we recognize revenue when four criteria are met: (i) persuasive evidence that an arrangement exists; (ii) delivery has occurred or services have been rendered; (iii) the sales price is fixed or determinable; and (iv) collectability is reasonably assured. In general, revenue is recognized when revenue-generating transactions generally fall into one of the following categories of revenue recognition:
|
|
•
|
We recognize product revenue at the time of shipment for substantially all products sold directly to customers and through distributors because title and risk of loss pass on delivery to the common carrier. Our customers and distributors do not have the right to return products. If title and risk of loss pass at some other point in time, we recognize such revenue for our customers when the product is delivered to the customer and title and risk of loss has passed.
|
|
|
•
|
We recognize installation and service and maintenance revenue at the time the service is performed.
|
|
|
•
|
We recognize revenue associated with extended maintenance agreements (“EMAs”) over the life of the contracts using the straight-line method, which approximates the expected timing in which applicable services are performed. Amounts collected in advance of revenue recognition are recorded as a current or long-term liability based on the time from the balance sheet date to the future date of revenue recognition.
|
|
|
•
|
We recognize revenue on certain rental programs over the life of the rental agreement using the straight-line method. Amounts collected in advance of revenue recognition are recorded as a current or long-term liability based on the time from the balance sheet date to the future date of revenue recognition.
|
|
|
•
|
Shipping costs reimbursed by the customer are included in revenue.
|
Multiple element arrangements (“MEAs”). Arrangements to sell products to customers frequently include multiple deliverables. Our most significant MEAs include the sale of one or more of our CleanSource UPS or PowerHouse products, combined with one or more of the following products: design services, project management, commissioning and installation services, spare parts or consumables, and EMA’s. Delivery of the various products or performance of services within the arrangement may or may not coincide. Certain services related to design and consulting may occur prior to delivery of product and commissioning and installation typically take place within six months of product delivery, depending upon customer requirements. EMAs, consumables, and repair, maintenance or consulting services generally are delivered over a period of one to five years. In certain arrangements revenue recognized is limited to the amount invoiced or received that is not contingent on the delivery of future products and services.
When arrangements include multiple elements, we allocate revenue to each element based on the relative selling price and recognize revenue when the elements have standalone value and the four criteria for revenue recognition have been met for each element. We establish the selling price of each element based on Vendor Specific Objective Evidence (“VSOE”) if available, Third Party Evidence (“TPE”) if VSOE is not available, or best estimate of selling price (“BESP”) if neither VSOE nor TPE is available. We generally determine selling price based on amounts charged separately for the delivered and undelivered elements to similar customers in standalone sales of the specific elements. When arrangements include an EMA, we recognize revenue related to the EMA at the stated contractual price on a straight-line basis over the life of the agreement.
Any taxes imposed by governmental authorities on our revenue-producing transactions with customers are shown in our consolidated statements of operations on a net-basis; that is excluded from our reported revenues.
Shipping and Handling Costs
We classify shipping and handling costs related to product sales as cost of revenue, and any payments from customers for shipping and handling are categorized in revenue. We classify shipping and handling costs associated with receiving production inventory as cost of product revenue. Any materials received or shipped which are related to our engineering, sales, marketing and administrative functions are classified as operating expenses.
Cash Equivalents
Investments with a contractual maturity of three months or less when purchased are classified as cash equivalents.
Investments in Marketable Securities
Investments in marketable securities consist of money-market funds, commercial paper and debt securities with readily determinable fair values. Active Power accounts for investments that are reasonably expected to be realized in cash, sold or consumed during the year as short-term investments. We classify investments in marketable securities as available-for-sale and all reclassifications made from unrealized gains/losses to realized gains/losses are determined based on the specific identification method. The carrying amount of investments in marketable securities approximated fair value at December 31, 2010 and we had no such investments at December 31, 2009.
In accordance with our investment policy and guidelines, our short-term investments are diversified among and limited to high quality securities with a minimum of investment grade ratings. We actively monitor our investment portfolio to ensure compliance with our investment objective to preserve capital, meet liquidity requirements and maximize return on our investments. We do not require collateral or enter into master netting arrangements to mitigate our credit risk.
The carrying value of our investments in marketable securities consists of the following at December 31, 2010
|
Amortized
Cost
|
Gross
Unrealized
Gains
|
Gross
Unrealized
Losses
|
Estimated
Fair Value
(Net
Carrying
Amount)
|
|||||||||||||
|
Money–market funds
|
$ | 134 | $ | — | $ | — | $ | 134 | ||||||||
| $ | 134 | $ | — | $ | — | 134 | ||||||||||
|
Less: Short-term investments in marketable securities
|
134 | |||||||||||||||
|
Long-term investments in marketable securities
|
$ | — | ||||||||||||||
The fair value by contractual maturity of our marketable securities at December 31, 2010 is shown below:
|
Within one year
|
$ | 134 | ||
| $ | 134 |
Effective October 1, 2008, we adopted an accounting standard, which defines fair value, establishes a framework for measuring fair value as well as expands on required disclosures regarding fair value measurements. This standard applies to reported balances that are required or permitted to be measured at fair value under existing accounting pronouncements; accordingly, the standard does not require any new fair value measurements of reported balances.
Level 1—uses quoted prices in active markets for identical assets or liabilities we have the ability to access.
Level 2—uses observable inputs other than quoted prices in Level 1, such as quoted prices for similar assets and liabilities in active markets; quoted prices for identical or similar assets and liabilities in markets that are not active; or other inputs that are observable or can be corroborated by observable market data.
Level 3—uses one or more significant inputs that are unobservable and supported by little or no market activity, and that reflect the use of significant management judgment
Inputs are referred to as assumptions that market participants would use in pricing the asset or liability. The uses of inputs in the valuation process are categorized into a three-level fair value hierarchy.
Our Level 1 assets and liabilities consist of cash equivalents, which are primarily invested in money market funds. These assets are classified as Level 1 because they are valued using quoted prices and other relevant information generated by market transactions involving identical assets and liabilities.
The fair value of our cash equivalents, are primarily invested in money market funds, was determined using the following inputs as of December 31, (in thousands):
|
2010
|
||||||||||||||||
|
Fair Value Measurements at Reporting Date Using
|
||||||||||||||||
|
Level 1
|
Level 2
|
Level 3
|
Total
|
|||||||||||||
|
Money-market funds
|
$ | 3,227 | $ | — | $ | — | $ | 3,227 | ||||||||
|
Total
|
$ | 3,227 | $ | — | $ | — | $ | 3,227 | ||||||||
|
Amounts included in:
|
||||||||||||||||
|
Cash and cash equivalents
|
$ | 3,093 | $ | — | $ | — | $ | 3,093 | ||||||||
|
Short-term investments
|
134 | — | — | 134 | ||||||||||||
|
Total
|
$ | 3,227 | $ | — | $ | — | $ | 3,227 | ||||||||
|
2009
|
||||||||||||||||
|
Fair Value Measurements at Reporting Date Using
|
||||||||||||||||
|
Level 1
|
Level 2
|
Level 3
|
Total
|
|||||||||||||
|
Money-market funds
|
$ | 3,094 | $ | — | $ | — | $ | 3,094 | ||||||||
|
Total
|
$ | 3,094 | $ | — | $ | — | $ | 3,094 | ||||||||
|
Amounts included in:
|
||||||||||||||||
|
Cash and cash equivalents
|
$ | 3,094 | $ | — | $ | — | $ | 3,094 | ||||||||
|
Short-term investments
|
— | — | — | — | ||||||||||||
|
Total
|
$ | 3,094 | $ | — | $ | — | $ | 3,094 | ||||||||
For cash and cash equivalents, marketable securities, accounts receivable, and accounts payable, the carrying amount approximates fair value because of the relative short maturity of those instruments
Allowance for Doubtful Accounts
We estimate an allowance for doubtful accounts based on factors related to the credit risk of each customer. Historically, credit losses were minimal, primarily because the majority of our revenues were generated from large OEM customers, primarily Caterpillar, Inc. (“Caterpillar”). As we began integrating additional distribution channels into our business and selling more of our products directly to customers, our risk of credit losses has increased. We perform credit evaluations of new customers and often require deposits, prepayments or use of bank instruments such as trade letters of credit or documentary collection to mitigate our credit risk. Allowance for doubtful account balances are $330 and $353 as of December 31, 2010 and 2009, respectively. Although we have fully provided for these balances, we continue to pursue collection of these receivables.
The following table summarizes the annual changes in our allowance for doubtful accounts:
|
Balance at December 31, 2007
|
$ | 406 | ||
|
Additions charged to expense
|
272 | |||
|
Recovery of amount previously reserved
|
(221 | ) | ||
|
Write-off of uncollectible accounts
|
(44 | ) | ||
|
Balance at December 31, 2008
|
$ | 413 | ||
|
Additions charged to expense
|
91 | |||
|
Write-off of uncollectible accounts
|
(151 | ) | ||
|
Balance at December 31, 2009
|
$ | 353 | ||
|
Additions charged to expense
|
35 | |||
|
Recovery of amount previously reserved
|
(39 | ) | ||
|
Write-off of uncollectible accounts
|
(19 | ) | ||
|
Balance at December 31, 2010
|
$ | 330 |
During 2008 we recovered equipment from customers that had not previously paid us for the equipment. At those times we reversed the outstanding receivables of $221 and the related allowance for doubtful accounts.
Inventories
Inventories are stated at the lower of cost or market, using the first-in-first-out method, and consist of the following at December 31:
|
2010
|
2009
|
|||||||
|
Raw materials
|
$ | 5,243 | $ | 5,238 | ||||
|
Work in process
|
2,382 | 1,253 | ||||||
|
Finished goods
|
1,148 | 2,448 | ||||||
|
Less inventory reserves
|
(2,343 | ) | (2,310 | ) | ||||
| $ | 6,430 | $ | 6,629 | |||||
Property and Equipment
Property and equipment is stated at cost and is depreciated using the straight-line method over the estimated useful lives of the assets, as follows (in years):
|
Equipment
|
2 – 10 | |||
|
Demonstration units
|
3 – 5 | |||
|
Computers and purchased software
|
2 – 3 | |||
|
Furniture and fixtures
|
2 – 5 |
Leasehold improvements are depreciated over the shorter of the life of the improvement or the remainder of the property lease term, including renewal options. Repairs and maintenance is expensed as incurred.
Long-Lived Assets
Long-lived assets held and used by the Company are reviewed for impairment whenever events or changes in circumstances indicate that their net book value may not be recoverable. When such factors and circumstances exist, we compare the projected undiscounted future cash flows associated with the related asset or group of assets over their estimated useful lives against their respective carrying amounts. Impairment, if any, is based on the excess of the carrying amount over the fair value of those assets and is recorded in the period in which the determination was made.
Patent Application Costs
We have not capitalized patent application fees and related costs because of uncertainties regarding net realizable value of the technology represented by the existing patent applications and ultimate recoverability. All patent costs have been expensed through December 31, 2010.
Accrued Expenses
Accrued expenses consist of the following at December 31:
|
2010
|
2009
|
|||||||
|
Compensation and benefits
|
$ | 3,985 | $ | 1,549 | ||||
|
Warranty liability
|
677 | 620 | ||||||
|
Property, income, state, sales and franchise tax
|
1,193 | 1,427 | ||||||
|
Professional fees
|
360 | 495 | ||||||
|
Other
|
853 | 866 | ||||||
| $ | 7,068 | $ | 4,957 | |||||
Warranty Liability
Generally, the warranty period for our power quality products is 12 months from the date of commissioning or 18 months from the date of shipment from Active Power, whichever period is shorter. Occasionally we offer longer warranty periods to certain customers. The warranty period for products sold to our OEM customer, Caterpillar, is 12 months from the date of shipment to the end-user, or up to 36 months from shipment. This is dependent upon Caterpillar complying with our storage requirements for our products in order to preserve this warranty period beyond the standard 18-month limit. We provide for the estimated cost of product warranties at the time revenue is recognized and this accrual is included in accrued expenses and long term liabilities on the accompanying consolidated balance sheet.
Changes in the Company’s warranty liability are as follows:
|
Balance at December 31, 2007
|
$ | 819 | ||
|
Warranty expense
|
702 | |||
|
Warranty charges incurred
|
(573 | ) | ||
|
Balance at December 31, 2008
|
$ | 948 | ||
|
Warranty expense
|
459 | |||
|
Warranty charges incurred
|
(744 | ) | ||
|
Balance at December 31, 2009
|
$ | 663 | ||
|
Warranty expense
|
830 | |||
|
Warranty charges incurred
|
(759 | ) | ||
|
Balance at December 31, 2010
|
$ | 734 | ||
|
Warrant liability included in accrued expenses
|
$ | 677 | ||
|
Long term warranty liability
|
57 | |||
|
Balance at December 31, 2010
|
$ | 734 |
Long-Term Liabilities
Long term liabilities consist of the following at December 31:
|
2010
|
2009
|
|||||||
|
Deferred revenue
|
$ | 347 | $ | 225 | ||||
|
Technology licensing agreement
|
150 | 175 | ||||||
|
Warranty liability
|
57 | 43 | ||||||
|
Sublease deposits
|
25 | 25 | ||||||
| $ | 579 | $ | 468 | |||||
Stock-Based Compensation Expense
Total stock-based compensation expense relating to our stock plans in the twelve-month period ended December 31, 2010, 2009 and 2008 was $1.1 million and $1.3 million and $1.7 million, respectively, and included the following:
|
Year Ended December 31,
|
||||||||||||
|
2010
|
2009
|
2008
|
||||||||||
|
Stock-based compensation expense by caption:
|
||||||||||||
|
Cost of product revenue
|
$ | 146 | $ | 169 | $ | 275 | ||||||
|
Cost of service and other revenue
|
43 | 46 | 36 | |||||||||
|
Research and development
|
80 | 171 | 384 | |||||||||
|
Selling and marketing
|
304 | 313 | 343 | |||||||||
|
General and administrative
|
558 | 573 | 663 | |||||||||
| $ | 1,131 | $ | 1,272 | $ | 1,701 | |||||||
|
Stock-based compensation expense by type of award:
|
||||||||||||
|
Stock options
|
$ | 1,147 | $ | 1,104 | $ | 1,523 | ||||||
|
Restricted stock awards
|
(16 | ) | 168 | 178 | ||||||||
| $ | 1,131 | $ | 1,272 | $ | 1,701 | |||||||
Stock-based compensation expense of $1 and $5 was capitalized and remained in inventory at December 31, 2010 and 2009, respectively.
We account for our stock-based compensation using a fair-value based recognition method. Stock-based compensation cost is estimated at the grant date based on the fair-value of the award and is recognized as expense ratably over the requisite service period of the award. Determining the appropriate fair-value model and calculating the fair value of stock-based awards at the grant date requires considerable judgment, including estimating stock price volatility, expected option life and forfeiture rates. We develop our estimates based on historical data and market information that can change significantly over time. A small change in the estimates used can have a relatively large change in the estimated valuation.
We use the Black-Scholes option valuation model to value employee stock awards. We estimate stock price volatility based upon our historical volatility. Estimated option life and forfeiture rate assumptions are derived from historical data. For stock-based compensation awards with graded vesting, we recognize compensation expense using the straight-line amortization method.
Income Taxes
We account for income taxes using the liability method of accounting for income taxes. Under the liability method, deferred taxes are determined based on the differences between the financial statement and tax basis of assets and liabilities using enacted tax rates in effect in the years in which the differences are expected to reverse. A valuation allowance is recorded to reduce the carrying amounts of deferred tax assets if it is more likely than not that such assets will not be realized.
As a result of our adoption of an accounting standard in January 2007, we recognize and measure benefits for uncertain tax positions which requires significant judgment from management. We evaluate our uncertain tax positions on a quarterly basis and base these evaluations upon a number of factors, including changes in facts or circumstances, changes in tax law, correspondence with tax authorities during the course of audits and effective settlement of audit issues. Changes in the recognition or measurement of uncertain tax positions could result in material increases or decreases in our income tax expense in the period in which we make the change, which could have a material impact on our effective tax rate and operating results. At December 31, 2010 and 2009, the Company had no material unrecognized tax benefits.
Segment Reporting
Active Power’s chief operating decision maker allocates resources and assesses the performance of its power management product development and sales activities as one segment.
Fair Value of Financial Instruments
Our financial instruments consist principally of cash and cash equivalents, investments, accounts receivable, accounts payable and our revolving line of credit. We believe all of these financial instruments are recorded at amounts that approximate their current market values.
Concentration of Credit Risk
Financial instruments which potentially subject Active Power to concentrations of credit risk consist of cash and cash equivalents, investments and accounts receivable. Active Power’s cash and cash equivalents and investments are placed with high credit quality financial institutions and issuers. On November 19, 2010, the FDIC issued a Final Rule implementing section 343 of the Dodd-Frank Wall Street Reform and Consumer Protection Act that provides for unlimited insurance coverage of noninterest-bearing transaction accounts beginning December 31, 2010 through December 31, 2012. Active Power performs limited credit evaluations of its customers’ financial condition prior to entering into commercial transactions. We generally require letters of credit or prepayments from higher-risk customers as deemed necessary to ensure collection. Our allowance for doubtful accounts is estimated based on factors related to the credit risk of each customer. Individual receivables are written off after they have been deemed uncollectible. We also purchase several components from sole source or limited source suppliers.
Economic Dependence
We are significantly dependent on our relationships with Hewlett Packard Corporation (“Hewlett Packard”) and Caterpillar, Inc. (“Caterpillar”). If these relationships are unsuccessful or discontinue, our business and revenue may suffer. The loss of or a significant reduction in orders from Hewlett Packard or Caterpillar, or the failure to provide adequate service and support to the end-users of our products by Hewlett Packard or Caterpillar, could significantly reduce our revenue. Our operating results in the foreseeable future will continue to depend on the sales made by a relatively small number of customers, including Hewlett Packard and Caterpillar.
The following customers accounted for a significant percentage of Active Power’s total revenue during each of the years ended December 31:
|
2010
|
2009
|
2008
|
||||||||||
|
Caterpillar
|
19 | % | 24 | % | 40 | % | ||||||
|
Hewlett Packard
|
25 | % | 12 | % | - | % | ||||||
|
United States based IT Customer
|
16 | % | 8 | % | 11 | % | ||||||
|
European based IT Customer
|
— | % | — | % | 11 | % | ||||||
No other customer represented more than 10% of our revenues in any of the years reported. Hewlett Packard represented 34% and 23% of our outstanding receivables at December 31, 2010 and 2009, respectively. Caterpillar represented 14%, and 6% of our outstanding accounts receivable at December 31, 2010 and 2009, respectively. One other US based IT customer accounted for 19% and 26% of our outstanding accounts receivable at December 31, 2010 and 2009, respectively. No other customer represented more than 10% of our accounts receivable at December 31, 2010 and 2009.
Advertising Costs
We expense advertising costs as incurred. These expenses were approximately $8, $33 and $69 in 2010, 2009 and 2008, respectively.
Net Loss Per Share
The following table sets forth the computation of basic and diluted net loss per share for the years ended December 31:
|
2010
|
2009
|
2008
|
||||||||||
|
Net loss
|
$ | (3,925 | ) | $ | (11,033 | ) | $ | (13,442 | ) | |||
|
Basic and diluted:
|
||||||||||||
|
Weighted-average shares of common stock outstanding used in computing basic and diluted net loss per share
|
77,677 | 63,854 | 60,124 | |||||||||
|
Basic and diluted net loss per share
|
$ | (0.05 | ) | $ | (0.17 | ) | $ | (0.22 | ) | |||
The calculation of diluted loss per share excludes 9,389,987, 5,639,442 and 5,703,721 shares of common stock issuable upon exercise of employee stock options as of December 31, 2010, 2009 and 2008, respectively, and 19,001, 116,345 and 223,677 non-vested shares of common stock issuable upon exercise of restricted stock awards as of December 31, 2010, 2009 and 2008, respectively, because their inclusion in the calculation would be anti-dilutive.
Recent Accounting Pronouncements
On January 1, 2010, we adopted amendments to authoritative literature that modifies the revenue recognition guidance for establishing separate units of accounting in a multiple element arrangement and requires the allocation of arrangement consideration to each deliverable in the arrangement based on relative selling price of the elements. The selling price for each deliverable is based on vendor-specific objective evidence (“VSOE”) if available, third-party evidence (“TPE”) if VSOE is not available, or best estimate of selling price (“BESP”) if neither VSOE nor TPE is available. BESP must be determined in a manner that is consistent with that used to determine the price to sell the specific elements on a standalone basis. The authoritative literature permitted prospective or retrospective adoption, and we elected prospective adoption. Other than the increased disclosure requirements of adoption of this policy, the adoption of these amendments did not change our units of accounting, allocation of arrangement consideration, or pattern or timing of revenue recognition. It also did not have a significant impact on our financial position, results of operations, or cash flows for the year ended December 31, 2010. See Note 1 for additional discussion of the Company’s revenue recognition policy.
2. Property and Equipment
Property and equipment consists of the following at December 31:
|
2010
|
2009
|
|||||||
|
Equipment
|
$ | 9,574 | $ | 9,321 | ||||
|
Demonstration units
|
1,195 | 1,436 | ||||||
|
Computers and purchased software
|
3,425 | 3,076 | ||||||
|
Furniture and fixtures
|
362 | 355 | ||||||
|
Leasehold improvements
|
7,328 | 7,305 | ||||||
|
Construction in progress
|
389 | 44 | ||||||
| 22,273 | 21,537 | |||||||
|
Accumulated depreciation
|
(20,268 | ) | (18,634 | ) | ||||
| $ | 2,005 | $ | 2,903 | |||||
3. Stockholders’ Equity
Preferred Stock
At December 31, 2010, Active Power had 10,420,000 shares of preferred stock authorized and no shares outstanding.
Common Stock
Common stock reserved for future issuance at December 31, 2010 consists of 12,904,344 shares of common stock reserved under our 2010 Stock Incentive Plan, of which 7,308,988 were subject to outstanding options and restricted shares and 5,495,356 were available for future grants of awards. Options are subject to terms and conditions as determined by our Board of Directors.
In May 2009, we completed the private placement of 6,000,000 shares of our common stock at a price of $0.50 per share, for an aggregate offering price of $3.0 million before expenses, with certain qualified institutional investors. We paid approximately $67 in expenses, including commissions, in connection with this offering. We filed a registration statement with the Securities and Exchange Commission in August 2009 that was declared effective on October 28, 2009.
In November 2009, we filed a registration statement with the Securities and Exchange Commission, using a “shelf” registration process. Under this shelf process, we may, from time to time, sell any combination of the securities described in this prospectus in one or more offerings up to a total dollar amount of $25,000,000. This filing became effective December 21, 2009.
In February 2010, we sold approximately 13.25 million shares of common stock at a purchase price of $0.75 per share, for proceeds, net of fees and expenses, of approximately $9.0 million, in a firm-commitment underwritten offering made under a shelf registration statement that we had filed with the Securities and Exchange Commission and that had been declared effective in December 2009. The proceeds from this offering were designed to strengthen our balance sheet and for general corporate purposes.
Stockholder Rights Plan
In December 2001, the Board of Directors adopted a Stockholder Rights Plan in which preferred stock purchase rights will be distributed as a dividend at the rate of one Right for each share of common stock of the Company held by stockholders of record as of the close of business on December 26, 2001. The Rights Plan is designed to deter coercive takeover tactics including the accumulation of shares in the open market or through private transactions and to prevent an acquirer from gaining control of the Company without offering a fair price to all of the Company’s stockholders. The Rights Plan was not adopted in response to any specific threat or takeover offer. The Rights will expire on December 26, 2011.
Stock Option Plan
Since its inception, we have authorized 19,911,478 shares of common stock for issuance under our 2000 and 2010 Stock Incentive Plans. We grant options under these plans that vest over periods ranging from immediate to four years. The term of each option is no more than ten years from the date of grant. We have repurchase rights for any unvested shares purchased by optionees that allow us to repurchase such shares at cost.
A summary of common stock option activity is as follows:
|
Number of
Shares
|
Weighted-Average
Exercise Price
|
Weighted-Average
Contractual Life
|
||||||||||
|
(in years)
|
||||||||||||
|
Outstanding at December 31, 2007
|
5,172,555 | $ | 4.30 | |||||||||
|
Granted
|
1,243,958 | 1.58 | ||||||||||
|
Exercised
|
(15,000 | ) | 1.22 | |||||||||
|
Canceled
|
(697,792 | ) | 4.83 | |||||||||
|
Outstanding at December 31, 2008
|
5,703,721 | $ | 3.66 | |||||||||
|
Granted
|
2,432,474 | 0.59 | ||||||||||
|
Exercised
|
(20,312 | ) | 0.56 | |||||||||
|
Canceled
|
(2,476,441 | ) | 4.53 | |||||||||
|
Outstanding at December 31, 2009
|
5,639,442 | $ | 1.97 | |||||||||
|
Granted
|
4,454,650 | 0.84 | ||||||||||
|
Exercised
|
(128,175 | ) | 0.79 | |||||||||
|
Canceled
|
(575,930 | ) | 1.59 | |||||||||
|
Outstanding at December 31, 2010
|
9,389,987 | $ | 1.47 | 7.52 | ||||||||
|
Vested and expected to vest at December 31, 2010
|
7,859,419 | $ | 1.47 | 7.52 | ||||||||
|
Exercisable at December 31, 2010
|
3,801,505 | $ | 2.40 | 5.78 | ||||||||
The following is a summary of options outstanding and exercisable as of December 31, 2010:
|
Options Outstanding
|
Options Exercisable
|
|||||||||||||||||||||
|
Range of Exercise Prices
|
Number Outstanding
|
Average Remaining Contractual Life
|
Weighted-
Average Exercise Price
|
Number Exercisable
|
Weighted-
Average Exercise Price
|
|||||||||||||||||
|
(in years)
|
||||||||||||||||||||||
| $ | 0.41 – $ 0.41 | 10,750 | 7.83 | $ | 0.41 | 5,374 | $ | 0.41 | ||||||||||||||
| $ | 0.48 – $0.48 | 1,305,560 | 8.10 | 0.48 | 567,872 | 0.48 | ||||||||||||||||
| $ | 0.55 – $ 0.76 | 677,697 | 5.22 | 0.72 | 371,616 | 0.71 | ||||||||||||||||
| $ | 0.79 – $ 0.79 | 3,662,375 | 9.15 | 0.79 | 12,469 | 0.79 | ||||||||||||||||
| $ | 0.81 – $1.75 | 1,266,745 | 7.80 | 1.35 | 544,797 | 1.42 | ||||||||||||||||
| $ | 1.81 – $22.45 | 2,466,860 | 5.26 | 3.29 | 2,299,377 | 3.39 | ||||||||||||||||
| 9,389,987 | 7.52 | $ | 1.47 | 3,801,505 | $ | 2.40 | ||||||||||||||||
The weighted average grant date fair value of options granted during 2010, 2009 and 2008 was $0.57, $0.59 and $1.58, respectively. The total intrinsic value of options exercised (which is the amount by which the stock price exceeded the exercise price of the options at the date of exercise) during the years ended December 31, 2010, 2009 and 2008, was $118, $4 and $17, respectively. The aggregate intrinsic value of options outstanding at December 31, 2010, 2009 and 2008, was $11,700, $0 and $0, respectively. During the year ended December 31, 2010, the amount of cash received from the exercise of options was $102.
Restricted (non-vested) Shares
In 2007 and 2008 we issued 310,000 and 72,000 restricted shares to officers and employees of the Company. The restrictions lapse as the shares vest in equal annual installments over a three year period from the date of issuance. No restricted shares were granted in 2009 or 2010 by the Company. We recorded stock compensation expense of $(16), $168 and $178 related to restricted shares in 2010, 2009 and 2008, respectively. A summary of our restricted, or non-vested, shares as of December 31, 2010, and changes during the year ended December 31, 2010 is as follows:
|
Number of
Shares
|
Weighted-Average
Grant Date Fair Value
|
|||||||
|
Outstanding at December 31, 2009
|
116,345 | $ | 1.83 | |||||
|
Granted
|
- | - | ||||||
|
Vested
|
(95,677 | ) | 2.01 | |||||
|
Canceled
|
(1,667 | ) | 1.00 | |||||
|
Outstanding at December 31, 2010
|
19,001 | $ | 1.00 | |||||
As of December 31, 2010 there was $2.1 million of total unrecognized compensation cost, related to non-vested stock options, that is expected to be recognized over a weighted-average vesting period of 1.6 years.
Stock options exercisable but not subject to repurchase (vested) as of December 31, 2010, 2009 and 2008 were 3,801,505, 2,579,162 and 3,553,458, respectively. Unvested options outstanding at December 31, 2010, 2009 and 2008 were 5,588,482, 3,060,280 and 2,137,126, respectively.
During the year ended December 31, 2010, we issued 2,280,000 performance-based options to executive officers of the Company. These options provided for vesting only in the event that the Company met certain 2010 EBITDA targets. We are required to assess whether the performance criteria is probable of being achieved and we only recognize compensation expense if the vesting is considered probable. Based on our assessment and our 2010 results, we recorded compensation expense of $360 during 2010 and determined that 1,575,000 of these options would vest. To the extent earned, the performance shares vest 50% on the first anniversary of the grant date, 25% on the second anniversary of the grant date and the remaining 25% on the third anniversary of the grant date so long as the officer remains a service provider to the Company. As of December 31, 2010, 2,100,000 of the performance based options were outstanding. 525,000 options were returned to the option pool in 2011 due to all of the performance targets not being met.
During 2009 the Company agreed to exchange certain out-of-the-money stock options granted under the Company’s Stock Plan to eligible employees (excluding all directors and officers) for a lesser number of new stock options pursuant to a Tender Offer process. Under this exchange offer, the Company accepted for exchange options to purchase an aggregate of 1,727,527 shares of the Company’s common stock. All of these surrendered options were cancelled, and immediately thereafter in exchange, the Company issued new options to purchase an aggregate of 627,974 shares of the Company’s common stock pursuant to the terms of the exchange offer.
The fair value of each option award is estimated on the date of grant using the Black-Scholes model. Expected volatilities are based on implied and historical volatilities. The expected life of options granted is based on historical experience and on the terms and conditions of the options. The risk-free rates are based on the U.S. Treasury yield in effect at the time of grant. Assumptions used in the Black-Scholes model for our stock plans are presented below:
|
2010
|
2009
|
2008
|
||||||||||
|
Weighted average expected life in years
|
6.35 years
|
6.43 years
|
6.30 years
|
|||||||||
|
Weighted expected volatility
|
74 | % | 73 | % | 65 | % | ||||||
|
Weighted average risk-free interest rate
|
1.79 | % | 2.28 | % | 2.72 | % | ||||||
|
Average expected forfeitures
|
16.3 | % | 16.5 | % | 15.5 | % | ||||||
The Black-Scholes option valuation model was developed for use in estimating the fair value of traded options and requires the input of subjective assumptions, including the expected stock price volatility and estimated option life. For purposes of this valuation model, no dividends have been assumed. Our options have no vesting restrictions and are fully transferable. Our policy is to issue new shares when we are required to issue shares upon share option exercises. We reserve fully for share options at the time of issuance. All options granted since 2007 are exercisable only when vested, so that we do not have to repurchase unvested shares from employees, directors or other option recipients.
4. Income Taxes
The components of the provision (benefit) for income taxes attributable to continuing operations are as follows:
|
2010
|
2009
|
|||||||
|
Current:
|
||||||||
|
Federal
|
$ | (41 | ) | $ | (89 | ) | ||
|
State
|
- | 4 | ||||||
|
Foreign
|
- | 41 | ||||||
|
Total current
|
(41 | ) | (44 | ) | ||||
|
Deferred:
|
||||||||
|
Federal
|
— | — | ||||||
|
State
|
— | — | ||||||
|
Foreign
|
— | — | ||||||
|
Total deferred
|
— | — | ||||||
| $ | (41 | ) | $ | (44 | ) | |||
As of December 31, 2010, the Company had federal net operating loss carryforwards of approximately $209.0 million and research and development credit carryforwards of approximately $3.1 million. The net operating loss and credit carryforwards will expire beginning in 2011 through 2030 if not utilized. Utilization of the net operating losses and credit carryforwards may be subject to a substantial annual limitation due to the “change of ownership” provisions of the Internal Revenue Code of 1986. The annual limitation may result in the expiration of net operating losses and credit carryforwards before utilization.
Deferred income taxes reflect the net tax effects of temporary differences between the carrying amounts of assets and liabilities for financial reporting purposes and the amounts used for income tax purposes. Significant components of the Company’s deferred taxes as of December 31 are as follows (in thousands):
|
2010
|
2009
|
|||||||
|
Deferred tax assets:
|
||||||||
|
Current deferred tax assets
|
||||||||
|
Reserves and allowances
|
1,467 | 1,586 | ||||||
|
Deferred revenue
|
176 | 160 | ||||||
|
Prepaid expenses
|
— | — | ||||||
|
Valuation allowance for current deferred tax assets
|
(1,641 | ) | (1,743 | ) | ||||
|
Net current deferred tax assets
|
2 | 3 | ||||||
|
Noncurrent deferred tax assets
|
||||||||
|
Acquired technology
|
1,031 | 1,175 | ||||||
|
Capital expenses
|
2,185 | 2,061 | ||||||
|
Stock compensation
|
786 | 875 | ||||||
|
Net operating loss and tax credit carryforwards
|
80,164 | 79,024 | ||||||
|
Valuation allowance for noncurrent deferred tax assets
|
(84,069 | ) | (83,012 | ) | ||||
|
Net noncurrent deferred tax assets
|
97 | 123 | ||||||
|
Deferred tax liabilities:
|
||||||||
|
Current deferred tax liabilities
|
||||||||
|
Prepaid expenses
|
(99 | ) | (126 | ) | ||||
|
Total current deferred tax liabilities
|
(99 | ) | (126 | ) | ||||
|
Noncurrent deferred tax liabilities
|
||||||||
|
Unrealized gains/losses
|
— | — | ||||||
|
Total noncurrent deferred tax liabilities
|
— | — | ||||||
|
Net current deferred tax asset (liability)
|
(97 | ) | (126 | ) | ||||
|
Net noncurrent deferred tax asset (liability)
|
97 | 123 | ||||||
|
Net deferred taxes
|
— | — | ||||||
The Company has established a valuation allowance equal to the net deferred tax asset due to uncertainties regarding the realization of deferred tax assets based on the Company’s lack of earnings history. The valuation allowance increased by approximately $1.0 million during 2010. Approximately $6.2 million of the total valuation allowance relates to tax benefits for stock option deductions included in the net operating loss carryforward, which when realized, will be allocated directly to contributed capital to the extent the benefits exceed amounts attributable to deferred compensation expense.
The Company’s provision for income taxes differs from the expected tax expense (benefit) amount computed by applying the statutory federal income tax rate of 34% to income before taxes due to the following:
|
Year Ended December 31,
|
||||||||||||
|
2010
|
2009
|
2008
|
||||||||||
|
Federal statutory rate
|
(34.0 | )% | (34.0 | )% | (34.0 | )% | ||||||
|
State taxes, net of federal benefit
|
0.3 | (0.9 | ) | (0.4 | ) | |||||||
|
R&D credits
|
(3.1 | ) | (0.7 | ) | 4.7 | |||||||
|
Change in Texas tax law
|
— | — | 5.2 | |||||||||
|
Stock compensation
|
5.7 | 2.8 | 4.7 | |||||||||
|
Effect of foreign operations
|
(0.3 | ) | 3.6 | 2.9 | ||||||||
|
Permanent items and other
|
5.9 | 2.6 | 3.8 | |||||||||
|
Change in valuation allowance
|
24.4 | 26.2 | 13.1 | |||||||||
| (1.1 | )% | (0.4 | )% | 0 | % | |||||||
The Company adopted the accounting standard related to uncertain tax positions on January 1, 2007. The Company recognized no material adjustment in the liability for unrecognized income tax benefits. The reconciliation of the Company’s unrecognized tax benefits at the beginning and end of the year is as follows:
|
Balance at January 1, 2010
|
$ | 949 | ||
|
Additions based on tax positions related to the current year
|
$ | 216 | ||
|
Additions for tax positions of prior years
|
$ | — | ||
|
Reductions for tax positions of prior years
|
(52 | ) | ||
|
Settlements
|
— | |||
|
Balance at December 31, 2010
|
$ | 1,113 | ||
Due to the existence of the valuation allowance, future changes in our unrecognized tax benefits will not impact the Company’s effective tax rate.
The Company recognizes interest and penalties related to uncertain tax positions in income tax expense. As of December 31, 2010, the Company had no accrued interest or penalties related to uncertain tax positions.
The tax years 2006 through 2010 remain open to examination by the major taxing jurisdictions to which the Company is subject.
5. Commitments
We lease our office and manufacturing and engineering facilities and our foreign sales offices under operating lease agreements. These facilities’ leases are non-cancelable and obligate us to pay taxes and maintenance costs. Our corporate headquarters facility is a 127,000 square foot building that we lease pursuant to a lease agreement that expires in December 2011. Our administrative, information systems, manufacturing, sales and service groups currently utilize 96,000 square feet of this facility. We sublease the remaining 31,000 square feet of our corporate headquarters facility pursuant to sublease agreements that we entered into during 2007. The sublease agreements extend through December 2011. Rent expense was offset by $333, $319 and $304 in 2010, 2009 and 2008, respectively, for cash received pursuant to these sublease agreements. Our administration, marketing and engineering facility of approximately 19,600 square feet is leased pursuant to a lease agreement that expires in March 2012.
In addition, we lease certain equipment such as copiers and phone systems under non-cancelable leases. Net rent expense was $1.2 million, $1.1 million and $1.1 million for the years ended December 31, 2010, 2009 and 2008, respectively.
Future minimum payments and receipts under these leases at December 31, 2010 are as follows:
|
Rental
payments
|
Sub-lease
Income
|
Net
|
||||||||||
|
2011
|
$ | 1,341 | $ | (333 | ) | $ | 1,008 | |||||
|
2012
|
272 | — | 272 | |||||||||
|
2013
|
162 | — | 162 | |||||||||
|
2014
|
71 | — | 71 | |||||||||
|
2015
|
62 | — | 62 | |||||||||
|
2016 and thereafter
|
154 | — | 154 | |||||||||
|
Total future minimum lease payments
|
$ | 2,062 | $ | (333 | ) | $ | 1,729 | |||||
We enter into certain commitments to purchase inventory and other items in the course of normal operations. At December 31, 2010, the total of these commitments is $6,903, of which $6,753 will mature in 2011 and $25 will mature in each subsequent year through 2017.
We have entered into Severance Benefits Agreements with our Chief Executive Officer and our Chief Financial Officer and Change of Control Severance Agreements with each of our other executive officers. These agreements generally provide that, if within 12 months following a change in control the executive officer’s employment is terminated for reasons other than for cause (as defined in the agreement) or by the executive for good reason, including a significant reduction in the role and/or responsibility of the executive within 12 months of the change in corporate control, then all outstanding stock options held by the executive would vest as of the date of the termination. Our Severance Benefits Agreements with our Chief Executive Officer and Chief Financial Officer contain the acceleration provision described above as well as certain additional benefits that are not contingent upon a change of control of the Company. In the case of our Chief Executive Officer, in the event of termination by the Company for reasons other than for cause or by him for good reason, he would be entitled to a severance payment equal to twelve months of salary and be entitled to receive health benefits for twelve additional months after termination. In the case of our Chief Financial Officer, in the event of a termination by the Company for reasons other than for cause or by him for good reason, he would be entitled to a severance payment equivalent to nine months of salary and be entitled to receive health benefits for nine additional months after termination.
6. Employee Benefit Plan
We maintain a 401(k) Plan that covers substantially all full-time employees. Company contributions to the plan are determined at the discretion of the Board of Directors and vest ratably over five years of service starting after the first year of employment. We did not contribute to this plan in 2010, 2009 or 2008.
7. Geographic Information
Revenues for the year ended December 31 were as follows:
|
2010
|
2009
|
2008
|
||||||||||
|
North America
|
$ | 47,530 | $ | 28,707 | $ | 27,113 | ||||||
|
EMEA
|
13,007 | 9,181 | 12,038 | |||||||||
|
Asia Pacific
|
4,418 | 2,423 | 3,834 | |||||||||
|
Total
|
$ | 64,955 | $ | 40,311 | $ | 42,985 | ||||||
Revenues from foreign countries above represent shipments to customers located in thirty-three countries during 2010. Substantially all of our property, plant and equipment is located in the United States. Net assets of operations in foreign countries (excluding intercompany receivables and payables eliminated in consolidation) was $7.1 million at December 31, 2010.
8. Guarantees
In certain geographical regions, particularly Europe and Africa, we are sometimes required to issue performance guarantees to our customers as a condition of sale. These guarantees usually provide financial protection to our customers in the event that we fail to fulfill our warranty obligations. We secure these guarantees with standby letters of credit through our bank. At December 31, 2010 and, 2009 we had $547 and $48, respectively, of performance guarantees outstanding to customers that were secured with letters of credit.
9. Revolving Credit Facility
In August 2010, we entered into a Second Amended and Restated Loan and Security Agreement (the “Loan Agreement” with our existing bank, Silicon Valley Bank (“SVB”). This new facility increased the total liquidity available from $6.0 million to $12.5 million subject to certain borrowing bases. This new facility expanded our ability to borrow funds from U.S. receivables to also include qualifying receivables from our U.K. operations, increased our ability to use inventory as collateral for borrowing against, and also added an ability to borrow against purchase orders. These additional bases of borrowing were designed to allow us to use the credit facility to fund inventory purchases in the event we received large or multiple sales orders that would require a major investment in inventory and work in progress, to help fund continued growth in our business.
This new two-year loan facility provides for a secured revolving line of credit in an aggregate amount of up to eighty percent (80%) of the facility amount of $15.625 million, or $12.5 million, subject to certain borrowing bases. In the event we have maintained cash and cash equivalents of at least $6.25 million with SVB for at least 30 consecutive days, which is referred to as being in a “Streamline Period”, the borrowing base formula is based on eligible accounts receivable, eligible purchase orders and eligible inventory, subject to a sublimit of $5 million for U.K. accounts receivable, $3.5 million for inventory and $1.5 million for purchase orders. When we are not in a Streamline Period, our borrowings are limited based on accounts receivable and purchase orders that SVB has specifically agreed to finance and a borrowing base for eligible inventory. We may also request that SVB issue letters of credit on our behalf, of up to $1.5 million, as a portion of our total loan facility.
On August 5, 2010, the Company borrowed approximately $2.5 million in revolving loans, all of which was used to refinance all indebtedness owing from the Company to SVB under our previous credit facility. The new credit facility increases the total credit available from our previous loan facility with SVB, which was $6.0 million, and enables us to borrow against eligible inventory, foreign receivables and customer purchase orders in addition to eligible accounts receivable.
At December 31, 2010 and 2009, $2.5 and $2.6 million, respectively, was outstanding on these borrowings, at an interest rate of 5.50% and 5.25%, respectively. Based on the borrowing base formula, we had an additional $9.4 million available for use at December 31, 2010 under this credit facility.
When a Streamline Period is in effect, each advance based upon accounts receivable and inventory accrues interest at a per annum rate equal to SVB’s prime rate, subject to a minimum prime rate of four percent (4.00%), plus one and one-half percent (1.50%) and each advance based upon a purchase order inventory accrues interest at a per annum rate equal to SVB’s prime rate, subject to a minimum prime rate of four percent (4.00%), plus two percent (2.00%). When a Streamline Period is not in effect, each advance based upon accounts receivable and inventory accrues interest at a per annum rate equal to SVB’s prime rate, subject to a minimum prime rate of four percent (4.00%), plus three and five-eighths percent (3.625%) and each advance based upon a purchase order accrues interest at a per annum rate equal to SVB’s prime rate, subject to a minimum prime rate of four percent (4.00%), plus six and one-half percent (6.50).
Finance charges and interest are payable monthly, and all principal and interest is due on the maturity date of August 5, 2012. However, when we are not in a Streamline Period, we must repay advances based on receivables when we receive payment on the receivable that has been financed, and we must repay advances based on purchase orders within 120 days of the date of the purchase order, together with all finance charges on such advances.
The revolving loans made to us under this loan facility will be secured by a lien on substantially all of our assets. In addition, on August 5, 2010, Active Power Solutions Limited, a wholly-owned United Kingdom subsidiary of the Company, entered into a Guarantee and Debenture with SVB (the “Guarantee and Debenture”), pursuant to which Active Power Solutions Limited guarantied all of the obligations of the Company under the Loan Agreement and secured its obligations under the Guarantee and Debenture with a security interest on substantially all of its assets.
The Loan Agreement includes customary affirmative covenants for a credit facility of this size and type, including delivery of financial statements, compliance with laws, maintenance of insurance and protection of intellectual property rights. Further, the Loan Agreement contains customary negative covenants for a credit facility of this size and type, including covenants that limit or restrict the Company’s ability to, among other things, dispose of assets, change its business, change its CEO or CFO without replacing such person within 120 days, have a change in control, make acquisitions, be acquired, incur indebtedness, grant liens, make investments, make distributions, repurchase stock, and enter into certain transactions with affiliates. The Loan Agreement also requires the Company to maintain a minimum liquidity ratio of 1.25:1. The liquidity ratio is defined as the ratio of unrestricted cash and cash equivalents and marketable securities plus eligible accounts receivable to all indebtedness owed by the Company to SVB. The Company is currently in compliance with all loan covenants under the Loan Agreement.
The Loan Agreement contains customary events of default that include, among other things, non-payment defaults, covenant defaults, material adverse change defaults, insolvency defaults, material judgment defaults and inaccuracy of representations and warranty defaults. The occurrence of an event of default could result in the acceleration of obligations under the Loan Agreement, in which case the Company must repay all loans and related charges, fees and amounts then due and payable, and our subsidiary may be required to pay any such amounts under the Guarantee and Debenture. At the election of SVB, upon the occurrence and during the continuance of an event of default, finance charges or interest rates, as applicable, will increase an additional five percentage points (5.00%) per annum above the rate that is otherwise applicable thereto upon the occurrence of such event of default, and the collateral handling fees will increase by one-half percent (0.50%).
10. Selected Quarterly Consolidated Financial Data (unaudited)
The following tables present selected unaudited consolidated statement of operations information for each of the quarters in the years ended December 31, 2010 and 2009 (in thousands, except per share data):
|
For the Quarter Ended
|
||||||||||||||||
|
Year Ended December 31, 2010
|
December 31
|
September 30
|
June 30
|
March 31
|
||||||||||||
|
Selected consolidated statement of operations information:
|
||||||||||||||||
|
Total revenue
|
$ | 19,335 | $ | 18,456 | $ | 16,047 | $ | 11,117 | ||||||||
|
Total cost of goods sold
|
14,006 | 12,978 | 11,685 | 8,266 | ||||||||||||
|
Gross profit
|
5,329 | 5,478 | 4,362 | 2,851 | ||||||||||||
|
Operating expenses
|
5,159 | 5,447 | 5,808 | 5,410 | ||||||||||||
|
Operating profit (loss)
|
170 | 31 | (1,446 | ) | (2,559 | ) | ||||||||||
|
Net income (loss)
|
145 | 55 | (1,536 | ) | (2,589 | ) | ||||||||||
|
Basic and diluted net income (loss) per share
|
$ | 0.00 | $ | 0.00 | $ | (0.02 | ) | $ | (0.04 | ) | ||||||
|
Selected consolidated balance sheet information:
|
||||||||||||||||
|
Current assets
|
37,199 | 34,050 | 33,796 | 31,192 | ||||||||||||
|
Total assets
|
39,518 | 36,389 | 36,396 | 34,029 | ||||||||||||
|
Current liabilities
|
18,117 | 15,626 | 16,234 | 12,420 | ||||||||||||
|
Working capital
|
19,082 | 18,424 | 17,562 | 18,772 | ||||||||||||
|
Long term obligations
|
579 | 606 | 629 | 691 | ||||||||||||
|
Stockholders’ equity
|
20,822 | 20,157 | 19,533 | 20,918 | ||||||||||||
|
For the Quarter Ended
|
||||||||||||||||
|
Year Ended December 31, 2009
|
December 31
|
September 30
|
June 30
|
March 31
|
||||||||||||
|
Selected consolidated statement of operations information:
|
||||||||||||||||
|
Total revenue
|
$ | 14,004 | $ | 8,534 | $ | 6,630 | $ | 11,143 | ||||||||
|
Total cost of goods sold
|
11,393 | 6,652 | 5,155 | 7,881 | ||||||||||||
|
Gross profit
|
2,611 | 1,882 | 1,475 | 3,262 | ||||||||||||
|
Operating expenses
|
4,860 | 4,868 | 4,895 | 5,570 | ||||||||||||
|
Operating loss
|
(2,249 | ) | (2,986 | ) | (3,420 | ) | (2,308 | ) | ||||||||
|
Net loss
|
(2,240 | ) | (2,960 | ) | (3,466 | ) | (2,367 | ) | ||||||||
|
Basic and diluted loss per share
|
$ | (0.03 | ) | $ | (0.04 | ) | $ | (0.06 | ) | $ | (0.04 | ) | ||||
|
Selected consolidated balance sheet information:
|
||||||||||||||||
|
Current assets
|
26,065 | 24,072 | 26,361 | 25,021 | ||||||||||||
|
Total assets
|
29,344 | 27,652 | 30,140 | 29,529 | ||||||||||||
|
Current liabilities
|
14,384 | 11,196 | 10,667 | 10,296 | ||||||||||||
|
Working capital
|
11,681 | 12,876 | 15,694 | 14,725 | ||||||||||||
|
Long term obligations
|
468 | 567 | 578 | 480 | ||||||||||||
|
Stockholders’ equity
|
14,492 | 15,889 | 18,895 | 18,753 | ||||||||||||
78