Attached files
UNITED STATES
SECURITIES AND EXCHANGE COMMISSION
WASHINGTON, D.C. 20549
FORM 10-K
| ☒ |
ANNUAL REPORT PURSUANT TO SECTION 13 OR 15(d) OF THE SECURITIES EXCHANGE ACT OF 1934
|
|
For the fiscal year ended December 31, 2014
|
OR
| ☐ |
TRANSITION REPORT PURSUANT TO SECTION 13 OR 15(d) OF THE SECURITIES EXCHANGE ACT OF 1934
|
|
For the transition period from to
|
Commission file number: 000-30939
ACTIVE POWER, INC.
(Exact name of registrant as specified in its charter)
|
Delaware
|
74-2961657
|
|
|
(State or other jurisdiction of incorporation or organization)
|
(I.R.S. Employer Identification No.)
|
|
|
2128 W. Braker Lane, BK 12, Austin, Texas
|
78758
|
|
|
(Address of principal executive offices)
|
(Zip Code)
|
(512) 836-6464
(Registrant’s telephone number, including area code)
Securities registered pursuant to Section 12(b) of the Act:
|
Title of Class
|
Name of Exchange on Which Registered
|
|
|
Common Stock, $0.001 per share
|
The Nasdaq Stock Market LLC
|
Securities registered pursuant to Section 12(g) of the Act:
(Title of Class)
Indicate by check mark if the registrant is a well-known seasoned issuer, as defined in Rule 405 of the Securities Act. o Yes T No
Indicate by check mark if the registrant is not required to file reports pursuant to Section 13 or Section 15(d) of the Exchange Act. o Yes T No
Indicate by check mark whether the registrant (1) has filed all reports required to be filed by Section 13 or 15(d) of the Securities Exchange Act of 1934 during the preceding 12 months (or for such shorter period that the registrant was required to file such reports), and (2) has been subject to such filing requirements for the past 90 days. T Yes o No
Indicate by check mark whether the registrant has submitted electronically and posted on its corporate Web site, if any, every Interactive Data File required to be submitted and posted pursuant to Rule 405 of Regulation S-T (§ 232.405 of this chapter) during the preceding 12 months (or for such shorter period that the registrant was required to submit and post such files). T Yes o No
Indicate by check mark if disclosure of delinquent filers pursuant to Item 405 of Regulation S-K is not contained herein, and will not be contained, to the best of registrant’s knowledge, in definitive proxy or information statements incorporated by reference in Part III of this Form 10-K or any amendment to this Form 10-K. T
Indicate by check mark whether the registrant is a large accelerated filer, an accelerated filer, a non-accelerated filer, or a smaller reporting company. See the definitions of “large accelerated filer,” “accelerated filer,” and “smaller reporting company” in Rule 12b-2 of the Exchange Act. (Check one)
|
Large accelerated filer ☐
|
Accelerated filer T
|
Non-accelerated filer ☐
|
Smaller reporting company ☐
|
|
(Do not check if a smaller reporting company)
|
|||
Indicate by check mark whether the registrant is a shell company (as defined in Rule 12b-2 of the Exchange Act) o Yes T No
The aggregate market value of the voting and non-voting common equity held by non-affiliates of the registrant, based upon the closing sale price of its common stock on the last day of registrant’s most recently completed second fiscal quarter, June 30, 2014, as reported on The Nasdaq Stock Market, was approximately $53.7 million (affiliates being, for these purposes only, directors and executive officers and holders of 10% or more of the registrant’s outstanding shares).
As of February 25, 2015, the registrant had 23,157,509 shares of common stock outstanding.
Documents Incorporated by Reference
Certain information required by Part III of Form 10-K is incorporated by reference to the registrant’s proxy statement for its 2015 Annual Meeting of Stockholders, which will be filed with the Securities and Exchange Commission within 120 days after the close of the registrant’s fiscal year ended December 31, 2014.
Active Power, Inc.
Unless otherwise indicated, “we,” “us,” “our,” and “Active Power” mean Active Power, Inc., including our predecessor Texas corporation and our subsidiary companies. References in this report to “$” or “dollars” are to United States of America currency.
|
PART I
|
||
|
ITEM 1.
|
4
|
|
|
ITEM 1A
|
15
|
|
|
ITEM 1B.
|
23
|
|
|
ITEM 2.
|
23
|
|
|
ITEM 3.
|
23
|
|
|
ITEM 4.
|
23
|
|
|
PART II
|
||
|
ITEM 5.
|
23
|
|
|
ITEM 6.
|
25
|
|
|
ITEM 7.
|
26
|
|
|
ITEM 7A.
|
36
|
|
|
ITEM 8.
|
37
|
|
|
ITEM 9.
|
37
|
|
|
ITEM 9A.
|
37
|
|
|
ITEM 9B.
|
37
|
|
|
PART III
|
||
|
ITEM 10.
|
38
|
|
|
ITEM 11.
|
38
|
|
|
ITEM 12.
|
38
|
|
|
ITEM 13.
|
38
|
|
|
ITEM 14.
|
38
|
|
|
PART IV
|
||
|
ITEM 15.
|
39
|
Special Note Regarding Forward-Looking Statements
This report on Form 10-K contains forward-looking statements within the meaning of Section 27A of the Securities Act of 1933, as amended (the “Securities Act”), and Section 21E of the Securities Exchange Act of 1934, as amended (the “Exchange Act”). All statements other than statements about historical or current facts, including, without limitation, statements about our business strategy, plans, and objectives of management and our future prospects, are forward-looking statements. These include, among other things, statements regarding:
| · | our expectations that we can increase bookings and backlog; |
| · | our belief that we can control our future expenses; |
| · | our expectations regarding market acceptance of our current and new products; |
| · | our international operations providing a significant portion of our total revenues; |
| · | our future anticipated working capital needs; |
| · | our ability to improve inventory turns and factory utilization; |
| · | our expectation that we will improve the productivity of sales resources; |
| · | our expectation to continue to make significant investments in research and development; |
| · | our belief that the outcome of certain legal proceedings and claims to which we are a party will not, individually or in the aggregate, result in losses that are materially in excess of amounts already recognized, if any; and |
| · | our expectation that seasonal trends will continue in fiscal 2015. |
You can identify forward-looking statements by words such as “may,” “will,” “expect,” “intend,” “anticipate,” “believe,” “estimate,” “seek,” “continue,” and other similar words. You should read statements that contain these words carefully because they discuss our future expectations, make projections of our future results of operations or financial condition, or state other “forward-looking” information.
We claim the protection of the safe harbor for forward-looking statements contained in the Private Securities Litigation Reform Act of 1995 for all forward-looking statements. We have based these forward-looking statements on our current expectations and projections about future events. These forward-looking statements are subject to risks, uncertainties and assumptions about our business that could affect our future results and could cause those results or other outcomes to differ materially from those expressed or implied in the forward-looking statements. Factors that might cause or contribute to such differences include, but are not limited to, those discussed in “Risk Factors” included in Item 1A of this report and as may be updated in filings we make from time to time with the U.S. Securities and Exchange Commission (the “SEC”), including the Quarterly Reports on Form 10-Q to be filed by us in our fiscal year 2015.
We have no obligation to publicly update or revise any forward-looking statements, whether as a result of new information, future events or risks, except to the extent required by applicable securities laws. If we do update one or more forward-looking statements, no inference should be drawn that we will make additional updates with respect to those or other forward-looking statements. New information, future events or risks could cause the forward-looking events we discuss in this report not to occur. You should not place undue reliance on these forward-looking statements, which reflect our expectations only as of the date of this report.
PART I.
Overview
Active Power designs, manufactures, sells, and services flywheel-based uninterruptible power supply (“UPS”) products that use kinetic energy to provide short-term power as a cleaner alternative to electro-chemical battery-based energy storage. We also design, manufacture, sell, and service modular infrastructure solutions (“MIS”) that integrate critical power components into a pre-packaged, purpose built enclosure that may include our UPS products as a component. Our products and solutions are based on our patented flywheel and power electronics technology and are designed to ensure continuity for data centers and other mission critical operations in the event of power disturbances.
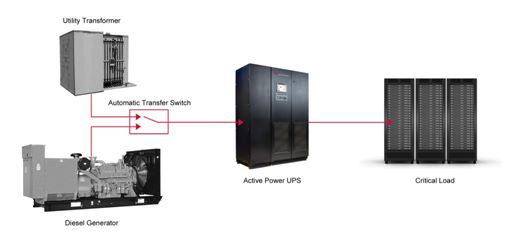
Our UPS products and solutions are designed to deliver continuous conditioned power during short-term power disturbances and outages, such as voltage sags and surges, and to provide ride-through power in the event of a utility failure, supporting operations until utility power is restored or a longer term alternative power source, such as a diesel generator, is started. We believe our products offer an advantage over those of our competitors in the areas of system reliability, power density (less floor space), and total cost of ownership.
We have sold our flywheel-based UPS products which we call CleanSource® UPS since 1999. As of December 31, 2014, we have shipped more than 4,000 flywheels in UPS systems, delivering nearly 1 gigawatt of power to customers in more than 50 countries around the world, and providing more than 200 million runtime hours of operation.
In addition to selling stand-alone UPS products, our MIS products integrate critical power components into a pre-packaged, purpose built enclosure that can be deployed by customers indoors or outdoors. These solutions can provide the customer benefits of our UPS systems along with the advantages of capital expense, speed to deployment, and system management controls. Our MIS products, for example, can include our UPS products with other related equipment including switchboards and automatic transfer switch; monitoring and control systems; fire detection; lighting; security; and air conditioning. When integrated with our UPS, this product, known as CleanSource PowerHouse™, is sold as a complete stand-alone power solution.
We also integrate and build modular power and IT infrastructure solutions to specification based on customer designs. These solutions are typically enclosures that have a fully built out interior including electrical, cooling, monitoring, and other elements ready for the customer to add its IT racks and servers. These solutions typically do not include our UPS products. These modular IT solutions serve as the physical infrastructure for modular data center products which are self-contained, fully functioning data centers once the customer adds its IT equipment. These products can be deployed rapidly and at a lower cost than traditional brick-and-mortar solutions, and are optimally suited for hyperscale IT and cloud applications.
To date, we have deployed more than 190 infrastructure modules worldwide, which include both CleanSource PowerHouse and our modular IT solutions.
We offer worldwide customer support services, including hardware and software maintenance, on all Active Power products, and other professional services such as assessment, implementation and lifecycle support for our customers’ infrastructure projects.
We are headquartered in Austin, Texas, with international offices in the United Kingdom, Germany, and China.
In 2014, 78% of our product revenue came from the sale of UPS products and 22% from the sale of MIS products. For additional financial detail on each of our segments, see Note 8 to the condensed consolidated financial statements of this Form 10-K.
Customer and Target Markets
According to a 2014 report on the world UPS market by IHS Research, a provider of global market, industry, and technical expertise, the global UPS market was estimated to be approximately $7.6 billion in 2014. IHS Research projects the market will increase to approximately $7.8 billion in 2015 and will grow to approximately $8.5 billion by 2017 with a projected compound annual growth rate of nearly 3% from 2013 to 2018.
UPS products can be classified into single phase and three phase systems. We compete in the higher power, three phase range. Demand for three phase systems is typically segmented by kVA (kilo-Volt-Amps or power level) and by geography. We focus on customers in the 250 kVA and higher segment in the Americas; Europe, Middle East, and Africa (EMEA); and Asia.
In 2014, IHS Research estimated our total available market in this segment to be $2.1 billion with a served addressable market in the 250 kVA and above segment of approximately $1.2 billion globally. In 2018, our total available market is forecasted to be approximately $2.7 billion with a served addressable market in the 250 kVA and above segment of approximately $1.6 billion. The 250 kVA and higher segment is one of the fastest growing segments of the UPS market according to IHS Research, with a compound annual growth rate projected at nearly 3% from 2014 to 2018.
451 Research, an IT research and advisory company, estimated our total available market for modular data center products in 2014 was $1.5 billion with a served addressable market of approximately $900 million globally. The total available market is anticipated to grow to approximately $4.0 billion by 2018 with a served addressable market of more than $1.5 billion, according to a 2015 report published by 451 Research. We serve the modular data center market with our CleanSource PowerHouse and modular IT products.
We deliver products and solutions that support and enable mission critical applications that cannot tolerate downtime due to a power disturbance. Although data center deployments represent more than half of our installed base, we also have had success in selling into non-IT environments. Below is a list of where these applications can be found and examples of the types of mission critical loads we protect with our products and solutions.
| · | Data Center – IT equipment in extreme/hyperscale, enterprise, and colocation facilities |
| · | Industrial/Manufacturing – precision machining, plastic extrusion equipment, and bottling equipment |
| · | Healthcare – imaging equipment (i.e. CAT, MRI, PET, etc.) and hospital data centers |
| · | Casino and Gaming – gaming machines and casino data centers |
| · | Transportation – runway and taxiway lighting at airports |
| · | Broadcast – master control rooms and transmitter sites |
| · | Government – data centers at military installations. |
The following list provides a representative sample of end user customers that use our products and solutions to support and enable their operations. The list includes customers to whom such products and solutions have been sold directly by us or via our Original Equipment Manufacturer (“OEM”) partners, manufacturer’s representatives, distributors, or strategic IT partners:
|
Representative Customers
|
Industry
|
|
Capgemini UK plc
|
Data Center
|
|
Verizon Terremark
|
Data Center
|
|
Heineken
|
Industrial/Manufacturing
|
|
Pemex
|
Industrial/Manufacturing
|
|
Parkland Health and Hospital System
|
Healthcare
|
|
Merck
|
Healthcare
|
|
Cherokee Casinos
|
Casino/Gaming
|
|
Osage Casino
|
Casino/Gaming
|
|
Amsterdam Airport Schiphol
|
Transportation
|
|
Mexico City International Airport
|
Transportation
|
|
WCBD-TV
|
Broadcast
|
|
WFFF-TV / WVNY-TV
|
Broadcast
|
Distribution
We continue to develop client relationships by selling directly and through our network of partners. Specifically, we use the following distribution methods:
| · | direct sales; |
| · | manufacturer’s representatives; |
| · | distributors; |
| · | OEM partners; and |
| · | strategic IT partners. |
Direct Sales. Our direct sales teams are located in The Americas, Europe and Asia, and are supported by our four regional offices located in the U.S., United Kingdom, Germany, and China. Our direct sales teams are focused on establishing and expanding local presence and brand awareness, winning large customer orders, and developing the foundation for long-term client relationships in their local markets.
Manufacturer’s Representatives. We have relationships with a group of manufacturer’s representatives primarily in North America. Representatives have been granted rights to sell Active Power products in specific geographic territories. This channel remains integral to the distribution of our products in North America and increases our geographic sales coverage without adding fixed costs. Products are marketed and sold under the Active Power brand through this channel.
Distributors. In certain markets outside of the United States, we recruit and retain specific distributors to market our products and services. The distributor buys products from us and resells them to the end user, often with other products or services. Distributors may also perform service and warranty work for end users. This strategy has been successful for us in markets where we choose not to deploy direct sales or service resources.
OEM Partners. OEM partners remain critical to our overall business strategy. Our primary OEM partner and one of our largest customers is Caterpillar, Inc. (“Caterpillar”). Caterpillar markets Active Power’s UPS products under the Caterpillar brand name “CAT UPS” and as a complement to its electric power product lines of diesel engines and switchgear. By offering the CAT UPS with a standby generator and switchgear, Caterpillar can transform a standby power system into a continuous power system. We believe this total solution gives Caterpillar and us significant competitive advantages in the power quality market. In 2011, we signed a five-year distribution agreement with Caterpillar, continuing this important relationship that started in 1999. Unless terminated, this contract automatically renews for successive one-year periods. Our sales to Caterpillar represented 18%, 14%, and 13% of our total revenue for the years ended December 31, 2014, 2013, and 2012, respectively.
Strategic IT Partners. We have entered into agreements with leading global organizations in the data center market who have the ability to collaborate with us on new sales opportunities. These relationships help us expand potential opportunities to market our products and services through all of our distribution channels. Our primary IT partner is Hewlett Packard Corporation (“HP”). HP accounted for 1%, 22%, and 35% of our total revenue during 2014, 2013, and 2012, respectively.
Geography
We focus our marketing and customer identification efforts globally, supported by our four regional offices. Located in Austin, Texas; Osterode, Germany; Evesham, United Kingdom; and Beijing, China, our regional offices provide local sales and service, applications engineering, project management, and system integration for UPS and MIS products. Sales outside of North America accounted for approximately 42%, 20%, and 40% of our total revenues in 2014, 2013, and 2012, respectively. We expect a significant portion of our total revenue will continue to be through international sales. For additional detail on revenue from external customers attributed to foreign operations, see Footnote 8 to the condensed consolidated financial statements in this Form 10-K. For risks related to revenue from external customers attributed to foreign operations, see Part I – Item 1A. Risk Factors, “We derive a substantial portion of our revenues from international markets and plan to continue to expand such efforts, which subjects us to additional business risks including increased logistical and financial complexity, managing internal controls and processes, political instability, and currency fluctuations.”
Products: UPS and MIS
UPS
Our UPS products serve two primary functions. First, during normal operations they are continuously conditioning (“cleaning”) the incoming power from the utility and delivering “conditioned” power to the client’s mission critical load. In this mode, the UPS regulates incoming utility power fluctuations in voltage and frequency. Second, if there is any interruption in the utility source, the UPS will provide temporary, or bridging power, until either the utility power is restored or an alternative generating source, such as a diesel generator, begins to provide power. This role of the UPS in the context of a continuous power application is illustrated below:
CleanSource 300/250 Series UPS
Active Power introduced the world’s first integrated flywheel UPS product in 1999, integrating UPS power electronics with flywheel energy storage technology. The flywheel stores kinetic energy – energy produced by motion – by constantly spinning a compact rotor in a low friction environment. When short-term backup power is required due to utility power fluctuations or losses, the UPS draws upon the stored kinetic energy of the spinning flywheel to generate electricity for the load until utility power returns. The flywheel immediately supports the critical load upon loss of utility power. Combining CleanSource UPS with a generator provides customers with complete short- and long-term protection in the event of a power disturbance. Within seconds of an extended outage occurring, the UPS signals the generator to start via the automatic transfer switch. The generator then carries the load until utility power is restored. The following is an illustration of our typical flywheel-based UPS system:
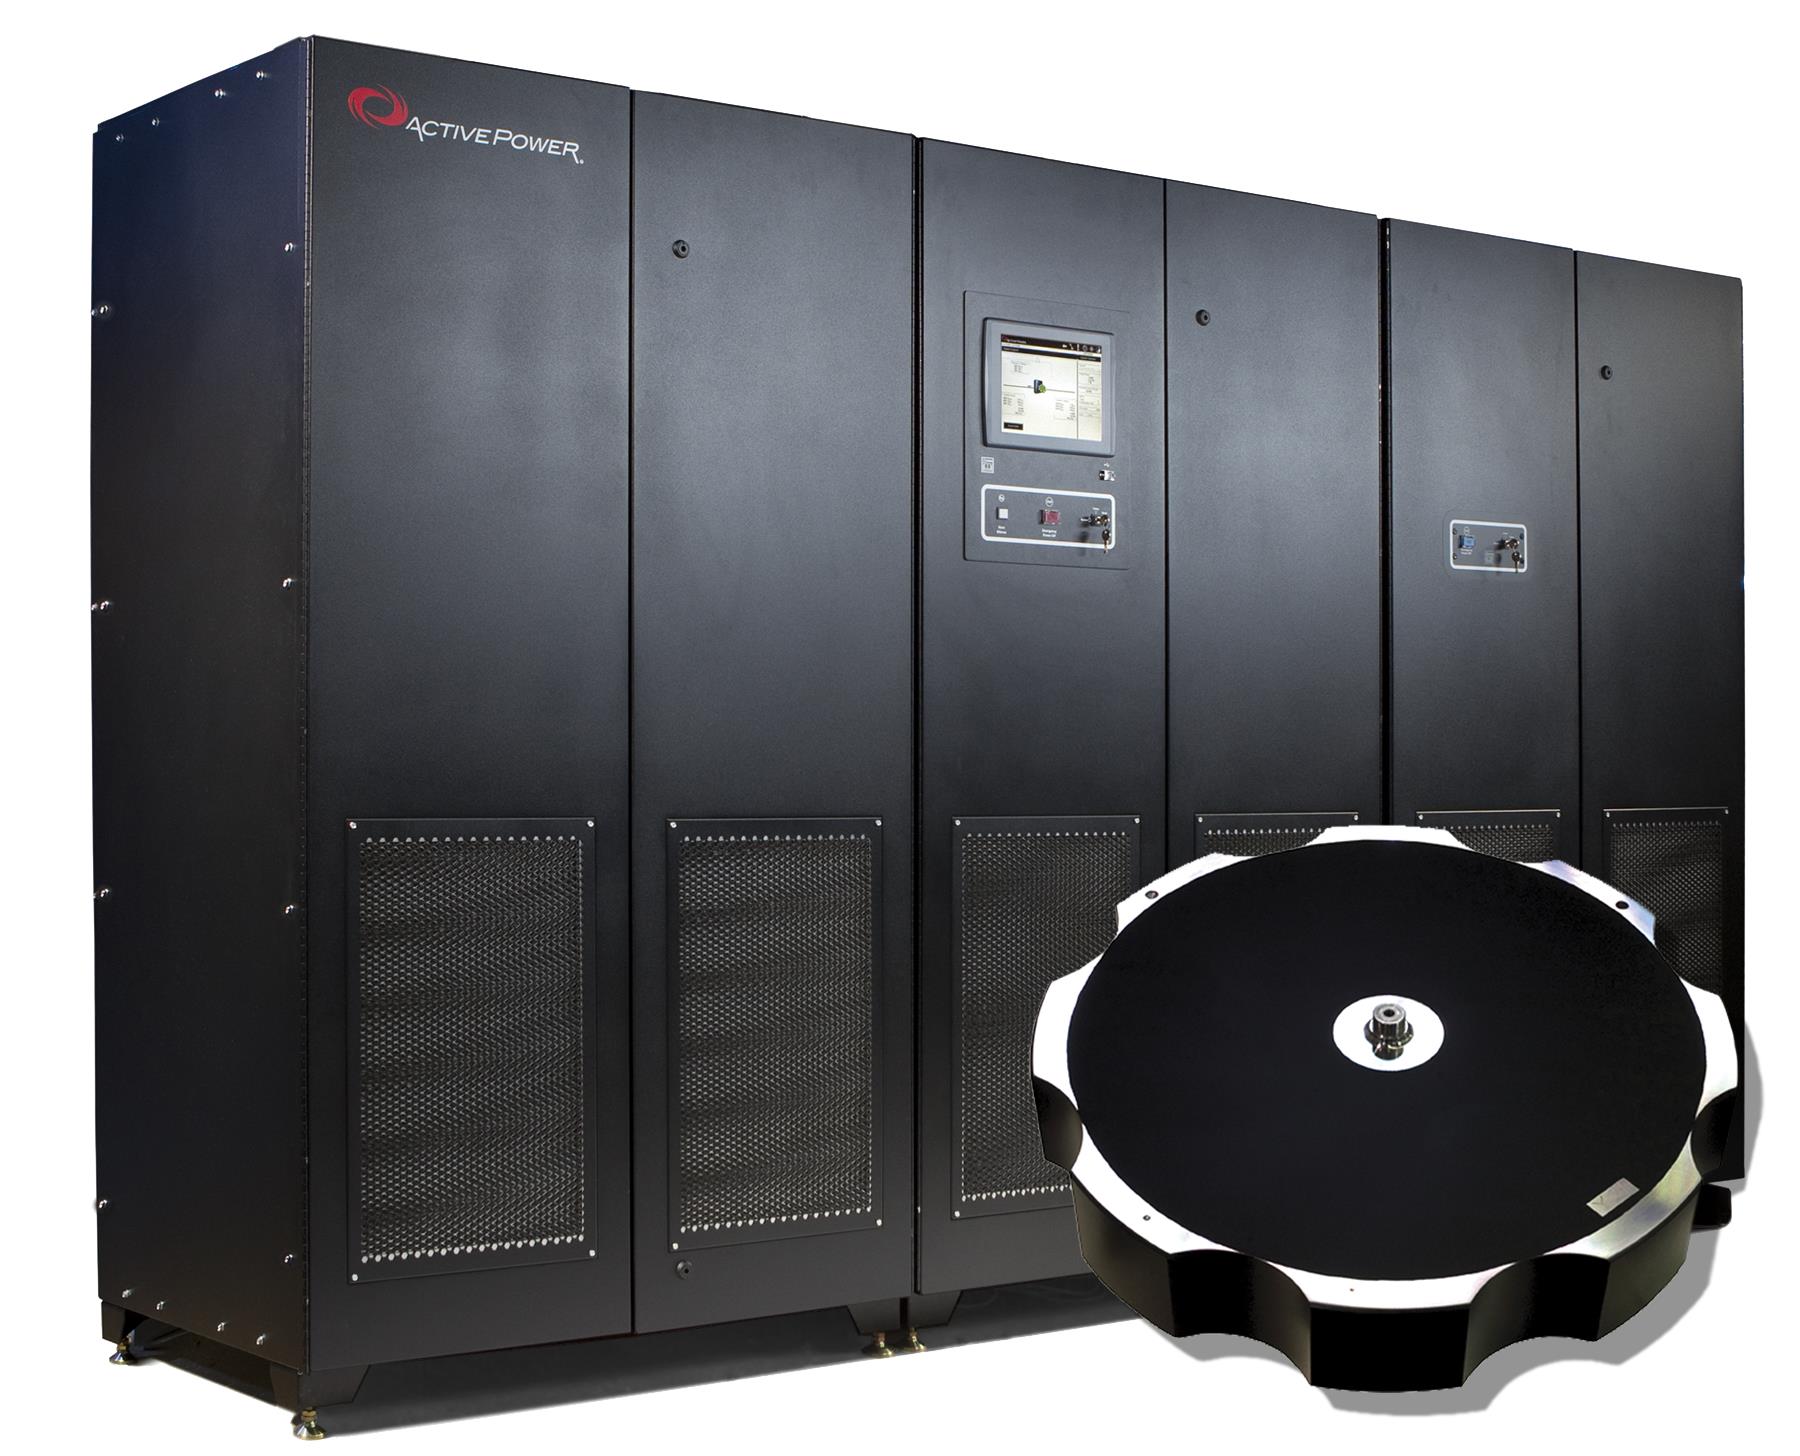
We market our flywheel-based UPS systems under the brand name CleanSource UPS rated at 300 kVA and 250 kVA for 480V and 400V applications, respectively. CleanSource UPS is a battery-free UPS system that integrates proprietary UPS electronics and our flywheel energy storage system into one compact cabinet lineup. We currently offer CleanSource UPS products in power configurations ranging up to 1.5 MVA (million volt ampere) with the ability to parallel these products to provide even more protected power.
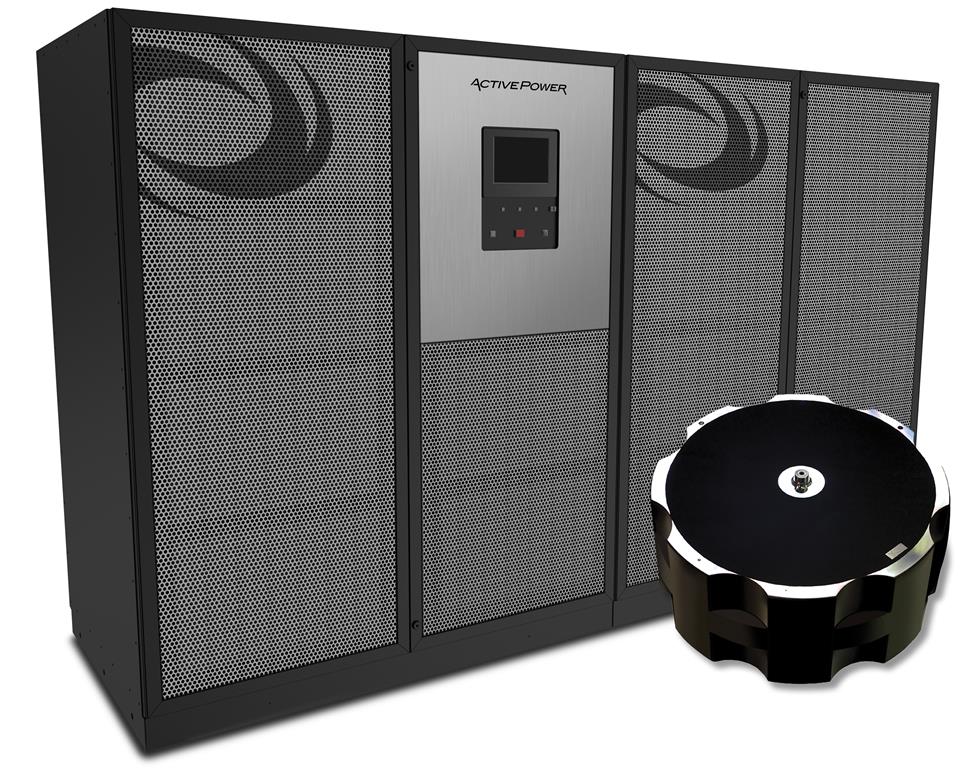
CleanSource HD UPS Series
In November 2012, we introduced our CleanSource 750/625HD UPS (see illustration below) which is available in standalone modules rated at 750 kVA and 625 kVA for 480V and 400V applications, respectively. This system is scalable and can be paralleled together to provide even more protected power. The product’s design allows for the use of auxiliary batteries in the event the customer requires extended, autonomous run time for certain applications. We believe CleanSource 750/625HD provides the reliability, power density, and total cost of ownership benefits that will make it a favorable complement to our existing products for large data center and other mission critical applications.
Our UPS products represented 57%, 37%, and 46% of total revenue in 2014, 2013, and 2012, respectively.
Modular Infrastructure Solutions (MIS)
CleanSource PowerHouse
For customers looking for a complete, integrated continuous power system, we package our CleanSource UPS along with switchboards and automatic transfer switch; monitoring and control systems; fire detection; lighting; security; and air conditioning into a fully integrated system. Due to the space efficiencies of our UPS products, we are able to offer all of these components in a pre-packaged containerized solution that we market under the brand name CleanSource PowerHouse (see illustration below). This solution offers customers the key benefits of our CleanSource UPS product line, including space efficiency and high operating temperature ranges compared to a legacy battery-based UPS.

CleanSource PowerHouse is packaged in a purpose-built enclosure that can be deployed by customers indoors or outdoors, with size and features customized depending upon the customer’s power load requirements and local and national regulatory requirements. These systems are specifically designed to handle the demands of data centers and other mission critical applications requiring the highest power integrity available while maximizing uptime, useable floor space, and operational efficiency. Our systems are offered in eight standard modular power configurations that enable sizing for power (and cooling) infrastructure. CleanSource PowerHouse delivers significant value to customers as the entire system is integrated and tested prior to delivery for a repeatable and simple solution.
CleanSource PowerHouse is used to support a variety of applications including facility expansion, temporary critical power needs such as event support, disaster recovery, or to support a containerized data center.
In March 2013, we introduced a redesigned CleanSource PowerHouse product line that provides lower acquisition cost, faster time to deployment, and improved monitoring, controls, and analytics software versus a conventional data center electrical room.
Modular IT
To better serve our customers, we use our expertise in integration, containerization, and power distribution to manufacture containerized infrastructure solutions designed to specification for select business partners on a contract basis. Modular IT infrastructure solutions refer to the components of a containerized data center. These modular IT products can include an outer shell and outfitting the interior of the enclosure with electrical, cooling, and monitoring components. Our clients then add IT equipment including servers and racks, resulting in a self-contained modular data center that our partners deliver to end users. Modular IT systems may be rapidly deployed with CleanSource PowerHouse as a cost-effective alternative to traditional data center construction.
Our products are designed to perform well in harsh environments where power quality or reliability are particularly poor, which makes them a good fit for countries with poor power infrastructure; in harsh manufacturing or process environments; or situations where reliability is paramount. Therefore, we have traditionally focused our direct sales efforts on these types of customer applications.
Our MIS products (CleanSource PowerHouse and modular IT) represented 17%, 35%, and 35% of total revenue in 2014, 2013, and 2012, respectively.
Service
We deliver worldwide customer support that offers clients assessment, implementation, and lifecycle support services for all Active Power products. Building a portfolio of services to work with clients through the lifecycle of their power assessment design and implementation process is a key element of our service growth strategy. We offer the following services to our clients:
| · | Deployment. Our experienced group of project managers will work with a client to develop a timely deployment schedule that avoids disrupting day-to-day business activity. We ensure expectations are clearly defined through the deployment phase; |
| · | Start-Up and Commissioning. Once the system is deployed, our team takes the system through a rigorous commissioning process to help ensure the system is working to specification. Our engineers work closely with the client’s team to make certain they are educated and trained on the successful operation of the system; |
| · | Service, Support and Monitoring. Clients can choose from a variety of comprehensive service and support offerings, tiered to match an organization’s internal capabilities and requirements. We also offer remote monitoring service through our headquarters in Austin, Texas, locally at the client’s facility, or as a combination offering; |
| · | Infrastructure Needs Assessment. We work locally through our global network of mission critical infrastructure engineers and project managers to assess the power and cooling needs of a client’s facility; |
| · | Vetting and Validation. Our teams of experienced application engineers use comprehensive assessments to vet and validate the optimal solution that complements a client’s business continuity plan; |
| · | Alignment with Business Objectives. Through continuous communication, our teams help ensure the solution accurately aligns with the original needs assessment and a client’s short-term and projected future business objectives; and |
| · | System Design. We design client solutions to ensure all components are optimized with a particular focus on reliability, efficiency, and cost effectiveness in determining the correct match and interoperability between components. |
Service revenues represented 26%, 28%, and 19% of our total revenue in 2014, 2013, and 2012, respectively.
UPS and MIS Market Drivers
We believe there are several market dynamics fueling the growth of the UPS and MIS markets and the need for power dense (less floor space is used), reliable, and low cost backup power. These include:
Increase in data usage and storage and in data center density:
| · | Growth of enterprise data, social networking sites, web-based applications, cloud computing, and other similar technologies requires data centers to invest in more IT and physical infrastructure equipment to support growth in use and storage requirements; |
| · | Additional IT and infrastructure requires more floor space; and |
| · | Enterprises’ need for more power density to accommodate IT equipment more efficiently within a given space. |
More awareness of energy efficiency from both a corporate social responsibility and financial perspective:
| · | More investment in highly efficient, sustainable technologies to keep electricity costs down and to stay competitive in the marketplace; |
| · | Customer preferences for clean, green technologies that do not contain toxic, harmful chemicals and avoid disposal costs associated with electro-chemical battery-based energy storage; |
| · | Government legislation like the United Kingdom Carbon Reduction Commitment Energy Scheme and other cap and trade programs are becoming more prominent to help control carbon emissions; and |
| · | Electricity costs are the single highest operating costs for many organizations due to the substantial amount of power needed to support data center facilities. |
Modular data centers are becoming more commonplace, not only for specific niche applications like military and high density computing environments:
| · | Colocation sites that house modular data centers are becoming more prevalent due to performance and tangible economic benefits; |
| · | Short lead times and rapid deployment capability due to use of factory built and tested systems are expected to increase demand for modular data center products, particularly for those organizations that do not have capital readily available to commit to building a brick and mortar facility; and |
| · | A modular design-build approach is a more capital efficient model that enables organizations to deploy IT and infrastructure as business and IT needs evolve, reducing underutilization. |
Customers focused on convenience and improving margins:
| · | More mission critical organizations are moving towards innovatively designed, turnkey data center and infrastructure solutions that involve less risk, cost, and complexity and more automation; and |
| · | Organizations want the ability to rapidly deploy IT and associated power and cooling infrastructure. |
Increase in global energy consumption:
| · | Rapid industrialization of highly populated world regions is increasing global energy demand and placing a premium on reliability of energy supply and sensitivity to loss of power; and |
| · | There is an increasing cost to produce and consume electricity due to depletion of finite fossil fuel sources, instability in oil-producing regions, and a preference for green energy sources. |
Increasing economic impact of a power interruption to users:
| · | The financial cost of a power interruption through loss of products, manufacturing down time, and computer processing interruptions; and |
| · | Reputational cost of a power interruption to businesses. |
Value Proposition
We believe our offerings deliver an unmatched combination of reliability, power density, and low total cost of ownership. The core differentiators for our products and solutions are the following:

| · | Proven to reduce failure risk by 80% versus legacy UPS |
| · | Unique patented design delivers predictable, consistent, and continuous operation |

| · | Superior power density: critical power delivered in about half the space of legacy UPS |
| · | Frees up more floor space for revenue generating equipment (i.e. IT equipment, etc.) |

| · | Lower operating expenses through superior energy efficiency, reduced cooling needs, lower maintenance costs, and no battery changes |
| · | Delivers up to 60% in total cost of ownership savings to customers |
Competition
We compete with two primary products: UPS products and MIS products.
UPS Products. Our CleanSource UPS products compete primarily against conventional battery-based UPS systems from vendors such as Emerson/Liebert, Eaton/Powerware, and APC/MGE. We also compete against rotary (battery-free) UPS systems from vendors such as Piller, Eurodiesel, and Hitec. For applications requiring less than one megawatt of critical load, we largely compete against battery-based competitors and for applications greater than one megawatt we tend to compete against rotary systems vendors. We believe there is greater market acceptance of battery-free solutions (such as flywheel and rotary) compared to battery-based solutions in the one-megawatt and higher power range, making this a very strong market for our CleanSource 750/625HD UPS. Several of the leading conventional UPS battery vendors offer flywheel-based energy storage in place of batteries. Vycon is the principal manufacturer of these flywheel systems.
Our primary basis of competition as compared to battery-based UPS systems is product differentiation and our advantages in reliability, power density (less floor space is used), and total cost of ownership.
Modular Infrastructure Solutions. We provide competitive offerings in both the modular power and modular IT infrastructure segments. There are a variety of competitors with similar capabilities including systems integrators and value added service providers who may procure system components and assemble custom solutions. We believe that we are one of only a few manufacturers in the world offering pre-packaged standard MIS solutions for quick delivery globally. Because of the significant up-front investment required, and the longer period between order and delivery relative to our UPS products, a significant increase in sales of our MIS products may materially increase the amount of working capital required to fund our operations.
The power density advantages we enjoy with our UPS products allow us to offer higher continuous power levels within the physical constraints of the containerized space compared to our battery-based competitors, which we believe is a barrier to entry for them. Our UPS products’ ability to operate in temperatures of up to 40 degrees Celsius in non-air -conditioned environments (such as a shell building or open-air facility) also acts as a competitive advantage for us compared to battery-based UPS systems which require sufficient air conditioning to operate.
We believe our experience with the power and cooling requirements of the infrastructure provides us with a competitive advantage in the design and manufacturing of these products compared to less experienced manufacturers. Further, the joint offering of our CleanSource PowerHouse with our modular IT solutions provides efficiencies, scale, and advantages in sales, marketing, and engineering we expect customers to find increasingly compelling.
Intellectual Property and Assets
We rely upon a combination of patents, trademarks, confidentiality agreements, and other contractual restrictions with employees and third parties to establish and protect our proprietary rights. Our general policy has been to seek patent protection for those inventions likely to be incorporated into our products or where obtaining such proprietary rights will improve our competitive position. We have filed many applications before the U.S. Patent and Trademark Office. We also seek patent protection abroad for our technology by filing patent applications in Europe and Asia. These efforts have resulted in a total of 116 active issued patents and pending applications worldwide.
We own the registered trademarks ACTIVE POWER and CLEANSOURCE in the United States and abroad. PowerHouse and the Active Power logo are trademarks of Active Power, Inc. All other trademarks, service marks, or trade names referred to in this report are the property of their respective owners.
Research and Development
We believe research and development efforts are essential to successfully delivering innovative products that address the current and emerging customer needs, particularly as power management/infrastructure needs evolve. Our research and development team works closely with our marketing and sales teams, IT channel partners, and OEMs to define product requirements that address specific customer needs. Our research and development expenses were $6.7 million, $7.4 million, and $5.4 million in 2014, 2013, and 2012, respectively. As of December 31, 2014, our research and development and engineering teams consisted of 30 engineers and technicians.
Manufacturing
We manufacture all of our UPS and our MIS products for customers in the Americas at our headquarters in Austin, Texas. We are an ISO 9001:2008 quality certified operation. We source the majority of our components from contract manufacturers to enhance our ability to scale operations and minimize costs. This approach allows us to respond quickly to customer orders while maintaining high quality standards and optimizing inventory levels.
We strive to continually improve inventory turns through effective sourcing plans and supplier relationship management programs. We also have Lean Six Sigma programs in place to help us identify and eliminate waste and drive efficiencies throughout the company.
Our internal manufacturing process consists of the fabrication of certain critical components within the flywheel energy storage system and the assembly, functional testing, and quality control of our finished products. We also test components, parts, and subassemblies obtained from contract manufacturers for quality control purposes.
We have entered into long-term agreements with some of our key suppliers, but we currently purchase most of our components on a purchase order basis. We are working to renew or establish more long-term agreements with our sole suppliers and other key vendors, using a rolling sales volume forecast to better ensure component availability. We use standard parts and components for our products where possible, and have developed multiple sources for some of our most critical components including the flywheel rotors. Lead times for ordering materials and components vary significantly and depend on factors such as specific supplier requirements, contract terms, production time required, and current market demand for such components or commodities.
We believe our current workforce, facilities, and inventory levels will be sufficient to handle our near-term projected sales demand. However, over time, we may need to hire additional manufacturing personnel to address sales volume increases.
Local Assembly
A key component of our strategy is to maintain a flexible operating model that allows us to perform local integration, assembly, and testing of certain MIS products. We perform this work either at company managed facilities or with local integration partners that have assembly, integration, and test resources. We also have a full complement of integration, assembly, and test capabilities at our Austin, Texas facility.
Environmental Regulation
We must comply with many different federal, state, local, and foreign governmental regulations related to the use, storage, discharge, and disposal of certain chemicals and gases used in our manufacturing processes. Our facilities have been designed to comply with these regulations and we believe our activities are conducted in material compliance with such regulations. Any changes in such regulations or in their enforcement could require us to acquire costly equipment or to incur other significant expenses to comply with environmental regulations. Any failure by us to adequately control the storage, use, discharge, and disposal of regulated substances could result in significant future liabilities. Increasing public attention has been focused on the environmental impact of manufacturing operations. While we have not experienced any material adverse effects on our operations from recently adopted environmental regulations, our business and results of operations could suffer if for any reason we fail to control the storage or use of, or to adequately restrict the discharge or disposal of, hazardous substances under present or future environmental regulations.
Backlog
Normally, our products are shipped and revenue is recognized within three to six months from the date of the order. Product revenue in any quarter is often dependent on orders booked and shipped throughout that quarter as historically our backlog has only provided a portion of the next quarter’s revenue. Service contracts, however, may extend for one or more years. We are attempting to increase the size of our backlog to promote greater efficiency in production, to facilitate business planning, and to improve revenue visibility. To support these efforts, we are working to drive consistent sales performance through targeted investing in and allocation of resources to our sales organization and distribution channels to build our backlog.
The dollar amount of backlog believed to be firm was approximately $26.7 million, and $14.0 million at December 31, 2014, and 2013, respectively. This increase in backlog is primarily due to the restructuring of our sales organization, a shift in our market approach, and reengagement with our OEM partner Caterpillar. Of the total backlog, approximately $5.4 million and $4.6 million at December 31, 2014, and 2013, respectively, was not expected to be filled in the following year. Backlog represents:
| · | anticipated revenue from unfulfilled product orders believed to be firm; and |
| · | service work not yet performed under signed contracts. |
Due to possible changes in product delivery schedules and the potential cancellation of unfulfilled product orders and service contracts, our backlog at any particular date should not be relied upon as being indicative of revenue for any succeeding period.
Employees
As of December 31, 2014, we had 204 total employees in the following areas:
| · | 30 in research and development; |
| · | 105 in manufacturing, sourcing, and service; |
| · | 43 in sales and marketing; and |
| · | 26 in administration, information technology, human resources, and finance. |
None of our employees are represented by a labor union. We have not experienced any work stoppages and consider our relations with our employees to be good.
Seasonality
Our business has experienced seasonal customer buying patterns for a number of years. In recent years, both UPS and MIS sales were weaker in the first calendar quarter of the year. We believe this pattern, which we attribute to annual capital budgeting procedures, will continue. We also have historically seen a decline in demand for our products in Europe in the summer months compared to other regions because of reduced corporate buying patterns during the vacation season.
Where You Can Find Other Information
Active Power is a Delaware corporation originally founded in 1992 as a Texas corporation. We file annual, quarterly, current, and other reports, proxy statements, and other information with the SEC pursuant to the Exchange Act. You may read and copy any materials the company files with the SEC at the SEC’s Public Reference Room at 100 F Street, N.E., Washington, D.C. 20549. You may obtain information on the operation of the SEC’s Public Reference Room by calling the SEC at 1-800-SEC-0330. The SEC maintains an Internet site that contains reports, proxy, and other information statements, and other information regarding issuers, including Active Power, that file electronically with the SEC. The address of that site is www.sec.gov.
We maintain a website at www.activepower.com. We make available free of charge through this site our Annual Report on Form 10-K, quarterly reports on Form 10-Q, current reports on Form 8-K, and amendments to those reports filed or furnished pursuant to Section 13(a) or 15(d) of the Exchange Act as soon as reasonably practical after we electronically file such material with, or furnish it to, the SEC. This information can be found in the Investor Relations section of our website. The website and the information contained therein or connected thereto are not intended to be incorporated in this Annual Report on Form 10-K.
Executive Officers of the Company
The following table sets forth certain biographical information concerning our current executive officers:
|
Name
|
Age
|
Position(s)
|
||
|
Mark A. Ascolese
|
64
|
President and Chief Executive Officer
|
||
|
James A. Powers
|
53
|
Chief Financial Officer and Vice President Finance
|
||
|
Randall J. Adleman
|
57
|
Vice President of Global Sales and Marketing
|
Mark A. Ascolese became President and Chief Executive Officer of Active Power on October 14, 2013. Mr. Ascolese has more than 40 years of experience serving a variety of mission critical and energy markets, including data centers. Prior to joining Active Power, Mr. Ascolese first served as CEO and then as Executive Board Chairman of Power Analytics Corporation (now part of Causam Energy, Inc.), an electrical infrastructure enterprise software firm focused on the mission critical and smart grid markets. Mr. Ascolese was appointed CEO of Power Analytics in March 2008 where he recruited the organization’s management team and created and implemented a successful strategic plan, transitioning the firm from a family owned company to a professionally managed business. In August 2012, Mr. Ascolese was appointed Executive Board Chairman at Power Analytics and served in this role prior to joining Active Power in October 2013. Previously, he served as President at Powerware Corporation (now part of Eaton Corporation) and in senior management positions at General Electric Company. From 2000 through 2002, Mr. Ascolese served as Senior Vice President of Business Development at Active Power during the company’s initial public offering. Mr. Ascolese earned a bachelor’s of Science in Commerce from the University of Louisville.
James A. Powers has served as Chief Financial Officer and Vice President of Active Power since December 4, 2013. As Chief Financial Officer, Vice President of Finance, he oversees all accounting, finance, treasury, and investor relations activities, as well as the company’s IT organization. From May 2013 until he joined Active Power, he served as Senior Vice President of Finance of the U.S. Windows and Doors division of Ply Gem Industries, Inc., a North American manufacturer of exterior building products. In this role, he managed the finance and IT organizations, leading all accounting, forecasting, budgeting, reporting, business analysis, internal controls, and working capital management activities. From May 2006 through May 2013, Mr. Powers served in various executive finance positions at Xerium Technologies Inc., a global manufacturer and supplier of consumable products and services used in various industries. From January 2011 through May 2013, he served as Vice President and Global Controller where he managed all corporate controllership functions, including SEC reporting and board financial reporting and analysis. From June 2008 through December 2010, Mr. Powers was Vice President of Finance, North America, at Xerium where he directed a broad range of financial functions. Prior to 2006, Mr. Powers served in various executive finance positions for international electrical equipment manufacturing businesses within Invensys Group PLC and ABB Ltd. Mr. Powers received a bachelor’s of Science in Accounting from the State of University of New York at Albany.
Randall J. Adleman joined Active Power on November 18, 2013, as Vice President of Global Sales and Marketing. In this role, he has overall responsibility for the company’s global sales and marketing organizations. From March 2010 until he joined Active Power, Mr. Adleman served as Vice President of Sales and Marketing for Valence Technology, Inc., a global manufacturer of lithium-ion energy storage solutions. There, he directed all worldwide sales and marketing efforts for the company’s motive, backup, industrial, and marine segments. Valence Technology filed a voluntary petition for chapter 11 business reorganization in the U.S. Bankruptcy Court for the Western District of Texas on July 12, 2012, during Mr. Adleman’s tenure as an executive officer. The U.S. Bankruptcy Court for the Western District of Texas approved the company’s exit from chapter 11 on November 13, 2013. Prior to that position, Mr. Adleman held various sales, marketing, and service leadership positions, including having founded and served as Principal at Fords Barron Advisership, a corporate consultancy focused on sales force effectiveness. Mr. Adleman holds an undergraduate degree from Colgate University and a master’s in Business Administration with a concentration in Marketing from Fairleigh Dickinson University.
You should carefully consider the risks described below before making a decision to invest in our common stock or in evaluating Active Power and our business. The risks and uncertainties described below are not the only ones we face. Additional risks and uncertainties that we do not presently know, or that we currently view as immaterial, may also impair our business operations.
This Form 10-K contains forward-looking statements that involve risks and uncertainties. Our results could materially differ from those anticipated in these forward-looking statements as a result of certain factors, including the risks described below and elsewhere. See “Special Note Regarding Forward-Looking Statements.”
Risks Related to our Business
We have a history of significant operating losses.
We have incurred annual operating losses each year since our inception in 1992. Although we achieved operating profitability on a quarterly basis in the second quarter of 2012, we have not been able to sustain this and achieve quarterly or annual operating profitability since then. As of December 31, 2014, we had an accumulated deficit of $284.0 million. To date, we have funded our operations principally through the public and private sales of our stock, from borrowings under our credit facilities, from product and service revenue, and from development funding. We will need to generate significant additional revenue while maintaining our current margins to achieve annual profitability, and we cannot assure you that we will ever realize such revenue levels or achieve profitability on a consistent basis.
If our revenues do not meet our expectations, our costs exceed our estimates, or our working capital needs are greater than anticipated, we may not have adequate liquidity to continue operating our business. Our cash requirements will depend on many factors, including:
| · | future sales growth; |
| · | the demand for our products; |
| · | the gross profit we are able to generate from our sales; |
| · | the timing, level, and extent of our research and development funding; |
| · | the rate of expansion of our sales and marketing activities; |
| · | the rate of expansion of our manufacturing processes; |
| · | our overall level of operating expenses; |
| · | the payment terms we negotiate with our suppliers; and |
| · | our default rates on receivables. |
A substantial increase in sales of our MIS solutions or a substantial increase in UPS sales may materially impact the amount of working capital required to fund our operations. In order to increase our MIS sales, we may be required to make larger investments in inventory and to increase the amount of our outstanding receivables. These larger investments may require us to obtain additional sources of working capital, debt, or equity financing in order to fund our business. Even if we obtain additional debt financing, a substantial portion of our operating cash flow may be dedicated to the payment of principal and interest on such indebtedness.
A significant increase in sales of our MIS products may materially increase the amount of working capital required to fund our operations.
Because of the significant up-front investment required, and the longer period between order and delivery relative to our UPS products, a significant increase in sales of our MIS products may materially increase the amount of working capital required to fund our operations. The amount of time between the receipt of payment from our customers and our expenditures for raw materials, manufacturing, and shipment of products (the cash cycle) for MIS sales can be as much as 210 days, depending on customer payment terms. If we experience a substantial increase in the size or number of MIS orders, we may need to obtain additional sources of working capital, debt, or equity financing to fund the business. If we are unsuccessful at obtaining additional sources of working capital, we may be required to curtail our level of MIS sales or we may lose potential customers, either of which may adversely impact our results of operations.
We may need additional capital in the future, and it may not be available to us on favorable terms, or at all.
We have historically relied on outside financing and cash flow from operations to fund our operating losses, operations, capital expenditures, and expansion. We may require additional capital from equity or debt financing in the future to fund our operations or respond to competitive pressures or strategic opportunities. We may not be able to secure timely additional financing on favorable terms, or at all. The terms of any additional financing may place limits on our financial and operating flexibility. If we are unable to obtain adequate financing or financing on terms satisfactory to us, if and when we require it, our ability to grow or support our business and to respond to business challenges could be significantly limited. We do not know whether we will be able to secure additional funding, or funding on terms acceptable to us, to continue our operations as planned. If financing is not available, we may be required to reduce, delay, or eliminate certain activities or to license or sell to others some of our proprietary technology.
Our reliance on large and complex system solutions and customer concentration may adversely affect our ability to accurately predict the timing of revenues and to meet short-term expectations of operating results.
Our reliance on large and complex system solutions means that we must devote substantial effort and time to complete sales to customers. Further, a large portion of our quarterly revenue is derived from relatively few large transactions with relatively few customers. For example, in 2014 and 2013, our three largest customers contributed 30% and 45% of our revenue, respectively. Any delay in completing these large sales transactions or any reduction in the number of customers or large transactions, may result in significant adverse fluctuations in our quarterly revenue. Further, we use anticipated revenues to establish our operating budgets and a large portion of our expenses, particularly rent and salaries are fixed in the short term. As a result, any shortfall or delay in revenue could result in increased losses and would likely cause our operating results to be below public expectations. The occurrence of any of these events would likely materially adversely affect our results of operations.
Our business may be affected by general economic conditions and uncertainty that may cause customers to defer or cancel sales commitments previously made to us.
Any future economic uncertainty in the United States or certain international markets may lead to an economic recession or lower capital spending and credit availability in some or all of the markets in which we operate. A recession or even the risk of a potential recession or uneven economic growth conditions may be sufficient reason for customers to delay, defer, or cancel purchase decisions, including decisions previously made. This risk is magnified for capital goods purchases such as UPS and MIS products that we supply. Although we believe that our competitive advantage and our efforts to broaden the number of different markets in which we sell may help mitigate the economic risk associated with any one country or market vertical, any customer delays or cancellation in sales orders could materially adversely affect our level of revenues and operating results.
Our business could be impacted by customer credit risk on receivables.
Most of our sales are on an open credit basis. Our failure to collect receivables from any of our customers in a timely manner could have a significant adverse effect on our liquidity. The collection risk may potentially increase if we sell a higher proportion of MIS, such as our CleanSource PowerHouse products, due to their higher average selling price. If future actual default rates on receivables differ from those currently anticipated, our working capital could decrease and we may not have adequate liquidity to continue operating our business.
Our financial results may vary significantly from quarter to quarter.
Our product revenue, operating expenses, and quarterly operating results have varied in the past and may fluctuate significantly from quarter to quarter in the future due to a variety of factors, many of which are outside of our control. As a result, you should not rely on our operating results during any particular quarter as an indication of our future performance in any quarterly period or fiscal year. The factors which may affect our business include, among others:
| · | timing of orders from our customers and the possibility that customers may change their order requirements with little or no notice to us; |
| · | demand for of our flywheel-based energy storage system as an alternative to lead-acid batteries and our continuous power and infrastructure solutions; |
| · | ongoing need for short-term power outage protection in traditional UPS systems; |
| · | deferral of customer orders in anticipation of new products from us or other providers of power quality systems; |
| · | our order backlog may not increase and does not always result in revenue; |
| · | limited visibility into customer spending plans; |
| · | timing of deferred revenue components associated with large orders; |
| · | ability to manage capital requirements associated with large orders; |
| · | timing and execution of our new product introductions; |
| · | new product releases, licensing, or pricing decisions by our competitors; |
| · | commodity and raw material component prices; |
| · | ability to adjust our cost structure in response to reductions in income; |
| · | loss of a significant customer or distributor; |
| · | impact of changes to our product distribution strategy and pricing policies; |
| · | failure to achieve our anticipated revenue growth rate; |
| · | impact of changes to our product distribution strategy and pricing policies of our distributors; |
| · | changes in product mix; |
| · | fluctuations in currency exchange rates; |
| · | changes in the mix of domestic and international sales; |
| · | rate of market growth for our products; and |
| · | acceptance of our latest generation UPS product in the marketplace. |
The market for power quality products is evolving and it is difficult to predict its potential size or future growth rate. Most of the organizations that may purchase our products have invested substantial resources in their existing power systems and, as a result, have been reluctant or slow to adopt a new technology, particularly during a period of reduced capital expenditures. Moreover, our current products are alternatives to traditional battery-based UPS systems and may never be accepted by our customers or may be made obsolete by other advances in power quality technologies.
Significant portions of our expenses are not variable in the short term and cannot be quickly reduced to respond to decreases in revenue. Therefore, if our revenue is below our expectations, our operating results are likely to be adversely and disproportionately affected. In addition, we may change our prices; modify our distribution strategy and policies; accelerate our investment in research and development; or shift our sales and marketing efforts in response to competitive pressures or to pursue new market opportunities. Any one of these activities may further limit our ability to adjust spending in response to revenue fluctuations. We use forecasted revenue to establish our expense budget. Because most of our expenses are fixed in the short term or incurred in advance of anticipated revenue, any shortfall in revenue may result in significant losses.
We derive a substantial portion of our revenues from international markets and plan to continue to expand such efforts, which subjects us to additional business risks including increased logistical and financial complexity, managing internal controls and processes, political instability, and currency fluctuations.
The percentage of our total revenue derived from customers located outside of North America was 42%, 20%, and 40% in 2014, 2013, and 2012, respectively. Our international operations are subject to a number of risks, including:
| · | foreign laws and business practices that favor local competition; |
| · | dependence on local channel partners; |
| · | compliance with multiple, conflicting, and changing government laws and regulations; |
| · | longer cash cycles; |
| · | difficulties in managing and staffing foreign operations; |
| · | foreign currency exchange rate fluctuations and the associated effects on product demand and timing of payment; |
| · | political and economic stability, particularly in the Middle East and Africa; |
| · | greater difficulty in the contracting and shipping process and in accounts receivable collection including longer collection periods; |
| · | ability to fund working capital requirements; |
| · | greater difficulty in hiring qualified technical sales and application engineers; and |
| · | difficulties with financial reporting in foreign countries. |
To date, the majority of our sales to international customers and purchases of components from international suppliers have been denominated in U.S. dollars, Euros, and British Pounds. All of our UPS products are manufactured in the U.S. and then sold to our foreign subsidiaries and customers, normally in U.S. dollars. An increase in the value of the U.S. dollar relative to foreign currencies could make our products more expensive for our international customers to purchase, thus rendering our products less competitive. We also source the non-UPS components for our modular power infrastructure products locally where possible and pay for these components in local currencies as a way to mitigate the impact of fluctuations in foreign currencies and lessen the impact of any unfavorable fluctuations with the U.S. dollar. We and many of our subsidiaries sell products outside of the country of incorporation, and often in foreign currencies. To the extent we record sales in other than our local currency; this can result in translation gains and losses. Currently, we do not engage in hedging activities for our international operations to offset this currency risk. However, we may engage in hedging activities in the future.
We are subject to risks relating to product concentration and lack of revenue diversification.
We derive a substantial portion of our revenue from a limited number of products, particularly from our CleanSource 300/250 Series UPS product family. These UPS products are also an integral component of our CleanSource PowerHouse products. We expect these products to continue to account for a large percentage of our revenues in the near term. Continued market acceptance of these products is therefore critical to our future success.
Our future success will also depend on our ability to reduce our dependence on these few products by developing and introducing new products and product or feature enhancements in a timely manner. Specifically, our ability to capture significant market share depends on our ability to develop and market extensions to our existing product lines at higher and lower power range offerings and as containerized solutions. We are currently investing significant amounts in our UPS and MIS products to broaden our product portfolio. Even if we are able to develop and commercially introduce new products and enhancements, they may not achieve market acceptance and the revenue generated from these new products and enhancements may not offset the costs, which would substantially impair our revenue, profitability, and overall financial prospects. Successful product development and market acceptance of our existing and future products depend on a number of factors, including:
| · | changing requirements of customers; |
| · | accurate prediction of market and technical requirements; |
| · | timely completion and introduction of new designs; |
| · | quality, price, and performance of our products; |
| · | availability, quality, price, and performance of competing products and technologies; |
| · | our customer service and support capabilities and responsiveness; |
| · | successful development of our relationships with existing and potential customers; and |
| · | changes in technology, industry standards, or end-user preferences. |
We must expand our distribution channels and manage our existing and new product distribution relationships to grow our business.
The future growth of our business will depend on our ability to expand our existing relationships with distributors; to identify and develop additional channels for the distribution and sale of our products; and to manage these relationships. As part of our growth strategy, we may expand our relationships with distributors and develop relationships with new distributors. We will also look to identify and develop new relationships with additional third parties that could serve as outlets for our products, or provide additional opportunities for our existing sales channels, such as the relationships we have developed with IT hardware manufacturers such as HP. Our inability to execute this strategy successfully and to integrate and manage our existing OEM channel partners and our new distributors and manufacturer’s representatives would likely impede our future growth.
Our backlog may not result in revenue.
Our backlog is not necessarily a meaningful predictor of future results. Backlog represents anticipated revenue from unfulfilled product orders and from service work not yet performed under signed contracts. Due to possible changes in product delivery schedules and the potential for cancellation of unfulfilled product orders and service contracts by our customers, our backlog at any particular date should not be relied upon as being indicative of revenue for any succeeding period. Time periods from receipt of an order to shipment date and installation vary widely, and may be determined by a number of factors, including the terms of the customer contract and the customer’s deployment plan. The value of service contracts included in backlog could cover services extending one or more years into the future. The size of an order or the scope of a service contract can be reduced significantly during the course of a project. If the scope of an order or contract is revised or an order or contract is cancelled, we adjust backlog accordingly. Also, some of the orders we accept from customers require certain conditions or contingencies to be satisfied prior to shipment or prior to commissioning or installation, some of which are outside of our control and some of which may not be satisfied. For these and other reasons, we may not fully realize our entire backlog as revenue.
We must continue to hire and retain skilled personnel.
We believe our future success will depend upon our ability to attract, motivate, and retain highly skilled managerial, engineering, sales, and product marketing personnel. There is a limited supply of skilled employees in the power quality marketplace. Our small size relative to our competitors, our history of significant operating losses and our lack of brand equity, particularly in foreign markets, makes it very difficult for us to attract new personnel. If we are unable to attract the new personnel we desire, retain personnel we currently employ, or if we are unable to replace departing employees quickly, our operations and new product development may suffer.
We are significantly dependent on our relationships with Caterpillar and Hewlett Packard. If these relationships are unsuccessful, for whatever reason, our business and financial prospects would likely suffer.
Caterpillar, together with its dealer network, is our primary OEM customer and the single largest customer for our flywheel-based UPS products. Caterpillar accounted for 18%, 14%, and 13% of our revenue in 2014, 2013, and 2012, respectively. HP is our largest IT channel partner and accounted for 1%, 22%, and 35% of our revenue in 2014, 2013, and 2012, respectively. A number of factors could cause these customers to cancel or defer orders, including interruptions to their operations due to a downturn in their industries; delays or changes in their product offerings; securing other sources for the products we manufacture; or developing such products internally. If our relationships with Caterpillar or HP are not successful or suffer a material adverse change, such as a material reduction in the level of orders due to an inability to win customer projects or other factors outside of our control; or their failure to pay us on a timely basis, our business and operating results would suffer unless we are able to replace these revenues from another source or sources in a timely manner.
We have underutilized manufacturing capacity and have no experience manufacturing our products in large quantities.
In 2001, we leased and equipped a 127,000 square foot facility used for manufacturing and testing of our three-phase product line, including our UPS and energy storage products. To be financially successful and to fully utilize the capacity of our facility and allocate its associated overhead, we must achieve significantly higher sales volumes. We must accomplish this while also preserving the quality levels we achieved when manufacturing these products in more limited quantities. To date, we have not been successful at increasing our sales volume to a level that fully utilizes the capacity of the facility and we may never increase our sales volume to necessary levels. If we do not reach these necessary sales volume levels, or if we cannot sell our products at our suggested prices, our ability to reach profitability on a quarterly or annual basis would be adversely impacted.
Achieving the necessary production levels to absorb the capacity of our manufacturing facility efficiently presents a number of technological and engineering challenges for us. We have not previously manufactured our products in high volume. We do not know whether or when we will be able to develop efficient, low-cost manufacturing capability and processes that will enable us to meet the quality, price, engineering, design, and product standards or production volumes required to manufacture large quantities of our products successfully. Even if we are successful in developing our manufacturing capability and processes, we do not know whether we will do so in time to meet our product commercialization objectives or to satisfy the requirements of our customers.
We must build quality products to ensure acceptance of our products.
The market perception of our products and related acceptance of such products is highly dependent upon the quality and reliability of the products we build. Any quality problems attributable to our UPS or MIS product lines may substantially impair our revenue and operating results. Moreover, quality problems for our product lines could cause us to delay or cease shipments of products or have to recall or field upgrade products, thus adversely affecting our ability to meet revenue or cost targets. In addition, while we seek to limit our liability as a result of product failure or defects through warranty and other limitations, if one of our products fails, a customer could suffer a significant loss and seek to hold us responsible for that loss and our reputation with other current or potential customers would likely suffer.
Seasonality may contribute to fluctuations in our quarterly operating results.
Historically, our business has experienced seasonal customer buying patterns. In recent years, our business has generally experienced relatively weaker demand in the first calendar quarter of the year. We believe this pattern, which we attribute to annual capital budgeting procedures, may possibly continue. In addition, we anticipate demand for our products in Europe may decline in the summer months, compared to other regions, because of reduced corporate buying patterns during the vacation season.
We depend on sole and limited source suppliers and outsource selected component manufacturing.
We purchase some of our critical component parts from sole source and limited source suppliers. If our suppliers receive excess demand for their products, we may receive a low priority for order fulfillment as large volume customers may receive priority that may result in delays in our acquiring components. A delay in acquiring components for our products may delay the manufacture and shipment of our products. Some of these delays may be substantial. As a result, we may purchase critical long-lead time or single-sourced components in large quantities to help protect our ability to deliver finished products on time. If we overestimate our component requirements, we may have excess inventory, which will increase our costs. If we underestimate our component requirements, we will have inadequate inventory, which will delay our manufacturing and render us unable to deliver products to customers on scheduled delivery dates. If we are unable to obtain a component from a supplier or if the price of a component has increased substantially, we may be required to manufacture the component internally, which will also result in delays or we may be required to absorb price increases. Manufacturing delays could negatively impact our ability to sell our products and could damage our customer relationships.
To assure the availability of our products to our customers, we outsource the manufacturing of selected components prior to the receipt of purchase orders from customers based on their forecasts of their product needs and internal product sales revenue forecasts. However, these forecasts do not represent binding purchase commitments from our customers. We do not recognize revenue for such products until we receive an order from the customer and the product is shipped to the customer. As a result, we incur inventory and manufacturing costs in advance of anticipated revenue. As demand for our products may not materialize, this product delivery method subjects us to increased risks of high inventory carrying costs, obsolescence and excess, and may increase our operating costs. In addition, we may from time to time make design changes to our products, which could lead to obsolescence of inventory.
Our manufacturing operations are concentrated in a small number of nearby facilities.
All of our UPS systems and our MIS products for customers in the Americas are manufactured in our Austin, Texas facility. Our manufacturing, research and development, and administrative activities are concentrated in two nearby facilities. If, for any reason, including as a result of a natural disaster, act of terrorism, or other similar event, either of these facilities should be damaged or destroyed or become inoperable or inaccessible, our ability to conduct our business could be adversely affected or interrupted entirely.
We face significant competition from other companies.
The markets for power quality and power reliability systems are intensely competitive. There are many companies engaged in all areas of traditional and alternative UPS and backup power systems in the U.S. and abroad, including, among others, major electric and specialized electronics firms, as well as universities, research institutions, and foreign government-sponsored companies. There are many companies that are developing flywheel-based energy storage systems and flywheel-based power quality systems. We may face future competition from companies that are developing other types of emerging power technologies, such as advanced new battery chemistries, high-speed composite flywheels, ultra capacitors, and superconducting magnetic energy storage.
Many of our current and potential competitors have longer operating histories, significantly greater financial, technical, service, marketing, and other resources, broader name and brand recognition, and a larger installed base of customers. As a result, these competitors may have greater credibility with our existing and potential customers and greater service infrastructure than we do. Given our current production volumes and lack of strategic supplier management programs, we may receive less favorable pricing from our suppliers than some of our larger competitors. Our competitors may be able to adopt more aggressive pricing policies and devote greater resources to the development, promotion, and sale of their products than we can, which would allow them to respond more quickly than us to new or emerging technologies or changes in customer requirements.
In addition, some of our current and potential competitors have established supplier or joint development relationships with our current or potential customers. These competitors may be able to use their existing relationships to discourage these customers from purchasing products from us or to persuade them to replace our products with their products. Increased competition could decrease our prices, reduce our sales, lower our margins, or decrease our market share. These and other competitive pressures could prevent us from competing successfully against current or future competitors and could materially harm our business.
We may be unable to protect our intellectual property and proprietary rights.
We expect future technological advancements made by us will be critical to achieving and sustaining market acceptance of our products. We rely on a combination of patent, copyright, trademark, and trade secret laws and restrictions on disclosure to protect our intellectual property rights. We also enter into confidentiality or license agreements with our employees, consultants, and business partners and control access to and distribution of our software, documentation, and other proprietary information.
Despite these efforts, unauthorized parties may attempt to copy or otherwise obtain and use our products or technology. Monitoring unauthorized use of our products is difficult, and we cannot be certain the steps we have taken will prevent unauthorized use of our technology, particularly in foreign countries where applicable laws may not protect our proprietary rights as fully as in the U.S. In addition, the measures we undertake may not be sufficient to protect our proprietary technology adequately and may not preclude competitors from independently developing products with functionality or features similar to those of our products. We believe that our success depends more on the knowledge, passion, experience and technological expertise of our employees than on the legal protection that our patents and other proprietary rights might afford.
We may be subject to claims by others that we infringe on their proprietary technology.
In recent years, there has been significant litigation in the U.S. involving patents, trademarks, and other intellectual property rights. We may become involved in litigation in the future to protect our intellectual property or defend allegations of infringement asserted by others. Legal proceedings could subject us to significant liability for damages or invalidate our intellectual property rights. Any litigation, regardless of its merits or its outcome, would likely be time consuming and expensive to resolve and would divert management’s time and attention. Any potential intellectual property litigation also could force us to take specific actions, including:
| · | cease selling our products that use the challenged intellectual property; |
| · | obtain from the owner of the infringed intellectual property right a license to sell or use the relevant technology or trademark, which license may not be available on reasonable terms, or at all; |
| · | redesign those products that use infringing intellectual property; or |
| · | cease to use an infringing trademark. |
Our involvement in any such litigation may cause us to incur unexpected litigation costs, require modifications to or limit our ability to sell our products, and adversely impact our business and reputation.
Our internal control over financial reporting may not prevent or detect misstatements because of its inherent limitations.
Pursuant to the Sarbanes-Oxley Act of 2002, we are required to provide a report by management on our internal control over financial reporting, including management’s assessment of the effectiveness of such control. Internal control over financial reporting may not prevent or detect misstatements because of its inherent limitations, including the possibility of human error, the circumvention or overriding of controls, or fraud. Therefore, even effective internal controls can provide only reasonable assurance with respect to the preparation and fair presentation of financial statements. In addition, projections of any evaluation of effectiveness of our internal control over financial reporting to future periods are subject to the risk that the control may become inadequate because of changes in conditions, or that the degree of compliance with the policies or procedures may deteriorate. If we fail to maintain the adequacy of our internal controls, including any failure to implement required new or improved controls, or if we experience difficulties in their implementation, our business and operating results could be harmed and we could fail to meet our reporting obligations.
A material weakness or other control deficiency could result in errors in our reported results and could have a material adverse effect on our operations.
A material weakness is a control deficiency or combination of control deficiencies, such that there is a reasonable possibility that a material misstatement of annual or interim financial statements will not be prevented or detected. In 2013, our management identified a material weakness resulting from control deficiencies related to our credit approval process whereby we did not confirm information from an employee of ours in China regarding the facts surrounding Qiyuan, a distributor with which we entered into a distribution agreement.
In response to such material weakness, management implemented additional credit approval process procedures including actions to further verify the financial condition and ownership structure of all new customers. The material weakness was remediated as of December 31, 2013. Any further material weakness or unsuccessful remediation could adversely impact investor confidence in the accuracy and completeness of our financial statements. As a result, our ability to obtain any additional financing could be materially and adversely affected, which in turn could materially and adversely affect our business and our financial condition. In addition, perceptions of us among customers, lenders, investors, securities analysts, and others could also be adversely affected. We can give no assurances the measures we have taken to date, or any future measures we may take, will prevent or remediate any additional material weaknesses in the future.
Our pending legal matters have increased our costs and could result in fines and penalties.
We are involved in ongoing legal matters as described in the section below titled “Legal Proceedings.” These matters may harm our business and liquidity in the future. We have incurred and expect to continue to incur substantial expenses for legal and accounting services related to such matters. These matters have also required significant time and attention from our management. At this point, we remain unable to predict the duration, scope, or results of the pending SEC investigation. In connection with our pending legal matters, including any further litigation that may be pursued, we may incur defense costs that may exceed our insurance coverage. We may also incur costs if the insurers of our directors and officers and our liability insurers deny coverage for the costs and expenses related to any litigation. Adverse outcomes or other developments during the course of such matters may harm our business, financial condition, results of operations, or liquidity.
Cybersecurity incidents could disrupt business operations, result in loss of critical and confidential information, and adversely impact our reputation and results of operation.
Global cybersecurity threats can range from uncoordinated individual attempts to gain unauthorized access to our information technology (IT) systems to sophisticated and targeted measures known as advanced persistent threats. While we employ comprehensive measures to prevent, detect, address, and mitigate these threats (including access controls, data encryption, vulnerability assessments, continuous monitoring of our IT networks, and systems and maintenance of backup and protective systems), cybersecurity incidents, depending on their nature and scope, could potentially result in the misappropriation, destruction, corruption, or unavailability of critical data and confidential or proprietary information (our own or that of third parties) and the disruption of business operations. The potential consequences of a material cybersecurity incident include reputational damage; litigation with third parties; diminution in the value of our investment in research; development and engineering; and increased cybersecurity protection and remediation costs; which in turn could adversely affect our competitiveness and results of operations.
Tax matters could adversely impact our results of operations and financial condition.
We are subject to potential income tax and other taxes in the United States and in foreign jurisdictions. Our tax liabilities are affected by the amount of income we have in various jurisdictions and the amounts we charge in intercompany transactions for products, services, funding, and other items. We are subject to periodic tax audits in the United States and in other various jurisdictions. Tax authorities may disagree with our intercompany charges, cross-jurisdictional transfer pricing, or other matters and assess additional taxes. We assess the likelihood of adverse outcomes resulting from these examinations to determine the need for and adequacy of a provision for income taxes. However, the outcomes from these examinations could have an adverse effect on our provision for income taxes and cash tax liability. In addition, our income taxes and other tax liability in the future could be adversely affected by numerous factors including changes in tax laws, regulations, accounting principles, or interpretations thereof, which could adversely impact our results of operations and financial condition.
Risks Related to our Common Stock
We have anti-takeover provisions that could discourage, delay or prevent our acquisition.
Provisions of our certificate of incorporation and bylaws could have the effect of discouraging, delaying, or preventing a merger or acquisition that a stockholder may consider favorable. We also are subject to the anti-takeover laws of the State of Delaware, which may further discourage, delay, or prevent someone from acquiring or merging with us. In addition, our agreement with Caterpillar for the distribution of UPS products provides that Caterpillar may terminate the agreement in the event we are acquired or undergo a change in control. The possible loss of a significant customer could be a significant deterrent to possible acquirers and may substantially limit the number of possible acquirers. All of these factors may decrease the likelihood we would be acquired, which may depress the market price of our common stock.
The trading price of our common stock has been volatile and is likely to be volatile in the future.
Historically, the market price of our common stock has fluctuated significantly. In 2014, the sales price of our common stock ranged from $1.63 to $3.67 per share. In addition to the other risks described in the “Risk Factors” section of this Form 10-K, the market price of our common stock can be expected to fluctuate significantly in response to numerous other factors, many of which are beyond our control, including the following:
| · | actual or anticipated fluctuations in our operating results; |
| · | changes in financial estimates by securities analysts, any financial guidance we may provide, or our failure to perform in line with such estimates or guidance; |
| · | changes in market valuations of other technology companies, particularly those that sell products used in power quality systems; |
| · | announcements by us or our competitors of significant sales, technical innovations, acquisitions, strategic partnerships, joint ventures or capital commitments; |
| · | introduction of technologies or product enhancements that reduce the need for flywheel energy storage or modular infrastructure products; |
| · | our loss of one or more key OEM customers or channel partners; |
| · | an inability to expand our distribution channels successfully; |
| · | departures of key personnel; |
| · | our ability to obtain additional equity capital or borrowings under our credit agreement; |
| · | the outcome of our pending litigation and SEC investigation; and |
| · | changing external capital market conditions. |
If the market for technology stocks or the stock market in general experiences loss of investor confidence, the trading price of our common stock could decline for reasons unrelated to our business, operating results, or financial condition. The trading price of our common stock might also decline in reaction to events that affect other companies in our industry or the stock market generally even if these events do not directly affect us. Each of these factors, among others, could cause our stock price to decline.
We have not in the past and do not currently intend to pay cash dividends on our common stock.
We have never declared or paid any cash dividends on our common stock, and we do not expect to declare or pay any cash dividends on our common stock in the foreseeable future. Future cash dividends, if any, will be determined by our Board of Directors, in its discretion, based upon our earnings, financial condition, cash flow, capital resources, capital requirements, charter restrictions, contractual restrictions including those under our bank credit facility, and such other factors as our Board of Directors deems relevant.
None.
Our corporate headquarters facility is a 127,000 square foot building we lease in Austin, Texas. We lease this building pursuant to a lease agreement that expires in December 2016. Our manufacturing, administrative, information systems, sales and service groups currently utilize this facility.
Our engineering facility of approximately 12,150 square feet is also located in Austin, Texas and is leased pursuant to a lease agreement that expires in March 2016.
In addition to these properties, we lease facilities totaling 12,979 square feet in the United Kingdom, Germany and China for sales and service activities.
Our current manufacturing and test facilities located at our corporate headquarters can support a business volume significantly in excess of our current revenues primarily with the addition of direct labor only and no need for additional significant capital investment. We believe our existing facilities are adequate to meet our current needs and plans.
Refer to Footnote 6, “Contingencies,” of the condensed consolidated financial statements on pages 61 to 62 of this Form 10-K.
Not applicable.
PART II.
|
Market for Registrant’s Common Equity, Related Stockholder Matters and Issuer Purchases of Equity Securities.
|
Our common stock is traded on The NASDAQ Stock Market LLC under the symbol “ACPW.” The following table lists the high and low per share sales prices for our common stock as reported by The NASDAQ Stock Market LLC for the periods indicated:
|
High
|
Low
|
|||||||
|
2014
|
||||||||
|
Fourth Quarter
|
$
|
2.00
|
$
|
1.63
|
||||
|
Third Quarter
|
$
|
2.79
|
$
|
1.88
|
||||
|
Second Quarter
|
$
|
3.40
|
$
|
2.63
|
||||
|
First Quarter
|
$
|
3.67
|
$
|
3.15
|
||||
|
2013
|
||||||||
|
Fourth Quarter
|
$
|
3.38
|
$
|
2.81
|
||||
|
Third Quarter
|
$
|
4.32
|
$
|
2.83
|
||||
|
Second Quarter
|
$
|
4.77
|
$
|
4.09
|
||||
|
First Quarter
|
$
|
4.91
|
$
|
3.43
|
||||
As of February 25, 2015, there were 23,157,509 shares of our common stock outstanding held by 125 stockholders of record.
We have never declared or paid cash dividends on our capital stock. We currently intend to retain any earnings for use in our business and do not anticipate paying any cash dividends in the foreseeable future. Future dividends, if any, will be determined by our board of directors.
We did not repurchase any of our securities during 2014.
Please refer to "Item 12 - Security Ownership of Certain Beneficial Owners and Management and Related Stockholder Matters" in this Form 10-K for the information required by Item 201(d) of Regulation S-K with respect to securities authorized for issuance under our equity compensation plans at December 31, 2014.
Sale of Unregistered Securities
None.
Stock Performance Graph
The following stock performance graph and related information shall not be deemed “soliciting material” or “filed” with the SEC, nor shall such information be incorporated by reference into any future filing under the Securities Act or the Exchange Act of 1934.
The graph depicted below shows a comparison of cumulative total stockholder returns for an investment in our common stock, The NASDAQ Stock Market (US) Composite Index, and a peer group of power technology companies having similar market capitalizations.
COMPARISON OF CUMULATIVE TOTAL RETURN
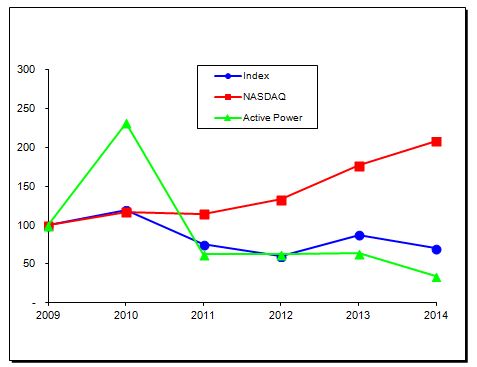
|
(1)
|
The Power Index peer group consists of an equal weighting of the following companies, all traded on The NASDAQ Stock Market: Active Power, Inc. (ACPW), Capstone Turbine, Inc. (CPST), FuelCell Energy, Inc. (FCEL), Maxwell Technologies (MXWL), and PowerSecure (POWR).
|
|
(2)
|
The graph covers the period from December 31, 2009, the last trading day before the beginning of our six preceding fiscal years, through December 30, 2014, the last trading day of our most recently completed fiscal year.
|
|
(3)
|
The graph assumes that $100 was invested in our common stock on December 31, 2009 at the adjusted closing price on that date of $5.30 per share, in The NASDAQ Stock Market Composite Index and the peer group Power Index, and that all dividends, if any, were reinvested. No cash dividends have been declared or paid on our common stock.
|
|
(4)
|
Stockholder returns over the indicated period should not be considered indicative of future stockholder returns.
|
The following tables include selected consolidated financial data for each of our last five fiscal years. The consolidated statement of operations data for the years ended December 31, 2014, 2013, and 2012 and consolidated balance sheet data at December 31, 2014 and 2013 have been derived from the audited consolidated financial statements appearing elsewhere in this Form 10-K. The consolidated statement of operations data for the years ended December 31, 2011 and 2010 and the consolidated balance sheet data at December 31, 2012, 2011 and 2010, have been derived from audited consolidated financial statements not appearing in this document. This data should be read in conjunction with the consolidated financial statements and notes thereto, with “Management’s Discussion and Analysis of Financial Condition and Results of Operations” in Item 7 and with the other financial data set forth elsewhere in this Form 10-K. Our historical results of operations are not necessarily indicative of results of operations to be expected for future periods.
|
Consolidated Statement of Operations Data
|
||||||||||||||||||||
|
In thousands except per share data
|
Year Ended December 31,
|
|||||||||||||||||||
|
2014
|
2013
|
2012
|
2011
|
2010
|
||||||||||||||||
|
Total revenue
|
$
|
49,136
|
$
|
61,699
|
$
|
76,315
|
$
|
75,482
|
$
|
64,955
|
||||||||||
|
Total cost of goods sold
|
$
|
36,484
|
$
|
42,303
|
$
|
51,601
|
$
|
57,581
|
$
|
46,953
|
||||||||||
|
Gross profit
|
$
|
12,652
|
$
|
19,396
|
$
|
24,714
|
$
|
17,901
|
$
|
18,020
|
||||||||||
|
Total operating expenses
|
$
|
24,672
|
$
|
27,013
|
$
|
26,440
|
$
|
24,781
|
$
|
21,824
|
||||||||||
|
Operating loss
|
$
|
(12,020
|
)
|
$
|
(7,617
|
)
|
$
|
(1,726
|
)
|
$
|
(6,880
|
)
|
$
|
(3,804
|
)
|
|||||
|
Net loss
|
$
|
(12,827
|
)
|
$
|
(8,351
|
)
|
$
|
(1,922
|
)
|
$
|
(7,094
|
)
|
$
|
(3,925
|
)
|
|||||
|
Basic and diluted net loss per share
|
$
|
(0.57
|
)
|
$
|
(0.43
|
)
|
$
|
(0.10
|
)
|
$
|
(0.11
|
)
|
$
|
(0.25
|
)
|
|||||
|
Consolidated Balance Sheet Data
|
||||||||||||||||||||
|
In thousands
|
Year Ended December 31,
|
|||||||||||||||||||
|
2014
|
2013
|
2012
|
2011
|
2010
|
||||||||||||||||
|
Cash and investments
|
$
|
14,824
|
$
|
12,261
|
$
|
13,524
|
$
|
10,746
|
$
|
15,550
|
||||||||||
|
Working capital
|
$
|
17,247
|
$
|
17,696
|
$
|
23,945
|
$
|
13,753
|
$
|
19,082
|
||||||||||
|
Total assets
|
$
|
36,098
|
$
|
37,907
|
$
|
45,799
|
$
|
35,027
|
$
|
39,518
|
||||||||||
|
Long-term obligations
|
$
|
821
|
$
|
741
|
$
|
713
|
$
|
726
|
$
|
579
|
||||||||||
|
Total stockholders' equity
|
$
|
18,793
|
$
|
20,306
|
$
|
25,999
|
$
|
16,292
|
$
|
20,822
|
||||||||||
The following discussion should be read in conjunction with the financial statements and related notes appearing elsewhere in this Form 10-K. This report contains forward-looking statements within the meaning of Section 27A of the Securities Act and Section 21E of the Exchange Act, that involve risks and uncertainties. Our expectations with respect to future results of operations that may be embodied in oral and written forward-looking statements, including any forward looking statements that may be included in this report, are subject to risks and uncertainties that must be considered when evaluating the likelihood of our realization of such expectations. Our actual results could differ materially. The words “believe,” “expect,” “intend,” “plan,” “project,” “will” and similar phrases as they relate to us are intended to identify forward-looking statements. For further discussion regarding forward-looking statements, please see “Special Note Regarding Forward-Looking Statements.” In addition, please see the risk factors section above for a discussion of items that may affect our future results.
Management’s Discussion and Analysis (“MD&A”) of Financial Condition and Results of Operations is designed to provide readers with narrative from the perspective of our management on our financial condition, results of operations, liquidity, and certain other factors that may impact our future results. Our MD&A is presented in the following sections:
| · | 2014 Highlights |
| · | 2015 Plan |
| · | Results of Operations |
| · | Critical Accounting Policies and Estimates |
| · | Liquidity and Capital Resources |
| · | Contractual Obligations |
| · | Off-Balance Sheet Arrangements |
| · | New Accounting Pronouncements |
2014 Highlights
Our total revenue in 2014 was $49.1 million, a decrease of $12.6 million or 20% from 2013, primarily driven by a decrease in MIS sales, which were down $13.4 million or 62% over 2013. This decrease in MIS sales is primarily attributable to lower sales via HP in 2014 which fluctuates depending on their success and needs for MIS products. MIS sales made up 22% of total product revenue in 2014 compared to 49% in 2013. The decrease in MIS sales was partly offset by an increase in UPS, our core business, by $5.4 million or 24% from 2013.
In early 2014 with a new executive team in place, we made a number of changes to the organization aimed at increasing bookings and backlog and controlling expenses. We also took steps to improve our working capital position and strengthen our operating platform. A number of these changes and achievements from 2014 are highlighted below.
| · | Changed go-to-market approach from a distribution model to a more direct sales model and restructured sales organization with sales personnel who possess both commercial sales and technical acumen to engage our customers who are technically savvy including end users, specifying engineers, electrical contractors, and general contractors |
| · | Reorganized engineering, product marketing, service, and manufacturing teams to improve our go-to-market support and enable us to better support our sales and service teams and respond to customer needs |
| · | Our focus on increasing bookings and backlog yielded steady progress in 2014 as we achieved four consecutive quarters of a book-to-bill ratio greater than 1. Bookings also improved with a 25% increase in second half 2014 bookings compared to bookings in the second half 2013. |
| · | Completed a public offering of 3.7 million newly issued shares at a price of $3.15 per share, generating approximately $10.4 million in net proceeds to the Company |
| · | Completed an expanded three-year $15.0 million credit facility in July 2014 with Silicon Valley Bank providing for greater borrowing capability with a lower interest |
| · | Reduced net inventory 43% or $5.2 million from December 31, 2013, through December 31, 2014, as part of the Company’s inventory reduction program |
| · | Reduced operating expenses 9% or $2.3 million in 2014 compared to 2013 |
| · | Reached agreements in principle and entered into memorandums of understanding on September 23, 2014, to the class action complaint and consolidated derivative actions in connection with the Company’s prior public disclosures regarding its relationships with Digital China Information Services Company Limited and Qiyuan Network System Limited |
The restructuring of our sales organization, the shift in our go-to-market approach, and reengagement with Caterpillar helped us in part achieve higher core UPS sales in 2014. UPS sales increased $5.4 million or 24% compared to 2013, making up 78% of total product revenue versus 51% in 2013.
Service sales decreased $4.6 million or 26% in 2014 compared to 2013. This decrease is primarily attributable to higher MIS sales recorded in 2013 compared to 2014 and their associated services revenue which we did not repeat in 2014.
Our gross profit was 26% of revenue for fiscal 2014 compared to 31% in fiscal 2013. This margin decrease is related to under absorption of fixed overhead costs in manufacturing and service due to the lower revenue and manufacturing production in 2014.
Operating expenses decreased 9% or $2.3 million in 2014 compared to 2013, primarily due to decreased engineering costs associated with the rollout and development of our latest UPS product which we began shipping in late 2013; lower general and administrative expenses associated with executive transition costs and legal fee expenses; and lower overall headcount.
Net loss was $12.8 million in 2014 compared to $8.4 million in 2013. The increase in net loss from 2013 to 2014 was due to the decline in revenue coupled with a decline in gross margin.
Cash and cash equivalents totaled $14.8 million at December 31, 2014, compared to $12.3 million at December 31, 2013. Management believes this available cash balance, combined with cash we anticipate to generate from operations and the credit facility we have in place, will be sufficient to fund our operations as we work to increase sales volume and scale the business. In March 2014, we raised additional funds through a public offering to provide additional funds for our future anticipated working capital needs. See Note 3 to the condensed consolidated financial statements of this Form 10-K for more information.
2015 Plan
Going forward, we will focus on increasing bookings and backlog, improving operational efficiencies, and controlling costs. We will also continue our product development efforts on our core flywheel energy storage and power electronics technology. We will support these priorities through a number of efforts including improving productivity of our sales resources, identifying and eliminating waste to drive efficiencies throughout the Company, and improving book-to-conversion. We will continue to improve inventory turns and factory utilization as we work to increase sales volume. However, a number of risks and challenges face our business going forward.
| · | The higher sales price of our CleanSource PowerHouse and modular IT infrastructure orders can cause large quarterly fluctuations in our inventory, receivables and payables balances, depending on the number of such orders in progress at any point in time. This can cause material fluctuations in the level of working capital we require. If the number of such orders increases rapidly or any of these orders have payment terms that are less favorable, we will need access to more working capital to fund the growth of our business and to fulfill these orders. We extended our bank credit facility in 2014 to help fund our growth and manage our working capital requirements. |
| · | We have a history of operating losses and have not yet reached operating profitability on an annual basis. We believe the success of our UPS and MIS products and our service offerings combined with our focus on direct sales to customers and a lower overall operating cost base, will help us to further increase our revenues and reduce our level of operating losses. We will need to continue to focus on our operating costs and cash and working capital management in 2015 to maintain sufficient funds for our operating activities. |
| · | Our sales cycle is such that we generally have some visibility in advance for future orders. However, a sudden change in business volume or product mix, positive or negative, from any of our business or channel partners or in our direct business can significantly impact our expected revenues and impact our ability to quickly respond to opportunities. The continued slow global economic growth has reduced our confidence in the ability to predict future revenues, and even with improving economic conditions, there is still uncertainty and risk in our forecasting. Our limited window of sales visibility does provide us with some opportunity to adjust expenditures or take other measures to reduce our cash consumption if we can see and anticipate a shortfall in revenue. This window may also give us time to identify additional sources of funding if we anticipate an increase in our working capital requirements due to increased revenues or changes in our revenue mix. A significant increase in sales, especially in our MIS business, would likely increase our working capital requirements due to the longer production time and cash cycle of sales of these products. |
| · | Foreign currency volatility could make it more challenging for us to sell outside of the US. As foreign currencies strengthen against the dollar, our pricing may not be competitive in certain geographies. |
Results of Operations
Below are our revenues and costs and expenses for fiscal 2014, 2013, and 2012. This information should be read in conjunction with our Consolidated Financial Statements and notes thereto.
|
Year Ended December 31,
|
Year Ended December 31,
|
|||||||||||||||||||||||||||||||
|
($ in thousands)
|
2014
|
2013
|
$ change
|
% change
|
2013
|
2012
|
$ change
|
% change
|
||||||||||||||||||||||||
|
Product revenue
|
$
|
36,211
|
$
|
44,158
|
$
|
(7,947
|
)
|
-18
|
%
|
$
|
44,158
|
$
|
62,031
|
$
|
(17,873
|
)
|
-29
|
%
|
||||||||||||||
|
Service and other revenue
|
12,925
|
17,541
|
(4,616
|
)
|
-26
|
%
|
17,541
|
14,284
|
3,257
|
23
|
%
|
|||||||||||||||||||||
|
Total revenue
|
49,136
|
61,699
|
(12,563
|
)
|
-20
|
%
|
61,699
|
76,315
|
(14,616
|
)
|
-19
|
%
|
||||||||||||||||||||
|
Cost of product revenue
|
29,182
|
32,825
|
(3,643
|
)
|
-11
|
%
|
32,825
|
42,510
|
(9,685
|
)
|
-23
|
%
|
||||||||||||||||||||
|
Cost of service and other revenue
|
7,302
|
9,478
|
(2,176
|
)
|
-23
|
%
|
9,478
|
9,091
|
387
|
4
|
%
|
|||||||||||||||||||||
|
Total cost of goods sold
|
36,484
|
42,303
|
(5,819
|
)
|
-14
|
%
|
42,303
|
51,601
|
(9,298
|
)
|
-18
|
%
|
||||||||||||||||||||
|
Gross profit
|
12,652
|
19,396
|
(6,744
|
)
|
-35
|
%
|
19,396
|
24,714
|
(5,318
|
)
|
-22
|
%
|
||||||||||||||||||||
|
Operating expenses:
|
||||||||||||||||||||||||||||||||
|
Research and development
|
6,689
|
7,430
|
(741
|
)
|
-10
|
%
|
7,430
|
5,440
|
1,990
|
37
|
%
|
|||||||||||||||||||||
|
Selling and marketing
|
11,940
|
12,032
|
(92
|
)
|
-1
|
%
|
12,032
|
14,139
|
(2,107
|
)
|
-15
|
%
|
||||||||||||||||||||
|
General and administrative
|
6,043
|
7,551
|
(1,508
|
)
|
-20
|
%
|
7,551
|
6,861
|
690
|
10
|
%
|
|||||||||||||||||||||
|
Total operating expenses
|
24,672
|
27,013
|
(2,341
|
)
|
-9
|
%
|
27,013
|
26,440
|
573
|
2
|
%
|
|||||||||||||||||||||
|
Loss from Operations
|
(12,020
|
)
|
(7,617
|
)
|
(4,403
|
)
|
58
|
%
|
(7,617
|
)
|
(1,726
|
)
|
(5,891
|
)
|
341
|
%
|
||||||||||||||||
|
Interest expense, net
|
(395
|
)
|
(370
|
)
|
(25
|
)
|
7
|
%
|
(370
|
)
|
(327
|
)
|
(43
|
)
|
13
|
%
|
||||||||||||||||
|
Other income (expense), net
|
(160
|
)
|
(364
|
)
|
204
|
-56
|
%
|
(364
|
)
|
131
|
(495
|
)
|
-378
|
%
|
||||||||||||||||||
|
Loss before income taxes
|
(12,575
|
)
|
(8,351
|
)
|
(4,224
|
)
|
51
|
%
|
(8,351
|
)
|
(1,922
|
)
|
(6,429
|
)
|
334
|
%
|
||||||||||||||||
|
Income tax expense
|
(252
|
)
|
-
|
(252
|
)
|
100
|
%
|
-
|
-
|
-
|
0
|
%
|
||||||||||||||||||||
|
Net Loss
|
$
|
(12,827
|
)
|
$
|
(8,351
|
)
|
$
|
(4,476
|
)
|
54
|
%
|
$
|
(8,351
|
)
|
$
|
(1,922
|
)
|
$
|
(6,429
|
)
|
334
|
%
|
||||||||||
Fiscal 2014 Compared to Fiscal 2013
Product Revenue. Our product revenue was derived from the following sources:
|
Year Ended December 31,
|
Year Ended December 31,
|
|||||||||||||||||||||||||||||||
|
($ in thousands)
|
2014
|
2013
|
$ change
|
% change
|
2013
|
2012
|
$ change
|
% change
|
||||||||||||||||||||||||
|
Product revenue:
|
||||||||||||||||||||||||||||||||
|
UPS product revenue
|
$
|
28,064
|
$
|
22,620
|
$
|
5,444
|
24
|
%
|
$
|
22,620
|
$
|
35,366
|
$
|
(12,746
|
)
|
-36
|
%
|
|||||||||||||||
|
Modular Infrastructure Solutions
|
8,147
|
21,538
|
(13,391
|
)
|
-62
|
%
|
21,538
|
26,665
|
(5,127
|
)
|
-19
|
%
|
||||||||||||||||||||
|
Total product revenue
|
$
|
36,211
|
$
|
44,158
|
$
|
(7,947
|
)
|
-18
|
%
|
$
|
44,158
|
$
|
62,031
|
$
|
(17,873
|
)
|
-29
|
%
|
||||||||||||||
Total product revenue for fiscal 2014 was $36.2 million, compared to $44.2 million in fiscal 2013, a $8.0 million decrease. The decrease in our product revenue in 2014 compared to 2013 came from lower sales from our MIS products primarily related to HP, which fluctuates depending on their success and needs for modular infrastructure solutions, partially offset by an increase in our UPS sales. In 2014, 78% of our product revenue came from the sale of UPS systems and 22% from the sale of MIS products. Sales of our UPS products increased by approximately $5.4 million, or 24%, compared to 2013 as we saw an increase in our direct sales to our customers.
Product revenue from our OEM channel for fiscal 2014 was $7.8 million, compared to $7.2 million in 2013, a $0.6 million increase or 7%. The size and volume of orders from our OEM channel can fluctuate significantly on a quarterly basis, and we continue to see a small number of large transactions from our OEM channel. Sales to Caterpillar, our primary OEM customer, represented 18% of our total revenue for fiscal 2014 compared to 14% in fiscal 2013. We have supported our OEM partners’ efforts to sell total solutions to their customers that include generators and switchgear that they manufacture along with our UPS products as a total solution.
Product revenue from our IT channel partners for fiscal 2014 were $2.1 million, compared to $11.1 million in 2013, a decrease of $9.0 million or 81%. This reduction reflects decreased demand of our MIS products during 2014 from our IT channel partners, primarily HP. The level of orders may continue to fluctuate depending on our partner’s success and need for modular infrastructure solutions.
Product revenue in the North and South America (“the Americas”) was $21.3 million, or 59% of our total product revenue for 2014, a decrease of $15.1 million or 41%, compared to $36.4, or 82%, for 2013. Our revenue in the Americas decreased in 2014 compared to 2013, primarily as a result of lower MIS revenues and the decrease in sales from our OEM channels, which historically have largely originated in the North American market.
Product sales to customers in Europe, the Middle East, and Africa (“EMEA”) increased by approximately $7.7 million, or 195% to $11.7 million in fiscal 2014 compared to $4.0 million in fiscal 2013. This increase is due to two large orders, one approximately $3.3 million and another approximately $1.2 million.
Our product sales in the Asia and Pacific Region (“APAC”) decreased by 18%, or $0.7 million in 2014 to $3.1 million compared to $3.8 million in 2013. This decrease is primarily due to reduced sales in China. We still see this region as having opportunity for long-term growth as Asia represents one of the largest UPS markets in the world.
We did not have any revenues greater than 10% concentrated in a single country outside of the United States in 2014 or 2013.
Service and other revenue. Service and other revenue decreased by approximately $4.5 million, or 26%, to $13.0 million in fiscal 2014, compared to $17.5 million in fiscal 2013. The decrease primarily reflects reduced service revenue and professional fees stemming from lower MIS product demand in 2014.
Cost of product revenue. The cost of product revenue as a percentage of total product revenue was 81% and 74% in 2014 and 2013, respectively. During 2014 and 2013, we operated a manufacturing facility that has a manufacturing and testing capacity significantly greater than required by our current product revenue levels. Our manufacturing operational costs include a large portion of fixed costs relative to our operational needs. We incurred approximately $5.8 million and $6.9 million, in 2014 and 2013, respectively, in fixed costs related to our manufacturing facility.
Cost of service and other revenue. The cost of service and other revenue as a percentage of total service and other revenue increased by 2%, to 56% in 2014 compared to 54% in 2013. A large portion of the costs involved in operating our service organization are fixed in nature and we incurred approximately $2.3 million and $3.0 million in unabsorbed overhead costs in fiscal 2014 and 2013, respectively. The utilization of our service personnel will be affected by the number of MIS products implemented in a particular period. When we have a lower number of installation projects we would expect our costs as a percentage of revenue to increase due to lower employee utilization.
Gross profit. Our gross profit was 26% of revenue for fiscal 2014 compared to 31% in fiscal 2013. This margin decrease is related to under absorption of fixed overhead costs in manufacturing and service due to the lower revenue and manufacturing production in 2014. Our gross margins fluctuate on a quarterly basis depending on changes in the product and geographic mix of our revenues and were as high as 30% during the third quarter of 2014 and as low as 19% in the second quarter of 2014.
Research and development. Research and development expenses were approximately $6.7 million, $0.7 million or 10%, lower in fiscal 2014 compared to $7.4 million in fiscal 2013. The decrease was primarily due to reduced costs for development activities on our next generation of UPS products.
Selling and marketing. Selling and marketing costs were approximately $11.9 million in fiscal 2014, compared to $12.0 million for the same period of 2013. The decrease was primarily due to severance expense to former executives in 2013 offset by payroll expense in 2014.
General and administrative. General and administrative expenses were approximately $6.0 million, $1.5 million or 20%, lower in fiscal 2014 compared to $7.6 million in 2013. The decreases were primarily due to reductions in (i) relocation and temporary living costs for executives of $0.4 million; (ii) severance payments to former executives of $0.3 million, and (iii) legal fees of $0.3 million from 2013.
Interest expense, net. Net interest expense was relatively flat in fiscal 2014 compared to 2013. The interest expense incurred during 2014 and 2013 was in connection with the outstanding balance on our revolving credit facility.
Other income (expense), net. Other income (expense), net was $0.2 million in fiscal 2014 and $0.4 million in fiscal 2013, a $0.2 million decrease or 56%. This decrease primarily reflects foreign exchange losses or gains on settlement of intercompany balances and sales contracts held in foreign currencies.
Income tax expense. Our income tax expense for 2014 was approximately $0.3 million with an effective tax rate of 2%, compared to $0 for 2013. The increase in the effective tax rate for fiscal 2014 was primarily due to settlement under tax examination by the German tax authorities. In September 2014, we settled a tax examination of our German subsidiary for years 2007 through 2011. In the settlement, we agreed to transfer pricing adjustments for the period under examination resulting in a reduction of loss carryovers and a deemed distribution subject to withholding taxes under German law. We recorded a provision for income taxes of $0.3 million in the quarter ended September 30, 2014 related to settlement of the German tax examination.
As a result of the examination, the Company also adjusted net operating losses in jurisdictions impacted by the transfer pricing adjustments to account for appropriate intercompany pricing for years prior to 2014. There was no overall tax impact as the net operating loss deferred tax assets are fully offset by a valuation allowance. Both the settlement and the adjustments to the net operating losses are reflected in the Company’s rate reconciliation of the income tax footnote.
Fiscal 2013 Compared to Fiscal 2012
Total revenues in fiscal 2013 were $61.7 million, compared to $76.3 million in fiscal 2012, a $14.6 million, or 19% decrease. The decrease in revenue was lower across all product lines, but primarily UPS products which were offset by an increase in service revenue.
Total product revenue for fiscal 2013 was $44.2 million, compared to $62.0 million in fiscal 2012, a $17.8 million decrease. The decrease in our product revenue in 2013 compared to 2012 came primarily from lower sales of our UPS products.
Product revenue from our OEM channel for fiscal 2013 was $7.2 million, compared to $9.4 million in 2012, a $2.2 million decrease or 23%. This decline reflects decreased performance from our OEM partners, primarily in the U.S. market. Sales to Caterpillar, our primary OEM customer, represented 14% of our total revenue for fiscal 2013 compared to 13% in fiscal 2012.
Product revenue from our IT channel partners for fiscal 2013 was $11.1 million, compared to $22.6 million in 2012, a decrease of $11.5 million or 51%. This reduction reflects decreased demand for our MIS products during 2013 from our IT channel partners, primarily HP. The level of orders may continue to fluctuate depending on our partner’s success and need for infrastructure solutions.
Product revenue in the Americas was $36.4 million, or 82% of our total product revenue for 2013, a decrease of $1.4 million or 4%, compared to $37.8, or 61%, for 2012. Our revenue in the Americas decreased in 2013 compared to 2012, primarily as a result of lower UPS product revenue and the decrease in sales from our OEM channel.
Product sales to customers in EMEA decreased by approximately $14.8 million, or 79%, to $4.0 million in fiscal 2013 compared to $18.8 million in fiscal 2012. This decrease relates primarily to a single larger order in fiscal 2012 that did not repeat in 2013. Revenue in Switzerland was $9.3 million, or 12%, in 2012. We did not have any revenues greater than 10% concentrated in a single country outside of the United States in 2013.
Our product sales in APAC decreased by 30%, or $1.6 million, in 2013 to $3.8 million compared to $5.4 million in 2012. This decrease is primarily due to reduced sales in China.
Service and other revenue. Service and other revenue increased by approximately $3.2 million, or 23%, to $17.5 million in fiscal 2013, compared to $14.3 million in fiscal 2012. This increase primarily comes from increased sales in spare parts, start-up services, and project management.
Cost of product revenue. The cost of product revenue as a percentage of total product revenue was 74% and 69% in 2013 and 2012, respectively. During 2013 and 2012, we operated a manufacturing facility that has a manufacturing and testing capacity significantly greater than required by our current product revenue levels.
Our manufacturing facility is comprised of a large portion of our fixed costs. We incurred approximately $6.9 million and $5.8 million, in 2013 and 2012, respectively, in fixed costs for our manufacturing facility. Our manufacturing capacity is in excess of our current business requirements. We expense the excess costs of the underutilization of this facility as part of our cost of product revenues.
Cost of service and other revenue. The cost of service and other revenue as a percentage of total service and other revenue decreased by 10%, to 54% in 2013 compared to 64% in 2012. This decrease in the cost of service and other revenue reflects higher utilization of service personnel and improved margins for MIS systems installations. A large portion of the costs involved in operating our service organization are fixed in nature and we incurred approximately $3.0 million in 2013.
Gross profit. Our gross profit was 31% of revenue for fiscal 2013 compared to 32% in fiscal 2012. The decrease in gross profit margin in 2013 compared to 2012 is related to a few higher margin orders in 2012 that did not repeat in 2013 along with higher unabsorbed overhead costs compared to 2012 from our manufacturing operations due to lower UPS product revenue.
Research and development. Research and development expenses were approximately $7.4 million, $2.0 million or 37%, higher in fiscal 2013 compared to $5.4 million in fiscal 2012. This was primarily related to the final testing and release of our latest generation UPS product in 2013 along with increased headcount to support the development of this new product and new modular infrastructure products we believe will contribute to future growth for us.
Selling and marketing. Selling and marketing costs were approximately $12.0 million in fiscal 2013, compared to $14.1 million for the same period in 2012. The decrease from 2012 is primarily related to a reduction in headcount and lower commissions expense. Selling and marketing expenses also includes $0.3 million in severance for terminated executives.
General and administrative. General and administrative expenses were approximately $7.6 million, $0.7 million or 10%, higher in fiscal 2013 compared to $6.9 million in 2012. This increase primarily reflects unexpected costs associated with $0.4 million in relocation and temporary living costs for executives and an increase in professional fees of $0.4 million associated with our investigations and pending lawsuits.
Interest expense, net. Net interest expense was relatively flat in fiscal 2013 compared to 2012. We negotiated a $12.5 million revolving credit facility with our bank in August 2010, amended in 2012, that incurs a minimum monthly interest liability.
Other income (expense), net. Other income (expense), net was an expense of $0.4 million in fiscal 2013 compared to income of $0.1 million in 2012. This decrease primarily reflects foreign exchange losses or gains on settlement of intercompany balances and sales contracts held in foreign currencies.
Income tax expense.
Due to operating losses, we have not recorded any income tax expenses, other than minimum or statutory costs. As of December 31, 2013 and 2012, our accumulated net operating loss carry-forward was $218.0 million and $208.0 million, respectively, and our research and development credit carry-forwards were $3.7 million and $3.3 million, respectively. We anticipate these loss carry-forward amounts may offset future taxable income that we may achieve and thus reduce future tax liabilities. However, because of uncertainty regarding our ability to use these carry-forwards and the potential limitations due to ownership changes, we have established a valuation allowance for the full amount of our net deferred tax assets.
Critical Accounting Policies and Estimates
We consider an accounting policy to be critical if:
| · | the accounting estimate requires us to make assumptions about matters that are highly uncertain or require the use of judgment at the time we make that estimate; and |
| · | changes in the estimate that are reasonably likely to occur from period to period, or use of different estimates that we could have reasonably used instead in the current period, would have a material impact on our financial condition or results of operations. |
Management has reviewed the development and selection of these critical accounting estimates with the Audit Committee of our Board of Directors. In addition, there are other items within our financial statements that require estimation, but are not deemed critical as defined above. Changes in these and other items could still have a material impact upon our financial statements.
Revenue recognition
We generally recognize revenue when four criteria are met: (i) persuasive evidence that an arrangement exists; (ii) delivery has occurred or services have been rendered; (iii) the sales price is fixed or determinable; and (iv) collectability is reasonably assured. Revenue-generating transactions generally fall into one of the following categories of revenue recognition:
| · | We recognize product revenue at the time of shipment for a significant portion of all products sold directly to customers and through distributors because title and risk of loss pass on delivery to the common carrier. Our customers and distributors do not have the right to return products. If title and risk of loss pass at some other point in time, we recognize such revenue for our customers when the product is delivered to the customer and title and risk of loss have passed. We may enter into bill-and-hold arrangements and when this happens delivery may not occur, but other criteria are reviewed to determine proper timing of revenue recognition. |
| · | We recognize installation, service and maintenance revenue at the time the service is performed. |
| · | We recognize revenue associated with extended maintenance agreements (“EMAs”) over the life of the contracts using the straight-line method, which approximates the expected timing in which applicable services are performed. Amounts collected in advance of revenue recognition are recorded as a current liability in the deferred revenue line of the consolidated balance sheet or long-term liability based on the time from the balance sheet date to the future date of revenue recognition. |
| · | We recognize revenue on certain rental programs over the life of the rental agreement using the straight-line method. Amounts collected in advance of revenue recognition are recorded as a current or long-term liability based on the time from the balance sheet date to the future date of revenue recognition. |
| · | Shipping costs reimbursed by the customer are included in revenue. |
Multiple element arrangements (“MEAs”) are arrangements to sell products to customers that frequently include multiple deliverables. Our most significant MEAs include the sale of one or more of our CleanSource UPS or CleanSource PowerHouse products, combined with one or more of the following products: design services, project management, commissioning and installation services, spare parts or consumables, and EMAs. Delivery of the various products or performance of services within the arrangement may or may not coincide. Certain services related to design and consulting may occur prior to product delivery. Commissioning and installation typically take place within six months of product delivery, depending upon customer requirements. EMAs, consumables, and repair, maintenance or consulting services generally are delivered over a period of one to five years. In certain arrangements revenue recognized is limited to the amount invoiced or received that is not contingent on the delivery of future products and services.
When arrangements include multiple elements, we allocate revenue to each element based on the relative selling price and recognize revenue when the elements have standalone value and the four criteria for revenue recognition have been met. We establish the selling price of each element based on Vendor Specific Objective Evidence (“VSOE”) if available, Third Party Evidence (“TPE”) if VSOE is not available, or Best Estimate of Selling Price (“BESP”) if neither VSOE nor TPE is available. We generally determine selling price based on amounts charged separately for the delivered and undelivered elements to similar customers in standalone sales of the specific elements. When arrangements include an EMA, we recognize revenue related to the EMA at the stated contractual price on a straight-line basis over the life of the agreement.
Any taxes imposed by governmental authorities on our revenue-producing transactions with customers are shown in our consolidated statement of operations on a net-basis; that is, excluded from our reported revenues.
Inventories
Inventories are priced at the lower of cost (using the first-in, first-out method) or market. We estimate inventory reserves on a quarterly basis and record reserves for obsolescence or slow-moving inventory based on assumptions about future demand and marketability of products, the impact of new product introductions, inventory turns and specific identification of items, such as product discontinuance, damaged goods or engineering/material changes.
Warranty liability
Estimated warranty liability costs are accrued for each of our products at the time of sale. Our estimates are principally based on assumptions regarding the lifetime warranty costs of each product, including where little or no claims experience may exist. Due to the uncertainty and potential volatility of these estimates, changes in our assumptions could have a material effect on our reported operating results. Our estimate of warranty liability is reevaluated on a quarterly basis. Experience has shown that initial data for a new product can be very volatile due to factors such as product and component failure rates, material usage and service delivery costs in correcting product failures; therefore our process relies upon long-term historical averages until actual data is available. As actual experience becomes available, it is used to modify the historical averages to ensure that the forecast is within the range of likely outcomes. The resulting balances are then compared to current spending rates to help ensure that the accruals are adequate to meet expected future obligations.
Stock-based compensation
Stock-based compensation cost is estimated at the grant date based on the fair value of the award and is recognized as an expense ratably over the requisite service period of the award. Determining the appropriate fair-value model and calculating the fair value of stock-based awards at the grant date requires considerable judgment, including estimating stock price volatility, expected option life and forfeiture rates. We develop our estimates based on historical data and market information that can change significantly over time. A small change in estimates used can have a relatively large impact on the estimated valuation.
We use the Black-Scholes option valuation model to value employee stock awards. We estimate stock price volatility based upon our historical volatility. Estimated option life and forfeiture rate assumptions are derived from historical data.
Liquidity and Capital Resources
Our primary sources of liquidity at December 31, 2014 are our cash and cash equivalents, our bank credit facilities and projected cash flows from operating activities. If we meet our cash flow projections, we expect that we will have adequate capital resources to continue operating our business for at least the next twelve months. Our projections and our assumptions around the adequacy of our liquidity are based on estimates regarding expected revenues and future costs. However, there are scenarios in which our revenues may not meet our projections, our costs may exceed our estimates or our working capital needs may be greater than anticipated. Further, our estimates may change and future events or developments may also affect our estimates. Any of these factors may change our expectation of cash usage in 2015 and beyond or significantly affect our level of liquidity.
In August 2010, we entered into a Second Amended and Restated Loan and Security Agreement (the “Loan Agreement”) with Silicon Valley Bank (“SVB”) which increased the total line of credit available to $12.5 million subject to certain borrowing bases. This facility expanded our ability to borrow funds from U.S. receivables to include qualifying receivables from our UK operations as well, increased our ability to use inventory as collateral, and also added an ability to borrow against purchase orders. These additional bases of borrowing were designed to allow us to use the credit facility to fund inventory purchases in the event we received large or multiple sales orders that would require a major investment in inventory and work in progress such as our MIS products, to help fund our business and to manage our working capital requirements.
The Loan Agreement provides for a secured revolving line of credit in an aggregate amount of up to eighty percent (80%) of the facility amount of $15.6 million, or $12.5 million, subject to certain borrowing bases. In the event we have maintained unrestricted cash and cash equivalents of at least $6.25 million with SVB for at least 30 consecutive days, which is referred to as being in a “Streamline Period”, the borrowing base formula is based on eligible accounts receivable, eligible purchase orders and eligible inventory, subject to a sublimit of $5.0 million for U.K. accounts receivable, $3.5 million for inventory and $1.5 million for purchase orders. When we are not in a Streamline Period, our borrowings are limited based on accounts receivable and purchase orders that SVB has specifically agreed to finance and a borrowing base for eligible inventory. We may also request that SVB issue letters of credit on our behalf, of up to $1.5 million, as a portion of our total loan facility.
In August 2012, we entered into the Second Amendment to Second Amended and Restated Loan and Security Agreement with SVB (“Second Amendment”) which amends the Loan Agreement, by and between us and SVB. Pursuant to the Second Amendment, the maturity date of the loan facility was extended by two years, to August 5, 2014, unless earlier terminated by us, subject to any then applicable early termination fee. The Second Amendment further provides for, among other things, (i) adding a $1.5 million sublimit under the borrowing base formula for 91-120 day aged accounts receivable, (ii) removing eligible purchase orders from the borrowing base formula, and (iii) removing sublimits providing for the issuance of letters of credit and cash management services. Additionally, pursuant to the Second Amendment, the definition of “Streamline Period” was amended such that the Company will be deemed to be in a Streamline Period in the event that it has a liquidity ratio of greater than or equal to 1.75:1.00 at all times for at least 60 consecutive days; provided that a Streamline Period will automatically be in effect if we achieve such liquidity ratio as a result of the sale of our equity securities.
Further, the Second Amendment provides for, among other things, (i) amending the finance charge on each eligible account financed by SVB to a per annum rate equal to SVB’s prime rate, subject to a minimum prime rate of four percent (4.00%), plus (a) one and one-quarter percent (1.25%) when we are in a Streamline Period or (b) one and three-quarters percent (1.75%) for eligible accounts (other than eligible 91-120 day aged accounts) and two percent (2.00%) for eligible 91 to 120 day aged accounts when we are not in a Streamline Period, and (ii) reducing the interest rate upon which each inventory advance accrues interest such that each advance based upon inventory accrues interest at a per annum rate equal to SVB’s prime rate, subject to a minimum prime rate of four percent (4.00%), plus (a) one and one-quarter percent (1.25%) when we are in a Streamline Period or (b) three and one half percent (3.50%) when we are not in a Streamline Period.
On July 28, 2014, we entered into a Third Amendment to Second Amended and Restated Loan and Security Agreement with SVB (“Third Amendment”). The amended three-year loan facility provides for a secured revolving line of credit in an aggregate amount of up to eighty percent (80%) of the facility amount of $18.8 million, or $15.0 million, and increases our inventory and purchase order availability from $3.5 million to $7.0 million subject to certain borrowing bases. Purchase orders and eligible inventory are subject to a sublimit of $4.0 million and accounts receivable for UK and Germany have a $5.0 million sublimit. If we maintain our liquidity ratio of 2.50:1.00 for the immediately preceding reconciliation periods the sublimit will be uncapped. We are currently in compliance with all loan covenants under the Loan Agreement. Further, the Third Amendment extends the maturity date to August 5, 2017 and reduces the finance charge to a per annum rate equal to SVB's prime rate, subject to a minimum prime rate of 4.00%, plus (a) 0.50% for eligible accounts, inventory and purchase orders when we are Borrowing Base Eligible (as defined in the Loan Agreement), or (b) 1.20% for eligible accounts when we are not Borrowing Base Eligible.
The revolving loans made to us under this loan facility are secured by a lien on substantially all of our assets, including the assets of Active Power Solutions Limited, our wholly-owned United Kingdom subsidiary, and the assets of Active Power (Germany) GmbH, our indirect wholly-owned German subsidiary. The only direct or indirect subsidiaries of Active Power, Inc. that are not guarantors under the Loan Agreement are Active Power China (Beijing) Co. Ltd. and immaterial subsidiaries that are not operating companies. There are no restrictions on the ability of any of the subsidiary guarantors to transfer funds to Active Power, Inc. in the form of loans, advances or dividends, except as provided by applicable law.
The Loan Agreement includes customary affirmative covenants for a credit facility of this size and type, including delivery of financial statements, compliance with laws, maintenance of insurance, and protection of intellectual property rights. Further, the Loan Agreement contains customary negative covenants for a credit facility of this size and type, including covenants that limit or restrict our ability, among other things, to dispose of assets, change our business, change our CEO or CFO without replacing such person within 120 days, have a change in control, make acquisitions, be acquired, incur indebtedness, grant liens, make investments, make distributions, repurchase stock, and enter into certain transactions with affiliates.
The Loan Agreement contains customary events of default that include, among other things, non-payment defaults, covenant defaults, material adverse change defaults, insolvency defaults, material judgment defaults and inaccuracy of representations and warranty defaults. The occurrence of an event of default could result in the acceleration of obligations under the Loan Agreement, in which case we must repay all loans and related charges, fees and amounts then due and payable, and our subsidiary may be required to pay any such amounts under the Guarantee and Debenture. At the election of SVB, upon the occurrence and during the continuance of an event of default, finance charges or interest rates, as applicable, will increase an additional five percentage points (5.00%) per annum above the rate that is otherwise applicable thereto upon the occurrence of such event of default, and the collateral handling fees will increase by one-half percent (0.50%).
During 2012, we borrowed amounts under this credit facility based on our short term liquidity requirements. As of December 31, 2014, we had outstanding borrowings of $5.5 million under this loan facility. Based on the borrowing base formula subsequent to the Third Amendment, the additional amount available for use ranged between $2.6 million and $5.2 million for 2014.
In March 2014, we sold approximately 3.7 million shares of common stock at a purchase price of $3.15 per share, for proceeds, net of fees and expenses, of approximately $10.4 million, in a public underwritten offering made under a shelf registration statement that we had filed with the SEC and that had been declared effective in June 2013. The proceeds from this offering will be used by us to help fund our working capital requirements and for general corporate purposes.
Should additional funding be required or desirable, we would expect to raise the required funds through borrowings or public or private sales of debt or equity securities. If we raise additional funds through the issuance of convertible debt or equity securities, the ownership of our existing stockholders could be significantly diluted. If we obtain additional debt financing, a substantial portion of our operating cash flow may be dedicated to the payment of principal and interest on such indebtedness, and the terms of the debt securities issued could impose significant restrictions on our operations. We do not know whether we will be able to secure additional funding, or funding on terms acceptable to us, to continue our operations as planned. If financing is not available, we may be required to reduce, delay or eliminate certain activities or to license or sell to others some of our proprietary technology.
Significant uses of cash
Operating Activities
The following table summarizes the yearly changes in cash used in operating activities (in thousands):
|
Year
|
Annual
Amount
|
Change from
Prior Year
|
Percent
Change
|
|||||||||
|
2014
|
$
|
(7,228
|
)
|
$
|
(5,921
|
)
|
-453
|
%
|
||||
|
2013
|
$
|
(1,307
|
)
|
$
|
4,683
|
78
|
%
|
|||||
|
2012
|
$
|
(5,990
|
)
|
$
|
660
|
10
|
%
|
|||||
Cash used in operating activities was $7.2 million in 2014 compared to $1.3 million in 2013. Cash used in operating activities was primarily related to our net loss of $12.8 million partially offset by the change in our inventory of $5.3 million initiated by our current management team to bring inventory levels down. Changes in our net working capital resulted in cash provided of $3.1 million in 2014, compared to $4.3 million in 2013. The frequent changes in our working capital can result in very large fluctuation in inventory, payables and receivables, even weekly, based on the large size of some of our orders. Our change in inventory also includes a non-cash charge of $44,000 in 2014 related to items purchased as inventory for our latest generation UPS product, but later capitalized to property and equipment as test units. Cash used in operating activities in 2013 primarily related to our net loss of $8.4 million partially offset by changes in our net accounts receivable and deferred revenue.
Our top five customers represented 40% of our 2014 total revenue and 47% of our total receivables at December 31, 2014. As a result of this customer concentration, our failure to collect receivables from any of these customers in a timely manner could have a significant adverse effect on our liquidity. This risk may potentially increase as we sell more modular infrastructure solutions due to their higher average selling price. We do continue to request deposits and periodic payments from large customers where commercially possible, particularly for projects with multiple deliverables. However, the amount of such advance payments can fluctuate significantly on a quarterly basis, depending on the size and scope of customer orders at any point in time. As a result, we will need to continue to focus on management of cash and working capital in 2015 to manage the level of funds we use in our operating activities.
Cash used in operating activities was $1.3 million in 2013 compared to $6.0 million in 2012. Cash used in operating activities was primarily related to our net loss of $8.4 million partially offset by changes in our net accounts receivable and deferred revenue. Changes in our net working capital, resulted in cash provided of $4.2 million in 2013, compared to cash used of $6.9 million in 2012. Our change in inventory includes a non-cash charge of $0.9 million in 2013 related to items purchased as inventory for our latest generation UPS product, but later capitalized to property and equipment as test units.
Investing Activities
Investing activities primarily consist of purchases of property and equipment. The cash used in investing activities decreased to $0.3 million in 2014 from $0.9 million in 2013 as we invested less in capital improvements in 2014. Capital expenditures decreased in 2014 from 2013 by approximately $0.7 million. Our capital expenditures in 2014 primarily included investments in equipment to support our manufacturing facility, computers, software, and test units of our latest generation UPS product.
The cash used in investing activities decreased to $0.9 million in 2013 from $1.1 million in 2012 as we invested less in capital improvements in 2013. Capital expenditures decreased in 2013 from 2012 by approximately $0.3 million. Our capital expenditures in 2013 primarily included investments in equipment to support our manufacturing facility, test units of our latest generation UPS product, leasehold improvements, and software.
Financing Activities
Funds provided by financing activities during 2014 was $10.6 million compared to $0.6 million in 2013, a $10.0 million increase. This increase primarily includes the sale of approximately 3.7 million shares of our common stock at a purchase price of $3.15 per share, for proceeds, net of fees and expenses, of approximately $10.4 million, in a public underwritten offering. Proceeds from the exercise of employee stock options were approximately $0.1 million.
Funds provided by financing activities during 2013 was $0.6 million compared to $10.1 million in 2012, a $9.5 million decrease. This decrease primarily reflects the sale of approximately 2.9 million shares of our common stock at a purchase price of $3.40 per share, for proceeds, net of issuances costs, of approximately $9.6 million in 2012. Proceeds from employee stock purchases were $0.6 million in 2012.
Contractual Obligations
In our day-to-day operations, we incur commitments to make future payments for goods and services. These arise from entering into operating leases and as we make commitments to vendors to purchase materials and services. The following table summarizes our significant contractual obligations and commitments at December 31, 2014 (in thousands):
|
Payment due by period
|
||||||||||||||||||||
|
Contractual Obligations
|
Total
|
Less than 1 year
|
1-3 years
|
3-5 years
|
More than 5
years
|
|||||||||||||||
|
Operating lease obligations
|
$
|
2,521
|
$
|
1,260
|
$
|
1,189
|
$
|
72
|
$
|
-
|
||||||||||
|
Purchase obligations
|
$
|
6,103
|
$
|
5,832
|
$
|
271
|
$
|
-
|
$
|
-
|
||||||||||
Our principal lease commitments consist of our leases for our corporate headquarters, engineering and administration facilities, and our global sales offices.
Future uses of cash
We believe that our cash and investments, projected cash flows from operations and sources of available liquidity will be sufficient to fund our operations for the next twelve months. However, a sudden change in business volume, positive or negative, from any of our business or channel partners, or in our direct business, or any customer-driven events such as order or delivery deferral, could significantly impact our expected revenues and cash needs. The continuing global economic instability and currency fluctuation has increased the already present challenge of predicting future revenues. We do have some opportunity to adjust expenditures or take other measures to reduce our cash consumption if we see and anticipate a shortfall in revenue, or give us time to identify additional sources of funding if we anticipate an increase in our working capital requirements due to increased revenues or changes in our revenue mix. A significant increase in sales, especially in our MIS business, would likely increase our working capital requirements, due to the longer production time and cash cycle of sales of these products.
We do not expect our level of capital investments to significantly fluctuate in 2015 compared to 2014.
Other factors that may affect liquidity
Our cash requirements will depend on many factors, including any sales growth, the market acceptance of our products, the gross profit we are able to generate with our sales, the timing and level of development funding, the rate of expansion of our sales and marketing activities, the rate of expansion of our manufacturing processes, and the timing and extent of research and development projects. Although we are not a party to any agreement or letter of intent with respect to a potential acquisition or merger, we may enter into acquisitions or strategic arrangements in the future to help support our growth, which could also require us to seek additional equity or debt financing. Should additional funding be required or desirable, we may need to raise the required funds through borrowings or public or private sales of debt or equity securities. If we raise additional funds through the issuance of convertible debt or equity securities, the percentage ownership of our existing stockholders could be significantly diluted. If we obtain additional debt financing, a substantial portion of our operating cash flow may be dedicated to the payment of principal and interest on such indebtedness, and the terms of the debt securities issued could impose significant restrictions on our operations. We do not know whether we will be able to secure additional funding, or funding on terms acceptable to us, to continue our operations as planned. If financing is not available, we may be required to reduce, delay or eliminate certain activities or to license or sell to others some of our proprietary technology.
In March 2014, we sold approximately 3.7 million shares of common stock at a purchase price of $3.15 per share, for proceeds, net of fees and expenses, of approximately $10.4 million, in a public underwritten offering made under a shelf registration statement that we had filed with the SEC and that had been declared effective in June 2013. The proceeds from this offering will be used by us to help fund our working capital requirements and for general corporate purposes.
Off-Balance Sheet Arrangements
During the years ended December 31, 2014, 2013, and 2012, we did not have any relationships with unconsolidated entities or financial partnerships, such as entities often referred to as structured finance or special purpose entities, which would have been established for the purpose of facilitating off-balance sheet arrangements or other contractually narrow or limited purposes.
New Accounting Pronouncements
In August 2014, the Financial Accounting Standards Board (the “FASB”) issued Accounting Standards Update (“ASU”) No. 2014-15, (“ASU 2014-15”), “Disclosure of Uncertainties About an Entity’s Ability to Continue as a Going Concern”. ASU 2014-15 requires management to perform interim and annual assessments of an entity’s ability to continue as a going concern within one year of the date the financial statements are issued and provides guidance on determining when and how to disclose going concern uncertainties in the financial statements. Certain disclosures will be required if conditions give rise to substantial doubt about an entity’s ability to continue as a going concern. ASU 2014-15 applies to all entities and is effective for annual and interim reporting periods ending after December 15, 2016, with early adoption permitted. The Company does not expect that the adoption of this standard will have a material effect on its financial statements.
In May 2014, the FASB issued ASU 2014-09, “Revenue from Contracts with Customers”, “Topic 606”. This ASU will supersede the revenue recognition requirements in Topic 605, Revenue Recognition, and most industry-specific guidance, and creates a Topic 606 Revenue from Contracts with Customers. The core principle of the guidance is that an entity should recognize revenue to depict the transfer of promised goods or services to customers in an amount that reflects the consideration to which the entity expects to be entitled in exchange for those goods or services. The Company will adopt this guidance January 1, 2017. We are evaluating the new guidelines to see if they will have a significant impact on our consolidated results of operation, financial condition or cash flows.
We invest our cash in a variety of financial instruments, including bank time deposits, and taxable variable rate and fixed rate obligations of corporations, municipalities, and local, state and national government entities and agencies. These investments are denominated in U.S. dollars.
Our interest income is sensitive to changes in the general level of U.S. interest rates, particularly since the majority of our investments are in short-term instruments. We believe that our investment policy is conservative, both in terms of the average maturity of investments that we hold and in terms of the credit quality of our investments. Because of the nature of the majority of our investments, we do not believe a 1% decline in interest rates would have a material effect on our interest income or on the fair value of our investments.
Our international sales were historically made in U.S. dollars. As we have increased sales in foreign markets and opened operations in multiple foreign countries, we have executed more transactions that are denominated in other currencies, primarily Euro and British pounds. Those sales and expenses in currencies other than U.S. dollars can result in translation gains and losses which have not been significant to date. Currently, we do not engage in hedging activities for our international operations other than an increasing amount of sales and support expenses being incurred in foreign currencies as a natural hedge. However, recent volatility in currencies, particularly with the Pound and Euro, is increasing the amount of potential translation gains and losses and we may engage in hedging activities in the future to mitigate the risks caused by such currency volatility. A hypothetical 10% increase or decrease in foreign currencies in which we transact would not have a material adverse effect on our financial condition or results of operations other than the imparct on the unrealized gain (loss) on the intercompany receivables held by us from our other subsidiaries.
Our international business is subject to the typical risks of any international business, including, but not limited to, the risks described in Item 1A, “Risk Factors.” Accordingly, our future results could be materially harmed by the actual occurrence of any of these or other risks.
The Financial Statements and Selected Quarterly Financial Data required by this item are included in Part IV, Item 15(a)(1) and are presented beginning on Page 39.
None.
Effectiveness of Disclosure Controls and Procedures.
Our Chief Executive Officer and our Chief Financial Officer, based on the evaluation of our disclosure controls and procedures (as defined in Rule 13a-15(e) or 15d-15(e) under the Exchange Act required by paragraph (b) of Rule 13a-15 or Rule 15d-15, have concluded that, as of December 31, 2014, our disclosure controls and procedures were effective to ensure that the information we are required to disclose in reports that we file or submit under the Exchange Act (i) is recorded, processed, summarized and reported within the time periods specified in SEC rules and forms, and (ii) is accumulated and communicated to our management, including our Chief Executive Officer and our Chief Financial Officer, as appropriate to allow timely decisions regarding required disclosure.
Management’s Report on Internal Control over Financial Reporting.
Management is responsible for establishing and maintaining adequate internal control over financial reporting, as such term is defined in Exchange Act Rules 13a-15(f) and 15d-15(f). Internal control over financial reporting is a process, designed by, or under the supervision of, our Chief Executive Officer and Chief Financial Officer, and effected by our Board, management and other personnel, to provide reasonable assurance regarding the reliability of financial reporting, and the preparation of financial statements for external purposes in accordance with U.S. generally accepted accounting principles.
Internal control over financial reporting includes those policies and procedures that (1) pertain to the maintenance of records that, in reasonable detail, accurately and fairly reflect the transactions and dispositions of the assets of the company; (2) provide reasonable assurance that transactions are recorded as necessary to permit preparation of financial statements in accordance with generally accepted accounting principles, and that our receipts and expenditures are being made only in accordance with the authorizations of our management and directors; and (3) provide reasonable assurance regarding prevention or timely detection of unauthorized acquisition, use, or disposition of our assets that could have a material effect on our financial statements.
Management assessed the effectiveness of our internal control over financial reporting as of December 31, 2014. In making this assessment, management used the criteria set forth in Internal Control – Integrated Framework issued by COSO (2013 framework). A material weakness is a control deficiency, or combination of control deficiencies, that results in more than a remote likelihood that a material misstatement of the annual or interim financial statements will not be prevented or detected. Based on our assessment, management concluded that, as of December 31, 2014, our internal control over financial reporting was effective to provide reasonable assurance regarding the reliability of financial reporting and the preparation of financial statements for external purposes in accordance with U.S. generally accepted accounting principles.
Our independent registered public accounting firm, Grant Thornton LLP, audited our consolidated financial statements, and independently assessed the effectiveness of our internal control over financial reporting. Grant Thornton LLP has issued their report, which is included in Part IV of this Form 10-K.
Changes in Internal Control over Financial Reporting.
There have been no changes in our internal control over financial reporting during the quarter ended December 31, 2014 that have materially affected, or are reasonably likely to affect materially, our internal control over financial reporting.
Because of its inherent limitations, internal control over financial reporting may not prevent or detect misstatements. Forward looking statements regarding the effectiveness of internal controls during future periods are subject to the risk that controls may become inadequate because of change in conditions, or that the degree of compliance with the policies and procedures may deteriorate.
On February 25, 2015, the Board of Directors of the Company approved the 2015 Adleman Incentive Plan (“2015 Incentive Plan”) for Mr. Randall Adleman, the Company’s Vice President of Global Sales and Marketing. In 2015, under the 2015 Incentive Plan, Mr. Adleman will be eligible to receive cash incentive compensation at a rate of 0.225% of bookings up to a specified target and at a rate of 0.295% of bookings in excess of such target, up to a maximum amount of $500,000.
The description of the 2015 Incentive Plan is qualified in its entirety by reference to the actual terms of the 2015 Incentive Plan, which is attached hereto as Exhibit 10.29 and is incorporated by reference into this Item 9B.
PART III.
Pursuant to General Instruction G(3) of Form 10-K, the information required by this item relating to our executive officers is included under the caption “Executive Officers of the Company” in Part I of this Form 10-K.
The other information required under Item 10, including information about our directors, disclosure of delinquent Section 16 filings, our Code of Ethics and matters relating to our audit committee and its members will be included under the sections captioned “Matters to be Considered at Annual Meeting, Proposal One: Election of Directors”, “Section 16(A) Beneficial Ownership Reporting Compliance”, “Corporate Governance” and “Meetings and Committees of the Board,” respectively, in our Proxy Statement for the 2015 Annual Meeting of Stockholders, which information is incorporated into this Annual Report by reference.
The information required by this Item will be included under the sections captioned “Compensation Discussion and Analysis,” “Compensation Committee Interlocks and Insider Participation,” “Compensation Committee Report,” “Certain Transactions,” and “Director Compensation” in our definitive Proxy Statement for the 2015 Annual Meeting of Stockholders, which information is incorporated into this Annual Report by reference.
| ITEM 12. | Security Ownership of Certain Beneficial Owners and Management and Related Stockholder Matters. |
The information required by this Item will be included under the sections captioned “Ownership of Securities,” “Equity Compensation Plan Information” and “Potential Payments upon Termination or Change of Control” in our definitive Proxy Statement for the 2015 Annual Meeting of Stockholders, which information is incorporated into this Annual Report by reference.
The information required by this Item will be included under the sections captioned “Certain Transactions” and “Director Independence” in our definitive Proxy Statement for the 2015 Annual Meeting of Stockholders, which information is incorporated into this Annual Report by reference.
The information required by this Item will be included under the section captioned “Proposal Three: Ratification of Appointment of Independent Registered Public Accounting Firm” in our definitive Proxy Statement for the 2015 Annual Meeting of Stockholders, which information is incorporated into this Annual Report by reference.
PART IV.
(a)
1. Financial Statements.
The following financial statements of Active Power, Inc. were filed as a part of the Annual Report on Form 10-K for the fiscal year ending December 31, 2014:
|
Page
|
|
|
Reports of Independent Registered Public Accounting Firm
|
44
|
|
Financial Statements:
|
|
|
Consolidated Balance Sheets
|
46
|
|
Consolidated Statements of Operations and Comprehensive Loss
|
47
|
|
Consolidated Statements of Stockholders’ Equity
|
48
|
|
Consolidated Statements of Cash Flows
|
49
|
|
Notes to Financial Statements
|
50
|
2. Schedules.
All schedules have been omitted since the information required by the schedule is not applicable, or is not present in amounts sufficient to require submission of the schedule, or because the information required is included in the Financial Statements and notes thereto.
3. Exhibits.
The exhibits listed on the accompanying index to exhibits immediately following the financial statements are filed herewith, or are incorporated by reference as indicated below.
(b) Exhibits
See the Exhibit Index beginning on page 44 of this Form 10-K.
SIGNATURES
Pursuant to the requirements of Section 13 or 15(d) of the Securities Exchange Act of 1934, the registrant has duly caused this report to be signed on its behalf by the undersigned, thereunto duly authorized.
|
ACTIVE POWER, INC.
|
||
|
Dated: February 27, 2015
|
By:
|
/s/ MARK A. ASCOLESE
|
|
President and Chief Executive Officer
|
||
Power of Attorney
KNOW ALL PERSONS BY THESE PRESENTS, that each person whose signature appears below hereby severally constitutes and appoints, Mark A. Ascolese and James A. Powers, and each or any of them, his true and lawful attorney-in-fact and agent, each with the power of substitution and resubstitution, for him in any and all capacities, to sign any and all amendments to this Annual Report on Form 10-K and to file the same, with exhibits thereto and other documents in connection therewith, with the Securities and Exchange Commission, hereby ratifying and confirming all that each said attorney-in-fact and agent, or his substitute or substitutes, may lawfully do or cause to be done by virtue hereof.
Pursuant to the requirements of the Securities Exchange Act of 1934, this report has been signed below by the following persons on behalf of the registrant and in the capacities and on the dates indicated.
|
Name
|
Title
|
Date
|
||
|
/s/ MARK A. ASCOLESE
|
President and Chief Executive Officer
|
February 27, 2015
|
||
|
Mark A. Ascolese
|
(principal executive officer)
|
|||
|
/s/ JAMES A. POWERS
|
Vice President—Finance, Chief Financial Officer
|
February 27, 2015
|
||
|
James A. Powers
|
(principal financial and accounting officer)
|
|||
|
/s/ AKE ALMGREN
|
Chairman of the Board, Director
|
February 27, 2015
|
||
|
Ake Almgren
|
||||
|
/s/ JAMES E. DEVENNY III
|
Director
|
February 27, 2015
|
||
|
James E. deVenny III
|
||||
|
/s/ ROBERT S. GREENBERG
|
Director
|
February 27, 2015
|
||
|
Robert S. Greenberg
|
||||
|
/s/ STEPHEN J. CLEARMAN
|
Director
|
February 27, 2015
|
||
|
Stephen J. Clearman
|
||||
|
/s/ T. PATRICK KELLY
|
Director
|
February 27, 2015
|
||
|
T. Patrick Kelly
|
INDEX TO EXHIBITS
|
Exhibit
Number
|
Description
|
|
|
3.1*
|
Restated Certificate of Incorporation of Active Power, Inc., as amended (filed as Exhibit 3.1 to Active Power Inc.’s Quarterly Report on Form 10-Q filed on August 1, 2014)
|
|
|
3.2*
|
Second Amended and Restated Bylaws of Active Power, Inc., as amended (filed as Exhibit 3.2 to Active Power Inc.’s Quarterly Report on Form 10-Q filed on May 1, 2014)
|
|
|
4.1*
|
Specimen certificate for shares of Common Stock (filed as Exhibit 4.1 to Active Power’s IPO Registration Statement on Form S-1 (SEC File No. 333-36946) (the “IPO Registration Statement"))
|
|
|
4.2*
|
See Exhibits 3.1 and 3.2 for provisions of the Certificate of Incorporation and Bylaws of the registrant defining the rights of holders of common stock
|
|
|
10.1*
|
Form of Indemnity Agreement (filed as Exhibit 10.1 to the IPO Registration Statement)
|
|
|
10.2*†
|
Active Power, Inc. 2000 Stock Incentive Plan (filed as Exhibit 10.2 to the IPO Registration Statement)
|
|
|
10.3*†
|
Active Power, Inc. 2010 Equity Incentive Plan, as amended (filed as Exhibit 10.1 to Active Power's Quarterly Report on Form 10-Q filed on August 3, 2012)
|
|
|
10.4*†
|
Form of Standard Stock Option Agreement (filed as Exhibit 10.2 to Active Power's Current Report on Form 8-K filed on May 18, 2010)
|
|
|
10.5*†
|
Form of Standard Restricted Stock Agreement Stock Agreement (filed as Exhibit 10.3 to Active Power's Current Report on Form 8-K filed on May 18, 2010)
|
|
|
10.6*†
|
Form of Standard Restricted Stock Unit Agreement (filed as Exhibit 10.4 to Active Power's Current Report on Form 8-K filed on May 18, 2010)
|
|
|
10.7*
|
Lease Agreement between Active Power, Inc. and Braker Phase III, Ltd. (filed as Exhibit 10.9 to the IPO Registration Statement)
|
|
|
10.8*
|
First Amendment to Lease Agreement between Active Power, Inc. and Braker Phase III, Ltd. (filed as Exhibit 10.10 to the IPO Registration Statement)
|
|
|
10.9*
|
Second Amendment to Lease Agreement between Active Power, Inc. and Braker Phase III, Ltd. (filed as Exhibit 10.11 to the IPO Registration Statement)
|
|
|
10.10*
|
Third Amendment to Lease Agreement between Active Power, Inc. and Braker Phase III, Ltd. (filed as Exhibit 10.12 to the IPO Registration Statement)
|
|
|
10.11*
|
Fourth Amendment to Lease Agreement between Active Power, Inc. and Metropolitan Life Insurance Company (filed as Exhibit 10.13 to the IPO Registration Statement)
|
|
|
10.12*
|
Fifth Amendment to Lease Agreement between Active Power, Inc. and Metropolitan Life Insurance Company (filed as Exhibit 10.14 to the IPO Registration Statement)
|
|
|
10.13*
|
Sixth Amendment to Lease Agreement between Active Power, Inc. and Metropolitan Life Insurance Company (filed as Exhibit 10.18 to Active Power’s Annual Report on Form 10-K for the fiscal year ended December 31, 2000 (the “2000 10-K”))
|
|
|
10.14*
|
Seventh Amendment to Lease Agreement between Active Power, Inc. and Metropolitan Life Insurance Company (filed as Exhibit 10.19 to the 2000 10-K)
|
|
|
Eight Amendment to Lease Agreement between Active Power, Inc. and Metropolitan Life Insurance Company
|
||
|
Ninth Amendment to Lease Agreement between Active Power, Inc. and Metropolitan Life Insurance Company
|
||
|
Tenth Amendment to Lease Agreement between Active Power, Inc. and Metropolitan Life Insurance Company
|
||
|
Eleventh Amendment to Lease Agreement between Active Power, Inc. and Metropolitan Life Insurance Company
|
||
|
Twelfth Amendment to Lease Agreement between Active Power, Inc. and Metropolitan Life Insurance Company
|
||
|
Thirteenth Amendment to Lease Agreement between Active Power, Inc. and Braker-Stonehollow, Ltd. (successor to Metropolitan Life Insurance Company)
|
||
|
Fourteenth Amendment to Lease Agreement between Active Power, Inc. and Windsor at Stonehollow, LP (successor to Braker-Stonehollow, Ltd.)
|
||
|
Fifteenth Amendment to Lease Agreement between Active Power, Inc. and Windsor at Stonehollow, LP
|
|
Sixteenth Amendment to Lease Agreement between Active Power, Inc. and Stonehollow Industrial Investors, LLC
|
||
|
10.24*
|
Lease Agreement between Active Power, Inc. and BC12 99, Ltd. (filed as Exhibit 10.17 to the 2000 10-K)
|
|
|
First Amendment to Lease Agreement between Active Power, Inc. and BC 12 99, LTD.
|
||
|
Second Amendment to Lease Agreement between Active Power, Inc. and BC 12 99, LTD.
|
||
|
Third Amendment to Lease Agreement between Active Power, Inc. and BC 12 99, LTD.
|
||
|
Fourth Amendment to Lease Agreement between Active Power, Inc. and Levy Braker 12 Associates, LLC (successor in interest to BC 12 99, LTD.)
|
||
| 10.29† |
2015 Adleman Incentive Plan
|
|
|
10.30*†
|
Form of Severance Benefits Agreement (filed as Exhibit 10.4 to Active Power's Quarterly Report on Form 10-Q filed on April 27, 2010)
|
|
|
10.31*†
|
Offer Letter, effective September 26, 2013, between Active Power, Inc. and Mark A. Ascolese (filed as Exhibit 10.1 to Active Power’s Quarterly Report on Form 10-Q filed on November 18, 2013)
|
|
|
10.32*†
|
Severance Benefits Agreement, effective September 26, 2013, between Active Power, Inc. and Mark A. Ascolese (filed as Exhibit 10.2 to Active Power’s Quarterly Report on Form 10-Q filed on November 18, 2013)
|
|
|
10.33*†
|
Offer Letter, effective November 4, 2013, between Active Power, Inc. and Randall J. Adleman (filed as Exhibit 10.3 to Active Power’s Quarterly Report on Form 10-Q filed on November 18, 2013)
|
|
|
10.34*†
|
Severance Benefits Agreement, effective November 4, 2013, between Active Power, Inc. and Randall J. Adleman (filed as Exhibit 10.4 to Active Power’s Quarterly Report on Form 10-Q filed on November 18, 2013)
|
|
|
10.35*†
|
Offer Letter, dated November 14, 2013, between Active Power, Inc. and James A. Powers (filed as Exhibit 10.21 to Active Power’s Annual Report on Form 10-K filed on March 4, 2014)
|
|
|
10.36*†
|
Severance Benefits Agreement, dated November 14, 2013, between Active Power, Inc. and James A. Powers (filed as Exhibit 10.22 to Active Power’s Annual Report on Form 10-K filed on March 4, 2014)
|
|
|
10.37*†
|
Separation Agreement and Release, effective April 22, 2013, between Active Power, Inc. and Lisa Brown (filed as Exhibit 10.1 to Active Power's Quarterly Report on Form 10-Q filed on May 3, 2013)
|
|
|
10.38*†
|
Separation Agreement and Release, dated November 7, 2013, between Active Power, Inc. and Martin T. Olsen (filed as Exhibit 10.5 to Active Power's Quarterly Report on Form 10-Q filed on November 18, 2013)
|
|
|
10.39*†
|
Separation Agreement and Release, dated November 20, 2013, between Active Power, Inc. and Steven R. Fife (filed as Exhibit 10.25 to Active Power’s Annual Report on Form 10-K filed on March 4, 2014)
|
|
|
10.40*†
|
Separation and Release Agreement, effective January 4, 2014, between Active Power, Inc. and J. Noel Foley (filed as Exhibit 10.1 to Active Power’s Quarterly Report on Form 10-Q filed on May 1, 2014)
|
|
|
10.41*
|
Second Amended and Restated Loan and Security Agreement dated as of August 5, 2010 between Active Power, Inc. and Silicon Valley Bank (filed as Exhibit 10.1 to Active Power's Quarterly Report on Form 10-Q filed on October 27, 2010)
|
|
|
10.42*
|
First Amendment to Second Amended and Restated Loan and Security Agreement, dated March 5, 2012, between Active Power, Inc. and Silicon Valley Bank (filed as Exhibit 10.3 to Active Power's Quarterly Report on Form 10-Q filed on August 3, 2012)
|
|
|
10.43*
|
Second Amendment to Second Amended and Restated Loan and Security Agreement dated August 15, 2012 between Active Power, Inc. and Silicon Valley Bank (filed as Exhibit 10.1 to Active Power’s Current Report on Form 8-K filed on August 20, 2012)
|
|
|
10.44*
|
Third Amendment to Second Amended and Restated Loan and Security Agreement dated July 28, 2014 between Active Power, Inc. and Silicon Valley Bank (filed as Exhibit 10.1 to Active Power’s Current Report on Form 8-K filed on July 29, 2014)
|
|
|
10.45*
|
Guarantee and Debenture Agreement, dated as of August 5, 2010 between Active Power Solutions Limited and Silicon Valley Bank(filed as Exhibit 10.2 to Active Power's Quarterly Report on Form 10-Q filed on October 27, 2010)
|
|
|
10.46*
|
Side Letter Agreement dated March 7, 2012 between Active Power, Inc. and Kinderhook Partners, L.P. (filed as Exhibit 10.2 to Active Power’s Current Report on Form 8-K filed on March 8, 2012)
|
|
|
10.47*+
|
Purchase Agreement effective as of June 1, 2011 between Active Power, Inc. and Caterpillar, Inc. (filed as Exhibit 10.6 to Active Power’s Quarterly Report on Form 10-Q filed on April 30, 2012)
|
|
10.48*†
|
2015 Management Incentive Plan (filed as Exhibit 10.1 to Active Power’s Current Report on Form 8-K filed on February 17, 2015)
|
|
|
10.49*+
|
Hardware Product Purchase Agreement, dated April 30, 2010 between Active Power, Inc. and Hewlett-Packard Company (filed as Exhibit 10.25 to Active Power's Annual Report on Form 10-K filed on March 1, 2012)
|
|
|
Subsidiaries of the Registrant
|
||
|
Consent of Grant Thornton LLP
|
||
|
24.1
|
Power of Attorney, pursuant to which amendments to this Form 10-K may be filed, is included on the signature page contained in Part IV of this Form 10-K
|
|
|
Certification of Principal Executive Officer as required by Section 302 of the Sarbanes-Oxley Act of 2002
|
||
|
Certification of Principal Financial Officer as required by Section 302 of the Sarbanes-Oxley Act of 2002
|
||
|
Certification of Principal Executive Officer as required by Section 906 of the Sarbanes-Oxley Act of 2002
|
||
|
Certification of Principal Financial Officer as required by Section 906 of the Sarbanes-Oxley Act of 2002
|
||
|
101
|
The following financial statements from Active Power's Annual Report on Form 10-K for the fiscal year ended December 31, 2014, formatted in XBRL: (i) Consolidated Balance Sheets, (ii) Consolidated Statement of Operations and Comprehensive Loss, (iii) Consolidated Statement of Cash Flows, and (iv) Notes to Consolidated Financial Statements.
|
| * | Incorporated by reference to the indicated filing. |
| + | Portions of this exhibit have been omitted pursuant to a confidential treatment previously granted. |
| † | Management contract or compensatory plan or arrangement. |
REPORT OF INDEPENDENT REGISTERED PUBLIC ACCOUNTING FIRM
Board of Directors and Shareholders
Active Power, Inc.
We have audited the internal control over financial reporting of Active Power, Inc. (a Delaware corporation) and subsidiaries as of December 31, 2014, based on criteria established in the 2013 Internal Control—Integrated Framework issued by the Committee of Sponsoring Organizations of the Treadway Commission (COSO). The Company’s management is responsible for maintaining effective internal control over financial reporting and for its assessment of the effectiveness of internal control over financial reporting, included in the accompanying Management’s Report on Internal Control over Financial Reporting. Our responsibility is to express an opinion on the Company's internal control over financial reporting based on our audit.
We conducted our audit in accordance with the standards of the Public Company Accounting Oversight Board (United States). Those standards require that we plan and perform the audit to obtain reasonable assurance about whether effective internal control over financial reporting was maintained in all material respects. Our audit included obtaining an understanding of internal control over financial reporting, assessing the risk that a material weakness exists, testing and evaluating the design and operating effectiveness of internal control based on the assessed risk, and performing such other procedures as we considered necessary in the circumstances. We believe that our audit provides a reasonable basis for our opinion.
A company’s internal control over financial reporting is a process designed to provide reasonable assurance regarding the reliability of financial reporting and the preparation of financial statements for external purposes in accordance with generally accepted accounting principles. A company’s internal control over financial reporting includes those policies and procedures that (1) pertain to the maintenance of records that, in reasonable detail, accurately and fairly reflect the transactions and dispositions of the assets of the company; (2) provide reasonable assurance that transactions are recorded as necessary to permit preparation of financial statements in accordance with generally accepted accounting principles, and that receipts and expenditures of the company are being made only in accordance with authorizations of management and directors of the company; and (3) provide reasonable assurance regarding prevention or timely detection of unauthorized acquisition, use, or disposition of the company’s assets that could have a material effect on the financial statements.
Because of its inherent limitations, internal control over financial reporting may not prevent or detect misstatements. Also, projections of any evaluation of effectiveness to future periods are subject to the risk that controls may become inadequate because of changes in conditions, or that the degree of compliance with the policies or procedures may deteriorate.
In our opinion, the Company maintained, in all material respects, effective internal control over financial reporting as of December 31, 2014, based on criteria established in the 2013 Internal Control-Integrated Framework issued by COSO.
We also have audited, in accordance with the standards of the Public Company Accounting Oversight Board (United States), the consolidated financial statements of the Company as of and for the year ended December 31, 2014, and our report dated February 27, 2015 expressed an unqualified opinion on those financial statements.
|
/s/ Grant Thornton LLP
|
|
|
Dallas, Texas
|
|
|
February 27, 2015
|
REPORT OF INDEPENDENT REGISTERED PUBLIC ACCOUNTING FIRM
Board of Directors and Shareholders
Active Power, Inc.
We have audited the accompanying consolidated balance sheets of Active Power, Inc. (a Delaware corporation) and subsidiaries as of December 31, 2014 and 2013, and the related consolidated statements of operations and comprehensive loss, stockholders’ equity, and cash flows for each of the three years in the period ended December 31, 2014. These financial statements are the responsibility of the Company’s management. Our responsibility is to express an opinion on these financial statements based on our audits.
We conducted our audits in accordance with the standards of the Public Company Accounting Oversight Board (United States). Those standards require that we plan and perform the audit to obtain reasonable assurance about whether the financial statements are free of material misstatement. An audit includes examining, on a test basis, evidence supporting the amounts and disclosures in the financial statements. An audit also includes assessing the accounting principles used and significant estimates made by management, as well as evaluating the overall financial statement presentation. We believe that our audits provide a reasonable basis for our opinion.
In our opinion, the consolidated financial statements referred to above present fairly, in all material respects, the financial position of Active Power, Inc. and subsidiaries as of December 31, 2014 and 2013, and the results of their operations and their cash flows for each of the three years in the period ended December 31, 2014, in conformity with accounting principles generally accepted in the United States of America.
We also have audited, in accordance with the standards of the Public Company Accounting Oversight Board (United States), Active Power, Inc.’s internal control over financial reporting as of December 31, 2014, based on criteria established in the 2013 Internal Control—Integrated Framework issued by the Committee of Sponsoring Organizations of the Treadway Commission (COSO), and our report dated February 27, 2015 expressed an unqualified opinion.
|
/s/ Grant Thornton LLP
|
|
|
Dallas, Texas
|
|
|
February 27, 2015
|
Active Power, Inc.
Consolidated Balance Sheets
(in thousands, except par value)
|
December 31, 2014
|
December 31, 2013
|
|||||||
|
ASSETS
|
||||||||
|
Current assets:
|
||||||||
|
Cash and cash equivalents
|
$
|
14,824
|
$
|
12,261
|
||||
|
Restricted cash
|
40
|
520
|
||||||
|
Accounts receivable, net of allowance for doubtful accounts of $212 and $313 at December 31, 2014 and December 31, 2013, respectively
|
11,222
|
9,075
|
||||||
|
Inventories, net
|
6,845
|
12,020
|
||||||
|
Prepaid expenses and other
|
800
|
680
|
||||||
|
Total current assets
|
33,731
|
34,556
|
||||||
|
Property and equipment, net
|
2,076
|
3,056
|
||||||
|
Deposits and other
|
291
|
295
|
||||||
|
Total assets
|
$
|
36,098
|
$
|
37,907
|
||||
|
LIABILITIES AND STOCKHOLDERS' EQUITY
|
||||||||
|
Current liabilities:
|
||||||||
|
Accounts payable
|
$
|
4,044
|
$
|
2,993
|
||||
|
Accrued expenses
|
4,134
|
5,583
|
||||||
|
Deferred revenue
|
2,771
|
2,749
|
||||||
|
Revolving line of credit
|
5,535
|
5,535
|
||||||
|
Total current liabilities
|
16,484
|
16,860
|
||||||
|
Long-term liabilities
|
821
|
741
|
||||||
|
Commitments and contingencies
|
||||||||
|
Stockholders' equity
|
||||||||
|
Preferred stock - $0.001 par value; 2,000 shares authorized
|
-
|
-
|
||||||
|
Common stock - $0.001 par value; 40,000 and 30,000 shares authorized; 23,162 and 19,452 issued and 23,094 and 19,388 outstanding at December 31, 2014 and 2013, respectively
|
23
|
19
|
||||||
|
Treasury stock
|
(231
|
)
|
(215
|
)
|
||||
|
Additional paid-in capital
|
302,667
|
290,964
|
||||||
|
Accumulated deficit
|
(283,995
|
)
|
(271,168
|
)
|
||||
|
Other accumulated comprehensive income
|
329
|
706
|
||||||
|
Total stockholders' equity
|
18,793
|
20,306
|
||||||
|
Total liabilities and stockholders' equity
|
$
|
36,098
|
$
|
37,907
|
||||
See accompanying notes.
Active Power, Inc.
Consolidated Statement of Operations and Comprehensive Loss
(in thousands, except per share amounts)
|
Year Ended December 31,
|
||||||||||||
|
2014
|
2013
|
2012
|
||||||||||
|
Revenues:
|
||||||||||||
|
Product revenue
|
$
|
36,211
|
$
|
44,158
|
$
|
62,031
|
||||||
|
Service and other revenue
|
12,925
|
17,541
|
14,284
|
|||||||||
|
Total revenue
|
49,136
|
61,699
|
76,315
|
|||||||||
|
Cost of goods sold:
|
||||||||||||
|
Cost of product revenue
|
29,182
|
32,825
|
42,510
|
|||||||||
|
Cost of service and other revenue
|
7,302
|
9,478
|
9,091
|
|||||||||
|
Total cost of goods sold
|
36,484
|
42,303
|
51,601
|
|||||||||
|
Gross profit
|
12,652
|
19,396
|
24,714
|
|||||||||
|
Operating expenses:
|
||||||||||||
|
Research and development
|
6,689
|
7,430
|
5,440
|
|||||||||
|
Selling and marketing
|
11,940
|
12,032
|
14,139
|
|||||||||
|
General and administrative
|
6,043
|
7,551
|
6,861
|
|||||||||
|
Total operating expenses
|
24,672
|
27,013
|
26,440
|
|||||||||
|
Loss from Operations
|
(12,020
|
)
|
(7,617
|
)
|
(1,726
|
)
|
||||||
|
Interest expense, net
|
(395
|
)
|
(370
|
)
|
(327
|
)
|
||||||
|
Other income (expense), net
|
(160
|
)
|
(364
|
)
|
131
|
|||||||
|
Loss before income taxes
|
(12,575
|
)
|
(8,351
|
)
|
(1,922
|
)
|
||||||
|
Income tax expense
|
(252
|
)
|
-
|
-
|
||||||||
|
Net Loss
|
$
|
(12,827
|
)
|
$
|
(8,351
|
)
|
$
|
(1,922
|
)
|
|||
|
Net Loss per share, basic and diluted
|
$
|
(0.57
|
)
|
$
|
(0.43
|
)
|
$
|
(0.10
|
)
|
|||
|
Shares used in computing net loss per share, basic and diluted
|
22,494
|
19,329
|
18,584
|
|||||||||
|
Comprehensive loss:
|
||||||||||||
|
Net loss
|
$
|
(12,827
|
)
|
$
|
(8,351
|
)
|
$
|
(1,922
|
)
|
|||
|
Translation gain (loss) on subsidiaries denominated in foreign currencies
|
(377
|
)
|
384
|
123
|
||||||||
|
Comprehensive loss
|
$
|
(13,204
|
)
|
$
|
(7,967
|
)
|
$
|
(1,799
|
)
|
|||
See accompanying notes.
Active Power, Inc.
Consolidated Statement of Stockholders' Equity
(in thousands, except per share amounts)
|
Common Stock
|
Treasury Stock
|
|||||||||||||||||||||||||||||||
|
Number of
Shares
|
Par
Value
|
Number of
Shares
|
At Cost
|
Additional
Paid-In
Capital
|
Accumulated
Deficit
|
Other
Accumulated Comprehen-
sive Income
(Loss)
|
Total
Stockholders'
Equity
|
|||||||||||||||||||||||||
|
Balance at December 31, 2011
|
16,116
|
$
|
16
|
28
|
$
|
(115
|
)
|
$
|
277,087
|
$
|
(260,895
|
)
|
$
|
199
|
$
|
16,292
|
||||||||||||||||
|
Employee stock option exercises
|
155
|
-
|
-
|
-
|
562
|
-
|
-
|
562
|
||||||||||||||||||||||||
|
Sale of common stock, less issuance costs
|
2,868
|
3
|
-
|
-
|
9,560
|
-
|
-
|
9,563
|
||||||||||||||||||||||||
|
Release of Restricted Stock
|
32
|
-
|
-
|
-
|
-
|
-
|
-
|
-
|
||||||||||||||||||||||||
|
Shares held in treasury
|
-
|
-
|
5
|
(29
|
)
|
-
|
-
|
-
|
(29
|
)
|
||||||||||||||||||||||
|
Net translation gain on foreign subsidiaries
|
-
|
-
|
-
|
-
|
-
|
-
|
123
|
123
|
||||||||||||||||||||||||
|
Stock-based compensation
|
-
|
-
|
-
|
-
|
1,410
|
-
|
-
|
1,410
|
||||||||||||||||||||||||
|
Net Loss
|
-
|
-
|
-
|
-
|
-
|
(1,922
|
)
|
-
|
(1,922
|
)
|
||||||||||||||||||||||
|
Balance at December 31, 2012
|
19,171
|
$
|
19
|
33
|
$
|
(144
|
)
|
$
|
288,619
|
$
|
(262,817
|
)
|
$
|
322
|
$
|
25,999
|
||||||||||||||||
|
Employee stock option exercises
|
200
|
-
|
-
|
-
|
711
|
-
|
-
|
711
|
||||||||||||||||||||||||
|
Release of Restricted Stock
|
81
|
-
|
4
|
-
|
-
|
4
|
||||||||||||||||||||||||||
|
Shares held in treasury
|
-
|
-
|
18
|
(71
|
)
|
-
|
-
|
-
|
(71
|
)
|
||||||||||||||||||||||
|
Net translation gain on foreign subsidiaries
|
-
|
-
|
-
|
-
|
-
|
-
|
384
|
384
|
||||||||||||||||||||||||
|
Stock-based compensation
|
-
|
-
|
-
|
-
|
1,689
|
-
|
-
|
1,689
|
||||||||||||||||||||||||
|
Issuance costs, shelf registration
|
(59
|
)
|
-
|
(59
|
)
|
|||||||||||||||||||||||||||
|
Net Loss
|
-
|
-
|
-
|
-
|
-
|
(8,351
|
)
|
-
|
(8,351
|
)
|
||||||||||||||||||||||
|
Balance at December 31, 2013
|
19,452
|
$
|
19
|
51
|
$
|
(215
|
)
|
$
|
290,964
|
$
|
(271,168
|
)
|
$
|
706
|
$
|
20,306
|
||||||||||||||||
|
Employee stock option exercises
|
43
|
-
|
-
|
-
|
129
|
-
|
-
|
129
|
||||||||||||||||||||||||
|
Sale of common stock, less issuance costs
|
3,651
|
4
|
10,434
|
10,438
|
||||||||||||||||||||||||||||
|
Release of Restricted Stock
|
16
|
-
|
-
|
-
|
-
|
|||||||||||||||||||||||||||
|
Shares held in treasury
|
-
|
-
|
5
|
(16
|
)
|
-
|
-
|
-
|
(16
|
)
|
||||||||||||||||||||||
|
Net translation loss on foreign subsidiaries
|
-
|
-
|
-
|
-
|
-
|
-
|
(377
|
)
|
(377
|
)
|
||||||||||||||||||||||
|
Stock-based compensation
|
-
|
-
|
-
|
-
|
1,140
|
-
|
-
|
1,140
|
||||||||||||||||||||||||
|
Net Loss
|
-
|
-
|
-
|
-
|
-
|
(12,827
|
)
|
-
|
(12,827
|
)
|
||||||||||||||||||||||
|
Balance at December 31, 2014
|
23,162
|
$
|
23
|
56
|
$
|
(231
|
)
|
$
|
302,667
|
$
|
(283,995
|
)
|
$
|
329
|
$
|
18,793
|
||||||||||||||||
See accompanying notes.
Active Power, Inc.
Consolidated Statement of Cash Flows
(in thousands)
|
Year ended December 31,
|
||||||||||||
|
2014
|
2013
|
2012
|
||||||||||
|
Operating activities
|
||||||||||||
|
Net Loss
|
$
|
(12,827
|
)
|
$
|
(8,351
|
)
|
$
|
(1,922
|
)
|
|||
|
Adjustments to reconcile net loss to cash used in operating activities:
|
||||||||||||
|
Depreciation expense
|
1,220
|
1,084
|
1,282
|
|||||||||
|
Change to allowance for doubtful accounts
|
(101
|
)
|
(175
|
)
|
151
|
|||||||
|
Loss (gain) on disposal of fixed assets
|
4
|
30
|
(35
|
)
|
||||||||
|
Impairment on fixed assets
|
57
|
69
|
218
|
|||||||||
|
Stock-based compensation
|
1,140
|
1,700
|
1,410
|
|||||||||
|
Changes in operating assets and liabilities:
|
||||||||||||
|
Restricted cash
|
480
|
(520
|
)
|
389
|
||||||||
|
Accounts receivable
|
(2,046
|
)
|
8,962
|
(6,850
|
)
|
|||||||
|
Inventories
|
5,257
|
(1,796
|
)
|
(1,640
|
)
|
|||||||
|
Prepaid expenses and other assets
|
(116
|
)
|
(99
|
)
|
(58
|
)
|
||||||
|
Accounts payable
|
1,051
|
(1,043
|
)
|
(721
|
)
|
|||||||
|
Accrued expenses
|
(1,449
|
)
|
623
|
(403
|
)
|
|||||||
|
Deferred revenue
|
22
|
(1,819
|
)
|
2,202
|
||||||||
|
Long term liabilities
|
80
|
28
|
(13
|
)
|
||||||||
|
Net cash used in operating activities
|
(7,228
|
)
|
(1,307
|
)
|
(5,990
|
)
|
||||||
|
Investing activities
|
||||||||||||
|
Purchases of property and equipment
|
(343
|
)
|
(996
|
)
|
(1,274
|
)
|
||||||
|
Proceeds from sale of fixed assets
|
19
|
71
|
212
|
|||||||||
|
Net cash used in investing activities
|
(324
|
)
|
(925
|
)
|
(1,062
|
)
|
||||||
|
Financing activities
|
||||||||||||
|
Proceeds from public offering of common stock, net of issuance cost
|
10,438
|
-
|
-
|
|||||||||
|
Proceeds from private placement of common stock
|
-
|
-
|
9,750
|
|||||||||
|
Issuance costs of private placement
|
-
|
-
|
(187
|
)
|
||||||||
|
Proceeds from draw on revolving line of credit
|
-
|
-
|
2,017
|
|||||||||
|
Payments on revolving line of credit
|
-
|
-
|
(2,017
|
)
|
||||||||
|
Proceeds from employee stock option exercises
|
129
|
711
|
562
|
|||||||||
|
Issuance costs, shelf registration
|
-
|
(59
|
)
|
-
|
||||||||
|
Taxes paid related to the net share settlement of equity awards
|
(16
|
)
|
(67
|
)
|
(29
|
)
|
||||||
|
Net cash provided by financing activities
|
10,551
|
585
|
10,096
|
|||||||||
|
Effects of exchange rates on cash
|
(436
|
)
|
384
|
123
|
||||||||
|
Change in cash and cash equivalents
|
2,563
|
(1,263
|
)
|
3,167
|
||||||||
|
Cash and cash equivalents, beginning of period
|
12,261
|
13,524
|
10,357
|
|||||||||
|
Cash and cash equivalents, end of period
|
$
|
14,824
|
$
|
12,261
|
$
|
13,524
|
||||||
|
Supplemental Cash Flow Information:
|
||||||||||||
|
Interest Paid
|
$
|
401
|
$
|
380
|
$
|
335
|
||||||
|
Income Tax Paid
|
$
|
252
|
$
|
-
|
$
|
-
|
||||||
See accompanying notes.
ACTIVE POWER, INC.
NOTES TO CONSOLIDATED FINANCIAL STATEMENTS
December 31, 2014
(in thousands, except share and per share amounts)
1. Summary of Significant Accounting Policies
Description of Business
Active Power, Inc. and its subsidiaries (collectively, “we”, “us”, “Active Power” or “Company”) design, manufacture, sell and service flywheel-based uninterruptible power supply (“UPS”) products that use kinetic energy to provide short-term power as a cleaner alternative to conventional electro-chemical battery-based energy storage. We also design, manufacture, sell, and service modular infrastructure solutions (“MIS”) that integrate critical power components into a pre-packaged, purpose built enclosure that may include our UPS products as a component. Our products and solutions are based on our patented flywheel and power electronics technology and are designed to ensure continuity for data centers and other mission critical operations in the event of power disturbances.
Our products and solutions are designed to deliver continuous conditioned power during power disturbances such as voltage sags and surges, and to provide ride-through power in the event of a brief utility failure, supporting operations until utility power is restored or a longer term alternative power source, such as a diesel generator, is started. We sell our products globally through our direct sales force, manufacturer’s representatives, distributors, Original Equipment Manufacturer (“OEM”) channel, and IT partners in the Americas, in Europe, Middle East, and Africa (“EMEA”), and in the Asia Pacific region (“APAC”).
We also offer services, including hardware and software maintenance, on all Active Power products, and other professional services such as assessment and implementation, for our customers’ infrastructure projects.
We were founded as a Texas Corporation in 1992 and reincorporated in Delaware in 2000. Our headquarters are in Austin, Texas with international offices in the United Kingdom, Germany and China.
The accompanying consolidated financial statements have been prepared in accordance with accounting principles generally accepted in the United States of America (“US GAAP”) and include the accounts of the Company and its consolidated subsidiaries. All intercompany transactions and balances have been eliminated upon consolidation.
The accompanying consolidated financial statements have also been prepared on the assumption that the Company will continue to operate as a going concern. Accordingly, assets and liabilities are recorded on the basis that the Company will be able to realize its assets and discharge its liabilities in the normal course of business. The Company’s history of operating losses and use of cash, in the absence of other factors, may cause uncertainty as to its ability to continue as a going concern. We have reviewed the current and prospective sources of liquidity, significant conditions and events and forecast financial results and concluded that we have adequate resources to continue to operate as a going concern. Our business plan and our assumptions around the adequacy of our liquidity are based on estimates regarding expected revenues and future costs. However, our revenues may not meet our projections or our costs may exceed our estimates. Further, our estimates may change and future events or developments may also affect our estimates. Any of these factors may change our expectation of cash usage in 2015 or significantly affect our level of liquidity, which may require us to seek additional financing or take other measures to reduce our operating costs in order to continue operating. These financial statements do not include any adjustments that might result from the Company not being able to continue as a going concern.
All common stock information and related share prices included in these notes to financial statements have been adjusted to reflect the five for one reverse stock split that occurred on December 21, 2012.
Use of Estimates
The preparation of financial statements in conformity with US GAAP requires management to make estimates and assumptions that affect the amounts reported in the financial statements and accompanying notes. Actual results could differ from those estimates. Changes in the estimates or assumptions used by management could have a material impact upon reported amounts and our results of operations.
Revenue Recognition
In general, we recognize revenue when four criteria are met: (i) persuasive evidence that an arrangement exists; (ii) delivery has occurred or services have been rendered; (iii) the sales price is fixed or determinable; and (iv) collectability is reasonably assured. In general, revenue is recognized when revenue-generating transactions generally fall into one of the following categories of revenue recognition:
| · | We recognize product revenue at the time of shipment for a significant portion of all products sold directly to customers and through distributors because title and risk of loss pass on delivery to the common carrier. Our customers and distributors do not have the right to return products. If title and risk of loss pass at some other point in time, we recognize such revenue for our customers when the product is delivered to the customer and title and risk of loss has passed. We may enter into bill-and-hold arrangements and when this happens delivery may not occur, but other criteria are reviewed to determine proper timing of revenue recognition. |
| · | We recognize installation, service and maintenance revenue at the time the service is performed. |
| · | We recognize revenue associated with extended maintenance agreements (“EMAs”) over the life of the contracts using the straight-line method, which approximates the expected timing in which applicable services are performed. Amounts collected in advance of revenue recognition are recorded as a current liability in the deferred revenue line of the consolidated balance sheet or long-term liability based on the time from the balance sheet date to the future date of revenue recognition. |
| · | We recognize revenue on certain rental programs over the life of the rental agreement using the straight-line method. Amounts collected in advance of revenue recognition are recorded as a current or long-term liability based on the time from the balance sheet date to the future date of revenue recognition. |
When collectability is not reasonably assured, we defer revenue and will recognize revenue as payments are received.
Multiple element arrangements (“MEAs”) are arrangements to sell products to customers that frequently include multiple deliverables. Our most significant MEAs include the sale of one or more of our CleanSource UPS or CleanSource PowerHouse products, combined with one or more of the following products: design services, project management, commissioning and installation services, spare parts or consumables, and EMA’s. Delivery of the various products or performance of services within the arrangement may or may not coincide. Certain services related to design and consulting may occur prior to product delivery. Commissioning and installation typically take place within six months of product delivery, depending upon customer requirements. EMAs, consumables, and repair, maintenance or consulting services are generally delivered over a period of one to five years. In certain arrangements revenue recognized is limited to the amount invoiced or received that is not contingent on the delivery of future products and services.
When arrangements include multiple elements, we allocate revenue to each element based on the relative selling price and recognize revenue when the elements have standalone value and the four criteria for revenue recognition have been met. We establish the selling price of each element based on Vendor Specific Objective Evidence (“VSOE”) if available, Third Party Evidence (“TPE”) if VSOE is not available, or best estimate of selling price (“BESP”) if neither VSOE nor TPE is available. We generally determine selling price based on amounts charged separately for the delivered and undelivered elements to similar customers in standalone sales of the specific elements. When arrangements include an EMA, we recognize revenue related to the EMA at the stated contractual price on a straight-line basis over the life of the agreement.
Any taxes imposed by governmental authorities on our revenue-producing transactions with customers are shown in our consolidated statements of operations on a net-basis; that is, excluded from our reported revenues.
Shipping and Handling Costs
We classify shipping and handling costs related to product sales as cost of revenue, and any payments from customers for shipping and handling are categorized in revenue. We classify shipping and handling costs associated with receiving production inventory as cost of product revenue. Any materials received or shipped which are related to our engineering, sales, marketing and administrative functions are classified as operating expenses.
Cash and Cash Equivalents
Investments with a contractual maturity of three months or less when purchased are classified as cash equivalents.
Fair Value of Financial Instruments
Fair value is measured based on an exit price, representing the amount that would be received to sell an asset or paid to satisfy a liability in an orderly transaction between market participants. Fair value is a market-based measurement that should be determined based on assumptions that market participants would use in pricing an asset or liability. As a basis for considering such assumptions, a fair value hierarchy is established, which categorizes the inputs used in measuring fair value as follows:
Level 1—Quoted prices in active markets for identical assets or liabilities.
Level 2—Significant observable inputs other than quoted prices in Level 1, such as quoted prices for similar assets and liabilities in active markets; quoted prices for identical or similar assets and liabilities in markets that are not active; or other inputs that are observable or can be corroborated by observable market data.
Level 3—One or more significant inputs that are unobservable and supported by little or no market data.
Highest priority is given for Level 1 input and lower propriety to Level 3 inputs. A financial instruments level is based on the lowest level of any input that is significant to the fair value measurement. No changes were made to our methodology.
Our Level 1 assets consist of cash equivalents, which are primarily invested in money-market funds. These assets are classified as Level 1 because they are valued using quoted prices in active markets and other relevant information generated by market transactions involving identical assets and liabilities. The fair value was $3.1 million as of December 31, 2014 and 2013.
For cash and cash equivalents, accounts receivable, accounts payable and our revolving line of credit, the carrying amount approximates fair value because of the relative short maturity of those instruments.
Allowance for Doubtful Accounts
We estimate an allowance for doubtful accounts based on factors related to the credit risk of each customer. Historically, credit losses were minimal, primarily because the majority of our revenues were generated from large customers, primarily Caterpillar, Inc. (“Caterpillar”) and Hewlett Packard Corporation (“HP”). We perform credit evaluations of new customers and often require deposits, prepayments or use of bank instruments such as trade letters of credit to mitigate our credit risk. We write off uncollectable trade receivables, and record any recoveries of previous write offs against the allowance. Our standard terms are net 30 days; however we may have agreements with our larger customers and certain distributors, OEM customers, and IT channel that allow for more extended terms at or above net 60 days.
The following table summarizes the annual changes in our allowance for doubtful accounts (in thousands):
|
Balance at December 31, 2011
|
$
|
337
|
||
|
Change in provision charged to expense
|
151
|
|||
|
Write-off of uncollectible accounts, net of recoveries
|
-
|
|||
|
Balance at December 31, 2012
|
$
|
488
|
||
|
Change in provision charged to expense
|
(139
|
)
|
||
|
Write-off of uncollectible accounts, net of recoveries
|
(36
|
)
|
||
|
Balance at December 31, 2013
|
$
|
313
|
||
|
Change in provision charged to expense
|
(67
|
)
|
||
|
Write-off of uncollectible accounts, net of recoveries
|
(34
|
)
|
||
|
Balance at December 31, 2014
|
$
|
212
|
||
Inventories, net
Inventories, net are stated at the lower of cost or market, using the first-in-first-out method, and consisted of the following at December 31 (in thousands, net of allowances):
|
2014
|
2013
|
|||||||
|
Raw materials
|
$
|
5,440
|
$
|
4,521
|
||||
|
Work in progress
|
473
|
2,429
|
||||||
|
Finished goods
|
932
|
5,070
|
||||||
|
$
|
6,845
|
$
|
12,020
|
|||||
Property and Equipment
Property and equipment is stated at cost and is depreciated using the straight-line method over the estimated useful lives of the assets, as follows (in years):
|
Equipment
|
2 - 10
|
|||
|
Demonstration units
|
3 - 5
|
|||
|
Computers and purchased software
|
2 - 3
|
|||
|
Furnitures and fixtures
|
2 - 5
|
Leasehold improvements are depreciated over the shorter of the life of the improvement or the remainder of the property lease term, including renewal options, generally three to five years. Repairs and maintenance is expensed as incurred.
Long-Lived Assets
Long-lived assets held and used by the Company are reviewed for impairment whenever events or changes in circumstances indicate that their net book value may not be recoverable. When such factors and circumstances exist, we compare the projected undiscounted future cash flows associated with the related asset or group of assets over their estimated useful lives against their respective carrying amounts. Impairment, if any, is based on the excess of the carrying amount over the fair value of those assets and is recorded in the period in which the determination was made.
Accrued Expenses
Accrued expenses consist of the following at December 31 (in thousands):
|
2014
|
2013
|
|||||||
|
Compensation, severance and benefits
|
$
|
1,296
|
$
|
2,685
|
||||
|
Warranty liability
|
475
|
529
|
||||||
|
Taxes, other than income
|
1,080
|
483
|
||||||
|
Professional fees
|
463
|
759
|
||||||
|
Other
|
820
|
1,127
|
||||||
|
$
|
4,134
|
$
|
5,583
|
|||||
Warranty Liability
Generally, the warranty period for our power quality products is 12 months from the date of commissioning or 18 months from the date of shipment from Active Power, whichever period is shorter. Occasionally we offer longer warranty periods to certain customers. The warranty period for products sold to our primary OEM customer, Caterpillar, is 12 months from the date of shipment to the end-user, or up to 36 months from shipment from Active Power. This is dependent upon Caterpillar complying with our storage requirements for our products in order to preserve this warranty period beyond the standard 18-month limit. We provide for the estimated cost of product warranties at the time revenue is recognized and this accrual is included in accrued expenses and long term liabilities on the accompanying consolidated balance sheet.
Changes in the Company’s warranty liability are as follows (in thousands):
|
Balance at December 31, 2011
|
$
|
613
|
||
|
Warranty expense
|
1,294
|
|||
|
Payments
|
(1,152
|
)
|
||
|
Balance at December 31, 2012
|
$
|
755
|
||
|
Warranty expense
|
589
|
|||
|
Payments
|
(782
|
)
|
||
|
Balance at December 31, 2013
|
$
|
562
|
||
|
Warranty expense
|
660
|
|||
|
Payments
|
(695
|
)
|
||
|
Balance at December 31, 2014
|
$
|
527
|
||
|
Warranty liability included in accrued expenses
|
$
|
475
|
||
|
Long term warranty liability
|
52
|
|||
|
Balance at December 31, 2014
|
$
|
527
|
Long-Term Liabilities
Long term liabilities consisted of the following at December 31 (in thousands):
|
2014
|
2013
|
|||||||
|
Deferred revenue
|
$
|
751
|
$
|
601
|
||||
|
Technology licensing agreement
|
-
|
88
|
||||||
|
Warranty liability
|
52
|
33
|
||||||
|
Sublease deposits
|
18
|
19
|
||||||
|
$
|
821
|
$
|
741
|
|||||
Stock-Based Compensation Expense
We account for our stock-based compensation using the Black Scholes option valuation model. Stock-based compensation cost is estimated at the grant date based on the fair-value of the award and is recognized as expense ratably over the requisite service period of the award, generally four years. We develop our estimates of expected life and forfeitures based on historical data. We estimate stock price volatility based on historical volatilities. The risk-free rates are based on the U.S. Treasury yield in effect at the time of grant. Details of our stock-based compensation include the following (in thousands):
|
2014
|
2013
|
2012
|
||||||||||
|
Stock-based compensation expense by caption:
|
||||||||||||
|
Cost of product revenue
|
$
|
110
|
$
|
254
|
$
|
216
|
||||||
|
Cost of service and other revenue
|
111
|
116
|
70
|
|||||||||
|
Research and development
|
207
|
204
|
153
|
|||||||||
|
Selling and marketing
|
370
|
587
|
484
|
|||||||||
|
General and administrative
|
342
|
539
|
486
|
|||||||||
|
$
|
1,140
|
$
|
1,700
|
$
|
1,409
|
|||||||
|
Stock-based compensation expense by type of award:
|
||||||||||||
|
Stock options
|
$
|
1,068
|
$
|
1,488
|
$
|
1,213
|
||||||
|
Restricted stock awards
|
72
|
212
|
196
|
|||||||||
|
$
|
1,140
|
$
|
1,700
|
$
|
1,409
|
|||||||
Assumptions used in the Black-Scholes model for our stock plans are presented below:
|
2014
|
2013
|
2012
|
||||||||||
|
Weighted average expected life in years
|
6.27 years
|
6.35 years
|
6.83 years
|
|||||||||
|
Weighted average expected volatility
|
75
|
%
|
76
|
%
|
77
|
%
|
||||||
|
Volatility Range
|
73%-76
|
%
|
75%-76
|
%
|
75%-78
|
%
|
||||||
|
Risk-free interest rate range
|
1.96%-2.12
|
%
|
1.13%-2.38
|
%
|
0.63%-1.00
|
%
|
||||||
|
Weighted average forfeiture rate
|
29.7
|
%
|
18.9
|
%
|
17.0
|
%
|
||||||
Income Taxes
We account for income taxes using the liability method of accounting for income taxes. Under the liability method, deferred taxes are determined based on the differences between the financial statement and tax basis of assets and liabilities using enacted tax rates in effect in the years in which the differences are expected to reverse. A valuation allowance is recorded to reduce the carrying amounts of deferred tax assets if it is more likely than not such assets will not be realized. Deferred income taxes reflect the net tax effects of temporary differences between the carrying amounts of assets and liabilities for financial reporting purposes and the amounts used for income tax purposes.
We recognize the financial statement benefit of a tax position that does not meet the more-likely-than-not threshold only after the statute of limitations expire of the relevant tax authority sustains the Company’s position following an audit. For tax positions meeting the more likely-than-not threshold, the amount recognized in the financial statements is the largest benefit that has a greater than 50 percent likelihood of being realized upon the ultimate settlement with the relevant tax authority. At December 31, 2014 and 2013, the Company had no material unrecognized tax benefits.
The Company recognizes interest and penalties related to uncertain tax positions in income tax expense. As of December 31, 2014, the Company had no accrued or expensed interest or penalties related to uncertain tax positions.
Segment Reporting
Active Power’s chief operating decision makers allocate resources and assess the performance of its power management product development and sales activities as one segment.
Concentration of Credit Risk
Financial instruments which potentially subject Active Power to concentrations of credit risk consist of cash and cash equivalents, investments and accounts receivable. Active Power’s cash and cash equivalents and investments are placed with high credit quality financial institutions and issuers. From time to time, we may have amounts on deposit with financial institutions that are in excess of the federally insured limit. We have not experienced any losses on deposits of cash and cash equivalents.
Active Power performs credit evaluations of its customers’ financial condition prior to entering into commercial transactions. We generally require letters of credit or prepayments from higher-risk customers as deemed necessary to ensure collection. Our allowance for doubtful accounts is estimated based on factors related to the credit risk of each customer. Individual receivables are written off after they have been deemed uncollectible. We also purchase several components from sole source or limited source suppliers.
Economic Dependence
We are significantly dependent on our relationships with HP and Caterpillar. If these relationships are unsuccessful or discontinue, our business and revenue may suffer. The loss of, or a significant reduction in, orders from HP or Caterpillar, or the failure to provide adequate service and support to the end-users of our products by HP or Caterpillar, could significantly reduce our revenue. Our operating results in the foreseeable future will continue to depend on the sales made by a relatively small number of customers, including HP and Caterpillar.
The following customers accounted for a significant percentage of Active Power’s total revenue during each of the years ended December 31:
|
2014
|
2013
|
2012
|
||||||||||
|
Caterpillar
|
18
|
%
|
14
|
%
|
13
|
%
|
||||||
|
HP
|
1
|
%
|
22
|
%
|
35
|
%
|
||||||
|
European based IT Customer
|
-
|
-
|
12
|
%
|
||||||||
No other customer represented more than 10% of our revenues in any of the years reported. Caterpillar represented 18% and 23% of our outstanding accounts receivable at December 31, 2014 and 2013, respectively. HP represented 22% of our outstanding receivables at December 31, 2013.
Advertising Costs
We expense advertising costs as incurred. These expenses were immaterial in 2014, 2013, and 2012, respectively.
Net Loss Per Share
The following table sets forth the computation of basic and diluted net loss per share (in thousands) for the years ended December 31:
|
2014
|
2013
|
2012
|
||||||||||
|
Net loss
|
$
|
(12,827
|
)
|
$
|
(8,351
|
)
|
$
|
(1,922
|
)
|
|||
|
Basic and diluted:
|
||||||||||||
|
Weighted-average shares of common stock outstanding used in computing basic and diluted net loss per share
|
22,494
|
19,329
|
18,584
|
|||||||||
|
Basic and diluted net loss per share
|
$
|
(0.57
|
)
|
$
|
(0.43
|
)
|
$
|
(0.10
|
)
|
|||
The calculation of diluted net loss per share excludes 2,399,890, 2,407,664, and 1,882,584 shares of common stock issuable upon exercise of employee stock options as of December 31, 2014, 2013, and 2012, respectively, and 21,994, 53,038, and 200,071 non-vested shares of common stock issuable upon exercise of restricted stock awards as of December 31, 2014, 2013, and 2012, respectively, because their inclusion in the calculation would be anti-dilutive.
Recent Accounting Pronouncements
In August 2014, the Financial Accounting Standards Board (the “FASB”) issued Accounting Standards Update (“ASU”) No. 2014-15, (“ASU 2014-15”), “Disclosure of Uncertainties About an Entity’s Ability to Continue as a Going Concern”. ASU 2014-15 requires management to perform interim and annual assessments of an entity’s ability to continue as a going concern within one year of the date the financial statements are issued and provides guidance on determining when and how to disclose going concern uncertainties in the financial statements. Certain disclosures will be required if conditions give rise to substantial doubt about an entity’s ability to continue as a going concern. ASU 2014-15 applies to all entities and is effective for annual and interim reporting periods ending after December 15, 2016, with early adoption permitted. The Company does not expect that the adoption of this standard will have a material effect on its financial statements.
In May 2014, the FASB issued ASU 2014-09, “Revenue from Contracts with Customers”, “Topic 606”. This ASU will supersede the revenue recognition requirements in Topic 605, Revenue Recognition, and most industry-specific guidance, and creates a Topic 606 Revenue from Contracts with Customers. The core principle of the guidance is that an entity should recognize revenue to depict the transfer of promised goods or services to customers in an amount that reflects the consideration to which the entity expects to be entitled in exchange for those goods or services. The Company will adopt this guidance January 1, 2017 as required. We are evaluating the new guidelines to see if they will have a significant impact on our consolidated results of operation, financial condition or cash flows.
2. Property and Equipment
Property and equipment consists of the following at December 31 (in thousands):
|
2014
|
2013
|
|||||||
|
Equipment
|
$
|
9,122
|
$
|
9,168
|
||||
|
Demonstration units
|
1,836
|
1,470
|
||||||
|
Computers and purchased software
|
3,321
|
3,273
|
||||||
|
Furnitures and fixtures
|
366
|
380
|
||||||
|
Leasehold improvements
|
7,225
|
7,216
|
||||||
|
Construction in progress
|
19
|
458
|
||||||
|
21,889
|
21,965
|
|||||||
|
Accumulated depreciation
|
(19,813
|
)
|
(18,909
|
)
|
||||
|
$
|
2,076
|
$
|
3,056
|
|||||
In 2014, we reclassified $44,000 of inventory into demonstration units. In 2013, we reclassified $0.9 million of inventory into equipment related to test units for our latest generation UPS product.
3. Stockholders’ Equity
Common Stock
Common stock reserved for future issuance at December 31, 2014 consisted of 3,461,909 shares of common stock reserved under our 2010 Stock Incentive Plan, of which 2,409,590 shares were subject to outstanding options and restricted shares and 1,052,319 shares were available for future grants of awards.
On May 28, 2014, our stockholders approved an amendment to the Company’s Restated Certificate of Incorporation to increase the number of authorized shares of common stock from 30 million shares to 40 million shares.
In March 2014, we sold approximately 3.7 million shares of common stock at a purchase price of $3.15 per share in a public underwritten offering made under a shelf registration statement that we had filed with the SEC and that had been declared effective in June 2013. This offering resulted in proceeds, net of expenses including underwriting discounts, commissions and fees of $0.8 million and professional service expenses of $0.2 million, of approximately $10.4 million. The proceeds from this offering will be used by us to help fund our working capital requirements and for general corporate purposes.
In May 2012, our Board of Directors approved the addition of 1.7 million shares of our common stock to be issued in accordance with our 2010 Equity Incentive Plan, and such addition was subsequently approved by our stockholders. Options are subject to terms and conditions as determined by the Compensation Committee of our Board of Directors.
In March 2012, we sold approximately 2.9 million shares of common stock at a purchase price of $3.40 per share, for proceeds, net of fees and expenses, of approximately $9.6 million, in an offering made under a shelf registration statement that we filed with the Securities and Exchange Commission and that had been declared effective in December 2009. The proceeds from this offering were used by us to help fund our working capital requirements and for general corporate purposes.
Stock Option Plan
Since its inception, we have authorized 5,682,296 shares of common stock for issuance under our 2000 and 2010 Stock Incentive Plans, however, we are only issuing new shares of common stock under our 2010 Stock Incentive Plan. We grant options under these plans that vest over periods of up to four years. The term of each option is no more than ten years from the date of grant. Our policy is to issue new shares when required to issue shares upon option exercises. The total fair value of options vested in the year was $1.8 million, $1.4 million, and $1.7 million in 2014, 2013, and 2012, respectively.
A summary of common stock option activity is as follows:
|
Number of
Shares
|
Weighted-
Average
Exercise
Price
|
Weighted-
Average
Contractual Life
(in years)
|
Aggregate
Intrinsic Value
(whole dollars)
|
|||||||||||||
|
Outstanding at December 31, 2013
|
2,407,664
|
$
|
5.27
|
|||||||||||||
|
Granted
|
993,725
|
3.01
|
||||||||||||||
|
Exercised
|
(42,600
|
)
|
3.03
|
|||||||||||||
|
Canceled
|
(958,899
|
)
|
5.44
|
|||||||||||||
|
Outstanding at December 31, 2014
|
2,399,890
|
$
|
4.30
|
7.57
|
$
|
2,000
|
||||||||||
|
Vested and expected to vest at December 31, 2014
|
1,901,476
|
$
|
4.63
|
7.18
|
$
|
1,000
|
||||||||||
|
Exercisable at December 31, 2014
|
1,028,618
|
$
|
5.83
|
5.64
|
$
|
-
|
||||||||||
The weighted average grant date fair value per share of options granted during 2014, 2013, and 2012 was $2.03, $2.60, and $2.60, respectively. The total intrinsic value of options exercised (which is the amount by which the stock price exceeded the exercise price of the options at the date of exercise) during the years ended December 31, 2014, 2013, and 2012 was $14,000, $0.1 million, and $0.1 million, respectively.
As of December 31, 2014, there was $2.6 million of total unrecognized compensation cost, related to non-vested stock options, that is expected to be recognized over a weighted-average vesting period of 2.8 years.
Restricted (non-vested) Shares
In 2013 and 2012, we issued approximately 6,000 and 248,000 restricted shares, respectively, to directors and employees of the Company. The restrictions lapse as the shares vest in equal quarterly installments over a four year period from the date of issuance. We recorded stock compensation expense related to restricted share units of $0.1 million in 2014. A summary of our restricted, non-vested, shares is as follows:
|
Number of
Shares
|
Weighted-
Average
Grant Date
Fair Value
|
|||||||
|
Outstanding at December 31, 2013
|
53,038
|
$
|
4.00
|
|||||
|
Granted
|
-
|
-
|
||||||
|
Vested
|
(18,681
|
)
|
4.00
|
|||||
|
Canceled
|
(12,363
|
)
|
4.00
|
|||||
|
Outstanding at December 31, 2014
|
21,994
|
$
|
4.00
|
|||||
As of December 31, 2014, there was $0.1 million of total unrecognized compensation cost related to restricted shares that is expected to be recognized over a weighted-average vesting period of 1.1 years. The total fair value of restricted share units vested in 2014 and 2013 was $0.1 million and $0.3 million, respectively.
4. Income Taxes
The Company’s pretax loss for the three years ended December 31, 2014, 2013, and 2012 were allocated between domestic and foreign operations as follows:
|
Year Ended December 31,
|
||||||||||||
|
2014
|
2013
|
2012
|
||||||||||
|
Domestic
|
$
|
(15,909
|
)
|
$
|
(9,105
|
)
|
$
|
(1,642
|
)
|
|||
|
Foreign
|
3,334
|
754
|
(280
|
)
|
||||||||
|
Total
|
$
|
(12,575
|
)
|
$
|
(8,351
|
)
|
$
|
(1,922
|
)
|
|||
In September 2014, we settled a tax examination of our German subsidiary for years 2007 through 2011. In the settlement, we agreed to transfer pricing adjustments for the period under examination resulting in a reduction of loss carryovers and a deemed distribution subject to withholding taxes under German law. We recorded a provision for foreign income taxes of $0.3 million in the quarter ended September 30, 2014 related to the settlement of the German tax examination.
As of December 31, 2014, the Company had federal net operating loss carry-forwards of approximately $232.0 million and research and development credit carry-forwards of approximately $4.0 million. The net operating loss and credit carry-forwards will expire beginning in 2018, if not utilized. The Company is currently in the process of analyzing potential limitations on the future utilization of the net operating losses and credit carry-forwards due to the “change of ownership” provisions of the Internal Revenue Code of 1986. Any annual limitation may result in the expiration of net operating losses and credit carry-forwards before utilization.
Deferred income taxes reflect the net tax effects of temporary differences between the carrying amounts of assets and liabilities for financial reporting purposes and the amounts used for income tax purposes. Significant components of the Company’s deferred taxes as of December 31 are as follows (in thousands):
|
2014
|
2013
|
|||||||
|
Deferred tax assets:
|
||||||||
|
Current deferred tax assets
|
||||||||
|
Reserves and allowances
|
$
|
751
|
$
|
1,177
|
||||
|
Deferred Rent
|
45
|
55
|
||||||
|
Deferred revenue
|
255
|
328
|
||||||
|
Valuation allowance for current deferred tax assets
|
(1,049
|
)
|
(1,558
|
)
|
||||
|
Net current deferred tax assets
|
$
|
2
|
$
|
2
|
||||
|
Noncurrent deferred tax assets
|
||||||||
|
Acquired technology
|
571
|
695
|
||||||
|
Capital expenses
|
1,652
|
1,624
|
||||||
|
Stock compensation
|
594
|
699
|
||||||
|
Net operating loss and tax credit carryforwards
|
84,047
|
84,356
|
||||||
|
Valuation allowance for noncurrent deferred tax assets
|
(86,687
|
)
|
(87,263
|
)
|
||||
|
Net noncurrent deferred tax assets
|
$
|
177
|
$
|
111
|
||||
|
Deferred tax liabilities:
|
||||||||
|
Current deferred tax liabilities
|
||||||||
|
Prepaid expenses
|
(179
|
)
|
(113
|
)
|
||||
|
Total current deferred tax liabilities
|
$
|
(179
|
)
|
$
|
(113
|
)
|
||
|
Total net deferred taxes
|
$
|
-
|
$
|
-
|
||||
The Company has established a valuation allowance equal to the net deferred tax asset due to uncertainties regarding the realization of deferred tax assets based on the Company’s lack of earnings history. The valuation allowance decreased by approximately $1.1 million during 2014.
The Company’s provision for income taxes differs from the expected tax expense (benefit) amount computed by applying the statutory federal income tax rate of 34% to income before taxes due to the following:
|
Year Ended December 31,
|
||||||||||||
|
2014
|
2013
|
2012
|
||||||||||
|
Federal statutory rate
|
(34.0
|
)%
|
(34.0
|
)%
|
(34.0
|
)%
|
||||||
|
State taxes, net of federal benefit
|
(1.0
|
)
|
(13.5
|
)
|
7.2
|
|||||||
|
R&D credits
|
(1.8
|
)
|
(5.6
|
)
|
1.3
|
|||||||
|
Stock compensation
|
3.8
|
6.2
|
14.5
|
|||||||||
|
Effect of current foreign operations
|
5.5
|
(20.5
|
)
|
157.3
|
||||||||
|
Expiration and adjustment of net operating losses
|
26.7
|
-
|
63.2
|
|||||||||
|
Foreign tax audit settlement
|
2.0
|
-
|
-
|
|||||||||
|
Loss carryforward adjustments due to tax audit methodologies
|
9.1
|
-
|
-
|
|||||||||
|
Permanent items and other
|
0.3
|
(1.9
|
)
|
6.8
|
||||||||
|
Change in valuation allowance
|
(8.6
|
)
|
69.3
|
(216.3
|
)
|
|||||||
|
2.0
|
%
|
-
|
%
|
-
|
%
|
|||||||
The Company recognized no material adjustment in the liability for unrecognized income tax benefits. The reconciliation of the Company’s unrecognized tax benefits at the beginning and end of the year is as follows:
|
Balance at January 1, 2014
|
$
|
1,990
|
||
|
Additions based on tax positions related to the current year
|
257
|
|||
|
Additions for tax positions of prior years
|
24
|
|||
|
Balance at December 31, 2014
|
$
|
2,271
|
Due to the existence of the valuation allowance, future changes in our unrecognized tax benefits will not materially impact the Company’s effective tax rate. The Company's assessment of its unrecognized tax benefits is subject to change as a function of the Company's financial statement audit.
The Company recognizes interest and penalties related to uncertain tax positions in income tax expense. As of December 31, 2014, the Company had no accrued interest or penalties related to uncertain tax positions.
The tax years 2009 through 2014 remain open to examination by the major taxing jurisdictions to which the Company is subject.
5. Commitments
We lease our office, manufacturing and engineering facilities and our foreign sales offices under operating lease agreements. These facilities’ leases are non-cancelable and obligate us to pay taxes and maintenance costs. In addition, we lease certain equipment such as copiers and phone systems under non-cancelable leases. Our leases expire at various dates through 2018. Rent expense for leases with escalating or de-escalating rent payments are recorded on a straight-line basis over the period of the lease. Net deferred rent on the consolidated balance sheet as of December 31, 2014 and 2013 was $0.1 million and $0.1 million, respectively. There was no deferred rent in 2012. Rent expense was $1.5 million, $1.7 million, and $1.7 million for the years ended December 31, 2014, 2013, and 2012, respectively.
Future minimum payments under these leases at December 31, 2014 are as follows (in thousands):
|
Rental
payments
|
||||
|
2015
|
$
|
1,260
|
||
|
2016
|
1,073
|
|||
|
2017
|
116
|
|||
|
2018
|
72
|
|||
|
Total future minimum lease payments
|
$
|
2,521
|
||
We enter into certain commitments to purchase inventory and other items in the course of normal operations. At December 31, 2014, the total of these commitments was $6.1 million, of which $5.8 million, $0.2 million, and $45,000 will mature in 2015, 2016, and 2017, respectively.
We have entered into Severance Benefits Agreements with our Chief Executive Officer (“CEO”) and Chief Financial Officer (“CFO”) and with each of our other executive officers. These agreements generally provide that, if within 12 months following a change in control the executive officer’s employment is terminated for reasons other than for cause (as defined in the agreement) or by the executive for good reason, including a significant reduction in the role and/or responsibility of the executive within 12 months of the change in corporate control, then all outstanding stock options or restricted shares held by the executive would vest as of the date of the termination and certain severance payments would be payable. In the case of our CEO and CFO, in the event of termination by the Company for reasons other than for cause or by him for good reason, he would be entitled to a severance payment equal to 12 months of salary and be entitled to receive health benefits for 12 additional months after termination. In the case of our other executive officer, in the event of a termination by the Company for reasons other than for cause or by the officer for good reason, he would be entitled to a severance payment equivalent to six months of salary and be entitled to receive health benefits for six additional months after termination.
6. Contingencies
The Company may be involved, either as plaintiff or defendant, in a variety of ongoing claims, demands, suits, investigations, tax matters and proceedings that arise from time to time in the ordinary course of its business. In evaluating whether a contingency should be disclosed, the Company considers if there is at least a reasonable possibility that a loss or an additional loss may have been incurred, and either an accrual is not made because any of the conditions, or an exposure to loss exists in excess of the amount accrued. The Company evaluated all potentially significant litigation, government investigations, claims or assessments in which the Company is involved and determined there were no contingent losses, either accrued or reasonably possible of loss that could materially affect its results of operations, financial condition, or cash flows.
The Company records an accrual with respect to a claim, suit, investigation or proceeding when it is reasonably probable that a liability has been incurred and the amount of the loss can be reasonably estimated. Any recorded liabilities, including any changes to such liabilities for the year ended December 31, 2014, were not material to the Consolidated Financial Statements.
The following is a summary of the significant legal matters involving the Company.
SEC Inquiry
By letter dated September 30, 2013, the SEC Division of Enforcement notified us that it is conducting an investigation regarding us, including matters relating to our public statements regarding Digital China Information Services Company Limited (“Digital China”) and our distribution relationships in China. We have been and intend to continue cooperating fully with the SEC. As of the date of this filing, we believe we have provided all requested material to the SEC.
Stockholder Litigation
Class action complaint
On September 10, 2013, a purported class action complaint was filed in the United States District Court for the Western District of Texas against us and certain of our former executives. The case is captioned Don Lee v. Active Power, Inc., et. al. (Civil Action No. 1:13-cv-00797-SS). As amended, the complaint alleges that on February 19, 2013, we reported that we had begun working with an unnamed Chinese distributor partner, and that on April 30, 2013, we announced in press releases and conference calls that we had entered into a strategic distribution partnership with Digital China. However, on September 5, 2013, after the close of trading, we disclosed that our partnership was with Qiyuan Network System Limited, which is neither an affiliate nor a subsidiary of Digital China. The amended complaint asserts claims under Sections 10(b) and 20(a) of the Securities Exchange Act of 1934, as amended, and Rule 10b-5 promulgated thereunder, and seeks unspecified damages on behalf of all stockholders who purchased common stock between February 19 and September 5, 2013. On March 7, 2014, we filed a motion to dismiss the class action complaint. Our motion was denied by the Court on July 2, 2014. On August 11, 2014, we filed an answer to the class action complaint, and on September 2, 2014, the Court declined to certify its order of July 2, 2014 for an interlocutory appeal to the United States Court of Appeals for the Fifth Circuit.
On September 23, 2014, we reached an agreement in principle and entered into a memorandum of understanding to settle the class action complaint. The parties to the class action signed a definitive settlement agreement on December 2, 2014, which was granted preliminary approval by the Court on January 7, 2015. The proposed settlement would resolve for all defendants all of the issues that are pending in the class action complaint. If completed, the class action settlement would result in a payment of $1.5 million to the settlement class, inclusive of fees and expenses. We anticipate that the total settlement amount and related expenses would be paid from insurance proceeds. The proposed settlement is not yet consummated, and is subject to a number of conditions. The proposed settlement is also subject to final approval by the Court at a hearing scheduled for May 15, 2015.
Derivative actions
On September 13, 2013 and October 14, 2013, two separate stockholders filed complaints in the District Court of Travis County, Texas, purporting to bring derivative actions on behalf of us against certain current and former officers and directors of the Company. The first derivative action is captioned Okumura v. Almgren, et. al. (Cause No. D-1-GN-13-003230), and the second derivative action is captioned Shaev v. Milner, et. al. (Cause No. D-1-GN-13-003557). The allegations of each derivative complaint mirror those of the class action complaint, and they assert claims for breach of fiduciary duty, unjust enrichment, and/or abuse of control and seek damages on our behalf. These derivative actions were stayed by agreement pending resolution of the motion to dismiss the securities class action. The stay was lifted and on August 4, 2014, the parties filed a joint motion to consolidate the two derivative cases. On September 18, 2014, the District Court appointed lead counsel in the consolidated derivative action.
On September 23, 2014, we reached an agreement in principle and entered into a memorandum of understanding to settle the consolidated derivative actions. The parties to the consolidated derivative actions signed a definitive settlement agreement on January 30, 2015. The proposed settlement would resolve for all defendants all of the issues that are pending in the consolidated derivative actions. The proposed consolidated derivative settlement includes, among other things, certain governance improvements by us. We anticipate that the settlement fees and related expenses would be paid entirely from insurance proceeds. The proposed settlement is not yet consummated, and is subject to a number of conditions. The proposed settlement is also subject to approval by the Court following completion of a fairness hearing. The initial Court hearing is scheduled for March 10, 2015.
7. Employee Benefit Plan
We maintain a 401(k) Plan that covers substantially all full-time employees. Company contributions to the plan are determined at the discretion of the Board of Directors and vest ratably over five years of service starting after the first year of employment. We did not contribute to this plan in 2014, 2013, or 2012.
8. Geographic Information
Revenues for the year ended December 31 were as follows (in thousands):
|
2014
|
2013
|
2012
|
||||||||||
|
Americas
|
$
|
31,495
|
$
|
50,365
|
$
|
48,190
|
||||||
|
Europe, Middle East and Africa
|
13,998
|
6,941
|
21,917
|
|||||||||
|
Asia
|
3,643
|
4,393
|
6,208
|
|||||||||
|
Total
|
$
|
49,136
|
$
|
61,699
|
$
|
76,315
|
||||||
Revenues from foreign countries above represented shipments to customers located in 38 countries during 2014. We often ship to areas that are outside of the jurisdiction in which revenue is recognized. Substantially all of our property, plant and equipment are located in the United States. Net assets of operations in foreign countries (excluding intercompany receivables and payables eliminated in consolidation) were $2.8 million at December 31, 2014 and were mostly located in the UK, Germany, and China.
9. Guarantees
In certain geographical regions, particularly Europe, we are sometimes required to issue performance guarantees to our customers as a condition of sale. These guarantees usually provide financial protection to our customers in the event that we fail to fulfill our delivery or warranty obligations. We secure these guarantees with standby letters of credit through our bank. At December 31, 2014 we had a $6,000 deposit guarantee for our building lease in the United Kingdom, which expires in April 2015 and a $34,000 performance guarantee to a customer that was secured with a letter of credit, which expires in June 2017. At December 31, 2013, we had a $0.5 million performance guarantee outstanding to a customer that was secured with a letter of credit. There is no foreseeable risk that we will not be able to meet the performance obligations. Our restricted cash, as shown on the balance sheet, is related to these guarantees.
10. Revolving Credit Facility
In August 2010, we entered into a Second Amended and Restated Loan and Security Agreement (the “Loan Agreement”) with Silicon Valley Bank (“SVB”) which increased the total line of credit available to $12.5 million subject to certain borrowing bases. This facility expanded our ability to borrow funds from U.S. receivables to include qualifying receivables from our UK operations as well, increased our ability to use inventory as collateral, and also added an ability to borrow against purchase orders. These additional bases of borrowing were designed to allow us to use the credit facility to fund inventory purchases in the event we received large or multiple sales orders that would require a major investment in inventory and work in progress such as our MIS products, to help fund our business and to manage our working capital requirements.
This loan facility provides for a secured revolving line of credit in an aggregate amount of up to eighty percent (80%) of the facility amount of $15.625 million, or $12.5 million, subject to certain borrowing bases. In the event we have maintained unrestricted cash and cash equivalents of at least $6.25 million with SVB for at least 30 consecutive days, which is referred to as being in a “Streamline Period”, the borrowing base formula is based on eligible accounts receivable, eligible purchase orders and eligible inventory, subject to a sublimit of $5.0 million for U.K. accounts receivable, $3.5 million for inventory and $1.5 million for purchase orders. When we are not in a Streamline Period, our borrowings are limited based on accounts receivable and purchase orders that SVB has specifically agreed to finance and a borrowing base for eligible inventory. We may also request that SVB issue letters of credit on our behalf, of up to $1.5 million, as a portion of our total loan facility.
In August 2012, we entered into the Second Amendment to Second Amended and Restated Loan and Security Agreement with SVB (“Second Amendment”) which amends the Second Amended and Restated Loan and Security Agreement, dated as of August 5, 2010, by and between us and SVB. Pursuant to the Second Amendment, the maturity date of the loan facility was extended by two years, to August 5, 2014, unless earlier terminated by us, subject to any then applicable early termination fee. The Second Amendment further provides for, among other things, (i) adding a $1.5 million sublimit under the borrowing base formula for 91-120 day aged accounts receivable, (ii) removing eligible purchase orders from the borrowing base formula, and (iii) removing sublimits providing for the issuance of letters of credit and cash management services. Additionally, pursuant to the Second Amendment, the definition of “Streamline Period” was amended such that the Company will be deemed to be in a Streamline Period in the event that it has a liquidity ratio of greater than or equal to 1.75:1.00 at all times for at least 60 consecutive days; provided that a Streamline Period will automatically be in effect if we achieve such liquidity ratio as a result of the sale of our equity securities.
Further, the Second Amendment provides for, among other things, (i) amending the finance charge on each eligible account financed by SVB to a per annum rate equal to SVB’s prime rate, subject to a minimum prime rate of four percent (4.00%), plus (a) one and one-quarter percent (1.25%) when we are in a Streamline Period or (b) one and three-quarters percent (1.75%) for eligible accounts (other than eligible 91-120 day aged accounts) and two percent (2.00%) for eligible 91 to 120 day aged accounts when we are not in a Streamline Period, and (ii) reducing the interest rate upon which each inventory advance accrues interest such that each advance based upon inventory accrues interest at a per annum rate equal to SVB’s prime rate, subject to a minimum prime rate of four percent (4.00%), plus (a) one and one-quarter percent (1.25%) when we are in a Streamline Period or (b) three and one half percent (3.50%) when we are not in a Streamline Period.
On July 28, 2014, we entered into a Third Amendment to Second Amended and Restated Loan and Security Agreement with SVB (“Third Amendment”). The amended three-year loan facility provides for a secured revolving line of credit in an aggregate amount of up to eighty percent (80%) of the facility amount of $18.8 million, or $15.0 million, and increases our inventory and purchase order availability from $3.5 million to $7.0 million subject to certain borrowing bases. Purchase orders and eligible inventory are subject to a sublimit of $4.0 million and accounts receivable for UK and Germany have a $5.0 million sublimit. If we maintain our Liquidity Ratio of 2.50:1.00 for the immediately preceding reconciliation periods the sublimit will be uncapped. We are currently in compliance with all loan covenants under the Loan Agreement. Further, the Third Amendment extends the maturity date to August 5, 2017 and reduces the finance charge to a per annum rate equal to Silicon Valley Bank's prime rate, subject to a minimum prime rate of 4.00%, plus (a) 0.50% for eligible accounts, inventory and purchase orders when we are Borrowing Base Eligible (as defined in the Loan Agreement), or (b) 1.20% for eligible accounts when we are not Borrowing Base Eligible.
The revolving loans made to us under this loan facility are secured by a lien on substantially all of our assets, including the assets of Active Power Solutions Limited, our wholly-owned United Kingdom subsidiary, and the assets of Active Power (Germany) GmbH, our indirect wholly-owned German subsidiary. The only direct or indirect subsidiaries of Active Power, Inc. that are not guarantors under the Loan Agreement are Active Power China (Beijing) Co. Ltd. and immaterial subsidiaries that are not operating companies. There are no restrictions on the ability of any of the subsidiary guarantors to transfer funds to Active Power, Inc. in the form of loans, advances or dividends, except as provided by applicable law.
The Loan Agreement includes customary affirmative covenants for a credit facility of this size and type, including delivery of financial statements, compliance with laws, maintenance of insurance, and protection of intellectual property rights. Further, the Loan Agreement contains customary negative covenants for a credit facility of this size and type, including covenants that limit or restrict our ability, among other things, to dispose of assets, change our business, change our CEO or CFO without replacing such person within 120 days, have a change in control, make acquisitions, be acquired, incur indebtedness, grant liens, make investments, make distributions, repurchase stock, and enter into certain transactions with affiliates.
The Loan Agreement contains customary events of default that include, among other things, non-payment defaults, covenant defaults, material adverse change defaults, insolvency defaults, material judgment defaults and inaccuracy of representations and warranty defaults. The occurrence of an event of default could result in the acceleration of obligations under the Loan Agreement, in which case we must repay all loans and related charges, fees and amounts then due and payable, and our subsidiary may be required to pay any such amounts under the Guarantee and Debenture. At the election of SVB, upon the occurrence and during the continuance of an event of default, finance charges or interest rates, as applicable, will increase an additional five percentage points (5.00%) per annum above the rate that is otherwise applicable thereto upon the occurrence of such event of default, and the collateral handling fees will increase by one-half percent (0.50%).
During 2012, we borrowed amounts under this credit facility based on our short term liquidity requirements. As of December 31, 2014, we had outstanding borrowings of $5.5 million under this loan facility. Based on the borrowing base formula subsequent to the amendment, the additional amount available for use at December 31, 2014 was approximately $4.6 million.
11. Selected Quarterly Consolidated Financial Data (unaudited)
The following tables present selected unaudited consolidated statement of operations information for each of the quarters in the years ended December 31, 2014 and 2013 (in thousands, except per share data):
|
For the Quarter Ended
|
||||||||||||||||
|
Year Ended December 31, 2014
|
December 31
|
September 30
|
June 30
|
March 31
|
||||||||||||
|
Selected consolidated statement of operations information:
|
||||||||||||||||
|
Total revenue
|
$
|
15,352
|
$
|
12,692
|
$
|
10,154
|
$
|
10,938
|
||||||||
|
Total cost of goods sold
|
$
|
11,303
|
$
|
8,932
|
$
|
8,239
|
$
|
8,010
|
||||||||
|
Gross profit
|
$
|
4,049
|
$
|
3,760
|
$
|
1,915
|
$
|
2,928
|
||||||||
|
Operating expenses
|
$
|
6,015
|
$
|
5,862
|
$
|
6,221
|
$
|
6,574
|
||||||||
|
Operating loss
|
$
|
(1,966
|
)
|
$
|
(2,102
|
)
|
$
|
(4,306
|
)
|
$
|
(3,646
|
)
|
||||
|
Net loss
|
$
|
(2,044
|
)
|
$
|
(2,496
|
)
|
$
|
(4,413
|
)
|
$
|
(3,874
|
)
|
||||
|
Basic and diluted net loss per share
|
$
|
(0.09
|
)
|
$
|
(0.11
|
)
|
$
|
(0.19
|
)
|
$
|
(0.19
|
)
|
||||
|
Selected consolidated balance sheet information:
|
||||||||||||||||
|
Current assets
|
$
|
33,731
|
$
|
34,711
|
$
|
36,427
|
$
|
42,070
|
||||||||
|
Total assets
|
$
|
36,098
|
$
|
37,341
|
$
|
39,350
|
$
|
45,164
|
||||||||
|
Current liabilities
|
$
|
16,484
|
$
|
15,720
|
$
|
15,529
|
$
|
17,069
|
||||||||
|
Working capital
|
$
|
17,247
|
$
|
18,991
|
$
|
20,898
|
$
|
25,001
|
||||||||
|
Long term obligations
|
$
|
821
|
$
|
852
|
$
|
697
|
$
|
746
|
||||||||
|
Stockholders' equity
|
$
|
18,793
|
$
|
20,769
|
$
|
23,124
|
$
|
27,349
|
||||||||
|
For the Quarter Ended
|
||||||||||||||||
|
Year Ended December 31, 2013
|
December 31
|
September 30
|
June 30
|
March 31
|
||||||||||||
|
Selected consolidated statement of operations information:
|
||||||||||||||||
|
Total revenue
|
$
|
13,926
|
$
|
13,154
|
$
|
20,195
|
$
|
14,424
|
||||||||
|
Total cost of goods sold
|
$
|
9,750
|
$
|
9,210
|
$
|
13,273
|
$
|
10,070
|
||||||||
|
Gross profit
|
$
|
4,176
|
$
|
3,944
|
$
|
6,922
|
$
|
4,354
|
||||||||
|
Operating expenses
|
$
|
7,990
|
$
|
6,909
|
$
|
6,412
|
$
|
5,702
|
||||||||
|
Operating profit (loss)
|
$
|
(3,814
|
)
|
$
|
(2,965
|
)
|
$
|
510
|
$
|
(1,348
|
)
|
|||||
|
Net income (loss)
|
$
|
(4,127
|
)
|
$
|
(3,135
|
)
|
$
|
332
|
$
|
(1,421
|
)
|
|||||
|
Basic and diluted new income (loss) per share
|
$
|
(0.21
|
)
|
$
|
(0.16
|
)
|
$
|
0.02
|
$
|
(0.07
|
)
|
|||||
|
Selected consolidated balance sheet information:
|
||||||||||||||||
|
Current assets
|
$
|
34,556
|
$
|
39,110
|
$
|
45,722
|
$
|
42,019
|
||||||||
|
Total assets
|
$
|
37,907
|
$
|
42,263
|
$
|
49,052
|
$
|
44,748
|
||||||||
|
Current liabilities
|
$
|
16,860
|
$
|
18,194
|
$
|
22,758
|
$
|
19,208
|
||||||||
|
Working capital
|
$
|
17,696
|
$
|
20,916
|
$
|
22,964
|
$
|
22,811
|
||||||||
|
Long term obligations
|
$
|
741
|
$
|
737
|
$
|
689
|
$
|
774
|
||||||||
|
Stockholders' equity
|
$
|
20,306
|
$
|
23,332
|
$
|
25,605
|
$
|
24,766
|
||||||||
63