Attached files
UNITED STATES
SECURITIES AND EXCHANGE COMMISSION
WASHINGTON, D.C. 20549
FORM 10-K
[x] ANNUAL REPORT PURSUANT TO SECTION 13 OR 15(d) OF THE SECURITIES EXCHANGE ACT OF 1934
FOR THE FISCAL YEAR ENDED DECEMBER 31, 2010
OR
[ ] TRANSITION REPORT PURSUANT TO SECTION 13 OR 15(d) OF THE SECURITIES EXCHANGE ACT OF 1934
FOR THE TRANSITION PERIOD FROM ___________ TO ___________
COMMISSION FILE NUMBER: 1-11535
|
Exact name of registrant as specified in its charter
 Burlington Northern Santa Fe, LLC
|
|
|
State of Organization
Delaware
|
I.R.S. Employer Identification No.
27-1754839
|
|
Address of principal executive offices, including zip code
2650 Lou Menk Drive, Fort Worth, Texas 76131-2830
Registrant’s telephone number, including area code
(800) 795-2673
|
|
|
Securities registered pursuant to Section 12(b) of the Act:
|
|
|
Title of each class
None
|
Name of each exchange on which registered
None
|
|
Securities registered pursuant to Section 12(g) of the Act:
Limited Liability Company Membership Interest
|
|
| Indicate by check mark if the registrant is a well-known seasoned issuer, as defined in Rule 405 of the Securities Act. |
Yes [x] No [ ]
|
|
Indicate by check mark if the registrant is not required to file reports pursuant to Section 13 or Section 15(d) of the Act.
|
Yes [ ] No [x]
|
|
Indicate by check mark whether the registrant: (1) has filed all reports required to be filed by Section 13 or 15(d) of the Securities Exchange Act of 1934 during the preceding 12 months (or for such shorter period that the registrant was required to file such reports), and (2) has been subject to such filing requirement for the past 90 days.
|
Yes [x] No [ ]
|
|
Indicate by check mark whether the registrant has submitted electronically and posted on its corporate Web site, if any, every Interactive Data File required to be submitted and posted pursuant to Rule 405 of Regulation S-T (§ 232.405 of this chapter) during the preceding 12 months (or for such shorter period that the registrant was required to submit and post such files).
|
Yes [x] No [ ]
|
|
Indicate by check mark if disclosure of delinquent filers pursuant to Item 405 of Regulation S-K (§ 229.405) is not contained herein, and will not be contained, to the best of registrant’s knowledge, in definitive proxy or information statements incorporated by reference in Part III of this Form 10-K or any amendment to this Form 10-K.
|
[x]
|
|
Indicate by check mark whether the registrant is a large accelerated filer, accelerated filer, non-accelerated filer, or smaller reporting company (as defined in Rule 12b-2 of the Act).
|
|
|
Large accelerated filer [ ] Accelerated filer [ ] Non-accelerated filer [x] Smaller reporting company [ ]
|
|
|
Indicate by check mark whether the registrant is a shell company (as defined in Rule 12b-2 of the Act).
|
Yes [ ] No [x]
|
|
Burlington Northern Santa Fe, LLC is an indirect, wholly owned subsidiary of Berkshire Hathaway Inc.; as a result, there is no market data with respect to registrant’s membership interests.
|
|
|
Indicate the number of shares outstanding of each of the registrant’s classes of common stock, as of the latest practicable date:
|
|
|
100% of the membership interests of Burlington Northern Santa Fe, LLC outstanding as of February 28, 2011 is held by National Indemnity Company, an indirect, wholly owned subsidiary of Berkshire Hathaway Inc.
|
|
DOCUMENTS INCORPORATED BY REFERENCE
None
REGISTRANT MEETS THE CONDITIONS SET FORTH IN GENERAL INSTRUCTION (I)(1)(a) AND (b) OF FORM 10-K AND IS THEREFORE FILING THIS FORM WITH THE REDUCED DISCLOSURE FORMAT.
i
Part I
Burlington Northern Santa Fe Corporation was incorporated in the State of Delaware on December 16, 1994. On February 12, 2010, Berkshire Hathaway Inc., a Delaware corporation (Berkshire), acquired 100% of the outstanding shares of Burlington Northern Santa Fe Corporation common stock that it did not already own. The acquisition was completed through the merger (the Merger) of Burlington Northern Santa Fe Corporation with and into R Acquisition Company, LLC, a Delaware limited liability company and an indirect wholly-owned subsidiary of Berkshire (Merger Sub), with Merger Sub continuing as the surviving entity. In connection with the Merger, Merger Sub changed its name to “Burlington Northern Santa Fe, LLC” and remains an indirect, wholly-owned subsidiary of Berkshire. Further information about the Merger is incorporated by reference from Note 1 and Note 3 to the Consolidated Financial Statements.
References herein to “BNSF,” “Registrant” or “Company,” with respect to matters occurring prior to completion of the Merger, are references to Burlington Northern Santa Fe Corporation. References herein to “BNSF,” “Registrant” or “Company,” with respect to matters occurring after completion of the Merger, are references to Burlington Northern Santa Fe, LLC.
BNSF is a holding company that conducts no operating activities and owns no significant assets other than through its interests in its subsidiaries. Through its subsidiaries, BNSF is engaged primarily in the freight rail transportation business. At December 31, 2010, BNSF and its subsidiaries had approximately 38,000 employees. The rail operations of BNSF Railway Company (BNSF Railway), the principal operating subsidiary, comprise one of the largest railroad systems in North America.
BNSF’s internet address is www.bnsf.com. Through this internet Web site (under the “About BNSF/Financial Information” link), BNSF makes available, free of charge, its Annual Report on Form 10-K, Quarterly Reports on Form 10-Q and Current Reports on Form 8-K, as well as all amendments to these reports, as soon as reasonably practicable after these reports are electronically filed with or furnished to the Securities and Exchange Commission (the SEC). BNSF makes available on its Web site other previously filed SEC reports, registration statements and exhibits via a link to the SEC’s Web site at www.sec.gov. The Code of Conduct for officers and salaried employees is also made available on the Company’s Web site.
Further discussion of the Company’s business, including equipment and business sectors, is incorporated by reference from Item 2, “Properties.”
Changes in government policy could negatively impact demand for the Company’s services, impair its ability to price its services or increase its costs or liability exposure.
Changes in United States and foreign government policies could change the economic environment and affect demand for the Company’s services. For example, changes in clean air laws or regulation of carbon dioxide emissions could reduce the demand for coal and revenues from the coal transportation services provided by BNSF Railway. Also, United States and foreign government agriculture tariffs or subsidies could affect the demand for grain. Developments and changes in laws and regulations as well as increased economic regulation of the rail industry through legislative action and revised rules and standards applied by the U.S. Surface Transportation Board in various areas, including rates, services and access to facilities could adversely impact the Company’s ability to determine prices for rail services and significantly affect the revenues, costs and profitability of the Company’s business. Additionally, because of the significant costs to maintain its rail network, a reduction in profitability could hinder the Company’s ability to maintain, improve or expand its rail network, facilities and equipment. Federal or state spending on infrastructure improvements or incentives that favor other modes of transportation could also adversely affect the Company’s revenues.
The Company’s success depends on its ability to continue to comply with the significant federal, state and local governmental regulations to which it is subject.
The Company is subject to a significant amount of governmental laws and regulation with respect to its rates and practices, taxes, railroad operations and a variety of health, safety, labor, environmental and other matters. Failure to comply with applicable laws and regulations could have a material adverse effect on the Company. Governments may change the legislative and/or regulatory framework within which the Company operates without providing the Company with any recourse for any adverse effects that the change may have on its business. Federal legislation enacted in 2008 mandates the implementation of positive train control technology by December 31, 2015, on certain mainline track where intercity and commuter passenger railroads operate and where toxic-by-inhalation hazardous materials are transported. This type of technology is new and deploying it across BNSF Railway’s system and other railroads may pose significant operating and implementation risks and will require significant capital expenditures.
As part of its railroad operations, the Company frequently transports chemicals and other hazardous materials, which could expose it to the risk of significant claims, losses and penalties.
BNSF Railway is required to transport these commodities to the extent of its common carrier obligation. An accidental release of these commodities could result in a significant loss of life and extensive property damage as well as environmental remediation obligations. The associated costs could have an adverse effect on the Company’s operating results, financial condition or liquidity as the Company is not insured above a certain threshold. Further, the rates BNSF Railway receives for transporting these commodities do not adequately compensate it should there be some type of accident. In addition, insurance premiums charged for some or all of the coverage currently maintained by the Company could increase dramatically or certain coverage may not be available to the Company in the future if there is a catastrophic event related to rail transportation of these commodities.
The Company faces intense competition from rail carriers and other transportation providers, and its failure to compete effectively could adversely affect its results of operations, financial condition or liquidity.
The Company operates in a highly competitive business environment. Depending on the specific market, the Company faces intermodal, intramodal, product and geographic competition. This competition from other railroads and motor carriers, as well as barges, ships and pipelines in certain markets, may be reflected in pricing, market share, level of services, reliability and other factors. For example, the Company believes that high service truck lines, due to their ability to deliver non-bulk products on an expedited basis, have had and will continue to have an adverse effect on the Company’s ability to compete for deliveries of non-bulk, time-sensitive freight. While the Company must build or acquire and maintain its rail system, trucks and barges are able to use public rights-of-way maintained by public entities. Any material increase in the capacity and quality of these alternative methods or the passage of legislation granting greater latitude to motor carriers with respect to size and weight restrictions could have an adverse effect on the Company’s results of operations, financial condition or liquidity. In addition, a failure to provide the level of service required by the Company’s customers could result in loss of business to competitors. Changes in the ports used by ocean carriers or the use of all-water routes from the Pacific Rim to the East Coast or other changes in the supply chain could also have an adverse effect on the Company’s volumes and revenues.
Downturns in the economy could adversely affect demand for the Company’s services.
Significant, extended negative changes in domestic and global economic conditions that impact the producers and consumers of the commodities transported by the Company may have an adverse effect on the Company’s operating results, financial condition or liquidity. Declines in or muted manufacturing activity, economic growth and international trade all could result in reduced revenues in one or more business units.
Negative changes in general economic conditions could lead to disruptions in the credit markets, increase credit risks and could adversely affect the Company’s financial condition or liquidity.
Challenging economic conditions may not only affect revenues due to reduced demand for many goods and commodities, but could result in payment delays, increased credit risk and possible bankruptcies of customers. Railroads are capital-intensive and may need to finance a portion of the building and maintenance of infrastructure as well as locomotives and other rail equipment. Economic slowdowns and related credit market disruptions may adversely affect the Company’s cost structure, its timely access to capital to meet financing needs and costs of its financings. The Company could also face increased counterparty risk for its cash investments, its derivative arrangements and access to its credit facility. Adverse economic conditions could also affect the Company’s costs for insurance or its ability to acquire and maintain adequate insurance coverage for risks associated with the railroad business if insurance companies experience credit downgrades or bankruptcies. Declines in the securities and credit markets could also affect the Company’s pension fund and railroad retirement tax rates, which in turn could increase funding requirements.
The Company is subject to stringent environmental laws and regulations, which may impose significant costs on its business operations.
The Company’s operations are subject to extensive federal, state and local environmental laws and regulations concerning, among other things, emissions to the air; discharges to waters; the generation, handling, storage, transportation and disposal of waste and hazardous materials; and the cleanup of hazardous material or petroleum releases. Changes to or limits on carbon dioxide emissions could result in significant capital expenditures to comply with these regulations with respect to BNSF Railway’s diesel locomotives, equipment, vehicles and machinery and its yards and intermodal facilities and the cranes and trucks serving those facilities. Emission regulations could also adversely affect fuel efficiency and increase operating costs. Further, local concerns on emissions and other forms of pollution could inhibit the Company’s ability to build facilities in strategic locations to facilitate growth and efficient operations. In addition, many land holdings are and have been used for industrial or transportation-related purposes or leased to commercial or industrial companies whose activities may have resulted in discharges onto the property. Environmental liability can extend to previously owned or operated properties, leased properties and properties owned by third parties, as well as to properties currently owned and used by the Company’s subsidiaries. Environmental liabilities have arisen and may continue to arise from claims asserted by adjacent landowners or other third parties in toxic tort litigation. The Company’s subsidiaries have been and may continue to be subject to allegations or findings to the effect that they have violated, or are strictly liable under, these laws or regulations. The Company’s operating results, financial condition or liquidity could be adversely affected as a result of any of the foregoing, and it may be required to incur significant expenses to investigate and remediate environmental contamination.
Fuel supply availability and fuel prices may adversely affect the Company’s results of operations, financial condition or liquidity.
Fuel supply availability could be impacted as a result of limitations in refining capacity, disruptions to the supply chain, rising global demand and international political and economic factors. A significant reduction in fuel availability could impact the Company’s ability to provide transportation services at current levels, increase fuel costs and impact the economy. Each of these factors could have an adverse effect on the Company’s operating results, financial condition or liquidity. If the price of fuel increases substantially, the Company expects to be able to offset a significant portion of these higher fuel costs through its fuel surcharge program. However, to the extent that the Company is unable to maintain, expand and ultimately collect under its existing fuel surcharge program, increases in fuel prices could have an adverse effect on the Company’s operating results, financial condition or liquidity.
Severe weather and natural disasters could disrupt normal business operations, which would result in increased costs and liabilities and decreases in revenues.
The Company’s success is dependent on its ability to operate its railroad system efficiently. Severe weather and natural disasters, such as tornados, flooding and earthquakes, could cause significant business interruptions and result in increased costs and liabilities and decreased revenues. In addition, damages to or loss of use of significant aspects of the Company’s infrastructure due to natural or man-made disruptions could have an adverse effect on the Company’s operating results, financial condition or liquidity for an extended period of time until repairs or replacements could be made. Additionally, during natural disasters, the Company’s workforce may be unavailable, which could result in further delays. Extreme swings in weather could also negatively affect the performance of locomotives and rolling stock.
The Company’s operational dependencies may adversely affect results of operations, financial condition or liquidity.
Due to the integrated nature of the United States’ freight transportation infrastructure, the Company’s operations may be negatively affected by service disruptions of other entities such as ports and other railroads which interchange with the Company. A significant prolonged service disruption of one or more of these entities could have an adverse effect on the Company’s results of operations, financial condition or liquidity.
Acts of terrorism or war, as well as the threat of war, may cause significant disruptions in the Company’s business operations.
Terrorist attacks and any government response to those types of attacks and war or risk of war may adversely affect the Company’s results of operations, financial condition or liquidity. The Company’s rail lines and facilities could be direct targets or indirect casualties of an act or acts of terror, which could cause significant business interruption and result in increased costs and liabilities and decreased revenues, which could have an adverse effect on operating results and financial condition. Such effects could be magnified if releases of hazardous materials are involved. Any act of terror, retaliatory strike, sustained military campaign or war or risk of war may have an adverse impact on the Company’s operating results and financial condition by causing unpredictable operating or financial conditions, including disruptions of BNSF Railway or connecting rail lines, loss of critical customers or partners, volatility or sustained increase of fuel prices, fuel shortages, general economic decline and instability or weakness of financial markets. In addition, insurance premiums charged for some or all of the coverage currently maintained by the Company could increase dramatically, the coverage available may not adequately compensate it for certain types of incidents and certain coverages may not be available to the Company in the future.
The Company depends on the stability and availability of its information technology systems.
The Company relies on information technology in all aspects of its business. A significant disruption or failure of its information technology systems could result in service interruptions, safety failures, security violations, regulatory compliance failures and the inability to protect corporate information assets against intruders or other operational difficulties. Although the Company has taken steps to mitigate these risks, including Business Continuity Planning, Disaster Recovery Planning and Business Impact Analysis, a significant disruption could adversely affect the Company’s results of operations, financial condition or liquidity. Additionally, if the Company is unable to acquire or implement new technology, it may suffer a competitive disadvantage, which could also have an adverse effect on the Company’s results of operations, financial condition or liquidity.
The Company is subject to various claims and lawsuits, and increases in the amount or severity of these claims and lawsuits could adversely affect the Company’s operating results, financial condition and liquidity.
As part of its railroad operations, the Company is exposed to various claims and litigation related to commercial disputes, personal injury, property damage, environmental liability and other matters. Personal injury claims by BNSF Railway employees are subject to the Federal Employees’ Liability Act (FELA), rather than state workers’ compensation laws. The Company believes that the FELA system, which includes unscheduled awards and a reliance on the jury system, can contribute to increased expenses. Other proceedings include claims by third parties for punitive as well as compensatory damages, and a few proceedings purport to be class actions. Developments in legislative and judicial standards, material changes to litigation trends, or a catastrophic rail accident or series of accidents involving any or all of property damage, personal injury, and environmental liability could have a material adverse effect on the Company’s operating results, financial condition and liquidity.
Most of the Company’s employees are represented by unions, and failure to negotiate reasonable collective bargaining agreements may result in strikes, work stoppages or substantially higher ongoing labor costs.
A significant majority of BNSF Railway’s employees are union-represented. BNSF Railway’s union employees work under collective bargaining agreements with various labor organizations. Wages, health and welfare benefits, work rules and other issues have traditionally been addressed through industry-wide negotiations. These negotiations have generally taken place over an extended period of time and have previously not resulted in any extended work stoppages. The existing agreements have remained in effect and will continue to remain in effect until new agreements are reached or the Railway Labor Act’s procedures (which include mediation, cooling-off periods and the possibility of presidential intervention) are exhausted. While the negotiations have not yet resulted in any extended work stoppages, if BNSF Railway is unable to negotiate acceptable new agreements, it could result in strikes by the affected workers, loss of business and increased operating costs as a result of higher wages or benefits paid to union members, any of which could have an adverse effect on the Company’s operating results, financial condition or liquidity.
The unavailability of qualified personnel could adversely affect the Company’s operations.
Changes in demographics, training requirements and the unavailability of qualified personnel, particularly engineers and trainmen, could negatively impact the Company’s ability to meet demand for rail service. Recruiting and retaining qualified personnel, particularly those with expertise in the railroad industry, are vital to operations. Although the Company has adequate personnel for the current business environment, unpredictable increases in demand for rail services may exacerbate the risk of not having sufficient numbers of trained personnel, which could have a negative impact on operational efficiency and otherwise have a material adverse effect on the Company’s operating results, financial condition or liquidity.
None.
Track Configuration
BNSF Railway operates one of the largest railroad networks in North America with approximately 32,000 route miles of track, excluding multiple main tracks, yard tracks and sidings, approximately 23,000 miles of which are owned route miles, including easements, in 28 states and two Canadian provinces as of December 31, 2010. Approximately 9,000 route miles of BNSF Railway’s system consist of trackage rights that permit BNSF Railway to operate its trains with its crews over other railroads’ tracks.
As of December 31, 2010, the total BNSF Railway system, including single and multiple main tracks, yard tracks and sidings, consisted of approximately 50,000 operated miles of track, all of which are owned by or held under easement by BNSF Railway except for approximately 10,000 route miles operated under trackage rights.
Property and Facilities
BNSF Railway operates various facilities and equipment to support its transportation system, including its infrastructure and locomotives and freight cars. It also owns or leases other equipment to support rail operations, including containers, chassis and vehicles. Support facilities for rail operations include yards and terminals throughout its rail network, system locomotive shops to perform locomotive servicing and maintenance, a centralized network operations center for train dispatching and network operations monitoring and management in Fort Worth, Texas, regional dispatching centers, computers, telecommunications equipment, signal systems and other support systems. Transfer facilities are maintained for rail-to-rail as well as intermodal transfer of containers, trailers and other freight traffic. These facilities include 31 major international hubs located across the system.
As of December 31, 2010, BNSF Railway owned or held under non-cancelable leases exceeding one year approximately 6,700 locomotives, 76,800 freight cars, and 7,700 chassis and containers, in addition to maintenance of way and other equipment.
In the ordinary course of business, BNSF incurs significant costs in repairing and maintaining the properties described above. In 2010, BNSF recorded approximately $2 billion in repairs and maintenance expense in the Consolidated Statements of Income.
Business Mix
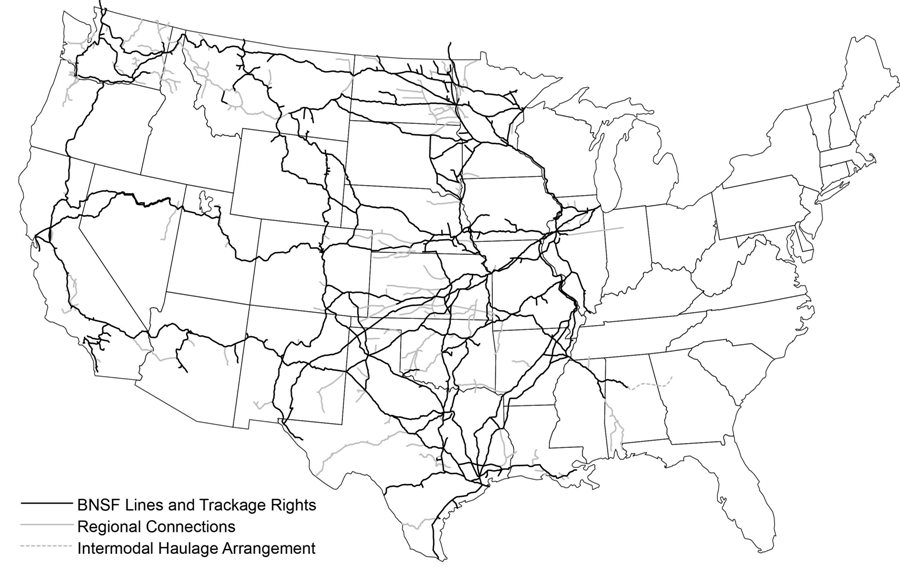
In serving the Midwest, Pacific Northwest, Western, Southwestern and Southeastern regions and ports of the country, BNSF transports, through one operating transportation services segment, a range of products and commodities derived from manufacturing, agricultural and natural resource industries. Over half of the freight revenues of the Company are covered by contractual agreements of varying durations,while the balance is subject to common carrier, published prices or quotations offered by the Company. BNSF’s financial performance is influenced by, among other things, general and industry economic conditions at the international, national and regional levels. The following map illustrates the Company’s primary routes, including trackage rights, which allow BNSF to access major cities and ports in the western and southern United States as well as Canadian and Mexican traffic. In addition to major cities and ports, BNSF efficiently serves many smaller markets by working closely with approximately 200 shortline partners. BNSF has also entered into marketing agreements with other rail carriers, expanding the marketing reach for each railroad and their customers.
Consumer Products:
The Consumer Products’ freight business provided approximately 31 percent of freight revenues for the 12 months ended December 31, 2010, and consisted of the following business sectors: International Intermodal, Domestic Intermodal (including Truckload/Intermodal Marketing Companies, Expedited Truckload/Less-than-Truckload/Parcel) and Automotive.
Coal:
The transportation of coal contributed approximately 27 percent of freight revenues for the 12 months ended December 31, 2010, with more than 90 percent of all BNSF’s coal tons originating from the Powder River Basin of Wyoming and Montana.
Industrial Products:
The Industrial Products’ freight business provided approximately 21 percent of freight revenues for the 12 months ended December 31, 2010, and consisted of the following five business areas: Construction Products, Building Products, Petroleum Products, Chemicals & Plastics Products and Food & Beverages.
Agricultural Products:
The transportation of Agricultural Products provided approximately 21 percent of freight revenues for the 12 months ended December 31, 2010. These products include wheat, corn, bulk foods, soybeans, oil seeds and meals, feeds, barley, oats and rye, flour and mill products, milo, oils, specialty grains, malt, ethanol and fertilizer.
Government Regulation and Legislation
The Company’s rail operations are subject to the regulatory jurisdiction of the Surface Transportation Board (STB) of the United States Department of Transportation (DOT), the Federal Railroad Administration of the DOT, the Occupational Safety and Health Administration (OSHA), as well as other federal and state regulatory agencies and Canadian regulatory agencies for operations in Canada. The STB has jurisdiction over disputes and complaints involving certain rates, routes and services, the sale or abandonment of rail lines, applications for line extensions and construction and consolidation or merger with, or acquisition of control of, rail common carriers. The outcome of STB proceedings can affect the profitability of BNSF’s business.
DOT and OSHA have jurisdiction under several federal statutes over a number of safety and health aspects of rail operations, including the transportation of hazardous materials. State agencies regulate some aspects of rail operations with respect to health and safety in areas not otherwise preempted by federal law.
Further discussion is incorporated by reference from Note 12 to the Consolidated Financial Statements.
Competition
The business environment in which BNSF Railway operates is highly competitive. Depending on the specific market, deregulated motor carriers and other railroads, as well as river barges, ships and pipelines in certain markets, may exert pressure on price and service levels. The presence of advanced, high service truck lines with expedited delivery, subsidized infrastructure and minimal empty mileage continues to affect the market for non-bulk, time-sensitive freight. The potential expansion of longer combination vehicles could further encroach upon markets traditionally served by railroads. In order to remain competitive, BNSF Railway and other railroads continue to develop and implement operating efficiencies to improve productivity.
As railroads streamline, rationalize and otherwise enhance their franchises, competition among rail carriers intensifies. BNSF Railway’s primary rail competitor in the Western region of the United States is the Union Pacific Railroad Company. Other Class I railroads and numerous regional railroads and motor carriers also operate in parts of the same territories served by BNSF Railway.
Based on weekly reporting by the Association of American Railroads, BNSF Railway’s share of the western United States rail traffic in 2010 was approximately 48 percent.
Beginning May 14, 2007, some 30 similar class action complaints were filed in six federal district courts around the country by rail shippers against BNSF Railway and other Class I railroads alleging that they have conspired to fix fuel surcharges with respect to unregulated freight transportation services in violation of the antitrust laws and seeking injunctive relief and unspecified treble damages. These cases have been consolidated and are currently pending in the federal district court of the District of Columbia for coordinated or consolidated pretrial proceedings. (In re: Rail Freight Fuel Surcharge Antitrust Litigation, MDL No. 1869). Consolidated amended class action complaints were filed against BNSF Railway and three other Class I railroads in April 2008. The Company believes that these claims are without merit and continues to defend against the allegations vigorously. The Company does not believe that the outcome of these proceedings will have a material effect on its financial condition, results of operations or liquidity.
Information concerning certain pending tax-related administrative or adjudicative state proceedings or appeals is incorporated by reference from Note 5 to the Consolidated Financial Statements, and information concerning other claims and litigation is incorporated by reference from Note 12 to the Consolidated Financial Statements.
Part II
All of the membership interests in Burlington Northern Santa Fe, LLC are owned by a subsidiary of Berkshire Hathaway Inc. and therefore are not traded on any market.
Management’s narrative analysis relates to the results of operations of Burlington Northern Santa Fe, LLC and its majority-owned subsidiaries (collectively BNSF, Registrant or Company). The principal operating subsidiary of BNSF is BNSF Railway Company (BNSF Railway) through which BNSF derives substantially all of its revenues. The following narrative analysis should be read in conjunction with the Consolidated Financial Statements and the accompanying notes.
Berkshire’s cost of acquiring BNSF has been pushed-down to establish a new accounting basis for BNSF. Accordingly, the accompanying consolidated financial statements are presented for two periods, Predecessor and Successor, which relate to the accounting periods preceding and succeeding the completion of the Merger. The Predecessor and Successor periods have been separated by a vertical line on the face of the consolidated financial statements to highlight the fact that the financial information for such periods has been prepared under two different historical-cost bases of accounting. The following narrative analysis of results of operations includes a brief discussion of the factors that materially affected the Company’s operating results in the Predecessor period of January 1 – February 12, 2010, and a comparative analysis of the Successor period of February 13 – December 31, 2010, and the Predecessor period of the year ended December 31, 2009.
Results of Operations
Revenues Summary
The following table presents BNSF’s revenue information by business group:
|
Revenues (in millions)
|
Cars / Units (in thousands)
|
||||||||||||||
|
Successor
|
Predecessor
|
Successor
|
Predecessor
|
||||||||||||
|
February 13 –
December 31,
2010
|
January 1 –
February 12,
2010
|
Year ended
December 31,
2009
|
February 13 –
December 31,
2010
|
January 1 –
February 12,
2010
|
Year ended
December 31,
2009
|
||||||||||
|
Consumer Products
|
$
|
4,516
|
$
|
515
|
$
|
4,316
|
3,834
|
453
|
3,911
|
||||||
|
Coal
|
3,906
|
442
|
3,564
|
2,156
|
259
|
2,390
|
|||||||||
|
Industrial Products
|
3,108
|
352
|
2,874
|
1,258
|
139
|
1,172
|
|||||||||
|
Agricultural Products
|
3,076
|
417
|
2,834
|
932
|
126
|
945
|
|||||||||
|
Total freight revenues
|
14,606
|
1,726
|
13,588
|
8,180
|
977
|
8,418
|
|||||||||
|
Other revenues
|
453
|
65
|
428
|
||||||||||||
|
Total operating revenues
|
$
|
15,059
|
$
|
1,791
|
$
|
14,016
|
|||||||||
|
Average Revenue Per Car / Unit
|
|||||||||
|
Successor
|
Predecessor
|
||||||||
|
February 13 –
December 31,
2010
|
January 1 –
February 12,
2010
|
Year ended
December 31,
2009
|
|||||||
|
Consumer Products
|
$
|
1,178
|
$
|
1,137
|
$
|
1,104
|
|||
|
Coal
|
1,812
|
1,707
|
1,491
|
||||||
|
Industrial Products
|
2,471
|
2,532
|
2,452
|
||||||
|
Agricultural Products
|
3,300
|
3,310
|
2,999
|
||||||
|
Total freight revenues
|
$
|
1,786
|
$
|
1,767
|
$
|
1,614
|
|||
Fuel Surcharges
Freight revenues include both revenue for transportation services and fuel surcharges. BNSF’s fuel surcharge program is intended to recover its incremental fuel costs when fuel prices exceed a threshold fuel price. Fuel surcharges are calculated differently depending on the type of commodity transported. In certain commodities, fuel surcharge is calculated using a fuel price from a time period that can be up to 60 days earlier. In a period of volatile fuel prices or changing customer business mix, changes in fuel expense and fuel surcharge may significantly differ.
The following table presents fuel surcharge and fuel expense information (in millions):
|
Successor
|
Predecessor
|
||||||||
|
February 13 –
December 31,
2010
|
January 1 –
February 12,
2010
|
Year ended
December 31,
2009
|
|||||||
|
Total fuel expense a
|
$
|
2,687
|
$
|
329
|
$
|
2,372
|
|||
|
BNSF fuel surcharges
|
$
|
1,774
|
$
|
192
|
$
|
1,226
|
|||
a Total fuel expense includes locomotive and non-locomotive fuel as well as gains and losses from fuel derivatives, which do not impact the fuel surcharge program.
Expense Table
The following table presents BNSF’s expense information (in millions):
|
Successor
|
Predecessor
|
||||||||
|
February 13 –
December 31,
2010
|
January 1 –
February 12,
2010
|
Year ended
December 31,
2009
|
|||||||
|
Compensation and benefits
|
$
|
3,562
|
$
|
442
|
$
|
3,481
|
|||
|
Fuel
|
2,687
|
329
|
2,372
|
||||||
|
Purchased services
|
1,890
|
279
|
1,873
|
||||||
|
Depreciation and amortization
|
1,532
|
192
|
1,537
|
||||||
|
Equipment rents
|
670
|
97
|
777
|
||||||
|
Materials and other
|
665
|
1
|
714
|
||||||
|
Total operating expenses
|
$
|
11,006
|
$
|
1,340
|
$
|
10,754
|
|||
|
Interest expense
|
$
|
435
|
$
|
72
|
$
|
613
|
|||
|
Other expense, net
|
$
|
7
|
$
|
2
|
$
|
8
|
|||
|
Income tax expense
|
$
|
1,376
|
$
|
153
|
$
|
920
|
|||
Predecessor Period of January 1 – February 12, 2010
Significant changes in the underlying trends affecting the Company’s revenues and expenses during the Predecessor period of January 1 – February 12, 2010, were as follows:
|
•
|
Purchased services expenses included Merger-related legal and consulting fees. See Note 3 to the Consolidated Financial Statements for more information.
|
|
•
|
Sale of a line segment in the State of Washington was completed, resulting in a gain to materials and other expenses of $74 million.
|
Successor Period of February 13 – December 31, 2010 vs Predecessor Period of the Year Ended December 31, 2009
Revenues
Revenues for the period of February 13 – December 31, 2010, were $15,059 million, up 7 percent compared with the year ended December 31, 2009. The increase in revenues was partially offset due to comparing operating results for a 322-day period to one consisting of 365 days, which primarily caused the 3-percent decrease in unit volumes. The following changes in underlying trends, based on a comparable number of days, also impacted the change in revenues:
|
•
|
Consumer Products revenues included increased unit volumes within international intermodal, domestic intermodal and automotive, as well as improved yields.
|
|
•
|
Coal revenues reflected improved yields, as well as a slight increase in volumes due to strength in coal-fired electricity generation during 2010 which was partially offset by customer stockpiles. 2009 included a $66 million loss in excess of amounts previously accrued related to an unfavorable coal rate case decision during the first quarter of 2009 (see Note 12 to the Consolidated Financial Statements under the heading "Coal Rate Case Decision"), partially offset by approximately $30 million for contract settlements and adjustments with specific customers.
|
|
•
|
Industrial Products revenues included increased unit volumes primarily due to increased demand in construction products.
|
|
•
|
Agricultural Products revenues reflected higher unit volumes due to increased grain shipments and improved fertilizer and ethanol loadings, as well as improved yields.
|
|
•
|
Increased fuel surcharges per unit, primarily due to increased fuel prices, impacted revenue in each of the business units.
|
Expenses
Operating expenses for the period of February 13 – December 31, 2010, were $11,006 million, an increase of $252 million, or 2 percent, from the year ended December 31, 2009. The increase in operating expenses was partially offset by a decrease in expenses due to comparing operating results for a 322-day period to one consisting of 365 days. The following changes in underlying trends, based on a comparable number of days, also impacted the change in operating expenses:
|
•
|
Increased unit volumes, wage inflation, higher health and welfare expenses, merger-related stock-based compensation adjustments and improved performance against targets related to incentive compensation and profit sharing, which cover all non-union and about one quarter of union employees, all contributed to increased compensation and benefits expenses.
|
|
•
|
Higher fuel prices increased fuel expenses, partially offset by a higher loss from closed fuel derivatives in 2009. Higher locomotive fuel consumption due to improved unit volumes also impacted fuel expenses.
|
|
•
|
New intangible asset amortization resulting from the application of acquisition method accounting and continuing capital expenditures increased depreciation and amortization expenses.
|
|
•
|
Increased ramping, drayage and other volume-related costs including purchased transportation for BNSF Logistics, a wholly owned, third-party logistics company, increased purchased services expenses. Higher locomotive maintenance costs also increased purchased services expenses.
|
|
•
|
Materials and other expenses included higher environmental costs due to changes in estimates at certain of BNSF’s more complex sites and lower personal injury costs. See Note 12 to the Consolidated Financial Statements for further information.
|
|
•
|
There were no significant changes in the underlying trends for equipment rents expenses.
|
|
•
|
Interest expense included increased interest related to a higher average debt balance, offset by the impact of merger-related adjustments resulting from the application of acquisition method accounting. During 2009, interest expense included a net $32 million loss for the termination of hedge accounting related to certain interest rate hedges as well as an additional $8 million of expense related to an unfavorable coal rate case decision (see Note 12 to the Consolidated Financial Statements under the heading "Coal Rate Case Decision.") Favorable tax settlements also impacted interest expense for 2009.
|
|
•
|
The effective tax rate for the period of February 13 – December 31, 2010, was 38.1 percent, compared with 34.8 percent for 2009. The increase in the effective tax rate is due to the 2009 tax benefit resulting from the donation of a portion of a line segment located in the State of Washington and to the enactment of the Patient Protection and Affordable Care Act in March 2010, which eliminated the tax deductibility of retiree health care costs to the extent of federal subsidies received by plan sponsors that provide retiree prescription drug benefits equivalent to Medicare Part D coverage.
|
Forward-Looking Information
To the extent that statements made by the Company relate to the Company’s future economic performance or business outlook, projections or expectations of financial or operational results, or refer to matters that are not historical facts, such statements are “forward-looking” statements within the meaning of the federal securities laws.
Forward-looking statements involve a number of risks and uncertainties, and actual performance or results may differ materially. For a discussion of material risks and uncertainties that the Company faces, see the discussion in Item 1A, “Risk Factors,” of this Annual Report on Form 10-K. Important factors that could cause actual results to differ materially include, but are not limited to, the following:
|
•
|
Economic and industry conditions: material adverse changes in economic or industry conditions, both in the United States and globally; volatility in the capital or credit markets including changes affecting the timely availability and cost of capital; changes in customer demand, effects of adverse economic conditions affecting shippers or BNSF’s supplier base, and effects due to more stringent regulatory policies such as the regulation of carbon dioxide emissions that could reduce the demand for coal or governmental tariffs or subsidies that could affect the demand for grain, changes in fuel prices and other key materials and disruptions in supply chains for these materials; competition and consolidation within the transportation industry; and changes in crew availability, labor and benefits costs and labor difficulties, including stoppages affecting either BNSF’s operations or customers’ abilities to deliver goods to BNSF for shipment;
|
|
•
|
Legal, legislative and regulatory factors: developments and changes in laws and regulations, including those affecting train operations or the marketing of services; the ultimate outcome of shipper and rate claims subject to adjudication or claims; investigations or litigation alleging violations of the antitrust laws; increased economic regulation of the rail industry through legislative action and revised rules and standards applied by the U.S. Surface Transportation Board in various areas including rates and services; developments in environmental investigations or proceedings with respect to rail operations or current or past ownership or control of real property or properties owned by others impacted by BNSF Railway operations; losses resulting from claims and litigation relating to personal injuries, asbestos and other occupational diseases; the release of hazardous materials, environmental contamination and damage to property; regulation, restrictions or caps, or other controls of diesel emissions that could affect operations or increase costs; the availability of adequate insurance to cover the risks associated with operations; and
|
|
•
|
Operating factors: changes in operating conditions and costs; operational and other difficulties in implementing positive train control technology, including increased compliance or operational costs or penalties; restrictions on development and expansion plans due to environmental concerns; constraints due to the nation’s aging infrastructure; disruptions to BNSF’s technology network including computer systems and software, as well as natural events such as severe weather, fires, floods and earthquakes or man-made or other disruptions of BNSF Railway’s or other railroads’ operating systems, structures, or equipment including the effects of acts of terrorism on the Company’s system or other railroads’ systems or other links in the transportation chain.
|
The Company cautions against placing undue reliance on forward-looking statements, which reflect its current beliefs and are based on information currently available to it as of the date a forward-looking statement is made. The Company undertakes no obligation to revise forward-looking statements to reflect future events, changes in circumstances, or changes in beliefs. In the event the Company does update any forward-looking statement, no inference should be made that the Company will make additional updates with respect to that statement, related matters, or any other forward-looking statements.
In the ordinary course of business, BNSF utilizes various financial instruments that inherently have some degree of market risk. The following table summarizes the impact of these derivative activities on the Company’s results of operations (in millions):
|
Successor
|
Predecessor
|
||||||||||
|
February 13 –
December 31,
2010
|
January 1 –
February 12,
2010
|
Year ended
December 31,
2009
|
|||||||||
|
Fuel-derivative gain (loss) (including ineffective portion of unexpired hedges)
|
$
|
49
|
$
|
(13
|
)
|
$
|
(195
|
)
|
|||
|
Interest rate hedge benefit
|
17
|
3
|
22
|
||||||||
|
Interest rate derivative loss
|
−
|
−
|
(32
|
)
|
|||||||
|
Total derivative benefit (loss)
|
66
|
(10
|
)
|
(205
|
)
|
||||||
|
Tax effect
|
(25
|
)
|
4
|
79
|
|||||||
|
Derivative benefit (loss), net of tax
|
$
|
41
|
$
|
(6
|
)
|
$
|
(126
|
)
|
|||
The Company’s fuel-derivative gain or loss was due to fluctuations in average fuel prices subsequent to the initiation of various derivatives. The interest rate hedge benefit is the result of lower interest rates. The interest rate derivative loss in 2009 was related to terminated treasury locks (see Note 4 to the Consolidated Financial Statements). There were no interest rate hedges outstanding at December 31, 2010. The information presented in Note 4 to the Consolidated Financial Statements describes significant aspects of BNSF’s financial instrument activities that have a material market risk.
Commodity Price Sensitivity
BNSF engages in derivative activities to partially mitigate the risk of fluctuations in the price of its diesel fuel purchases. Existing derivative transactions as of December 31, 2010, were based on the front month settlement prices of New York Mercantile Exchange (NYMEX) #2 heating oil (HO), West Texas Intermediate (WTI) crude oil, or the HO refining spread (HO-WTI), which is the difference between HO and WTI. A WTI derivative combined with a HO-WTI derivative will result in the equivalent of a HO derivative. For swaps, BNSF either pays or receives the difference between the derivative price and the actual average price of the derivative commodity during a specified determination period for a specified number of gallons. For costless collars, if the average derivative commodity price for a specified determination period is greater than the cap price, BNSF receives the difference for a specified number of gallons. If the average commodity price is less than the floor price, BNSF pays the difference for a specified number of gallons. If the commodity price is between the floor price and the cap price, BNSF neither makes nor receives a payment. Derivative transactions are generally settled with the counterparty in cash. Based on historical information, BNSF believes there is a significant correlation between the market prices for diesel fuel, HO and WTI.
At December 31, 2010, BNSF had recorded a net fuel-derivative asset of $82 million for fuel derivatives covering 2011 through 2012.
The following table is an estimate of the impact to earnings that could result from hypothetical price changes during the twelve-month period ending December 31, 2011, and the balance sheet impact from the hypothetical price changes on all open derivatives, both based on the Company’s derivative position at December 31, 2010:
|
Sensitivity Analysis
|
||||
|
Derivative Commodity
Price Change
|
Fuel-Derivative Annual
Pre-Tax Earnings Impact
|
Balance Sheet Impact of Change
in Fuel-Derivative Fair Value
|
||
|
10-percent increase
|
$50 million increase
|
$68 million increase
|
||
|
10-percent decrease
|
$52 million decrease
|
$73 million decrease
|
Based on locomotive fuel consumption during the twelve-month period ended December 31, 2010, of 1,295 million gallons and fuel prices during that same period, excluding the impact of the Company’s derivative activities, a 10-percent increase or decrease in the commodity price per gallon would result in an approximate $278 million increase or decrease, respectively, in fuel expense (pre-tax) on an annual basis.
At December 31, 2010, BNSF maintained fuel inventories for use in normal operations, which were not material to BNSF’s overall financial position and, therefore, represent no significant market exposure. The frequency of BNSF’s fuel inventory turnover also reduces market exposure, should fuel inventories become material to BNSF’s overall financial position. Further information on fuel derivatives is incorporated by reference from Note 4 to the Consolidated Financial Statements.
Interest Rate Sensitivity
At December 31, 2010, the fair value of BNSF’s debt, excluding capital leases and unamortized gains on interest rate swaps, was $10,761 million.
The following table is an estimate of the impact to the fair value of total debt, excluding capital leases and unamortized gains on interest rate swaps, that could result from hypothetical interest rate changes during the twelve-month period ending December 31, 2011, based on debt levels as of December 31, 2010:
|
Sensitivity Analysis
|
|||
|
Hypothetical Change
in Interest Rates
|
Change in Fair Value
|
||
|
Total Debt
|
|||
|
1-percent decrease
|
$1,027 million increase
|
||
|
1-percent increase
|
$871 million decrease
|
||
Further information on interest rate hedges is incorporated by reference from Note 4 to the Consolidated Financial Statements. Information on the Company’s debt, which may be sensitive to interest rate fluctuations, is incorporated by reference from Note 11 to the Consolidated Financial Statements.
The Consolidated Financial Statements of BNSF and subsidiary companies, together with the reports of the Company’s independent registered public accounting firms, are included as part of this filing.
The following documents are filed as a part of this report:
Consolidated Financial Statements
|
|
|
|
|
|
|
|
|
|
|
|
|
|
|
|
|
|
To the Board of Managers and Member of
Burlington Northern Santa Fe, LLC
We have audited the accompanying consolidated balance sheet of Burlington Northern Santa Fe, LLC and subsidiaries (the "Company") as of December 31, 2010, and the related consolidated statements of operations, cash flows, and changes in equity for the periods from February 13, 2010 through December 31, 2010 (Successor) and January 1, 2010 through February 12, 2010 (Predecessor). These financial statements are the responsibility of the Company's management. Our responsibility is to express an opinion on the financial statements based on our audit.
We conducted our audits in accordance with the standards of the Public Company Accounting Oversight Board (United States). Those standards require that we plan and perform the audit to obtain reasonable assurance about whether the financial statements are free of material misstatement. The Company is not required to have, nor were we engaged to perform, an audit of its internal control over financial reporting. Our audits included consideration of internal control over financial reporting as a basis for designing audit procedures that are appropriate in the circumstances, but not for the purpose of expressing an opinion on the effectiveness of the Company's internal control over financial reporting. Accordingly, we express no such opinion. An audit also includes examining, on a test basis, evidence supporting the amounts and disclosures in the financial statements, assessing the accounting principles used and significant estimates made by management, as well as evaluating the overall financial statement presentation. We believe that our audits provide a reasonable basis for our opinion.
In our opinion, such consolidated financial statements present fairly, in all material respects, the financial position of Burlington Northern Santa Fe, LLC and subsidiaries as of December 31, 2010 (Successor) and the results of their operations and their cash flows for the periods from February 13, 2010 through December 31, 2010 (Successor) and January 1, 2010 through February 12, 2010 (Predecessor) in conformity with accounting principles generally accepted in the United States of America.
/s/ DELOITTE & TOUCHE LLP
Fort Worth, Texas
February 28, 2011
Report of Independent Registered Public Accounting Firm
To the Board of Managers and Member of
Burlington Northern Santa Fe, LLC
In our opinion, the consolidated financial statements listed in the accompanying index as of December 31, 2009 and for each of two years in the period ended December 31, 2009 present fairly, in all material respects, the financial position of Burlington Northern Santa Fe Corporation and its subsidiaries (the Company) at December 31, 2009, and the results of their operations and their cash flows for each of the two years in the period ended December 31, 2009, in conformity with accounting principles generally accepted in the United States of America. These financial statements are the responsibility of the Company's management. Our responsibility is to express an opinion on these financial statements based on our audits. We conducted our audits of these statements in accordance with the standards of the Public Company Accounting Oversight Board (United States). Those standards require that we plan and perform the audit to obtain reasonable assurance about whether the financial statements are free of material misstatement. An audit includes examining, on a test basis, evidence supporting the amounts and disclosures in the financial statements, assessing the accounting principles used and significant estimates made by management, and evaluating the overall financial statement presentation. We believe that our audits provide a reasonable basis for our opinion.
/s/ PricewaterhouseCoopers LLP
Fort Worth, Texas
February 11, 2010
Burlington Northern Santa Fe, LLC and Subsidiaries
In millions
|
Successor
|
Predecessor
|
|||||||||||
|
February 13 –
December 31,
2010
|
January 1 –
February 12,
2010
|
Year ended
December 31,
2009
|
Year ended
December 31,
2008
|
|||||||||
|
Revenues
|
$
|
15,059
|
$
|
1,791
|
$
|
14,016
|
$
|
18,018
|
||||
|
Operating expenses:
|
||||||||||||
|
Compensation and benefits
|
3,562
|
442
|
3,481
|
3,884
|
||||||||
|
Fuel
|
2,687
|
329
|
2,372
|
4,640
|
||||||||
|
Purchased services
|
1,890
|
279
|
1,873
|
2,133
|
||||||||
|
Depreciation and amortization
|
1,532
|
192
|
1,537
|
1,397
|
||||||||
|
Equipment rents
|
670
|
97
|
777
|
901
|
||||||||
|
Materials and other
|
665
|
1
|
714
|
1,151
|
||||||||
|
Total operating expenses
|
11,006
|
1,340
|
10,754
|
14,106
|
||||||||
|
Operating income
|
4,053
|
451
|
3,262
|
3,912
|
||||||||
|
Interest expense
|
435
|
72
|
613
|
533
|
||||||||
|
Other expense, net
|
7
|
2
|
8
|
11
|
||||||||
|
Income before income taxes
|
3,611
|
377
|
2,641
|
3,368
|
||||||||
|
Income tax expense
|
1,376
|
153
|
920
|
1,253
|
||||||||
|
Net income
|
$
|
2,235
|
$
|
224
|
$
|
1,721
|
$
|
2,115
|
||||
See accompanying Notes to Consolidated Financial Statements.
Burlington Northern Santa Fe, LLC and Subsidiaries
Dollars in millions, shares in thousands
|
Successor
|
Predecessor
|
|||||||
|
December 31, 2010
|
December 31, 2009
|
|||||||
|
Assets
|
||||||||
|
Current assets:
|
||||||||
|
Cash and cash equivalents
|
$
|
2,087
|
$
|
1,269
|
||||
|
Accounts receivable, net
|
928
|
787
|
||||||
|
Materials and supplies
|
652
|
633
|
||||||
|
Current portion of deferred income taxes
|
317
|
290
|
||||||
|
Other current assets
|
193
|
277
|
||||||
|
Total current assets
|
4,177
|
3,256
|
||||||
|
Property and equipment, net of accumulated depreciation of $660 and $10,736, respectively
|
45,486
|
32,294
|
||||||
|
Goodwill
|
14,803
|
−
|
||||||
|
Intangible assets, net
|
1,732
|
−
|
||||||
|
Other assets
|
2,449
|
3,125
|
||||||
|
Total assets
|
$
|
68,647
|
$
|
38,675
|
||||
|
Liabilities and Equity
|
||||||||
|
Current liabilities:
|
||||||||
|
Accounts payable and other current liabilities
|
$
|
2,768
|
$
|
2,695
|
||||
|
Long-term debt due within one year
|
699
|
644
|
||||||
|
Total current liabilities
|
3,467
|
3,339
|
||||||
|
Deferred income taxes
|
14,307
|
9,322
|
||||||
|
Long-term debt
|
11,281
|
9,691
|
||||||
|
Intangible liabilities, net
|
1,790
|
−
|
||||||
|
Casualty and environmental liabilities
|
938
|
899
|
||||||
|
Pension and retiree health and welfare liability
|
490
|
783
|
||||||
|
Other liabilities
|
867
|
1,843
|
||||||
|
Total liabilities
|
33,140
|
25,877
|
||||||
|
Commitments and contingencies (see Notes 4, 11 and 12)
|
||||||||
|
Equity:
|
||||||||
|
Additional paid-in-capital
|
34,495
|
7,776
|
||||||
|
Retained earnings
|
985
|
13,941
|
||||||
|
Accumulated other comprehensive income (loss)
|
27
|
(496
|
)
|
|||||
|
Predecessor:
|
||||||||
|
Common stock, $0.01 par value, 600,000 shares authorized; 543,416 shares issued
|
−
|
5
|
||||||
|
Treasury stock, at cost, 202,677 shares
|
−
|
(8,428
|
)
|
|||||
|
Total equity
|
35,507
|
12,798
|
||||||
|
Total liabilities and equity
|
$
|
68,647
|
$
|
38,675
|
||||
See accompanying Notes to Consolidated Financial Statements.
Burlington Northern Santa Fe, LLC and Subsidiaries
In millions
|
Successor
|
Predecessor
|
|||||||||||||
|
February 13 –
December 31,
2010
|
January 1 –
February 12,
2010
|
Year ended
December 31,
2009
|
Year ended
December 31,
2008
|
|||||||||||
|
Operating Activities
|
||||||||||||||
|
Net income
|
$
|
2,235
|
$
|
224
|
$
|
1,721
|
$
|
2,115
|
||||||
|
Adjustments to reconcile net income to net cash provided by operating activities:
|
||||||||||||||
|
Depreciation and amortization
|
1,532
|
192
|
1,537
|
1,397
|
||||||||||
|
Deferred income taxes
|
710
|
127
|
612
|
417
|
||||||||||
|
Long-term casualty and environmental liabilities, net
|
(25
|
)
|
(2
|
)
|
(90
|
)
|
150
|
|||||||
|
Contributions to qualified pension plan
|
(400
|
)
|
−
|
(255
|
)
|
−
|
||||||||
|
Other, net
|
(204
|
)
|
(78
|
)
|
45
|
66
|
||||||||
|
Changes in current assets and liabilities:
|
||||||||||||||
|
Accounts receivable, net
|
(118
|
)
|
(21
|
)
|
116
|
191
|
||||||||
|
Change in accounts receivable securitization program
|
−
|
−
|
(50
|
)
|
(250
|
)
|
||||||||
|
Materials and supplies
|
(23
|
)
|
3
|
(108
|
)
|
54
|
||||||||
|
Other current assets
|
104
|
(123
|
)
|
(38
|
)
|
(31
|
)
|
|||||||
|
Accounts payable and other current liabilities
|
539
|
(258
|
)
|
(77
|
)
|
(132
|
)
|
|||||||
|
Net cash provided by operating activities
|
4,350
|
64
|
3,413
|
3,977
|
||||||||||
|
Investing Activities
|
||||||||||||||
|
Capital expenditures excluding equipment
|
(1,829
|
)
|
(137
|
)
|
(1,991
|
)
|
(2,167
|
)
|
||||||
|
Acquisition of equipment
|
(445
|
)
|
(67
|
)
|
(733
|
)
|
(949
|
)
|
||||||
|
Proceeds from sale of equipment financed
|
−
|
−
|
368
|
348
|
||||||||||
|
Construction costs for facility financing obligation
|
−
|
−
|
(37
|
)
|
(64
|
)
|
||||||||
|
Partnership investment
|
(443
|
)
|
−
|
−
|
−
|
|||||||||
|
Other, net
|
(255
|
)
|
68
|
(244
|
)
|
(241
|
)
|
|||||||
|
Net cash used for investing activities
|
(2,972
|
)
|
(136
|
)
|
(2,637
|
)
|
(3,073
|
)
|
||||||
|
Financing Activities
|
||||||||||||||
|
Net decrease in commercial paper and bank borrowings
|
−
|
−
|
(100
|
)
|
(161
|
)
|
||||||||
|
Proceeds from issuance of long-term debt
|
1,500
|
−
|
825
|
1,150
|
||||||||||
|
Payments on long-term debt
|
(493
|
)
|
(30
|
)
|
(429
|
)
|
(217
|
)
|
||||||
|
Dividends paid
|
(1,250
|
)
|
(226
|
)
|
(546
|
)
|
(471
|
)
|
||||||
|
Proceeds from stock options exercised
|
−
|
21
|
59
|
91
|
||||||||||
|
Purchase of BNSF common stock
|
−
|
−
|
(16
|
)
|
(1,147
|
)
|
||||||||
|
Excess tax benefits from equity compensation plans
|
−
|
9
|
29
|
96
|
||||||||||
|
Proceeds from facility financing obligation
|
−
|
−
|
51
|
68
|
||||||||||
|
Other, net
|
(19
|
)
|
−
|
(13
|
)
|
(10
|
)
|
|||||||
|
Net cash used for financing activities
|
(262
|
)
|
(226
|
)
|
(140
|
)
|
(601
|
)
|
||||||
|
Increase (decrease) in cash and cash equivalents
|
1,116
|
(298
|
)
|
636
|
303
|
|||||||||
|
Cash and cash equivalents:
|
||||||||||||||
|
Beginning of period
|
971
|
1,269
|
633
|
330
|
||||||||||
|
End of period
|
$
|
2,087
|
$
|
971
|
$
|
1,269
|
$
|
633
|
||||||
|
Supplemental Cash Flow Information
|
||||||||||||||
|
Interest paid, net of amounts capitalized
|
$
|
539
|
$
|
97
|
$
|
587
|
$
|
538
|
||||||
|
Income taxes paid, net of refunds
|
$
|
665
|
$
|
−
|
$
|
264
|
$
|
820
|
||||||
|
Non-cash asset financing
|
$
|
40
|
$
|
8
|
$
|
514
|
$
|
258
|
||||||
See accompanying Notes to Consolidated Financial Statements.
Burlington Northern Santa Fe, LLC and Subsidiaries
Dollars in millions, shares in thousands, except per share data
|
Predecessor
|
Common Shares
|
Treasury
Shares
|
Common Stock
and Paid–in
Capital
|
Retained
Earnings
|
Treasury
Stock
|
Accumulated Other
Comprehensive Loss
|
Total
Equity
|
||||||||||||||
|
Balance at December 31, 2007
|
537,330
|
(189,626
|
)
|
$ |
7,353
|
$ |
11,152
|
$ |
(7,222
|
)
|
$ |
(139
|
)
|
$ |
11,144
|
||||||
|
Comprehensive income:
|
|||||||||||||||||||||
|
Net income
|
–
|
2,115
|
–
|
–
|
2,115
|
||||||||||||||||
|
Change in unrecognized prior service credit and actuarial losses, net of tax benefit of $219
|
–
|
–
|
–
|
(353
|
)
|
(353
|
)
|
||||||||||||||
|
Change in fuel/interest hedge mark-to-market, net of tax benefit of $233
|
–
|
–
|
–
|
(377
|
)
|
(377
|
)
|
||||||||||||||
|
Change in other comprehensive income of equity method investees
|
–
|
–
|
–
|
(5
|
)
|
(5
|
)
|
||||||||||||||
|
Total comprehensive income
|
–
|
2,115
|
–
|
(735
|
)
|
1,380
|
|||||||||||||||
|
Adjustment to change the measurement date pursuant to adoption of authoritative accounting guidance related to defined benefit pension and other postretirement plans, net of tax benefit of $3
|
–
|
(7
|
)
|
–
|
2
|
(5
|
)
|
||||||||||||||
|
Adjustment to initially apply authoritative accounting guidance related to defined benefit pension and other postretirement plans to equity method investees
|
–
|
–
|
–
|
(2
|
)
|
(2
|
)
|
||||||||||||||
|
Common stock dividends, $1.44 per share
|
–
|
(496
|
)
|
–
|
–
|
(496
|
)
|
||||||||||||||
|
Restricted stock and stock options expense
|
69
|
–
|
–
|
–
|
69
|
||||||||||||||||
|
Restricted stock activity and related tax benefit of $25
|
697
|
1
|
26
|
–
|
–
|
–
|
26
|
||||||||||||||
|
Exercise of stock options and related tax benefit of $71
|
3,319
|
(255
|
)
|
188
|
–
|
(26
|
)
|
–
|
162
|
||||||||||||
|
Purchase of BNSF common stock
|
–
|
(12,285
|
)
|
–
|
–
|
(1,147
|
)
|
–
|
(1,147
|
)
|
|||||||||||
|
Balance at December 31, 2008
|
541,346
|
(202,165
|
)
|
7,636
|
12,764
|
(8,395
|
)
|
(874
|
)
|
11,131
|
|||||||||||
|
Comprehensive income:
|
|||||||||||||||||||||
|
Net income
|
–
|
1,721
|
–
|
–
|
1,721
|
||||||||||||||||
|
Change in unrecognized prior service credit and actuarial losses, net of tax expense of $13
|
–
|
–
|
–
|
24
|
24
|
||||||||||||||||
|
Change in fuel/interest hedge mark-to-market, net of tax expense of $203
|
–
|
–
|
–
|
327
|
327
|
||||||||||||||||
|
Recognized loss on derivative instruments-discontinued hedges, net of tax benefit of $16
|
–
|
–
|
–
|
27
|
27
|
||||||||||||||||
|
Total comprehensive income
|
–
|
1,721
|
–
|
378
|
2,099
|
||||||||||||||||
|
Common stock dividends, $1.60 per share
|
–
|
(544
|
)
|
–
|
–
|
(544
|
)
|
||||||||||||||
|
Restricted stock and stock options expense
|
38
|
–
|
–
|
–
|
38
|
||||||||||||||||
|
Restricted stock activity
|
43
|
1
|
2
|
–
|
–
|
–
|
2
|
||||||||||||||
|
Exercise of stock options and related tax benefit of $29
|
2,027
|
(267
|
)
|
105
|
–
|
(17
|
)
|
–
|
88
|
||||||||||||
|
Purchase of BNSF common stock
|
–
|
(246
|
)
|
–
|
–
|
(16
|
)
|
–
|
(16
|
)
|
|||||||||||
|
Balance at December 31, 2009
|
543,416
|
(202,677
|
)
|
|
7,781
|
|
13,941
|
|
(8,428
|
)
|
|
(496
|
)
|
|
12,798
|
||||||
|
Comprehensive income:
|
|||||||||||||||||||||
|
Net income
|
–
|
224
|
–
|
–
|
224
|
||||||||||||||||
|
Change in unrecognized prior service credit and actuarial losses, net of tax expense of $1
|
–
|
–
|
–
|
2
|
2
|
||||||||||||||||
|
Change in fuel/interest hedge mark-to-market, net of tax benefit of $28
|
–
|
–
|
–
|
(45
|
)
|
(45
|
)
|
||||||||||||||
|
Change in other comprehensive income of equity method investees
|
–
|
–
|
–
|
2
|
2
|
||||||||||||||||
|
Total comprehensive income
|
–
|
224
|
–
|
(41
|
)
|
183
|
|||||||||||||||
|
Common stock dividends, $0.26 per share
|
–
|
(89
|
)
|
–
|
–
|
(89
|
)
|
||||||||||||||
|
Restricted stock and stock options expense
|
8
|
–
|
–
|
–
|
8
|
||||||||||||||||
|
Restricted stock activity
|
4
|
–
|
–
|
–
|
–
|
–
|
–
|
||||||||||||||
|
Exercise of stock options and related tax benefit of $10
|
544
|
(1
|
)
|
31
|
–
|
–
|
–
|
31
|
|||||||||||||
|
Purchase of BNSF common stock
|
–
|
(1
|
)
|
–
|
–
|
–
|
–
|
–
|
|||||||||||||
|
Balance at February 12, 2010
|
543,964
|
(202,679
|
)
|
$
|
7,820
|
$
|
14,076
|
$
|
(8,428
|
)
|
$
|
(537
|
)
|
$
|
12,931
|
||||||
|
Successor
|
Paid–in
Capital
|
Retained
Earnings
|
Accumulated Other
Comprehensive Income
|
Total
Equity
|
|||||||||||||||||
|
Net contribution from Berkshire Hathaway Inc.
|
$
|
34,495
|
$
|
–
|
$
|
–
|
$
|
34,495
|
|||||||||||||
|
Comprehensive income:
|
|||||||||||||||||||||
|
Net income
|
–
|
2,235
|
–
|
2,235
|
|||||||||||||||||
|
Change in unrecognized actuarial losses, net of tax benefit of $8
|
–
|
–
|
(13
|
)
|
(13
|
)
|
|||||||||||||||
|
Change in fuel hedge mark-to-market, net of tax expense of $26
|
–
|
–
|
41
|
41
|
|||||||||||||||||
|
Change in other comprehensive loss of equity method investees
|
–
|
–
|
(1
|
)
|
(1
|
)
|
|||||||||||||||
|
Total comprehensive income
|
–
|
2,235
|
27
|
2,262
|
|||||||||||||||||
|
Dividend paid to Parent
|
–
|
(1,250
|
)
|
–
|
(1,250
|
)
|
|||||||||||||||
|
Balance at December 31, 2010
|
$
|
34,495
|
$
|
985
|
$
|
27
|
$
|
35,507
|
|||||||||||||
|
See accompanying Notes to Consolidated Financial Statements.
|
|||||||||||||||||||||
Burlington Northern Santa Fe, LLC and Subsidiaries
1. The Company
Burlington Northern Santa Fe, LLC (BNSF or the Company) is a holding company that conducts no operating activities and owns no significant assets other than through its interests in its subsidiaries. BNSF’s principal, wholly-owned subsidiary is BNSF Railway Company (BNSF Railway), which operates one of the largest railroad networks in North America with approximately 32,000 route miles in 28 states and two Canadian provinces. Through one operating transportation services segment, BNSF Railway transports a wide range of products and commodities including the transportation of Consumer Products, Coal, Industrial Products and Agricultural Products, derived from manufacturing, agricultural and natural resource industries, which constituted 31 percent, 27 percent, 21 percent and 21 percent, respectively, of total freight revenues for the period February 13 – December 31, 2010 (Successor), and 30 percent, 26 percent, 20 percent and 24 percent, respectively, of total freight revenues for the period January 1 – February 12, 2010 (Predecessor). These Consolidated Financial Statements include BNSF, BNSF Railway and other majority-owned subsidiaries, all of which are separate legal entities.
Burlington Northern Santa Fe Corporation was incorporated in the State of Delaware on December 16, 1994. As further discussed in Note 3 to the Consolidated Financial Statements, on February 12, 2010, Berkshire Hathaway Inc., a Delaware corporation (Berkshire), acquired 100% of the outstanding shares of Burlington Northern Santa Fe Corporation common stock that it did not already own. The acquisition was completed through the merger (the Merger) of Burlington Northern Santa Fe Corporation with and into R Acquisition Company, LLC, a Delaware limited liability company and an indirect wholly-owned subsidiary of Berkshire (Merger Sub), with Merger Sub continuing as the surviving entity. In connection with the Merger, Merger Sub changed its name to “Burlington Northern Santa Fe, LLC” and remains an indirect, wholly-owned subsidiary of Berkshire.
Berkshire’s cost of acquiring BNSF has been pushed-down to establish a new accounting basis for BNSF beginning as of February 13, 2010. Accordingly, the accompanying consolidated financial statements are presented for two periods, Predecessor and Successor, which relate to the accounting periods preceding and succeeding the completion of the Merger. The Predecessor and Successor periods have been separated by a vertical line on the face of the consolidated financial statements to highlight the fact that the financial information for such periods has been prepared under two different historical-cost bases of accounting. Earnings per share data is not presented because BNSF has no outstanding issued stock or membership interests to the public.
2. Significant Accounting Policies
Principles of Consolidation
The Consolidated Financial Statements include the accounts of BNSF, including its principal subsidiary BNSF Railway. All significant intercompany accounts and transactions have been eliminated. The Company evaluates its less than majority-owned investments for consolidation pursuant to authoritative accounting guidance related to the consolidation of variable interest entities (VIEs).
Transfers of Financial Assets and Variable Interest Entities
In June 2009, the FASB amended authoritative accounting guidance related to transfers of financial assets which updated existing guidance. The amended authoritative accounting guidance limits the circumstances in which financial assets can be derecognized and requires enhanced disclosures regarding transfers of financial assets and a transferor’s continuing involvement with transferred financial assets. The amended authoritative accounting guidance also eliminated the concept of a qualifying special-purpose entity (QSPE), which requires companies to evaluate former QSPEs for consolidation.
In June 2009, the FASB amended authoritative accounting guidance related to the consolidation of VIEs. The amended authoritative accounting guidance updated existing guidance used to determine whether or not a company is required to consolidate a VIE and requires enhanced disclosures. The amended authoritative accounting guidance also eliminated quantitative-based assessments and requires companies to perform ongoing qualitative assessments to determine whether or not the VIE should be consolidated.
The Company prospectively adopted the amended authoritative accounting guidance on January 1, 2010. See Note 6, Note 9 and Note 11 to the Consolidated Financial Statements for information related to the impact of the amended authoritative accounting guidance.
Use of Estimates
The preparation of financial statements in accordance with generally accepted accounting principles in the United States of America (GAAP) requires management to make estimates and assumptions that affect the reported amounts of assets and liabilities and disclosure of contingent assets and liabilities at the date of the financial statements and the reported amounts of revenues and expenses during the periods presented. These estimates and assumptions are periodically reviewed by management. Actual results could differ from those estimates.
Revenue Recognition
Transportation revenues are recognized based upon the proportion of service provided as of the balance sheet date, with related expenses recognized as incurred. Revenues from ancillary services are recognized when performed. Customer incentives, which are primarily provided for shipping a specified cumulative volume or shipping to/from specific locations, are recorded as a reduction to revenue on a pro-rata basis based on actual or projected future customer shipments. When using projected shipments, the Company relies on historic trends as well as economic and other indicators to estimate the liability for customer incentives.
Accounts Receivable, Net
Accounts receivable, net includes accounts receivable reduced by an allowance for bill adjustments and uncollectible accounts. The allowance for bill adjustments and uncollectible accounts is based on historical experience as well as any known trends or uncertainties related to customer billing and account collectibility. Allowances for uncollectible accounts are charged off when it is determined that the counterparty will be unable to pay based on the contractual terms of the receivables. Additionally, the Company has an Accounts Receivable securitization program (see Note 6 to the Consolidated Financial Statements).
Cash and Cash Equivalents
All short-term investments with original maturities of 90 days or less are considered cash equivalents. Cash equivalents are stated at cost, which approximates market value because of the short maturity of these instruments.
Materials and Supplies
Materials and supplies, which consist mainly of rail, ties and other items for construction and maintenance of property and equipment, as well as diesel fuel, are valued at the lower of average cost or market.
Goodwill and Other Intangible Assets and Liabilities
Goodwill is the excess of the cost of an acquired entity over the net of the amounts assigned to assets acquired and liabilities assumed. As a result of the Merger, BNSF recognized goodwill as well as additional intangible assets and liabilities (see Note 3 to the Consolidated Financial Statements for further information related to the Merger).
Goodwill is tested for impairment annually or more frequently if events or circumstances indicate that the carrying amount may not be recoverable. The impairment test involves a two-step process. The first step is to estimate the fair value of the reporting unit through discounting projected future net cash flows. If the carrying amount of a reporting unit, including goodwill, exceeds the estimated fair value, a second step is performed. Under the second step, the identifiable assets and liabilities, including identifiable intangible assets and liabilities, of the reporting unit are estimated at fair value as of the current testing date. The excess of the estimated fair value of the reporting unit over the estimated fair value of net assets establishes the implied value of goodwill. If the carrying amount of goodwill exceeds the implied value of goodwill, an impairment loss is recognized in an amount equal to that excess.
Other intangible assets and liabilities are amortized based on the estimated pattern in which the economic benefits are expected to be consumed or on a straight-line basis over their estimated economic lives. Other intangible assets and liabilities are reviewed for impairment when events or changes in circumstances indicate that the carrying amount may not be recoverable or realized.
See Note 8 to the Consolidated Financial Statements for further information related to goodwill and other intangible assets and liabilities.
Property and Equipment, Net
BNSF’s railroad operations are highly capital intensive and its large base of homogenous, network-type assets turns over on a continuous basis. Each year BNSF develops a capital program for the replacement of assets and for the acquisition or construction of assets that enables BNSF to enhance the efficiency of operations, gain strategic benefit or provide new service offerings to customers. Assets purchased or constructed throughout the year are capitalized if they meet applicable minimum units of property criteria.
Normal repairs and maintenance are charged to operating expense as incurred, while costs incurred that extend the useful life of an asset, improve the safety of BNSF’s operations, or improve operating efficiency are capitalized.
Property and equipment are stated at cost and are depreciated and amortized on a straight-line basis over their estimated useful lives. Upon application of acquisition method accounting, at the Merger date property and equipment were measured at fair value to establish a new historical cost basis. The Company uses the group method of depreciation in which a single depreciation rate is applied to the gross investment in a particular class of property, despite differences in the service life or salvage value of individual property units within the same class. The Company conducts studies of depreciation rates and the required accumulated depreciation balance as required by the Surface Transportation Board (STB), which is generally every three years for equipment property and every six years for track structure and other roadway property. These detailed studies form the basis for our depreciation methods used in accordance with current U.S. GAAP. There are no differences between assumptions used in determining average service lives between STB reporting and U.S. GAAP.
Depreciation studies take into account the following factors:
|
•
|
Statistical analysis of historical patterns of use and retirements of each of BNSF’s asset classes;
|
|
•
|
Evaluation of any expected changes in current operations and the outlook for continued use of the assets;
|
|
•
|
Evaluation of technological advances and changes to maintenance practices; and
|
|
•
|
Expected salvage to be received upon retirement.
|
Changes in the estimated service lives of the assets and their related depreciation rates are implemented prospectively. Currently, BNSF is not aware of any specific factors that would cause significant changes in average useful service lives.
Under group depreciation, the historical cost net of salvage of depreciable property that is retired or replaced in the ordinary course of business is charged to accumulated depreciation and no gain or loss is recognized. This historical cost of certain assets is estimated as it is impracticable to track individual, homogenous network-type assets. Historical costs are estimated by deflating current costs using (i) the Producer Price Index (PPI) and (ii) the estimated useful life of the assets as determined by BNSF’s depreciation studies. The PPI was selected because it closely correlates with the major costs of the items comprising the asset classes. Because of the number of estimates inherent in the depreciation and retirement processes and because it is impossible to precisely estimate each of these variables until a group of property is completely retired, BNSF continually monitors the estimated service lives of its assets and the accumulated depreciation associated with each asset class to ensure its depreciation rates are appropriate.
For retirements of depreciable asset classes that do not occur in the normal course of business, a gain or loss may be recognized in operating expense if the retirement meets each of the following conditions: (i) is unusual, (ii) is material in amount, and (iii) varies significantly from the retirement profile identified through BNSF’s depreciation studies. During the three fiscal years presented, no such gains or losses were recognized due to the retirement of depreciable assets. Gains or losses from disposals of land and non-rail property are recorded at the time of their occurrence.
When BNSF purchases an asset, all costs necessary to make the asset ready for its intended use are capitalized. BNSF self-constructs portions of its track structure and rebuilds certain classes of rolling stock. Expenditures that significantly increase asset values or extend useful lives are capitalized. In addition to direct labor and material, certain indirect costs such as materials, small tools and project supervision are capitalized. Annually, a study is performed for the purpose of identifying indirect costs that clearly relate to capital projects. Costs related to the removal and deconstruction of replaced assets are not included in such studies. From those studies, an overhead application rate is developed. Indirect projects costs are then allocated to capital projects using this overhead application rate.
BNSF incurs certain direct labor, contract service and other costs associated with the development and installation of internal-use computer software. Costs for newly developed software or significant enhancements to existing software are typically capitalized. Research, preliminary project, operations, maintenance and training costs are charged to operating expense when the work is performed.
Assets held under capital leases are recorded at the lower of the net present value of the minimum lease payments or at the fair value of the leased asset at the inception of the lease. Amortization expense is computed using the straight-line method over the shorter of the estimated useful lives of the asset or the period of the related lease.
Leasehold improvements that meet capitalization criteria are capitalized and amortized on a straight-line basis over the lesser of their estimated useful lives or the remaining lease term. Cash flows for capitalized leasehold improvements are reported in the investing activities other, net line of the Consolidated Statements of Cash Flows.
Long-lived assets are reviewed for impairment when events or changes in circumstances indicate that the carrying amount of an asset may not be recoverable. If impairment indicators are present and the estimated future undiscounted cash flows are less than the carrying value of the long-lived assets, the carrying value is reduced to the estimated fair value as measured by the discounted cash flows.
Planned Major Maintenance Activities
BNSF utilizes the deferral method of accounting for leased locomotive overhauls, which includes the refurbishment of the engine and related components. Accordingly, BNSF has established an asset for overhauls that have been performed. This asset, which is included in property and equipment, net in the Consolidated Balance Sheets, is amortized to expense using the straight-line method until the next overhaul is performed or the end of the lease, whichever comes first, typically between six and eight years.
Rail Grinding Costs
Upon the Merger discussed in Note 3, BNSF adopted the direct expense method of accounting for rail grinding costs, under which the Company expenses rail grinding costs as incurred.
Environmental Liabilities
Liabilities for environmental cleanup costs are initially recorded when BNSF’s liability for environmental cleanup is both probable and reasonably estimable. Subsequent adjustments to initial estimates are recorded as necessary based upon additional information developed in subsequent periods. Estimates for these liabilities are undiscounted.
Personal Injury Claims
Liabilities for personal injury claims are initially recorded when the expected loss is both probable and reasonably estimable. Subsequent adjustments to initial estimates are recorded as necessary based upon additional information developed in subsequent periods. Liabilities recorded for unasserted personal injury claims, including those related to asbestos, are based on information currently available. Other than the fair value adjustments recorded in the application of acquisition method accounting, as discussed in Note 3, estimates of liabilities for personal injury claims are undiscounted.
Income Taxes
Deferred tax assets and liabilities are measured using the tax rates that apply to taxable income in the period in which the deferred tax asset or liability is expected to be realized or paid. Changes in the Company’s estimates regarding the statutory tax rate to be applied to the reversal of deferred tax assets and liabilities could materially affect the effective tax rate. Valuation allowances are established to reduce deferred tax assets if it is more likely than not that some or all of the deferred tax asset will not be realized. BNSF has not recorded a valuation allowance, as it believes that the deferred tax assets will be fully realized in the future. Investment tax credits are accounted for using the flow-through method.
The Company recognizes the tax benefit from an uncertain tax position only if it is more likely than not that the tax position will be sustained on examination by the taxing authorities, based on the technical merits of the position. The tax benefits recognized in the financial statements from such a position are measured based on the largest benefit that has a greater than fifty percent likelihood of being realized upon ultimate settlement.
BNSF is included in the U.S. consolidated federal income tax return of Berkshire beginning as of February 13, 2010. BNSF’s tax expense and liabilities have been computed on a stand alone basis, and substantially all of its current federal income taxes payable is remitted each quarter to Berkshire.
Stock-Based Compensation
The Company recognizes the compensation expense related to the cost of employee services received in exchange for Berkshire (Successor) or BNSF (Predecessor) equity interests over the award’s vesting period based on the award’s fair value at the appropriate measurement date under authoritative accounting guidance.
Employment Benefit Plans
The Company estimates liabilities and expenses for pension and retiree health and welfare plans. Estimated amounts are based on historical information, current information and estimates regarding future events and circumstances. Significant assumptions used in the valuation of pension and/or retiree health and welfare liabilities include the expected return on plan assets, discount rate, rate of increase in compensation levels and the health care cost trend rate.
Fair Value Measurements
As defined under authoritative accounting guidance, fair value is the price that would be received to sell an asset or paid to transfer a liability between market participants in the principal market or in the most advantageous market when no principal market exists. Adjustments to transaction prices or quoted market prices may be required in illiquid or disorderly markets in order to estimate fair value. Different valuation techniques may be appropriate under the circumstances to determine the value that would be received to sell an asset or paid to transfer a liability in an orderly transaction. Market participants are assumed to be independent, knowledgeable, able and willing to transact an exchange and not under duress. Nonperformance or credit risk is considered in determining the fair value of liabilities. Considerable judgment may be required in interpreting market data used to develop the estimates of fair value. Accordingly, estimates of fair value presented herein are not necessarily indicative of the amounts that could be realized in a current or future market exchange.
The authoritative accounting guidance specifies a three-level hierarchy of valuation inputs which was established to increase consistency, clarity and comparability in fair value measurements and related disclosures.
|
•
|
Level 1–Quoted prices for identical assets or liabilities in active markets that the Company has the ability to access at the measurement date.
|
|
•
|
Level 2–Quoted prices for similar assets or liabilities in active markets; quoted prices for identical or similar assets or liabilities in markets that are not active; and model-derived valuations in which all significant inputs are observable market data.
|
|
•
|
Level 3–Valuations derived from valuation techniques in which one or more significant inputs are unobservable.
|
Subsequent Events
Related Party Transaction
In February 2011, BNSF declared and paid a dividend of $1 billion to its parent company.
Reclassifications
Certain comparative prior year amounts in the Consolidated Financial Statements and accompanying notes have been reclassified to conform to the current year presentation. These reclassifications had no effect on previously reported operating income or net income.
3. Merger
As discussed in Note 1 to the Consolidated Financial Statements, on February 12, 2010, Burlington Northern Santa Fe Corporation was acquired by Berkshire pursuant to the Agreement and Plan of Merger, dated as of November 2, 2009 (the Merger Agreement). Immediately prior to completion of the Merger, Berkshire and its affiliates and associates owned 76,777,029 shares of Burlington Northern Santa Fe Corporation common stock, representing 22.5% of the total issued and outstanding shares of its common stock. As a result of the Merger, each share of common stock of Burlington Northern Santa Fe Corporation, par value $0.01 per share, other than shares owned by Berkshire, Burlington Northern Santa Fe Corporation or any of their respective subsidiaries, was converted into the right to receive, at the election of the stockholder (subject to the proration and reallocation procedures described in the Merger Agreement), either (i) $100.00 in cash, without interest, or (ii) a portion of a share of Berkshire Class A common stock equal to the exchange ratio, which was calculated by dividing $100.00 by the average of the daily volume–weighted average trading prices per share of Berkshire Class A common stock over the ten trading day period ending on the second full trading day prior to completion of the Merger. Fractional shares of Berkshire Class A common stock were not issued in the Merger. Instead, shares of Berkshire Class B common stock were issued in lieu of fractional shares of Berkshire Class A common stock, and cash was paid in lieu of fractional shares of Berkshire Class B common stock. Approximately 60% of the total merger consideration paid by Berkshire to stockholders of Burlington Northern Santa Fe Corporation was in the form of cash and approximately 40% was in the form of Berkshire common stock.
Between January 1 and February 12, 2010 (Predecessor), the Company incurred approximately $62 million in costs related to the Merger, which were primarily recorded in purchased services in the Consolidated Statements of Income.
The Merger was accounted for using the acquisition method under Accounting Standards Codification (ASC) Topic 805, Business Combinations. Under the acquisition method, the purchase price was allocated to the underlying tangible and intangible assets acquired and liabilities assumed based on their respective fair values, with the remainder allocated to goodwill. None of the goodwill recorded in connection with the Merger will be deductible for income tax purposes. The purchase price allocation at December 31, 2010, is complete and is summarized in the following tables (in millions):
|
Cash paid as merger consideration
|
$
|
15,874
|
|
|
Value of Berkshire common stock issued as merger consideration
|
10,577
|
||
|
Total merger consideration to acquire the remaining shares of Predecessor
|
26,451
|
||
|
Value of Predecessor already owned by Berkshire valued at merger price of $100.00 per share
|
7,678
|
||
|
Value of Berkshire equity awards to replace pre-existing Predecessor equity awards
|
366
|
||
|
Total purchase price to be allocated
|
$
|
34,495
|
|
Assets
|
Liabilities and net assets acquired
|
|||||||
|
Cash and cash equivalents
|
$
|
971
|
Accounts payable and other current liabilities
|
$
|
2,261
|
|||
|
Accounts receivable
|
808
|
Long-term debt due within one year
|
649
|
|||||
|
Materials and supplies
|
630
|
Long-term debt
|
10,493
|
|||||
|
Current portion of deferred income taxes
|
210
|
Deferred income taxes
|
13,413
|
|||||
|
Other current assets
|
144
|
Intangible liabilities
|
2,056
|
|||||
|
Property and equipment
|
43,987
|
Casualty and environmental liabilities
|
928
|
|||||
|
Goodwill
|
14,803
|
Pension and retiree health and welfare liability
|
865
|
|||||
|
Intangible assets
|
2,025
|
Other liabilities
|
513
|
|||||
|
Other assets
|
2,095
|
Net assets acquired
|
34,495
|
|||||
|
Total assets
|
$
|
65,673
|
Total liabilities and net assets acquired
|
$
|
65,673
|
The fair value of assets acquired included accounts receivable of $808 million, consisting of the gross amount due under contracts of $862 million, less $54 million estimated to be uncollectible.
The fair value of assets acquired also included intangible assets of $2,025 million, with a weighted average amortization life of 10 years. The fair value of liabilities acquired included intangible liabilities of $2,056 million, with a weighted average amortization life of 16 years. See Note 8 to the Consolidated Financial Statements for further information related to intangible assets and liabilities.
Liabilities acquired included contingencies related to casualty and environmental liabilities in the amount of $1,178 million. Casualty liabilities were measured at fair value, and environmental liabilities were measured in accordance with ASC Topic 450, Contingencies. See Note 12 to the Consolidated Financial Statements for further information related to casualty and environmental liabilities.
The following unaudited pro forma financial data summarizes BNSF’s results of operations as if the Merger had occurred as of January 1, 2009 (in millions):
|
Year ended December 31,
|
||||||
|
2010
|
2009
|
|||||
|
Revenues
|
$
|
16,883
|
$
|
14,290
|
||
|
Net income
|
$
|
2,549
|
$
|
1,949
|
||
The pro forma amounts represent BNSF’s results of operations with appropriate adjustments, which are expected to have a continuing impact, resulting from the application of acquisition method accounting. The unaudited pro forma financial data is provided for informational purposes only and is not necessarily indicative of what BNSF’s results of operations would have been if the Merger had occurred as of January 1, 2009, or the results of operations for any future periods.
4. Derivative Activities
The Company uses derivative financial instruments to hedge against increases in diesel fuel prices and interest rates as well as to convert a portion of its fixed-rate long-term debt to floating-rate debt. The Company does not use derivative financial instruments for trading or speculative purposes. The Company formally documents the relationship between the hedging instrument and the hedged item, as well as the risk management objective and strategy for the use of the hedging instrument. This documentation includes linking the derivatives that are designated as fair value or cash flow hedges to specific assets or liabilities on the balance sheet, commitments or forecasted transactions. The Company assesses at the time a derivative contract is entered into, and at least quarterly thereafter, whether the derivative item is effective in offsetting the changes in fair value or cash flows. Any change in fair value resulting from ineffectiveness, as defined by authoritative accounting guidance related to derivatives and hedging, is recognized in current period earnings. For derivative instruments that are designated and qualify as cash flow hedges, the effective portion of the gain or loss on the derivative instrument is recorded in accumulated other comprehensive income (AOCI) as a separate component of equity and reclassified into earnings in the period during which the hedge transaction affects earnings. Cash flows related to fuel and interest rate derivatives are classified as operating activities in the Consolidated Statements of Cash Flows.
Upon application of acquisition method accounting due to the Merger, the Company was required to re-designate its outstanding derivatives as hedges under authoritative accounting guidance. Certain costless collar derivatives did not qualify for re-designation as they were in net written positions as of the Merger date. As a result, hedge accounting was discontinued on these instruments. The Company will continue to hold these financial instruments to hedge against increases in diesel fuel prices, recognizing any gains and losses from changes in fair value in current period earnings.
No additional derivative contracts have been entered into subsequent to the Merger.
BNSF monitors its derivative instrument positions and credit ratings of its counterparties and does not anticipate any losses due to counterparty nonperformance. All counterparties were financial institutions with credit ratings of A2/A or higher as of December 31, 2010. The maximum amount of loss the Company could incur from credit risk based on the gross fair value of derivative instruments in asset positions as of December 31, 2010 and 2009, was $87 million and $104 million, respectively. Other than as disclosed under the heading “Fuel; Total Fuel-Derivative Activities,” the Company’s derivative agreements do not include provisions requiring collateral. Certain of the Company’s derivative instruments are covered by master netting arrangements whereby, in the event of a default, the non-defaulting party has the right to setoff any amounts payable against any obligation of the defaulting party under the same counterparty agreement. As such, the Company’s net asset exposure to counterparty credit risk was $86 million and $90 million as of December 31, 2010 and 2009, respectively.
Additional disclosures related to derivative instruments are included in Note 11 and Note 16 to the Consolidated Financial Statements.
The amounts recorded in the Consolidated Balance Sheets for derivative transactions were as follows, presented net of any master netting arrangements (in millions):
|
Successor
|
Predecessor
|
|||||||
|
December 31, 2010
|
December 31, 2009
|
|||||||
|
Short-term derivative asset
|
$
|
69
|
$
|
34
|
||||
|
Long-term derivative asset
|
17
|
57
|
||||||
|
Short-term derivative liability
|
(4
|
)
|
(25
|
)
|
||||
|
Long-term derivative liability
|
−
|
(12
|
)
|
|||||
|
Total derivatives
|
$
|
82
|
$
|
54
|
||||
The tables below contain summaries of all derivative positions reported in the Consolidated Financial Statements, presented gross of any master netting arrangements (in millions):
|
Fair Value of Derivative Instruments
|
||||||||
|
Asset Derivatives
|
||||||||
|
Successor
|
Predecessor
|
|||||||
|
December 31,
2010
|
December 31,
2009
|
Balance Sheet
Location
|
||||||
|
Asset derivatives designated as hedging
instruments under ASC 815-20
|
||||||||
|
Fuel Contracts
|
$
|
60
|
$
|
20
|
Other current assets
|
|||
|
Interest Rate Contracts
|
−
|
14
|
Other current assets
|
|||||
|
Fuel Contracts
|
17
|
40
|
Other assets
|
|||||
|
Interest Rate Contracts
|
−
|
17
|
Other assets
|
|||||
|
Fuel Contracts
|
− | 10 | Accounts payable and other current liabilities | |||||
|
Fuel Contracts
|
−
|
3
|
Other liabilities
|
|||||
|
Total asset derivatives designated as
hedging instruments under ASC 815-20
|
$
|
77
|
$
|
104
|
||||
|
Asset derivatives not designated as hedging
instruments under ASC 815-20
|
||||||||
|
Fuel contracts
|
$
|
10
|
$
|
−
|
Other current assets
|
|||
|
Total asset derivatives not designated as
hedging instruments under ASC 815-20
|
$
|
10
|
$
|
−
|
||||
|
Total asset derivatives
|
$
|
87
|
$
|
104
|
||||
|
Liability Derivatives
|
||||||||
|
Successor
|
Predecessor
|
|||||||
|
December 31,
2010
|
December 31,
2009
|
Balance Sheet
Location
|
||||||
|
Liability derivatives designated as hedging
instruments under ASC 815-20
|
||||||||
|
Fuel Contracts
|
$
|
1
|
$
|
−
|
Other current assets | |||
|
Fuel Contracts
|
4
|
35
|
Accounts payable and other current liabilities | |||||
|
Fuel Contracts
|
−
|
15
|
Other liabilities | |||||
|
Total liability derivatives designated as
hedging instruments under ASC 815-20
|
$
|
5
|
$
|
50
|
||||
|
Total liability derivatives
|
$
|
5
|
$
|
50
|
||||
|
The Effects of Derivative Instruments Gains and Losses for the Periods
February 13 – December 31, 2010 (Successor), January 1 – February 12, 2010 (Predecessor)
and the Years Ended December 31, 2009 and 2008 (Predecessor)
|
Derivatives in ASC 815-20 Cash Flow Hedging Relationships
|
Amount of Gain or (Loss) Recognized in OCI
on Derivatives (Effective Portion)
|
||||||||
|
Successor
|
Predecessor
|
|||||||
|
February 13 –
December 31,
2010
|
January 1 –
February 12,
2010
|
Year Ended
December 31,
2009
|
Year Ended
December 31,
2008
|
|||||
|
Fuel Contracts
|
$
|
93
|
$
|
(79)
|
$
|
268
|
$
|
(499)
|
|
Interest Rate Contracts
|
−
|
−
|
66
|
(116)
|
||||
|
Total derivatives
|
$
|
93
|
$
|
(79)
|
$
|
334
|
$
|
(615)
|
|
Amount of Gain or (Loss) Recognized from
AOCI into Income (Effective Portion)
|
|||||||||
|
Successor
|
Predecessor
|
||||||||
|
Location of Gain or
(Loss) Recognized
from AOCI into Income
|
February 13 –
December 31,
2010
|
January 1 –
February 12,
2010
|
Year Ended
December 31,
2009
|
Year Ended
December 31,
2008
|
|||||
|
Fuel Contracts
|
Fuel expense
|
$
|
26
|
$
|
(6)
|
$
|
(227)
|
$
|
12
|
|
Interest Rate Contracts
|
Interest expense
|
−
|
−
|
(1)
|
−
|
||||
|
Total derivatives
|
$
|
26
|
$
|
(6)
|
$
|
(228)
|
$
|
12
|
|
|
Amount of Gain or (Loss) Recognized in
Income on Derivatives (Ineffective Portion and
Amount Excluded from Effectiveness Testing)a
|
|||||||||
|
Successor
|
Predecessor
|
||||||||
|
Location of Gain or
(Loss) Recognized
in Income on Derivatives
|
February 13 –
December 31,
2010
|
January 1 –
February 12,
2010
|
Year Ended
December 31,
2009
|
Year Ended
December 31,
2008
|
|||||
|
Fuel Contracts
|
Fuel expense
|
$
|
10
|
$
|
(7)
|
$
|
32
|
$
|
(17)
|
|
Total derivatives
|
$
|
10
|
$
|
(7)
|
$
|
32
|
$
|
(17)
|
|
a No portion of the gain or (loss) was excluded from the assessment of hedge effectiveness for the periods then ended.
Derivatives Not Designated as Hedging Instruments under ASC 815-20
|
Amount of Gain or (Loss) Recognized in
Income on Derivatives
|
|||||||||
|
Successor
|
Predecessor
|
||||||||
|
Location of Gain or
(Loss) Recognized in
Income on Derivatives
|
February 13 –
December 31,
2010
|
January 1 –
February 12,
2010
|
Year Ended
December 31,
2009
|
Year Ended
December 31,
2008
|
|||||
|
Fuel Contracts
|
Fuel expense
|
$
|
13
|
$
|
−
|
$
|
−
|
$
|
−
|
|
Interest Rate Contracts
|
Interest expense
|
−
|
−
|
(32)
|
−
|
||||
|
Total derivatives
|
$
|
13
|
$
|
−
|
$
|
(32)
|
$
|
−
|
|
As of December 31, 2010, the Company estimates that within the next twelve months approximately $59 million in pre-tax hedge instrument gains will be reclassified from accumulated other comprehensive income into earnings.
Fuel
Fuel costs represented 24 percent, 25 percent, 22 percent and 33 percent of total operating expenses during the periods February 13 – December 31, 2010 (Successor), January 1 – February 12, 2010 (Predecessor), and the years ended December 31, 2009 and 2008 (Predecessor), respectively. Due to the significance of diesel fuel expenses to the operations of BNSF and the historical volatility of fuel prices, the Company has entered into derivatives to partially mitigate the risk of fluctuations in the price of its diesel fuel purchases. The fuel derivatives include the use of derivatives that are accounted for as cash flow hedges. The Company enters into fuel-derivative instruments based on management’s evaluation of current and expected diesel fuel price trends with the intent of protecting operating margins and overall profitability from adverse fuel price changes. However, to the extent the Company hedges portions of its fuel purchases, it may not realize the impact of decreases in fuel prices. Conversely, to the extent the Company does not hedge portions of its fuel purchases, it may be adversely affected by increases in fuel prices.
Total Fuel-Derivative Activities
As of December 31, 2010, BNSF’s total fuel-derivative positions for 2011 and 2012, of which the majority are designated as cash flow hedges, covered approximately 19 percent and 3 percent, respectively, of the average annual locomotive fuel consumption over the past three years. Derivative positions are closely monitored to ensure that they will not exceed actual fuel requirements in any period. As of December 31, 2010 and 2009, BNSF had entered into fuel-derivative agreements covering approximately 284 million gallons and 561 million gallons, respectively.
Certain of the Company’s fuel-derivative instruments are covered by an agreement which includes a provision such that the Company either receives or posts cash collateral if the fair value of the instruments exceeds a certain net asset or net liability threshold, respectively. The threshold is based on a sliding scale, utilizing either the counterparty’s credit rating, if the instruments are in a net asset position, or BNSF’s credit rating, if the instruments are in a net liability position. If the applicable credit rating should fall below Ba3 (Moody’s) or BB- (S&P), the threshold would be eliminated and collateral would be required for the entire fair value amount. All cash collateral paid is held on deposit by the payee and earns interest to the benefit of the payor based on the London Interbank Offered Rate (LIBOR). The aggregate fair value of all open fuel-derivative instruments under these provisions was in a net liability position on December 31, 2010 and 2009, of $4 million and $18 million, respectively, which was below the collateral threshold. As such, there was no posted collateral outstanding at December 31, 2010 or 2009.
The Company utilizes a market approach using the forward commodity price for the periods hedged to value its fuel-derivative swaps and costless collars. As such, the fair values of these instruments are classified as Level 2 valuations under authoritative accounting guidance related to fair value measurements.
Interest Rate
From time to time, the Company enters into various interest rate derivative transactions for the purpose of managing exposure to fluctuations in interest rates by establishing rates in anticipation of both future debt issuances and the refinancing of leveraged leases, as well as converting a portion of its fixed-rate, long-term debt to floating-rate debt. The Company uses interest rate swaps and treasury locks as part of its interest rate risk management strategy.
The Company utilizes a market approach using estimates of the mid-market values to value its interest rate derivatives. As such, the fair values of these instruments are classified as Level 2 valuations under authoritative accounting guidance related to fair value measurements.
Fair Value Interest Rate Hedges
The Company enters into interest rate swaps to convert fixed-rate long-term debt to floating-rate debt. These swaps are accounted for as fair value hedges under authoritative accounting guidance related to derivatives and hedging. Upon application of acquisition method accounting due to the Merger, the outstanding swaps were re-designated as fair value hedges. However, the swaps no longer qualified for the short-cut method of recognition; therefore, effectiveness was measured at least quarterly and any resulting ineffectiveness was recognized in current period earnings.
The gain or loss on the fair value hedges as well as the offsetting loss or gain on the hedged items (fixed-rate debt) attributable to the hedged risk were recorded in current earnings. The Company includes the gain or loss on the fixed-rate debt in the same line item (interest expense) as the offsetting loss or gain on the related interest rate swaps as follows (in millions):
|
Gain (Loss) on Interest Rate Swaps
|
||||||||||||
|
Successor
|
Predecessor
|
|||||||||||
|
Income Statement Classification
|
February 13
– December
31, 2010
|
January 1 –
February
12, 2010
|
Year Ended
December
31, 2009
|
Year Ended
December
31, 2008
|
||||||||
|
Interest expense
|
$
|
14
|
$
|
6
|
$
|
(47)
|
|
$
|
67
|
|||
|
Gain (Loss) on Fixed-rate Debt
|
||||||||||||
|
Successor
|
Predecessor
|
|||||||||||
|
Income Statement Classification
|
February 13
– December
31, 2010
|
January 1 –
February
12, 2010
|
Year Ended
December
31, 2009
|
Year Ended
December
31, 2008
|
||||||||
|
Interest expense
|
$
|
(13)
|
$
|
(6)
|
|
$
|
47
|
$
|
(67)
|
|||
In July 2010, BNSF unwound four interest rate swaps having an aggregate notional amount of $400 million. The swaps were originally entered into in March 2008 to convert the fixed rate of 5.75 percent on $400 million of 10-year notes, due 2018, into a variable interest rate. As a result of the transaction, BNSF recognized a gain of $45 million, which will be amortized as a reduction of interest expense over the remaining term of these notes.
As of December 31, 2010, BNSF had no outstanding interest rate swaps. As of December 31, 2009, BNSF had entered into nine separate swaps with an aggregate notional amount of $650 million, in conjunction with notes due in 2010 and 2018.
Cash Flow Interest Rate Hedges
As of December 31, 2010 and 2009, the Company had no outstanding cash flow hedges.
AOCI included $8 million of unrecognized gains on closed hedges as of December 31, 2009, which was being amortized to interest expense over the life of the corresponding issued debt. The unrecognized gain on closed hedges in AOCI was eliminated in the application of acquisition method accounting due to the Merger.
In September 2009, the Company entered into a treasury lock having a notional amount of $500 million and a locked-in rate of 3.46 percent, to fix a portion of the rate for a 10-year unsecured debt issuance. The treasury lock was terminated in connection with the issuance of $750 million 10-year notes (see Note 11 to the Consolidated Financial Statements). Upon termination, BNSF received approximately $600 thousand from the counterparty, which, prior to the application of acquisition method accounting due to the Merger, was being amortized to interest expense over the life of the issued debt. This transaction was accounted for as a cash flow hedge.
In anticipation of a future debt issuance, the Company entered into five treasury locks during 2008 having an aggregate notional amount of $250 million, and an average locked-in rate of 4.18 percent, to fix a portion of the rate for a future 30-year unsecured debt issuance. The Company also entered into six treasury locks during 2008 having an aggregate notional amount of $150 million, and an average locked-in rate of 3.80 percent, to fix a portion of the rate for a future 10-year unsecured debt issuance. These transactions were previously accounted for as cash flow hedges. During the first quarter of 2009, the Company determined that it was no longer probable that it would issue debt according to the terms of the hedges. As such, hedge accounting could no longer be applied to the treasury locks. The treasury locks were terminated in early April of 2009, and $32 million was paid to the counterparties, which was the fair value of the treasury locks at the date of termination. Therefore, a net $32 million loss was recognized as an increase to interest expense during 2009.
In anticipation of a future debt issuance, the Company entered into nine treasury locks during 2008 and 2007, having an aggregate notional amount of $250 million, and an average locked-in rate of 4.24 percent, to fix a portion of the rate for a future 10-year unsecured debt issuance. The treasury locks were terminated in March 2008 in connection with the issuance of $650 million 10-year notes (see Note 11 to the Consolidated Financial Statements). Upon termination, BNSF paid $13 million to the counterparties, which, prior to the application of acquisition method accounting due to the Merger, was being amortized to interest expense over the life of the issued debt. These transactions were accounted for as cash flow hedges.
5. Income Taxes
Income tax expense was as follows (in millions):
|
Successor
|
Predecessor
|
|||||||||||
|
February 13 –
December 31,
2010
|
January 1 –
February 12,
2010
|
Year Ended
December 31,
2009
|
Year Ended
December 31,
2008
|
|||||||||
|
Current:
|
||||||||||||
|
Federal
|
$
|
593
|
$
|
23
|
$
|
282
|
$
|
735
|
||||
|
State
|
73
|
3
|
26
|
101
|
||||||||
|
Total current
|
666
|
26
|
308
|
836
|
||||||||
|
Deferred:
|
||||||||||||
|
Federal
|
626
|
113
|
535
|
383
|
||||||||
|
State
|
84
|
14
|
77
|
34
|
||||||||
|
Total deferred
|
710
|
127
|
612
|
417
|
||||||||
|
Total
|
$
|
1,376
|
$
|
153
|
$
|
920
|
$
|
1,253
|
||||
Reconciliation of the U.S. federal statutory income tax rate to the effective tax rate was as follows:
|
Successor
|
Predecessor
|
|||||||||
|
February 13 –
December 31,
2010
|
January 1 –
February 12,
2010
|
Year Ended
December 31,
2009
|
Year Ended
December 31,
2008
|
|||||||
|
U.S. Federal statutory income tax rate
|
35.0
|
%
|
35.0
|
%
|
35.0
|
%
|
35.0
|
%
|
||
|
State income taxes, net of federal tax benefit
|
3.1
|
3.1
|
2.5
|
2.6
|
||||||
|
Property donations
|
–
|
–
|
(3.0
|
)
|
–
|
|||||
|
Tax law change (Medicare Part D)
|
0.5
|
–
|
–
|
–
|
||||||
|
Other, net
|
(0.5
|
)
|
2.5
|
0.3
|
(0.4
|
)
|
||||
|
Effective tax rate
|
38.1
|
%
|
40.6
|
%
|
34.8
|
%
|
37.2
|
%
|
||
The components of deferred tax assets and liabilities were as follows (in millions):
|
Successor
|
Predecessor
|
|||||||
|
December 31,
2010
|
December 31,
2009
|
|||||||
|
Deferred tax liabilities:
|
||||||||
|
Property and equipment
|
$
|
(15,652
|
)
|
$
|
(9,939
|
)
|
||
|
Hedging
|
(31
|
)
|
(12
|
)
|
||||
|
Other
|
(298
|
)
|
(173
|
)
|
||||
|
Total deferred tax liabilities
|
(15,981
|
)
|
(10,124
|
)
|
||||
|
Deferred tax assets:
|
||||||||
|
Intangible assets and liabilities
|
474
|
–
|
||||||
|
Casualty and environmental
|
395
|
398
|
||||||
|
Compensation and benefits
|
372
|
141
|
||||||
|
Long-term debt fair value adjustment under acquisition method accounting
|
253
|
–
|
||||||
|
Pension and retiree health and welfare benefits
|
207
|
328
|
||||||
|
Other
|
290
|
225
|
||||||
|
Total deferred tax assets
|
1,991
|
1,092
|
||||||
|
Net deferred tax liability
|
$
|
(13,990
|
)
|
$
|
(9,032
|
)
|
||
|
Non-current deferred income tax liability
|
$
|
(14,307
|
)
|
$
|
(9,322
|
)
|
||
|
Current portion of deferred income taxes
|
317
|
290
|
||||||
|
Net deferred tax liability
|
$
|
(13,990
|
)
|
$
|
(9,032
|
)
|
||
BNSF is included in the consolidated U.S. federal income tax return of Berkshire beginning as of February 13, 2010. BNSF’s tax expense and liabilities have been computed on a stand alone basis, and substantially all of its currently payable income taxes are remitted each quarter to Berkshire. See Note 14 to the Consolidated Financial Statements for information related to income taxes paid to Berkshire during 2010.
All U.S. federal income tax returns of BNSF are closed through 2005. Internal Revenue Service (IRS) examination of the years 2006 and 2007 for BNSF is completed, and the un-agreed issues are pending before IRS Appeals. It is anticipated that a settlement with the IRS for the years 2006 and 2007 may be reached within the next twelve months. BNSF is currently under examination for years 2008 and 2009, and for the short tax year January 1 - February 12, 2010.
BNSF and its subsidiaries have various state income tax returns in the process of examination, administrative appeal or litigation. State income tax returns are generally subject to examination for a period of three to five years after filing of the respective return. The state impact of any federal changes remains subject to examination by various states for a period of up to one year after formal notification to the states.
A significant portion of the audit issues relate to state income tax issues with various taxing authorities and with the IRS related to whether certain valuations of donated property are appropriate. A provision for taxes resulting from ongoing and future federal and state audits is based on an estimation of aggregate adjustments that may be required as a result of the audits.
Uncertain Tax Positions
The amount of unrecognized tax benefits at December 31, 2010, 2009 and 2008, was $112 million, $166 million and $150 million, respectively. The amount of unrecognized tax benefits at December 31, 2010, that would affect the Company’s effective tax rate if recognized was $86 million. A reconciliation of the beginning and ending amount of unrecognized tax benefits is as follows (in millions):
|
Successor
|
Predecessor
|
|||||||||||||
|
February 13 –
December 31,
2010
|
January 1 –
February 12,
2010
|
Year ended
December 31,
2009
|
Year ended
December 31,
2008
|
|||||||||||
|
Beginning balance
|
$
|
167
|
$
|
166
|
$
|
150
|
$
|
125
|
||||||
|
Additions for tax positions related to current year
|
24 | 1 | 49 | 19 | ||||||||||
|
(Reductions) additions for tax positions taken in prior years
|
(58 |
)
|
− | (8 | ) | 9 | ||||||||
|
(Reductions) additions for tax positions as a result of:
|
|
|||||||||||||
|
Settlements
|
(10 |
)
|
− |
(13
|
) |
2
|
||||||||
|
Lapse of statute of limitations
|
(11 |
)
|
−
|
(12
|
) |
(5
|
) | |||||||
|
Ending balance
|
$
|
112 |
$
|
167 |
$
|
166
|
$
|
150 | ||||||
It is expected that the amount of unrecognized tax benefits will change in the next twelve months; however, BNSF does not expect the change to have a significant impact on the results of operations or the financial position of the Company.
The Company recognizes interest accrued related to unrecognized tax benefits in interest expense and penalties in income tax expense in the Consolidated Statements of Income, which is consistent with the recognition of these items in prior reporting periods. The Company had recorded a liability of approximately $20 million and $23 million for the payment of interest and penalties for the years ended December 31, 2010 and 2009, respectively. For the periods February 13 – December 31, 2010 (Successor), and the years ended December 31, 2009 and 2008 (Predecessor), the Company recognized a reduction of approximately $9 million, $8 million and $18 million in interest and penalty expense, respectively. For the period January 1 – February 12, 2010 (Predecessor), the Company recognized an increase of approximately $1 million in interest and penalty expense.
6. Accounts Receivable, Net
BNSF Railway may transfer a portion of its accounts receivable to a wholly-owned subsidiary, Santa Fe Receivables Corporation (SFRC). SFRC transfers an undivided interest in such receivables, with limited exceptions, to a master trust and causes the trust to issue an undivided interest in the receivables to investors (the A/R securitization program). The undivided interests in the master trust purchased by investors may be in the form of certificates or purchased interests. BNSF Railway retains the collection responsibility with respect to the accounts receivable transferred. The investors in the master trust have no recourse to BNSF Railway’s other assets except for customary warranty and indemnity claims. Creditors of BNSF Railway have no recourse to the assets of the master trust or SFRC until after the creditors have been paid and SFRC and the master trust have been terminated.
BNSF Railway’s total capacity to sell undivided interests to investors under the A/R securitization program was $200 million at December 31, 2010, which was comprised of two $100 million facilities, which were entered into in November 2010 and terminate in November 2011. Each of the financial institutions providing credit for the facilities is rated Aa2/A+ or higher. The amount of undivided interests in the accounts receivable sold by BNSF Railway to investors fluctuates based on borrowing needs. Additionally, if the combined dilution and delinquency percentages exceed an established threshold, there would be an impact on the amount of undivided interest that BNSF Railway could sell. At December 31, 2010, the effective capacity under the A/R securitization program was $200 million.
As discussed in Note 2 to the Consolidated Financial Statements, on January 1, 2010, BNSF Railway prospectively adopted authoritative accounting guidance which amended accounting guidance related to transfers of assets and VIEs. The amended guidance also eliminated the concept of a QSPE.
At January 1, 2010, the A/R securitization program master trust was considered a VIE as it does not retain sufficient equity to finance its activities without the support of BNSF Railway. BNSF Railway has a variable interest in the master trust as it absorbs any losses related to the receivables transferred in the event of default. BNSF Railway is the primary beneficiary of the VIE as it (1) directs the amount of undivided interest in receivables sold to investors by the master trust, and thus holds the power to direct the activities of the master trust that most significantly impact performance and (2) has the obligation to absorb the losses in the event of defaulted receivables, which could potentially be significant to the master trust. As the primary beneficiary of the master trust, BNSF Railway fully consolidated the master trust at January 1, 2010. The consolidation did not impact the Company’s consolidated financial statements as there were no outstanding undivided interests held by investors under the A/R securitization program at January 1, 2010. Prior to 2010, the A/R securitization master trust was considered a QSPE and was not consolidated.
As of December 31, 2010 and 2009, there were no outstanding undivided interests held by investors under the A/R securitization program; thus, no asset or related liability was recorded in the Company’s Consolidated Balance Sheets. For the year ended December 30, 2009, $50 million of cash flows related to the A/R securitization program was classified as Operating Activities in the Consolidated Statement of Cash Flows. Upon adoption of the aforementioned guidance on January 1, 2010, any prospective activity will be classified as Financing Activities in the Consolidated Statements of Cash Flows. For the periods February 13 – December 31, 2010 (Successor) and January 1 – February 12, 2010 (Predecessor), there was no cash flow activity related to the A/R securitization program.
BNSF Railway does not provide financial support to the master trust that it was not previously contractually obligated to provide.
At both December 31, 2010 and 2009, $22 million of accounts receivable were greater than 90 days old.
BNSF maintains an allowance for bill adjustments and uncollectible accounts based upon the expected collectibility of accounts receivable, including receivables transferred to the master trust. At December 31, 2010 and 2009, $27 million and $31 million, respectively, of such allowances had been recorded.
7. Property and Equipment, Net
Property and equipment, net (in millions), and the corresponding ranges of estimated useful lives were as follows:
|
Successor
|
Predecessor
|
2010 | |||||||
|
December 31,
2010
|
December 31,
2009
|
Range of
Estimated
Useful Life
|
|||||||
|
Land
|
$
|
5,901
|
$
|
1,794
|
–
|
||||
|
Track structure
|
15,711
|
20,095
|
15 – 45 years
|
||||||
|
Other roadway
|
19,752
|
12,946
|
5 – 100 years
|
||||||
|
Locomotives
|
2,846
|
4,749
|
5 – 37 years
|
||||||
|
Freight cars and other equipment
|
1,233
|
2,237
|
1 – 37 years
|
||||||
|
Computer hardware, software and other
|
250
|
685
|
5 – 9 years
|
||||||
|
Construction in progress
|
453
|
524
|
–
|
||||||
|
Total cost
|
46,146
|
43,030
|
|||||||
|
Less accumulated depreciation and amortization
|
(660
|
)
|
(10,736
|
)
|
|||||
|
Property and equipment, net
|
$
|
45,486
|
$
|
32,294
|
|||||
The Consolidated Balance Sheets at December 31, 2010 and 2009, included $2,544 million, net of $113 million of amortization and $1,876 million, net of $772 million of amortization, respectively, for property and equipment under capital leases, primarily for rolling stock.
The Company capitalized $13 million, $1 million, $18 million and $17 million of interest for the periods February 13 – December 31, 2010 (Successor), January 1 – February 12, 2010 (Predecessor), and the years ended December 31, 2009 and 2008 (Predecessor), respectively.
8. Goodwill and Other Intangible Assets and Liabilities
During the periods February 13 – December 31, 2010 (Successor), January 1 – February 12, 2010 (Predecessor), and the years ended December 31, 2009 and 2008 (Predecessor), no impairment losses related to goodwill were incurred. As of December 31, 2010 and 2009, there were no accumulated impairment losses related to goodwill.
The changes in the carrying amount of goodwill were as follows (in millions):
|
Successor
|
Predecessor
|
||||||||
|
February 13 –
December 31,
2010
|
January 1 –
February 12,
2010
|
Year Ended
December 31,
2009
|
|||||||
|
Beginning balance
|
$
|
−
|
$
|
−
|
$
|
−
|
|||
|
Additions
|
14,803
|
−
|
−
|
||||||
|
Ending balance
|
$
|
14,803
|
$
|
−
|
$
|
−
|
|||
Amortized intangible assets and liabilities were as follows (in millions):
|
Successor
|
Predecessor
|
|||||||||||
|
As of December 31, 2010
|
As of December 31, 2009
|
|||||||||||
|
Gross Carrying
Amount
|
Accumulated
Amortization
|
Gross Carrying
Amount
|
Accumulated
Amortization
|
|||||||||
|
Amortized intangible assets
|
$
|
2,013
|
$
|
281
|
$
|
−
|
$
|
−
|
||||
|
Amortized intangible liabilities
|
$
|
2,056
|
$
|
266
|
$
|
−
|
$
|
−
|
||||
Amortized intangible assets primarily consisted of internally developed software and franchise & customer assets. Amortized intangible liabilities primarily consisted of customer and shortline contracts which were in an unfavorable position at the date of Merger.
Amortized intangible assets and liabilities are amortized based on the estimated pattern in which the economic benefits are expected to be consumed or on a straight-line basis over their estimated economic lives.
Amortization of intangible assets and liabilities was as follows (in millions):
|
Successor
|
Predecessor
|
||||||||
|
February 13 –
December 31,
2010
|
January 1 –
February 12,
2010
|
Year Ended
December 31,
2009
|
|||||||
|
Amortization of intangible assets
|
$
|
281
|
$
|
−
|
$
|
−
|
|||
|
Amortization of intangible liabilities
|
$
|
266
|
$
|
−
|
$
|
−
|
|||
Amortization of intangible assets and liabilities for the next five years is expected to approximate the following (in millions):
|
Amortization of
intangible assets
|
Amortization of
intangible liabilities
|
|||||
|
2011
|
$
|
307
|
$
|
293
|
||
|
2012
|
$
|
307
|
$
|
282
|
||
|
2013
|
$
|
307
|
$
|
252
|
||
|
2014
|
$
|
307
|
$
|
179
|
||
|
2015
|
$
|
54
|
$
|
115
|
||
9. Other Assets
In July 2010, the Company entered into a low-income housing partnership (the Partnership) as the limited partner, holding a 99.9% interest in the Partnership. The Partnership is a VIE, with the purpose of developing and operating low-income housing rental properties. Recovery of the Company’s investment is accomplished through the utilization of low-income housing tax credits and the tax benefits of Partnership losses. The general partner, who holds a 0.1% interest in the Partnership, is an unrelated third party and is responsible for controlling and managing the business and financial operation of the Partnership. As the Company does not have the power to direct the activities that most significantly impact the Partnership’s economic performance, the Company is not the primary beneficiary and therefore, does not consolidate the Partnership. As of December 31, 2010, the assets of the unconsolidated Partnership totaled approximately $740 million. The Company does not provide financial support to the Partnership that it was not previously contractually obligated to provide.
The Company has accounted for its investment in the Partnership using the effective yield method. The risk of loss of the Company's investment in the Partnership is considered low as an affiliate of the general partner has provided certain guarantees of tax credits and minimum annual returns. The Company’s maximum exposure to loss related to the Partnership is the unamortized investment balance. The following table provides information as of December 31, 2010 (in millions):
|
Unamortized investment balance
classified as Other Assets
|
Remaining commitments
classified as Other Liabilities
|
Maximum exposure to loss
|
|||||
|
$
|
562
|
$
|
148
|
$
|
562
|
||
Of the remaining commitments, $130 million is due at the end of 2012 and $18 million is due at the end of 2013.
10. Accounts Payable and Other Current Liabilities
Accounts payable and other current liabilities consisted of the following (in millions):
|
Successor
|
Predecessor
|
|||||
|
December 31,
2010
|
December 31,
2009
|
|||||
|
Compensation and benefits payable
|
$
|
690
|
$
|
512
|
||
|
Accounts payable
|
327
|
244
|
||||
|
Casualty and environmental liabilities
|
215
|
250
|
||||
|
Accrued interest
|
191
|
177
|
||||
|
Property tax liabilities
|
187
|
177
|
||||
|
Rents and leases
|
174
|
283
|
||||
|
Customer incentives
|
156
|
125
|
||||
|
Dividends payable
|
−
|
137
|
||||
|
Other
|
828
|
790
|
||||
|
Total
|
$
|
2,768
|
$
|
2,695
|
||
11. Debt
Debt outstanding was as follows (in millions):
|
Successor
|
Predecessor
|
|||||||||||
|
December 31, 2010 a
|
December 31, 2009 a
|
|||||||||||
|
Notes and debentures, due 2011 to 2097
|
$
|
9,312
|
6.1
|
%
|
$
|
8,095
|
6.0
|
%
|
||||
|
Equipment obligations, due 2011 to 2027
|
228
|
6.0
|
271
|
6.2
|
||||||||
|
Capitalized lease obligations, due 2011 to 2028
|
1,378
|
5.9
|
1,589
|
5.5
|
||||||||
|
Mortgage bonds, due 2011 to 2047
|
91
|
5.1
|
94
|
5.9
|
||||||||
|
Financing obligations, due 2011 to 2028
|
314
|
6.2
|
323
|
6.2
|
||||||||
|
Unamortized fair value adjustment under acquisition method accounting, discount and other, net
|
657
|
(37
|
)
|
|||||||||
|
Total
|
11,980
|
10,335
|
||||||||||
|
Less current portion of long-term debt
|
(699
|
)
|
6.5
|
%
|
(644
|
)
|
5.1
|
%
|
||||
|
Long-term debt
|
$
|
11,281
|
$
|
9,691
|
||||||||
a Amounts represent debt outstanding and weighted average effective interest rates for 2010 and 2009, respectively. Maturities are as of December 31, 2010.
Notes and debentures included a fair value adjustment increase for hedges of $26 million at December 31, 2009. There were no outstanding interest rate hedges at December 31, 2010.
As of December 31, 2010, certain BNSF Railway properties and other assets were subject to liens securing $91 million of mortgage debt. Certain locomotives and rolling stock of BNSF Railway were subject to equipment obligations and capital leases.
The following table provides fair value information for the Company’s debt obligations including principal cash flows, related weighted average interest rates by contractual maturity dates and fair value. The Company had no outstanding variable rate debt or commercial paper at December 31, 2010.
|
December 31, 2010 (Successor)
|
||||||||||||||||||||||||||||
|
Maturity Date
|
Total
Including Capital
Leases
|
Total Excluding Capital
Leases
|
Fair Value Excluding Capital
Leases
|
|||||||||||||||||||||||||
|
2011
|
2012
|
2013
|
2014
|
2015
|
Thereafter
|
a, b
|
b
|
|||||||||||||||||||||
|
Fixed-rate debt (in millions)
|
$
|
699
|
$
|
521
|
$
|
452
|
$
|
646
|
$
|
365
|
$
|
9,297
|
$
|
11,980
|
$
|
10,446
|
$
|
10,761
|
||||||||||
|
Average interest rate
|
6.5
|
%
|
5.9
|
%
|
5.1
|
%
|
6.8
|
%
|
5.2
|
%
|
6.1
|
%
|
6.1
|
%
|
||||||||||||||
a Amount also excludes unamortized fair value adjustment under acquisition method accounting related to capital leases.
b Amount also excludes unamortized gains on interest rate swaps.
As of December 31, 2009, the fair value excluding capital leases of fixed-rate debt and variable-rate debt was $8,740 million and $676 million, respectively.
The fair value of BNSF’s long-term debt is primarily based on quoted market prices for the same or similar issues, or on the current rates that would be offered to BNSF for debt of the same remaining maturities. Capital leases, interest rate hedges and unamortized gains on interest rate swaps have been excluded from the calculation of fair value for both 2010 and 2009.
Notes and Debentures
2010
In September 2010, BNSF issued $250 million of 3.60 percent debentures due September 1, 2020 and $500 million of 5.05 percent debentures due March 1, 2041. The net proceeds from the sale of the debentures were used for general corporate purposes, including but not limited to, working capital, capital expenditures and repayment of outstanding indebtedness.
In May 2010, BNSF issued $750 million of 5.75 percent debentures due May 1, 2040. The net proceeds from the sale of the debentures were used for general corporate purposes, including but not limited to, working capital, capital expenditures and repayment of outstanding indebtedness.
In each of May and August 2010, the Board of Managers (the Board) of the Company authorized an additional $750 million of debt securities that may be issued pursuant to a debt shelf registration statement filed with the Securities and Exchange Commission (SEC). At December 31, 2010, $750 million remained authorized by the Board to be issued through the SEC debt shelf registration process.
2009
In September 2009, BNSF issued $750 million of 4.70 percent notes due October 1, 2019. The net proceeds from the sale of the notes were used for general corporate purposes including, but not limited to, working capital, capital expenditures and repayment of outstanding indebtedness.
2008
In November 2008, BNSF issued $500 million of 7.00 percent notes due February 1, 2014. The net proceeds from the sale of the notes were used for general corporate purposes including, but not limited to, working capital, capital expenditures, repurchase of common stock pursuant to the share repurchase program and repayment of short-term borrowings.
In March 2008, BNSF issued $650 million of 5.75 percent notes due March 15, 2018. The net proceeds from the sale of the notes were used for general corporate purposes including, but not limited to, working capital, capital expenditures, funding debt which matured in 2008, repurchase of common stock pursuant to the share repurchase program and repayment of short-term borrowings.
Equipment Obligation
2009
In July 2009, BNSF Railway entered into an 18-year equipment obligation totaling $75 million to finance locomotives and railcars.
Capital Leases
2010
During the periods February 13 – December 31, 2010 (Successor), and January 1 – February 12, 2010 (Predecessor), BNSF Railway entered into capital leases totaling $40 million and $8 million, respectively to finance maintenance of way and other vehicles and equipment with lease terms of five to seven years.
2009
In 2009, BNSF Railway entered into a 12-year capital lease to finance $368 million of locomotives and freight cars. Additionally, BNSF Railway entered into capital leases totaling $146 million to finance maintenance of way and other vehicles and equipment with lease terms of three to seven years.
2008
In 2008, BNSF Railway entered into a capital lease for approximately $158 million to finance locomotives and freight cars. The term of the lease is 20 years. Additionally, BNSF Railway entered into capital leases totaling $100 million to finance maintenance of way and other vehicles and equipment with lease terms of three to seven years.
Financing Obligation
In 2005, the Company commenced the construction of an intermodal facility that it intended to sell to a third party and subsequently lease back. In 2009, construction of the facility was completed for a cost of approximately $160 million. All improvements have been sold to the third party and BNSF leased the facility from the third party for 20 years. This sale leaseback transaction was accounted for as a financing obligation due to continuing involvement. The outflows from the construction of the facility were classified as investing activities, and the inflows from the associated financing proceeds were classified as financing activities in the Company’s Consolidated Statements of Cash Flows.
Revolving Credit Facility and Commercial Paper
As of December 31, 2010, the Company had borrowing capacity of up to $1.2 billion under its long-term revolving bank credit facility, which expires in September 2012. Annual facility fees are currently 0.07 percent for the facility. The rate is subject to change based upon changes in BNSF’s senior unsecured debt ratings. Borrowing rates are based upon (i) LIBOR plus a spread determined by BNSF’s senior unsecured debt ratings, (ii) money market rates offered at the option of the lenders, or (iii) an alternate base rate. BNSF must maintain compliance with certain financial covenants under its revolving bank credit facility. At December 31, 2010, the Company was in compliance with these covenants.
At December 31, 2010, there were no borrowings under the revolving credit facility.
BNSF issues commercial paper from time to time. Outstanding commercial paper reduces the amount of borrowing capacity available under the revolving bank credit facility. The classification of commercial paper is determined by the Company’s ability and intent to use long-term or short-term funding sources to settle the obligations at maturity.
There was no commercial paper outstanding at December 31, 2010 or 2009; therefore, the total borrowing capacity available under the revolving bank credit facility was $1.2 billion.
Guarantees
As of December 31, 2010, BNSF Railway has not been called upon to perform under the guarantees specifically disclosed in this footnote and does not anticipate a significant performance risk in the foreseeable future.
Debt and other obligations of non-consolidated entities guaranteed by the Company as of December 31, 2010, were as follows (dollars in millions):
|
Guarantees
|
||||||||||||||||||
|
BNSF
Ownership Percentage
|
Principal
Amount Guaranteed
|
Maximum
Future
Payments
|
Maximum
Recourse
Amount
|
a
|
Remaining
Term
(in years
|
)
|
Capitalized Obligations
|
|||||||||||
|
Kinder Morgan Energy Partners, L.P.
|
0.5
|
%
|
$
|
190
|
$
|
190
|
$
|
–
|
Termination of Ownership
|
$
|
2
|
b
|
||||||
|
Chevron Phillips Chemical Company, LP
|
0.0
|
%
|
N/A
|
d
|
N/A
|
d
|
N/A
|
d
|
7
|
$
|
11
|
c
|
||||||
|
All other
|
0.0
|
%
|
$
|
2
|
$
|
2
|
$
|
–
|
Various
|
$
|
–
|
|||||||
|
a Reflects the maximum amount the Company could recover from a third party other than the counterparty.
b Reflects capitalized obligations that are recorded on the Company’s Consolidated Balance Sheet.
c Reflects the asset and corresponding liability for the fair value of these guarantees required by authoritative accounting guidance related to guarantees.
d There is no cap to the liability that can be sought from BNSF for BNSF’s negligence or the negligence of the indemnified party. However, BNSF could receive reimbursement from certain insurance policies if the liability exceeds a certain amount.
|
||||||||||||||||||
Kinder Morgan Energy Partners, L.P.
Santa Fe Pacific Pipelines, Inc., an indirect, wholly-owned subsidiary of BNSF Railway, has a guarantee in connection with its remaining special limited partnership interest in Santa Fe Pacific Pipelines Partners, L.P. (SFPP), a subsidiary of Kinder Morgan Energy Partners, L.P., to be paid only upon default by the partnership. All obligations with respect to the guarantee will cease upon termination of ownership rights, which would occur upon a put notice issued by BNSF or the exercise of the call rights by the general partners of SFPP.
Chevron Phillips Chemical Company, LP
In the third quarter of 2007, BNSF Railway entered into an indemnity agreement with Chevron Phillips Chemical Company, LP (Chevron Phillips), granting certain rights of indemnity from BNSF Railway, in order to facilitate access to a new storage facility. Under certain circumstances, payment under this obligation may be required in the event Chevron Phillips were to incur certain liabilities or other incremental costs resulting from trackage access.
All Other
As of December 31, 2010, BNSF guaranteed $2 million of other debt and leases. These guarantees expire between 2011 and 2013.
Indemnities
In the ordinary course of business, BNSF enters into agreements with third parties that include indemnification clauses. The Company believes that these clauses are generally customary for the types of agreements in which they are included. At times, these clauses may involve indemnification for the acts of the Company, its employees and agents, indemnification for another party’s acts, indemnification for future events, indemnification based upon a certain standard of performance, indemnification for liabilities arising out of the Company’s use of leased equipment or other property, or other types of indemnification. Despite the uncertainty whether events which would trigger the indemnification obligations would ever occur, the Company does not believe that these indemnity agreements will have a material adverse effect on the Company’s results of operations, financial position or liquidity. Additionally, the Company believes that, due to lack of historical payment experience, the fair value of indemnities cannot be estimated with any amount of certainty. However, the fair value of any such amount would be immaterial to the Consolidated Financial Statements. Agreements that contain unique circumstances, particularly agreements that contain guarantees that indemnify for another party’s acts are disclosed separately if appropriate. Unless separately disclosed above, no fair value liability related to indemnities has been recorded in the Consolidated Financial Statements.
Variable Interest Entities - Leases
As discussed in Note 2 to the Consolidated Financial Statements, on January 1, 2010, the Company prospectively adopted authoritative accounting guidance which amended accounting guidance related to VIEs.
BNSF Railway has entered into various equipment lease transactions in which the structure of the lease contains VIEs. These VIEs were created solely for the lease transactions and have no other activities, assets or liabilities outside of the lease transactions. In some of the arrangements, BNSF Railway has the option to purchase some or all of the equipment at a fixed-price, thereby creating variable interests for BNSF Railway in the VIEs. The future minimum lease payments associated with the VIE leases were approximately $5 billion as of December 31, 2010.
In the event the leased equipment is destroyed, BNSF Railway is obligated to either replace the equipment or pay a fixed loss amount. The inclusion of the fixed loss amount is a standard clause within equipment lease arrangements. Historically, BNSF Railway has not incurred significant losses related to this clause. As such, it is not anticipated that the maximum exposure to loss would materially differ from the future minimum lease payments.
BNSF Railway does not provide financial support to the VIEs that it was not previously contractually obligated to provide.
BNSF Railway maintains and operates the equipment based on contractual obligations within the lease arrangements, which set specific guidelines consistent within the industry. As such, BNSF Railway has no control over activities that could materially impact the fair value of the leased equipment. BNSF Railway does not hold the power to direct the activities of the VIEs and therefore does not control the ongoing activities that have a significant impact on the economic performance of the VIEs. Additionally, BNSF Railway does not have the obligation to absorb losses of the VIEs or the right to receive benefits of the VIEs that could potentially be significant to the VIEs. Depending on market conditions, the fixed-price purchase options could potentially provide benefit to the Company; however, any benefits potentially received from a fixed-price purchase option are expected to be minimal. Based on these factors, BNSF Railway is not the primary beneficiary of the VIEs. As BNSF Railway is not the primary beneficiary and the VIE leases are classified as operating leases, there are no assets or liabilities related to the VIEs recorded in the Company's Consolidated Balance Sheet.
12. Commitments and Contingencies
Lease Commitments
BNSF has substantial lease commitments for locomotives, freight cars, trailers and containers, office buildings, operating facilities and other property, and many of these leases provide the option to purchase the leased item at fair market value at the end of the lease. However, some provide fixed price purchase options. Future minimum lease payments as of December 31, 2010, are summarized as follows (in millions):
|
December 31,
|
Capital Leases
|
Operating Leases
|
a
|
||||
|
2011
|
$
|
311
|
$
|
595
|
|||
|
2012
|
229
|
571
|
|||||
|
2013
|
176
|
554
|
|||||
|
2014
|
145
|
534
|
|||||
|
2015
|
113
|
508
|
|||||
|
Thereafter
|
828
|
3,477
|
|||||
|
Total
|
1,802
|
$
|
6,239
|
||||
|
Less amount representing interest
|
(424
|
)
|
|||||
|
Present value of minimum lease payments
|
$
|
1,378
|
|||||
|
aExcludes leases having non-cancelable lease terms of less than one year and per diem leases.
|
|||||||
Lease rental expense for all operating leases, excluding per diem leases, was $531 million, $82 million, $644 million and $689 million for the periods February 13 – December 31, 2010 (Successor), January 1 – February 12, 2010 (Predecessor), and the years ended December 31, 2009 and 2008 (Predecessor), respectively. When rental payments are not made on a straight-line basis, the Company recognizes rental expense on a straight-line basis over the lease term. Contingent rentals and sublease rentals were not significant.
Other Commitments
In the normal course of business, the Company enters into long-term contractual requirements for future goods and services needed for the operations of the business. Such commitments are not in excess of expected requirements and are not reasonably likely to result in performance penalties or payments that would have a material adverse effect on the Company’s liquidity.
Personal Injury and Environmental Costs
Personal Injury
Personal injury claims, including asbestos claims and employee work-related injuries and third-party injuries (collectively, other personal injury), are a significant expense for the railroad industry. Personal injury claims by BNSF Railway employees are subject to the provisions of the Federal Employers’ Liability Act (FELA) rather than state workers’ compensation laws. FELA’s system of requiring the finding of fault, coupled with unscheduled awards and reliance on the jury system, contributed to increased expenses in past years. Other proceedings include claims by non-employees for punitive as well as compensatory damages. A few proceedings purport to be class actions. The variability present in settling these claims, including non-employee personal injury and matters in which punitive damages are alleged, could result in increased expenses in future years. BNSF has implemented a number of safety programs designed to reduce the number of personal injuries as well as the associated claims and personal injury expense.
Other than the fair value adjustments recorded in the application of acquisition method accounting, as discussed in Note 3 to the Consolidated Financial Statements, BNSF records an undiscounted liability for personal injury claims when the expected loss is both probable and reasonably estimable. The liability and ultimate expense projections are estimated using standard actuarial methodologies. Liabilities recorded for unasserted personal injury claims are based on information currently available. Due to the inherent uncertainty involved in projecting future events such as the number of claims filed each year, developments in judicial and legislative standards and the average costs to settle projected claims, actual costs may differ from amounts recorded. Expense accruals and any required adjustments are classified as materials and other in the Consolidated Statements of Income.
Asbestos
The Company is party to a number of personal injury claims by employees and non-employees who may have been exposed to asbestos. The heaviest exposure for BNSF employees was due to work conducted in and around the use of steam locomotive engines that were phased out between the years of 1950 and 1967. However, other types of exposures, including exposure from locomotive component parts and building materials, continued after 1967 until they were substantially eliminated at BNSF by 1985.
BNSF assesses its unasserted asbestos liability exposure on an annual basis during the third quarter. BNSF determines its asbestos liability by estimating its exposed population, the number of claims likely to be filed, the number of claims that will likely require payment and the estimated cost per claim. Estimated filing and dismissal rates and average cost per claim are determined utilizing recent claim data and trends.
Key elements of the assessment include:
|
•
|
Because BNSF did not have detailed employment records in order to compute the population of potentially exposed employees, it computed an estimate using Company employee data from 1970 forward and estimated the BNSF employee base from 1938-1969 using railroad industry historical census data and estimating BNSF’s representation in the total railroad population.
|
|
•
|
The projected incidence of disease was estimated based on epidemiological studies using employees’ age, duration and intensity of exposure while employed.
|
|
•
|
An estimate of the future anticipated claims filing rate by type of disease (non-malignant, cancer and mesothelioma) was computed using the Company’s average historical claim filing rates for the period 2004-2006.
|
|
•
|
An estimate of the future anticipated dismissal rate by type of claim was computed using the Company’s historical average dismissal rates observed in 2005-2007.
|
|
•
|
An estimate of the future anticipated settlement by type of disease was computed using the Company’s historical average of dollars paid per claim for pending and future claims using the average settlement by type of incidence observed during 2005-2007.
|
From these assumptions, BNSF projected the incidence of each type of disease to the estimated population to arrive at an estimate of the total number of employees that could potentially assert a claim. Historical claim filing rates were applied for each type of disease to the total number of employees that could potentially assert a claim to determine the total number of anticipated claim filings by disease type. Historical dismissal rates, which represent claims that are closed without payment, were then applied to calculate the number of future claims by disease type that would likely require payment by the Company. Finally, the number of such claims was multiplied by the average settlement value to estimate BNSF’s future liability for unasserted asbestos claims.
The most sensitive assumptions for this accrual are the estimated future filing rates and estimated average claim values. Asbestos claim filings are typically sporadic and may include large batches of claims solicited by law firms. To reflect these factors, BNSF used a multi-year calibration period (i.e., the average historical filing rate for the period 2004-2006) because it believed it would be most representative of its future claim experience. In addition, for non-malignant claims, the number of future claims to be filed against BNSF declines at a rate consistent with both mortality and age as there is a decreasing propensity to file a claim as the population ages. BNSF believes the average claim values by type of disease from the historical period 2005-2007 are most representative of future claim values. Non-malignant claims, which represent approximately 90 percent of the total number and 75 percent of the cost of estimated future asbestos claims, were priced by age of the projected claimants. Historically, the ultimate settlement value of these types of claims is most sensitive to the age of the claimant.
During the third quarters of 2010, 2009 and 2008, the Company analyzed recent filing and payment trends to ensure the assumptions used by BNSF to estimate its future asbestos liability were reasonable. In 2010, 2009 and 2008, management determined that the liability remained appropriate and no change was recorded. The Company plans to update its study again in the third quarter of 2011.
Throughout the year, BNSF monitors actual experience against the number of forecasted claims and expected claim payments and will record adjustments to the Company’s estimates as necessary.
Based on BNSF’s estimate of the potentially exposed employees and related mortality assumptions, it is anticipated that unasserted asbestos claims will continue to be filed through the year 2050. The Company recorded an amount for the full estimated filing period through 2050 because it had a relatively finite exposed population (former and current employees hired prior to 1985), which it was able to identify and reasonably estimate and about which it had obtained reliable demographic data (including age, hire date and occupation) derived from industry or BNSF specific data that was the basis for the study. BNSF projects that approximately 55, 75 and 90 percent of the future unasserted asbestos claims will be filed within the next 10, 15 and 25 years, respectively.
Other Personal Injury
BNSF estimates its other personal injury liability claims and expense quarterly based on the covered population, activity levels and trends in frequency and the costs of covered injuries. Estimates include unasserted claims except for certain repetitive stress and other occupational trauma claims that allegedly result from prolonged repeated events or exposure. Such claims are estimated on an as-reported basis because the Company cannot estimate the range of reasonably possible loss due to other non-work related contributing causes of such injuries and the fact that continued exposure is required for the potential injury to manifest itself as a claim. BNSF has not experienced any significant adverse trends related to these types of claims in recent years.
Key elements of the actuarial assessment include:
|
•
|
Size and demographics (employee age and craft) of the workforce.
|
|
•
|
Activity levels (manhours by employee craft and carloadings).
|
|
•
|
Expected claim frequency rates by type of claim (employee FELA or third-party liability) based on historical claim frequency trends.
|
|
•
|
Expected dismissal rates by type of claim based on historical dismissal rates.
|
|
•
|
Expected average paid amounts by type of claim for open and incurred but not reported claims that eventually close with payment.
|
From these assumptions, BNSF estimates the number of open claims by accident year that will likely require payment by the Company. The projected number of open claims by accident year that will require payment is multiplied by the expected average cost per claim by accident year and type to determine BNSF’s estimated liability for all asserted claims. Additionally, BNSF estimates the number of its incurred but not reported claims that will likely result in payment based upon historical emergence patterns by type of claim. The estimated number of projected claims by accident year requiring payment is multiplied by the expected average cost per claim by accident year and type to determine BNSF’s estimated liability for incurred but not reported claims.
BNSF monitors quarterly actual experience against the number of forecasted claims to be received, the forecasted number of claims closing with payment and expected claim payments. Adjustments to the Company’s estimates are recorded quarterly as necessary or more frequently as new events or revised estimates develop.
The following table summarizes the activity in the Company’s accrued obligations for asbestos and other personal injury matters (in millions):
|
Successor
|
Predecessor
|
|||||||||||||
|
February 13 –
December 31,
2010
|
January 1 –
February 12,
2010
|
Year ended
December 31,
2009
|
Year ended
December 31,
2008
|
|||||||||||
|
Beginning balance
|
$
|
664
|
$
|
632
|
$
|
693
|
$
|
709
|
||||||
|
Accruals
|
21
|
10
|
73
|
159
|
||||||||||
|
Payments
|
(110
|
)
|
(9
|
)
|
(134
|
)
|
(175
|
)
|
||||||
|
Ending balance
|
$
|
575
|
$
|
633
|
$
|
632
|
$
|
693
|
||||||
At December 31, 2010 and 2009, $135 million and $160 million were included in current liabilities, respectively. In addition, defense and processing costs, which are recorded on an as-reported basis, were not included in the recorded liability. The Company is primarily self-insured for personal injury claims.
Because of the uncertainty surrounding the ultimate outcome of personal injury claims, it is reasonably possible that future costs to settle personal injury claims may range from approximately $510 million to $675 million. However, BNSF believes that the $575 million recorded at December 31, 2010, is the best estimate of the Company’s future obligation for the settlement of personal injury claims.
The amounts recorded by BNSF for personal injury liabilities were based upon currently known facts. Future events, such as the number of new claims to be filed each year, the average cost of disposing of claims, as well as the numerous uncertainties surrounding personal injury litigation in the United States, could cause the actual costs to be higher or lower than projected.
While the final outcome of personal injury matters cannot be predicted with certainty, considering among other things the meritorious legal defenses available and liabilities that have been recorded, it is the opinion of BNSF that none of these items, when finally resolved, will have a material adverse effect on the Company’s financial position or liquidity. However, the occurrence of a number of these items in the same period could have a material adverse effect on the results of operations in a particular quarter or fiscal year.
BNSF Insurance Company
The Company has a consolidated, wholly-owned subsidiary, Burlington Northern Santa Fe Insurance Company, Ltd. (BNSF IC) that provides insurance coverage for certain risks, FELA claims, railroad protective and force account insurance claims and certain excess general liability coverage, and certain other claims which are subject to reinsurance. BNSF IC has entered into annual reinsurance treaty agreements with several other companies. The treaty agreements insure workers compensation, general liability, auto liability and FELA risk. In accordance with the agreements, BNSF IC cedes a portion of its FELA exposure through the treaty and assumes a proportionate share of the entire risk. Each year BNSF IC reviews the objectives and performance of the treaty to determine its continued participation in the treaty. The treaty agreements provide for certain protections against the risk of treaty participants’ non-performance. On an on-going basis, BNSF and/or the treaty manager reviews the credit-worthiness of each of the participants. BNSF does not believe its exposure to treaty participants’ non-performance is material at this time. BNSF IC typically invests in commercial paper, time deposits and money market accounts. At December 31, 2010, there was approximately $490 million related to these third-party investments, which were classified as cash and cash equivalents on the Company’s Consolidated Balance Sheet, as compared with approximately $485 million at December 31, 2009.
Environmental
The Company’s operations, as well as those of its competitors, are subject to extensive federal, state and local environmental regulation. BNSF’s operating procedures include practices to protect the environment from the risks inherent in railroad operations, which frequently involve transporting chemicals and other hazardous materials. Additionally, many of BNSF’s land holdings are and have been used for industrial or transportation-related purposes or leased to commercial or industrial companies whose activities may have resulted in discharges onto the property. As a result, BNSF is subject to environmental cleanup and enforcement actions. In particular, the federal Comprehensive Environmental Response, Compensation and Liability Act of 1980 (CERCLA), also known as the Superfund law, as well as similar state laws, generally impose joint and several liability for cleanup and enforcement costs on current and former owners and operators of a site without regard to fault or the legality of the original conduct. BNSF has been notified that it is a potentially responsible party (PRP) for study and cleanup costs at Superfund sites for which investigation and remediation payments are or will be made or are yet to be determined (the Superfund sites) and, in many instances, is one of several PRPs. In addition, BNSF may be considered a PRP under certain other laws. Accordingly, under CERCLA and other federal and state statutes, BNSF may be held jointly and severally liable for all environmental costs associated with a particular site. If there are other PRPs, BNSF generally participates in the cleanup of these sites through cost-sharing agreements with terms that vary from site to site. Costs are typically allocated based on such factors as relative volumetric contribution of material, the amount of time the site was owned or operated and/or the portion of the total site owned or operated by each PRP.
BNSF is involved in a number of administrative and judicial proceedings and other mandatory cleanup efforts for 286 sites, including 19 Superfund sites, at which it is participating in the study or cleanup, or both, of alleged environmental contamination.
Liabilities for environmental cleanup costs are recorded when BNSF’s liability for environmental cleanup is probable and reasonably estimable. Subsequent adjustments to initial estimates are recorded as necessary based upon additional information developed in subsequent periods. Environmental costs include initial site surveys and environmental studies as well as costs for remediation of sites determined to be contaminated.
BNSF estimates the ultimate cost of cleanup efforts at its known environmental sites on an annual basis during the third quarter. Ultimate cost estimates for environmental sites are based on historical payment patterns, current estimated percentage to closure ratios and benchmark patterns developed from data accumulated from industry and public sources, including the Environmental Protection Agency and other governmental agencies. These factors incorporate into the estimates experience gained from cleanup efforts at other similar sites. The most significant assumptions are as follows: (i) historical payment patterns of site development and (ii) variance from benchmark costs.
Annual studies do not include (i) contaminated sites of which the Company is not aware; (ii) additional amounts for third-party tort claims, which arise out of contaminants allegedly migrating from BNSF property, due to a limited number of sites; or (iii) natural resource damage claims. BNSF continues to estimate third-party tort claims on a site by site basis when the liability for such claims is probable and reasonably estimable. BNSF’s recorded liability for third-party tort claims as of December 31, 2010, is $12 million.
On a quarterly basis, BNSF monitors actual experience against the forecasted remediation and related payments made on existing sites and conducts ongoing environmental contingency analyses, which consider a combination of factors including independent consulting reports, site visits, legal reviews and analysis of the likelihood of participation in, and the ability to pay for, cleanup of other PRPs. Adjustments to the Company’s estimates will continue to be recorded as necessary based on developments in subsequent periods. Additionally, environmental accruals, which are classified as materials and other in the Consolidated Statements of Income, include amounts for newly identified sites or contaminants, third-party claims and legal fees incurred for defense of third-party claims and recovery efforts.
The following table summarizes the activity in the Company’s accrued obligations for environmental matters (in millions):
|
Successor
|
Predecessor
|
|||||||||||||
|
February 13 –
December 31,
2010
|
January 1 –
February 12,
2010
|
Year ended
December 31,
2009
|
Year ended
December 31,
2008
|
|||||||||||
|
Beginning balance
|
$
|
514
|
$
|
517
|
$
|
546
|
$
|
380
|
||||||
|
Accruals
|
144
|
6
|
64
|
251
|
||||||||||
|
Payments
|
(80
|
)
|
(9
|
)
|
(93
|
)
|
(85
|
)
|
||||||
|
Ending balance
|
$
|
578
|
$
|
514
|
$
|
517
|
$
|
546
|
||||||
At December 31, 2010 and 2009, $80 million and $90 million were included in current liabilities, respectively.
During the third quarters of 2010, 2009 and 2008, the Company analyzed recent data and trends to ensure the assumptions used by BNSF to estimate its future environmental liability were reasonable. As a result of this study, in the third quarters of 2010, 2009 and 2008, management recorded additional expense of approximately $73 million, $25 million and $13 million as of the June 30 measurement date, respectively. The Company plans to update its study again in the third quarter of 2011.
In the fourth quarter of 2010, as part of BNSF’s ongoing quarterly environmental contingency analyses, BNSF recorded additional expense of approximately $100 million related to changes in estimates at approximately 20 of its more complex sites. The total cost of remediation at these sites has a higher degree of uncertainty than the majority of its sites, driven by higher regulatory volatility and more complex, longer term, and costly type remedies than BNSF typically experiences. These factors highlighted a need for BNSF to incorporate other potential outcomes into its current estimates.
In 2008, the Company completed an analysis of its Montana sites to determine its legal exposure related to the potential effect of a Montana Supreme Court decision. The decision, which did not involve BNSF, held that restoration damages (damages equating to clean-up costs which are intended to return property to its original condition) may be awarded under certain circumstances even where such damages may exceed the property’s actual value. The legal situation in Montana, the increase in the number of claims against BNSF and others resulting from this decision, and the completion of the analysis caused BNSF to record additional pre-tax environmental expenses of $175 million, for environmental liabilities primarily related to the effect of the aforementioned Montana Supreme Court decision on certain of BNSF’s Montana sites. In the third quarter of 2010, additional test results and negotiations with various parties at certain sites resulted in a reduction in expense of approximately $40 million.
BNSF’s environmental liabilities are not discounted. BNSF anticipates that the majority of the accrued costs at December 31, 2010, will be paid over the next ten years, and no individual site is considered to be material.
Liabilities recorded for environmental costs represent BNSF’s best estimate of its probable future obligation for the remediation and settlement of these sites and include both asserted and unasserted claims. Although recorded liabilities include BNSF’s best estimate of all probable costs, without reduction for anticipated recoveries from third parties, BNSF’s total cleanup costs at these sites cannot be predicted with certainty due to various factors such as the extent of corrective actions that may be required, evolving environmental laws and regulations, advances in environmental technology, the extent of other parties’ participation in cleanup efforts, developments in ongoing environmental analyses related to sites determined to be contaminated and developments in environmental surveys and studies of contaminated sites.
Because of the uncertainty surrounding these factors, it is reasonably possible that future costs for environmental liabilities may range from approximately $430 million to $865 million. However, BNSF believes that the $578 million recorded at December 31, 2010, is the best estimate of the Company’s future obligation for environmental costs.
Although the final outcome of these environmental matters cannot be predicted with certainty, it is the opinion of BNSF that none of these items, when finally resolved, will have a material adverse effect on the Company’s financial position or liquidity. However, the occurrence of a number of these items in the same period could have a material adverse effect on the results of operations in a particular quarter or fiscal year.
Other Claims and Litigation
In addition to asbestos, other personal injury and environmental matters discussed above, BNSF and its subsidiaries are also parties to a number of other legal actions and claims, governmental proceedings and private civil suits arising in the ordinary course of business, including those related to disputes and complaints involving certain transportation rates and charges. Some of the legal proceedings include claims for punitive as well as compensatory damages, and a few proceedings purport to be class actions. Although the final outcome of these matters cannot be predicted with certainty, considering among other things the meritorious legal defenses available and liabilities that have been recorded along with applicable insurance, BNSF currently believes that none of these items, when finally resolved, will have a material adverse effect on the Company’s financial position or liquidity. However, an unexpected adverse resolution of one or more of these items could have a material adverse effect on the results of operations in a particular quarter or fiscal year.
Coal Rate Case Decision
On February 17, 2009, the United States Surface Transportation Board (STB) issued a new decision in a rate dispute between Western Fuels Association, Inc. and Basin Electric Power Cooperative, Inc. (collectively, WFA) and BNSF Railway Company (BNSF Railway). (Western Fuels Association, Inc. and Basin Electric Power Cooperative v. BNSF Railway Company, STB Docket No. 42088). The dispute relates to the reasonableness of rates BNSF Railway charges to WFA for the transportation of approximately 8 million tons of coal a year from Powder River Basin mines in Wyoming to the Laramie River Station Plant at Moba Junction, Wyoming. The STB previously ruled in this matter in 2007 that the challenged rates were not shown unreasonable. During the pendency of the case, the STB issued new guidelines for reviewing the reasonableness of rates in cases such as this and then permitted WFA to submit new evidence. In its new 2009 decision, the STB found that these same challenged rates were not commercially reasonable. The STB ordered BNSF Railway to reimburse WFA for amounts previously collected above the new levels prescribed for prior periods. The STB also prescribed maximum rates through 2024 at levels substantially below the rates previously set by BNSF Railway. In compliance with the STB’s decision, BNSF Railway published new rates to the Laramie River Station effective March 20, 2009. WFA challenged BNSF Railway’s methodology for implementing those rates before the STB and on July 27, 2009, the STB issued a decision that largely adopted the methodology advocated for by BNSF Railway. The final amount of approximately $120 million in reparations, which includes interest, was submitted by WFA to the STB with BNSF Railway’s concurrence. The STB approved the final amount of reparations. BNSF Railway paid the reparations during the fourth quarter of 2009.
The net impact in 2009 resulting from the STB’s decision was a loss of $74 million in excess of amounts previously accrued. Of the total loss, $66 million and $8 million were recorded as a reduction to freight revenues and an increase to interest expense, respectively.
13. Employment Benefit Plans
BNSF provides a funded, noncontributory qualified pension plan, the BNSF Retirement Plan, which covers most non-union employees, and an unfunded non-tax-qualified pension plan, the BNSF Supplemental Retirement Plan, which covers certain officers and other employees. The benefits under these pension plans are based on years of credited service and the highest consecutive sixty months of compensation for the last ten years of salaried employment with BNSF. The Company also provides two funded, noncontributory qualified pension plans which cover certain union employees of the former The Atchison, Topeka and Santa Fe Railway Company. The benefits under these pension plans are based on elections made at the time the plans were implemented. BNSF’s funding policy is to contribute annually not less than the regulatory minimum and not more than the maximum amount deductible for income tax purposes with respect to the funded plans.
Certain salaried employees of BNSF who have met age and years of service requirements are eligible for life insurance coverage and medical benefits, including prescription drug coverage, during retirement. This postretirement benefit plan, referred to as the retiree health and welfare plan, is contributory and provides benefits to retirees, their covered dependents and beneficiaries. Retiree contributions are adjusted annually. The plan also contains fixed deductibles, coinsurance and out-of-pocket limitations. The basic life insurance plan is noncontributory and covers retirees only. Optional life insurance coverage is available for some retirees; however, the retiree is responsible for the full cost. BNSF’s policy is to fund benefits payable under the medical and life insurance plans as they come due. Generally, employees beginning salaried employment with BNSF subsequent to September 22, 1995, are not eligible for medical benefits during retirement.
Components of the net cost for these plans were as follows (in millions):
|
Pension Benefits
|
||||||||||||||
|
Successor
|
Predecessor
|
|||||||||||||
|
February 13 –
December 31,
2010
|
January 1 –
February 12,
2010
|
Year ended
December 31,
2009
|
Year ended
December 31,
2008
|
|||||||||||
|
Service cost
|
$
|
28
|
$
|
3
|
$
|
28
|
$
|
25
|
||||||
|
Interest cost
|
95
|
12
|
102
|
102
|
||||||||||
|
Expected return on plan assets
|
(108
|
)
|
(14
|
)
|
(107
|
)
|
(112
|
)
|
||||||
|
Amortization of net loss
|
–
|
4
|
24
|
16
|
||||||||||
|
Net cost recognized
|
$
|
15
|
$
|
5
|
$
|
47
|
$
|
31
|
||||||
|
Retiree Health and
Welfare Benefits
|
||||||||||||||
|
Successor
|
Predecessor
|
|||||||||||||
|
February 13 –
December 31,
2010
|
January 1 –
February 12,
2010
|
Year ended
December 31,
2009
|
Year ended
December 31,
2008
|
|||||||||||
|
Service cost
|
$
|
1
|
$
|
–
|
$
|
3
|
$
|
2
|
||||||
|
Interest cost
|
13
|
2
|
15
|
18
|
||||||||||
|
Amortization of net loss
|
–
|
–
|
1
|
5
|
||||||||||
|
Amortization of prior service credit
|
–
|
–
|
(6
|
)
|
(8
|
)
|
||||||||
|
Net cost recognized
|
$
|
14
|
$
|
2
|
$
|
13
|
$
|
17
|
||||||
The projected benefit obligation is the present value of benefit earned to date by plan participants, including the effect of assumed future salary increases and expected healthcare cost trend rate increases. The following table shows the change in projected benefit obligation (in millions):
|
Pension Benefits
|
|||||||||||
|
Successor
|
Predecessor
|
||||||||||
|
Change in Benefit Obligation
|
February 13 –
December 31,
2010
|
January 1 –
February 12,
2010
|
Year ended
December 31,
2009
|
||||||||
|
Projected benefit obligation at beginning of perioda
|
$
|
1,986
|
$
|
1,864
|
$
|
1,840
|
|||||
|
Service cost
|
28
|
3
|
28
|
||||||||
|
Interest cost
|
95
|
12
|
102
|
||||||||
|
Actuarial loss
|
100
|
–
|
35
|
||||||||
|
Benefits paid
|
(126
|
)
|
(11
|
)
|
(141
|
)
|
|||||
|
Settlements
|
(15
|
)
|
–
|
−
|
|||||||
|
Projected benefit obligation at end of period
|
2,068
|
1,868
|
1,864
|
||||||||
|
Component representing future salary increases
|
(63
|
)
|
(51
|
)
|
(53
|
)
|
|||||
|
Accumulated benefit obligation at end of period
|
$
|
2,005
|
$
|
1,817
|
$
|
1,811
|
|||||
a Successor beginning balance includes fair value adjustment under acquisition method accounting.
|
Retiree Health and Welfare Benefits
|
|||||||||||
|
Successor
|
Predecessor
|
||||||||||
|
Change in Benefit Obligation
|
February 13 –
December 31,
2010
|
January 1 –
February 12,
2010
|
Year ended
December 31,
2009
|
||||||||
|
Projected benefit obligation at beginning of period
|
$
|
265
|
$
|
266
|
$
|
269
|
|||||
|
Service cost
|
1
|
–
|
3
|
||||||||
|
Interest cost
|
13
|
2
|
15
|
||||||||
|
Plan participants’ contributions
|
6
|
1
|
9
|
||||||||
|
Actuarial loss
|
18
|
–
|
|
–
|
|||||||
|
Medicare subsidy
|
1
|
–
|
2
|
||||||||
|
Benefits paid
|
(25
|
)
|
(4
|
)
|
(32
|
)
|
|||||
|
Projected benefit obligation at end of period
|
$
|
279
|
$
|
265
|
$
|
266
|
|||||
BNSF’s pension plans had accumulated and projected benefit obligations in excess of plan assets at December 31, 2010 and 2009.
The following table shows the change in plan assets of the plans (in millions):
|
Pension Benefits
|
|||||||||||
|
Successor
|
Predecessor
|
||||||||||
|
Change in Plan Assets
|
February 13 –
December 31,
2010
|
January 1 –
February 12,
2010
|
Year ended
December 31,
2009
|
||||||||
|
Fair value of plan assets at beginning of perioda
|
$
|
1,342
|
$
|
1,319
|
$
|
1,034
|
|||||
|
Actual return on plan assets
|
206
|
13
|
|
160
|
|||||||
|
Employer contributionsb
|
421
|
1
|
266
|
||||||||
|
Benefits paid
|
(126
|
)
|
(11
|
)
|
(141
|
)
|
|||||
|
Settlements
|
(15
|
)
|
–
|
–
|
|||||||
|
Fair value of plan assets at measurement date
|
$
|
1,828
|
$
|
1,322
|
$
|
1,319
|
|||||
a Successor beginning balance includes fair value adjustment under acquisition method accounting.
b Other than contributions to the qualified pension plan, employer contributions were classified as Other, Net under Operating Activities in the Company’s Consolidated Statements of Cash Flows.
|
Retiree Health and
Welfare Benefits
|
|||||||||||
|
Successor
|
Predecessor
|
||||||||||
|
Change in Plan Assets
|
February 13 –
December 31,
2010
|
January 1 –
February 12,
2010
|
Year ended
December 31,
2009
|
||||||||
|
Fair value of plan assets at beginning of period
|
$
|
–
|
$
|
–
|
$
|
–
|
|||||
|
Employer contributionsa
|
19
|
3
|
21
|
||||||||
|
Plan participants’ contributions
|
6
|
1
|
9
|
||||||||
|
Medicare subsidy
|
–
|
–
|
2
|
||||||||
|
Benefits paid
|
(25
|
)
|
(4
|
)
|
(32
|
)
|
|||||
|
Fair value of plan assets at measurement date
|
$
|
–
|
$
|
–
|
$
|
–
|
|||||
a Employer contributions were classified as Other, Net under Operating Activities in the Company’s Consolidated Statements of Cash Flows.
The following table shows the funded status, defined as plan assets less the projected benefit obligation (in millions):
|
Pension Benefits
|
Retiree Health and
Welfare Benefits
|
|||||||||||||
|
Successor
|
Predecessor
|
Successor
|
Predecessor
|
|||||||||||
|
December 31,
2010
|
December 31,
2009
|
December 31,
2010
|
December 31,
2009
|
|||||||||||
|
Funded status (plan assets less projected benefit obligations)
|
$
|
(240
|
)
|
$
|
(545
|
)
|
$
|
(279
|
)
|
$
|
(266
|
)
|
||
Of the combined pension and retiree health and welfare benefits liability of $519 million and $811 million recognized as of December 31, 2010 and 2009, respectively, $29 million and $28 million was included in other current liabilities, respectively.
Actuarial gains and losses and prior service credits are recognized in the Consolidated Balance Sheets through an adjustment to AOCI. Beginning in 2007, the Company recognized actuarial gains and losses and prior service credits in AOCI as they arose. The following table shows the pre-tax change in AOCI attributable to the components of the net cost and the change in benefit obligation (in millions):
|
Pension Benefits
|
||||||||||||||
|
Successor
|
Predecessor
|
|||||||||||||
|
Change in AOCI
|
February 13 –
December 31,
2010
|
January 1 –
February 12,
2010
|
Year ended
December 31,
2009
|
Year ended
December 31,
2008
|
||||||||||
|
Beginning balancea
|
$
|
–
|
$
|
792
|
$
|
834
|
$
|
233
|
||||||
|
Measurement date adjustment pursuant to adoption of authoritative accounting guidance issued September 2006
|
–
|
–
|
–
|
(4
|
)
|
|||||||||
|
Amortization of actuarial loss
|
–
|
(3
|
)
|
(24
|
)
|
(16
|
)
|
|||||||
|
Actuarial loss (gain)
|
2
|
–
|
(18
|
)
|
621
|
|||||||||
|
Ending balance
|
$
|
2
|
$
|
789
|
$
|
792
|
$
|
834
|
||||||
a Upon application of acquisition method accounting due to the Merger, the Company eliminated the beginning balance in AOCI.
|
Retiree Health and
Welfare Benefits
|
||||||||||||||
|
Successor
|
Predecessor
|
|||||||||||||
|
Change in AOCI
|
February 13 –
December 31,
2010
|
January 1 –
February 12,
2010
|
Year ended
December 31,
2009
|
Year ended
December 31,
2008
|
||||||||||
|
Beginning balancea
|
$
|
–
|
$
|
19
|
$
|
14
|
$
|
46
|
||||||
|
Measurement date adjustment pursuant to adoption of authoritative accounting guidance issued September 2006
|
–
|
–
|
–
|
1
|
||||||||||
|
Amortization of actuarial loss
|
–
|
–
|
(1
|
)
|
(5
|
)
|
||||||||
|
Amortization of prior service credit
|
–
|
–
|
6
|
8
|
||||||||||
|
Actuarial loss (gain)
|
19 |
–
|
–
|
(36 | ) | |||||||||
|
Ending balance
|
$
|
19
|
$
|
19
|
$
|
19
|
$
|
14
|
||||||
a Upon application of acquisition method accounting due to the Merger, the Company eliminated the beginning balance in AOCI.
None of the actuarial losses from defined benefit pension plans or retiree health and welfare benefit plans in AOCI are required to be amortized into net periodic benefit cost over the next fiscal year. Pre-tax amounts currently recognized in AOCI consist of the following (in millions):
|
Pension Benefits
|
Retiree Health and
Welfare Benefits
|
||||||||||||||
|
Successor
|
Predecessor
|
Successor
|
Predecessor
|
||||||||||||
|
2010
|
2009
|
2010
|
2009
|
||||||||||||
|
Net actuarial loss
|
$
|
2
|
$
|
792
|
$
|
19
|
$
|
25
|
|||||||
|
Prior service credit
|
−
|
−
|
−
|
(6
|
)
|
||||||||||
|
Pre-tax amount recognized in AOCI at December 31,
|
2
|
792
|
19
|
19
|
|||||||||||
|
After-tax amount recognized in AOCI at December 31,
|
$
|
1
|
$
|
489
|
$
|
12
|
$
|
11
|
|||||||
The assumptions used in accounting for the BNSF plans were as follows:
|
Pension Benefits
|
||||||||||||||
|
Successor
|
Predecessor
|
|||||||||||||
|
Assumptions Used to Determine Net Cost
|
February 13 –
December 31,
2010
|
January 1 –
February 12,
2010
|
Year ended
December 31,
2009
|
Year ended
December 31,
2008
|
||||||||||
|
Discount rate
|
5.75
|
%
|
5.75
|
%
|
5.75
|
%
|
6.00
|
%
|
||||||
|
Expected long-term rate of return on plan assets
|
8.00
|
%
|
8.00
|
%
|
8.00
|
%
|
8.00
|
%
|
||||||
|
Rate of compensation increase
|
3.80
|
%
|
3.80
|
%
|
3.80
|
%
|
3.80
|
%
|
||||||
|
Retiree Health and Welfare Benefits
|
||||||||||||||
|
Successor
|
Predecessor
|
|||||||||||||
|
Assumptions Used to Determine Net Cost
|
February 13 –
December 31,
2010
|
January 1 –
February 12,
2010
|
Year ended
December 31,
2009
|
Year ended
December 31,
2008
|
||||||||||
|
Discount rate
|
5.75
|
%
|
5.75
|
%
|
5.75
|
%
|
6.00
|
%
|
||||||
|
Rate of compensation increase
|
3.80
|
%
|
3.80
|
%
|
3.80
|
%
|
3.80
|
%
|
||||||
|
Pension Benefits
|
Retiree Health and
Welfare Benefits
|
||||||||||||||
|
Successor
|
Predecessor
|
Successor
|
Predecessor
|
||||||||||||
|
Assumptions Used to Determine Benefit Obligations
|
December 31,
2010
|
December 31,
2009
|
December 31,
2010
|
December 31,
2009
|
|||||||||||
|
Discount rate
|
5.25
|
%
|
5.75
|
%
|
5.25
|
%
|
5.75
|
%
|
|||||||
|
Rate of compensation increase
|
3.80
|
%
|
3.80
|
%
|
3.80
|
%
|
3.80
|
%
|
|||||||
BNSF determined the discount rate based on year-end market yields of high-quality corporate bonds whose maturities match expected payments. The discount rate used for the 2011 calculation of net benefit cost decreased to 5.25 percent which reflects market conditions at the December 31, 2010, measurement date.
The expected long-term rate of return is the return the Company anticipates earning, net of plan expenses, over the period that benefits are paid. It reflects the rate of return on present investments and on expected contributions. In determining the expected long-term rate of return, BNSF considered the following: (i) forward looking capital market forecasts; (ii) historical returns for individual asset classes; and (iii) the impact of active portfolio management. The expected rate of return on plan assets was 8.00 percent and 7.50 percent for 2010 and 2011, respectively, and the Company does not expect any near-term significant changes to the current investment allocation of assets. However, unforeseen changes in the investment markets or other external factors could prompt changes in these estimates in future years.
The following table is an estimate of the impact on future net benefit cost that could result from hypothetical changes to the most sensitive assumptions, the discount rate and rate of return on plan assets:
|
Sensitivity Analysis
|
||||
|
Change in Net Benefit Cost
|
||||
|
Hypothetical Discount Rate Change
|
Pension
|
Retiree Health and Welfare
|
||
|
50 basis point decrease
|
$4 million increase
|
$300 thousand increase
|
||
|
50 basis point increase
|
$1 million increase
|
$400 thousand increase
|
||
|
Hypothetical Rate of Return
on Plan Assets Change
|
Pension
|
|||
|
50 basis point decrease
|
$8 million increase
|
|||
|
50 basis point increase
|
$8 million decrease
|
|||
The following table presents assumed health care cost trend rates:
|
Successor
|
Predecessor
|
|||||||||||||
|
February 13 –
December 31,
2010
|
January 1 –
February 12,
2010
|
Year ended
December 31,
2009
|
Year ended
December 31,
2008
|
|||||||||||
|
Assumed health care cost trend rate for next year
|
9.00
|
%
|
9.00
|
%
|
9.00
|
%
|
9.75
|
%
|
||||||
|
Rate to which health care cost trend rate is expected to decline and remain
|
4.80
|
%
|
5.00
|
%
|
5.00
|
%
|
5.00
|
%
|
||||||
|
Year that the rate reaches the ultimate trend rate
|
2022
|
2016
|
2016
|
2016
|
||||||||||
Assumed health care cost trend rates have a significant effect on the amounts reported for the health care plans. A one percentage point change in assumed health care cost trend rates would have the following effects (in millions):
|
One Percentage-
Point Increase
|
One Percentage-
Point Decrease
|
||||||
|
Effect on total service and interest cost
|
$
|
1
|
$
|
(1
|
)
|
||
|
Effect on postretirement benefit obligation
|
$
|
22
|
$
|
(19
|
)
|
||
BNSF’s asset allocation for its funded pension plans at December 31, 2010 and 2009, and the target allocation for 2010 by asset category are as follows:
|
Target Allocation
|
Percentage of Pension Plan Assets
|
|||||||||
|
Successor
|
Predecessor
|
|||||||||
|
2010
|
2010
|
2009
|
||||||||
|
Equity Securities
|
45 – 75
|
%
|
60
|
%
|
62
|
%
|
||||
|
Fixed Income Securities
|
25 – 45
|
%
|
34
|
30
|
||||||
|
Real Estate
|
0 – 10
|
%
|
6
|
8
|
||||||
|
Total
|
100
|
%
|
100
|
%
|
||||||
The general investment objective of BNSF’s funded pension plans is to grow the plan assets in relation to the plan liabilities while prudently managing the risk of a decrease in the plan’s assets relative to those liabilities. To meet this objective, the Company’s management has adopted the above asset allocation ranges. This allows flexibility to accommodate market changes in the asset classes within defined parameters.
Assets are primarily managed by external Investment Managers each with a specific asset class mandate as directed by management.
Concentration in a single security or credit issuer is generally limited to 5% of each Investment Manager’s portfolio (excluding U.S. government and agencies, authorized commingled funds, and other manager specific exceptions as authorized by management). Real estate investment trust investments may not exceed 10% of any equity manager’s portfolio.
The Fixed Income allocation may include Core, Core “Plus”, and/or Long Duration portfolios. “Plus” strategies (higher risk investments such as high yield, emerging markets, and non-dollar denominated securities) are limited to 30% of the Core Plus portfolio value.
Real Estate is generally accessed through direct investment in one or more commingled funds with reasonable diversification by property type and geographic location.
Derivative investments are permitted under certain circumstances.
Investments are stated at fair value. The various types of investments are valued as follows: (i) Equity securities are valued at the last trade price at primary exchange close time on the last business day of the year (Level 1 input). If the last trade price is not available, values are based on bid, ask/offer quotes from contracted pricing vendors, brokers, or investment managers (Level 3 input or Level 2 if corroborated). (ii) Corporate debt securities, government debt securities, and collateralized obligations and mortgage backed securities are valued based on institutional bid evaluations from contracted vendors. Where available, vendors use observable market-based data to evaluate prices (Level 2 input). This also applies to U.S. Treasury securities included in cash and cash equivalents. If observable market-based data is not available, unobservable inputs such as extrapolated data, proprietary models, and indicative quotes are used to arrive at estimated prices representing the price a dealer would pay for the security (Level 3 input). (iii) Shares of real estate commingled funds are valued at the quarterly net asset value of units held at year end. Net asset value is based on significant unobservable inputs such as discount rates, capitalization rates and cash flows (Level 3 input). (iv) Registered investment companies and common/collective trusts are valued at the daily net asset value of shares held at year end. Net asset value is considered a Level 1 input if net asset value is computed daily and redemptions at this value are available to all shareholders without restriction. Net asset value is considered a Level 2 input if the fund may restrict share redemptions under limited circumstances or if net asset value is not computed daily. Net asset value is considered a Level 3 input if shares could not be redeemed on the reporting date and net asset value can not be corroborated by trading activity.
The following table summarizes the investments of BNSF’s funded pension plans as of December 31, 2010, based on the inputs used to value them (in millions):
|
Asset Category
|
Total as of
December 31,
2010
|
Level 1
Inputs a
|
Level 2
Inputs a
|
Level 3
Inputs a
|
||||||||
|
Equity securities:
|
||||||||||||
|
U.S.
|
$
|
367
|
$
|
367
|
$
|
−
|
$
|
−
|
||||
|
International
|
322
|
322
|
−
|
−
|
||||||||
|
Corporate debt securities
|
356
|
−
|
356
|
−
|
||||||||
|
Registered investment companies
|
298
|
298
|
−
|
−
|
||||||||
|
Government debt securities:
|
||||||||||||
|
U.S.
|
150
|
−
|
149
|
1
|
||||||||
|
International
|
8
|
−
|
8
|
−
|
||||||||
|
Real estate
|
116
|
−
|
−
|
116
|
||||||||
|
Common/collective trust
|
108
|
−
|
108
|
−
|
||||||||
|
Collateralized obligations and mortgage backed securities (MBS)
|
64
|
−
|
61
|
3
|
||||||||
|
Cash and cash equivalents
|
28
|
−
|
28
|
−
|
||||||||
|
Totalb
|
$
|
1,817
|
$
|
987
|
$
|
710
|
$
|
120
|
||||
|
a See Note 2 to the Consolidated Financial Statements under the heading “Fair Value Measurements” for a definition of each of these levels of inputs.
b Excludes $11 million accrued for dividend and interest receivable.
|
||||||||||||
The table below sets forth a summary of changes in the fair value of Level 3 assets held by BNSF’s funded pension plans for the period January 1 – February 12, 2010 (Predecessor) (in millions):
|
Level 3 Inputs
|
Total
|
Real Estate
|
Collateralized
Obligations &
MBS
|
|||||||
|
Balance as of December 31, 2009
|
$
|
104 |
$
|
103
|
$
|
1
|
||||
|
Actual return on plan assets:
|
||||||||||
|
Relating to assets still held at reporting date
|
−
|
−
|
−
|
|||||||
|
Relating to assets sold during the period
|
−
|
−
|
−
|
|||||||
|
Purchases, sales and settlements
|
1
|
−
|
1
|
|||||||
|
Transfers out of Level 3
|
−
|
−
|
−
|
|||||||
|
Balance as of February 12, 2010
|
$
|
105
|
$
|
103
|
$
|
2
|
||||
The table below sets forth a summary of changes in the fair value of Level 3 assets held by BNSF’s funded pension plans for the period February 13 – December 31, 2010 (Successor) (in millions):
|
Level 3 Inputs
|
Total
|
U.S.
Government
Debt
Securities
|
Real Estate
|
Collateralized
Obligations &
MBS
|
|||||||||
|
Balance as of February 13, 2010
|
$
|
105
|
$
|
−
|
$
|
103
|
$
|
2
|
|||||
|
Actual return on plan assets:
|
|||||||||||||
|
Relating to assets still held at reporting date
|
17
|
−
|
17
|
−
|
|||||||||
|
Relating to assets sold during the period
|
(4) |
|
−
|
(4)
|
|
−
|
|||||||
|
Purchases, sales and settlements
|
3
|
1
|
−
|
2
|
|||||||||
|
Transfers out of Level 3
|
(1)
|
|
−
|
−
|
(1) 1
|
|
|||||||
|
Balance as of December 31, 2010
|
$
|
120
|
$
|
1
|
$
|
116
|
$
|
3
|
|||||
Comparative Prior Year Information
The following table summarizes the investments of BNSF’s funded pension plans as of December 31, 2009, based on the inputs used to value them (in millions):
|
Asset Category
|
Total as of
December 31,
2009
|
Level 1
Inputs a
|
Level 2
Inputs a
|
Level 3
Inputs a
|
||||||||
|
Equity securities:
|
||||||||||||
|
U.S.
|
$
|
443
|
$
|
443
|
$
|
−
|
$
|
−
|
||||
|
International
|
336
|
336
|
−
|
−
|
||||||||
|
Corporate debt securities
|
157
|
−
|
157
|
−
|
||||||||
|
Registered investment companies
|
34
|
23
|
11
|
−
|
||||||||
|
Government debt securities
|
||||||||||||
|
U.S.
|
113
|
−
|
113
|
−
|
||||||||
|
International
|
1
|
−
|
1
|
−
|
||||||||
|
Real estate
|
103
|
−
|
−
|
103
|
||||||||
|
Collateralized obligations and mortgage backed securities (MBS)
|
78
|
−
|
77
|
1
|
||||||||
|
Cash and cash equivalents
|
48
|
38
|
10
|
−
|
||||||||
|
Total b
|
$
|
1,313
|
$
|
840
|
$
|
369
|
$
|
104
|
||||
|
a See Note 2 to the Consolidated Financial Statements under the heading “Fair Value Measurements” for a definition of each of these levels of inputs.
b Excludes $6 million accrued for dividend and interest receivable.
|
||||||||||||
The table below sets forth a summary of changes in the fair value of Level 3 assets held by BNSF’s funded pension plans for the year ended December 31, 2009 (in millions):
|
Level 3 Inputs
|
Total
|
U.S. Equity Securities
|
Corporate
Debt
Securities
|
Registered Investment Companies
|
Real Estate
|
Collateralized Obligations &
MBS
|
Cash and
Cash
Equivalentsa
|
||||||||||||||
|
Balance as of December 31, 2008
|
$
|
162
|
$
|
1
|
$
|
6
|
$
|
2
|
$
|
151
|
$
|
4
|
$
|
(2)
|
|||||||
|
Actual return on plan assets:
|
|||||||||||||||||||||
|
Relating to assets still held at reporting date
|
(39)
|
|
−
|
2
|
−
|
(42)
|
|
(1)
|
|
2
|
|||||||||||
|
Relating to assets sold during the period
|
(5)
|
|
(1)
|
|
−
|
−
|
(2) )
|
|
−
|
(2)
|
|||||||||||
|
Purchases, sales and settlements
|
(8)
|
|
−
|
(3)
|
|
(2)
|
|
(4)
|
|
(1)
|
|
2
|
|||||||||
|
Transfers out of Level 3
|
(6)
|
|
−
|
(5)
|
|
−
|
−
|
(1)
|
|
−
|
|||||||||||
|
Balance as of December 31, 2009
|
$
|
104
|
$
|
−
|
$
|
−
|
$
|
−
|
$
|
103
|
$
|
1
|
$
|
−
|
|||||||
|
a Balance at December 31, 2008, represents a temporary deficit in a securities lending program. As of December 31, 2009, the Company no longer participated in the program.
|
|||||||||||||||||||||
The Company is not required to make contributions to the BNSF Retirement Plan in 2011. The Company is required to make contributions of $9 million to its other funded pension plans. The Company expects to make benefit payments in 2011 of $8 million from its unfunded non-qualified pension plan.
The following table shows expected benefit payments from its defined benefit pension plans and expected claim payments and Medicare Part D subsidy receipts for the retiree health and welfare plan for the next five fiscal years and the aggregate five years thereafter (in millions):
|
Fiscal year
|
Expected
Pension
Plan Benefit
Payments
|
a
|
Expected
Retiree Health
and Welfare
Payments
|
Expected
Medicare
Subsidy
|
|||||
|
2011
|
$
|
158
|
$
|
23
|
$
|
(2
|
)
|
||
|
2012
|
156
|
24
|
(3
|
)
|
|||||
|
2013
|
158
|
24
|
(3
|
)
|
|||||
|
2014
|
161
|
24
|
(3
|
)
|
|||||
|
2015
|
158
|
24
|
(3
|
)
|
|||||
|
2016–2020
|
761
|
118
|
(17
|
)
|
|||||
|
aPrimarily consists of the BNSF Retirement Plan payments, which are made from the plan trust and do not represent an immediate cash outflow to the Company.
|
|||||||||
Defined Contribution Plans
BNSF sponsors qualified 401(k) plans that cover substantially all employees and a non-qualified defined contribution plan that covers certain officers and other employees. BNSF matches 50 percent of the first six percent of non-union employees’ contributions and matches 25 percent on the first four percent of a limited number of union employees’ contributions, which are subject to certain percentage limits of the employees’ earnings, at each pay period. Non-union employees are eligible to receive an annual discretionary matching contribution of up to 30 percent of the first six percent of their contributions. Employer contributions are subject to a five-year length of service vesting schedule. BNSF’s 401(k) matching expense was $25 million, $3 million, $22 million and $29 million during the periods February 13 – December 31, 2010 (Successor), January 1 – February 12, 2010 (Predecessor), and the years ended December 31, 2009 and 2008 (Predecessor), respectively.
Other
Under collective bargaining agreements, BNSF participates in multi-employer benefit plans that provide certain postretirement health care and life insurance benefits for eligible union employees. Insurance premiums paid attributable to retirees, which are generally expensed as incurred, were $55 million, $8 million, $54 million and $54 million during the periods February 13 – December 31, 2010 (Successor), January 1 – February 12, 2010 (Predecessor), and the years ended December 31, 2009 and 2008 (Predecessor), respectively.
14. Related Party Transactions
The companies identified as affiliates of BNSF include Berkshire and its subsidiaries. For the period February 13 – December 31, 2010, the Company declared and paid dividends of $1,250 million to its parent company. For the period February 13 – December 31, 2010, the Company made cash payments of $579 million for income taxes to Berkshire.
15. Stock-Based Compensation
Predecessor
On April 15, 1999, BNSF shareholders approved the Burlington Northern Santa Fe 1999 Stock Incentive Plan and authorized 20 million shares of BNSF common stock to be issued in connection with stock options, restricted stock, restricted stock units and performance stock. On April 18, 2001, April 17, 2002, April 21, 2004 and April 19, 2006, BNSF shareholders approved the amendments to the Burlington Northern Santa Fe 1999 Stock Incentive Plan, which authorized additional awards of 9 million, 6 million, 7 million and 11 million shares, respectively, of BNSF common stock to be issued in connection with stock options, restricted stock, restricted stock units and performance stock. Additionally, on April 18, 1996, BNSF shareholders approved the non-employee directors’ stock plan and authorized 900 thousand shares of BNSF common stock to be issued in connection with this plan.
No further grants of BNSF stock will be made under the BNSF stock-based compensation plans.
Under BNSF’s Predecessor stock plans, options were granted to directors, officers and salaried employees at the fair market value of BNSF’s common stock on the date of grant. Stock option grants generally vest ratably over three years and expire within ten years after the date of grant. Shares issued upon exercise of options were issued from treasury shares or from authorized but unissued shares.
Successor
Following the Merger, each outstanding stock option or share award of BNSF common stock was converted into an option or restricted stock unit of Berkshire Class B Common Stock, in accordance with a formula to convert such awards.
Additionally, following the Merger, the Berkshire Hathaway Inc. 2010 Umbrella Plan for BNSF Equity Plans became effective, authorizing approximately 16 million shares of Berkshire Class B Common Stock to be issued in connection with the conversion of BNSF stock options, restricted stock units and performance stock. Included in this amount is approximately 300 thousand shares for certain outstanding option awards that provide for a reload feature if the eligible employee pays all or a portion of the purchase price with Berkshire stock. In that event, the employee is issued new options to purchase additional shares of Berkshire Class B Common Stock equal to the number of shares of stock surrendered in such payment. Approximately 220 thousand shares of Berkshire Class B Common Stock were available for future reload grants at December 31, 2010.
Stock Options
The fair value of each option award is estimated on the date of grant using the Black-Scholes option-pricing model. The following assumptions apply to the options granted for the periods presented:
|
Successor
|
Predecessor
|
||||||||||||
|
February 13 –
December 31,
2010
|
January 1 –
February 12,
2010
|
Year ended
December 31,
2009
|
Year ended
December 31,
2008
|
||||||||||
|
Weighted average expected life (years)
|
2.4
|
N/A
|
4.8
|
4.7
|
|||||||||
|
Weighted average expected volatility
|
26.0
|
%
|
N/A
|
%
|
29.6
|
%
|
24.0
|
%
|
|||||
|
Weighted average expected dividend yield
|
0.00
|
%
|
N/A
|
%
|
1.96
|
%
|
1.50
|
%
|
|||||
|
Weighted average risk free interest rate
|
0.73
|
%
|
N/A
|
%
|
2.15
|
%
|
3.09
|
%
|
|||||
|
Weighted average fair value per share at date of grant
|
$
|
13.29
|
$
|
N/A
|
$
|
15.09
|
$
|
22.92
|
|||||
Expected volatilities are based on historical volatility of Berkshire (Successor) and BNSF (Predecessor), implied volatilities from traded options and other factors. The Company uses historical experience with exercise and post-vesting employment termination behavior to determine the options’ expected life. The expected life represents the period of time that options granted are expected to be outstanding. The risk-free rate is based on the U.S. Treasury rate with a maturity date corresponding to the options’ expected life.
A summary of the status of stock options is presented below (options in thousands, aggregate intrinsic value in millions):
|
Successor
|
Options
|
Weighted Average Exercise Prices
|
Weighted Average Remaining
Contractual Term
(in years)
|
Aggregate Intrinsic
Value
|
||||||||
|
Balance at February 13, 2010
|
12,685
|
$
|
52.14
|
|||||||||
|
Granted
|
78
|
80.67
|
||||||||||
|
Exercised
|
(1,706
|
)
|
39.62
|
|||||||||
|
Cancelled
|
(54
|
)
|
53.32
|
|||||||||
|
Balance at December 31, 2010
|
11,003
|
$
|
54.28
|
5.51
|
$
|
285
|
||||||
|
Options exercisable at December 31, 2010
|
8,486
|
$
|
53.79
|
4.77
|
$
|
224
|
||||||
|
Predecessor
|
Options
|
Weighted Average Exercise Prices
|
||||
|
Balance at January 1, 2010
|
10,020
|
$
|
68.24
|
|||
|
Granted
|
−
|
−
|
||||
|
Exercised
|
(544
|
)
|
38.43
|
|||
|
Cancelled
|
(21
|
)
|
68.67
|
|||
|
Balance at February12, 2010
|
9,455
|
$
|
69.96
|
|||
The total intrinsic value of options exercised was $71 million, $33 million, $87 million and $207 million during the periods February 13 – December 31, 2010 (Successor), January 1 – February 12, 2010 (Predecessor), and the years ended December 31, 2009 and 2008 (Predecessor), respectively.
Other Incentive Programs
BNSF had other long-term incentive programs that utilized restricted shares/units. A summary of the status of restricted shares/units and the weighted average grant date fair values as of, and for the year ended December 31, 2010, is presented below (shares in thousands):
|
Successor
|
Time Based
|
Performance
Based Units
|
Performance
Stock
|
Total
|
||||||||||||||||
|
Balance at
February 13, 2010
|
364
|
$
|
76.90
|
1,816
|
$
|
76.90
|
884
|
$
|
76.90
|
3,064
|
$
|
76.90
|
||||||||
|
Granted
|
−
|
−
|
−
|
−
|
−
|
−
|
−
|
−
|
||||||||||||
|
Vested
|
(189
|
)
|
76.90
|
(31
|
)
|
76.90
|
−
|
−
|
(220
|
)
|
76.90
|
|||||||||
|
Forfeited
|
−
|
−
|
(671
|
)
|
76.90
|
(332
|
)
|
76.90
|
(1,003
|
)
|
76.90
|
|||||||||
|
Balance at December 31, 2010
|
175
|
$
|
76.90
|
1,114
|
$
|
76.90
|
552
|
$
|
76.90
|
1,841
|
$
|
76.90
|
||||||||
|
Predecessor
|
Time Based
|
Performance
Based Units
|
Performance
Stock
|
Total
|
||||||||||||||||
|
Balance at
January 1, 2010
|
276
|
$
|
74.89
|
1,365
|
$
|
83.24
|
666
|
$
|
79.67
|
2,307
|
$
|
81.21
|
||||||||
|
Granted
|
−
|
−
|
−
|
−
|
−
|
−
|
−
|
−
|
||||||||||||
|
Vested
|
−
|
−
|
(4
|
)
|
69.08
|
−
|
−
|
(4
|
)
|
69.08
|
||||||||||
|
Forfeited
|
(5
|
)
|
83.21
|
(7
|
)
|
75.07
|
(6
|
)
|
75.39
|
(18
|
)
|
77.13
|
||||||||
|
Balance at February 12, 2010
|
271
|
$
|
74.72
|
1,354
|
$
|
83.32
|
660
|
$
|
79.71
|
2,285
|
$
|
81.25
|
||||||||
A summary of the weighted average grant date fair market values of the restricted share/units as of, and for the years ended December 31, 2009 and 2008 (Predecessor), is presented below:
|
Grant Date Fair Market Value of Awards Granted
|
Time Based
|
Performance
Based Units
|
Performance
Stock
|
||||||
|
Year ended December 31, 2009
|
$
|
66.67
|
$
|
64.97
|
$
|
59.75
|
|||
|
Year ended December 31, 2008
|
$
|
102.06
|
$
|
105.23
|
$
|
100.13
|
|||
A summary of the fair value of the restricted share/units vested during the periods February 13 – December 31, 2010 (Successor), January 1 – February 12, 2010 (Predecessor), and the years ended December 31, 2009 and 2008 (Predecessor), respectively, is presented below:
|
Total Fair Value of Shares Vested
(in millions)
|
Time Based |
Performance
Based Units
|
Performance
Stock
|
Total
|
||||||||
|
February 13 – December 31, 2010 (Successor)
|
$
|
15
|
$
|
2
|
$
|
−
|
$
|
17
|
||||
|
January 1 – February 12, 2010 (Predecessor)
|
$
|
−
|
$
|
−
|
$
|
−
|
$
|
−
|
||||
|
Year ended December 31, 2009
|
$
|
15
|
$
|
14
|
$
|
4
|
$
|
33
|
||||
|
Year ended December 31, 2008
|
$
|
31
|
$
|
30
|
$
|
15
|
$
|
76
|
||||
Time-based awards were granted to senior managers within BNSF primarily as a retention tool and to encourage ownership in BNSF. They generally vest over three years, although in some cases up to five years, and are contingent on continued salaried employment.
Performance-based units were granted to senior managers within BNSF to encourage ownership in BNSF and to align management’s interest with those of its shareholders. Performance-based units generally vest over three years and are contingent on the achievement of certain predetermined corporate performance goals (e.g., return on invested capital (ROIC)) and continued salaried employment.
Additionally, eligible employees could earn performance stock contingent upon achievement of higher ROIC goals and continued salaried employment.
Shares awarded under each of the plans may not be sold or used as collateral and are generally not transferable by the holder until the shares awarded become free of restrictions. Compensation cost, net of tax, recorded under the various stock incentive plans is shown in the following table (in millions):
|
Successor
|
Predecessor
|
|||||||||||||
|
February 13 –
December 31,
2010
|
January 1 –
February 12,
2010
|
Year ended
December 31,
2009
|
Year ended
December 31,
2008
|
|||||||||||
|
Compensation cost
|
$
|
114
|
$
|
8
|
$
|
41
|
$
|
69
|
||||||
|
Income tax benefit
|
(40
|
)
|
(3
|
)
|
(15
|
)
|
(25
|
)
|
||||||
|
Total
|
$
|
74
|
$
|
5
|
$
|
26
|
$
|
44
|
||||||
|
Compensation cost capitalized
|
$
|
4
|
$
|
−
|
$
|
6
|
$
|
6
|
||||||
Subsequent to the completion of the Merger, the Company immediately recognized $32 million of expense related to the excess fair value of the converted vested awards at the Merger date.
At December 31, 2010, there was $83 million of total unrecognized compensation cost related to unvested share-based compensation arrangements. That cost is expected to be recognized over a weighted-average period of 0.95 years.
16. Accumulated Other Comprehensive Income
The following table provides the components of accumulated other comprehensive income (in millions):
|
Successor
|
Predecessor
|
||||||
|
December 31, 2010
|
December 31, 2009
|
||||||
|
Unrecognized actuarial losses and prior service credit, net of tax (see Note 13)
|
$
|
(13
|
)
|
$
|
(500)
|
||
|
Fuel/interest hedge mark-to-market, net of tax (see Note 4)
|
41
|
10
|
|||||
|
Accumulated other comprehensive loss of equity method investees
|
(1
|
)
|
(6)
|
||||
|
Total accumulated other comprehensive income (loss)
|
$
|
27
|
$
|
(496)
|
|||
17. Quarterly Financial Data—Unaudited
Dollars in millions
|
Successor
|
Predecessor
|
||||||||||||||
|
2010
|
Fourth
|
Third
|
Second
|
February 13 –
March 31
|
January 1 –
February 12
|
||||||||||
|
Revenues
|
$
|
4,501
|
$
|
4,391
|
$
|
4,094
|
$
|
2,073
|
$
|
1,791
|
|||||
|
Operating income
|
$
|
1,167
|
$
|
1,261
|
$
|
1,086
|
$
|
539
|
$
|
451
|
|||||
|
Net income
|
$
|
644
|
$
|
706
|
$
|
603
|
$
|
282
|
$
|
224
|
|||||
|
Predecessor
|
||||||||||||
|
2009
|
Fourth
|
Third
|
Second
|
First
|
||||||||
|
Revenues
|
$
|
3,681
|
$
|
3,595
|
$
|
3,316
|
$
|
3,424
|
||||
|
Operating income
|
$
|
895
|
$
|
901
|
$
|
797
|
$
|
669
|
||||
|
Net income
|
$
|
536
|
$
|
488
|
$
|
404
|
$
|
293
|
||||
None.
Disclosure Controls and Procedures
Based on their evaluation as of the end of the period covered by this annual report on Form 10-K, the Company's principal executive officer and principal financial officer have concluded that BNSF’s disclosure controls and procedures (as defined in Rules 13a-15(e) and 15d-15(e) of the Securities Exchange Act of 1934) are effective to ensure that information required to be disclosed by BNSF in the reports that it files or submits under the Securities Exchange Act of 1934 is recorded, processed, summarized and reported within the time periods specified in Securities and Exchange Commission rules and forms and that such information is accumulated and communicated to BNSF’s management, including its principal executive and principal financial officers, as appropriate to allow timely decisions regarding required disclosure.
Management’s Report on Internal Control Over Financial Reporting
The management of BNSF is responsible for establishing and maintaining adequate internal control over financial reporting. BNSF’s internal control over financial reporting was designed to provide reasonable assurance regarding the reliability of financial reporting and the preparation of BNSF’s financial statements for external reporting purposes in accordance with generally accepted accounting principles in the United States of America.
Management assessed the effectiveness of the BNSF’s internal control over financial reporting as of December 31, 2010. In making this assessment, management used the criteria set forth by the Committee of Sponsoring Organizations of the Treadway Commission in Internal Control – Integrated Framework. Based on management’s assessment, management concluded that as of December 31, 2010, BNSF’s internal control over financial reporting was effective based on those criteria.
This annual report does not include an attestation report of the Company’s registered public accounting firm regarding internal control over financial reporting. Management’s report was not subject to attestation by the Company’s registered public accounting firm pursuant to rules of the Securities and Exchange Commission that permit the Company to provide only management’s report in this annual report.
Changes in Internal Control Over Financial Reporting
As of the period covered by this report, the Company has concluded that there have been no changes in BNSF’s internal control over financial reporting that occurred during BNSF’s fourth fiscal quarter that have materially affected, or are reasonably likely to materially affect, BNSF’s internal control over financial reporting.
None.
Part III
Independent Registered Public Accounting Firm Fees
The following table presents the fees incurred by BNSF, including its majority-owned subsidiaries, for services provided by Deloitte and Touche LLP, the independent registered public accounting firm, for the twelve months ended December 31, 2010, and PricewaterhouseCoopers LLP, the independent registered public accounting firm, for the twelve months ended December 31, 2009 (in thousands):
|
2010
|
2009
|
|||||
|
Audit fees
|
$
|
2,222
|
$
|
2,790
|
||
|
Tax fees
|
13
|
79
|
||||
|
All other fees
|
−
|
78
|
||||
|
Total
|
$
|
2,235
|
$
|
2,947
|
||
Tax Fees
Tax fees consist of professional services for tax compliance, tax audit and tax planning for specific transactions or potential transactions of the Company.
All Other Fees
All other fees consist of professional services for a benchmarking study and a limited design review of certain aspects of an ERP system implemented in 2009.
Pre-Approval Policies and Procedures
The Registrant is an indirect, wholly owned subsidiary of Berkshire Hathaway Inc. and does not have an audit committee. During 2010, the Audit Committee of Berkshire Hathaway Inc. following the February 12, 2010 Merger, and during 2009 and in 2010 up to the Merger, the Audit Committee of Burlington Northern Santa Fe Corporation or the Audit Committee’s Chairman, pre-approved all fees and services provided by the independent registered public accounting firm, subject to the exceptions for non-audit services described in the Securities Exchange Act of 1934 and rules and regulations thereunder.
Part IV
(a)The following documents are filed as part of this report:
|
1.
|
Consolidated Financial Statements—see Item 8.
|
|
|
Schedules are omitted because they are not required or applicable, or the required information is included in the Consolidated Financial Statements or related notes.
|
|
2.
|
Exhibits:
|
|
See Index to Exhibits beginning on page E-1 for a description of the exhibits filed as a part of this Report on Form 10-K.
|
Pursuant to the requirements of Section 13 or 15(d) of the Securities Exchange Act of 1934, Burlington Northern Santa Fe, LLC has duly caused this report to be signed on its behalf by the undersigned, thereunto duly authorized.
|
Burlington Northern Santa Fe, LLC
|
|||
|
|
By:
|
/s/ Matthew K. Rose
|
|
|
Dated: February 28, 2011
|
Matthew K. Rose
Chairman and
Chief Executive Officer
|
||
Pursuant to the requirements of the Securities Exchange Act of 1934, this report has been signed below by the following persons on behalf of Burlington Northern Santa Fe, LLC and in the capacities and on the date indicated.
|
Signature
|
Title
|
|
|
/s/ Matthew K. Rose
|
Chairman and Chief Executive Officer
|
|
|
Matthew K. Rose
|
(Principal Executive Officer), and Manager
|
|
|
/s/ Thomas N. Hund
|
Executive Vice President and Chief Financial Officer
|
|
|
Thomas N. Hund
|
(Principal Financial Officer), and Manager
|
|
|
/s/ Julie A. Piggott
|
Vice President-Planning & Studies and Controller
|
|
|
Julie A. Piggott
|
(Principal Accounting Officer)
|
|
| /s/ Warren E. Buffett* |
Manager
|
|
| Warren E. Buffett | ||
|
/s/ Gregory C. Fox
|
Manager
|
|
|
Gregory C. Fox
|
||
|
/s/ Marc D. Hamburg*
|
Manager
|
|
| Marc D. Hamburg | ||
|
/s/ Carl R. Ice
|
Manager
|
|
|
Carl R. Ice
|
||
|
/s/ John P. Lanigan, Jr.
|
Manager
|
|
|
John P. Lanigan, Jr.
|
||
|
/s/ Roger Nober
|
Manager
|
|
|
Roger Nober
|
||
|
*
|
By:
|
/s/ Roger Nober
|
|
|
Dated: February 28, 2011
|
Roger Nober
Executive Vice President Law
and Secretary
|
Burlington Northern Santa Fe, LLC and Subsidiaries
|
Incorporated by Reference
(if applicable)
|
||||||||||
|
Exhibit Number and Description
|
Form
|
File Date
|
File No.
|
Exhibit
|
||||||
|
(2)
|
Plan of acquisition, reorganization, arrangement, liquidation or succession
|
|||||||||
|
2.1
|
Agreement and Plan of Merger by and among Berkshire Hathaway Inc., R Acquisition Company, LLC, and Burlington Northern Santa Fe Corporation, dated November 2, 2009.
|
8-K
|
11/3/2009
|
1-11535
|
2.1
|
|||||
|
(3)
|
Articles of Incorporation and Bylaws
|
|||||||||
|
3.1
|
Certificate of Formation dated November 2, 2009.
|
8-K
|
2/16/2010
|
1-11535
|
3.1
|
|||||
|
3.2
|
Amended and Restated Limited Liability Operating Agreement of Burlington Northern Santa Fe, LLC, dated February 12, 2010.
|
8-K
|
2/16/2010
|
1-11535
|
3.4
|
|||||
|
3.3
|
Written Consent of the Sole Member, dated April 8, 2010, amending the Amended and Restated Limited Liability Operating Agreement.
|
8-K
|
4/8/2010
|
1-11535
|
3.1
|
|||||
|
(4)
|
Instruments defining the rights of security holders, including indentures
|
|||||||||
|
4.1
|
Indenture, dated as of December 1, 1995, between BNSF and The First National Bank of Chicago, as Trustee.
|
S-3
|
2/8/1999
|
333-72013
|
4
|
|||||
|
4.2
|
Form of BNSF’s 6 3/4% Debentures Due March 15, 2029.
|
10-K
|
3/31/1999
|
1-11535
|
4.3
|
|||||
|
4.3
|
Form of BNSF’s 6.70% Debentures Due
August 1, 2028.
|
10-K
|
3/31/1999
|
1-11535
|
4.4
|
|||||
|
4.4
|
Form of BNSF’s 8.125% Debentures Due April 15, 2020.
|
10-K
|
2/12/2001
|
1-11535
|
4.6
|
|||||
|
4.5
|
Form of BNSF’s 7.95% Debentures Due
August 15, 2030.
|
10-K
|
2/12/2001
|
1-11535
|
4.7
|
|||||
|
4.6
|
Form of BNSF’s 6.75% Notes Due July 15, 2011.
|
10-Q
|
8/3/2001
|
1-11535
|
4.1
|
|||||
|
4.7
|
Form of BNSF’s 5.90% Notes Due July 1, 2012.
|
10-Q
|
8/9/2002
|
1-11535
|
4.1
|
|||||
|
4.9
|
Officers’ Certificate of Determination as to the terms of BNSF’s 4.875% Notes Due January 15, 2015, including Exhibit A thereto, the form of the Notes.
|
8-K
|
12/9/2004
|
1-11535
|
4.1
|
|||||
|
4.10
|
Indenture, dated as of December 8, 2005, between BNSF and U.S. Bank Trust National Association, as Trustee.
|
S-3 ASR
|
12/8/2005
|
333-130214
|
4.1
|
|||||
|
4.11
|
Certificate of Trust of BNSF Funding Trust I, executed and filed by U.S. Bank Trust National Association, Linda Hurt and James Gallegos, as Trustees.
|
S-3 ASR
|
12/8/2005
|
333-130214
|
4.3
|
|||||
|
4.12
|
Amended and Restated Declaration of Trust
of BNSF Funding Trust I, dated as of
December 15, 2005.
|
8-K
|
12/15/2005
|
1-11535
|
4.4
|
|||||
|
4.13
|
Guarantee Agreement between BNSF and U.S. Bank Trust National Association, as Guarantee Trustee, dated as of December 15, 2005.
|
8-K
|
12/15/2005
|
1-11535
|
4.5
|
|||||
|
4.14
|
First Supplemental Indenture, dated as of
December 15, 2005, between BNSF and U.S. Bank Trust National Association, as Trustee.
|
8-K
|
12/15/2005
|
1-11535
|
4.6
|
|||||
|
Incorporated by Reference
(if applicable)
|
||||||||||
|
Exhibit Number and Description
|
Form
|
File Date
|
File No.
|
Exhibit
|
||||||
|
4.15
|
Agreement as to Expenses and Liabilities dated as of December 15, 2005, between BNSF and BNSF Funding Trust I.
|
8-K
|
12/15/2005
|
1-11535
|
4.4
(Exhibit C)
|
|||||
|
4.16
|
Form of BNSF Funding Trust I’s 6.613% Trust Preferred Securities.
|
8-K
|
12/15/2005
|
1-11535
|
4.4
(Exhibit D)
|
|||||
|
4.17
|
Officer’s Certificate of Determination as to the terms of BNSF’s 6.20% Debentures Due August 15, 2036, including the form of the Debentures.
|
10-Q
|
10/24/2006
|
1-11535
|
4.1
|
|||||
|
4.18
|
First Supplemental Indenture, dated as of April 13, 2007, to Indenture dated as of December 1, 1995, between Burlington Northern Santa Fe Corporation and Bank of New York Trust Company, N.A., as Trustee.
|
8-K
|
4/13/2007
|
1-11535
|
4.1
|
|||||
|
4.19
|
Officer’s Certificate of Determination as to the terms of BNSF’s 5.65% Debentures due May 1, 2017, and 6.15% Debentures Due May 1, 2037, including the forms of the Debentures.
|
8-K
|
4/13/2007
|
1-11535
|
4.2
|
|||||
|
4.20
|
Second Supplemental Indenture, dated as of March 14, 2008, to Indenture dated as of December 1, 1995, between Burlington Northern Santa Fe Corporation and Bank of New York Mellon Trust Company, N.A., as Trustee.
|
8-K
|
3/14/2008
|
1-11535
|
4.1
|
|||||
|
4.21
|
Officer’s Certificate of Determination as to the terms of BNSF’s 5.75% Notes due March 18, 2018, including the form of the Notes.
|
8-K
|
3/14/2008
|
1-11535
|
4.2
|
|||||
|
4.22
|
Third Supplemental Indenture, dated as of December 3, 2008, to Indenture dated as of December 1, 1995, between Burlington Northern Santa Fe Corporation and Bank of New York Mellon Trust Company, N.A., as Trustee.
|
8-K
|
12/3/2008
|
1-11535
|
4.1
|
|||||
|
4.23
|
Officer’s Certificate of Determination as to the terms of BNSF’s 7.00% Debentures due February 1, 2014.
|
8-K
|
12/3/2008
|
1-11535
|
4.2
|
|||||
|
4.24
|
Fourth Supplemental Indenture, dated as of September 24, 2009, to Indenture dated as of December 1, 1995, between Burlington Northern Santa Fe Corporation and The Bank of New York Mellon Trust Company, N.A., as Trustee including the form of BNSF’s 4.700% Notes due October 1, 2019.
|
8-K
|
9/24/2009
|
1-11535
|
4.1
|
|||||
|
4.25
|
Certificate of Determination as to the terms of BNSF’s 4.700% Notes due October 1, 2019.
|
8-K
|
9/24/2009
|
1-11535
|
4.2
|
|||||
|
4.26
|
Fifth Supplemental Indenture, dated as of February 11, 2010, by and among Burlington Northern Santa Fe Corporation, R Acquisition Company, LLC and The Bank of New York Mellon Trust Company, N.A.
|
8-K
|
2/16/2010
|
1-11535
|
4.1
|
|||||
|
4.27
|
Second Supplemental Indenture, dated as of February 11, 2010, by and among Burlington Northern Santa Fe Corporation, R Acquisition Company, LLC and U.S. Bank Trust National Association.
|
8-K
|
2/16/2010
|
1-11535
|
4.2
|
|||||
|
4.28
|
Sixth Supplemental Indenture, dated as of May 17, 2010, to Indenture dated as of December 1, 1995, between Burlington Northern Santa Fe, LLC and The Bank of New York Mellon Trust Company, N.A., as Trustee.
|
8-K
|
5/17/2010
|
1-11535
|
4.1
|
|||||
|
4.29
|
Certificate of Determination as to the terms of BNSF’s 5.75% Debentures due May 1, 2040.
|
8-K
|
5/17/2010
|
1-11535
|
4.2
|
|||||
|
4.30
|
Seventh Supplemental Indenture, dated as of September 10, 2010, to Indenture dated as of December 1, 1995, between Burlington Northern Santa Fe, LLC and The Bank of New York Mellon Trust Company, N.A., as Trustee.
|
8-K
|
9/10/2010
|
1-11535
|
4.1
|
|||||
|
Incorporated by Reference
(if applicable)
|
||||||||||
|
Exhibit Number and Description
|
Form
|
File Date
|
File No.
|
Exhibit
|
||||||
|
4.31
|
Certificate of Determination as to the terms of BNSF’s 3.60% Debentures due September 1, 2020 and 5.05% Debentures due March 1, 2041.
|
8-K
|
9/10/2010
|
1-11535
|
4.2
|
|||||
|
Certain instruments evidencing long-term indebtedness of BNSF are not being filed as exhibits to this Report because the total amount of securities authorized under any single such instrument does not exceed 10% of BNSF’s total assets. BNSF will furnish copies of any material instruments upon request of the Securities and Exchange Commission.
|
||||||||||
|
(10)
|
Material Contracts
|
|||||||||
|
10.23
|
Replacement Capital Covenant, dated as of December 15, 2005, by BNSF in favor of and for the benefit of each Covered Debtholder (as defined therein).
|
10-K
|
2/17/2006
|
1-11535
|
10.41
|
|||||
|
(12)
|
Statements re: Computation of Ratios
|
|||||||||
|
(16)
|
Letter re change in certifying accountant
|
|||||||||
|
16.1
|
Letter from PricewaterhouseCoopers LLP addressed to the Securities and Exchange Commission, dated as of February 16, 2010.
|
8-K
|
2/16/2010
|
1-11535
|
16.1
|
|||||
|
(23)
|
Consents of experts and counsel
|
|||||||||
|
(24)
|
Power of Attorney
|
|||||||||
|
(31)
|
Rule 13a-14(a)/15d-14(a) Certifications
|
|||||||||
|
(32)
|
Section 1350 Certifications
|
|||||||||
|
‡
|
Filed herewith
|
E-3