Attached files
| file | filename |
|---|---|
| EX-31.1 - SECTION 302 CERTIFICATION - BURLINGTON NORTHERN SANTA FE, LLC | d68781exv31w1.htm |
| EX-32.1 - SECTION 906 CEO AND CFO CERTIFICATION - BURLINGTON NORTHERN SANTA FE, LLC | d68781exv32w1.htm |
| EX-31.2 - SECTION 302 CERTIFICATION - BURLINGTON NORTHERN SANTA FE, LLC | d68781exv31w2.htm |
| EX-15.1 - INDEPENDENT REGISTERED PUBLIC ACCOUNTING FIRM'S AWARENESS LETTER - BURLINGTON NORTHERN SANTA FE, LLC | d68781exv15w1.htm |
| EXCEL - IDEA: XBRL DOCUMENT - BURLINGTON NORTHERN SANTA FE, LLC | Financial_Report.xls |
| EX-12.1 - COMPUTATION OF RATIO OF EARNINGS TO FIXED CHARGES - BURLINGTON NORTHERN SANTA FE, LLC | d68781exv12w1.htm |
Table of Contents
UNITED STATES
SECURITIES AND EXCHANGE COMMISSION
SECURITIES AND EXCHANGE COMMISSION
WASHINGTON, D.C. 20549
FORM 10-Q
(Mark One)
| x | QUARTERLY REPORT PURSUANT TO SECTION 13 OR 15(d) OF THE SECURITIES EXCHANGE ACT OF 1934 |
| For the quarterly period ended September 30, 2009 |
| OR |
| o | TRANSITION REPORT PURSUANT TO SECTION 13 OR 15(d) OF THE SECURITIES EXCHANGE ACT OF 1934 |
| For the transition period from to |
Commission file number 1-11535

BURLINGTON NORTHERN SANTA FE CORPORATION
(Exact name of registrant as specified in its charter)
| Delaware | 41-1804964 | |
| (State or other jurisdiction of incorporation or organization) |
(I.R.S. Employer Identification No.) |
2650 Lou Menk Drive
Fort Worth, Texas
(Address of principal executive offices)
Fort Worth, Texas
(Address of principal executive offices)
76131-2830
(Zip Code)
(Zip Code)
(800) 795-2673
(Registrant’s telephone number, including area code)
(Registrant’s telephone number, including area code)
Indicate by check mark whether the registrant: (1) has filed all reports required to be filed
by Section 13 or 15(d) of the Securities Exchange Act of 1934 during the preceding 12 months (or
for such shorter period that the registrant was required to file such reports), and (2) has been
subject to such filing requirements for the past 90 days. Yes [x] No [ ]
Indicate by check mark whether the registrant has submitted electronically and posted on its
corporate Web site, if any, every Interactive Data File required to be submitted and posted
pursuant to Rule 405 of Regulation S-T (§232.405 of this chapter) during the preceding 12
months (or for such shorter period that the registrant was required to submit and post such files).
Yes [x] No [ ]
Indicate by check mark whether the registrant is a large accelerated filer, an accelerated filer, a
non-accelerated filer, or a smaller reporting company. See the definitions of “large accelerated
filer”, “accelerated filer” and “smaller reporting company” in Rule 12b-2 of the Exchange Act.
Large accelerated filer [x] Accelerated filer [ ] Non-accelerated filer [ ] Smaller reporting company [ ]
Indicate by check mark whether the registrant is a shell company (as defined in Rule 12b-2 of the
Exchange Act).
Yes [ ] No [x]
Indicate the number of shares outstanding of each of the issuer’s classes of common stock, as of
the latest practicable date.
| Shares | ||||
| Outstanding at | ||||
| Class | October 13, 2009 | |||
Common stock, $.01 par value |
340,435,006 shares | |||
Table of Contents
2
Table of Contents
PART I
FINANCIAL INFORMATION
FINANCIAL INFORMATION
Item 1.
Financial Statements.
BURLINGTON NORTHERN SANTA FE CORPORATION and SUBSIDIARIES
CONSOLIDATED STATEMENTS OF INCOME
(In millions, except per share data)
(Unaudited)
CONSOLIDATED STATEMENTS OF INCOME
(In millions, except per share data)
(Unaudited)
| Three Months Ended | Nine Months Ended | ||||||||||||||
| September 30, | September 30, | ||||||||||||||
| 2009 | 2008 | 2009 | 2008 | ||||||||||||
Revenues |
$ | 3,595 | $ | 4,906 | $ | 10,335 | $ | 13,645 | |||||||
Operating expenses: |
|||||||||||||||
Compensation and benefits |
872 | 1,013 | 2,564 | 2,947 | |||||||||||
Fuel |
606 | 1,349 | 1,729 | 3,685 | |||||||||||
Purchased services |
453 | 537 | 1,396 | 1,600 | |||||||||||
Depreciation and amortization |
386 | 349 | 1,135 | 1,039 | |||||||||||
Equipment rents |
194 | 229 | 591 | 682 | |||||||||||
Materials and other |
183 | 222 | 553 | 896 | |||||||||||
Total operating expenses |
2,694 | 3,699 | 7,968 | 10,849 | |||||||||||
Operating income |
901 | 1,207 | 2,367 | 2,796 | |||||||||||
Interest expense |
127 | 122 | 462 | 396 | |||||||||||
Other expense, net |
1 | 6 | 5 | 11 | |||||||||||
Income before income taxes |
773 | 1,079 | 1,900 | 2,389 | |||||||||||
Income tax expense |
285 | 384 | 715 | 889 | |||||||||||
Net income |
$ | 488 | $ | 695 | $ | 1,185 | $ | 1,500 | |||||||
Earnings per share: |
|||||||||||||||
Basic earnings per share |
$ | 1.43 | $ | 2.01 | $ | 3.48 | $ | 4.33 | |||||||
Diluted earnings per share |
$ | 1.42 | $ | 1.99 | $ | 3.45 | $ | 4.28 | |||||||
Dividends declared per share |
$ | 0.40 | $ | 0.40 | $ | 1.20 | $ | 1.04 | |||||||
See accompanying Notes to Consolidated Financial Statements.
3
Table of Contents
BURLINGTON NORTHERN SANTA FE CORPORATION and SUBSIDIARIES
CONSOLIDATED BALANCE SHEETS
(Dollars in millions, shares in thousands)
(Unaudited)
CONSOLIDATED BALANCE SHEETS
(Dollars in millions, shares in thousands)
(Unaudited)
| September 30, | December 31, | |||||||
| 2009 | 2008 | |||||||
ASSETS |
||||||||
Current assets: |
||||||||
Cash and cash equivalents |
$ | 1,161 | $ | 633 | ||||
Accounts receivable, net |
853 | 847 | ||||||
Materials and supplies |
523 | 525 | ||||||
Current portion of deferred income taxes |
454 | 442 | ||||||
Other current assets |
286 | 218 | ||||||
Total current assets |
3,277 | 2,665 | ||||||
Property and equipment, net of accumulated depreciation of $10,453
and $9,912, respectively |
32,135 | 30,847 | ||||||
Other assets |
3,141 | 2,891 | ||||||
Total assets |
$ | 38,553 | $ | 36,403 | ||||
LIABILITIES AND STOCKHOLDERS’ EQUITY |
||||||||
Current liabilities: |
||||||||
Accounts payable and other current liabilities |
$ | 2,848 | $ | 3,190 | ||||
Long-term debt due within one year |
323 | 456 | ||||||
Total current liabilities |
3,171 | 3,646 | ||||||
Long-term debt |
10,062 | 9,099 | ||||||
Deferred income taxes |
9,235 | 8,590 | ||||||
Pension and retiree health and welfare liability |
1,020 | 1,047 | ||||||
Casualty and environmental liabilities |
963 | 959 | ||||||
Employee separation costs |
55 | 57 | ||||||
Other liabilities |
1,792 | 1,874 | ||||||
Total liabilities |
26,298 | 25,272 | ||||||
Commitments and contingencies (see Notes 2, 4 and 5) |
||||||||
Stockholders’ equity: |
||||||||
Common stock, $0.01 par value, 600,000 shares authorized; 543,062 shares and 541,346 shares issued, respectively |
5 | 5 | ||||||
Additional paid-in capital |
7,721 | 7,631 | ||||||
Retained earnings |
13,541 | 12,764 | ||||||
Treasury stock, at cost, 202,640 shares and 202,165 shares, respectively |
(8,424 | ) | (8,395 | ) | ||||
Accumulated other comprehensive loss |
(588 | ) | (874 | ) | ||||
Total stockholders’ equity |
12,255 | 11,131 | ||||||
Total liabilities and stockholders’ equity |
$ | 38,553 | $ | 36,403 | ||||
See accompanying Notes to Consolidated Financial Statements.
4
Table of Contents
BURLINGTON NORTHERN SANTA FE CORPORATION and SUBSIDIARIES
CONSOLIDATED STATEMENTS OF CASH FLOWS
(In millions)
(Unaudited)
CONSOLIDATED STATEMENTS OF CASH FLOWS
(In millions)
(Unaudited)
| Nine Months Ended September 30, | 2009 | 2008 | ||||||
OPERATING ACTIVITIES |
||||||||
Net income |
$ | 1,185 | $ | 1,500 | ||||
Adjustments to reconcile net income to net cash provided
by operating activities: |
||||||||
Depreciation and amortization |
1,135 | 1,039 | ||||||
Deferred income taxes |
458 | 248 | ||||||
Employee separation costs paid |
(10 | ) | (11 | ) | ||||
Long-term casualty and environmental liabilities, net |
(31 | ) | 181 | |||||
Other, net |
26 | 50 | ||||||
Changes in current assets and liabilities: |
||||||||
Accounts receivable, net |
50 | (108 | ) | |||||
Change in accounts receivables sales program |
(50 | ) | 278 | |||||
Materials and supplies |
2 | (47 | ) | |||||
Other current assets |
(91 | ) | (142 | ) | ||||
Accounts payable and other current liabilities |
(36 | ) | 315 | |||||
Net cash provided by operating activities |
2,638 | 3,303 | ||||||
INVESTING ACTIVITIES |
||||||||
Capital expenditures excluding equipment |
(1,669 | ) | (1,704 | ) | ||||
Acquisition of equipment |
(615 | ) | (676 | ) | ||||
Proceeds from sale of equipment financed |
368 | 190 | ||||||
Construction costs for facility financing obligation |
(36 | ) | (38 | ) | ||||
Other, net |
(167 | ) | (153 | ) | ||||
Net cash used for investing activities |
(2,119 | ) | (2,381 | ) | ||||
FINANCING ACTIVITIES |
||||||||
Net decrease in commercial paper and bank borrowings |
(100 | ) | (261 | ) | ||||
Proceeds from issuance of long-term debt |
825 | 650 | ||||||
Payments on long-term debt |
(373 | ) | (174 | ) | ||||
Dividends paid |
(409 | ) | (334 | ) | ||||
Proceeds from stock options exercised |
26 | 87 | ||||||
Purchase of BNSF common stock |
(15 | ) | (878 | ) | ||||
Excess tax benefits from equity compensation plans |
18 | 90 | ||||||
Proceeds from facility financing obligation |
51 | 50 | ||||||
Other, net |
(14 | ) | (6 | ) | ||||
Net cash provided by (used for) financing activities |
9 | (776 | ) | |||||
Increase in cash and cash equivalents |
528 | 146 | ||||||
Cash and cash equivalents: |
||||||||
Beginning of period |
633 | 330 | ||||||
End of period |
$ | 1,161 | $ | 476 | ||||
SUPPLEMENTAL CASH FLOW INFORMATION |
||||||||
Interest paid, net of amounts capitalized |
$ | 463 | $ | 406 | ||||
Income taxes paid, net of refunds |
$ | 170 | $ | 565 | ||||
Non-cash asset financing |
$ | 464 | $ | 79 | ||||
See accompanying Notes to Consolidated Financial Statements.
5
Table of Contents
BURLINGTON NORTHERN SANTA FE CORPORATION and SUBSIDIARIES
CONSOLIDATED STATEMENT OF CHANGES IN STOCKHOLDERS’ EQUITY
(Shares in thousands, dollars in millions, except per share data)
(Unaudited)
CONSOLIDATED STATEMENT OF CHANGES IN STOCKHOLDERS’ EQUITY
(Shares in thousands, dollars in millions, except per share data)
(Unaudited)
| Common Stock | Accumulated Other |
Total | |||||||||||||||||||||||||||
| Common | Treasury | and Paid-in | Retained | Treasury | Comprehensive | Stockholders’ | |||||||||||||||||||||||
| Shares | Shares | Capital | Earnings | Stock | Loss | Equity | |||||||||||||||||||||||
Balance at December 31, 2008 |
541,346 | (202,165 | ) | $ | 7,636 | $ | 12,764 | $ | (8,395 | ) | $ | (874 | ) | $ | 11,131 | ||||||||||||||
Common stock dividends, $1.20 per share |
– | (408 | ) | – | – | (408 | ) | ||||||||||||||||||||||
Restricted stock and stock options
expense |
32 | – | – | – | 32 | ||||||||||||||||||||||||
Restricted stock activity and related
tax expense of $1 |
506 | 1 | 1 | – | – | – | 1 | ||||||||||||||||||||||
Exercise of stock options and related
tax benefit of $17 |
1,210 | (243 | ) | 57 | – | (14 | ) | – | 43 | ||||||||||||||||||||
Purchase of BNSF common stocka |
– | (233 | ) | – | – | (15 | ) | – | (15 | ) | |||||||||||||||||||
Comprehensive income: |
|||||||||||||||||||||||||||||
Net income |
– | 1,185 | – | – | 1,185 | ||||||||||||||||||||||||
Change in unrecognized prior
service credit and actuarial losses, net
of tax expense of $6 |
– | – | – | 9 | 9 | ||||||||||||||||||||||||
Change in fuel/interest hedge
mark-to-market and other items, net of
tax expense of $155 |
– | – | – | 249 | 249 | ||||||||||||||||||||||||
Recognized loss on derivative
instruments-discontinued hedges, net of
tax benefit of $16 |
– | – | – | 27 | 27 | ||||||||||||||||||||||||
Change in unrealized loss on
securities held by equity method
investees, net of tax expense of $1 |
– | – | – | 1 | 1 | ||||||||||||||||||||||||
Total comprehensive income |
1,471 | ||||||||||||||||||||||||||||
Balance at September 30, 2009 |
543,062 | (202,640 | ) | $ | 7,726 | $ | 13,541 | $ | (8,424 | ) | $ | (588 | ) | $ | 12,255 | ||||||||||||||
a Total-to-date share repurchases through September 30, 2009, under the Company’s share repurchase program, were 192 million shares at an average price of $41.53 per share, leaving 18 million shares available for repurchase out of
the 210 million shares authorized.
See accompanying Notes to Consolidated Financial Statements.
6
Table of Contents
BURLINGTON NORTHERN SANTA FE CORPORATION and SUBSIDIARIES
NOTES TO CONSOLIDATED FINANCIAL STATEMENTS (Unaudited)
1. Accounting Policies and Interim Results
The Consolidated Financial Statements should be read in conjunction with Burlington Northern
Santa Fe Corporation’s Annual Report on Form 10-K for the year ended December 31, 2008, including
the financial statements and notes thereto. Burlington Northern Santa Fe Corporation (BNSF) is a
holding company that conducts no operating activities and owns no significant assets other than
through its interests in its subsidiaries. The Consolidated Financial Statements include the
accounts of BNSF and its majority-owned subsidiaries, all of which are separate legal entities
(collectively, the Company). BNSF’s principal operating subsidiary is BNSF Railway Company (BNSF
Railway). All significant intercompany accounts and transactions have been eliminated. BNSF was
incorporated in Delaware on December 16, 1994.
The results of operations for any interim period are not necessarily indicative of the results
of operations to be expected for the entire year. In the opinion of management, the unaudited
financial statements reflect all adjustments (consisting of only normal recurring adjustments,
except as disclosed) necessary for a fair statement of BNSF’s consolidated financial position as of
September 30, 2009, and the results of operations for the three and nine month periods ended
September 30, 2009 and 2008.
BNSF
has evaluated subsequent events through October 23, 2009, which represents the date the
Consolidated Financial Statements were issued.
Certain comparative prior period amounts in the Consolidated Financial Statements have been
reclassified to conform to the current period presentation. These reclassifications had no effect
on previously reported operating income or net income.
Adoption of New Accounting Pronouncement
In June 2009, the Financial Accounting Standards Board (FASB)
issued authoritative accounting guidance which established the FASB Accounting Standards
Codification (Codification or ASC) as the source of authoritative accounting principles recognized
by the FASB to be applied by nongovernmental entities and stated that all guidance contained in the
Codification carries an equal level of authority. The authoritative accounting guidance recognized
that rules and interpretive releases of the Securities and Exchange Commission (SEC) under federal
securities laws are also sources of authoritative Generally Accepted Accounting Principles (GAAP)
for SEC registrants. The Company adopted the provisions of the authoritative accounting guidance
for the interim reporting period ended September 30, 2009, the adoption of which did not have a
material effect on the Company’s consolidated financial statements.
7
Table of Contents
BURLINGTON NORTHERN SANTA FE CORPORATION and SUBSIDIARIES
NOTES TO CONSOLIDATED FINANCIAL STATEMENTS (Unaudited) – (Continued)
2. Hedging Activities
The Company uses derivative financial instruments to hedge against increases in diesel fuel
prices and interest rates as well as to convert a portion of its fixed-rate long-term debt to
floating-rate debt. The Company does not hold or issue derivative financial instruments for trading
or speculative purposes. The Company formally documents the relationship between the hedging
instrument and the hedged item, as well as the risk management objective and strategy for the use
of the hedging instrument. This documentation includes linking the derivatives that are designated
as fair value or cash flow hedges to specific assets or liabilities on the balance sheet,
commitments or forecasted transactions. The Company assesses at the time a derivative contract is
entered into, and at least quarterly thereafter, whether the derivative item is effective in
offsetting the changes in fair value or cash flows. Any change in fair value resulting from
ineffectiveness, as defined by authoritative accounting guidance related to derivatives and
hedging, is recognized in current period earnings. For derivative instruments that are designated
and qualify as cash flow hedges, the effective portion of the gain or loss on the derivative
instrument is recorded in accumulated other comprehensive loss (AOCL) as a separate component of
stockholders’ equity and reclassified into earnings in the period during which the hedge
transaction affects earnings. Cash flows related to fuel and interest rate derivatives are
classified as operating activities in the Consolidated Statements of Cash Flows.
BNSF monitors its hedging positions and credit ratings of its counterparties and does not
anticipate any losses due to counterparty nonperformance. All counterparties were financial
institutions with credit ratings of A2/A or higher as of September 30, 2009. The maximum amount of
loss the Company could incur from credit risk based on the gross fair value of derivative
instruments in asset positions as of September 30, 2009 and December 31, 2008, was $63 million and
$77 million, respectively. Other than as disclosed under the heading “Fuel; Total Fuel-Hedging
Activities,” the Company’s hedge agreements do not include provisions requiring collateral. Certain
of the Company’s hedge instruments are covered by master netting arrangements whereby, in the event
of a default, the non-defaulting party has the right to setoff any amounts payable against any
obligation of the defaulting party under the same counterparty agreement. As such, the Company’s
net asset exposure to counterparty credit risk was $51 million and $53 million as of September 30,
2009 and December 31, 2008, respectively.
Additional disclosure related to derivative instruments is included in Note 9 to the
Consolidated Financial Statements.
The amounts recorded in the Consolidated Balance Sheets for derivative transactions were as
follows (in millions). These amounts exclude $8 million and $106 million of collateral posted for
certain fuel hedge contracts as of September 30, 2009 and December 31, 2008, respectively.
| September 30, | December 31, | |||||||
| 2009 | 2008 | |||||||
Short-term hedge asset |
$ | 6 | $ | 5 | ||||
Long-term hedge asset |
47 | 72 | ||||||
Short-term hedge liability |
(79 | ) | (387 | ) | ||||
Long-term hedge liability |
(45 | ) | (193 | ) | ||||
Total derivatives |
$ | (71 | ) | $ | (503 | ) | ||
8
Table of Contents
BURLINGTON NORTHERN SANTA FE CORPORATION and SUBSIDIARIES
NOTES TO CONSOLIDATED FINANCIAL STATEMENTS (Unaudited) – (Continued)
The tables below contain summaries of all derivative positions reported in the
Consolidated Financial Statements, presented gross of any master netting arrangements (in
millions).
| Fair Value of Derivative Instruments | |||||||||||
| Asset Derivatives |
|||||||||||
| Balance Sheet | September 30, | December 31, | |||||||||
| Location | 2009 | 2008 | |||||||||
Derivatives designated
as hedging instruments
under ASC 815-20 |
|||||||||||
Fuel Contracts |
Other current assets | $ | 4 | $ | – | ||||||
Interest Rate Contracts |
Other current assets | 4 | 5 | ||||||||
Fuel Contracts |
Other assets | 12 | – | ||||||||
Interest Rate Contracts |
Other assets | 41 | 72 | ||||||||
Fuel Contracts |
Accounts payable and other current liabilities |
2 | – | ||||||||
Total Asset
Derivatives designated
as hedging instruments
under ASC 815-20 |
$ | 63 | $ | 77 | |||||||
| Liability Derivatives |
|||||||||||
| Balance Sheet | September 30, | December 31, | |||||||||
| Location | 2009 | 2008 | |||||||||
Derivatives designated
as hedging instruments
under ASC 815-20 |
|||||||||||
Fuel Contracts |
Other current assets | $ | 2 | $ | – | ||||||
Fuel Contracts |
Other assets | 6 | – | ||||||||
Fuel Contracts |
Accounts payable and other current liabilities |
81 | 279 | ||||||||
Interest Rate Contracts |
Accounts payable and other current liabilities |
– | 108 | ||||||||
Fuel Contracts |
Other liabilities | 45 | 193 | ||||||||
Total Liability
Derivatives designated
as hedging instruments
under ASC 815-20 |
$ | 134 | $ | 580 | |||||||
9
Table of Contents
BURLINGTON NORTHERN SANTA FE CORPORATION and SUBSIDIARIES
NOTES TO CONSOLIDATED FINANCIAL STATEMENTS (Unaudited) – (Continued)
The Effect of Derivative Instruments Gains and Losses
for the Three Month Periods Ended September 30, 2009 and 2008
| Derivatives in | Location of | ||||||||
| ASC 815-20 | Gain | Amount of Gain | |||||||
| Fair Value | Recognized in | Recognized | |||||||
| Hedging | Income on | in Income | |||||||
| Relationships | Derivatives | on Derivatives | |||||||
| 2009 | 2008 | ||||||||
Interest Rate Contracts |
Interest expense |
$ | 6 | $ | 4 | ||||
Total derivatives |
$ | 6 | $ | 4 | |||||
| Amount of Gain | ||||||||||||||||||||||||||||
| or (Loss) | ||||||||||||||||||||||||||||
| Location of | Location of | Recognized in Income | ||||||||||||||||||||||||||
| Gain or | Gain or | on Derivatives | ||||||||||||||||||||||||||
| Derivatives in | Amount of Gain or | (Loss) | Amount of Gain or | (Loss) | (Ineffective Portion | |||||||||||||||||||||||
| ASC 815-20 | (Loss) Recognized | Recognized | (Loss) Recognized | Recognized | and Amount | |||||||||||||||||||||||
| Cash Flow | in OCI on | from | from AOCL | in Income | Excluded from | |||||||||||||||||||||||
| Hedging | Derivatives | AOCL into | into Income | on | Effectiveness | |||||||||||||||||||||||
| Relationships | (Effective Portion) | Income | (Effective Portion) | Derivatives | Testing)a | |||||||||||||||||||||||
| 2009 | 2008 | 2009 | 2008 | 2009 | 2008 | |||||||||||||||||||||||
Fuel
Contracts |
$ | (20) | $ | (136) | Fuel expense |
$ | (38) | $ | 17 | Fuel expense |
$ | 3 | $ | (6) | ||||||||||||||
Interest Rate
Contracts |
1 | 8 | Interest expense | (1) | – | Interest expense | – | – | ||||||||||||||||||||
Total derivatives |
$ | (19) | $ | (128) | $ | (39) | $ | 17 | $ | 3 | $ | (6) | ||||||||||||||||
a No portion of the gain or (loss) was excluded from the assessment of hedge
effectiveness for the periods then ended.
10
Table of Contents
BURLINGTON NORTHERN SANTA FE CORPORATION and SUBSIDIARIES
NOTES TO CONSOLIDATED FINANCIAL STATEMENTS (Unaudited) – (Continued)
The Effect of Derivative Instruments Gains and Losses
for the Nine Month Periods Ended September 30, 2009 and 2008
for the Nine Month Periods Ended September 30, 2009 and 2008
| Derivatives in | Location of | ||||||||
| ASC 815-20 | Gain | Amount of Gain | |||||||
| Fair Value | Recognized in | Recognized | |||||||
| Hedging | Income on | in Income | |||||||
| Relationships | Derivatives | on Derivatives | |||||||
| 2009 | 2008 | ||||||||
Interest Rate Contracts |
Interest expense |
$ | 16 | $ | 8 | ||||
Total derivatives |
$ | 16 | $ | 8 | |||||
| Amount of Gain | ||||||||||||||||||||||||||||
| or (Loss) | ||||||||||||||||||||||||||||
| Location of | Location of | Recognized in Income | ||||||||||||||||||||||||||
| Gain or | Gain or | on Derivatives | ||||||||||||||||||||||||||
| Derivatives in | Amount of Gain or | (Loss) | Amount of Gain or | (Loss) | (Ineffective Portion | |||||||||||||||||||||||
| ASC 815-20 | (Loss) Recognized | Recognized | (Loss) Recognized | Recognized | and Amount | |||||||||||||||||||||||
| Cash Flow | in OCI on | from | from AOCL | in Income | Excluded from | |||||||||||||||||||||||
| Hedging | Derivatives | AOCL into | into Income | on | Effectiveness | |||||||||||||||||||||||
| Relationships | (Effective Portion) | Income | (Effective Portion) | Derivatives | Testing)a | |||||||||||||||||||||||
| 2009 | 2008 | 2009 | 2008 | 2009 | 2008 | |||||||||||||||||||||||
Fuel
Contracts |
$ | 152 | $ | (16) | Fuel expense |
$ | (204) | $ | 50 | Fuel expense |
$ | 19 | $ | (6) | ||||||||||||||
Interest Rate
Contracts |
66 | – | Interest expense | (1) | – | Interest expense | – | – | ||||||||||||||||||||
Total derivatives |
$ | 218 | $ | (16) | $ | (205) | $ | 50 | $ | 19 | $ | (6) | ||||||||||||||||
| Derivatives | |||||||||
| Not | Location of | ||||||||
| Designated as | (Loss) | ||||||||
| Hedging | Recognized | Amount of (Loss) | |||||||
| Instruments | in | Recognized | |||||||
| under | Income on | in Income | |||||||
| ASC 815-20 | Derivatives | on Derivatives | |||||||
| 2009 | 2008 | ||||||||
Interest Rate Contracts
|
Interest expense
|
$ | (32) | $ | – | ||||
Total derivatives
|
$ | (32) | $ | – | |||||
a No portion of the gain or (loss) was excluded from the assessment of hedge
effectiveness for the periods then ended.
11
Table of Contents
BURLINGTON NORTHERN SANTA FE CORPORATION and SUBSIDIARIES
NOTES
TO CONSOLIDATED FINANCIAL STATEMENTS (Unaudited) – (Continued)
Fuel
Fuel costs represented 22 percent and 34 percent of total operating expenses during the nine
month periods ended September 30, 2009 and 2008, respectively. Due to the significance of diesel
fuel expenses to the operations of BNSF and the historical volatility of fuel prices, the Company
has entered into hedges to partially mitigate the risk of fluctuations in the price of its diesel
fuel purchases. The fuel hedges include the use of derivatives that are accounted for as cash flow
hedges. The hedging is intended to protect the Company’s operating margins and overall
profitability from adverse fuel price changes by entering into fuel-hedge instruments based on
management’s evaluation of current and expected diesel fuel price trends. However, to the extent
the Company hedges portions of its fuel purchases, it may not realize the impact of decreases in
fuel prices. Conversely, to the extent the Company does not hedge portions of its fuel purchases,
it may be adversely affected by increases in fuel prices. Based on locomotive fuel consumption
(which represents substantially all fuel consumption) during the twelve-month period ended
September 30, 2009, and excluding the impact of the hedges, each one-cent increase in the price of
fuel per gallon would result in approximately $12 million of additional fuel expense on an annual
basis. However, BNSF believes any fuel price increase would be substantially offset by the
Company’s fuel surcharge program.
Total Fuel-Hedging Activities
As of September 30, 2009, BNSF’s total fuel-hedging positions for the remainder of 2009, 2010,
2011, and 2012 covered approximately 22 percent, 20 percent, 16 percent, and 3 percent,
respectively, of the average annual locomotive fuel consumption over the past three years. Hedge
positions are closely monitored to ensure that they will not exceed actual fuel requirements in any
period.
The amounts recorded in the Consolidated Balance Sheets for settled fuel-hedge transactions
were as follows (in millions):
| September 30, | December 31, | ||||||||
| 2009 | 2008 | ||||||||
Settled fuel-hedging contracts payable |
$ | (38) | $ | (38 | ) | ||||
Certain of the Company’s fuel-hedge instruments are covered by an agreement which includes a
provision such that the Company either receives or posts cash collateral if the fair value of the
instruments exceeds a certain net asset or net liability threshold, respectively. The threshold is
based on a sliding scale, utilizing either the counterparty’s credit rating, if the instruments are
in a net asset position, or BNSF’s credit rating, if the instruments are in a net liability
position. If the applicable credit rating should fall below Ba3 (Moody’s) or BB- (S&P), the
threshold would be eliminated and collateral would be required for the entire fair value amount.
All cash collateral paid is held on deposit by the payee and earns interest to the benefit of the
payor based on the London Interbank Offered Rate (LIBOR). The aggregate fair value of all open
fuel-hedge instruments under these provisions was in a net liability position on September 30, 2009
and December 31, 2008, of $43 million and $131 million, respectively, for which the Company posted
collateral of $8 million and $106 million, respectively. Additional collateral of $15 million and
$20 million was posted related to settled fuel-hedging contracts payable at September 30, 2009 and
December 31, 2008, respectively. The collateral was reflected as a reduction to either accounts
payable and other current liabilities or other liabilities in the Consolidated Balance Sheets,
depending on the expiration date of the related fuel hedges. The settled fuel-hedge liabilities
presented in the table above do not reflect a reduction for the posted collateral.
The Company uses the forward commodity price for the periods hedged to value its fuel-hedge
swaps and costless collars. This methodology is a market approach, which under authoritative
accounting guidance related to fair value measurements utilizes Level 2 inputs as it uses
market data for similar instruments in active markets.
12
Table of Contents
BURLINGTON NORTHERN SANTA FE CORPORATION and SUBSIDIARIES
NOTES TO CONSOLIDATED FINANCIAL STATEMENTS (Unaudited) – (Continued)
NOTES TO CONSOLIDATED FINANCIAL STATEMENTS (Unaudited) – (Continued)
New York Mercantile Exchange (NYMEX) #2 Heating Oil (HO) Hedges
As of September 30, 2009, BNSF had entered into fuel swap agreements utilizing NYMEX #2 HO.
The hedge prices do not include taxes, transportation costs, certain other fuel handling costs and
any differences that may occur between the prices of HO and the purchase price of BNSF’s diesel
fuel. Over the twelve months ended September 30, 2009, the sum of all such costs averaged
approximately 17 cents per gallon.
During the first nine months of 2009, the Company entered into fuel swap agreements utilizing
HO to hedge the equivalent of approximately 77.35 million gallons of fuel with an average swap
price of $1.95 per gallon. The following table provides fuel-hedge data based on the quarter being
hedged for all HO fuel hedges outstanding as of September 30, 2009.
| Quarter Ending | |||||||||||||||||||
| 2010 | March 31, | June 30, | September 30, | December 31, | Annual | ||||||||||||||
HO Swaps |
|||||||||||||||||||
Gallons hedged (in millions) |
5.60 | 8.35 | 6.10 | 6.50 | 26.55 | ||||||||||||||
Average swap price (per gallon) |
$ | 1.79 | $ | 1.81 | $ | 1.87 | $ | 1.93 | $ | 1.85 | |||||||||
Fair value (in millions) |
$ | – | $ | 1 | $ | 1 | $ | 1 | $ | 3 | |||||||||
| Quarter Ending | |||||||||||||||||||
| 2011 | March 31, | June 30, | September 30, | December 31, | Annual | ||||||||||||||
HO Swaps |
|||||||||||||||||||
Gallons hedged (in millions) |
8.30 | 8.30 | 7.50 | 7.50 | 31.60 | ||||||||||||||
Average swap price (per gallon) |
$ | 1.91 | $ | 1.89 | $ | 1.95 | $ | 2.01 | $ | 1.94 | |||||||||
Fair value (in millions) |
$ | 2 | $ | 2 | $ | 1 | $ | 1 | $ | 6 | |||||||||
| Quarter Ending | |||||||||||||||||||
| 2012 | March 31, | June 30, | September 30, | December 31, | Annual | ||||||||||||||
HO Swaps |
|||||||||||||||||||
Gallons hedged (in millions) |
17.20 | 2.00 | – | – | 19.20 | ||||||||||||||
Average swap price (per gallon) |
$ | 2.08 | $ | 2.18 | $ | – | $ | – | $ | 2.09 | |||||||||
Fair value (in millions) |
$ | 2 | $ | – | $ | – | $ | – | $ | 2 | |||||||||
West Texas Intermediate (WTI) Crude Oil Hedges
In addition, BNSF enters into fuel swap and costless collar agreements utilizing WTI crude
oil. The hedge prices do not include taxes, transportation costs, certain other fuel handling costs
and any differences which may occur between the prices of WTI and the purchase price of BNSF’s
diesel fuel, including refining costs. Over the twelve months ended September 30, 2009, the sum of
all such costs averaged approximately 43 cents per gallon.
13
Table of Contents
BURLINGTON NORTHERN SANTA FE CORPORATION and SUBSIDIARIES
NOTES TO CONSOLIDATED FINANCIAL STATEMENTS (Unaudited) – (Continued)
NOTES TO CONSOLIDATED FINANCIAL STATEMENTS (Unaudited) – (Continued)
During the first nine months of 2009, the Company entered into fuel swap agreements utilizing
WTI to hedge the equivalent of approximately 890 thousand barrels of fuel with an average swap
price of $76.44 per barrel and costless collar agreements utilizing WTI to hedge the equivalent of
approximately 80 thousand barrels of fuel with an average call price of $79.86 per barrel and an
average put price of $70.06 per barrel. The following table provides fuel-hedge data based on the
quarter being hedged for all WTI fuel hedges outstanding as of September 30, 2009.
| Quarter Ending | ||||
| 2009 | December 31, | |||
WTI Swaps |
||||
Barrels hedged (in thousands) |
1,425 | |||
Equivalent gallons hedged (in millions) |
59.85 | |||
Average swap price (per barrel) |
$ | 75.72 | ||
Fair value (in millions) |
$ | (7 | ) | |
WTI Costless Collars |
||||
Barrels hedged (in thousands) |
475 | |||
Equivalent gallons hedged (in millions) |
19.95 | |||
Average cap price (per barrel) |
$ | 135.46 | ||
Average floor price (per barrel) |
$ | 125.38 | ||
Fair value (in millions) |
$ | (25 | ) | |
| Quarter Ending | ||||||||||||||||||||
| 2010 | March 31, | June 30, | September 30, | December 31, | Annual | |||||||||||||||
WTI Swaps |
||||||||||||||||||||
Barrels hedged (in thousands) |
1,210 | 1,110 | 1,125 | 1,235 | 4,680 | |||||||||||||||
Equivalent gallons hedged (in millions) |
50.82 | 46.62 | 47.25 | 51.87 | 196.56 | |||||||||||||||
Average swap price (per barrel) |
$ | 85.05 | $ | 87.89 | $ | 87.82 | $ | 86.27 | $ | 86.71 | ||||||||||
Fair value (in millions) |
$ | (15 | ) | $ | (15 | ) | $ | (14 | ) | $ | (12 | ) | $ | (56 | ) | |||||
WTI Costless Collars |
||||||||||||||||||||
Barrels hedged (in thousands) |
420 | 420 | 420 | 320 | 1,580 | |||||||||||||||
Equivalent gallons hedged (in millions) |
17.64 | 17.64 | 17.64 | 13.44 | 66.36 | |||||||||||||||
Average cap price (per barrel) |
$ | 78.23 | $ | 79.79 | $ | 81.33 | $ | 82.84 | $ | 80.40 | ||||||||||
Average floor price (per barrel) |
$ | 72.35 | $ | 73.84 | $ | 75.15 | $ | 76.54 | $ | 74.34 | ||||||||||
Fair value (in millions) |
$ | (1 | ) | $ | (1 | ) | $ | (1 | ) | $ | (1 | ) | $ | (4 | ) | |||||
14
Table of Contents
BURLINGTON NORTHERN SANTA FE CORPORATION and SUBSIDIARIES
NOTES TO CONSOLIDATED FINANCIAL STATEMENTS (Unaudited) – (Continued)
NOTES TO CONSOLIDATED FINANCIAL STATEMENTS (Unaudited) – (Continued)
| Quarter Ending | ||||||||||||||||||||
| 2011 | March 31, | June 30, | September 30, | December 31, | Annual | |||||||||||||||
WTI Swaps |
||||||||||||||||||||
Barrels hedged (in thousands) |
995 | 1,000 | 1,005 | 1,055 | 4,055 | |||||||||||||||
Equivalent gallons hedged (in millions) |
41.79 | 42.00 | 42.21 | 44.31 | 170.31 | |||||||||||||||
Average swap price (per barrel) |
$ | 85.59 | $ | 85.20 | $ | 85.52 | $ | 85.88 | $ | 85.55 | ||||||||||
Fair value (in millions) |
$ | (8 | ) | $ | (8 | ) | $ | (7 | ) | $ | (8 | ) | $ | (31 | ) | |||||
WTI Costless Collars |
||||||||||||||||||||
Barrels hedged (in thousands) |
200 | 200 | 200 | 200 | 800 | |||||||||||||||
Equivalent gallons hedged (in millions) |
8.40 | 8.40 | 8.40 | 8.40 | 33.60 | |||||||||||||||
Average cap price (per barrel) |
$ | 84.00 | $ | 84.70 | $ | 85.39 | $ | 86.10 | $ | 85.05 | ||||||||||
Average floor price (per barrel) |
$ | 77.75 | $ | 78.40 | $ | 79.05 | $ | 79.70 | $ | 78.73 | ||||||||||
Fair value (in millions) |
$ | (1 | ) | $ | (1 | ) | $ | (1 | ) | $ | (1 | ) | $ | (4 | ) | |||||
| Quarter Ending | ||||||||||||||||||||
| 2012 | March 31, | June 30, | September 30, | December 31, | Annual | |||||||||||||||
WTI Swaps |
||||||||||||||||||||
Barrels hedged (in thousands) |
205 | 200 | – | – | 405 | |||||||||||||||
Equivalent gallons hedged (in millions) |
8.61 | 8.40 | – | – | 17.01 | |||||||||||||||
Average swap price (per barrel) |
$ | 76.95 | $ | 77.52 | $ | – | $ | – | $ | 77.23 | ||||||||||
Fair value (in millions) |
$ | – | $ | – | $ | – | $ | – | $ | – | ||||||||||
NYMEX #2 Heating Oil Refining Spread Hedges
During the first nine months of 2009, the Company entered into fuel swap agreements utilizing
the HO refining spread (HO-WTI) to hedge the equivalent of approximately 250 thousand barrels of
fuel with an average swap price of $8.06 per barrel. HO-WTI is the difference in price between HO
and WTI; therefore, a HO-WTI swap in combination with a WTI swap is equivalent to a HO swap. The
following table provides fuel-hedge data based upon the quarter being hedged for all HO-WTI fuel
hedges outstanding as of September 30, 2009.
| Quarter Ending | ||||||||||||||||||||
| 2010 | March 31, | June 30, | September 30, | December 31, | Annual | |||||||||||||||
HO-WTI Swaps |
||||||||||||||||||||
Barrels hedged (in thousands) |
115 | 90 | 45 | – | 250 | |||||||||||||||
Equivalent gallons hedged (in millions) |
4.83 | 3.78 | 1.89 | – | 10.50 | |||||||||||||||
Average swap price (per barrel) |
$ | 7.70 | $ | 7.95 | $ | 9.20 | $ | – | $ | 8.06 | ||||||||||
Fair value (in millions) |
$ | – | $ | – | $ | – | $ | – | $ | – | ||||||||||
Interest Rate
From time to time, the Company enters into various interest rate hedging transactions for the
purpose of managing exposure to fluctuations in interest rates by establishing rates in
anticipation of both future debt issuances and the refinancing of leveraged leases, as well as
converting a portion of its fixed-rate long-term debt to floating-rate debt. The Company uses
interest rate swaps and treasury locks as part of its interest rate risk management strategy.
15
Table of Contents
BURLINGTON NORTHERN SANTA FE CORPORATION and SUBSIDIARIES
NOTES TO CONSOLIDATED FINANCIAL STATEMENTS (Unaudited) – (Continued)
NOTES TO CONSOLIDATED FINANCIAL STATEMENTS (Unaudited) – (Continued)
Total Interest Rate Hedging Program
All interest rate hedge transactions outstanding are reflected in the following table:
| September 30, 2009 | ||||||||||||||||||||||||||||||||
| Maturity Date | Fair | |||||||||||||||||||||||||||||||
| 2009 | 2010 | 2011 | 2012 | 2013 | Thereafter | Total | Value | |||||||||||||||||||||||||
Fair Value Hedges |
||||||||||||||||||||||||||||||||
Fixed to variable swaps (in millions) |
$ | – | $ | 250 | $ | – | $ | – | $ | – | $ | 400 | $ | 650 | $ | 45 | a | |||||||||||||||
Average fixed rate |
– | % | 7.13 | % | – | % | – | % | – | % | 5.75 | % | 6.28 | % | ||||||||||||||||||
Average floating rate |
– | % | 3.17 | % | – | % | – | % | – | % | 1.70 | % | 2.27 | % | ||||||||||||||||||
a Fair value includes $4 million of accrued interest.
BNSF’s measurement of the fair value of interest rate derivatives is based on estimates of the
mid-market values for the transactions which are provided by the counterparties to these
agreements. BNSF reviews these estimates for reasonableness. This methodology is a market approach,
which under authoritative accounting guidance related to fair value measurements utilizes Level 2
inputs as it uses market data for similar instruments in active markets.
Fair Value Interest Rate Hedges
The Company enters into interest rate swaps to convert fixed-rate long-term debt to
floating-rate debt. These swaps are accounted for as fair value hedges under authoritative
accounting guidance related to derivatives and hedging. These fair value hedges qualify for the
short-cut method of recognition; therefore, no portion of these swaps is treated as ineffective.
The gain or loss on the fair value hedges as well as the offsetting loss or gain on the hedged
items (fixed-rate debt) attributable to the hedged risk are recorded in current earnings. The
Company includes the gain or loss on the fixed-rate debt in the same line item - interest expense -
as the offsetting loss or gain on the related interest rate swaps as follows (in millions):
| Gain (Loss) on Interest Rate Swaps | Gain (Loss) on Fixed-rate Debt | |||||||||||||||||||||||||||||||
| Three Months | Nine Months | Three Months | Nine Months | |||||||||||||||||||||||||||||
| Income Statement | Ended | Ended | Ended | Ended | ||||||||||||||||||||||||||||
| Classification | September 30, | September 30, | September 30, | September 30, | ||||||||||||||||||||||||||||
| 2009 | 2008 | 2009 | 2008 | 2009 | 2008 | 2009 | 2008 | |||||||||||||||||||||||||
Interest expense |
$ | 9 | $ | 7 | $ | (32 | ) | $ | (3 | ) | $ | (9 | ) | $ | (7 | ) | $ | 32 | $ | 3 | ||||||||||||
As of September 30, 2009 and December 31, 2008, BNSF had entered into nine and eleven separate
swaps, respectively, with an aggregate notional amount of $650 million and $850 million,
respectively, in which it pays an average floating rate, which fluctuates quarterly, based on
LIBOR. The average floating rate to be paid by BNSF as of September 30, 2009, was 2.27 percent, and
the average fixed rate BNSF is to receive was 6.28 percent.
16
Table of Contents
BURLINGTON NORTHERN SANTA FE CORPORATION and SUBSIDIARIES
NOTES TO CONSOLIDATED FINANCIAL STATEMENTS (Unaudited) – (Continued)
NOTES TO CONSOLIDATED FINANCIAL STATEMENTS (Unaudited) – (Continued)
Cash Flow Interest Rate Hedges
In September 2009, the Company entered into a treasury lock having a notional amount of $500
million and a locked-in rate of 3.46 percent, to fix a portion of the rate for a 10-year unsecured
debt issuance. The treasury lock was terminated in connection with the issuance of $750 million
10-year notes (see Note 4 to the Consolidated Financial Statements). Upon termination, BNSF
received approximately $600 thousand from the counterparty, which will be amortized as a reduction
to interest expense over the life of the issued debt. This transaction was accounted for as a cash
flow hedge. As of September 30, 2009, no cash flow hedges were outstanding.
In anticipation of a future debt issuance, the Company entered into five treasury locks during
2008 having an aggregate notional amount of $250 million, and an average locked-in rate of 4.18
percent, to fix a portion of the rate for a future 30-year unsecured debt issuance. The Company
also entered into six treasury locks during 2008 having an aggregate notional amount of $150
million, and an average locked-in rate of 3.80 percent, to fix a portion of the rate for a future
10-year unsecured debt issuance. These transactions were previously accounted for as cash flow
hedges. However, during the first quarter of 2009, the Company determined that it was no longer
probable that it would issue debt according to the terms of the hedges. As such, hedge accounting
could no longer be applied to the treasury locks. The treasury locks were terminated in early April
and $32 million was paid to the counterparties, which was the fair value of the treasury locks at
the date of termination. Therefore, a net $32 million loss was recognized as an increase to
interest expense.
AOCL included $8 million and $6 million of unrecognized gains on closed hedges as of September
30, 2009 and December 31, 2008, respectively. These amounts will be amortized to interest expense
over the life of the corresponding issued debt.
3. Accounts Receivable, Net
BNSF Railway sells a portion of its accounts receivable to Santa Fe Receivables Corporation
(SFRC), a special purpose subsidiary. The sole purpose and activity of SFRC is to purchase
receivables from BNSF Railway. SFRC transfers an undivided interest in such receivables, with
limited exceptions, to a master trust and causes the trust to issue an undivided interest in the
receivables to investors (the A/R sales program). The undivided interests in the master trust may
be in the form of certificates or purchased interests and are isolated from BNSF Railway which
eliminates all of BNSF Railway’s control over the undivided interest. SFRC periodically incurs
minor legal fees that are paid by BNSF Railway and are financed through short-term intercompany
payables.
BNSF Railway’s total capacity to sell undivided interests to investors under the A/R sales
program was $700 million at September 30, 2009, which was comprised of two $175 million, 364-day
accounts receivable facilities and two $175 million, 3-year accounts receivable facilities. Both
364-day facilities will mature in November 2009 and are expected to be renewed. The two 3-year
facilities will mature in November 2010. Each of the financial institutions providing credit for
the facilities is rated Aa3/A+ or higher. There was no outstanding interest held by investors under
the A/R sales program at September 30, 2009. Outstanding undivided interests held by investors
under the A/R sales program were $50 million at December 31, 2008, with $12.5 million outstanding
under each of the four facilities. These undivided interests in receivables are excluded from
accounts receivable by BNSF Railway in connection with the sale of undivided interests under the
A/R sales program. As of September 30, 2009 and December 31, 2008, an interest in $864 million and
$878 million, respectively, of receivables had been transferred by SFRC to the master trust. When
SFRC transfers the interest in these receivables to the master trust, it retains an undivided
interest in the receivables, which is included in accounts receivable in the Company’s Consolidated
Financial Statements. The interest that continues to be held by SFRC of $864 million and $828
million at September 30, 2009 and December 31, 2008, respectively, less an allowance for
uncollectible accounts, reflected the total accounts receivable transferred by SFRC to the master
trust less $50 million of outstanding undivided interests held by investors at December 31, 2008.
Due to a relatively short collection cycle, the fair value of the undivided interest transferred to
investors in the A/R sales program approximated book value, and there was no gain or loss from the
transaction.
17
Table of Contents
BURLINGTON NORTHERN SANTA FE CORPORATION and SUBSIDIARIES
NOTES TO CONSOLIDATED FINANCIAL STATEMENTS (Unaudited) – (Continued)
NOTES TO CONSOLIDATED FINANCIAL STATEMENTS (Unaudited) – (Continued)
BNSF Railway retains the collection responsibility with respect to the accounts receivable.
Proceeds from collections reinvested in the A/R sales program were approximately $11.2 billion and
$14.5 billion for the nine months ended September 30, 2009 and 2008, respectively. No servicing
asset or liability has been recorded because the fees BNSF Railway receives for servicing the
receivables approximate the related costs. SFRC’s costs of the sale of receivables are included in
other expense, net and were $2 million and $9 million for the nine months ended September 30, 2009
and 2008, respectively. These costs fluctuate monthly with changes in prevailing interest rates as
well as unused available commitments and include interest, discounts associated with transferring
the receivables under the A/R sales program to SFRC, program fees paid to banks, incidental
commercial paper issuing costs and fees for unused commitment availability.
The amount of accounts receivable sold by BNSF Railway fluctuates based on borrowing needs and
upon the availability of receivables and is directly affected by changing business volumes and
credit risks, including dilution and delinquencies. In order for there to be an impact on the
amount of receivables BNSF Railway could sell, the combined dilution and delinquency percentages
would have to exceed an established threshold. BNSF Railway has historically experienced very low
levels of dilution or delinquency and was below the established reserve threshold at September 30,
2009. Based on the current levels, if dilution or delinquency percentages were to increase by one
percentage point, there would be no impact to the amount of receivables BNSF Railway could sell.
Receivables eligible under the A/R sales program do not include receivables over 90 days past
due or concentrations over certain limits with any one customer and certain other receivables. At
September 30, 2009 and December 31, 2008, $15 million and $9 million, respectively, of such
accounts receivable were greater than 90 days old.
BNSF Railway maintains an allowance for bill adjustments and uncollectible accounts based upon
the expected collectibility of accounts receivable, including receivables transferred to the master
trust. At September 30, 2009 and December 31, 2008, $31 million and $43 million, respectively, of
such allowances had been recorded, of which $31 million and $42 million, respectively, had been
recorded as a reduction to accounts receivable, net. The remaining $1 million at December 31, 2008
had been recorded in other current liabilities because it related to the outstanding undivided
interests held by investors. During the nine months ended September 30, 2009 and 2008, $6 million
and $5 million, respectively, of accounts receivable were written off, net of recoveries. Credit
losses are based on specific identification of uncollectible accounts and application of historical
collection percentages by aging category.
The investors in the master trust have no recourse to BNSF Railway’s other assets except for
customary warranty and indemnity claims. Creditors of BNSF Railway have no recourse to the assets
of the master trust or SFRC unless and until all claims of their respective creditors have been
paid. The A/R sales program includes thresholds for dilution, delinquency, and write-off ratios
that, if exceeded, allow the investors participating in this program, at their option, to cancel
the program. At September 30, 2009, BNSF Railway was in compliance with these provisions.
See Note 10 to the Consolidated Financial Statements for information about recent accounting
pronouncements that will have an impact on the A/R sales program upon adoption.
4. Debt
Revolving Credit Facility and Commercial Paper
As of September 30, 2009, the Company had borrowing capacity of up to $1.2 billion under its
long-term revolving bank credit facility, which expires in September 2012. Annual facility fees are
currently 0.08 percent for the facility. The rate is subject to change based upon changes in BNSF’s
senior unsecured debt ratings. Borrowing rates are based upon (i) LIBOR plus a spread determined by
BNSF’s senior unsecured debt ratings; (ii) money market rates offered at the option of the lenders;
or (iii) an alternate base rate. BNSF must maintain compliance with certain financial covenants
under its revolving bank credit facility. At September 30, 2009, the Company was in compliance with
these covenants.
At September 30, 2009, there were no bank borrowings against the revolving credit agreement.
BNSF issues commercial paper from time to time that is supported by the revolving bank credit
facility. Outstanding commercial paper balances reduce the amount of borrowings available under
this agreement. The classification of commercial paper is determined by the Company’s ability and
intent to use long-term or short-term funding sources to settle the obligations at maturity. At
December 31, 2008, the Company classified outstanding commercial paper as long-term debt.
18
Table of Contents
BURLINGTON NORTHERN SANTA FE CORPORATION and SUBSIDIARIES
NOTES TO CONSOLIDATED FINANCIAL STATEMENTS (Unaudited) – (Continued)
NOTES TO CONSOLIDATED FINANCIAL STATEMENTS (Unaudited) – (Continued)
No commercial paper was outstanding as of September 30, 2009.
Notes and Debentures
In September 2009, BNSF issued $750 million of 4.7 percent notes due October 1, 2019. The net
proceeds from the sale of the notes are being used for general corporate purposes which may
include, but are not limited to, working capital, capital expenditures, repurchase of common stock
pursuant to the share repurchase program, and repayment of outstanding indebtedness.
At September 30, 2009, $750 million remained authorized by the Board of Directors to be issued
through a SEC debt shelf registration statement.
Equipment Obligation
In July 2009, BNSF Railway entered into an 18-year equipment obligation totaling $75 million
to finance locomotives and railcars.
Capital Leases
During the first nine months of 2009, BNSF entered into a 12-year capital lease to finance
$368 million of locomotives and freight cars. Additionally, BNSF entered into capital leases
totaling $96 million to finance maintenance of way and other vehicles and equipment with lease
terms of three to seven years.
Financing Obligation
In 2005, the Company commenced the construction of an intermodal facility that it intended to
sell to a third party and subsequently lease back. As of September 30, 2009, construction of the
facility was completed for a cost of approximately $160 million. All improvements have been sold to
the third party and BNSF leased the facility from the third party for 20 years. This sale leaseback
transaction was accounted for as a financing obligation due to continuing involvement. The outflows
from the construction of the facility were classified as investing activities, and the inflows from
the associated financing proceeds were classified as financing activities in the Company’s
Consolidated Statements of Cash Flows.
Fair Value of Debt Instruments
At September 30, 2009 and December 31, 2008, the fair value of BNSF’s debt, excluding capital
leases and interest rate hedges, was $9,578 million and $8,323 million, respectively, while the
book value was $8,772 million and $8,274 million, respectively. The fair value of BNSF’s debt is
primarily based on quoted market prices for the same or similar issues, or on the current rates
that would be offered to BNSF for debt of the same remaining maturities. The book value of
commercial paper approximates fair value due to its short maturity.
Guarantees
As of September 30, 2009, BNSF Railway has not been called upon to perform under the
guarantees specifically disclosed in this footnote and does not anticipate a significant
performance risk in the foreseeable future.
19
Table of Contents
BURLINGTON NORTHERN SANTA FE CORPORATION and SUBSIDIARIES
NOTES TO CONSOLIDATED FINANCIAL STATEMENTS (Unaudited) – (Continued)
NOTES TO CONSOLIDATED FINANCIAL STATEMENTS (Unaudited) – (Continued)
Debt and other obligations of non-consolidated entities guaranteed by the Company as of
September 30, 2009, were as follows (dollars in millions):
| Guarantees | ||||||||||||||||||||||||
| BNSF | Principal | Maximum | Maximum | Remaining | ||||||||||||||||||||
| Ownership | Amount | Future | Recourse | Term | Capitalized | |||||||||||||||||||
| Percentage | Guaranteed | Payments | Amounta | (in years) | Obligations | |||||||||||||||||||
Kinder Morgan Energy Partners, L.P. |
0.5% | $ | 190 | $ | 190 | $ | – | Termination of Ownership | $ | – | ||||||||||||||
Kansas City Terminal Intermodal
Transportation Corporation |
0.0% | $ | 48 | $ | 67 | $ | 67 | 9 | $ | 27 | b | |||||||||||||
Westside Intermodal Transportation
Corporation |
0.0% | $ | 37 | $ | 55 | $ | – | 14 | $ | 29 | b | |||||||||||||
The Unified Government of Wyandotte County/Kansas City, Kansas |
0.0% | $ | 12 | $ | 17 | $ | – | 14 | $ | 9 | b | |||||||||||||
Chevron Phillips
Chemical Company, LP |
0.0% | N/A | d | N/A | d | N/A | d | 8 | $ | 11 | c | |||||||||||||
Various lessors (Residual value guarantees) |
0.0% | N/A | $ | 270 | $ | 270 | Various | $ | 68 | c | ||||||||||||||
All other |
0.0% | $ | 4 | $ | 4 | $ | 1 | Various | $ | – | ||||||||||||||
| a | Reflects the maximum amount the Company could recover from a third party other than the counterparty. |
| b | Reflects capitalized obligations that are recorded on the Company’s Consolidated Balance Sheet. |
| c | Reflects the asset and corresponding liability for the fair value of these guarantees required by authoritative accounting guidance related to guarantees. |
| d | There is no cap to the liability that can be sought from BNSF for BNSF’s negligence or the negligence of the indemnified party. However, BNSF could receive reimbursement from certain insurance policies if the
liability exceeds a certain amount. |
Kinder Morgan Energy Partners, L.P.
Santa Fe Pacific Pipelines, Inc., an indirect, wholly-owned subsidiary of BNSF Railway, has a
guarantee in connection with its remaining special limited partnership interest in Santa Fe Pacific
Pipelines Partners, L.P. (SFPP), a subsidiary of Kinder Morgan Energy Partners, L.P., to be paid
only upon default by the partnership. All obligations with respect to the guarantee will cease upon
termination of ownership rights, which would occur upon a put notice issued by BNSF or the exercise
of the call rights by the general partners of SFPP.
Kansas City Terminal Intermodal Transportation Corporation
BNSF Railway and another major railroad jointly and severally guarantee $48 million of debt of
Kansas City Terminal Intermodal Transportation Corporation, the proceeds of which were used to
finance construction of a double track grade separation bridge in Kansas City, Missouri, which is
operated and used by Kansas City Terminal Railway Company (KCTRC). BNSF Railway has a 25 percent
ownership in KCTRC, accounts for its interest using the equity method of accounting and would be
required to fund a portion of the remaining obligation upon default by the original debtor.
Westside Intermodal Transportation Corporation and The Unified Government of
Wyandotte County/Kansas City, Kansas
Wyandotte County/Kansas City, Kansas
BNSF Railway has outstanding guarantees of $49 million of debt, the proceeds of which were
used to finance construction of a bridge that connects BNSF Railway’s Argentine Yard in Kansas
City, Kansas, with the KCTRC mainline tracks in Kansas City, Missouri. The bridge is operated by
KCTRC, and payments related to BNSF Railway’s guarantee of this obligation would only be called for
upon default by the original debtor.
20
Table of Contents
BURLINGTON NORTHERN SANTA FE CORPORATION and SUBSIDIARIES
NOTES
TO CONSOLIDATED FINANCIAL STATEMENTS (Unaudited) – (Continued)
Chevron Phillips Chemical Company, LP
In the third quarter of 2007, BNSF Railway entered into an indemnity agreement with Chevron
Phillips Chemical Company, LP (Chevron Phillips), granting certain rights of indemnity from BNSF
Railway, in order to facilitate access to a new storage facility. Under certain circumstances,
payment under this obligation may be required in the event Chevron Phillips were to incur certain
liabilities or other incremental costs resulting from trackage access.
Residual Value Guarantees (RVG)
In the normal course of business, the Company enters into leases in which it guarantees the
residual value of certain leased equipment. Some of these leases have renewal or purchase options,
or both, that the Company may exercise at the end of the lease term. If the Company elects not to
exercise these options, it may be required to pay the lessor an amount not exceeding the RVG. The
amount of any payment is contingent upon the actual residual value of the leased equipment. Some of
these leases also require the lessor to pay the Company any surplus if the actual residual value of
the leased equipment is over the RVG. These guarantees will expire between 2010 and 2011.
The maximum future payments, as disclosed in the Guarantees table above, represent the
undiscounted maximum amount that the Company could be required to pay in the event the Company did
not exercise its renewal option and the fair market value of the equipment had significantly
declined. BNSF does not anticipate such a large reduction in the fair market value of the leased
equipment. As of September 30, 2009, the Company had recorded a $68 million asset and corresponding
liability for the fair value of RVG.
All Other
As of September 30, 2009, BNSF guaranteed $4 million of other debt and leases. BNSF holds a
performance bond and has the option to sub-lease property to recover up to $1 million of the $4
million of guarantees. These guarantees expire between 2011 and 2013.
Other than as discussed above, there is no collateral held by a third party that the Company
could obtain and liquidate to recover any amounts paid under the above guarantees.
Other than as discussed above, none of the guarantees are recorded in the Consolidated
Financial Statements of the Company. The Company does not expect performance under these guarantees
to have a material effect on the Company in the foreseeable future.
Indemnities
In the ordinary course of business, BNSF enters into agreements with third parties that
include indemnification clauses. In general, these clauses are customary for the types of
agreements in which they are included. At times, these clauses may involve indemnification for the
acts of the Company, its employees and agents, indemnification for another party’s acts,
indemnification for future events, indemnification based upon a certain standard of performance,
indemnification for liabilities arising out of the Company’s use of leased equipment or other
property, or other types of indemnification. Due to the uncertainty of whether events which would
trigger the indemnification obligations would ever occur, the Company does not believe that these
indemnity agreements will have a material adverse effect on the Company’s results of operations,
financial position or liquidity. Additionally, the Company believes that, due to lack of historical
payment experience, the fair value of indemnities cannot be estimated with any amount of certainty
and that the fair value of any such amount would be immaterial to the Consolidated Financial
Statements. Agreements that contain unique circumstances, particularly agreements that contain
guarantees that indemnify for another party’s acts are disclosed separately if appropriate. Unless
separately disclosed above, no fair value liability related to indemnities has been recorded in the
Consolidated Financial Statements.
21
Table of Contents
BURLINGTON NORTHERN SANTA FE CORPORATION and SUBSIDIARIES
NOTES TO CONSOLIDATED FINANCIAL STATEMENTS (Unaudited) – (Continued)
5. Commitments and Contingencies
Personal Injury
Personal injury claims, including asbestos claims and employee work-related injuries and
third-party injuries (collectively, other personal injury), are a significant expense for the
railroad industry. Personal injury claims by BNSF Railway employees are subject to the provisions
of the Federal Employers’ Liability Act (FELA) rather than state workers’ compensation laws. FELA’s
system of requiring the finding of fault, coupled with unscheduled awards and reliance on the jury
system, contributed to increased expenses in past years. Other proceedings include claims by
non-employees for punitive as well as compensatory damages. A few proceedings purport to be class
actions. The variability present in settling these claims, including non-employee personal injury
and matters in which punitive damages are alleged, could result in increased expenses in future
years. BNSF has implemented a number of safety programs designed to reduce the number of personal
injuries as well as the associated claims and personal injury expense.
BNSF records a liability for personal injury claims when the expected loss is both probable
and reasonably estimable. The liability and ultimate expense projections are estimated using
standard actuarial methodologies. Liabilities recorded for unasserted personal injury claims are
based on information currently available. Due to the inherent uncertainty involved in projecting
future events such as the number of claims filed each year, developments in judicial and
legislative standards and the average costs to settle projected claims, actual costs may differ
from amounts recorded. Expense accruals and any required adjustments are classified as materials
and other in the Consolidated Statements of Income.
Asbestos
The Company is party to a number of personal injury claims by employees and non-employees who
may have been exposed to asbestos. The heaviest exposure for BNSF employees was due to work
conducted in and around the use of steam locomotive engines that were phased out between the years
of 1950 and 1967. However, other types of exposures, including exposure from locomotive component
parts and building materials, continued after 1967 until they were substantially eliminated at BNSF
by 1985.
BNSF assesses its unasserted liability exposure on an annual basis during the third quarter.
BNSF determines its asbestos liability by estimating its exposed population, the number of claims
likely to be filed, the number of claims that will likely require payment, and the estimated cost
per claim. Estimated filing and dismissal rates and average cost per claim are determined utilizing
recent claim data and trends.
During the third quarter of 2009 and 2008, the Company analyzed recent filing and payment
trends to ensure the assumptions used by BNSF to estimate its future asbestos liability were
reasonable. In the third quarters of 2009 and 2008, management determined that the liability
remained appropriate and no change was recorded. The Company plans to update its study again in the
third quarter of 2010.
Throughout the year, BNSF monitors actual experience against the number of forecasted claims
and expected claim payments and will record adjustments to the Company’s estimates as necessary.
The following table summarizes the activity in the Company’s accrued obligations for both
asserted and unasserted asbestos matters (in millions):
| Three Months Ended | Nine Months Ended | |||||||||||||||
| September 30, | September 30, | |||||||||||||||
| 2009 | 2008 | 2009 | 2008 | |||||||||||||
Beginning balance |
$ | 244 | $ | 261 | $ | 251 | $ | 270 | ||||||||
Accruals |
– | – | – | – | ||||||||||||
Payments |
(3 | ) | (5 | ) | (10 | ) | (14 | ) | ||||||||
Ending balance at September 30, |
$ | 241 | $ | 256 | $ | 241 | $ | 256 | ||||||||
22
Table of Contents
BURLINGTON NORTHERN SANTA FE CORPORATION and SUBSIDIARIES
NOTES TO CONSOLIDATED FINANCIAL STATEMENTS (Unaudited) – (Continued)
Of the September 30, 2009 obligation, $199 million was related to unasserted claims while $42
million was related to asserted claims. At September 30, 2009, $17 million was included in current
liabilities. The recorded liability was not discounted. In addition, defense and processing costs,
which are recorded on an as-reported basis, were not included in the recorded liability. The
Company is primarily self-insured for asbestos-related claims.
The following table summarizes information regarding the number of asserted asbestos claims
filed against BNSF:
| Three Months Ended | Nine Months Ended | |||||||||||||||
| September 30, | September 30, | |||||||||||||||
| 2009 | 2008 | 2009 | 2008 | |||||||||||||
Claims unresolved at beginning of period |
1,750 | 1,800 | 1,833 | 1,781 | ||||||||||||
Claims filed |
89 | 143 | 236 | 415 | ||||||||||||
Claims settled, dismissed or otherwise resolved |
(96 | ) | (83 | ) | (326 | ) | (336 | ) | ||||||||
Claims unresolved at September 30, |
1,743 | 1,860 | 1,743 | 1,860 | ||||||||||||
Based on BNSF’s estimate of the potentially exposed employees and related mortality
assumptions, it is anticipated that unasserted claims will continue to be filed through the year
2050. The Company recorded an amount for the full estimated filing period through 2050 because it
had a relatively finite exposed population (former and current employees hired prior to 1985),
which it was able to identify and reasonably estimate and about which it had obtained reliable
demographic data (including age, hire date and occupation) derived from industry or BNSF specific
data that was the basis for the study. BNSF projects that approximately 55, 75 and 95 percent of
the future unasserted asbestos claims will be filed within the next 10, 15 and 25 years,
respectively.
Because of the uncertainty surrounding the factors used in the study, it is reasonably
possible that future costs to settle asbestos claims may range from approximately $217 million to
$262 million. However, BNSF believes that the $241 million recorded is the best estimate of the
Company’s future obligation for the settlement of asbestos claims.
The amounts recorded by BNSF for the asbestos-related liability were based upon currently
known facts. Future events, such as the number of new claims to be filed each year, the average
cost of disposing of claims, as well as the numerous uncertainties surrounding asbestos litigation
in the United States, could cause the actual costs to be higher or lower than projected.
While the final outcome of asbestos-related matters cannot be predicted with certainty,
considering among other things the meritorious legal defenses available and liabilities that have
been recorded, it is the opinion of BNSF that none of these items, when finally resolved, will have
a material adverse effect on the Company’s financial position or liquidity. However, the occurrence
of a number of these items in the same period could have a material adverse effect on the results
of operations in a particular quarter or fiscal year.
Other Personal Injury
BNSF estimates its other personal injury liability claims and expense quarterly based on the
covered population, activity levels and trends in frequency and the costs of covered injuries.
Estimates include unasserted claims except for certain repetitive stress and other occupational
trauma claims that allegedly result from prolonged repeated events or exposure. Such claims are
estimated on an as-reported basis because the Company cannot estimate the range of reasonably
possible loss due to other non-work related contributing causes of such injuries and the fact that
continued exposure is required for the potential injury to manifest itself as a claim. BNSF has not
experienced any significant adverse trends related to these types of claims in recent years.
BNSF monitors quarterly actual experience against the number of forecasted claims to be
received, the forecasted number of claims closing with payment and expected claims payments.
Adjustments to the Company’s estimates are recorded quarterly as necessary or more frequently as
new events or revised estimates develop.
23
Table of Contents
BURLINGTON NORTHERN SANTA FE CORPORATION and SUBSIDIARIES
NOTES TO CONSOLIDATED FINANCIAL STATEMENTS (Unaudited) – (Continued)
The following table summarizes the activity in the Company’s accrued obligations for other
personal injury matters (in millions):
| Three Months Ended | Nine Months Ended | |||||||||||||||
| September 30, | September 30, | |||||||||||||||
| 2009 | 2008 | 2009 | 2008 | |||||||||||||
Beginning balance |
$ | 436 | $ | 474 | $ | 442 | $ | 439 | ||||||||
Accruals |
22 | 34 | 76 | 136 | ||||||||||||
Payments |
(28 | ) | (37 | ) | (88 | ) | (104 | ) | ||||||||
Ending balance at September 30, |
$ | 430 | $ | 471 | $ | 430 | $ | 471 | ||||||||
At September 30, 2009, $153 million was included in current liabilities. BNSF’s liabilities
for other personal injury claims are undiscounted. In addition, defense and processing costs, which
are recorded on an as-reported basis, were not included in the recorded liability. The Company is
substantially self-insured for other personal injury claims.
The following table summarizes information regarding the number of personal injury claims,
other than asbestos, filed against BNSF:
| Three Months Ended | Nine Months Ended | |||||||||||||||
| September 30, | September 30, | |||||||||||||||
| 2009 | 2008 | 2009 | 2008 | |||||||||||||
Claims unresolved at beginning of period |
3,155 | 3,941 | 3,349 | 3,322 | ||||||||||||
Claims filed |
1,175 | 994 | 2,632 | 3,441 | ||||||||||||
Claims settled, dismissed or otherwise resolved |
(834 | ) | (861 | ) | (2,485 | ) | (2,689 | ) | ||||||||
Claims unresolved at September 30, |
3,496 | 4,074 | 3,496 | 4,074 | ||||||||||||
Because of the uncertainty surrounding the ultimate outcome of other personal injury claims,
it is reasonably possible that future costs to settle other personal injury claims may range from
approximately $375 million to $530 million. However, BNSF believes that the $430 million recorded
is the best estimate of the Company’s future obligation for the settlement of other personal injury
claims.
The amounts recorded by BNSF for other personal injury claims were based upon currently known
facts. Future events, such as the number of new claims to be filed each year, the average cost of
disposing of claims, as well as the numerous uncertainties surrounding personal injury litigation
in the United States, could cause the actual costs to be higher or lower than projected.
While the final outcome of these other personal injury matters cannot be predicted with
certainty, considering among other things the meritorious legal defenses available and liabilities
that have been recorded, it is the opinion of BNSF that none of these items, when finally resolved,
will have a material adverse effect on the Company’s financial position or liquidity. However, the
occurrence of a number of these items in the same period could have a material adverse effect on
the results of operations in a particular quarter or fiscal year.
24
Table of Contents
BURLINGTON NORTHERN SANTA FE CORPORATION and SUBSIDIARIES
NOTES
TO CONSOLIDATED FINANCIAL STATEMENTS (Unaudited) – (Continued)
BNSF Insurance Company
The Company has a consolidated, wholly-owned subsidiary, Burlington Northern Santa Fe
Insurance Company, Ltd. (BNSF IC) that provides insurance coverage for certain risks incurred after
April 1, 1998, FELA claims, railroad protective and force account insurance claims and certain
excess general liability coverage incurred after January 1, 2002, and certain other claims which
are subject to reinsurance. Beginning in 2004, BNSF IC entered into annual reinsurance treaty
agreements with several other companies. The treaty agreements insure workers compensation, general
liability, auto liability and FELA risk. In accordance with the agreements, BNSF IC cedes a portion
of its FELA exposure through the treaty and assumes a proportionate share of the entire risk. Each
year BNSF IC reviews the objectives and performance of the treaty to determine its continued
participation in the treaty. The treaty agreements provide for certain protections against the risk
of treaty participants’ non-performance. On an on-going basis, BNSF and/or the treaty manager
reviews the credit-worthiness of each of the participants, and BNSF does not believe its exposure
to treaty participants’ non-performance is material at this time. BNSF IC typically invests in
third-party commercial paper, time deposits and money market accounts as well as in commercial
paper issued by BNSF. At September 30, 2009, there was $484 million related to these third-party
investments, which were classified as cash and cash equivalents on the Company’s Consolidated
Balance Sheet, as compared with approximately $425 million at December 31, 2008.
Environmental
The Company’s operations, as well as those of its competitors, are subject to extensive
federal, state and local environmental regulation. BNSF’s operating procedures include practices to
protect the environment from the risks inherent in railroad operations, which frequently involve
transporting chemicals and other hazardous materials. Additionally, many of BNSF’s land holdings
are and have been used for industrial or transportation-related purposes or leased to commercial or
industrial companies whose activities may have resulted in discharges onto the property. As a
result, BNSF is subject to environmental cleanup and enforcement actions. In particular, the
federal Comprehensive Environmental Response, Compensation and Liability Act of 1980 (CERCLA), also
known as the Superfund law, as well as similar state laws, generally impose joint and several
liability for cleanup and enforcement costs on current and former owners and operators of a site
without regard to fault or the legality of the original conduct. BNSF has been notified that it is
a potentially responsible party (PRP) for study and cleanup costs at Superfund sites for which
investigation and remediation payments are or will be made or are yet to be determined (the
Superfund sites) and, in many instances, is one of several PRPs. In addition, BNSF may be
considered a PRP under certain other laws. Accordingly, under CERCLA and other federal and state
statutes, BNSF may be held jointly and severally liable for all environmental costs associated with
a particular site. If there are other PRPs, BNSF generally participates in the cleanup of these
sites through cost-sharing agreements with terms that vary from site to site. Costs are typically
allocated based on such factors as relative volumetric contribution of material, the amount of time
the site was owned or operated and/or the portion of the total site owned or operated by each PRP.
Liabilities for environmental cleanup costs are recorded when BNSF’s liability for
environmental cleanup is probable and reasonably estimable. Subsequent adjustments to initial
estimates are recorded as necessary based upon additional information developed in subsequent
periods. Environmental costs include initial site surveys and environmental studies as well as
costs for remediation of sites determined to be contaminated.
BNSF estimates the ultimate cost of cleanup efforts at its known environmental sites on an
annual basis during the third quarter. Ultimate cost estimates for environmental sites are based on
historical payment patterns, current estimated percentage to closure ratios and benchmark patterns
developed from data accumulated from industry and public sources, including the Environmental
Protection Agency and other governmental agencies. These factors incorporate into the estimates
experience gained from cleanup efforts at other similar sites.
On a quarterly basis, BNSF monitors actual experience against the forecasted remediation and
related payments made on existing sites and conducts ongoing environmental contingency analyses,
which consider a combination of factors including independent consulting reports, site visits,
legal reviews and analysis of the likelihood of participation in, and the ability to pay for,
cleanup of other PRPs. Adjustments to the Company’s estimates will continue to be recorded as
necessary based on developments in subsequent periods. Additionally, environmental accruals, which
are classified as materials and other in the Consolidated Statements of Income, include amounts for
newly identified sites or contaminants, third-party claims and legal fees incurred for defense of
third-party claims and recovery efforts.
25
Table of Contents
BURLINGTON NORTHERN SANTA FE CORPORATION and SUBSIDIARIES
NOTES
TO CONSOLIDATED FINANCIAL STATEMENTS (Unaudited) – (Continued)
During the third quarters of 2009 and 2008, the Company analyzed recent data and trends to
ensure the assumptions used by BNSF to estimate its future environmental liability were reasonable.
As a result of this study, in the third quarters of 2009 and 2008, management recorded additional
expense of approximately $25 million and $13 million as of the respective June 30 measurement
dates. The Company plans to update its study again in the third quarter of 2010.
Annual studies do not include (i) contaminated sites of which the Company is not aware; (ii)
additional amounts for third-party tort claims, which arise out of contaminants allegedly migrating
from BNSF property, due to a limited number of sites; or (iii) natural resource damage claims. BNSF
continues to estimate third-party tort claims on a site by site basis when the liability for such
claims is probable and reasonably estimable. BNSF’s recorded liability for third-party tort claims
as of September 30, 2009, was approximately $14 million.
BNSF is involved in a number of administrative and judicial proceedings and other mandatory
cleanup efforts for 316 sites, including 19 Superfund sites, at which it is participating in the
study or cleanup, or both, of alleged environmental contamination.
The following table summarizes the activity in the Company’s accrued obligations for
environmental matters (in millions):
| Three Months Ended | Nine Months Ended | |||||||||||||||
| September 30, | September 30, | |||||||||||||||
| 2009 | 2008 | 2009 | 2008 | |||||||||||||
Beginning balance |
$ | 529 | $ | 545 | $ | 546 | $ | 380 | ||||||||
Accruals |
32 | 26 | 60 | 223 | ||||||||||||
Payments |
(24 | ) | (28 | ) | (69 | ) | (60 | ) | ||||||||
Ending balance at September 30, |
$ | 537 | $ | 543 | $ | 537 | $ | 543 | ||||||||
At September 30, 2009, $75 million was included in current liabilities.
In the second quarter of 2008, the Company completed an analysis of its Montana sites to
determine its legal exposure related to the potential effect of a Montana Supreme Court decision.
The decision, which did not involve BNSF, held that restoration damages (damages equating to
clean-up costs which are intended to return property to its original condition) may be awarded
under certain circumstances even where such damages may exceed the property’s actual value. The
legal situation in Montana, the increase in the number of claims against BNSF and others resulting
from this decision, and the completion of the analysis caused BNSF to record additional pre-tax
environmental expenses of $175 million, or $0.31 per diluted share in the second quarter of 2008
for environmental liabilities primarily related to the effect of the aforementioned Montana Supreme
Court decision on certain of BNSF’s Montana sites.
BNSF’s environmental liabilities are not discounted. BNSF anticipates that the majority of the
accrued costs at September 30, 2009, will be paid over the next ten years, and no individual site
is considered to be material.
The following table summarizes the environmental sites:
| Three Months Ended | Nine Months Ended | |||||||||||||||
| September 30, | September 30, | |||||||||||||||
| BNSF Sites | 2009 | 2008 | 2009 | 2008 | ||||||||||||
Number of sites at beginning of period |
318 | 350 | 336 | 346 | ||||||||||||
Sites added during the period |
– | 4 | 9 | 16 | ||||||||||||
Sites closed during the period |
(2 | ) | (14 | ) | (29 | ) | (22 | ) | ||||||||
Number of sites at September 30, |
316 | 340 | 316 | 340 | ||||||||||||
26
Table of Contents
BURLINGTON NORTHERN SANTA FE CORPORATION and SUBSIDIARIES
NOTES
TO CONSOLIDATED FINANCIAL STATEMENTS (Unaudited) – (Continued)
Liabilities recorded for environmental costs represent BNSF’s best estimate of its probable
future obligation for the remediation and settlement of these sites and include both asserted and
unasserted claims. Although recorded liabilities include BNSF’s best estimate of all probable
costs, without reduction for anticipated recoveries from third parties, BNSF’s total cleanup costs
at these sites cannot be predicted with certainty due to various factors such as the extent of
corrective actions that may be required, evolving environmental laws and regulations, advances in
environmental technology, the extent of other parties’ participation in cleanup efforts,
developments in ongoing environmental analyses related to sites determined to be contaminated and
developments in environmental surveys and studies of contaminated sites.
Because of the uncertainty surrounding these factors, it is reasonably possible that future
costs for environmental liabilities may range from approximately $390 million to $850 million.
However, BNSF believes that the $537 million recorded at September 30, 2009, is the best estimate
of the Company’s future obligation for environmental costs.
While the final outcome of these environmental matters cannot be predicted with certainty, it
is the opinion of BNSF that none of these items, when finally resolved, will have a material
adverse effect on the Company’s financial position or liquidity. However, the occurrence of a
number of these items in the same period could have a material adverse effect on the results of
operations in a particular quarter or fiscal year.
Other Claims and Litigation
In addition to asbestos, other personal injury and environmental matters discussed above, BNSF
and its subsidiaries are also parties to a number of other legal actions and claims, governmental
proceedings and private civil suits arising in the ordinary course of business, including those
related to disputes and complaints involving certain transportation rates and charges (including
complaints seeking refunds of prior charges paid for coal transportation and the prescription of
future rates for such movements and claims relating to service under contract provisions or
otherwise). Some of the legal proceedings include claims for punitive as well as compensatory
damages, and a few proceedings purport to be class actions. Although the final outcome of these
matters cannot be predicted with certainty, considering among other things the meritorious legal
defenses available and liabilities that have been recorded along with applicable insurance, it is
the opinion of BNSF that none of these items, when finally resolved, will have a material adverse
effect on the Company’s financial position or liquidity. However, an unexpected adverse resolution
of one or more of these items could have a material adverse effect on the results of operations in
a particular quarter or fiscal year.
Coal Rate Case Decision
On February 17, 2009, the United States Surface Transportation Board (STB) issued a new
decision in a rate dispute between Western Fuels Association, Inc. and Basin Electric Power
Cooperative, Inc. (collectively, WFA) and BNSF Railway Company (BNSF Railway). (Western Fuels
Association, Inc. and Basin Electric Power Cooperative v. BNSF Railway Company, STB Docket No.
42088). The dispute relates to the reasonableness of rates BNSF Railway charges to WFA for the
transportation of approximately 8 million tons of coal a year from Powder River Basin mines in
Wyoming to the Laramie River Station Plant at Moba Junction, Wyoming. The STB previously ruled in
this matter in 2007 that the challenged rates were not shown unreasonable. During the pendency of
the case, the STB issued new guidelines for reviewing the reasonableness of rates in cases such as
this and then permitted WFA to submit new evidence. In its new 2009 decision, the STB found that
these same challenged rates were not commercially reasonable. The STB ordered BNSF Railway to
reimburse WFA for amounts previously collected above the new levels prescribed for prior periods.
The STB also prescribed maximum rates through 2024 at levels substantially below the rates
previously set by BNSF Railway. In compliance with the STB’s decision, BNSF Railway published new
rates to the Laramie River Station effective March 20, 2009. WFA challenged BNSF Railway’s
methodology for implementing those rates before the STB and on July 27, 2009, the STB issued a
decision that largely adopted the methodology advocated for by BNSF Railway. The final amount of
approximately $120 million in reparations, which includes
interest, was submitted by WFA to
the STB with BNSF Railway’s concurrence. The STB approved the
final amount of reparations on October 22, 2009, with the Company to
pay the reparations within 30 days. On March 4, 2009,
BNSF Railway filed a petition for judicial review of the 2009 decision of the STB to the United
States Court of Appeals for the District of Columbia Circuit (Western Fuels Association, Inc. and
Basin Electric Power Cooperative v. Surface Transportation Board and United States of America,
Consolidated Docket Nos. 08-1167 and 09-1092), and briefing is underway.
27
Table of Contents
BURLINGTON NORTHERN SANTA FE CORPORATION and SUBSIDIARIES
NOTES TO CONSOLIDATED FINANCIAL STATEMENTS (Unaudited) – (Continued)
In accordance with the final amount of reparations, during the third quarter of 2009
BNSF recorded an adjustment to amounts previously accrued in the first quarter of 2009, resulting
in a gain of $31 million, or $0.06 per diluted share, of which $30 million and $1 million were
recorded as an increase to freight revenues and a reduction to interest expense, respectively. As
such, the net impact in the first nine months of 2009 resulting from the STB’s decision was a loss
of $74 million, or $0.13 per diluted share, in excess of amounts previously accrued. Of the total
loss, $66 million and $8 million were recorded as a reduction to freight revenues and an increase
to interest expense, respectively.
6. Employee Separation Costs
Employee separation costs activity was as follows (in millions):
| Nine Months Ended September 30, | 2009 | 2008 | ||||||
Beginning balance at January 1, |
$ | 79 | $ | 91 | ||||
Accruals |
12 | 3 | ||||||
Payments |
(10 | ) | (11 | ) | ||||
Ending balance at September 30, |
$ | 81 | $ | 83 | ||||
Employee separation liabilities of $81 million were included in the Consolidated Balance Sheet
at September 30, 2009, and principally represent the following: (i) $79 million for deferred
benefits payable upon separation or retirement to certain active conductors, trainmen and
locomotive engineers; (ii) less than $1 million for employee-related severance costs for the
consolidation of clerical functions, material handlers in mechanical shops and trainmen on reserve
boards; and (iii) $2 million for certain non-union employee severance costs. Employee separation
expenses are recorded in materials and other in the Consolidated Statements of Income. At September
30, 2009, $26 million of the remaining liabilities was included in current liabilities.
The deferred benefits payable upon separation or retirement to certain active conductors,
trainmen and locomotive engineers were primarily incurred in connection with labor agreements
reached prior to the business combination of BNSF’s predecessor companies, Burlington Northern Inc.
and Santa Fe Pacific Corporation. These agreements, among other things, reduced train crew sizes
and allowed for more flexible work rules. The majority of the remaining costs will be paid between
2009 and 2020. As of September 30, 2009, the Company had updated its estimate and recorded an
additional liability of $12 million related to deferred benefits. The remaining costs for (ii)
above are expected to be paid out between 2009 and approximately 2011, and the costs for (iii)
above are expected be paid out between 2009 and 2021 based on deferral elections made by the
affected employees.
7. Employment Benefit Plans
Components of the net cost were as follows (in millions):
| Pension Benefits | ||||||||||||||||
| Three Months Ended | Nine Months Ended | |||||||||||||||
| September 30, | September 30, | |||||||||||||||
| Net Cost | 2009 | 2008 | 2009 | 2008 | ||||||||||||
Service cost |
$ | 7 | $ | 7 | $ | 21 | $ | 19 | ||||||||
Interest cost |
25 | 25 | 76 | 76 | ||||||||||||
Expected return on plan assets |
(27 | ) | (28 | ) | (80 | ) | (84 | ) | ||||||||
Amortization of net loss |
7 | 4 | 19 | 12 | ||||||||||||
Net cost recognized |
$ | 12 | $ | 8 | $ | 36 | $ | 23 | ||||||||
28
Table of Contents
BURLINGTON NORTHERN SANTA FE CORPORATION and SUBSIDIARIES
NOTES
TO CONSOLIDATED FINANCIAL STATEMENTS (Unaudited) – (Continued)
| Retiree Health and Welfare Benefits | ||||||||||||||||
| Three Months Ended | Nine Months Ended | |||||||||||||||
| September 30, | September 30, | |||||||||||||||
| Net Cost | 2009 | 2008 | 2009 | 2008 | ||||||||||||
Service cost |
$ | 1 | $ | 1 | $ | 2 | $ | 2 | ||||||||
Interest cost |
4 | 4 | 11 | 13 | ||||||||||||
Amortization of net loss |
– | 1 | 1 | 3 | ||||||||||||
Amortization of prior service credit |
(1 | ) | (1 | ) | (4 | ) | (5 | ) | ||||||||
Net cost recognized |
$ | 4 | $ | 5 | $ | 10 | $ | 13 | ||||||||
In the second quarter of 2009, the Company made a voluntary contribution of $33 million to
BNSF’s qualified pension plan. The Company is not required to make any additional contributions to
BNSF’s qualified pension plan in 2009.
8. Earnings Per Share
Basic earnings per share is based on the weighted average number of common shares outstanding.
Diluted earnings per share is based on basic earnings per share adjusted for the effect of
potential common shares outstanding that were dilutive during the period, arising from employee
stock awards and incremental shares calculated using the treasury stock method.
Weighted average stock options totaling 4.4 million and 5.1 million for the three and nine
months ended September 30, 2009, respectively, and 1.8 million and 1.6 million for the three and
nine months ended September 30, 2008, respectively, were not included in the computation of diluted
earnings per share because the options’ exercise price exceeded the average market price of the
Company’s stock for those periods.
The Company adopted authoritative accounting guidance which requires non-vested shares that
contain non-forfeitable rights to dividends or dividend equivalents (whether paid or unpaid) to be
considered participating securities, and therefore be included in computing earnings per share
using the two-class method. The Company has retrospectively applied the provisions to the financial
information included herein, which resulted in a reduction in earnings per diluted share of $0.01
and $0.02 for the three months and nine months ended in September 30, 2008, respectively.
The following table is a reconciliation of net income available to common stockholders used in
the basic and diluted EPS computations for the three months and nine months ended September 30,
2009 and 2008 (in millions, except per share amounts):
| Three Months Ended | Nine Months Ended | |||||||||||||||
| September 30, | September 30, | |||||||||||||||
| 2009 | 2008 | 2009 | 2008 | |||||||||||||
Income Statement: |
||||||||||||||||
Net income |
$ | 488 | $ | 695 | $ | 1,185 | $ | 1,500 | ||||||||
Net income allocated to participating securities |
(2 | ) | (3 | ) | (4 | ) | (6 | ) | ||||||||
Net income available to common stockholders |
$ | 486 | $ | 692 | $ | 1,181 | $ | 1,494 | ||||||||
Average Shares: |
||||||||||||||||
Basic |
340.2 | 343.5 | 339.8 | 344.9 | ||||||||||||
Diluted |
342.7 | 347.2 | 342.2 | 349.2 | ||||||||||||
Earnings Per Share: |
||||||||||||||||
Basic |
$ | 1.43 | $ | 2.01 | $ | 3.48 | $ | 4.33 | ||||||||
Diluted |
$ | 1.42 | $ | 1.99 | $ | 3.45 | $ | 4.28 | ||||||||
29
Table of Contents
BURLINGTON NORTHERN SANTA FE CORPORATION and SUBSIDIARIES
NOTES TO CONSOLIDATED FINANCIAL STATEMENTS (Unaudited) – (Continued)
9. Comprehensive Income
Other comprehensive income refers to revenues, expenses, gains and losses that under generally
accepted accounting principles are included in comprehensive income, a component of Stockholders’
Equity within the Consolidated Balance Sheets, rather than net income on the Consolidated
Statements of Income. Under existing accounting standards, other comprehensive income may include,
among other things, unrecognized gains and losses and prior service credit related to pension and
other postretirement benefit plans and accounting for derivative financial instruments, which
qualify for cash flow hedge accounting.
The following table provides a reconciliation of net income reported in the Consolidated
Statements of Income to total comprehensive income (in millions):
| Three Months Ended | Nine Months Ended | |||||||||||||||
| September 30, | September 30, | |||||||||||||||
| 2009 | 2008 | 2009 | 2008 | |||||||||||||
Net income |
$ | 488 | $ | 695 | $ | 1,185 | $ | 1,500 | ||||||||
Other comprehensive income: |
||||||||||||||||
Change in unrecognized
prior service credit and
actuarial losses, net of
tax (see Note 7) |
3 | 2 | 9 | 6 | ||||||||||||
Change in fuel/interest
hedge mark-to-market and
other items, net of tax
(see Note 2) |
9 | (85 | ) | 249 | (37 | ) | ||||||||||
Recognized loss on
derivative
instruments-discontinued
hedges, net of tax (see
Note 2) |
– | – | 27 | – | ||||||||||||
Change in unrealized loss
on securities held by
equity method investees,
net of tax |
1 | (1 | ) | 1 | (1 | ) | ||||||||||
Total comprehensive income |
$ | 501 | $ | 611 | $ | 1,471 | $ | 1,468 | ||||||||
The following table provides the components of accumulated other comprehensive loss (in
millions):
| September 30, | December 31, | |||||||
| 2009 | 2008 | |||||||
Unrecognized prior service credit and actuarial losses, net of tax (see
Note 7) |
$ | (514 | ) | $ | (523 | ) | ||
Fuel/interest hedge mark-to-market and other items, net of tax (see Note 2) |
(68 | ) | (344 | ) | ||||
Unrealized loss on securities held by equity method investees, net of tax |
(6 | ) | (7 | ) | ||||
Total Accumulated other comprehensive loss |
$ | (588 | ) | $ | (874 | ) | ||
30
Table of Contents
BURLINGTON NORTHERN SANTA FE CORPORATION and SUBSIDIARIES
NOTES TO CONSOLIDATED FINANCIAL STATEMENTS (Unaudited) – (Continued)
10. Accounting Pronouncements
In June 2009, the FASB issued Statement of Financial Accounting Standards (SFAS) No. 166, Accounting for Transfers of Financial Assets – an
amendment of FASB Statement No. 140. SFAS 166 limits the circumstances in which financial assets
can be derecognized and requires enhanced disclosures regarding transfers of financial assets and a
transferor’s continuing involvement with transferred financial assets. SFAS No. 166 also eliminates
the concept of a qualifying special-purpose entity (QSPE), which will require companies to evaluate
former QSPEs for consolidation.
In June 2009, the FASB issued SFAS No. 167, Amendments to FASB Interpretation No. 46(R). SFAS
No. 167 amends existing guidance used to determine whether or not a company is required to
consolidate a variable interest entity (VIE) and requires enhanced disclosures. SFAS No. 167
eliminates quantitative-based assessments and will require companies to perform ongoing qualitative
assessments to determine whether or not the VIE should be consolidated.
Both SFAS 166 and SFAS 167 are effective for the Company on January 1, 2010.
As discussed in Note 3, the Company’s A/R sales program involves a master trust that issues an
undivided interest in receivables to investors. The A/R sales master trust is not currently
consolidated in the Company’s financial statements and the undivided interest in receivables that
have been sold to investors is derecognized. These new pronouncements will require the Company to
consolidate the A/R sales master trust and to no longer derecognize the undivided interest sold to
investors effective January 1, 2010. As a result, the Company’s Consolidated Balance Sheets will
reflect an increase in accounts receivable, net and an increase in current liabilities for the
amount of undivided interest sold to investors and any related cash flow impacts will be included
in Financing Activities rather than Operating Activities in the Consolidated Statements of Cash
Flows. There was no outstanding interest held by investors under the A/R sales program at September
30, 2009. Outstanding undivided interests held by investors under the A/R sales program was $50
million at December 31, 2008.
11. Report of Independent Registered Public Accounting Firm
PricewaterhouseCoopers LLP’s review report is included in this quarterly report; however,
PricewaterhouseCoopers LLP does not express an opinion on the unaudited financial information.
Accordingly, such report is not a “report” or “part of a registration statement” within the
meaning of Sections 7 and 11 of the Securities Act of 1933 and PricewaterhouseCoopers LLP is not
subject to the liability provisions of Section 11 of such Act with respect to the review report.
31
Table of Contents
Report of Independent Registered Public Accounting Firm
To the Shareholders and Board of Directors of
Burlington Northern Santa Fe Corporation:
Burlington Northern Santa Fe Corporation:
We have reviewed the accompanying consolidated balance sheet of Burlington Northern Santa Fe
Corporation and its subsidiaries (“the Company”) as of September 30, 2009, and the related
consolidated statements of income for the three-month and nine-month periods ended September 30,
2009 and 2008, consolidated statements of cash flows for the nine-month periods ended September 30,
2009 and 2008 and consolidated statement of changes in stockholders’ equity for the nine-month
period ended September 30, 2009. These interim financial statements are the responsibility of the
Company’s management.
We conducted our review in accordance with the standards of the Public Company Accounting Oversight
Board (United States). A review of interim financial information consists principally of applying
analytical procedures and making inquiries of persons responsible for financial and accounting
matters. It is substantially less in scope than an audit conducted in accordance with the
standards of the Public Company Accounting Oversight Board (United States), the objective of which
is the expression of an opinion regarding the financial statements taken as a whole. Accordingly,
we do not express such an opinion.
Based on our review, we are not aware of any material modifications that should be made to the
accompanying consolidated interim financial statements for them to be in conformity with accounting
principles generally accepted in the United States of America.
We previously audited, in accordance with the standards of the Public Company Accounting Oversight
Board (United States), the consolidated balance sheet as of December 31, 2008, and the related
consolidated statements of income, of changes in stockholders’ equity, and of cash flows for the
year then ended (not presented herein), and in our report dated February 12, 2009 we expressed an
unqualified opinion on those consolidated financial statements. In our opinion, the information
set forth in the accompanying consolidated balance sheet information as of December 31, 2008, is
fairly stated in all material respects in relation to the consolidated balance sheet from which it
has been derived.
/s/ PricewaterhouseCoopers LLP
Fort
Worth, Texas
October 23, 2009
October 23, 2009
32
Table of Contents
Item 2. Management’s Discussion and Analysis of Financial Condition and Results of Operations.
Management’s discussion and analysis relates to the financial condition and results of
operations of Burlington Northern Santa Fe Corporation and its majority-owned subsidiaries
(collectively BNSF, Registrant or Company). The principal operating subsidiary of BNSF is the BNSF
Railway Company (BNSF Railway) through which BNSF derives substantially all of its revenues. All
earnings per share information is stated on a diluted basis.
Company Overview
Through its subsidiaries, BNSF is engaged primarily in the freight rail transportation
business. BNSF’s primary operating subsidiary, BNSF Railway, operates one of the largest North
American rail networks with about 32,000 route miles in 28 states and two Canadian provinces.
Through its one operating transportation segment, BNSF Railway transports a wide range of products
and commodities including Consumer Products, Coal, Industrial Products and Agricultural Products.
Additional operational information, including weekly intermodal and carload unit reports as
submitted to the Association of American Railroads and annual reports submitted to the Surface
Transportation Board, are available on the Company’s Web site at www.bnsf.com/investors.
Executive Summary
Overview:
| Ø | Quarterly earnings were $1.42 per diluted share, which included a
$0.06 per share impact related to a favorable coal rate case
adjustment. Third-quarter 2008 earnings were $1.99 per diluted
share. |
|
| Ø | Quarterly freight revenues of $3.49 billion were $1.28 billion, or
27 percent lower than third-quarter 2008 revenues of $4.77
billion, and include a $30 million favorable
coal rate case accrual adjustment. The 27-percent decrease in
revenues included a decrease in fuel surcharges of $725 million.
The remaining variance was due to 17 percent lower unit volumes
as a result of the economic downturn, partially offset by improved
yields. |
|
| Ø | Operating expenses of $2.69 billion for the third quarter of 2009
were $1.01 billion, or 27 percent lower than third-quarter 2008
operating expenses of $3.70 billion. About half of the reduction
in operating expenses was due to lower fuel prices, with the
remainder due to strong cost controls and decreased unit volumes. |
33
Table of Contents
Results of Operations
Three Months Ended September 30, 2009, Compared with Three Months Ended September 30, 2008
Revenues Summary
The following table presents BNSF’s revenue information by business group for the three months
ended September 30, 2009 and 2008.
| Revenues | Cars / Units | Average Revenue | ||||||||||||||||||||||
| (in millions) | (in thousands) | Per Car / Unit | ||||||||||||||||||||||
| 2009 | 2008 | 2009 | 2008 | 2009 | 2008 | |||||||||||||||||||
Consumer Products |
$ | 1,087 | $ | 1,686 | 978 | 1,254 | $ | 1,111 | $ | 1,344 | ||||||||||||||
Coal |
940 | 1,047 | 604 | 645 | 1,556 | 1,623 | ||||||||||||||||||
Industrial Products |
747 | 1,124 | 308 | 420 | 2,425 | 2,676 | ||||||||||||||||||
Agricultural Products |
715 | 909 | 247 | 271 | 2,895 | 3,354 | ||||||||||||||||||
Total Freight Revenues |
3,489 | 4,766 | 2,137 | 2,590 | $ | 1,633 | $ | 1,840 | ||||||||||||||||
Other Revenues |
106 | 140 | ||||||||||||||||||||||
Total Operating Revenues |
$ | 3,595 | $ | 4,906 | ||||||||||||||||||||
Fuel Surcharges
Freight revenues include both revenue for transportation services and fuel surcharges. BNSF’s
fuel surcharge program is intended to recover its incremental fuel costs when fuel prices exceed a
threshold fuel price. Fuel surcharges are calculated differently depending on the type of commodity
transported. In certain commodities, fuel surcharge is calculated using a fuel price from a time
period that can be up to 60 days earlier. In a period of volatile fuel prices or changing customer
business mix, changes in fuel expense and fuel surcharge may significantly differ.
The following table presents fuel surcharge and fuel expense information for the three months
ended September 30, 2009 and 2008 (in millions).
| 2009 | 2008 | |||||||
Total fuel expense a |
$ | 606 | $ | 1,349 | ||||
BNSF fuel surcharges |
$ | 312 | $ | 1,037 | ||||
a Total fuel expense includes locomotive and non-locomotive fuel as well as gains and losses from
fuel hedges, which do not impact the fuel surcharge program.
Revenues
Freight revenues for the third quarter of 2009 were $3,489 million, 27 percent lower than the
same 2008 period, on a 17-percent decline in unit volumes resulting from the economic downturn.
Average revenue per car/unit was 11 percent lower in the third quarter of 2009 than the third
quarter of 2008 primarily due to a decrease in fuel surcharges.
34
Table of Contents
Consumer Products
The Consumer Products’ freight business includes a significant intermodal component and
consists of the following three business areas: international intermodal, domestic intermodal and
automotive. Consumer Products revenues of $1,087 million for the third quarter of 2009 were $599 million, or 36 percent less than the third quarter of 2008. This reflects lower international intermodal, domestic intermodal and automotive volumes due to the economy and lower average revenue per unit due primarily to decreased fuel surcharges. |
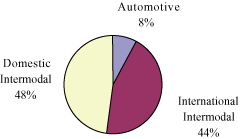 |
Coal
BNSF is one of the largest transporters of low-sulfur coal in the United States. More than 90
percent of all BNSF’s coal tons originate from the Powder River Basin of Wyoming and Montana.
Coal revenues of $940 million for the third quarter of 2009 declined $107 million, or 10
percent, compared with the same 2008 period due to decreased fuel surcharges and lower unit volumes driven by soft demand due to
economic conditions and mild summer weather, partially offset by a $30 million favorable adjustment
to amounts previously accrued related to an unfavorable coal rate case decision in the first
quarter of 2009 (see Note 5 to the Consolidated Financial Statements under the heading “Coal Rate
Case Decision”) and improved yields.
Industrial Products
The Industrial Products’ freight business consists of five business areas: construction
products, building products, petroleum products, chemicals & plastic products and food & beverages. Industrial Products revenues of $747 million for the third quarter of 2009 were $377 million, or 34 percent less than the third quarter of 2008 due to lower unit volumes, driven by lower demand for construction and building products, and decreased fuel surcharges, partially offset by improved yields. |
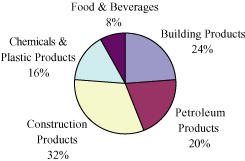 |
|
| Agricultural Products | ||
The Agricultural Products’ freight business transports agricultural products including corn,
wheat, soybeans, bulk foods, ethanol, fertilizer and other products. Agricultural Products revenues of $715 million for the third quarter of 2009 decreased $194 million, or 21 percent, compared with the same 2008 period. This decrease was due mainly to lower fuel surcharges, as well as lower unit volumes predominately due to reduced domestic loadings and international grain shipments. |
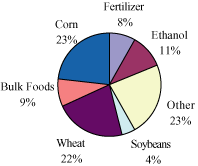 |
|
Other Revenues
Other revenues decreased $34 million, or 24 percent, to $106 million for the third quarter of
2009. The decline was primarily due to a decrease in revenues from BNSF Logistics, which is a
wholly-owned, third-party logistics company, and a decrease in charges for storage costs.
35
Table of Contents
Expenses
Total operating expenses for the third quarter of 2009 were $2,694 million, a decrease of
$1,005 million, or 27 percent, from the same period in 2008.
Compensation and benefits
Compensation and benefits includes expenses for BNSF employee wages, health and welfare,
payroll taxes and other related items. The primary factors influencing the expenses recorded are
volume, headcount, utilization, wage rates, incentives earned during the period, benefit plan
participation and pension expenses.
Compensation and benefits expenses of $872 million in the third quarter of 2009 were $141
million, or 14 percent lower than the same prior year period. This reduction was primarily the
result of decreased volumes, effective cost controls, as well as lower incentive compensation
costs, which cover all non-union and about one quarter of union employees. The average number of
employees decreased 9 percent compared to the third quarter of 2008.
Fuel
Fuel expense is driven by market price, the level of locomotive consumption of diesel fuel and
the effects of hedging activities. Substantially all fuel expense consists of fuel used in
locomotives for transportation services. Fuel expense also includes non-locomotive fuel-related
costs such as fuel used in vehicles (maintenance of way and other vehicles/equipment), fuel used in
refrigerated cars, intermodal facilities’ fuel, and fuel-based products used in servicing
locomotives.
Fuel expenses of $606 million for the third quarter of 2009 were $743 million, or 55 percent
lower than the third quarter of 2008. The decrease in fuel expense was primarily due to a decrease
in the average all-in cost per gallon of locomotive diesel fuel. The average all-in cost per gallon
of locomotive diesel fuel decreased by $1.73 to $1.99, resulting in a $500 million decrease in
expense. The decrease in the average all-in cost reflected a decrease in the average purchase price
per gallon of $1.88, or a $546 million decrease in locomotive fuel expense, offset by an increase
in the hedge loss of 15 cents per gallon, or $46 million (third quarter 2009 loss of $35 million
less third quarter 2008 benefit of $11 million). Locomotive fuel consumption in the third quarter
of 2009 decreased by 59 million gallons to 290 million gallons, when compared with consumption in
the same 2008 period, resulting in a decrease in expense of $221 million. The remainder of the
decrease was primarily due to lower non-locomotive fuel prices.
Purchased services
Purchased services expense includes the following: ramping (lifting of containers onto and off
of rail cars); drayage (highway movements to and from railway facilities); maintenance of
locomotives, freight cars and equipment; transportation costs over other railroads; technology
services outsourcing; professional services; and other contract services provided to BNSF.
Purchased services expense also includes purchased transportation costs for BNSF Logistics. The
expenses are driven by the rates established in the related contracts and the volume of services
required.
Purchased service expenses of $453 million for the third quarter of 2009 were $84 million, or
16 percent lower than the third quarter of 2008. Variable expenses on lower volumes led to
decreased costs in ramping, drayage, locomotive maintenance, car repairs and other volume-related costs.
Depreciation and amortization
Depreciation and amortization expenses for the period are determined by using the group method
of depreciation, which applies a single rate to the gross investment in a particular class of
property. Due to the capital-intensive nature of BNSF’s operations, depreciation expense is a
significant component of the Company’s operating expenses. The full effect of inflation is not
reflected in operating expenses because depreciation is based on historical cost.
Depreciation and amortization expenses of $386 million for the third quarter of 2009 were $37
million, or 11 percent higher than the same period in 2008. This increase in depreciation expense
was primarily due to ongoing capital expenditures.
36
Table of Contents
Equipment rents
Equipment rents expense includes long-term and short-term payments primarily for locomotives,
freight cars, containers and trailers. The expense is driven primarily by volume, lease and rental
rates, utilization of equipment and changes in business mix resulting in equipment usage variances.
Equipment rents expenses of $194 million for the third quarter of 2009 were $35 million, or 15
percent lower than the third quarter of 2008. Improved car velocity, lower volumes and the return
of leased equipment all contributed to the decrease.
Materials and other
Material expenses consist mainly of the costs involved to purchase mechanical and engineering
materials, in addition to other items for maintenance of property and equipment. Other expenses
principally include personal injury claims, environmental remediation and derailments as well as
utilities, locomotive overhauls, property and miscellaneous taxes and employee separation costs.
The total is offset by gains on land sales and insurance recoveries.
Materials and other expenses of $183 million for the third quarter of 2009 were $39 million,
or 18 percent lower than the third quarter of 2008 due largely to lower derailment and personal
injury costs, reduced volumes and effective cost controls.
Interest expense
Interest expense of $127 million for the third quarter of 2009 was $5 million, or 4 percent
higher than the third quarter of 2008. This increase was primarily attributable to a higher average
debt balance, partially offset by a decrease to interest expense of $1 million related to a
favorable coal rate case adjustment (see Note 5 to the Consolidated Financial Statements under the
heading “Coal Rate Case Decision”) in the third quarter of 2009. Favorable tax settlements impacted
interest expense for both of the third quarters ended September 30, 2009 and 2008.
Income taxes
The effective tax rate for the three months ended September 30, 2009, was 36.9 percent
compared with 35.6 percent for the same prior year period. Favorable tax settlements impacted both
of the third quarters ended September 30, 2009 and 2008.
Nine Months Ended September 30, 2009, Compared with Nine Months Ended September 30, 2008
Revenues Summary
The following table presents BNSF’s revenue information by business group for the nine months
ended September 30, 2009 and 2008.
| Revenues | Cars / Units | Average Revenue | ||||||||||||||||||||||
| (in millions) | (in thousands) | Per Car / Unit | ||||||||||||||||||||||
| 2009 | 2008 | 2009 | 2008 | 2009 | 2008 | |||||||||||||||||||
Consumer Products |
$ | 3,176 | $ | 4,643 | 2,912 | 3,655 | $ | 1,091 | $ | 1,270 | ||||||||||||||
Coal |
2,678 | 2,903 | 1,820 | 1,868 | 1,471 | 1,554 | ||||||||||||||||||
Industrial Products |
2,152 | 3,109 | 888 | 1,245 | 2,423 | 2,497 | ||||||||||||||||||
Agricultural Products |
2,012 | 2,603 | 686 | 817 | 2,933 | 3,186 | ||||||||||||||||||
Total Freight Revenues |
10,018 | 13,258 | 6,306 | 7,585 | $ | 1,589 | $ | 1,748 | ||||||||||||||||
Other Revenues |
317 | 387 | ||||||||||||||||||||||
Total Operating Revenues |
$ | 10,335 | $ | 13,645 | ||||||||||||||||||||
37
Table of Contents
Fuel Surcharges
The following table presents fuel surcharge and fuel expense information for the nine months
ended September 30, 2009 and 2008 (in millions).
| 2009 | 2008 | |||||||
Total fuel expense a |
$ | 1,729 | $ | 3,685 | ||||
BNSF fuel surcharges |
$ | 859 | $ | 2,500 | ||||
a Total fuel expense includes locomotive and non-locomotive fuel as well as gains and losses from
fuel hedges, which do not impact the fuel surcharge program.
Revenues
Freight revenues for the first nine months of 2009 were $10,018 million, 24 percent lower than
the same 2008 period, on a 17-percent decline in unit volumes resulting from the economic downturn.
Average revenue per car/unit was 9 percent lower in the first nine months of 2009 than the first
nine months of 2008 primarily due to a decrease in fuel surcharges.
Consumer Products
Consumer Products revenues of $3,176 million for the first nine months of 2009 were $1,467
million, or 32 percent less than the first nine months of 2008. This reflects lower international
intermodal, domestic intermodal and automotive volumes due to the economy and a reduction in
average revenue per unit due primarily to lower fuel surcharges.
Coal
Coal revenues of $2,678 million for the first nine months of 2009 declined $225 million, or 8
percent, compared with the same 2008 period. The decline was due to decreased fuel surcharges,
lower unit volumes and a $66 million loss in excess of amounts previously accrued related to the
unfavorable coal rate case decision during the first quarter of 2009 (see Note 5 to the
Consolidated Financial Statements under the heading “Coal Rate Case Decision.”) These declines were
partially offset by improved yields from renewed contracts and a $22 million favorable coal rate
case decision during the second quarter of 2009.
Industrial Products
Industrial Products revenues of $2,152 million for the first nine months of 2009 were $957
million, or 31 percent less than the first nine months of 2008 due to lower unit volumes, driven
primarily by decreased demand for construction and building products, and lower fuel surcharges,
partially offset by improved yields.
Agricultural Products
Agricultural Products revenues of $2,012 for the first nine months of 2009 decreased $591
million, or 23 percent. This decrease was due mainly to lower fuel surcharges, as well as lower
unit volumes predominately due to reduced domestic loadings and international grain shipments,
partially offset by improved yields.
Other Revenues
Other revenues decreased $70 million, or 18 percent, to $317 million for the first nine months
of 2009. The decline was primarily due to a decrease in revenues from BNSF Logistics, which is a
wholly-owned, third-party logistics company, and a decrease in charges for storage costs.
38
Table of Contents
Expenses
Total operating expenses for the first nine months of 2009 were $7,968 million, a decrease of
$2,881 million, or 27 percent, from the same period in 2008.
Compensation and benefits
Compensation and benefits expenses of $2,564 million in the first nine months of 2009 were
$383 million, or 13 percent lower than the same prior year period. This reduction was primarily the
result of decreased volumes, effective cost controls, as well as lower incentive compensation
costs, which cover all non-union and about one quarter of union employees. The average number of
employees decreased 8 percent compared to the same 2008 period.
Fuel
Fuel expenses of $1,729 million for the first nine months of 2009 were $1,956 million, or 53
percent lower than the first nine months of 2008. The decrease in fuel expense was primarily due to
a decrease in the average all-in cost per gallon of locomotive diesel fuel. The average all-in cost
per gallon of locomotive diesel fuel decreased by $1.50 to $1.83, resulting in a $1,340 million
decrease in expense. The decrease in the average all-in cost reflected a decrease in the average
purchase price per gallon of $1.75, or a $1,569 million decrease in locomotive fuel expense, offset
by an increase in the hedge loss of 25 cents per gallon, or $229 million (first nine months 2009
loss of $185 million less first nine months 2008 benefit of $44 million). Locomotive fuel
consumption for the first nine months of 2009 decreased by 168 million gallons to 900 million
gallons, when compared with consumption in the same 2008 period, resulting in a decrease in expense
of $566 million. The remainder of the decrease was primarily due to lower non-locomotive fuel
prices.
Purchased services
Purchased service expenses of $1,396 million for the first nine months of 2009 were $204
million, or 13 percent lower than the first nine months of 2008. Variable expenses on lower volumes
led to decreased costs in ramping, drayage, car repairs and other volume related costs.
Depreciation and amortization
Depreciation and amortization expenses of $1,135 million for the first nine months of 2009
were $96 million, or 9 percent higher than the same period in 2008. This increase in depreciation
expense was primarily due to capital expenditures and due to updated depreciation rates that went
into effect in April 2008 for other roadway property, which includes items such as bridges, office
buildings and facilities, telecommunication and information technology systems and machinery.
Equipment rents
Equipment rents expenses of $591 million for the first nine months of 2009 were $91 million,
or 13 percent lower than the first nine months of 2008. Improved car velocity, lower volumes and
the return of leased equipment all contributed to the decrease.
Materials and other
Materials and other expenses of $553 million for the first nine months of 2009 were $343
million or 38 percent lower than the first nine months of 2008 due largely to expenses in
connection with environmental matters in Montana during the second quarter of 2008, lower
derailment and personal injury costs, reduced volumes and effective cost controls.
39
Table of Contents
Interest expense
Interest expense of $462 million for the first nine months of 2009 was $66 million, or 17
percent higher than the first nine months of 2008. This increase was primarily attributable to a
net $32 million loss for terminated treasury locks (see Note 2 to the Consolidated Financial
Statements). The unfavorable coal rate case decision further increased interest expense by $8
million (see Note 5 to the Consolidated Financial Statements under the heading “Coal Rate Case
Decision”). The remainder of the increase was primarily due to a higher average debt balance.
Favorable tax settlements impacted interest expense for both of the nine month periods ended
September 30, 2009 and 2008.
Income taxes
The effective tax rate for the nine months ended September 30, 2009, was 37.6 percent compared
with 37.2 percent for the same prior year period. Favorable tax settlements impacted both of the
nine month periods ended September 30, 2009 and 2008.
Liquidity and Capital Resources
Liquidity is a company’s ability to generate cash flows to satisfy current and future
obligations. Cash generated from operations is BNSF’s principal source of liquidity. BNSF generally
funds any additional liquidity requirements through debt issuance, including commercial paper,
through leasing of assets and through the sale of a portion of its accounts receivable.
Operating Activities
Net cash provided by operating activities was $2,638 million for the nine months ended
September 30, 2009, compared with $3,303 million for the nine months ended September 30, 2008. The
decrease was primarily the result of a decrease in earnings before depreciation and amortization
expense, environmental related matters in Montana during the second quarter of 2008 and changes in
working capital.
Investing Activities
Net cash used for investing activities was $2,119 million for the nine months ended September
30, 2009, compared with $2,381 million for the nine months ended September 30, 2008. The decrease
in cash used for investing activities is related to higher proceeds from the sale of equipment
financed, in addition to a $96 million decrease in capital expenditures. The following table
presents a breakdown of capital expenditures for the nine months ended September 30, 2009 and 2008
(in millions):
| Nine Months Ended September 30, | 2009 | 2008 | |||||
Engineering |
$ | 1,358 | $ | 1,220 | |||
Mechanical |
86 | 116 | |||||
Other |
88 | 87 | |||||
Total replacement capital |
1,532 | 1,423 | |||||
Information services |
59 | 71 | |||||
Terminal and line expansion |
78 | 210 | |||||
Total capital expenditures excluding equipment |
$ | 1,669 | $ | 1,704 | |||
Acquisition of equipment |
$ | 615 | $ | 676 | |||
Acquisition of equipment includes the acquisition of locomotives, freight cars and other
equipment, some or all of which may be sold and leased back by the Company through either an
operating or capital lease. The cash received from any such sale-leaseback transaction is included
in proceeds from sale of equipment financed in the Consolidated Statements of Cash Flows.
40
Table of Contents
Financing Activities
Nine Months Ended September 30, 2009
Net cash provided by financing activities during the first nine months of 2009 was $9
million, primarily related to net debt borrowings of $352 million, proceeds from a facility
financing obligation of $51 million, proceeds from stock options exercised of $26 million and
excess tax benefits from equity compensation plans of $18 million, partially offset by dividend
payments of $409 and common stock repurchases to satisfy tax withholding obligations for stock
option exercises of $15 million.
Aggregate debt due to mature within one year was $323 million. BNSF’s ratio of net debt to
total capitalization was 42.9 percent at September 30, 2009, compared with 44.5 percent at December
31, 2008. The Company’s adjusted net debt to total capitalization was 52.4 percent at September 30,
2009, compared with 54.7 percent at December 31, 2008. BNSF’s adjusted net debt to total
capitalization is a non-GAAP measure and should be considered in addition to, but not as a
substitute for or preferable to, the information prepared in accordance with GAAP. However,
management believes that adjusted net debt to total capitalization provides meaningful additional
information about the ability of BNSF to service long-term debt and other fixed obligations and to
fund future growth.
The following table presents a reconciliation of the calculation of adjusted net debt to total
capitalization percentage:
| September 30, | December 31, | |||||||
| 2009 | 2008 | |||||||
Net debt to total capitalization a |
42.9 | % | 44.5 | % | ||||
Adjustment for long-term operating leases and other debt equivalents b |
9.1 | 9.7 | ||||||
Adjustment for unfunded pension and retiree health and welfare liability |
1.4 | 1.5 | ||||||
Adjustment for junior subordinated notes c |
(1.0 | ) | (1.0 | ) | ||||
Adjusted net debt to total capitalization |
52.4 | % | 54.7 | % | ||||
| a | Net debt to total capitalization is calculated as total debt (long-term debt plus long-term debt due within one year) less cash and cash equivalents divided by the sum of
net debt and total stockholders’ equity. |
| b | Primarily represents an adjustment for the net present value of future operating lease commitments. |
| c | Junior subordinated notes are included in total debt on the respective Consolidated Balance Sheets; however, as they include certain equity characteristics, they have been
assigned 50 percent equity credit for purposes of this calculation. |
In September 2009, BNSF issued $750 million of 4.7 percent notes due October 1, 2019. The net
proceeds from the sale of the notes are being used for general corporate purposes which may
include, but are not limited to, working capital, capital expenditures, repurchase of common stock
pursuant to the share repurchase program, and repayment of outstanding indebtedness.
At September 30, 2009, $750 million remained authorized by the Board of Directors to be issued
through a SEC debt shelf registration statement.
In July 2009, BNSF Railway entered into an 18-year equipment obligation totaling $75 million
to finance locomotives and railcars.
During the first nine months of 2009, BNSF entered into a 12-year capital lease to finance
$368 million of locomotives and freight cars. Additionally, BNSF entered into capital leases
totaling $96 million to finance maintenance of way and other vehicles and equipment with lease
terms of three to seven years.
In 2005, the Company commenced the construction of an intermodal facility that it intended to
sell to a third party and subsequently lease back. As of September 30, 2009, construction of the
facility was completed for a cost of approximately $160 million. All improvements have been sold to
the third party and BNSF leased the facility from the third party for 20 years. This sale leaseback
transaction was accounted for as a financing obligation due to continuing involvement. The outflows
from the construction of the facility were classified as investing activities, and the inflows from
the associated financing proceeds were classified as financing activities in the Company’s
Consolidated Statements of Cash Flows.
41
Table of Contents
Nine Months Ended September 30, 2008
Net cash used for financing activities during the first nine months of 2008 was $776 million,
primarily related to common stock repurchases of $878 million, including $60 million to satisfy tax
withholding obligations for stock option exercises, and dividend payments of $334 million, which
were partially offset by net debt borrowings of $215 million, excess tax benefits from equity
compensation plans of $90 million, proceeds from stock options exercised of $87 million and
proceeds from a facility financing obligation of $50 million.
Dividends
Common stock dividends declared for the nine months ended September 30, 2009 and 2008 were
$1.20 and $1.04 per share, respectively. Dividends paid on common stock during the first nine
months of 2009 and 2008 were $409 million and $334 million, respectively. On July 23, 2009, the
Board declared a quarterly dividend of $0.40 per share on outstanding shares of common stock,
payable October 1, 2009 to shareholders of record on September 10, 2009. On October 22, 2009, the
Board declared a quarterly dividend of $0.40 per share on outstanding shares of common stock,
payable January 4, 2010 to shareholders of record on December 14, 2009.
Share Repurchase Program
BNSF did not repurchase shares related to its share repurchase program during the first nine
months of 2009. Program-to-date repurchases through September 30, 2009, were 192 million shares at
an average price of $41.53 per share, leaving 18 million shares available for repurchase out of the
210 million shares authorized. During the nine months ended September 30, 2009, the Company
acquired shares from employees at a cost of $15 million to satisfy tax withholding obligations.
Long-Term Debt and Other Obligations
The Company’s business is capital intensive. BNSF has historically generated a significant
amount of cash from operating activities, which it uses to fund capital additions, service debt,
repurchase shares and pay dividends. Additionally, the Company relies on access to the debt and
leasing markets to finance a portion of capital additions on a long-term basis.
In the third quarter of 2009, BNSF took delivery of 73 locomotives under a long-term
commitment. At September 30, 2009, BNSF’s remaining commitment was to acquire 595 locomotives by
2013.
In connection with a transaction entered into in 2006, as amended, BNSF has remaining railcar
purchase obligations for 837 covered hopper cars through 2010.
The locomotives and freight cars under these agreements have been or are expected to be
financed from one or a combination of sources including, but not limited to, cash from operations,
capital or operating leases, and debt issuances. The decision on the method used for a particular
acquisition financing will depend on market conditions and other factors at that time.
In the normal course of business, the Company enters into long-term contracts for future goods
and services needed for the operations of the business. Such commitments are not in excess of
expected requirements and are not reasonably likely to result in performance penalties or payments
that would have a material adverse effect on the Company’s liquidity.
Credit Agreement
Information concerning the Company’s outstanding commercial paper balances and revolving
credit agreement is incorporated by reference from Note 4 to the Consolidated Financial Statements.
42
Table of Contents
Off-Balance Sheet Arrangements
Sale of Accounts Receivable
The accounts receivable sales program of Santa Fe Receivables Corporation, as described in
Note 3 to the Consolidated Financial Statements, includes thresholds for dilution, delinquency and
write-off ratios that, if exceeded, would allow the investors participating in this program, at
their option, to cancel the program. These provisions include a maximum debt-to-capital test, which
is the same as in BNSF’s revolving credit agreements. At September 30, 2009, BNSF Railway was in
compliance with these provisions.
The accounts receivable sales program provides efficient financing at a competitive interest
rate as compared with traditional borrowing arrangements and provides diversification of funding
sources. Since the funding is collateralized by BNSF receivables, the risk of exposure is only as
great as the risk of default on these receivables (see Note 3 to the Consolidated Financial
Statements for additional information). See Note 10 to the Consolidated Financial Statements for
information about recent accounting pronouncements that will have an impact on the A/R sales
program upon adoption.
Guarantees
The Company acts as guarantor for certain debt and lease obligations of others. During the
past few years, the Company has primarily utilized guarantees to allow third-party entities to
obtain favorable terms to finance the construction of assets that will benefit the Company.
Additionally, in the ordinary course of business, BNSF enters into agreements with third parties
that include indemnification clauses. The Company does not expect performance under these
guarantees or indemnities to have a material adverse effect on the Company’s liquidity in the
foreseeable future (see Note 4 to the Consolidated Financial Statements for additional
information).
Other Matters
Hedging Activities
The Company uses derivatives to hedge against increases in diesel fuel prices and interest
rates as well as to convert a portion of its fixed-rate long-term debt to floating-rate debt. The
Company does not hold or issue derivative financial instruments for trading or speculative
purposes. The Company formally documents the relationship between the hedging instrument and the
hedged item, as well as the risk management objective and strategy for the use of the hedging
instrument. This documentation includes linking the derivatives that are designated as fair value
or cash flow hedges to specific assets or liabilities on the balance sheet, commitments or
forecasted transactions. The Company assesses at the time a derivative contract is entered into,
and at least quarterly thereafter, whether the derivative item is effective in offsetting the
changes in fair value or cash flows. Any change in fair value resulting from ineffectiveness, as
defined by authoritative accounting guidance related to derivatives and hedging, is recognized in
current period earnings. For derivative instruments that are designated and qualify as cash flow
hedges, the effective portion of the gain or loss on the derivative instrument is recorded in
accumulated other comprehensive loss (AOCL) as a separate component of stockholders’ equity and
reclassified into earnings in the period during which the hedge transaction affects earnings. Cash
flows related to fuel and interest rate derivatives are classified as operating activities in the
Consolidated Statements of Cash Flows.
BNSF monitors its hedging positions and credit ratings of its counterparties and does not
anticipate losses due to counterparty nonperformance. As of September 30, 2009, BNSF’s
counterparties have credit ratings of A2/A or higher.
Fuel
BNSF measures the fair value of fuel hedges from data provided by various external
counterparties. The Company uses the forward commodity price for the periods hedged to value its
fuel-hedge swaps and costless collars. This methodology is a market approach, which under
authoritative accounting guidance related to fair value measurements utilizes Level 2 inputs as it
uses market data for similar instruments in active markets. Certain of the Company’s fuel-hedge
instruments are covered by an agreement which includes a provision such that the Company either
receives or posts cash collateral if the fair value of the instruments exceeds a certain net asset
or net liability threshold, respectively. Further information on BNSF’s fuel hedging program is
incorporated by reference from Note 2 to the Consolidated Financial Statements.
43
Table of Contents
Interest Rate
From time to time, the Company enters into various interest rate hedging transactions for the
purpose of managing exposure to fluctuations in interest rates by establishing rates in
anticipation of both future debt issuances and the refinancing of leveraged leases, as well as
converting a portion of its fixed-rate long-term debt to floating-rate debt. The Company uses
interest rate swaps and treasury locks as part of its interest rate risk management strategy.
BNSF’s measurement of the fair value of interest rate derivatives is based on estimates of the
mid-market values for the transactions provided by the counterparties to these agreements. This
methodology is a market approach, which under authoritative accounting guidance related to fair
value measurements utilizes Level 2 inputs as it uses market data for similar instruments in active
markets. Further information on BNSF’s interest hedging program is incorporated by reference from
Note 2 to the Consolidated Financial Statements.
Employee and Labor Relations
A significant majority of BNSF Railway’s employees are union-represented. Final agreements
were reached in the most recent bargaining round covering 100 percent of BNSF’s unionized
workforce. These agreements resolved all wage, work rule and benefit issues through December 31,
2009, and will remain in effect until new agreements are reached in the next bargaining round or
the Railway Labor Act’s procedures (which include mediation, cooling-off periods and the
possibility of U.S. Presidential intervention) are exhausted. The next bargaining round will begin
November 1, 2009.
Accounting Pronouncements
See Note 10 to the Consolidated Financial Statements for information about recent accounting
pronouncements that will have an impact on BNSF.
Forward-Looking Information
To the extent that statements made by the Company relate to the Company’s future economic
performance or business outlook, projections or expectations of financial or operational results,
or refer to matters that are not historical facts, such statements are “forward-looking” statements
within the meaning of the federal securities laws. These forward-looking statements include, but
are not limited to, statements regarding:
| • | Expectations as to operating results, such as revenues and earnings per share; |
||
| • | Expectations as to the effect on the Company’s financial condition of claims,
litigation, environmental and personal injury costs, commitments, contingent liabilities,
U.S. Surface Transportation Board and other governmental and regulatory investigations
and proceedings, and changes in the economic laws and regulations applicable to the rail
industry; |
||
| • | Plans and goals for future operational improvements and capital commitments; and |
||
| • | Current or future volatility in the credit market and future market conditions or economic
performance. |
Forward-looking statements involve a number of risks and uncertainties, and actual performance
or results may differ materially. For a discussion of material risks and uncertainties that the
Company faces, see the discussion in the Annual Report on Form 10-K titled “Risk Factors.”
Important factors that could cause actual results to differ materially include, but are not limited
to, the following:
44
Table of Contents
• Economic and industry conditions: material adverse changes in economic or industry
conditions, both in the United States and globally, volatility in the capital or credit markets
including changes affecting the timely availability and cost of capital, changes in customer
demand, effects of adverse economic conditions affecting shippers or BNSF’s supplier base and in
the industries and geographic areas that produce and consume freight, changes in demand due to more
stringent regulatory policies such as the regulation of carbon dioxide emissions that could reduce
the demand for coal or governmental tariffs or subsidies that could affect the demand for grain,
competition and consolidation within the transportation industry, the extent to which BNSF is
successful in gaining new long-term relationships with customers or retaining existing ones, level
of service failures that could lead customers to use competitors’ services, changes in fuel prices
and other key materials and disruptions in supply chains for these materials, increased customer
bankruptcies, closures or slowdowns, and changes in crew availability, labor costs and labor
difficulties, including stoppages affecting either BNSF’s operations or customers’ abilities to
deliver goods to BNSF for shipment;
• Legal, legislative and regulatory factors: developments and changes in laws and regulations,
including those affecting train operations or the marketing of services, the ultimate outcome of
shipper and rate claims subject to adjudication or claims, investigations or litigation alleging
violations of the antitrust laws, increased economic regulation of the rail industry through
legislative action and revised rules and standards applied by the U.S. Surface Transportation Board
in various areas including rates and services, other more general legislative actions, developments
in environmental investigations or proceedings with respect to rail operations or current or past
ownership or control of real property or properties owned by others impacted by BNSF Railway
operations, and developments in and losses resulting from other types of claims and litigation,
including those relating to personal injuries, asbestos and other occupational diseases, the
release of hazardous materials, environmental contamination and damage to property; the
availability of adequate insurance to cover the risks associated with operations; and
• Operating factors: technical difficulties, changes in operating conditions and costs,
changes in business mix, the availability of equipment and human resources to meet changes in
demand, the extent of the Company’s ability to achieve its operational and financial initiatives
and to contain costs in response to changes in demand and other factors, the effectiveness of steps
taken to maintain and improve operations and velocity and network fluidity, operational and other
difficulties in implementing positive train control technology, restrictions on development and
expansion plans due to environmental concerns, constraints due to the nation’s aging
infrastructure, disruptions to BNSF’s technology network including computer systems and software,
as well as natural events such as severe weather, fires, floods and earthquakes or man-made or
other disruptions of BNSF Railway’s operating systems, structures, or equipment including the
effects of acts of terrorism on the Company’s system or other railroads’ systems or other links in
the transportation chain.
The Company cautions against placing undue reliance on forward-looking statements, which
reflect its current beliefs and are based on information currently available to it as of the date a
forward-looking statement is made. The Company undertakes no obligation to revise forward-looking
statements to reflect future events, changes in circumstances, or changes in beliefs. In the event
the Company does update any forward-looking statement, no inference should be made that the Company
will make additional updates with respect to that statement, related matters, or any other
forward-looking statements. Any corrections or revisions and other important assumptions and
factors that could cause actual results to differ materially from forward-looking statements made
by the Company may appear in the Company’s public filings with the SEC, which are accessible at
www.sec.gov, and on the Company’s Web site at www.bnsf.com, and which investors are advised to
consult.
45
Table of Contents
Item 3. Quantitative and Qualitative Disclosures About Market Risk.
In the ordinary course of business, BNSF utilizes various financial instruments that
inherently have some degree of market risk. The following table summarizes the impact of these
hedging activities on the Company’s results of operations (in millions):
Three Months Ended September 30, |
2009 | 2008 | ||||||
Fuel hedge (loss) benefit (including ineffective portion of unexpired hedges) |
$ | (35 | ) | $ | 11 | |||
Interest rate hedge benefit
|
5 | 4 | ||||||
Total hedge and derivative (loss) benefit |
(30 | ) | 15 | |||||
Tax effect |
11 | (6 | ) | |||||
Hedge and derivative (loss) benefit, net of tax |
$ | (19 | ) | $ | 9 | |||
Nine Months Ended September 30, |
2009 | 2008 | ||||||
Fuel hedge (loss) benefit (including ineffective portion of unexpired hedges) |
$ | (185 | ) | $ | 44 | |||
Interest rate hedge benefit |
15 | 8 | ||||||
Interest rate derivative loss |
(32 | ) | – | |||||
Total hedge and derivative (loss) benefit |
(202 | ) | 52 | |||||
Tax effect |
77 | (20 | ) | |||||
Hedge and derivative (loss) benefit, net of tax |
$ | (125 | ) | $ | 32 | |||
The Company’s fuel-hedge loss was due to decreases in average fuel prices subsequent to the
initiation of various hedges and through their termination. The interest rate hedge benefit was the
result of lower interest rates. The interest rate derivative loss was related to terminated
treasury locks (see Note 2 to the Consolidated Financial Statements). The information presented in
the Management’s Discussion and Analysis of Financial Condition and Results of Operations section
and Notes 2 and 4 to the Consolidated Financial Statements describes significant aspects of BNSF’s
financial instrument activities that have a material market risk. Additionally, the Company uses
fuel surcharges, which it believes substantially mitigates the risk of fuel price volatility.
Commodity Price Sensitivity
BNSF engages in hedging activities to partially mitigate the risk of fluctuations in the price
of its diesel fuel purchases. Existing hedge transactions as of September 30, 2009, are based on
the front month settlement prices of New York Mercantile Exchange (NYMEX) #2 heating oil (HO), West
Texas Intermediate (WTI) crude oil, or the HO refining spread (HO-WTI), which is the difference
between HO and WTI. A WTI hedge combined with a HO-WTI hedge will result in the equivalent of a HO
hedge. For swaps, BNSF either pays or receives the difference between the hedge price and the
actual average price of the hedge commodity during a specified determination period for a specified
number of gallons. For costless collars, if the average hedge commodity price for a specified
determination period is greater than the cap price, BNSF receives the difference for a specified
number of gallons. If the average commodity price is less than the floor price, BNSF pays the
difference for a specified number of gallons. If the commodity price is between the floor price and
the cap price, BNSF neither makes nor receives a payment. Hedge transactions are generally settled
with the counterparty in cash. Based on historical information, BNSF believes there is a
significant correlation between the market prices for diesel fuel, HO and WTI.
At September 30, 2009, BNSF had recorded a net fuel-hedging liability of $116 million for fuel
hedges covering 2009 through 2012.
46
Table of Contents
The following table is an estimate of the impact to earnings that could result from
hypothetical price changes during the twelve-month period ending September 30, 2010, and the
balance sheet impact from the hypothetical price changes on all open hedges, both based on the
Company’s hedge position at September 30, 2009:
| Sensitivity Analysis | ||||
| Hedged commodity | Fuel-hedge annual pre-tax | Balance Sheet impact of change | ||
| price change | earnings impact | in fuel-hedge fair value | ||
10-percent increase
|
$45 million increase | $114 million increase | ||
| 10-percent decrease | $52 million decrease | $113 million decrease | ||
Based on locomotive fuel consumption during the twelve-month period ending September 30, 2009,
of 1,247 million gallons and fuel prices during that same period, excluding the impact of the
Company’s hedging activities, a 10-percent increase or decrease in the commodity price per gallon
would result in an approximate $203 million increase or decrease, respectively, in fuel expense
(pre-tax) on an annual basis. Additionally, the Company uses fuel surcharges, which it believes
substantially mitigates the risk of fuel price volatility.
At September 30, 2009, BNSF maintained fuel inventories for use in normal operations, which
were not material to BNSF’s overall financial position and, therefore, represent no significant
market exposure. The frequency of BNSF’s fuel inventory turnover also reduces market exposure,
should fuel inventories become material to BNSF’s overall financial position. Further information
on fuel hedges is incorporated by reference from Note 2 to the Consolidated Financial Statements.
Interest Rate Sensitivity
From time to time, BNSF enters into various interest rate hedging transactions for purposes of
managing exposure to fluctuations in interest rates by establishing rates in anticipation of both
future debt issuances and the refinancing of leveraged leases, as well as to convert a portion of
its fixed-rate long-term debt to floating-rate debt. These interest rate hedges are accounted for
as cash flow or fair value hedges. BNSF’s measurement of the fair value of these hedges is based on
estimates of the mid-market values for the transactions provided by the counterparties to these
agreements.
At September 30, 2009, the fair value of BNSF’s debt, excluding capital leases and a net fair
value interest rate hedge benefit of $41 million, was $9,578 million.
The following table is an estimate of the impact to earnings and the fair value of the total
debt, excluding capital leases, and interest rate hedges that could result from hypothetical
interest rate changes during the twelve-month period ending September 30, 2010, based on debt
levels and outstanding hedges as of September 30, 2009:
| Sensitivity Analysis | ||||||
| Floating rate debt - | ||||||
| Hypothetical change | Annual pre-tax earnings | Change in fair value | ||||
| in interest rates | impact | Total debta | Interest rate hedges | |||
| 1-percent decrease | $7 million increase | $869 million increase | $35 million increase | |||
| 1-percent increase | $7 million decrease | $745 million decrease | $32 million decrease | |||
a Excludes the impact of interest rate hedges.
Further information on interest rate hedges is incorporated by reference from Note 2 to the
Consolidated Financial Statements. Information on the Company’s debt, which may be sensitive to
interest rate fluctuations, is incorporated by reference from Note 4 to the Consolidated Financial
Statements.
47
Table of Contents
Item 4. Controls and Procedures.
Based on their evaluation as of the end of the period covered by this quarterly report on Form
10-Q, BNSF’s principal executive officer and principal financial officer have concluded that BNSF’s
disclosure controls and procedures (as defined in Rules 13a-15(e) and 15d-15(e) of the Securities
Exchange Act of 1934) are effective to ensure that information required to be disclosed by BNSF in
the reports that it files or submits under the Securities Exchange Act of 1934 is recorded,
processed, summarized, and reported within the time periods specified in Securities and Exchange
Commission rules and forms and that such information is accumulated and communicated to BNSF’s
management, including its principal executive and principal financial officers, as appropriate to
allow timely decisions regarding required disclosure. As discussed below, management effected
changes in BNSF’s internal control over financial reporting that occurred during BNSF’s third
fiscal quarter that have materially affected, or are reasonably likely to materially affect, BNSF’s
internal control over financial reporting. There were no other changes in BNSF’s internal control
over financial reporting that occurred during BNSF’s third fiscal quarter that have materially
affected, or are reasonably likely to materially affect, BNSF’s internal control over financial
reporting.
In July 2009, the Company implemented a new Enterprise Resource Planning (ERP) system. The
implementation of this new ERP system involved changes to the Company’s procedures for internal
control over financial reporting. The Company followed a system implementation life cycle process
that required pre-implementation planning, design and testing. The Company conducted
post-implementation monitoring, testing and process modifications to ensure the effectiveness of
internal control over financial reporting. The Company does not believe that this ERP system
implementation had an adverse effect on the Company’s internal control over financial reporting.
48
Table of Contents
BURLINGTON NORTHERN SANTA FE CORPORATION and SUBSIDIARIES
PART II OTHER INFORMATION
Item 1. Legal Proceedings
Reference is made to the Company’s Form 10-Q for the quarter ending March 31, 2009, with
respect to the February 17, 2009 decision of the United States Surface Transportation Board (STB)
in Western Fuels Association, Inc. and Basin Electric Power Cooperative v. BNSF Railway Company,
STB Docket No. 42088), and BNSF Railway Company’s appeal of this STB decision to the United States
Court of Appeals for the District of Columbia Circuit (Western Fuels Association, Inc. and Basin
Electric Power Cooperative v. Surface Transportation Board and United States of America,
Consolidated Docket Nos. 08-1167 and 09-1092). For information relating to these matters, see Note
5, Commitments and Contingencies under Part I, Item 1 of this Quarterly Report on Form 10-Q.
Item 2. Unregistered Sales of Equity Securities and Use of Proceeds.
Common Stock Repurchases
The following table presents repurchases by the Company of its common stock for each of the
three months for the quarter ended September 30, 2009 (shares in thousands):
| Issuer Purchases of Equity Securities | ||||||||||||||||
| Total Number of | Maximum Number | |||||||||||||||
| Shares Purchased | of Shares that May | |||||||||||||||
| Total Number | Average | as Part of Publicly | Yet Be Purchased | |||||||||||||
| of Shares | Price Paid | Announced Plans | Under the Plans or | |||||||||||||
| Period | Purchaseda | Per Share | or Programsb | Programsb | ||||||||||||
July 1 – 31 |
34 | $ | 77.67 | – | 17,816 | |||||||||||
August 1 – 31 |
3 | $ | 83.41 | – | 17,816 | |||||||||||
September 1 –
30 |
– | $ | – | – | 17,816 | |||||||||||
Total |
37 | $ | 78.17 | – | ||||||||||||
| a | Total number of shares purchased includes 37 thousand shares where employees delivered already owned shares or used an attestation procedure to satisfy the exercise price of stock options or the withholding of tax payments. Total number of shares purchased does not include 36 thousand shares acquired from employees to satisfy tax withholding obligations that arose on the vesting of restricted stock or the exercise of stock options. | |
| b | On July 17, 1997, the Board initially authorized and the Company announced the repurchase of up to 30 million shares of the Company’s common stock from time to time in the open market. On December 9, 1999, April 20, 2000, September 21, 2000, January 16, 2003, December 8, 2005 and February 14, 2007, the Board authorized and the Company announced extensions of the BNSF share repurchase program, adding 30 million shares at each date for a total of 210 million shares authorized. The share repurchase program does not have an expiration date. |
Item 6. Exhibits.
See Index to Exhibits on page E-1 for a description of the exhibits filed as part of this
report.
49
Table of Contents
SIGNATURES
Pursuant to the requirements of the Securities Exchange Act of 1934, the registrant has duly
caused this report to be signed on its behalf by the undersigned thereunto duly authorized.
| BURLINGTON NORTHERN SANTA FE CORPORATION | |||||
| (Registrant) | |||||
| By: | /s/ Thomas N. Hund | ||||
| Thomas N. Hund Executive Vice President and Chief Financial Officer (On behalf of the Registrant and as principal financial officer) |
|||||
Dated:
October 23, 2009
S-1
Table of Contents
BURLINGTON NORTHERN SANTA FE CORPORATION and SUBSIDIARIES
Exhibit Index
| Incorporated by Reference | ||||||||||||||||
| (if applicable) | ||||||||||||||||
| Exhibit Number and Description | Form | File Date | File No. | Exhibit | ||||||||||||
| 3.1 | Amended and Restated Certificate of Incorporation
of Burlington Northern Santa Fe Corporation, dated
December 21, 1994, as amended. |
10-Q | 8/13/1998 | 001-11535 | 3.1 | |||||||||||
| 3.2 | By-Laws of Burlington Northern Santa Fe
Corporation, as amended and restated, dated
December 11, 2008. |
8-K | 12/12/2008 | 001-11535 | 3.2 | |||||||||||
| 4.1 | Fourth Supplemental Indenture, dated as of
September 24, 2009, to Indenture dated as of
December 1, 1995, between Burlington Northern
Santa Fe Corporation and The Bank of New York
Trust Company, N.A., as Trustee, including the
form of BNSF’s 4.700% Notes due October 1, 2019. |
8-K | 09/24/2009 | 001-11535 | 4.1 | |||||||||||
| 4.2 | Certificate of Determination as to the terms of
BNSF’s 4.700% Notes due October 1, 2019. |
8-K | 09/24/2009 | 001-11535 | 4.2 | |||||||||||
| 12.1 | Computation
of Ratio of Earnings to Fixed Charges.* |
|||||||||||||||
| 15.1 | Independent Registered Public Accounting Firm’s
Awareness Letter.* |
|||||||||||||||
| 31.1 | Principal Executive Officer’s Certifications
Pursuant to Section 302 of the Sarbanes-Oxley Act
of 2002.* |
|||||||||||||||
| 31.2 | Principal Financial Officer’s Certifications
Pursuant to Section 302 of the Sarbanes-Oxley Act
of 2002.* |
|||||||||||||||
| 32.1 | Certification Pursuant to 18 U.S.C. § 1350
(Section 906 of the Sarbanes-Oxley Act of 2002).* |
|||||||||||||||
| 101 | The following financial information from
Burlington Northern Santa Fe Corporation’s
Quarterly Report on Form 10-Q for the quarter
ended September 30, 2009, formatted in XBRL
(Extensible Business Reporting Language) includes: (i) the Consolidated Statements of Income for each
of the three-month and nine-month periods ended
September 30, 2009 and 2008, (ii) the Consolidated
Balance Sheets as of September 30, 2009 and
December 31, 2008, (iii) the Consolidated
Statements of Cash Flows for each of the
nine-month periods ended September 30, 2009 and
2008, (iv) the Consolidated Statement of Changes
in Stockholders’ Equity for the nine-month period
ended September 30, 2009, and (v) the Notes to
Consolidated Financial Statements, tagged as
blocks of text.* |
|||||||||||||||
Certain instruments defining the rights of the holders of long-term debt of the Company and of its
subsidiaries, involving a total
amount of indebtedness not in excess of 10 percent of the total assets of the Company and its
subsidiaries on a consolidated basis, have
not been filed as exhibits. The Company hereby agrees to furnish a copy of any of these agreements
to the SEC upon request.
| * Filed herewith |
E-1