Attached files
| file | filename |
|---|---|
| 8-K - FORM 8-K - DYNEX CAPITAL INC | d8k.htm |
 1
FOCUSED ON THE LONG TERM
Dynex Capital, Inc.
Fourth Quarter 2010
Investor Presentation
February 15, 2011
Exhibit 99.1 |
 2
Note:
This
presentation
contains
“forward-looking
statements”
within
the
meaning
of
the
Private Securities Litigation Reform Act of 1995, including statements about projected
financial
performance
and
future
investment
opportunities.
The
words
“will,”
“believe,”
“expect,”
“forecast,”
“anticipate,”
“intend,”
“estimate,”
“assume,”
“project,”
“plan,”
“continue,”
and similar expressions also identify forward-looking statements that are
inherently subject to risks and uncertainties, some of which cannot be predicted or
quantified.
Although
these
forward-looking
statements
reflect
our
current
beliefs,
assumptions and expectations based on information currently available to us, the
Company’s actual results and timing of certain events could differ materially from those
projected in or contemplated by these statements. Our forward-looking statements
are subject
to
the
following
principal
risks
and
uncertainties:
availability
of
suitable
reinvestment opportunities; investing in real estate assets including changes in general
economic and market conditions and the general availability of credit; variability in
investment portfolio cash flows; defaults by borrowers and/or guarantors and
foreclosures and related legal proceedings; fluctuations in interest rates;
prepayments of investment portfolio assets; inadequate or improper servicing of our
loans and securities by third-party servicers; general competitive factors;
uncertainty around government policy and the impact of
regulatory
changes;
our
compliance
with
Section
404
of
the
Sarbanes-Oxley
Act;
our
ability
to
maintain
our
qualification
as
a
REIT;
and
our
ability
to
maintain
our
exemption
from registration under the Investment Company Act of 1940. For additional information,
see the Company’s Annual Report on Form 10-K for the year ended December 31,
2009, and other reports filed with and furnished to the Securities and Exchange
Commission. Safe Harbor Statement |
 3
DX Snapshot
$328.5 million
Market Capitalization (2/11/2011)
1.1
Price to Book
$10.68
Share Price (2/11/2011)
$0.27
Quarterly Dividend (4Q 2010)
30,762,134
Shares Outstanding (2/11/2011)
DX
NYSE Stock Ticker
Market Highlights
Company Highlights
Internally managed REIT commenced operations in 1988
Significant insider ownership and experienced management team
Hybrid investment strategy investing in residential and commercial mortgage assets
Large NOL carryfoward for unique total return opportunity |
 4
2010 Highlights
•
Generated total
return to shareholders of 38% assuming
reinvested dividends (source: Bloomberg)
•
Raised $117 million in new common equity
and earned $1.41
per common share
•
Generated an ROE of 14.5%
•
Increased market value of common stock to $328.5 million
as of 2/11/11
from $119 million as of 12/31/09
(source: SNL)
…..All while maintaining our conservative
risk profile |
 5
Management Team
•Thomas B. Akin –
Chairman and Chief Executive Officer
–
32 years of experience in the industry and 7 years at Dynex
–
CEO since 2008
–
Managing General Partner of Talkot Capital, LLC
–
16 years at Merrill Lynch and Salomon Brothers
•Byron L. Boston –
Chief Investment Officer
–
27 years of experience in the industry with 3 years as CIO at Dynex
–
13 years managing levered multi-product portfolios at Freddie Mac and Sunset Financial
Resources –
11 years trading MBS on Wall Street
–
3 years Senior Corporate Lending Officer at Chemical Bank
•Stephen J. Benedetti –
Chief Financial Officer and Chief Operating Officer
–
21 years of experience in the industry and 16 years at Dynex
–
Employed in various capacities at Dynex since 1994
–
Managed Dynex from 2002 –
2007
–
Began career at Deloitte & Touche
•Portfolio Management Team
–
4
member
team
with
a
collective
55
years
of
industry
experience
with
broad
and
deep
skill
sets
in
both
agency and non-agency investment strategies
Experienced team of professionals with a combined 80 years of experience
managing mortgage REITs and mortgage portfolios
5 |
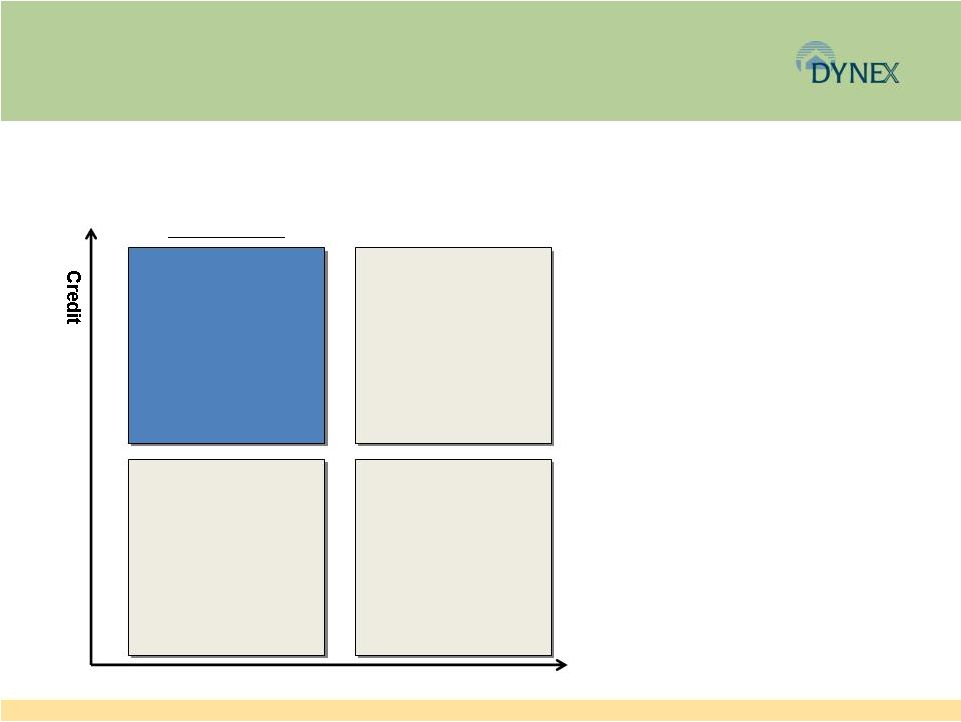 Hybrid Investment
Strategy Hybrid Investment Strategy
that invests in a combination of Agency and non-Agency residential
and commercial assets to maximize risk adjusted total return.
Duration
•
Higher Credit Quality
•
Low Duration
Examples include:
-
Short Duration
Agency ARMs
-
Seasoned non-Agency
RMBS & CMBS
Target Strategy
•
Lower Credit Quality
•
Low Duration
Examples include:
-
Floating Rate Mezzanine
•
Higher Credit Quality
•
Long Duration
Examples include:
-
30 year Agency MBS
Current Coupon
-
Super Senior CMBS
•
Lower Credit Quality
•
Long Duration
Examples include:
-
Credit Sensitive
Securities Rated BBB
and Below
ASSETS:
•
High grade securitized products –
Agency
MBS, non-Agency RMBS and CMBS
•
Target assets with a disciplined capital
allocation framework focused on risk-
adjusted returns and capital preservation
FUNDING:
•
Blend of recourse and non-recourse
•
Conservative leverage
•
Diversified counterparty profile to avoid
concentration risk
•
Active maturity management to ensure
stable financing profile
6 |
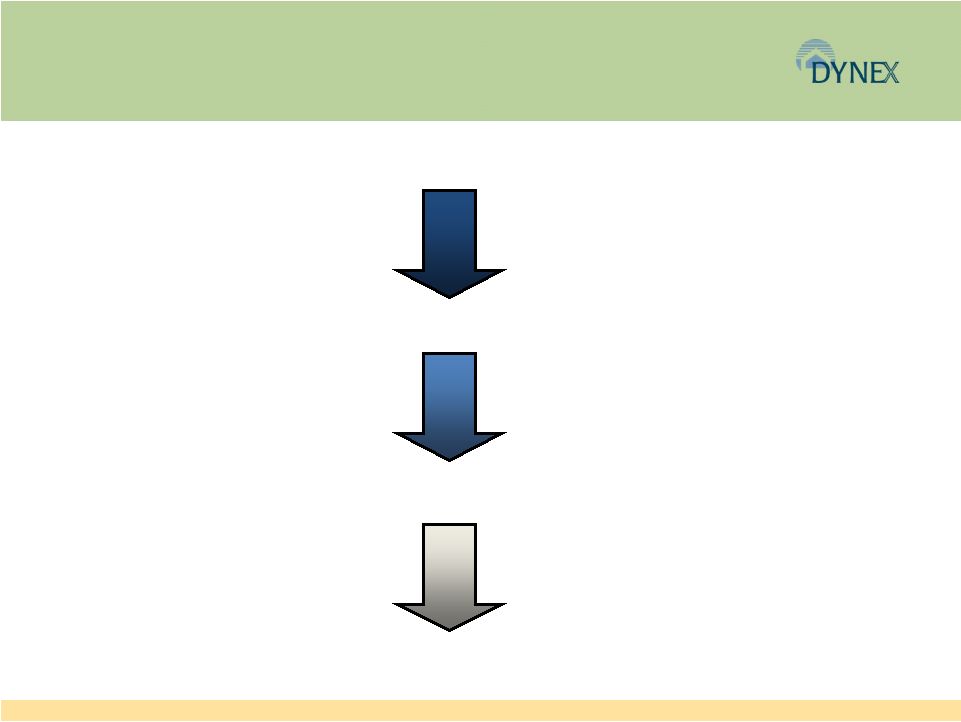 7
Disciplined Top-Down Investment Philosophy
Macroeconomic Analysis
Sector Analysis
Security Selection & Funding
Performance & Risk Management |
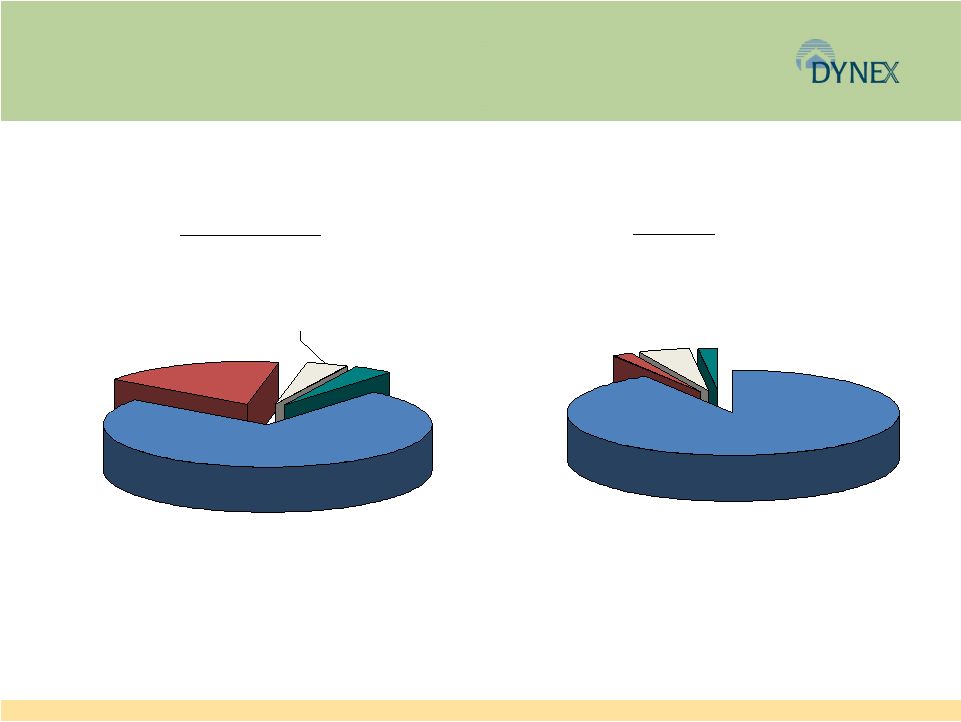 8
Unique Investment Portfolio
(as of 12/31/10)
Agency MBS
74%
Seasoned DX
RMBS/loans
4%
Other
CMBS/RMBS
4%
Seasoned DX
CMBS/loans
18%
AAA
91%
AA
2%
A
5%
Below A
2%
Composition
Ratings |
 9
Current Investment Environment
Macro:
–
Fed funds rate at historic lows with a steep yield curve
–
Government policy/regulations to influence investment returns
–
Improved financing environment
–
Competition for high quality assets
–
Securitization markets are healing slowly but unevenly
–
Global risk remains high
Investment thesis:
–
Tighter credit standards have created more predictable mortgage cash flows
and better investment opportunities
–
Agency MBS and highly-rated securities offer stable returns and have low
financing risk
–
Premium risk is manageable
–
Hybrid REIT strategy allocates capital to most compelling investment
opportunities |
 10
Return Profile for Prospective Investments as of
12/31/10
100-104
94-103
104-107
102-108
Range of Prices
10%-15%
1.6%-2.4%
4.8%-5.3%
‘AAA’
CMBS
12%-20%
2.8%-3.8%
3.8%-5.0%
‘AAA’
RMBS
Non –Agency
13%-20%
1.6%-2.5%
4.2%-4.5%
CMBS
14%-25%
1.7%-2.7%
2.5%-
3.8%
RMBS
Agency
Range of ROEs
Range of net
spread to
funding
Range of
yields
Investment
Note: Ranges noted above reflect estimates based on certain assumptions made by
management and may not be indicative of actual results. |
 11
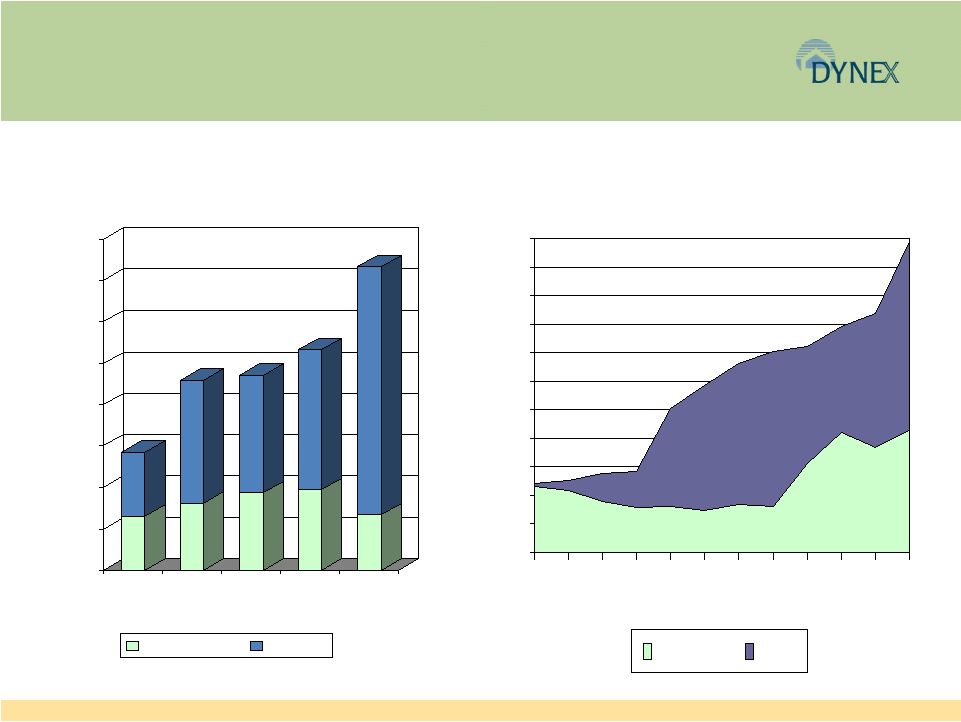
Portfolio Growth and Diversification of Income
Investments
Net Interest Income
$0
$1,000
$2,000
$3,000
$4,000
$5,000
$6,000
$7,000
$8,000
$9,000
$10,000
$11,000
1Q08
2Q08
3Q08
4Q08
1Q09
2Q09
3Q09
4Q09
1Q10
2Q10
3Q10
4Q10
Non-Agency
Agency
$0
$200,000
$400,000
$600,000
$800,000
$1,000,000
$1,200,000
$1,400,000
$1,600,000
2008
2009
2Q10
3Q10
4Q10
Non-Agency
Agency
($ in thousands) |
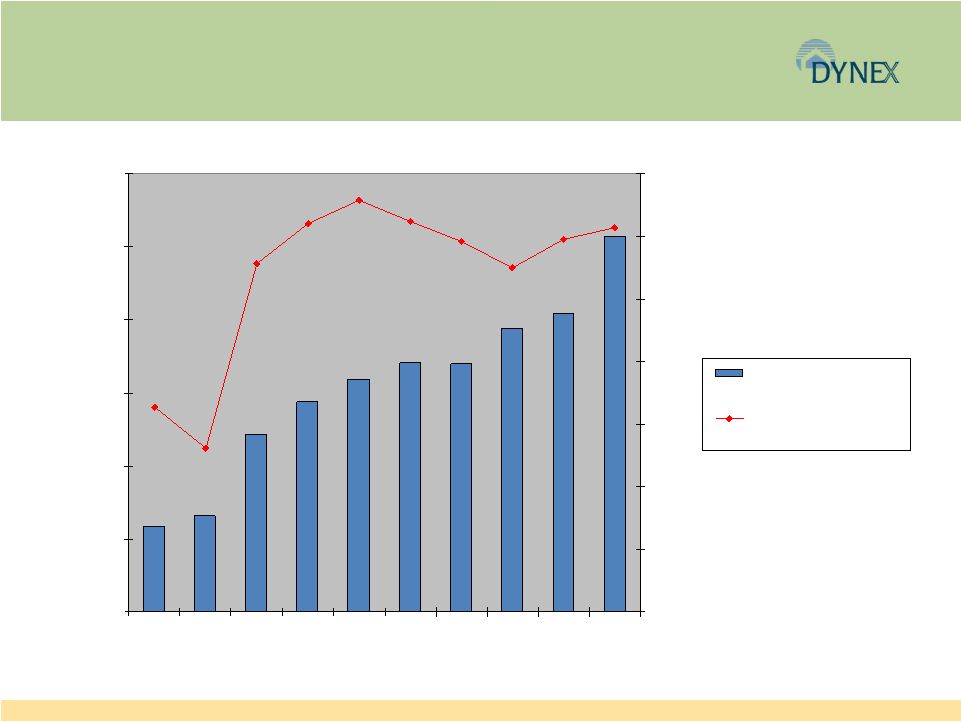 12
Investment Portfolio Income and Spread
$0
$2,000
$4,000
$6,000
$8,000
$10,000
$12,000
3Q08
4Q08
1Q09
2Q09
3Q09
4Q09
1Q10
2Q10
3Q10
4Q10
0.00%
0.50%
1.00%
1.50%
2.00%
2.50%
3.00%
3.50%
Net interest income after
provision (LHS)
Net interest spread (RHS)
$ in thousands |
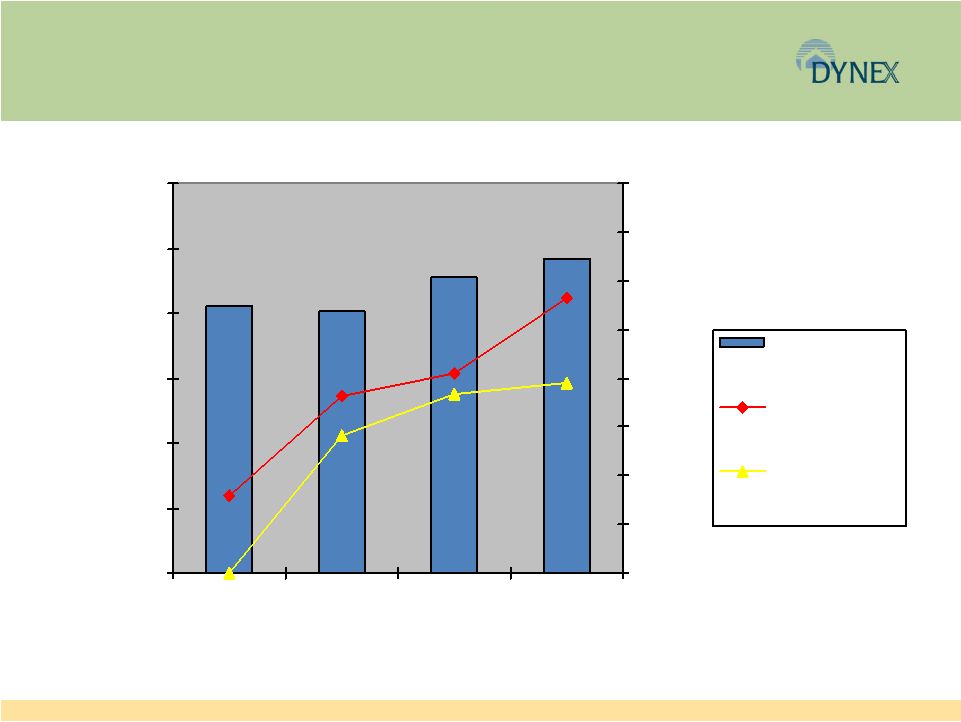 13
Total Return Opportunity
$8.22
$8.07
$9.08
$9.71
$0.40
$0
$0.91
$1.02
$1.41
$0.71
$0.98
$0.92
$0.00
$2.00
$4.00
$6.00
$8.00
$10.00
$12.00
2007
2008
2009
2010
$0.00
$0.25
$0.50
$0.75
$1.00
$1.25
$1.50
$1.75
$2.00
Book value per
common share
(LHS)
Diluted net income
per common share
(RHS)
Dividend per
common share
(RHS) |
 14
Why Dynex
Excellent track record with attractive total return opportunity
Strong and defensive balance sheet positioned to weather market
volatility
Experienced management with a track record of disciplined capital
deployment through multiple economic cycles
Alignment of interests with shareholders due to owner-operator
structure
Complementary investment opportunities exist with attractive
return profiles consistent with our investment philosophy
Opportunistic capital raises have increased shareholder value with
minimal book value dilution |
 FOCUSED ON
THE LONG TERM APPENDIX |
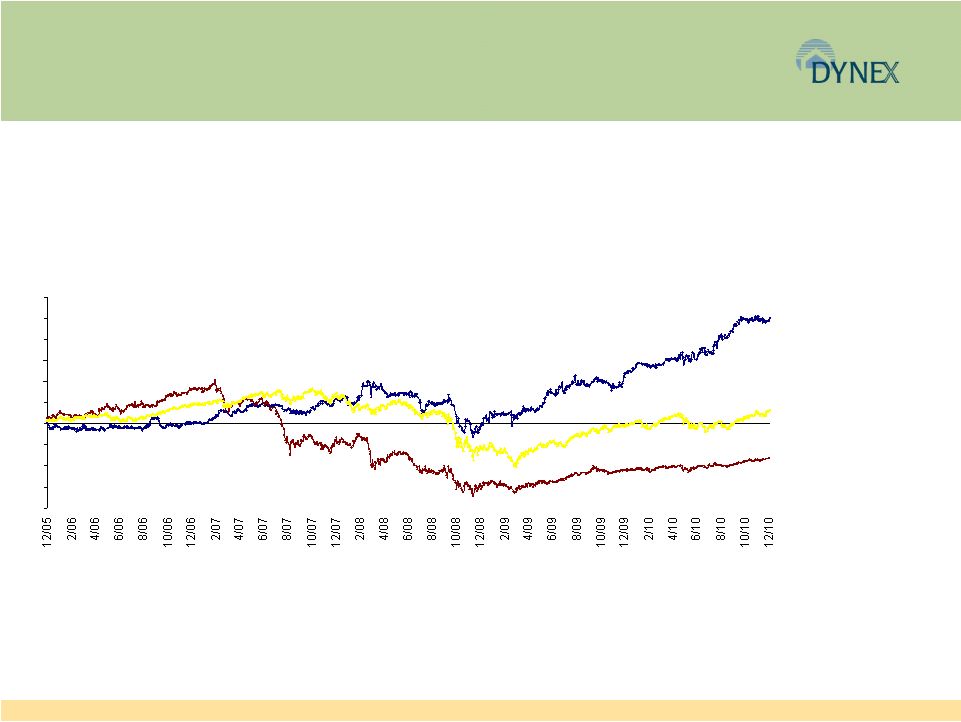 16
Long-Term Track Record
Demonstrated history of disciplined capital management and producing returns
in excess of market benchmarks.
DX 99.6%
S&P 500 13.3%
SNL Finance REIT*
(32.8%)
-80
-60
-40
-20
0
20
40
60
80
100
120
*SNL Finance REIT: Includes all publicly traded (NYSE, NYSE Amex, NASDAQ, OTC BB,
Pink Sheets) Investment Companies with the following primary focuses: MBS
REIT, Mortgage REIT and Specialty Finance REIT in SNL's coverage universe.
Source: SNL Financial |
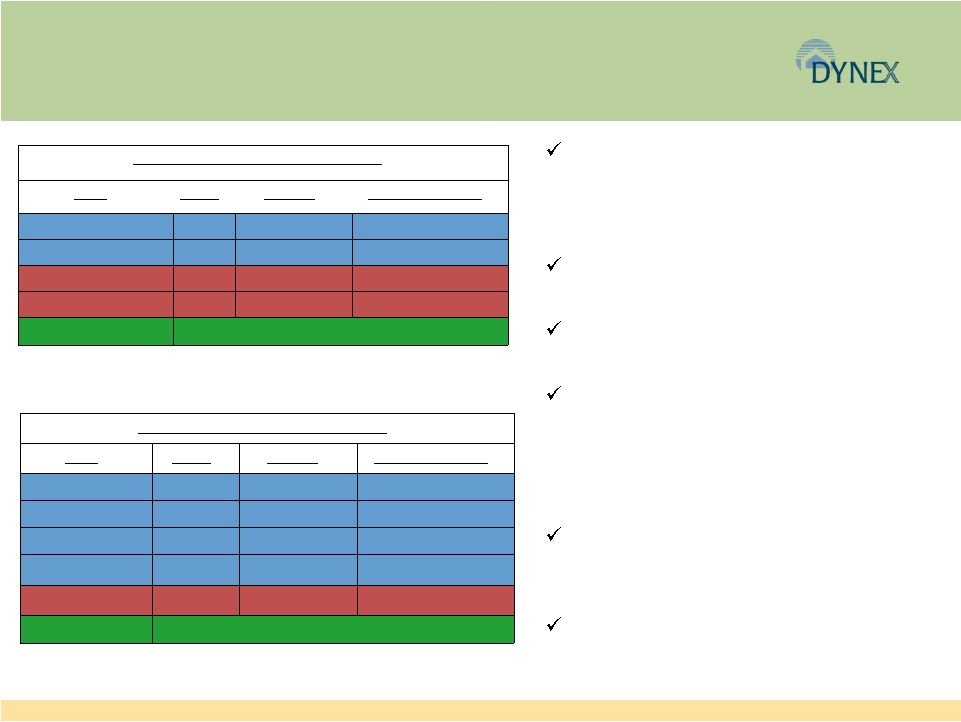 17
CMBS Investments Unique to DX
1998 CMBS (12/31/10 balances)
5.3% Non-investment grade
$15.6 million
9%
‘BBB’
8.0%
$6.5 million
13%
‘BBB+’
8.0%
$19.5 million
25%
‘A+’
8.0%
$43.4 million
50%
‘AAA’
8.0%
$83.7 million
Credit Support
Rating
WAC
UPB
1997 CMBS (12/31/10 balances)
7.6% Non-investment grade
$19.8 million
20%
‘A’
7.2%
$23.7 million
44%
‘AAA’
7.0%
$33.1 million
78%
‘AAA’
6.8%
$20.5 million
99%
‘AAA’
1200%
$0.1 million
99%
‘AAA’
6.7%
$0.8 million
Credit Support
Rating
WAC
UPB
We created and sold two CMBS in 1997
and 1998, retaining only the non-
investment grade CMBS in green at
issuance
We redeemed the 1998 CMBS bonds in
blue at par in 12/2009 and 7/2010
We redeemed the 1997 CMBS bonds in
blue at par in 8/2010
We financed all of the redemptions via
resecuritization and repo at a current
effective interest rate of ~1.8% for a
current weighted average “spread”
on the
redeemed CMBS of ~6.4%
Annual net interest income expected
based on the spread earned on the CMBS is
~$12 million based on current rates
DX still owns rights to redeem the CMBS
bonds in red at par |
 18
Current Counterparties
Bank of America
Greenwich Capital
Cantor Fitzgerald
BB&T Capital
Morgan Keegan
Deutsche Bank
Morgan Stanley
SunTrust
MF Global
Barclay’s
ING
Guggenheim
Jeffries Securities
Mizuho
South Street Securities
Goldman Sachs
Nomura
LBBW
Credit Suisse
Princeridge
20 |