Attached files
| file | filename |
|---|---|
| 8-K - CURRENT REPORT OF MATERIAL EVENTS OR CORPORATE CHANGES - GEOKINETICS INC | a10-22630_18k.htm |
| EX-99.1 - EX-99.1 - GEOKINETICS INC | a10-22630_1ex99d1.htm |
Exhibit 99.2
|
|
Capital One Southcoast 2010 Energy Conference December 7-9, 2010 |

|
|
This presentation contains forward-looking statements. All forward-looking statements speak only as of the date of this presentation or, in the case of any document incorporated by reference, the date of that document. All subsequent written and oral forward-looking statements attributable to the company or any person acting on the company’s behalf are qualified by the cautionary statements in this section. The company does not undertake any obligation to update or publicly release any revisions to forward-looking statements to reflect events, circumstances or changes in expectations after the date of this report. Actual experience may differ and such differences may be material. Backlog consists of written orders and estimates for our services which we believe to be firm. In many instances contracts are cancelable by customers so we may never realize some or all of our backlog, which may lead to lower than expected financial performance. Forward-looking statements are subject to uncertainties and risks which are disclosed in Geokinetics’ Annual Report on Form 10-K and Quarterly Reports on Form 10-Q. NYSE Amex: GOK 2 Forward-Looking Statements |
|
|
NYSE Amex: GOK Seismic Industry Overview |

|
|
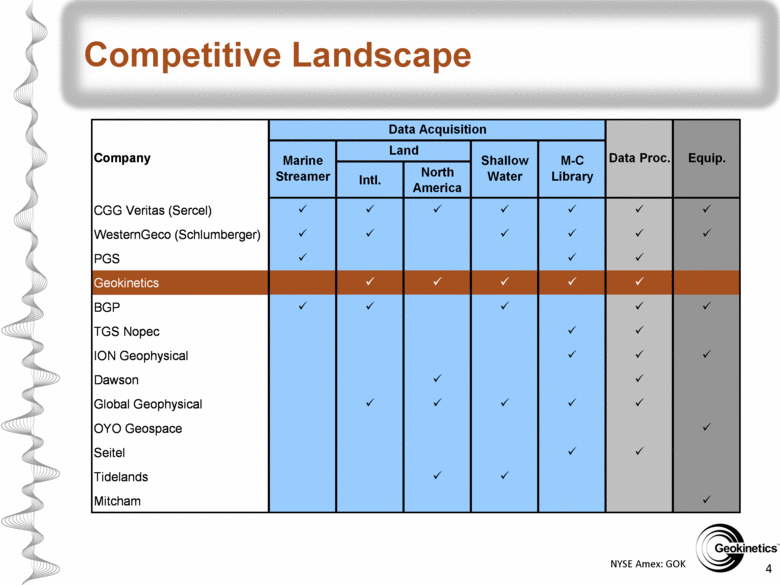
NYSE Amex: GOK 4 Competitive Landscape Intl. North America CGG Veritas (Sercel) WesternGeco (Schlumberger) PGS Geokinetics BGP TGS Nopec ION Geophysical Dawson Global Geophysical OYO Geospace Seitel Tidelands Mitcham Company Data Proc. Equip. Land Marine Streamer Shallow Water Data Acquisition M-C Library |
|
|
NYSE Amex: GOK 5 Industry Dynamics Earnings volatility reflects varying crew profitability due to: Fluctuations in job size and location Utilization of crews Timing of crew moves Seasonality in operations (Canadian working season and thaw, rainy season in Latin America, monsoon season and whale migrations in Far East / Australia) Multi-Client data library “late sales” revenue recognition unpredictable Budgeting cycles of National Oil Companies (NOCs) and International Oil Companies (IOCs) tend to be more strategic and longer term in nature International projects primarily target oil prospects, while U.S. projects generally focus on natural gas NOCs control as much as 94% of world’s oil and gas reserves U.S. shale plays still active and profitable with E&P expenditures expected to rise in 2011 Technical advances (3-D seismic, hydraulic fracturing and horizontal drilling) are bringing new activity in regions with known hydrocarbon systems Increasing demand for seabed seismic data acquisition (Transition Zone, Ocean Bottom Cable and 4D) (1) Source: Oil & Gas Journal, February 2, 2009 (2) Source: Barclays Capital – The Original E&P Spending Survey, June 15, 2010 (1) (2) |
|
|
Company Overview NYSE Amex: GOK |
|
|
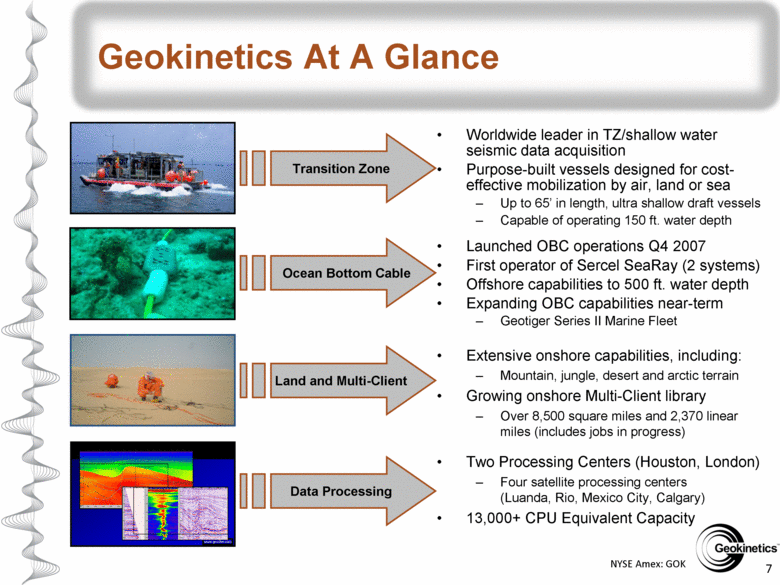
NYSE Amex: GOK 7 Geokinetics At A Glance Transition Zone Ocean Bottom Cable Land and Multi-Client Data Processing www.geodev.com Worldwide leader in TZ/shallow water seismic data acquisition Purpose-built vessels designed for cost-effective mobilization by air, land or sea Up to 65’ in length, ultra shallow draft vessels Capable of operating 150 ft. water depth Launched OBC operations Q4 2007 First operator of Sercel SeaRay (2 systems) Offshore capabilities to 500 ft. water depth Expanding OBC capabilities near-term Geotiger Series II Marine Fleet Extensive onshore capabilities, including: Mountain, jungle, desert and arctic terrain Growing onshore Multi-Client library Over 8,500 square miles and 2,370 linear miles (includes jobs in progress) Two Processing Centers (Houston, London) Four satellite processing centers (Luanda, Rio, Mexico City, Calgary) 13,000+ CPU Equivalent Capacity |
|
|
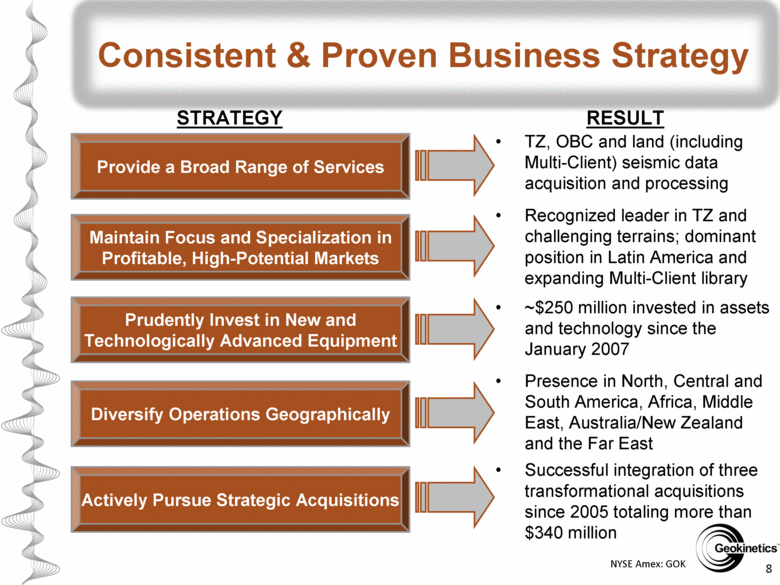
NYSE Amex: GOK 8 Consistent & Proven Business Strategy Provide a Broad Range of Services TZ, OBC and land (including Multi-Client) seismic data acquisition and processing Maintain Focus and Specialization in Profitable, High-Potential Markets Recognized leader in TZ and challenging terrains; dominant position in Latin America and expanding Multi-Client library Prudently Invest in New and Technologically Advanced Equipment ~$250 million invested in assets and technology since the January 2007 Diversify Operations Geographically Actively Pursue Strategic Acquisitions Successful integration of three transformational acquisitions since 2005 totaling more than $340 million Presence in North, Central and South America, Africa, Middle East, Australia/New Zealand and the Far East STRATEGY RESULT |
|
|
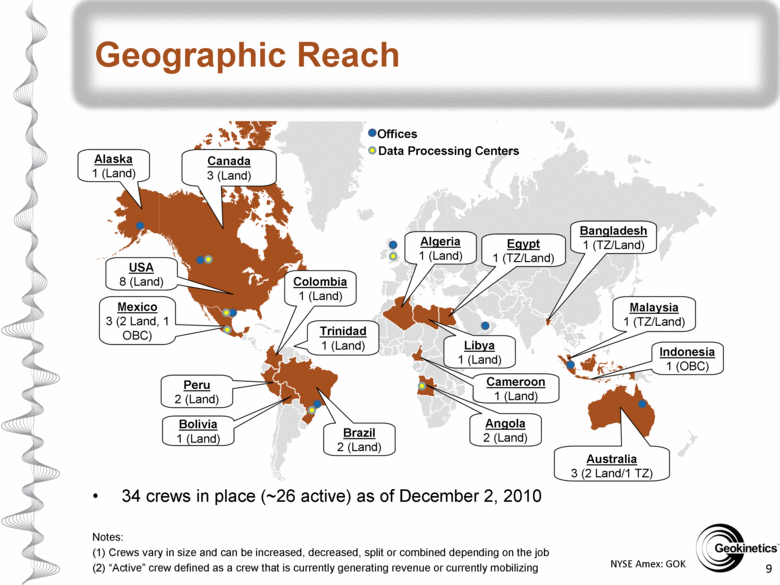
NYSE Amex: GOK 9 Geographic Reach Canada 3 (Land) USA 8 (Land) Mexico 3 (2 Land, 1 OBC) Egypt 1 (TZ/Land) Algeria 1 (Land) Alaska 1 (Land) Brazil 2 (Land) Malaysia 1 (TZ/Land) Bangladesh 1 (TZ/Land) Angola 2 (Land) Cameroon 1 (Land) Colombia 1 (Land) Peru 2 (Land) Libya 1 (Land) Bolivia 1 (Land) Trinidad 1 (Land) Australia 3 (2 Land/1 TZ) Indonesia 1 (OBC) Notes: (1) Crews vary in size and can be increased, decreased, split or combined depending on the job (2) “Active” crew defined as a crew that is currently generating revenue or currently mobilizing Offices Data Processing Centers 34 crews in place (~26 active) as of December 2, 2010 |
|
|
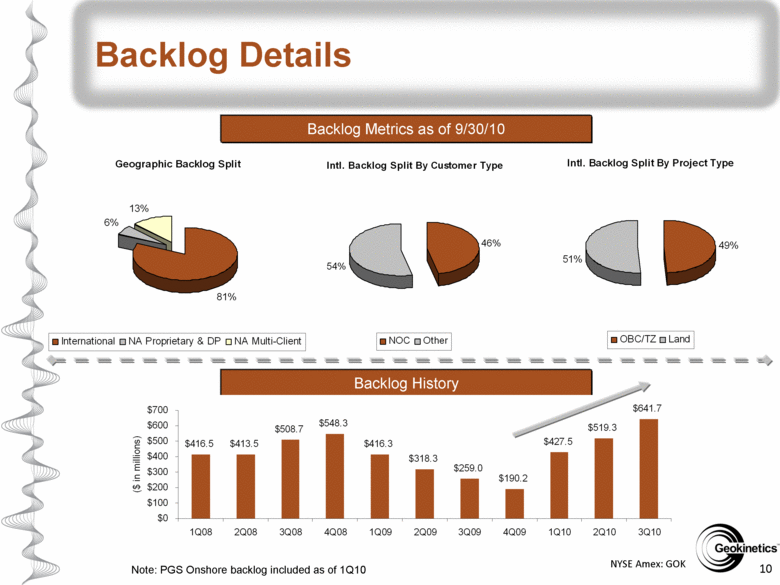
NYSE Amex: GOK 10 Backlog Details Note: PGS Onshore backlog included as of 1Q10 Backlog Metrics as of 9/30/10 Backlog History $416.5 $413.5 $508.7 $548.3 $416.3 $318.3 $259.0 $190.2 $427.5 $519.3 $641.7 $0 $100 $200 $300 $400 $500 $600 $700 1Q08 2Q08 3Q08 4Q08 1Q09 2Q09 3Q09 4Q09 1Q10 2Q10 3Q10 ($ in millions) Intl. Backlog Split By Project Type 49% 51% OBC/TZ Land Geographic Backlog Split 81% 6% 13% International NA Proprietary & DP NA Multi-Client Intl. Backlog Split By Customer Type 46% 54% NOC Other |
|
|
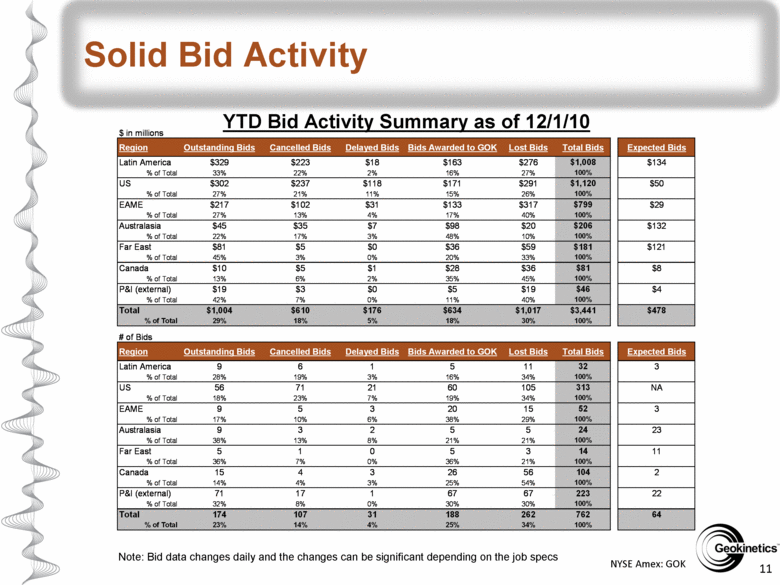
NYSE Amex: GOK 11 Solid Bid Activity YTD Bid Activity Summary as of 12/1/10 Note: Bid data changes daily and the changes can be significant depending on the job specs $ in millions Region Outstanding Bids Cancelled Bids Delayed Bids Bids Awarded to GOK Lost Bids Total Bids Expected Bids Latin America $329 $223 $18 $163 $276 $1,008 $134 % of Total 33% 22% 2% 16% 27% 100% US $302 $237 $118 $171 $291 $1,120 $50 % of Total 27% 21% 11% 15% 26% 100% EAME $217 $102 $31 $133 $317 $799 $29 % of Total 27% 13% 4% 17% 40% 100% Australasia $45 $35 $7 $98 $20 $206 $132 % of Total 22% 17% 3% 48% 10% 100% Far East $81 $5 $0 $36 $59 $181 $121 % of Total 45% 3% 0% 20% 33% 100% Canada $10 $5 $1 $28 $36 $81 $8 % of Total 13% 6% 2% 35% 45% 100% P&I (external) $19 $3 $0 $5 $19 $46 $4 % of Total 42% 7% 0% 11% 40% 100% Total $1,004 $610 $176 $634 $1,017 $3,441 $478 % of Total 29% 18% 5% 18% 30% 100% # of Bids Region Outstanding Bids Cancelled Bids Delayed Bids Bids Awarded to GOK Lost Bids Total Bids Expected Bids Latin America 9 6 1 5 11 32 3 % of Total 28% 19% 3% 16% 34% 100% US 56 71 21 60 105 313 NA % of Total 18% 23% 7% 19% 34% 100% EAME 9 5 3 20 15 52 3 % of Total 17% 10% 6% 38% 29% 100% Australasia 9 3 2 5 5 24 23 % of Total 38% 13% 8% 21% 21% 100% Far East 5 1 0 5 3 14 11 % of Total 36% 7% 0% 36% 21% 100% Canada 15 4 3 26 56 104 2 % of Total 14% 4% 3% 25% 54% 100% P&I (external) 71 17 1 67 67 223 22 % of Total 32% 8% 0% 30% 30% 100% Total 174 107 31 188 262 762 64 % of Total 23% 14% 4% 25% 34% 100% |
|
|
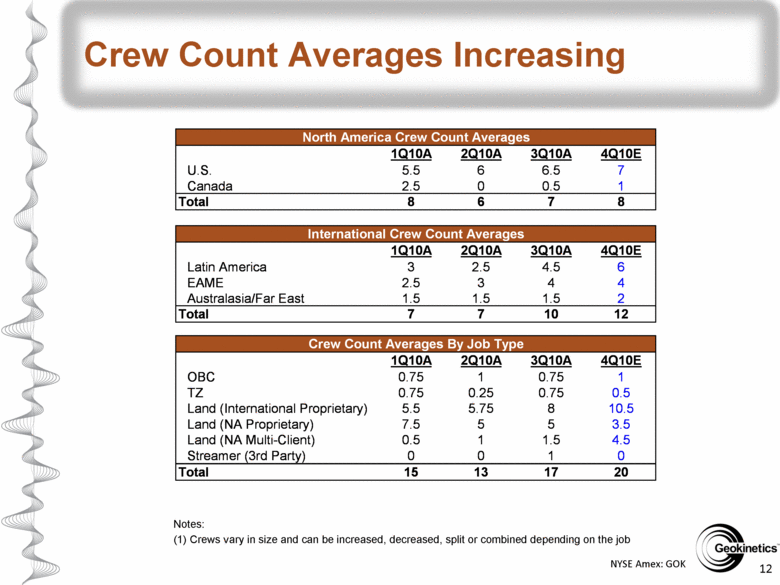
NYSE Amex: GOK 12 Crew Count Averages Increasing Notes: (1) Crews vary in size and can be increased, decreased, split or combined depending on the job 1Q10A 2Q10A 3Q10A 4Q10E U.S. 5.5 6 6.5 7 Canada 2.5 0 0.5 1 Total 8 6 7 8 1Q10A 2Q10A 3Q10A 4Q10E Latin America 3 2.5 4.5 6 EAME 2.5 3 4 4 Australasia/Far East 1.5 1.5 1.5 2 Total 7 7 10 12 1Q10A 2Q10A 3Q10A 4Q10E OBC 0.75 1 0.75 1 TZ 0.75 0.25 0.75 0.5 Land (International Proprietary) 5.5 5.75 8 10.5 Land (NA Proprietary) 7.5 5 5 3.5 Land (NA Multi-Client) 0.5 1 1.5 4.5 Streamer (3rd Party) 0 0 1 0 Total 15 13 17 20 North America Crew Count Averages International Crew Count Averages Crew Count Averages By Job Type |
|
|
NYSE Amex: GOK 13 Diversified Customer Base Solid relationships with National Oil Companies (NOCs), International Oil Companies (IOCs) and independent oil and natural gas producers No one customer represented more than 11% of total revenues in 1Q-3Q 2010 |
|
|
NYSE Amex: GOK 14 PGS Onshore Acquisition Rationale Expanded scope and scale Channel count increased 64% to approximately 201,000 Crew capacity increased over 50% Added skilled employees in growth regions Significant business expansion Mexico: Solid existing relationship with Pemex Recently awarded contract by Pemex valued at over $110 million (>80% OBC) North Africa/Middle East: Skill set of large channel crews with 24 hour vibrator operations Recently awarded contract in Libya valued at over $18 million Alaska: Future opportunities in environment with high barriers to entry Multi-Client: ~5,500 square mile data library and expertise $9.8 million in “late sales” in YTD 2010 related to legacy PGS Onshore data library Estimated annual synergies of at least $10 million conservative Majority of synergies driven by overlap and cost reductions PGS Onshore integration complete |
|
|
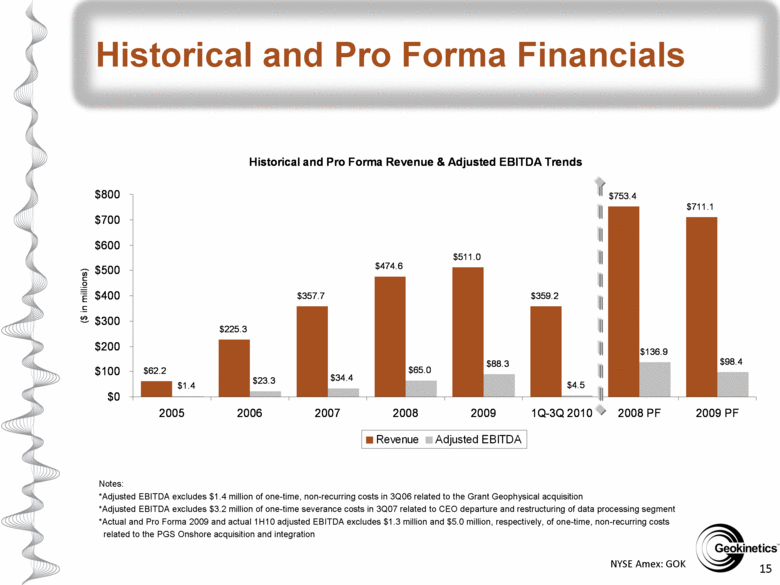
NYSE Amex: GOK 15 Historical and Pro Forma Financials Notes: *Adjusted EBITDA excludes $1.4 million of one-time, non-recurring costs in 3Q06 related to the Grant Geophysical acquisition *Adjusted EBITDA excludes $3.2 million of one-time severance costs in 3Q07 related to CEO departure and restructuring of data processing segment *Actual and Pro Forma 2009 and actual 1H10 adjusted EBITDA excludes $1.3 million and $5.0 million, respectively, of one-time, non-recurring costs related to the PGS Onshore acquisition and integration Historical and Pro Forma Revenue & Adjusted EBITDA Trends $62.2 $225.3 $357.7 $474.6 $511.0 $359.2 $753.4 $711.1 $1.4 $23.3 $34.4 $65.0 $88.3 $4.5 $136.9 $98.4 $0 $100 $200 $300 $400 $500 $600 $700 $800 2005 2006 2007 2008 2009 1Q-3Q 2010 2008 PF 2009 PF ($ in millions) Revenue Adjusted EBITDA |
|
|
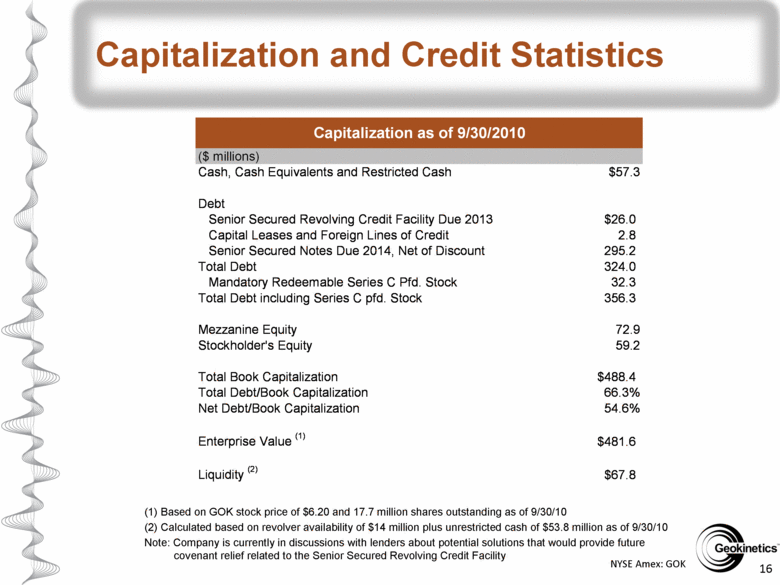
NYSE Amex: GOK 16 Capitalization and Credit Statistics (1) Based on GOK stock price of $6.20 and 17.7 million shares outstanding as of 9/30/10 (2) Calculated based on revolver availability of $14 million plus unrestricted cash of $53.8 million as of 9/30/10 Note: Company is currently in discussions with lenders about potential solutions that would provide future covenant relief related to the Senior Secured Revolving Credit Facility ($ millions) Cash, Cash Equivalents and Restricted Cash $57.3 Debt Senior Secured Revolving Credit Facility Due 2013 $26.0 Capital Leases and Foreign Lines of Credit 2.8 Senior Secured Notes Due 2014, Net of Discount 295.2 Total Debt 324.0 Mandatory Redeemable Series C Pfd. Stock 32.3 Total Debt including Series C pfd. Stock 356.3 Mezzanine Equity 72.9 Stockholder's Equity 59.2 Total Book Capitalization $488.4 Total Debt/Book Capitalization 66.3% Net Debt/Book Capitalization 54.6% Enterprise Value (1) $481.6 Liquidity (2) $67.8 Capitalization as of 9/30/2010 |
|
|
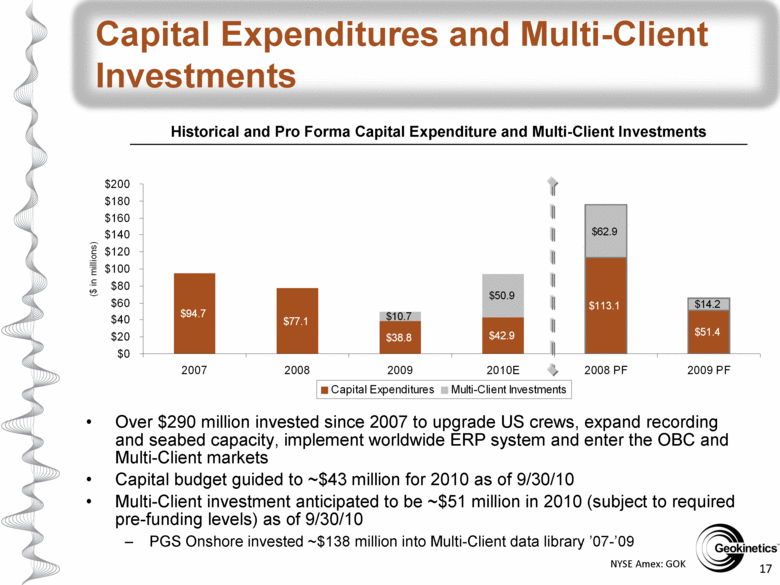
NYSE Amex: GOK 17 Capital Expenditures and Multi-Client Investments Over $290 million invested since 2007 to upgrade US crews, expand recording and seabed capacity, implement worldwide ERP system and enter the OBC and Multi-Client markets Capital budget guided to ~$43 million for 2010 as of 9/30/10 Multi-Client investment anticipated to be ~$51 million in 2010 (subject to required pre-funding levels) as of 9/30/10 PGS Onshore invested ~$138 million into Multi-Client data library ’07-’09 Historical and Pro Forma Capital Expenditure and Multi-Client Investments $94.7 $77.1 $38.8 $42.9 $113.1 $51.4 $10.7 $50.9 $62.9 $14.2 $0 $20 $40 $60 $80 $100 $120 $140 $160 $180 $200 2007 2008 2009 2010E 2008 PF 2009 PF ($ in millions) Capital Expenditures Multi-Client Investments |
|
|
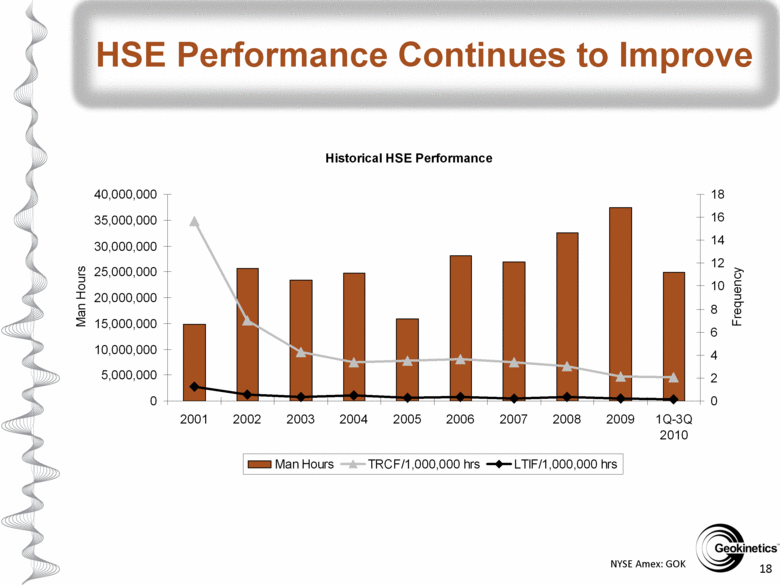
NYSE Amex: GOK 18 HSE Performance Continues to Improve Historical HSE Performance 0 5,000,000 10,000,000 15,000,000 20,000,000 25,000,000 30,000,000 35,000,000 40,000,000 2001 2002 2003 2004 2005 2006 2007 2008 2009 1Q-3Q 2010 Man Hours 0 2 4 6 8 10 12 14 16 18 Frequency Man Hours TRCF/1,000,000 hrs LTIF/1,000,000 hrs |
|
|
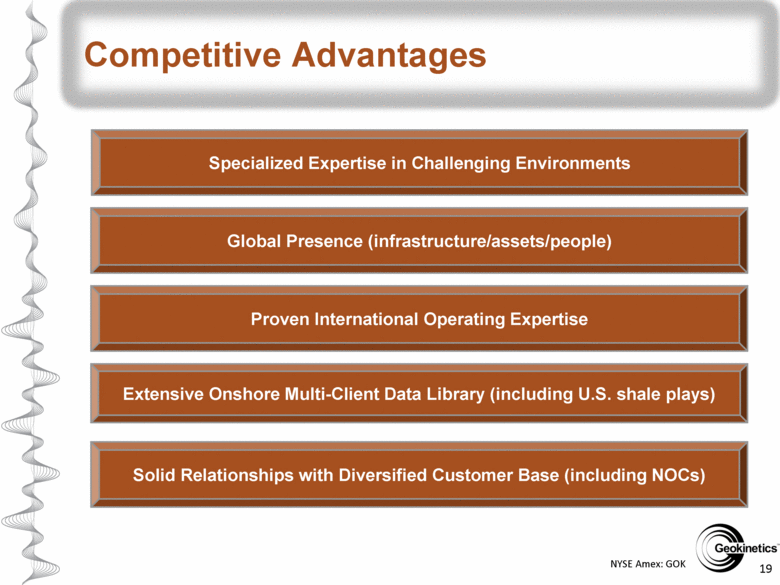
NYSE Amex: GOK 19 Competitive Advantages Specialized Expertise in Challenging Environments Proven International Operating Expertise Global Presence (infrastructure/assets/people) Extensive Onshore Multi-Client Data Library (including U.S. shale plays) Solid Relationships with Diversified Customer Base (including NOCs) |
|
|
NYSE Amex: GOK Business Segment Outlook |

|
|
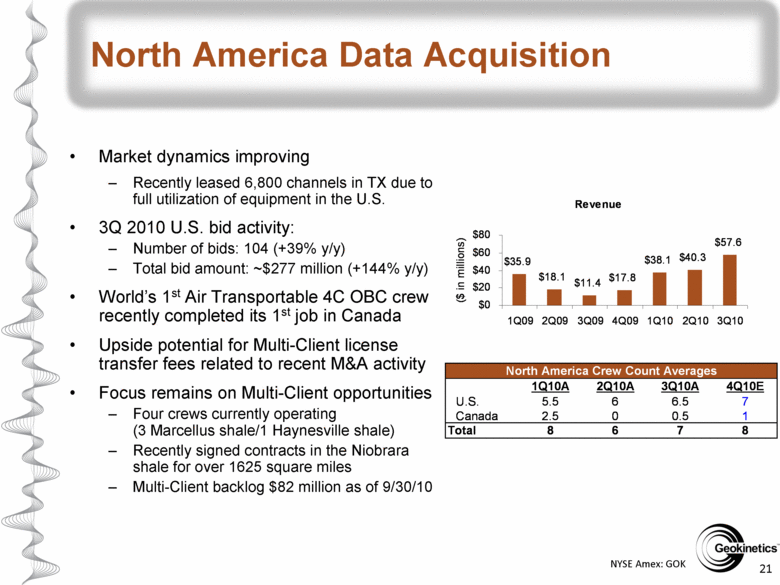
NYSE Amex: GOK 21 North America Data Acquisition Market dynamics improving Recently leased 6,800 channels in TX due to full utilization of equipment in the U.S. 3Q 2010 U.S. bid activity: Number of bids: 104 (+39% y/y) Total bid amount: ~$277 million (+144% y/y) World’s 1st Air Transportable 4C OBC crew recently completed its 1st job in Canada Upside potential for Multi-Client license transfer fees related to recent M&A activity Focus remains on Multi-Client opportunities Four crews currently operating (3 Marcellus shale/1 Haynesville shale) Recently signed contracts in the Niobrara shale for over 1625 square miles Multi-Client backlog $82 million as of 9/30/10 1Q10A 2Q10A 3Q10A 4Q10E U.S. 5.5 6 6.5 7 Canada 2.5 0 0.5 1 Total 8 6 7 8 North America Crew Count Averages ($ in millions) 3Q10 2Q10 1Q10 4Q09 3Q09 2Q09 1Q09 $80 $60 $40 $20 $0 $57.6 $40.3 $38.1 $17.8 $11.4 $18.1 $35.9 Revenue |
|
|
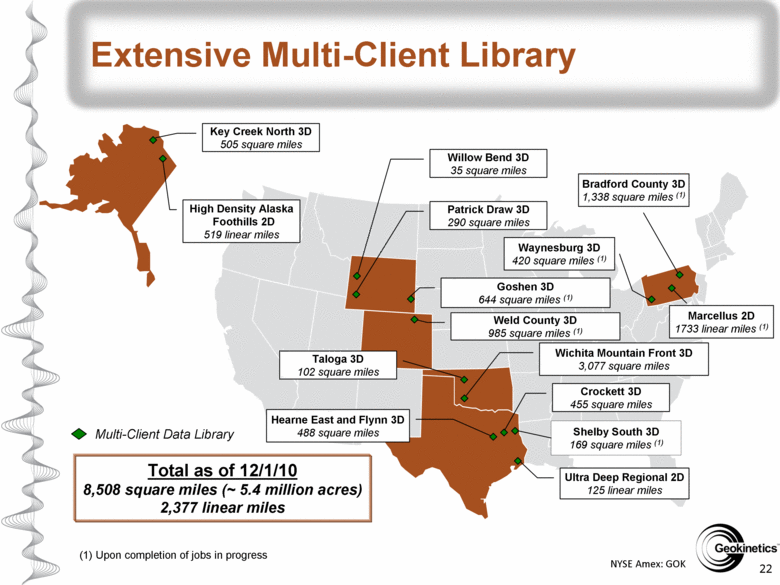
NYSE Amex: GOK 22 Extensive Multi-Client Library (1) Upon completion of jobs in progress Multi-Client Data Library Willow Bend 3D 35 square miles Patrick Draw 3D 290 square miles Wichita Mountain Front 3D 3,077 square miles Ultra Deep Regional 2D 125 linear miles Hearne East and Flynn 3D 488 square miles Crockett 3D 455 square miles Key Creek North 3D 505 square miles High Density Alaska Foothills 2D 519 linear miles Bradford County 3D 1,338 square miles (1) Waynesburg 3D 420 square miles (1) Shelby South 3D 169 square miles (1) Total as of 12/1/10 8,508 square miles (~ 5.4 million acres) 2,377 linear miles Marcellus 2D 1733 linear miles (1) Taloga 3D 102 square miles Goshen 3D 644 square miles (1) Weld County 3D 985 square miles (1) |
|
|
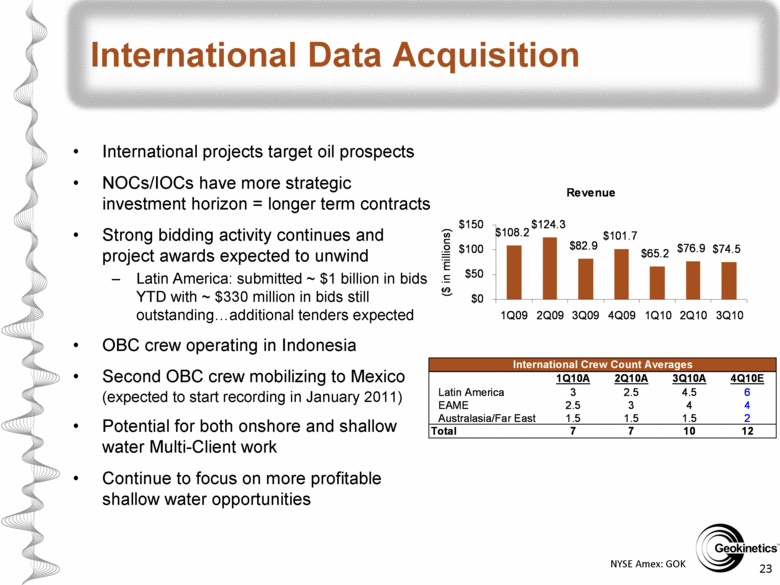
NYSE Amex: GOK 23 International Data Acquisition International projects target oil prospects NOCs/IOCs have more strategic investment horizon = longer term contracts Strong bidding activity continues and project awards expected to unwind Latin America: submitted ~ $1 billion in bids YTD with ~ $330 million in bids still outstandingadditional tenders expected OBC crew operating in Indonesia Second OBC crew mobilizing to Mexico (expected to start recording in January 2011) Potential for both onshore and shallow water Multi-Client work Continue to focus on more profitable shallow water opportunities 1Q10A 2Q10A 3Q10A 4Q10E Latin America 3 2.5 4.5 6 EAME 2.5 3 4 4 Australasia/Far East 1.5 1.5 1.5 2 Total 7 7 10 12 International Crew Count Averages ($ in millions) 3Q10 2Q10 1Q10 4Q09 3Q09 2Q09 1Q09 $150 $100 $50 $0 $74.5 $76.9 $65.2 $101.7 $82.9 $124.3 $108.2 Revenue |
|
|
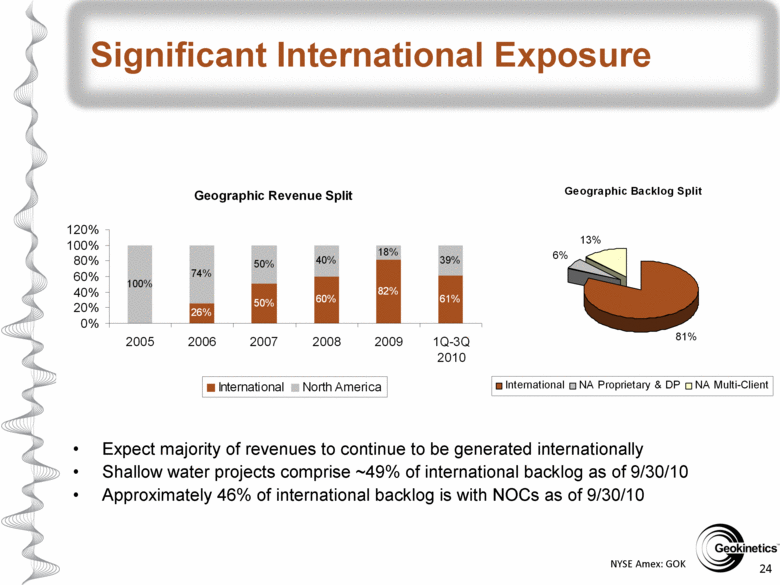
NYSE Amex: GOK 24 Significant International Exposure Expect majority of revenues to continue to be generated internationally Shallow water projects comprise ~49% of international backlog as of 9/30/10 Approximately 46% of international backlog is with NOCs as of 9/30/10 Geographic Backlog Split 81% 6% 13% International NA Proprietary & DP NA Multi-Client North America International 2010 1Q-3Q 2009 2008 2007 2006 2005 120% 100% 80% 60% 40% 20% 0% 39% 18% 40% 50% 74% 100% 61% 82% 60% 50% 26% Geographic Revenue Split |
|
|
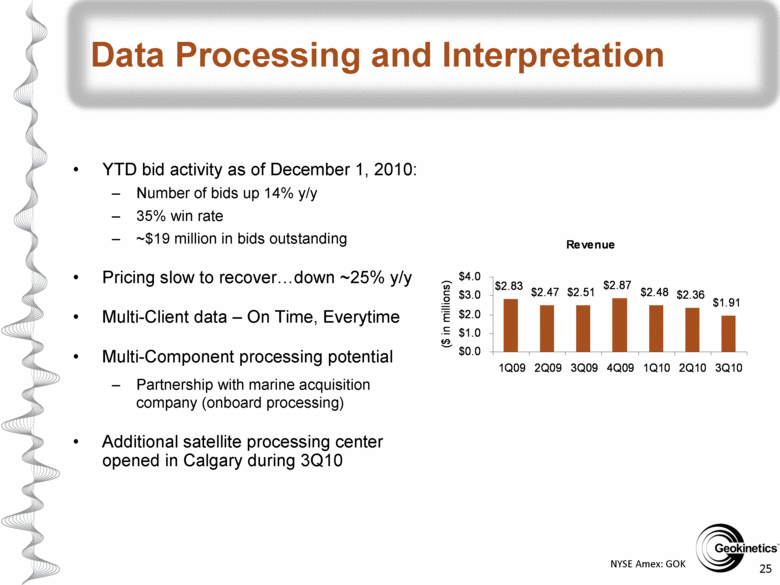
NYSE Amex: GOK 25 Data Processing and Interpretation YTD bid activity as of December 1, 2010: Number of bids up 14% y/y 35% win rate ~$19 million in bids outstanding Pricing slow to recover...down ~25% y/y Multi-Client data – On Time, Everytime Multi-Component processing potential Partnership with marine acquisition company (onboard processing) Additional satellite processing center opened in Calgary during 3Q10 Revenue $2.83 $2.47 $2.51 $2.87 $2.48 $2.36 $1.91 $0.0 $1.0 $2.0 $3.0 $4.0 1Q09 2Q09 3Q09 4Q09 1Q10 2Q10 3Q10 ($ in millions) |
|
|
NYSE Amex: GOK 26 Summary Recent industry challenges and depressed valuation create nice entry point Largest provider of onshore and TZ seismic data acquisition services in the Western Hemisphere (2nd largest world-wide) Growing backlog (81% international as of 9/30/10) with proven ability to execute E&P capital expenditure budgets expected to increase meaningfully Well positioned (infrastructure/assets/people) in profitable high-potential markets Fully trained, local management/technicians in key markets Ability to mobilize crews to most active regions as markets dictate Use of common equipment increases productivity and provides costs savings Uniquely qualified to operate in challenging environments Diversified customer base Extensive Multi-Client library currently focused on U.S. shale plays Underinvestment in energy, combined with declining production and expected GDP growth in many international markets, should ultimately lead to increased demand for our services |
|
|
NYSE Amex: GOK Appendix |
|
|
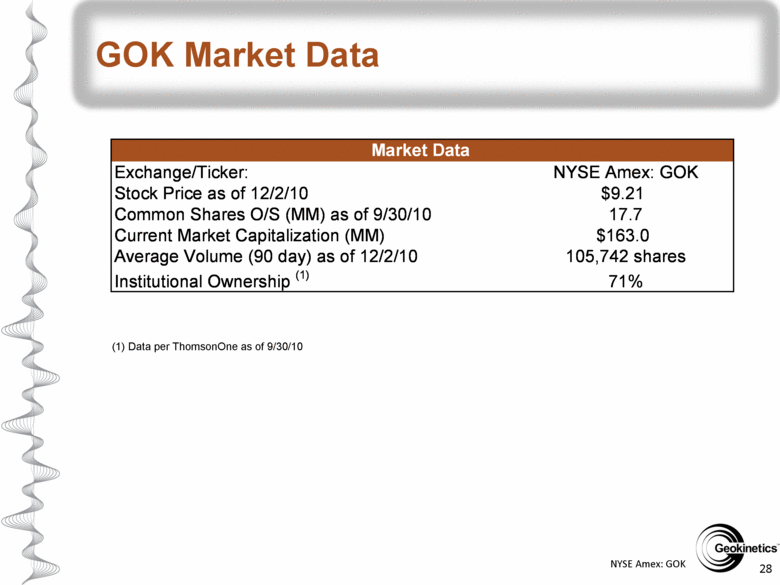
NYSE Amex: GOK 28 GOK Market Data (1) Data per ThomsonOne as of 9/30/10 Exchange/Ticker: NYSE Amex: GOK Stock Price as of 12/2/10 $9.21 Common Shares O/S (MM) as of 9/30/10 17.7 Current Market Capitalization (MM) $163.0 Average Volume (90 day) as of 12/2/10 105,742 shares Institutional Ownership (1) 71% Market Data |
|
|
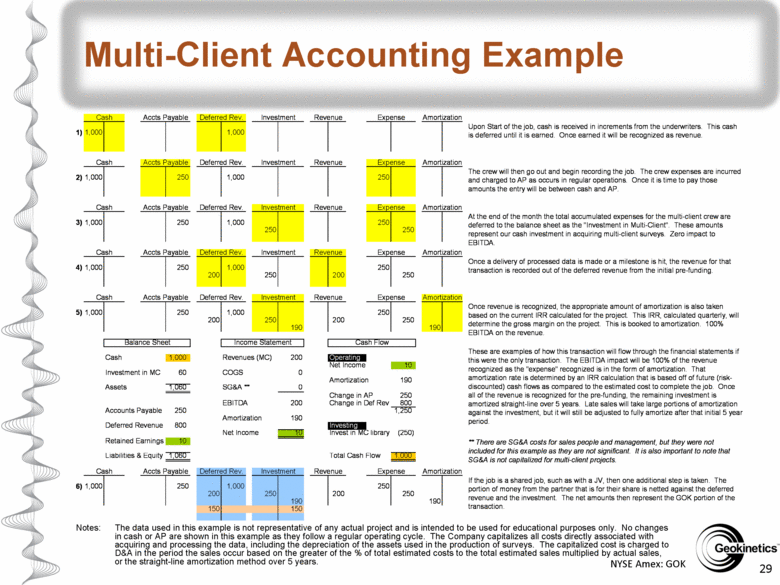
NYSE Amex: GOK 29 Multi-Client Accounting Example Notes: The data used in this example is not representative of any actual project and is intended to be used for educational purposes only. No changes in cash or AP are shown in this example as they follow a regular operating cycle. The Company capitalizes all costs directly associated with acquiring and processing the data, including the depreciation of the assets used in the production of surveys. The capitalized cost is charged to D&A in the period the sales occur based on the greater of the % of total estimated costs to the total estimated sales multiplied by actual sales, or the straight-line amortization method over 5 years. 1,000 1,000 1,000 250 1,000 250 1,000 250 1,000 250 250 250 1,000 250 1,000 250 200 250 200 250 1,000 250 1,000 250 200 250 200 250 190 190 Cash 1,000 Revenues (MC) 200 Operating Net Income 10 Investment in MC 60 COGS 0 Amortization 190 Assets 1,060 SG&A ** 0 Change in AP 250 EBITDA 200 Change in Def Rev 800 Accounts Payable 250 1,250 Amortization 190 Deferred Revenue 800 Investing Net Income 10 Invest in MC library (250) Retained Earnings 10 Liabilities & Equity 1,060 Total Cash Flow 1,000 1,000 250 1,000 250 200 250 200 250 190 190 150 150 Cash Flow Deferred Rev. 6) Cash Accts Payable Deferred Rev. Revenue Expense Cash Amortization 1) 2) 3) 4) 5) Cash Accts Payable Investment Expense Amortization Revenue Revenue Expense Cash Accts Payable Deferred Rev. Investment Accts Payable Deferred Rev. Investment Amortization Amortization Accts Payable Revenue Amortization Cash Deferred Rev. Investment Expense Accts Payable Revenue Cash Deferred Rev. Investment Expense At the end of the month the total accumulated expenses for the multi-client crew are deferred to the balance sheet as the "Investment in Multi-Client". These amounts represent our cash investment in acquiring multi-client surveys. Zero impact to EBITDA. Once a delivery of processed data is made or a milestone is hit, the revenue for that transaction is recorded out of the deferred revenue from the initial pre-funding. Once revenue is recognized, the appropriate amount of amortization is also taken based on the current IRR calculated for the project. This IRR, calculated quarterly, will determine the gross margin on the project. This is booked to amortization. 100% EBITDA on the revenue. Upon Start of the job, cash is received in increments from the underwriters. This cash is deferred until it is earned. Once earned it will be recognized as revenue. The crew will then go out and begin recording the job. The crew expenses are incurred and charged to AP as occurs in regular operations. Once it is time to pay those amounts the entry will be between cash and AP. If the job is a shared job, such as with a JV, then one additional step is taken. The portion of money from the partner that is for their share is netted against the deferred revenue and the investment. The net amounts then represent the GOK portion of the transaction. Balance Sheet These are examples of how this transaction will flow through the financial statements if this were the only transaction. The EBITDA impact will be 100% of the revenue recognized as the "expense" recognized is in the form of amortization. That amortization rate is determined by an IRR calculation that is based off of future (risk- discounted) cash flows as compared to the estimated cost to complete the job. Once all of the revenue is recognized for the pre-funding, the remaining investment is amortized straight-line over 5 years. Late sales will take large portions of amortization against the investment, but it will still be adjusted to fully amortize after that initial 5 year period. ** There are SG&A costs for sales people and management, but they were not included for this example as they are not significant. It is also important to note that SG&A is not capitalized for multi-client projects. Investment Revenue Expense Amortization Income Statement |
|
|
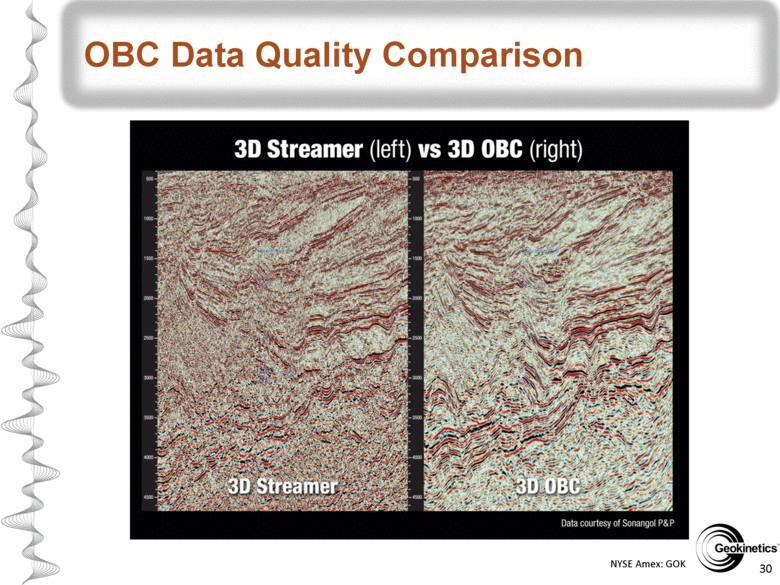
NYSE Amex: GOK 30 OBC Data Quality Comparison |
|
|
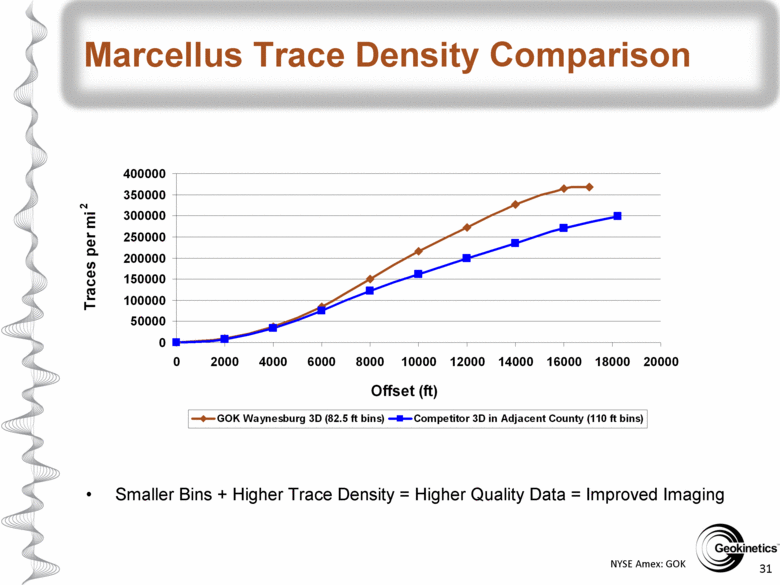
NYSE Amex: GOK 31 Marcellus Trace Density Comparison Smaller Bins + Higher Trace Density = Higher Quality Data = Improved Imaging 0 50000 100000 150000 200000 250000 300000 350000 400000 0 2000 4000 6000 8000 10000 12000 14000 16000 18000 20000 Offset (ft) Traces per mi 2 GOK Waynesburg 3D (82.5 ft bins) Competitor 3D in Adjacent County (110 ft bins) |
|
|
Investor Presentation Thank You For Your Interest |