Attached files
| file | filename |
|---|---|
| EX-21.1 - EX-21.1 - GEOKINETICS INC | a2202936zex-21_1.htm |
| EX-12.1 - EX-12.1 - GEOKINETICS INC | a2202936zex-12_1.htm |
| EX-32.1 - EX-32.1 - GEOKINETICS INC | a2202936zex-32_1.htm |
| EX-31.2 - EX-31.2 - GEOKINETICS INC | a2202936zex-31_2.htm |
| EX-31.1 - EX-31.1 - GEOKINETICS INC | a2202936zex-31_1.htm |
| EX-23.1 - EX-23.1 - GEOKINETICS INC | a2202936zex-23_1.htm |
UNITED STATES
SECURITIES AND EXCHANGE COMMISSION
WASHINGTON, D.C. 20549
FORM 10-K
| ý | ANNUAL REPORT PURSUANT TO SECTION 13 OR 15(d) OF THE SECURITIES EXCHANGE ACT OF 1934 | |
For the fiscal year ended December 31, 2010 |
||
OR |
||
o |
TRANSITION REPORT PURSUANT TO SECTION 13 OR 15(d) OF THE SECURITIES EXCHANGE ACT OF 1934 |
|
Commission file number: 001-33460
GEOKINETICS INC.
(Exact name of registrant as specified in its charter)
| Delaware (State or other jurisdiction of incorporation or organization) |
94-1690082 (I.R.S. Employer Identification No.) |
|
1500 CityWest Blvd., Suite 800 Houston, Texas (Address of principal executive offices) |
77042 (Zip Code) |
(713) 850-7600
(Telephone Number)
Securities registered pursuant to Section 12(b) of the Act:
| Title of Each Class | Name of Each Exchange on Which Registered | |
|---|---|---|
| Common Stock, $0.01 par value | NYSE AMEX |
Securities registered pursuant to Section 12(g) of the Act: None
Indicate by check mark if the registrant is a well-known seasoned issuer, as defined in Rule 405 of the Securities Act. Yes o No ý
Indicate by check mark if the registrant is not required to file reports pursuant to Section 13 or Section 15(d) of the Exchange Act. Yes o No ý
Indicate by check mark whether the registrant (1) has filed all reports required to be filed by Section 13 or 15(d) of the Securities Exchange Act of 1934 during the preceding 12 months (or for such shorter period that the registrant was required to file such reports), and (2) has been subject to such filing requirements for the past 90 days. Yes ý No o
Indicate by check mark whether the registrant has submitted electronically and posted on its corporate Web site, if any, every Interactive Data File required to be submitted and posted pursuant to Rule 405 of Regulation S-T (§232.405 of this chapter) during the preceding 12 months (or for such shorter period that the registrant was required to submit and post such files). Yes o No o
Indicate by check mark if disclosure of delinquent filers pursuant to Item 405 of Regulation S-K is not contained herein, and will not be contained, to the best of registrant's knowledge, in definitive proxy or information statements incorporated by reference in Part III of this Form 10-K or any amendment to this Form 10-K. o
Indicate by check mark whether the registrant is a large accelerated filer, an accelerated filer, a non-accelerated filer, or a smaller reporting company. See the definitions of "large accelerated filer," "accelerated filer" and "smaller reporting company" in Rule 12b-2 of the Exchange Act. (Check one):
| Large Accelerated filer o | Accelerated filer o | Non-accelerated filer o | Smaller reporting company ý |
Indicate by check mark whether the registrant is a shell company (as defined in Rule 12b-2 of the Exchange Act). Yes o No ý
Aggregate market value of the common stock held by non-affiliates of the registrant as of June 30, 2010, computed by reference to the closing sale price of the registrant's common stock on the NYSE AMEX on such date: $40.7 million.
Common Stock, par value $0.01 per share. Shares outstanding on March 15, 2011: 17,804,459 shares
Documents Incorporated by Reference
Portions of the definitive proxy statement for the Registrant's Annual Meeting of Stockholders to be held on June 8, 2011, which the Registrant expects to file with the Securities and Exchange Commission within 120 days after December 31, 2010, are incorporated by reference into Part III of this report.
FORM 10-K
FOR THE FISCAL YEAR ENDED DECEMBER 31, 2010
TABLE OF CONTENTS
1
PART I
Forward Looking Statements
Unless the context otherwise requires, references in this annual report to "the Company," "our company," "the registrant," "we," "our," "us," and "Geokinetics" shall mean Geokinetics Inc. and its consolidated subsidiaries. References in this annual report to "PGS Onshore" refer to certain entities and assets formerly comprising the onshore seismic business of Petroleum Geo-Services ASA. References to the "PGS Onshore acquisition" refer to the Company's acquisition of PGS Onshore, which closed in February 2010, and the related financing of that acquisition.
We have made in this report, and may from time to time otherwise make in other public filings, press releases and discussions with our management, forward-looking statements within the meaning of Section 27A of the Securities Act of 1933 and Section 21E of the Securities Exchange Act of 1934 concerning our operations, economic performance and financial condition. These forward-looking statements are often accompanied by words such as "believe," "should," "anticipate," "plan," "continue," "expect," "potential," "scheduled," "estimate," "project," "intend," "seek," "goal," "may" and similar expressions. These statements include, without limitation, statements about our ability to meet our short-term liquidity needs, our market opportunity, our growth strategy, competition, expected activities, future acquisitions and investments, and the adequacy of our available cash resources. We urge you to read these statements carefully and caution you that matters subject to forward-looking statements involve risks and uncertainties, including economic, regulatory, competitive and other factors that may affect our business. For such statements, we claim the protection of the safe harbor for forward-looking statements contained in the Private Securities Litigation Reform Act of 1995. Although we believe that the expectations reflected in the forward-looking statements are reasonable, we cannot guarantee future results, levels of activity, performance, or achievements; our actual results in future periods may differ materially from those projected or contemplated within the forward-looking statements. As a result of, but not limited to, the following factors:
- •
- our ability to comply with the covenants in our revolving credit facility or to obtain an amendment or waiver of such
covenants if needed;
- •
- our ability to raise capital or sell assets to meet our short-term liquidity needs;
- •
- our ability to successfully integrate PGS Onshore into our existing operations;
- •
- our ability to convert backlog into revenues;
- •
- a decline in capital expenditures by oil and gas exploration and production companies;
- •
- market developments affecting, and other changes in, the demand for seismic data and related services;
- •
- the timing and extent of changes in the price of oil and gas;
- •
- our future capital requirements and availability of financing on satisfactory terms;
- •
- availability or increases in the price of seismic equipment;
- •
- availability of crew personnel and technical personnel;
- •
- competition;
- •
- technological obsolescence of our seismic data acquisition equipment;
- •
- the condition of the capital markets generally, which will be affected by interest rates, foreign currency fluctuations
and general economic conditions;
- •
- the effects of weather or other delays on our operations;
2
- •
- cost and other effects of legal proceedings, settlements, investigations and claims, including liabilities which may not
be covered by indemnity or insurance;
- •
- governmental regulation; and
- •
- the political and economic climate in the foreign or domestic jurisdictions in which we conduct business.
We have also discussed the risks to our business under the caption "Risk Factors" disclosed under Item 1A. Given these risks and uncertainties, we can give no assurances that results projected in any forward-looking statements will in fact occur and therefore caution investors not to place undue reliance on them. We undertake no obligation to publicly update or revise any forward-looking statements, whether as a result of new information, future events or otherwise, except as required by law. In light of these risks, uncertainties and assumptions, the forward-looking events discussed in this report and the documents incorporated by reference herein might not occur.
Available Information
All of our Annual Reports on Form 10-K, Quarterly Reports on Form 10-Q, Current Reports on Form 8-K and all amendments to those reports filed with or furnished to the Securities and Exchange Commission ("SEC") are available free of charge through our Internet Website, http://www.geokinetics.com, as soon as reasonably practical after we have electronically filed such material with, or furnished it to, the SEC. Other information contained on our Internet Website is available for information purposes only and should not be relied upon for investment purposes nor is it incorporated by reference in this Annual Report on Form 10-K. In addition, the SEC maintains an Internet Website containing reports, proxy and information statements, and other information filed electronically at www.sec.gov. You may also read and copy this information, for a copying fee, at the SEC's Public Reference Room at 100 F Street, N.E., Washington, D.C. 20549. Please call the SEC at 1-800-SEC-0330 to obtain information on the operation of the Public Reference Room.
Our Business
We are a full-service, global provider of seismic data acquisition, processing and interpretation services to the oil and natural gas industry. We also provide clients access, via licenses, to our multi-client seismic data library. As an acknowledged industry leader in land, marsh, swamp, transition zone and shallow water (down to 500 feet water depths) ocean-bottom-cable or "OBC" environments, we have the capacity to operate up to 32 seismic crews with approximately 200,000 channels of seismic data acquisition equipment worldwide and the ability to process seismic data collected throughout the world. Crew count, configuration and location can change depending upon industry demand and requirements.
We provide a suite of geophysical services including acquisition of two-dimensional ("2D"), three-dimensional ("3D"), time-lapse four-dimensional ("4D") and multi-component seismic data surveys, data processing and interpretation services and other geophysical services for customers in the oil and natural gas industry, which include many national oil companies, major international oil companies and independent oil and gas exploration and production companies (collectively "E&P companies") in the United States, Canada, Latin America (including Mexico), Africa, Australia, New Zealand, Asia-Pacific and the Middle East. Seismic data is used by E&P companies to identify and analyze drilling prospects, maximize drilling success, optimize field development and enhance production economics. We also own a multi-client data library whereby we maintain full or partial ownership of data acquired for future licensing. Our multi-client data library consists of data covering various areas in the United States,
3
Canada, Brazil, and Australia. For the years ended December 31, 2010, 2009 and 2008, we generated total revenues of $558.1 million, $511.0 million and $474.6 million, respectively.
Developments related to our business during 2010 and into 2011 include the following:
- •
- On February 12, 2010, we consummated the acquisition of PGS Onshore, issued 2.15 million shares of common
stock as partial consideration of the acquisition, refinanced our senior secured revolving credit facility and paid off substantially all our existing capital lease obligations with the combined
proceeds of the issuance of $300.0 million senior notes and $37.0 million common stock offering in 2009.
- •
- Our multi-client data library increased substantially through the PGS Onshore acquisition. We have continued to expand
this library through 2010; including jobs in progress, this library contains approximately 9,700 square miles of 3D data and 2,400 linear miles of 2D data as of March 23, 2011.
- •
- Our backlog increased 47% annually to $557.6 million at December 31, 2010 from $378.2 million at
December 31, 2009 (pro-forma combined with PGS Onshore).
- •
- Bid activity has been strong throughout 2010 and into 2011 as we had approximately $1,130.0 million in outstanding
bids as of March 23, 2011.
- •
- We launched our new Geotiger Series II highly transportable 4 component (4C) OBC crew to the Canadian Arctic and
commenced operations in the second quarter of 2010. This unique crew utilizes the state-of-the-art Sercel Searay 4C OBC system and is capable of being deployed
worldwide in a matter of days via our proprietary Geotiger Series II Marine Fleet. This crew completed its first job in October and is currently operating in Mexico.
- •
- On December 14, 2010, we closed a $30 million private placement of 120,000 shares of a new series of
junior preferred stock (the "Series D Preferred Stock") and warrants (the "2010 Warrants") to purchase 3,495,000 shares of Geokinetics' common stock with affiliates of Avista Capital
Partners ("Avista"), Levant America S.A. ("Levant"), Petroleum Geo-Services ASA and certain of our directors. The proceeds were used to repay indebtedness and for general corporate
purposes.
- •
- On February 12, 2010, our wholly owned subsidiary Geokinetics Holdings (USA), Inc. ("Holdings"), entered into a revolving loan and letters of credit facility, with a group of lenders lead by RBC (the "RBC Facility" or the "revolving credit facility") which initially matured on February 12, 2013. See below. We have continued to work with the lenders under our revolving credit facility to receive the required waivers and increase the available borrowings under the facility. We may borrow up to $40 million, based on a formula defined in the agreement. During 2010, our lenders granted us financial covenant waivers during each of the second, third and fourth quarters. The last amendment of the fourth quarter provides, among other things, adjustments to a monthly maximum total leverage ratio and a monthly minimum interest coverage ratio. It also requires us to adhere to a monthly liquidity test, monthly senior notes interest reserve and monthly cumulative adjusted EBITDA targets commencing with the month ending January 31, 2011 through the month ending December 31, 2011. Furthermore, capital expenditures for the fiscal year 2011 may not exceed $40 million. We complied with these various financial covenants for the months ending January 31, 2011 and February 28, 2011. On April 1, 2011 we entered into a waiver of specific events of default that would have occurred on March 31, 2011 for failure to comply with financial reporting covenant requirements. Additionally, we entered into Amendment No. 4 which modifies certain financial covenant requirements (minimum total leverage ratio and cumulative adjusted EBITDA) and our interest cost. The Amendment also changes the maturity date of the revolving credit facility to April 15, 2012. While we believe we will remain in compliance with the revised covenants through
4
December 31, 2011, our actual results may differ from our forecasts, and may be affected by events beyond our control.
Our Strengths
Leading provider with a balanced global market presence. Our global diversity and exposure to both oil and natural gas exploration opportunities provide us with a balanced market presence, which increases new contract opportunities while reducing our sensitivity to individual markets and commodity price volatility. We have the equipment and trained personnel to deploy up to 32 seismic crews throughout the world. Our size and operating capability allow for improved crew and equipment utilization and the ability to service our customers across the globe. Our long operating history and reputation for quality service encourages customers to continue to select us as their provider of seismic data acquisition services.
Specialized expertise in difficult environments and key high-growth markets. We specialize in seismic data acquisition services in transition zones, shallow water (down to 500 feet water depth) OBC and difficult land environments, which we believe to be underserved and one of the fastest growing segments of the overall seismic services industry. Our extensive experience operating in such complex and challenging areas, including our expertise in designing and utilizing special equipment customized for these environments, provides us a significant competitive advantage. We also have experience operating in local markets within key high growth regions around the world, such as the United States, Latin America, and Australia. In addition, we possess the expertise required to operate in challenging environments around the world which positions us to potentially realize higher operating margins than we realize on more traditional land seismic projects.
Strong relationships with a globally diversified customer base. We have strong, long-standing relationships with a diverse customer base consisting of national oil companies, super majors, majors and independent E&P Companies in over 30 countries. We have been providing seismic data acquisition services to the petroleum industry for over sixty years. Our global operating capability and sizable crew count allow us to leverage relationships with our customers and increase revenues by providing services throughout the world and tailoring crew sizes to meet their requirements. Our customer base is diversified and it is not dependent on any one customer. For the year ended December 31, 2010, one single customer accounted for 10% of our total revenues.
Strong backlog that provides significant revenue visibility. Our backlog increased 47% annually to $557.6 million at December 31, 2010 from $378.2 million at December 31, 2009 (pro-forma combined with PGS Onshore). The strength of our backlog is due in part to our strong relationships with national oil companies whose capital budgets are less dependent on commodity prices than many of the independent exploration and production companies. We estimate our total seismic data acquisition and seismic data processing revenue backlog to be $557.6 million as of December 31, 2010, of which $143.5 million is for North American (excluding Mexico) projects and $414.1 million is for international projects. On a pro-forma basis for the PGS Onshore acquisition, total backlog was $378.2 million as of December 31, 2009, of which $89.0 million was for North American projects and $289.2 million was for international projects.
Multi-client library. As of March 23, 2011, we have completed acquisition on approximately 7,500 square miles of 3D data and 1,100 linear miles of 2D data. The PGS Onshore acquisition increased our multi-client library by approximately 5,500 square miles of 3D data. We believe there continues to be significant opportunities in North America, specifically in the unconventional resource plays, for the continued expansion of our multi-client library business. As we grow our multi-client library, we plan to continue to secure a significant portion of prefunded sales prior to commencing any multi-client project.
5
Highly experienced management team and strategic equity investors. We draw on the global experience of our management team to maintain our leading market position and strong customer relationships. Our senior executive management team has an average of over 25 years of relevant industry experience in the seismic services sector as well as in oil and gas exploration, with a demonstrated track record. Our largest stockholder is Avista Capital Partners, L.P. or "Avista" and its respective affiliates, which initially invested in us at the time of our merger with Grant Geophysical in 2006. Avista brings significant experience as an investor in the oilfield service sector. Our second largest stockholder is, as a result of the PGS Onshore acquisition, Petroleum Geo-Services ASA, a leading geophysical services provider with deep industry knowledge.
Our Strategy
Enhance asset utilization and operating efficiency. Through greater customer and geographic diversification, upgraded equipment and improved crew capabilities, we seek to enhance the continuity of our seismic crews, the utilization of our equipment and our operating efficiency, which we expect will generate increased revenues and higher margins. Expanding our customer base and presence internationally will allow us to better manage our resources and minimize our reliance on certain customers, reduce downtime between projects and limit the effects of seasonality and cyclicality on our business.
Throughout 2010 we continually kept crews in ready mode rather than our normal practice of shutting them down and demobilizing from the area in the expectation of new jobs that didn't materialize. As we absorbed PGS Onshore into our operations we also decentralized and pushed more decisions and job functions into the regions. These two factors coupled with one particular job towards the end of 2010 caused a significant loss and cash drain that we did not anticipate going into the year.
As a result we have revised our strategy and returned to our tried and trusted method of immediately shutting down the crew, eliminating any excess personnel and returning the equipment to a strategic base ready for the next opportunity. We are also in the process of centralizing our management services which we believe will provide a higher level of service at a greatly reduced cost. Our main focus in 2011 is cash management, and we believe we can best achieve this goal by limiting our exposure to countries and regions that offer long term and continuous new job opportunities. We will also continue to focus on transition zone and shallow water OBC work, but we will also focus on environmentally sensitive areas where our expertise and recently introduced equipment innovations should allow us to charge a premium for our services. At our clients request we will also offer our services in other areas but will cover risk, mobilization and lack of follow on work with improved contract terms and fee structure.
Maintain focus and specialization in profitable, high-potential markets. To maximize profitability, we will continue to target our growth in areas in which we believe we have a competitive advantage, such as transition zones, shallow water (down to 500 feet water depths) OBC and difficult land environments. We believe these areas continue to be underserved and represent the fastest growing segments of the overall seismic services market. We also plan to further expand the types of services offered in existing and new high-potential markets throughout the world to diversify our customer base and capitalize on opportunities in our areas of operations.
Prudently invest in new and technologically-advanced equipment. We believe growth in demand for our seismic services will continue to be enhanced by the development and application of new technologies, particularly for use in difficult land environments, transition zones, shallow water, and environmentally sensitive areas. We will continue to acquire and develop expertise in utilizing technologically-advanced equipment to perform our services. In addition, we have upgraded and will continue to upgrade our existing equipment, primarily for our transition zone and ocean-bottom cable
6
operations, to improve operating efficiency and to equip us for larger crew sizes, which we expect to lead to increased operating margins.
Throughout the business cycle, we continue to develop innovations for increasing data quality and crew productivity while minimizing environmental impact and enhancing safety. In 2010, we brought to market our new onSEIS energy source units. These onSEIS units are relatively compact, lightweight and highly mobile and use our proprietary synchronization technology to acquire high-quality data in areas that are currently off-limits or inaccessible to the use of other energy sources. Later this year, we plan to offer an environmentally sensitive marine vibrator as another shallow water energy source option for our customers. These units will allow us to acquire high-quality data in environmentally sensitive areas without the use of noisy air guns or dynamite. Our marine vibrator energy source units emit very low levels of ambient noise and are designed to have no negative impact on fish or sea mammals. We have an exclusive license to use marine vibrator technology, originally developed by Petroleum Geo-Services ASA ("PGS"), in shallow water environments.
Make strategic investments in our multi-client data library. We believe that opportunities exist for us to continue to build and expand our multi-client data library in areas that will provide a high likelihood for future revenues. We will continue to acquire multi-client data by either using a joint venture partner when deemed prudent or on our own with a particular near-term focus on the unconventional resource plays in the United States.
Provide a broad range of services. We believe there are significant global opportunities in providing customers a broad range of seismic data services, from acquisition and processing to interpretation and management and partnering with E&P companies for multi-client library projects. Customers are increasingly seeking integrated solutions to better evaluate known oil and gas deposits and improve the amount of recoverable hydrocarbons. Given our size and technological capabilities, we believe we have the infrastructure to significantly expand these multiple service offerings that add value and efficiency for our customers.
Industry Overview
Seismic surveys enable E&P companies to determine whether subsurface conditions are favorable for finding oil and natural gas accumulations and to determine the size and structure of previously identified oil and natural gas deposits. Seismic surveys consist of the acquisition and processing of 2D, 3D, time-lapse 4D and multi-component seismic data, which is used to produce computer-generated, graphic cross-sections, maps and 3D images of the subsurface. These resulting images are then analyzed and interpreted by geophysicists and used by E&P companies to assist in acquiring prospective oil and natural gas drilling rights, select drilling locations on exploratory prospects and to manage and develop producing reservoirs.
Seismic data is acquired by crews operating on land and in, transition zone and marine environments. Seismic data is generated by the propagation of sound waves near the earth's surface by controlled energy sources, such as dynamite or vibration equipment. The waves radiate into the earth and are reflected back to the surface and collected by data collection devices known in the industry as "geophones." Multiple geophones are strategically positioned, according to client requirements, and connected as a single recording channel or as multi-component recording channels to acquire data. For OBC operations, an assembly of vertically oriented geophones and hydrophones connected by electrical wires typically is deployed on the sea floor to record and relay data to a seismic recording vessel. Such systems were originally introduced to enable surveying in areas of obstructions (such as production platforms) or shallow water inaccessible to ships towing seismic streamers (submerged cables). The data is subsequently processed by experienced and highly technically skilled geoscientists using advanced computing systems running proprietary software designed specifically to enhance the recorded signal by attenuating, to improve resolution and to produce an accurate image of the subsurface geological
7
features. 3D seismic surveys collect far more information and generate significantly greater detail of the underlying reservoirs than 2D surveys.
The overall demand for seismic data and related seismic services is dependent upon spending by E&P companies for exploration, production, development and field management activities, which, in turn, is driven largely by present and expected future prices for oil and natural gas and the need to replenish drilling prospects and reserves. This is impacted by supply and demand, global and local events, as well as political, economic and environmental considerations. Demand for seismic data acquisition in North America is particularly driven by natural gas prices, with international demand typically driven by oil prices. However, there has been a recent shift by E&P companies in North America to target natural gas liquids ("NGL's") and oil as North American natural gas prices tend to be highly volatile. Since mid-2008, the spot price for Henry Hub natural gas has ranged from a high of $13.31 per MMBtu on July 2, 2008, to a low of $1.88 on September 4, 2009. As of March 15, 2011, the spot price for Henry Hub natural gas was $3.89 per MMBtu, and the twelve month strip, or the average of the next twelve months' futures contract, was $3.96 per MMBtu. Many factors combined to cause natural gas prices to decline to extremely depressed levels during the late summer and fall of 2009 from its recent high in mid-2008. The worldwide economic downturn resulted in reduced energy consumption, creating a sharp decline in the demand for natural gas. On the supply side, increases in onshore production in North America, driven by a significant increase in onshore drilling activity through mid-2008 and increased activity in prolific unconventional natural gas basins also put downward pressure on natural gas prices. Natural gas prices have recovered from the September 2009 low, but still remain depressed. Expectations for an economic rebound leading to a recovery in industrial demand for natural gas have been overshadowed by the current natural gas supply overhang in the United States. The decline in North American drilling activity from its 2008 peak did not lead to the production declines many had expected, and drilling activity has since rebounded to near peak levels. These factors, together with weather, will likely remain key drivers in the natural gas market for the foreseeable future. Oil prices also declined significantly from mid-2008 to early 2009 as a result of the anticipated effects of global economic weakness, increase in oil inventories relative to consumption and a strengthening in the U.S. dollar. The price of West Texas intermediate crude ("WTI") declined from $145.29 on July 3, 2008, to a multi-year low of $31.41 on December 22, 2008. However, oil prices have since recovered meaningfully to $98.61 as of March 15, 2011, and expectations are for oil prices to remain elevated for the foreseeable future.
Global energy demand growth. We believe that long-term, global demand for energy will increase and that as demand continues to rebound, demand from E&P companies for seismic services will also increase.
Recent civil unrest in several of our markets. During 2011, several governments in oil producing regions in North Africa and the Middle East have experienced civil unrest. We conduct business and have equipment in several of these countries, including Libya, Tunisia, Algeria and Egypt. This civil unrest, and the imposition of sanctions on some of these regimes by the United States in connection with the civil unrest, has made the conduct of our business in these locations more difficult, and in some cases impossible, and could lead to the loss of equipment and future business opportunities.
E&P capital spending. The need to replace depleting reserves should encourage capital expenditures by E&P companies, which we expect will benefit the seismic services industry. We believe that E&P companies, including many national oil and gas companies, remain under pressure to increase or replenish reserves and are looking to unconventional resource plays, transition zones, international locations and the optimization of current reserves with new technology to achieve these results. Seismic data acquisition services are a key component of E&P companies' capital expenditure programs.
8
Technological development. The application and utilization of seismic services have considerably increased over the last several years as a result of significant technological advancements, such as the move from 2D to 3D and single-component to multi-component seismic data recording and processing. Seismic services can now be applied to the entire sequence of exploration, development and production, as opposed to exploration only, allowing for a greater range of use for our services. Additionally, surveys previously shot 2D or single-component are often being reshot with newer techniques to give greater clarity to the subsurface.
Regulatory environment. In response to the oil spill in the Gulf of Mexico during 2010 and in connection with concerns raised related to the hydraulic fracturing ("fracking") of unconventional resource plays, the United States Congress is considering a number of legislative proposals relating to the upstream oil and gas industry both onshore and offshore that could result in significant additional laws or regulations governing operations in the United States. Additionally, governments around the world have become increasingly focused on similar regulatory matters which may result in significant changes in laws or regulations elsewhere. While we do not provide seismic services in the deepwater, our customers include national and international oil companies involved in deepwater drilling projects. In the past we have conducted transition area and ocean bottom seismic acquisition surveys in the Gulf, and may do so in the future. Although it is not possible at this time to predict whether proposed legislation or regulations will be adopted, or how legislation or new regulation that may be adopted would impact our business, any such future laws and regulations could result in increased compliance costs or additional operating restrictions for our customers. Additional costs or operating restrictions associated with legislation or regulations could have a material adverse effect on our customer's operating results and cash flows, which could also negatively impact the demand for our services. Conversely, capital that was previously dedicated to the Gulf of Mexico may be redirected onshore in the near-term, which could positively impact demand for our services.
Business Segments
We are organized into two reportable segments: seismic data acquisition and seismic data processing and interpretation. We further break down our seismic data acquisition segment into two geographic reporting units: North American seismic data acquisition and international seismic data acquisition. For the fiscal years ending December 31, 2010, 2009 and 2008, our North American seismic data acquisition services represented 36%, 16% and 37%, international seismic data acquisition services represented 62%, 82% and 60% and data processing and interpretation services represented 2%, 2% and 3% of total revenues, respectively. We continue to focus on diversifying and expanding into new international markets and expect international data acquisition revenues to continue to provide the majority of total revenues.
Seismic Data Acquisition Services
Through our subsidiaries, we engage in seismic data acquisition services in land, transition zone and shallow water environments on a contract basis for our customers. Our equipment is capable of collecting 2D, 3D, time-lapse 4D and multi-component seismic data. We own approximately 200,000 channels of seismic data acquisition equipment that can be configured to operate up to 32 crews worldwide. Most of our seismic data acquisition services involve 3D surveys. The crews are scalable and specially configured for each project; the number of individuals on each crew is dependent upon the size and nature of the seismic survey requested by the customer.
On a typical land seismic survey, the seismic recording crew is supported by a surveying crew and a drilling crew. The surveying crew lays out the line locations to be recorded and identifies the sites for shot-hole placement. The drilling crew creates the holes for the explosive charges that produce the necessary acoustical impulse. A mechanical vibrating unit is used in areas where explosives are not utilized. The seismic crew lays out the geophones and recording instruments, directs shooting
9
operations and records the acoustical signal reflected from subsurface strata. In the United States and Canada, the survey crew and drill crew are typically provided by third parties and supervised by our personnel. Outside the United States and Canada, we perform our own surveying and drilling. A fully staffed seismic land crew typically consists of at least one party manager, observer, head linesman and crew laborers. The number of individuals on each crew is dependent upon the size and nature of the seismic survey requested by the customer and can be extensive in certain parts of the world. We use helicopters to assist the crews in seismic data acquisition services in circumstances where such use will reduce overall costs and improve productivity. A typical transition zone or OBC crew utilizes numerous support vessels and air guns as the energy source that produces the acoustical impulse needed to record seismic data.
Typically, our contracts provide that the seismic data we acquire is the exclusive property of the customer. However, we also collect and process geophysical data for our own account and retain ownership rights. We license the data to customers on a non-transferable basis. In most circumstances, prior to collecting and processing such data, we sell the rights on a non-exclusive basis to one or more E&P companies, which covers the majority, if not all, of the expected costs. We then license the same data to other companies to generate additional revenues. For the years ended December 31, 2010, 2009 and 2008, seismic data acquisition services generated revenues of $549.1 million, $500.3 million and $462.6 million, respectively. Of these segment revenues, for the year ended December 31, 2010, North American operations accounted for 36% and international operations accounted for 64%.
Seismic data acquisition services contracts, whether bid or negotiated, provide for payment on either a turnkey or term (also referred to as "day-rate") basis, or on a combination of both methods. A turnkey contract provides for a fixed fee to be paid for data acquired. Such a contract causes us to bear varying degrees of business interruption risk caused by weather delays and other hazards. Our seismic data acquisition services are performed outdoors and are therefore subject to weather and seasonality. Term contracts provide for payments based on agreed rates per units of time, which may be expressed in periods ranging from days to months. This type of contract causes the customer to bear the majority of the business interruption risks. When a combination of both turnkey and term methods is used, the risk of business interruption is shared by us and the customer. In either case, progress payments are usually required unless it is expected the job can be accomplished in a short period. Our contracts for seismic data acquisition services are predominantly turnkey contracts.
Seismic Data Processing
We also provide a full suite of onshore and offshore proprietary seismic data processing and interpretation products and services to complement our data acquisition services. Seismic data is processed to produce an image of the earth's subsurface using proprietary computer software and internally developed techniques. Our seismic data processing and interpretation centers are located in the United States, England, Brazil, Angola, Mexico, and Canada. We can process and provide interpretation of 2D, 3D, time-lapse 4D and multi-component seismic data acquired by our own crews as well as data acquired by other seismic data acquisition companies.
Our data processing and interpretation centers facilitate the penetration of a wider range of geographic markets, provide access to worldwide technology trends, strengthen our overall seismic and management expertise and enable access to the data our crews acquire to more effectively service our clients. A majority of our seismic data processing and interpretation services are performed on 3D seismic data. We also re-process older seismic data using new techniques designed to enhance the quality of the result. Substantially all of our data processing services contracts are on a turnkey basis.
The seismic data processing services industry is highly technical and the technological requirements for the acquisition and processing of seismic data have increased continuously over time. Thus, we must continually take steps to ensure that our technological capabilities are comparable or superior to those
10
of our competitors, whether through continuing research and development, strategic alliances with equipment manufacturers or acquisitions of technology through licenses from others. We have introduced several technological innovations that have become industry-standard products in the seismic data processing business, including our proprietary amplitude variation with offset ("AVO") reflectivity process. Since 2005, we have made significant investments to upgrade our technology in the areas of pre-stack time and depth imaging, multi-component and 4D seismic data processing through technology joint ventures and proprietary developments. Our Gulf of Mexico well log database and rock properties database continue to be unique products offered in the seismic data processing and interpretation services area. We actively market our seismic data processing and interpretation services in conjunction with our seismic data acquisition services to enhance total value provided to our customers.
Marketing
Our seismic data acquisition services and seismic data processing and interpretation services are marketed from various offices around the world. We maintain offices in North America, Latin America, Europe, the Middle East, Africa, and Asia Pacific, including our corporate headquarters in Houston, Texas, from which we market and/or perform services.
Seismic data acquisition services and seismic data processing and interpretation services contracts are obtained either through competitive bidding in response to invitations to bid, or by direct negotiation with a prospective customer. A significant portion of our contracts result from competitive bidding. Contracts are generally denominated in U.S. dollars and are awarded primarily on the basis of price, experience, availability, technological expertise and reputation for dependability and safety.
Our regional personnel communicate directly with existing and target customers during the bid preparation process. With the involvement and review of senior management, bids are prepared by knowledgeable regional operations managers who understand their respective markets, customers and operating conditions. Furthermore, the regional personnel are able to convey the superior technical services we provide and communicate the advantages of providing data processing and interpretive services in conjunction with seismic data acquisition. Most of our revenue is generated through repeat customer sales and new sales to customers referred by our existing and past clients. We believe this is due to the solid long-term relationships we share with our customer base combined with our favorable industry reputation and the experience and skills of our personnel.
Customers
For the year ended December 31, 2010, our top ten customers represented 50% of our consolidated revenue for 2010. Our two largest customers in 2010, two national oil companies ("NOCs"), accounted for 10% and 8% of total revenue, respectively. Because of the nature of our contracts and customers' projects, our largest customers can change from year to year and the largest customers in any year may not be indicative of the largest customers in any subsequent year.
Backlog
We grew our backlog from $190.2 million as of December 31, 2009 to $557.6 million as of December 31, 2010, despite various project commencement delays and job cancellations in the first half of the year due to uncertainty surrounding the overall economy. On a pro-forma basis for the PGS Onshore acquisition, total backlog was $378.2 million as of December 31, 2009. Backlog at December 31, 2010 included $414.1 million or 74% from international projects, and $143.5 million or 26% from North American (excluding Mexico) projects, of which approximately $81.3 million is attributable to the multi-client business in the United States. Of the total international backlog, approximately $252.0 million or 61% is with NOCs or partnerships including NOCs. Furthermore, approximately $209.8 million or 51% of the international backlog is in shallow water transition zones
11
and OBC environments. We anticipate that approximately 86% of the backlog at December 31, 2010 will be completed in 2011 with the remaining amount to be completed in 2012. This backlog consists of written orders or commitments believed to be firm. Contracts for services are occasionally modified by mutual consent and in many instances can be cancelled by the customer on short notice without penalty. As a result, our backlog as of any particular date may not be indicative of our actual operating results for any succeeding fiscal period.
Competition
The acquisition and processing of seismic data for the oil and natural gas industry are highly competitive businesses. Competition is based on the type and capability of equipment used to conduct seismic surveys and the availability of such equipment. In addition to these factors, price, experience, availability, technological expertise and reputation for dependability and safety of a crew significantly affect a potential customer's decision to award a contract to us or one of our competitors. In addition, in the international markets in which we operate, we compete with various smaller local competitors.
Regulation
Our operations are subject to numerous international, federal, state and local laws and regulations. These laws and regulations govern various aspects of operations, including the discharge of explosive materials into the environment, requiring the removal and clean-up of materials that may harm the environment or otherwise relating to the protection of the environment and access to private and governmental land to conduct seismic surveys. We believe we have conducted our operations in substantial compliance with applicable laws and regulations governing our activities.
Our Quality, Health, Safety and Environmental ("QHSE") department is generally responsible for our meeting and remaining in compliance with certain regulatory requirements. We have QHSE Advisors who maintain and administer these programs for our field personnel. The costs of acquiring permits and remaining in compliance with environmental laws and regulations, title research, environmental studies, archeological surveys and cultured resource surveys are generally borne by our customers.
Although our direct costs of complying with applicable laws and regulations have historically not been material, the changing nature of such laws and regulations makes it impossible to predict the cost or impact of such laws and regulations on our future operations. Additional United States or foreign government laws or regulations would likely increase the compliance and insurance costs associated with our customers' operations. Significant increases in compliance expenses for our customers could have a material adverse effect on our customers' operating results and cash flows, which could also negatively impact the demand for our services.
Research and Development
We rely on certain proprietary information, proprietary software, trade secrets and confidentiality and licensing agreements to conduct our current operations. Our future success will depend, in part, on our ability to maintain and preserve our intellectual property without infringing on the rights of any third parties. There can be no assurance that we will be successful in protecting our intellectual property or that our competitors will not develop technologies that are substantially equivalent or superior to our technologies. We are continuously working to improve our technology and operating techniques, through internal development activities, and working with our vendors to develop new technologies.
12
Employees
At December 31, 2010, we had approximately 5,200 full time equivalent employees. Some of our employees are a party to collective bargaining agreements in certain international locations. We consider relations with our employees to be good.
Capital Expenditures
Our Board of Directors has approved a capital expenditure budget for 2011 of approximately $38.0 million, which is a decrease of 20.0% from capital expenditures in 2010. We expect investments in 2011 to be primarily targeted toward maintenance capital expenditures.
In addition, our Board of Directors has approved multi-client data library investments for 2011 of approximately $92.0 million subject to certain minimum pre-funding levels. We expect our investments in 2011 to be primarily focused on the expansion of our existing multi-client data library interests in the Marcellus Shale in Pennsylvania and West Virginia, Haynesville Shale in the East Texas basin, and in the Niobrara Shale in Colorado and Wyoming.
The following risk factors, which are not all-inclusive, should be carefully considered, together with the other information in this Form 10-K, in evaluating us. If any of the following risks were to actually occur, our business, financial condition and results of operations could be materially affected.
Risks Related to our Business
We are subject to certain risks related to acquisitions and these risks may materially adversely affect our revenues, expenses, operating results and financial condition.
The PGS Onshore acquisition involved the integration of Geokinetics and PGS Onshore, two businesses that have previously operated independently and as competitors. We acquired PGS Onshore with the expectation that, among other things, the PGS Onshore acquisition would enable us to achieve cost synergies.
We plan to evaluate opportunities to grow through acquisitions of companies and assets. There can be no assurance that attractive acquisition opportunities will be available or economical or that we will be successful in making such acquisitions in the future. We must plan and manage our acquisitions effectively to achieve revenue growth and maintain profitability in our evolving market. If we fail to manage current and future acquisitions effectively, our results of operations could be adversely affected. Our growth has placed, and is expected to continue to place, significant demands on our personnel, management and other resources. A lack of continued improvement to our operational, financial, management and legal/compliance information systems to keep pace with the growth of our business could have a material adverse effect on us.
Any future acquisitions could present a number of risks, including but not limited to:
- •
- incorrect assumptions regarding the future results of acquired operations, assets, planned cost reductions or other
synergies expected to be realized as a result of acquiring operations or assets;
- •
- failure to integrate the operations or management of any acquired operations or assets successfully and timely and retain
key personnel; and
- •
- our inability to secure, on terms we find acceptable, sufficient financing that may be required for any such acquisition or investment.
Our failure to successfully integrate our acquisitions in a timely and cost effective manner could have an adverse effect on our business, financial condition or results of operations.
13
Our business largely depends on the levels of exploration and development activity in the oil and natural gas industry. A decrease in this activity caused by low oil and gas prices, reduced demand or other factors will have an adverse effect on our business, liquidity and results of operations.
Our business is substantially dependent upon the condition of the oil and natural gas industry and, in particular, the willingness of oil and gas companies to make capital expenditures for exploration, development and production operations. The level of capital expenditures generally depends on the prevailing views of future oil and natural gas prices, which are influenced by numerous factors, including but not limited to:
- •
- changes in United States and international economic conditions, including the length and severity of the recent recession
and the effect of such recession on economic activity;
- •
- demand for oil and natural gas;
- •
- worldwide political conditions, particularly in significant oil-producing regions such as the Middle East,
West Africa and Latin America;
- •
- actions taken by the Organization of Petroleum Exporting Countries, or OPEC;
- •
- the availability and discovery rate of new oil and natural gas reserves;
- •
- the rate of decline of existing and new oil and gas reserves;
- •
- the cost of exploration for, and production and transportation of, oil and natural gas;
- •
- the ability of E&P companies to generate funds or otherwise obtain external capital for exploration, development,
construction and production operations;
- •
- the sale and expiration dates of leases in the United States and overseas;
- •
- technological advances affecting energy exploration, production, transportation and consumption;
- •
- weather conditions;
- •
- environmental or other government regulations both domestic and foreign;
- •
- domestic and foreign tax policies; and
- •
- the pace adopted by foreign governments for the exploration, development and production of their oil and gas reserves.
While prices for oil remain near historical highs, prices for natural gas have been relatively depressed recently. The natural gas market is a key market for our North American seismic data acquisition business and the multi-client data library business. A worldwide decrease in hydrocarbon demand and a decline in commodity prices have caused many oil and gas companies to curtail planned capital spending. Historically, demand for our services has been sensitive to the level of exploration spending by oil and gas companies. A sustained period of low drilling and production activity, low commodity prices or reductions in industry budgets could reduce demand for our services and would likely have a material adverse effect on our business, financial condition or results of operations.
We operate under hazardous conditions that subject us and our employees to risk of damage to property or personal injury and limitations on our insurance coverage may expose us to potentially significant liability costs.
Our activities are often conducted in dangerous environments and include hazardous conditions, including operation of heavy equipment, the detonation of explosives, and operations in remote areas of developing countries. Operating in such environments, and under such conditions, carries with it inherent risks, such as loss of human life or equipment, as well as the risk of downtime or reduced
14
productivity resulting from equipment failures caused by an adverse operating environment. These risks could cause us to experience equipment losses, injuries to our personnel and interruptions in our business. Although we maintain what we believe is prudent insurance protection, we cannot assure that our insurance will be sufficient or adequate to cover all losses or liabilities or that insurance will continue to be available to us or available to us on acceptable terms. A successful claim for which we are not fully insured, or which exceeds the policy limits of our applicable insurance could have a material adverse effect on our financial condition. Moreover, we do not carry business interruption insurance with respect to our operations.
Historically, we have been dependent on a few customers operating in a single industry; the loss of one or more customers could adversely affect our financial condition and results of operations.
Our customers are engaged in the oil and natural gas drilling business throughout the world. Historically, we have been dependent upon a few customers for a significant portion of our revenue. For the years ended December 31, 2010, 2009 and 2008, our top ten customers collectively represented approximately 50%, 70%, and 47% of total revenues, respectively. Our three largest customers in 2010, 2009 and 2008 accounted for approximately 25%, 45%, and 19% of total revenues, respectively. This concentration of customers may increase our overall exposure to credit risk, and customers will likely be similarly affected by changes in economic and industry conditions. If any of these significant clients were to terminate their contracts or fail to contract for our services in the future because they are acquired, alter their exploration or development strategy, or for any other reason, our results of operations could be adversely affected.
We have invested, and expect to continue to invest, significant amounts of money in acquiring and processing seismic data for multi-client surveys and for our seismic data library without knowing precisely how much of this seismic data we will be able to sell or when and at what price we will be able to sell such data.
Multi-client surveys and the resulting seismic data library are an increasingly important part of our business and our future investments. We invest significant amounts of money in acquiring and processing seismic data that we own. By making such investments, we are exposed to the following risks:
- •
- We may not fully recover our costs of acquiring, processing and interpreting seismic data through future sales. The
amounts of these data sales are uncertain and depend on a variety of factors, many of which are beyond our control.
- •
- The timing of these sales is unpredictable and can vary greatly from period to period. The costs of each survey are
capitalized and then amortized over the expected useful life of the data. This amortization will affect our earnings and when combined with the sporadic nature of sales, will result in increased
earnings volatility.
- •
- Regulatory changes that affect the ability of E&P companies to drill, either generally or in a specific location where we
have acquired seismic data, could materially adversely affect the value of the seismic data contained in our library. Technology changes could also make existing data sets obsolete. Additionally, each
of our individual surveys has a limited book life based on its location and interest of E&P companies to explore in prospecting for reserves in such location, so a particular survey may be subject to
a significant decline in value beyond our initial estimates.
- •
- The value of our multi-client data could be significantly adversely affected if any material adverse change occurs in the general prospects for oil and gas exploration, development and production activities.
15
- •
- The cost estimates upon which we base our pre-commitments of funding could be wrong. The result could be losses that have a material adverse effect on our financial condition and results of operations. These pre-commitments of funding are subject to the creditworthiness of our clients. In the event that a client refuses or is unable to pay its commitment, we could lose a material amount of money.
Any reduction in the market value of such data will require us to write down its recorded value, which could have a significant material adverse effect on our results of operations.
The seismic data acquisition services industry is capital intensive and sources of cash to finance our capital expenditures may not always be available. If financing is not available, our results of operations will be negatively affected.
Seismic data acquisition equipment is continually being improved with new technology. In order to remain competitive, we must continue to invest additional capital to maintain, upgrade and expand our seismic data acquisition capabilities. Seismic data acquisition equipment is expensive and our ability to operate and expand our business operations is dependent upon the availability of internally generated cash flow and financing alternatives. Such financing may consist of bank or commercial debt, equity or debt securities or any combination thereof. There can be no assurance that we will be successful in obtaining sufficient capital to upgrade and expand our current operations through cash from operations or additional financing or other transactions if and when required on terms acceptable to us. Due to the uncertainties surrounding the changing market for seismic services, increases in capital and technological requirements, and other matters associated with our operations, we are unable to estimate the amount or terms of any financing that we may need to acquire, upgrade and maintain seismic equipment. If we are unable to obtain such financing, if and when needed, we may be forced to curtail our business objectives, and to finance our business activities with only such internally generated funds as may then be available.
Our high level of fixed costs can leave us vulnerable to downturns in revenues, which can result in losses.
We are subject to high fixed costs which primarily consist of depreciation, maintenance expenses associated with our seismic data acquisition, processing and interpretation equipment and certain crew costs. Extended periods of significant downtime or low productivity caused by reduced demand, weather interruptions, equipment failures, permit delays or other causes could reduce our profitability and have a material adverse effect on our financial condition and results of operations because we will not be able to reduce our fixed costs as fast as revenues decline.
We face intense competition in our business that could result in downward pricing pressure and the loss of market share.
Competition among seismic contractors historically has been, and likely will continue to be, intense. Competitive factors have in recent years included price, crew experience, equipment availability, technological expertise and reputation for quality and dependability. We also face increasing competition from nationally-owned companies in various international jurisdictions that operate under less significant financial constraints than those we experience. Additionally, the seismic data acquisition services business is extremely price competitive and has a history of protracted periods where seismic contractors under financial duress bid jobs below cost and therefore adversely impact industry pricing. Competition from these and other competitors could result in downward pricing pressure and the loss of market share.
16
We rely on a limited number of key suppliers for specific seismic services and equipment. Loss of any of these suppliers could have a material adverse effect on our business.
We depend on a limited number of third parties to supply us with specific seismic services and equipment. From time to time, increased demand for seismic data acquisition services has decreased the available supply of new seismic equipment, resulting in extended delivery dates on orders. Any delay in obtaining equipment could delay our implementation of additional crews and restrict the productivity of our existing crews, adversely affecting our business and results of operations. In addition, any adverse change in the terms of our supplier arrangements could affect our results of operations.
Revenue derived from our projects may not be sufficient to cover our costs of completing those projects or may not result in the profit we anticipated when we entered into the contract. Therefore, our results of operations may be adversely affected.
Our revenue is determined, in part, by the price we receive for our services, the productivity of our crew and the accuracy of our cost estimates. Our crew's productivity is partly a function of external factors, such as weather and third party delays, over which we have no control. In addition, cost estimates for our projects may be inadequate due to unknown factors associated with the work to be performed and market conditions, resulting in cost over-runs. If our crew encounters operational difficulties or delays, or if we have not correctly priced our services, our results of operation may vary, and in some cases, may be adversely affected.
Many of our projects are performed on a turnkey basis where a defined amount and scope of work is provided by us for a fixed price and extra work, which is subject to client approval, is billed separately. The revenue, cost and gross profit realized on a turnkey contract can vary from our estimated amount because of changes in job conditions, variations in labor and equipment productivity from the original estimates, and the performance of subcontractors. Turnkey contracts may also cause us to bear substantially all of the risks of business interruption caused by weather delays and other hazards. These variations, delays and risks inherent in billing clients at a fixed price may result in us experiencing reduced profitability or losses on projects.
Our clients could delay, reduce or cancel their commitments or service contracts with us on short notice, which may lead to lower than expected demand and revenues.
Our backlog consists of written orders or commitments for our services that we believe to be firm. We estimate our total seismic data acquisition and seismic data processing and interpretation services revenue backlog to be $557.6 million at December 31, 2010. Backlog at December 31, 2010 included $414.1 million or 74% from international projects, and $143.5 million or 26% from North American projects. It is anticipated that approximately 86% of the backlog at December 31, 2010 will be completed in 2011 with the remaining amount to be completed in 2012 and 2013. Backlog levels vary during the year depending on the timing of the completion of certain projects and when new projects are awarded and contracts are signed. Because of potential changes in the scope or schedule of our clients' projects, we cannot predict with certainty when or if our backlog will be realized. In addition, the contracts in our backlog are cancelable by the client. Material delays, payment defaults or cancellations could reduce the amount of backlog currently reported, and, consequently, could inhibit the conversion of that backlog into revenue which may materially affect our financial condition, results of operations and cash flows.
17
Our agreements with our clients may not adequately protect us from unforeseen events or address all issues that could arise with our clients. The occurrence of unforeseen events, or disputes with clients not adequately addressed in the contracts could result in increased liability, costs and expenses associated with any given project.
We enter into master service agreements with many of our clients which allocate certain operational risks. For example, we seek to minimize the risk of delays through the inclusion of "standby rate" provisions which provide for payment to us of a reduced rate for a limited amount of time if the weather conditions or certain other factors outside of our control prevent us from recording data. Despite the inclusion of risk allocation provisions in our agreements, our operations may be affected by a number of events that are unforeseen or not within our control. We cannot assure you that our agreements will adequately protect us from each possible event. If an event occurs which we have not contemplated or otherwise addressed in our agreement, we, and not our client, will likely bear the increased cost or liability. To the extent our agreements do not adequately address these and other issues, or we are not able to successfully resolve resulting disputes, we may incur increased liability, costs and expenses.
We may be held liable for the actions of our subcontractors.
We often work as the general contractor on seismic data acquisition surveys and consequently engage a number of subcontractors to perform services and provide products. While we obtain contractual indemnification and insurance covering the acts of these subcontractors, and require the subcontractors to obtain insurance for our benefit, there can be no assurance we will not be held liable for the actions of these subcontractors. In addition, subcontractors may cause damage or injury to our personnel and property that is not fully covered by insurance.
Our results of operations can be significantly affected by currency fluctuations.
Because we derive a substantial amount of our revenue from sales internationally, we are subject to risks relating to fluctuations in currency exchange rates. Fluctuations in the exchange rate of the U.S. dollar against such other currencies may, in future periods, have a significant effect upon our results of operations. While we attempt to reduce the risks associated with such exchange rate fluctuations, we cannot assure you that we will be effective in doing so or that fluctuations in the value of the currencies in which we operate will not materially affect our results of operations in the future.
Our operations outside of the United States are subject to additional political, economic, and other uncertainties that could adversely affect our business, financial condition or results of operations, and our exposure to such risks will increase as we expand our international operations.
Over the past several years, our operations have become increasingly international. For the years ended December 31, 2010, 2009 and 2008, 64%, 83%, and 62%, respectively, of our actual revenues from our seismic data acquisition services segment were derived outside of the U.S. and Canada. Our operations outside of the United States are subject to risks inherent in foreign operations, including but not limited to:
- •
- government instability, which can cause investment in capital projects by our potential clients to be withdrawn or
delayed, reducing or eliminating the viability of some markets for our services;
- •
- potential expropriation, seizure, nationalization or detention of assets;
- •
- difficulty in repatriating foreign currency received in excess of local currency requirements;
- •
- civil uprisings, riots and war, which can make it unsafe to continue operations, adversely affect both budgets and schedules and expose us to losses;
18
- •
- availability of suitable personnel and equipment, which can be affected by government policy, or changes in policy, which
limit the importation of qualified crewmembers or specialized equipment in areas where local resources are insufficient;
- •
- decrees, laws, regulations, interpretation and court decisions under legal systems, which are not always fully developed
and which may be retroactively applied and cause us to incur unanticipated and/or unrecoverable costs as well as delays which may result in real or opportunity costs; and
- •
- terrorist attacks, including kidnappings and assassinations of our personnel.
In addition, laws and policies of the United States affecting foreign trade and taxation may also adversely affect our international operations.
As a company subject to compliance with the Foreign Corrupt Practices Act (the "FCPA"), our business may suffer because our efforts to comply with U.S. laws could restrict our ability to do business in foreign markets relative to our competitors who are not subject to U.S. law. Any determination that we or our foreign agents or joint venture partners have violated the FCPA may adversely affect our business and operations.
We and our local partners operate in many parts of the world that have experienced governmental corruption to some degree and, in certain circumstances, strict compliance with anti-bribery laws may conflict with local customs and practices. We may be subject to competitive disadvantages to the extent that our competitors are able to secure business, licenses or other preferential treatment by making payments to government officials and others in positions of influence or using other methods that U.S. law and regulations prohibit us from using.
As a U.S. corporation, we are subject to the regulations imposed by the FCPA, which generally prohibits U.S. companies and their intermediaries from making improper payments to foreign officials for the purpose of obtaining or keeping business. In particular, we may be held liable for actions taken by our strategic or local partners even though our partners are not subject to the FCPA. Any such violations could result in substantial civil and/or criminal penalties and might adversely affect our business, results of operations or financial condition. In addition, our ability to continue to work in such foreign markets could be adversely affected if we were found to have violated certain U.S. laws, including the FCPA.
We are subject to compliance with stringent environmental laws and regulations that may expose us to significant costs and liabilities.
Our operations are subject to stringent federal, provincial, state and local environmental laws and regulations in the United States and foreign jurisdictions relating to environmental protection. These laws and regulations may impose numerous obligations that are applicable to our operations including:
- •
- the acquisition of permits before commencing regulated activities; and
- •
- the limitation or prohibition of seismic activities in environmentally sensitive or protected areas such as wetlands or wilderness areas.
Numerous governmental authorities, such as the Federal Environmental Protection Agency and analogous state agencies in the United States and governmental bodies with control over environmental matters in foreign jurisdictions, have the power to enforce compliance with these laws and regulations and any permits issued under them, oftentimes requiring difficult and costly actions. Failure to comply with these laws, regulations and permits may result in the assessment of administrative, civil and criminal penalties, the imposition of remedial obligations and the issuance of injunctions limiting or preventing some or all of our operations.
19
There is inherent risk of incurring significant environmental costs and liabilities in our operations due to our controlled storage, use and disposal of explosives. Although we believe that our safety procedures for handling and disposing of explosives comply with the standards prescribed by applicable laws and regulations, the risk of accidental injury from these materials cannot be completely eliminated. In the event of an accident, we could be held liable for any damages that result or we could be penalized with fines, and any liability could exceed the limits of or fall outside our insurance coverage.
Current or future distressed financial conditions of customers could have an adverse impact on us in the event these customers are unable to pay us for the services we provide.
Some of our customers are experiencing, or may experience in the future, severe financial problems that have had or may have a significant impact on their creditworthiness. Although we perform ongoing credit evaluations of our customers' financial conditions, we generally require no collateral from our customers. We cannot provide assurance that one or more of our financially distressed customers will not default on their obligations to us or that such a default or defaults will not have a material adverse effect on our business, financial position, results of operations, or cash flows. Furthermore, the bankruptcy of one or more of our customers, or some other similar proceeding or liquidity constraint, might make it unlikely that we would be able to collect all or a significant portion of amounts owed. In addition, such events might force such customers to reduce or curtail their future use of our products and services, which could have a material adverse effect on our results of operations and financial condition.
Our seismic data acquisition services revenues are subject to seasonal conditions.
Our seismic data acquisition services are performed outdoors and are therefore subject to seasonality. Shorter winter days and adverse weather negatively impact our ability to provide services in certain regions. Additionally, we have limited control over the timing of our international operations due to the extensive planning and preparation required to perform a seismic survey.
We may be unable to retain and attract management and skilled and technically knowledgeable employees.
Our continued success depends upon retaining and attracting highly skilled employees. A number of our employees possess many years of industry experience and are highly skilled and our inability to retain such individuals could adversely affect our ability to compete in the seismic service industry. We may face significant competition for such skilled personnel, particularly during periods of increased demand for seismic services. Although we utilize employment agreements, stock-based compensation and other incentives to retain certain of our key employees, there is no guarantee that we will be able to retain these personnel.
Our operating results from seismic data acquisition services can be significantly impacted from quarter to quarter due to a change in the timing of a few large jobs occurring at any one time.
We have the capacity to field up to 32 seismic data acquisition crews. However, in any given period, we could have idle crews which result in a significant portion of its revenues, cash flows and earnings coming from a relatively small number of crews. Additionally, due to location, service line or particular job, some of our individual crews may achieve results that are a significant percentage of consolidated operating results. Should one or more of these crews experience significant changes in timing, our financial results are subject to significant variations from period to period. Factors that may result in these changes in timing include, but are not limited to, weather, permits, customer requirements and political unrest.
20
Our operations are subject to delays related to obtaining land access rights from third parties which could affect our results of operations.
Our seismic data acquisition operations could be adversely affected by our inability to timely obtain access to both public and private land included within a seismic survey. We cannot begin surveys on property without obtaining permits from certain governmental entities as well as the permission of the parties who have rights to the land being surveyed. In recent years, it has become more difficult, costly and time-consuming to obtain access rights as drilling activities have expanded into more populated areas. Additionally, while land owners generally are cooperative in granting access rights, some have become more resistant to seismic and drilling activities occurring on their property and stall or refuse to grant these rights for various reasons. In our multi-client services business, we acquire data sets pertaining to large areas of land. Consequently, if we do not obtain land access rights from a specific land owner, we may not be able to provide a complete survey for that area. The failure to redact or remove the seismic information relating to mineral interests held by non-consenting third parties could result in claims against us for seismic trespass. In addition, governmental entities do not always grant permits within the time periods expected. Delays associated with obtaining such permits and significant omissions from a survey as a result of the failure to obtain consents could have a material adverse effect on our financial condition and results of operations.
Our results of operations could be adversely affected by asset impairments.
We periodically review our portfolio of equipment and intangible assets, including our multi-client data library, for impairment. If we expect significant sustained decreases in oil and natural gas prices in the future, we may be required to write down the value of our assets if the future cash flows anticipated to be generated from the related assets falls below net book value. The recent decline in oil and natural gas prices, if sustained, could result in future impairments. If we are forced to write down the value of our goodwill, other intangible assets or equipment, these non-cash asset impairments could negatively affect our results of operations in the period in which they are recorded.
The cyclical nature of, or a prolonged downturn in, our industry, could affect the carrying value of our goodwill or other long-lived assets and negatively impact our earnings.
As of December 31, 2010, we had $131.3 million of goodwill, or 18% of total assets, which has increased from $73.4 million at December 31, 2009. We have recorded goodwill because we paid more for some of our businesses than the fair market value of the tangible and measurable intangible net assets of those businesses at the time of acquisition. We are required to annually assess whether the carrying value of our goodwill has been impaired. This assessment includes many management assumptions including, but not limited to, business forecasts, risk premiums, cost of capital and market factors. Should any one or combination of these factors change, it could negatively impact our future assessments of the carrying values of these assets. If management determines that the carrying value of our long-lived assets may not be recoverable, our goodwill will be reduced which will adversely affect our earnings.
There are inherent limitations in all control systems and failure of our controls and procedures to detect error or fraud could seriously harm our business and results of operations.
Our management, including our Chief Executive Officer and Chief Financial Officer, does not expect that our internal controls and disclosure controls will prevent all possible error and all fraud. A control system, no matter how well conceived and operated, can provide only reasonable, not absolute, assurance that the objectives of the control system are met. In addition, the design of a control system must reflect the fact that there are resource constraints and the benefit of controls must be relative to their costs. Because of the inherent limitations in all control systems, no evaluation of our controls can provide absolute assurance that all control issues and instances of fraud, if any, will be detected. These
21
inherent limitations include the realities that judgments in decision-making can be faulty and that breakdowns can occur because of simple error or mistake. Further, controls can be circumvented by the individual acts of some persons or by collusion of two or more persons. The design of any system of controls is based in part upon the likelihood of future events, and there can be no assurance that any design will succeed in achieving our intended goals under all potential future conditions. Over time, a control may become inadequate because of changes in conditions or the degree of compliance with our policies or procedures may deteriorate. Because of inherent limitations in a cost-effective control system, misstatements due to error or fraud may occur without detection.
We have identified material weaknesses in our internal controls, which could affect our ability to ensure timely and reliable financial reports and our ability to attest to the effectiveness of our internal controls.
During management's review of our internal controls as of December 31, 2010, control deficiencies that constituted a material weakness related to the following items were identified:
Entity Level Controls (Control Environment): While we continue to deliver quality seismic services to our customers, we continued to experience issues related to our overall internal control environment. These issues were primarily related to our inability to properly account for certain operational processes and transactions which was not supportive of an effective and efficient internal control environment; this resulted in hindering our ability to report financials in a complete, accurate and timely manner. Effective Tone at the Top (a significant element of the control environment) related to internal controls that impact financial reporting was not embedded in our culture.
We experienced significant turnover in key accounting and finance positions during the fiscal year which had an indelible impact on our effectiveness. This included extended vacancies of key executive management positions during the fiscal year such as: Chief Financial Officer (CFO), Chief Accounting Officer (CAO), Chief Information Officer (CIO), Vice President and Treasurer, Corporate Controller, North America Regional Controller, Eastern Hemisphere Regional Controller, Internal Controls Manager, and Payroll Manager. However, critical positions including CFO and CIO were filled during Q4; CAO and Vice President and Treasurer positions were filled in January 2011, and others remain unfilled.
Corporate Financial Reporting Process: Controls over the financial close and reporting processes were deficient in areas related to account reconciliations and analyses, accrual management, deferred expenses, revenue accounting, and payroll accounting. This resulted in an elongated period-end close process and post-closing accounting adjustments. In fact, several adjustments related to Multi-Client accounting (revenue and amortization) and deferred expenses were material. Although several steps were taken and some improvement was made during the fiscal year in financial reporting, there continued to be deficiencies caused by ineffective and inefficient systems and processes.
Our accounting and finance resources lacked the technical expertise and knowledge to address certain financial reporting and system integration requirements for a global company. The ineffective control environment (referred to above) along with operations management philosophy and operating structure, were identified as the underlying causes of this material weakness.
We recorded a number of post-closing adjustments to our 2010 consolidated financial statements as a result of these material weaknesses. The adjustments primarily affected revenue recognition in North America, non-routine accruals and deferred cost accounts, related to our international operations, including, as applicable, the corresponding income statement accounts. Based on management's evaluation, because of the material weaknesses described above, management has concluded that our internal control over financial reporting was not effective as of December 31, 2010.
While we have taken certain actions to address the deficiencies identified, additional measures will be necessary and these measures, along with other measures we expect to take to improve our internal
22
controls over financial reporting, may not be sufficient to address the deficiencies identified or ensure that our internal control over financial reporting is effective. If we are unable to provide reliable and timely financial external reports, our business and prospects could suffer material adverse effects. In addition, we may in the future identify further material weaknesses or significant deficiencies in our internal control over financial reporting.
Climate change legislation or regulations could result in increased operating costs and reduced demand for the oil and gas our clients intend to produce and so adversely affect the demand of our services.
On December 15, 2009, the EPA officially published its findings that emissions of carbon dioxide, methane and other GHGs present an endangerment to public health and the environment because emissions of such gases are, according to the EPA, contributing to warming of the earth's atmosphere and other climatic changes. These findings open the door for the EPA to adopt and implement regulations that would restrict emissions of GHGs under existing provisions of the federal Clean Air Act. On June 3, 2010, the EPA published its so-called GHG tailoring rule that begins the phase in of federal prevention of significant deterioration (PSD) permit requirements, for new sources and modifications, and Title V operating permits, for all sources that have the potential to emit specific quantities of GHGs. On October 30, 2009, the EPA published a final rule requiring the reporting of GHG emissions from specified large GHG emission sources in the United States beginning in 2011 for emissions occurring in 2010. On November 30, 2010, the EPA published its amendments to the GHG reporting rule to include onshore and offshore oil and natural gas production facilities and onshore oil and natural gas processing, transmission, storage and distribution facilities, which may include facilities our clients operate. Reporting of GHG emissions from such facilities will be required on an annual basis beginning in 2012 for emissions occurring in 2011.
Although the federal government is unlikely to adopt legislation to reduce emissions of GHGs, a number of states have taken measures to reduce GHG emission levels, which may include the development of GHG emission inventories and/or cap and trade programs. Most of these cap and trade programs require major sources of emissions or major producers of fuels to acquire and surrender emission allowances. The number of allowances available for purchase is reduced each year in an effort to achieve the overall GHG emission reduction goal. These allowances would be expected to escalate significantly in cost over time.
The adoption and implementation of legislation or regulatory programs imposing reporting obligations on, or limiting emissions of GHGs from, our customers' equipment and operations could curtail their activities, including the services we provide.
Significant physical effects of climatic change have the potential to damage our facilities, disrupt our production activities and cause us to incur significant costs in preparing for or responding to those effects.
In an interpretative guidance on climate change disclosures, the SEC indicates that climate change could have an effect on the severity of weather (including hurricanes and floods), sea levels, the arability of farmland, and water availability and quality. If such effects were to occur, our seismic acquisition operations have the potential to be adversely affected. Potential adverse effects could include damages to our facilities from powerful winds or rising waters in low-lying areas, disruption of our production activities either because of climate-related damages to our facilities in our costs of operation potentially arising from such climatic effects, less efficient or non-routine operating practices necessitated by climate effects or increased costs for insurance coverage in the aftermath of such effects. Significant physical effects of climate change could also have an indirect effect on our financing and operations by disrupting the transportation or process-related services provided by midstream companies, service companies or suppliers with whom we have a business relationship. We may not be able to recover through insurance some or any of the damages, losses or costs that may result from potential physical effects of climate change.
23
Federal legislation and state legislative and regulatory initiatives relating to hydraulic fracturing could result in increased costs and additional operating restrictions or delays.
Hydraulic fracturing is used to stimulate production of hydrocarbons, particularly natural gas, from tight formations. The process involves the injection of water, sand and chemicals under pressure into formations to fracture the surrounding rock and stimulate production. The process is typically regulated by state oil and gas commissions but is not subject to regulation at the federal level. The EPA has commenced a study of the potential environmental impacts of hydraulic fracturing activities, with results of the study anticipated to be available by late 2012, and a committee of the U.S. House of Representatives is also conducting an investigation of hydraulic fracturing practices. Legislation has been introduced before Congress to provide for federal regulation of hydraulic fracturing and to require disclosure of the chemicals used in the fracturing process. In addition, some states have adopted, and other states are considering adopting, regulations that could restrict hydraulic fracturing in certain circumstances. For example, New York has imposed a de facto moratorium on the issuance of permits for high-volume, horizontal hydraulic fracturing until state-administered environmental studies are finalized, a draft of which must be published by June 1, 2011, followed by a 30-day comment period. Further, Pennsylvania has adopted a variety of regulations limiting how and where fracturing can be performed.
A portion of our seismic operations relate the development of wells that will be subject to hydraulic fracturing. If new laws or regulations that significantly restrict hydraulic fracturing are adopted, such legal requirements the demand for our services will be reduced.
Risks Related to our Indebtedness
Our substantial debt could adversely affect our financial health and adversely affect our liquidity and results of operations.
We have a significant amount of debt and may incur substantial additional debt (including secured debt) in the future. As of December 31, 2010, we had total indebtedness of $321 million, net of discount (excluding mandatorily redeemable preferred stock of $45 million, net of discount). Permitted outstanding borrowings available under our amended senior secured revolving credit facility is presently $40 million. We cannot assure you that we will be able to generate sufficient cash to service our debt or sufficient earnings to cover fixed charges in future years. If new debt is added to our current debt levels, the related risks for us could intensify.
Our substantial debt could have important consequences. In particular, it could:
- •
- increase our vulnerability to general adverse economic and industry conditions;
- •
- require us to dedicate a substantial portion of our cash flow from operations to payments on our indebtedness, thereby
reducing the availability of our cash flow to fund capital expenditures and other general corporate purposes;
- •
- limit our flexibility in planning for, or reacting to, changes in our businesses and the industries in which we operate;
- •
- place us at a competitive disadvantage compared to our competitors that have less debt; and
- •
- limit, along with the financial and other restrictive covenants of our indebtedness, among other things, our ability to borrow additional funds.
24
Our debt agreements contain restrictive covenants that may limit our ability to respond to changes in market conditions or pursue business opportunities.
Our debt agreements contain restrictive covenants that limit our ability to, among other things:
- •
- incur or guarantee additional debt;
- •
- pay dividends;
- •
- repay subordinated debt prior to its maturity;
- •
- grant additional liens on our assets;
- •
- enter into transactions with our affiliates;
- •
- repurchase stock;
- •
- make certain investments or acquisitions of substantially all or a portion of another entity's business assets;
and
- •
- merge with another entity or dispose of our assets.
In addition, our debt agreements require us to maintain certain financial ratios and tests. The requirement that we comply with these provisions may have a materially adverse effect on our ability to react to changes in market conditions, take advantage of business opportunities we believe to be desirable, obtain future financing, fund needed capital expenditures or withstand a continuing or future downturn in our business.
We may be unable to comply with the maintenance covenants in our senior revolving credit facility. If we are unable to comply with the restrictions and covenants in our debt agreements, there could be a default under the terms of such agreements, which could result in an acceleration of repayment. Failure to maintain existing or to secure new financing could have a material adverse effect on our liquidity and financial position.
If we are unable to comply with the restrictions and covenants in our debt agreements, including our senior secured revolving credit facility, there could be a default under the terms of these agreements. In the event of a default under these agreements, lenders could terminate their commitments to lend or accelerate the loans and declare all amounts borrowed due and payable. Borrowings under other debt instruments that contain cross-acceleration or cross-default provisions may also be accelerated and become due and payable. If any of these events occur, our assets might not be sufficient to repay in full all of our outstanding indebtedness and we may be unable to find alternative financing. Even if we could obtain alternative financing, it might not be on terms that are favorable or acceptable to us. Additionally, we may not be able to amend our debt agreements or obtain needed waivers on satisfactory terms or without incurring substantial costs. Failure to maintain existing or secure new financing could have a material adverse effect on our liquidity and financial position.
To service our indebtedness, we require a significant amount of cash, and our ability to generate cash will depend on many factors beyond our control.
Our ability to make payments on and to refinance our indebtedness, and to fund planned capital expenditures depends in part on our ability to generate cash in the future. This ability is, to a certain extent, subject to general economic, financial, competitive, legislative, regulatory and other factors that are beyond our control.
We cannot assure you that we will generate sufficient cash flow from operations, realize operating improvements on schedule, or otherwise improve operating cash flow. If cash flow is not adequate, we cannot assure you that future borrowings will be available to us in an amount sufficient to enable us to service and repay our indebtedness or to fund our other liquidity needs. If we are unable to satisfy our
25
debt obligations, we may have to undertake alternative financing plans, such as refinancing or restructuring our indebtedness, selling assets, reducing or delaying capital investments, delaying bids on new sales, or seeking to raise additional capital. We cannot assure you that any refinancing or debt restructuring would be possible, that any assets could be sold or that, if sold, the timing of the sales and the amount of proceeds realized from those sales would be favorable to us or that additional financing could be obtained on acceptable terms. Disruptions in the capital and credit markets, as were experienced during 2008 and 2009, could adversely affect our ability to meet our liquidity needs or to refinance our indebtedness, including our ability to draw on our existing credit facilities or enter into new credit facilities. Banks that are party to our existing credit facilities may not be able to meet their funding commitments to us if they experience shortages of capital and liquidity or if they experience excessive volumes of borrowing requests from us and other borrowers within a short period of time.
Risks Related to our Common Stock
Our stock price may be volatile and may decrease in response to various factors, which could adversely affect our business and cause our stockholders to suffer significant losses.
Although we are listed on a national exchange, our common stock is relatively illiquid and its price has been and may continue to be volatile in the future. The market price of our common stock may be influenced by many factors, many of which are beyond our control, including the risks described in this "Risk Factors" section and the following:
- •
- decreases in prices for oil and natural gas resulting in decreased demand for our services;
- •
- variations in our operating results and failure to meet expectations of investors and analysts;
- •
- the public's reaction to our press releases, other public announcements and filings with the SEC;
- •
- increases in interest rates;
- •
- the loss of customers;
- •
- competition;
- •
- overcapacity within industry;
- •
- illiquidity of the market for our common stock;
- •
- sales of common stock by existing stockholders; and
- •
- other developments affecting us or the financial markets.
We are unable to predict the extent to which investor interest in us will affect the liquidity of our shares of common stock. If liquidity remains low, stockholders may have difficulty selling our common stock.
Our stock price may decline when our financial results decline or when events occur that are adverse to us or our industry.
You can expect the market price of our common stock to decline when our financial results decline or otherwise fail to meet the expectations of the financial community or the investing public or at any other time when events actually or potentially adverse to us or the oil and natural gas industry occur. Our common stock price may decline to a price below the price you paid to purchase your shares of common stock.
26
We do not expect to pay dividends on our common stock and investors will be able to receive cash in respect of the shares of common stock only upon the sale of the shares.
We have never paid cash dividends on our common stock. We have no intention in the foreseeable future to pay any cash dividends on our common stock and our senior secured credit facility and the indenture that governs our senior secured notes restricts our ability to pay dividends on our common stock. Therefore, an investor in our common stock will obtain an economic benefit from holding our common stock only after an increase in its trading price and only by selling the common stock.
Holders of our preferred stock vote as a class with our common stock and have the ability to cast approximately 31% of the votes on matters submitted to a vote of our stockholders, and so will have significant influence on matters submitted to a vote of our stockholders. Holders of our preferred stock also have the right to consent to certain corporate actions, which will prevent us from undertaking those actions without the consent of the holders of our preferred stock.
Approximately 91% of our outstanding convertible preferred stock is held by Avista and its affiliates, and Avista owns an additional 2,863,954 shares of our common stock at December 31, 2010. The preferred stock votes as a class with our common stock on an as converted basis, and represents approximately 31% of the outstanding voting power of Geokinetics. In addition, the terms of the preferred stock provide that while the preferred stock is outstanding, the holders of preferred stock voting together as a class are entitled to elect one director of Geokinetics. Accordingly, Avista and the holders of our preferred stock are able to substantially influence matters submitted to a vote of our stockholders, including the election of directors. Currently, two members of our board of directors are affiliates of Avista.
In addition, the holders of a majority of the outstanding shares of preferred stock are required to approve each of the following transactions:
- •
- any amendment to our certificate of incorporation or by-laws;
- •
- any payment of a dividend to holders of our common stock or any repurchase of our common stock;
- •
- any sale of all or substantially all of our assets and the assets of our subsidiaries, or any merger or consolidation with
another person if our stockholders immediately prior to the merger own less than 50% of the entity resulting from the merger;
- •
- any reclassification or reorganization of our common stock;
- •
- the issuance of any stock on parity with or having preference to the preferred stock;
- •
- certain transaction with our management, related parties or affiliates, unless unaffiliated members of our board of
directors approve the transaction; or
- •
- any increase or decrease in the number of directors on our board.
The holders of our preferred stock have the preemptive right to acquire shares of our common stock that we may offer for cash in the future, other than shares sold in a public offering.
Item 1B. Unresolved Staff Comments
27
We own or lease administrative offices, operations centers, data processing centers, and warehouses throughout the world. No significant lease is scheduled to terminate in the near future, and we believe comparable space is readily obtainable should any lease expire without renewal. We believe our properties are generally well maintained and adequate for their intended use. As of December 31, 2010, we leased properties worldwide totaling approximately 1,176,000 square feet. Of this total, 682,000 square feet are located in North America and 494,000 square feet are located internationally.
Our seismic data processing leased facilities are located in Houston, Texas in the United States, and in Old Woking, Surrey in the United Kingdom.
Within North America, our seismic data acquisition leased facilities are located in Houston and Stafford, Texas; in Canonsburg, Pennsylvania; in Anchorage, Alaska; and in Calgary, Canada.
Outside the United States, we lease facilities for our seismic data acquisition segment in Rio de Janeiro, Brazil; Santa Cruz, Bolivia; Bogota, Colombia; Poza Rica, Miguel Hidalgo, and General Bravo, Mexico; Lima, Peru; San Fernando, Trinidad; Brisbane, Australia; Dhaka, Bangladesh; Jakarta, Indonesia; Singapore; Douala, Cameroon; Cairo, Egypt; Alger, Algeria; Luanda, Soyo, and Viana, Angola; Tripoli, Libya; Glasgow, Scotland; Tunis, Tunisia; and Dubai and Abu Dhabi, United Arab Emirates. We own two warehouse facilities in Yopal and Bogota, Colombia totaling approximately 78,000 square feet.
Neither we nor any of our subsidiaries is a party to any pending legal proceedings other than certain routine litigation that is incidental to our business and that we believe is unlikely to materially impact us. Moreover, we are not aware of any such legal proceedings that are contemplated by governmental authorities with respect to us, any of our subsidiaries, or any of their respective properties that we believe would have a material impact to our financial position or results of operation.
Item 4. [Removed and Reserved]
28
PART II
Item 5. Market for Registrant's Common Equity, Related Stockholder Matters and Issuer Purchases of Equity Securities
Our common stock, $0.01 par value per share, is listed on the NYSE AMEX (formerly the American Stock Exchange) under the trading symbol "GOK." As of March 15, 2011, we had 77 stockholders of record; however, since many shares may be held by investors in nominee names such as the name of their broker or their broker's nominee, the number of record holders often bears little relationship to the number of beneficial owners of the common stock.
The following table sets forth the high and low closing prices for the common stock of Geokinetics Inc. during the most recent two fiscal years, as reported by the NYSE AMEX. The following quotations reflect inter-dealer prices, without retail mark-up, mark-down or commission and may not represent actual transactions.
Quarter Ended
|
High | Low | |||||
|---|---|---|---|---|---|---|---|
March 31, 2009 |
$ | 4.19 | $ | 1.84 | |||
June 30, 2009 |
15.95 | 3.13 | |||||
September 30, 2009 |
22.05 | 9.88 | |||||
December 31, 2009 |
21.21 | 9.05 | |||||
March 31, 2010 |
10.76 | 7.21 | |||||
June 30, 2010 |
9.55 | 3.83 | |||||
September 30, 2010 |
6.80 | 3.62 | |||||
December 31, 2010 |
9.29 | 5.70 | |||||
The closing market price of our common stock on March 15, 2011 was $9.17 per share.
We have never paid cash dividends on our common stock and the Board of Directors intends to retain all of our earnings, if any, to finance the development and expansion of our business. There can be no assurance that our operations will prove profitable to the extent necessary to pay cash dividends. Moreover, even if such profits are achieved, the future dividend policy will depend upon our earnings, capital requirements, financial condition, debt covenants and other factors considered relevant by our Board of Directors.
Stock Performance Graph
The information included under the caption "Stock Performance Graph" in this Item 5 of this annual report is not deemed to be "soliciting material" or to be "filed" with the SEC or subject to Regulation 14A or 14C under the Exchange Act or to the liabilities of Section 18 of the Exchange Act, and will not be deemed to be incorporated by reference into any filings we make under the Securities Act of 1933 or the Exchange Act, except to the extent Geokinetics specifically incorporates it by reference into such a filing.
29
The following graph depicts the five-year cumulative total return of our common stock as compared with the S&P 500 Stock Index and the PHLX Oil Services Index ("OSX"). The PHLX Index consists of larger companies that perform a variety of services as compared to land based acquisition and processing of seismic data performed by us.
Comparison of 5-year Cumulative Total Return*
Among Geokinetics Inc., the S&P 500 Index and the PHLX Oil Service Sector Index
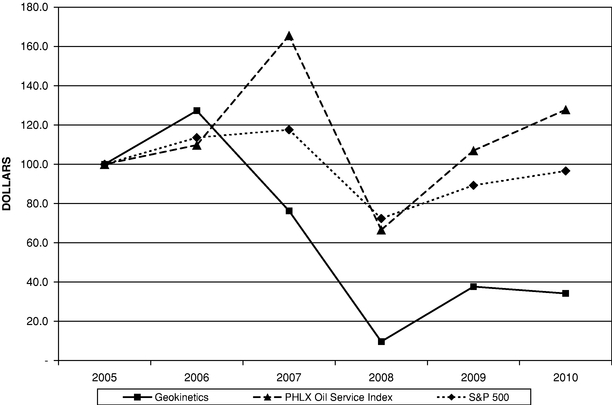
- *
- $100 invested on 12/31/05 in stock or index—including investment of dividends
| |
12/05 | 12/06 | 12/07 | 12/08 | 12/09 | 12/10 | |||||||||||||
|---|---|---|---|---|---|---|---|---|---|---|---|---|---|---|---|---|---|---|---|
Geokinetics |
100.0 | 127.3 | 76.3 | 9.7 | 37.7 | 36.4 | |||||||||||||
PHLX Oil Service Index |
100.0 | 109.8 | 165.6 | 66.6 | 107.0 | 134.6 | |||||||||||||
S&P 500 |
100.0 | 113.6 | 117.6 | 72.4 | 89.3 | 100.7 | |||||||||||||
30
Securities Authorized for Issuance under Equity Compensation Plans
As of December 31, 2010, we had three active equity compensation plans approved by security holders: the 2002 Stock Awards Plan, the 2007 Stock Awards Plan and the 2010 Stock Awards Plan. Adopted in March 2003 and amended in November 2006, the 2002 Plan has 800,000 shares of common stock authorized for issuance; the 2007 Plan, adopted on May 23, 2007, has 750,000 shares of common stock authorized for issuance; and the 2010 Plan, adopted on April 1, 2010, has 1,600,000 shares of common stock authorized for issuance.
Plan Category
|
Number of Securities to be Issued upon Exercise of Outstanding Options, Warrants and Rights (a) |
Weighted-average Exercise Price of Outstanding Options, Warrants and Rights (b) |
Number of Securities Remaining Available for Future Issuances Under Equity Compensation Plans (Excluding Securities Reflected in Column (a)) (c) |
|||||||
|---|---|---|---|---|---|---|---|---|---|---|
Equity Compensation Plans Approved by Security Holders |
506,463 | $ | 12.16 | 1,493,002 | ||||||
Equity Compensation Plans Not Approved by Security Holders |
— | — | — | |||||||
Total |
506,463 | $ | 12.16 | 1,493,002 | ||||||
Item 6. Selected Financial Data
The following selected financial data should be read in conjunction with Item 7. "Management's Discussion and Analysis of Financial Condition and Results of Operations," and with our consolidated financial statements and related notes included in Item 8. "Financial Statements and Supplementary Data."
Selected Financial Data
| |
As of and for the Year Ended December 31, | |||||||||||||||
|---|---|---|---|---|---|---|---|---|---|---|---|---|---|---|---|---|
| |
2010(1) | 2009 | 2008 | 2007 | 2006 | |||||||||||
| |
(In thousands, except per share data) |
|||||||||||||||
Total revenue |
$ | 558,134 | $ | 510,966 | $ | 474,598 | $ | 357,677 | $ | 225,183 | ||||||
Income (loss) before income taxes |
(133,874 | ) | 10,917 | 10,254 | (13,684 | ) | (942 | ) | ||||||||
Income taxes |
4,810 | 23,252 | 9,268 | 2,252 | 3,234 | |||||||||||
Net income (loss) |
(138,684 | ) | (12,335 | ) | 986 | (15,936 | ) | (4,176 | ) | |||||||
Loss applicable to common stockholders |
(147,534 | ) | (34,125 | ) | (5,339 | ) | (20,802 | ) | (4,382 | ) | ||||||
Loss per common share, basic and diluted |
(8.46 | ) | (3.14 | ) | (0.51 | ) | (2.44 | ) | (0.81 | ) | ||||||
Total assets |
725,164 | 771,690 | 439,716 | 354,321 | 299,633 | |||||||||||
Long-term debt and capital leases, net of current portion |
319,284 | (2) | 296,601 | (2) | 57,850 | 60,352 | 113,617 | |||||||||
Current portion of long-term debt and capital lease obligations |
1,634 | (3) | 68,256 | (3) | 33,096 | 19,560 | 3,552 | |||||||||
Derivative liabilities |
38,271 | (4) | 9,317 | (4) | — | — | — | |||||||||
Mezzanine and temporary equity |
74,987 | (5) | 66,976 | (5) | 94,862 | 60,926 | 56,077 | |||||||||
Total stockholders equity (excluding preferred stock) |
21,787 | 145,330 | 129,680 | 130,965 | 28,595 | |||||||||||
- (1)
- Includes operating results of PGS Onshore since February 12, 2010.
31
- (2)
- Includes
mandatorily redeemable preferred stock and $300 million of Senior Secured Notes at December 31, 2010 and 2009. Long-term
debt increased in 2010 as compared to 2009 due to draw on the revolver and the increase of mandatorily redeemable preferred stock.
- (3)
- Current
portion of long-term debt and capital leases decreased in 2010 as we paid off existing amounts.
- (4)
- Includes
fair value of derivative liabilities related to 2010 and 2008 warrants and the convertible preferred stock Series B conversion feature.
- (5)
- During 2008, we exchanged our Series B-2 Preferred Stock for Series C Preferred Stock which is classified as mandatorily redeemable preferred stock. Increase in 2010 is due to stock dividend and accretion of initial discount.
32
Item 7. Management's Discussion and Analysis of Financial Condition and Results of Operation
The following discussion of our financial condition and results of operations should be read in conjunction with the financial statements and notes to those financial statements included elsewhere in this Form 10-K. This discussion contains forward looking statements that involve risks and uncertainties. Please see "Risk Factors" and "Forward Looking Statements" elsewhere in this Form 10-K.
Overview
We are a full-service, global provider of seismic data acquisition, processing and interpretation services to the oil and natural gas industry. We also provide clients access, via licenses, to our multi-client seismic data library. As an acknowledged industry leader in land, marsh, swamp, transition zone and shallow water (down to 500 feet water depths) ocean-bottom-cable or "OBC" environments, we have the capacity to operate up to 32 seismic crews with approximately 200,000 recording channels worldwide and the ability to process seismic data collected throughout the world. Crew count, configuration and location can change depending upon industry demand and requirements.
We provide a suite of geophysical services including acquisition of two-dimensional ("2D"), three-dimensional ("3D"), time-lapse four-dimensional ("4D") and multi-component seismic data surveys, data processing and interpretation services and other geophysical services for customers in the oil and natural gas industry, which include many national oil companies, major international oil companies and independent oil and gas exploration and production companies (collectively "E&P Companies") in the United States, Canada, Latin America (including Mexico), Africa, Australia, New Zealand, Asia Pacific and the Middle East. Seismic data is used by E&P companies to identify and analyze drilling prospects, maximize drilling success, optimize field development and enhance production economics. We also own a multi-client data library whereby we maintain full or partial ownership of data acquired for future licensing. Our multi-client data library consists of data covering various areas in the United States, Canada, Brazil and Australia.
The seismic services industry is dependent upon the capital spending levels of oil and natural gas companies for exploration, development, exploitation and production of oil and natural gas. These spending levels have traditionally been heavily influenced by the prices of oil and natural gas; however, budget cycles of National Oil Companies ("NOCs") and International Oil Companies ("IOCs") tend to be more strategic and longer term in nature. Since the third quarter of 2008, oil and natural gas prices have shown significant volatility, and E&P spending has been adjusted accordingly. To the extent that exploration spending does not increase, our cash flows from operations could be directly affected. While there are signs of recovery, if the world experiences a double-dip to the recent global recession, commodity prices may be depressed for an extended period of time, which could alter acquisition and exploration plans, and adversely affect our growth strategy.
The PGS Onshore Acquisition
In February 2010, we closed the acquisition of the onshore seismic acquisition and multi-client library business of Petroleum Geo-Services ASA and certain of its subsidiaries ("PGS Onshore acquisition"). The acquisition significantly increased our onshore seismic acquisition business in Mexico, North Africa, the Far East and Alaska. The acquisition also substantially increased our multi-client business, adding 5,500 square miles of 3D seismic data to our multi-client library. The purchase price was $202.8 million, paid $183.4 million in cash and $19.4 million by the issuance of 2.2 million shares of our common stock.
To finance this acquisition in December 2009, we issued an additional 4,000,000 shares of common stock for net cash proceeds of $34.0 million and our wholly owned subsidiary issued $300.0 million of
33
senior secured notes due 2014. The following table presents summary unaudited pro forma consolidated statements of income for the years ended December 31, 2010 and 2009.
| |
Pro forma for the years ended December 31, (Unaudited) |
||||||
|---|---|---|---|---|---|---|---|
| |
2010 | 2009 | |||||
Total Revenue |
$ | 578,757 | $ | 711,028 | |||
Income (loss) from operations |
$ | (97,292 | ) | $ | 1,590 | ||
Net loss |
$ | (145,905 | ) | $ | (78,052 | ) | |
Dividends and accretion on preferred stock |
$ | (8,850 | ) | $ | (20,379 | ) | |
Net loss applicable to common stockholders |
$ | (154,755 | ) | $ | (98,431 | ) | |
Basic and diluted net loss per common share |
$ | (8.87 | ) | $ | (5.57 | ) | |
Pro forma adjustments are primarily to reflect the purchase of PGS Onshore and related financing transactions as if they had occurred as of the beginning of the periods presented on the pro forma combined statement of operations as of December 31, 2009. For additional information, see note 3 to notes to consolidated financial statements included elsewhere in this annual report of Form 10-K. The related financing transactions include:
- •
- the common stock issued to PGS,
- •
- the Senior Secured Notes due 2014,
- •
- the preferred stock restructuring, and
- •
- the secured credit revolving credit facility.
Other Events in 2010
In addition to the PGS Onshore acquisition and related financings, developments in our business during 2010 include the following:
- •
- We continue to expand our multi-client library which consisted of approximately 6,000 square miles of 3D data and 640
linear miles of 2D data immediately after the closing of the PGS Onshore acquisition. Our new multi-client program focuses on unconventional resource plays including the Marcellus Shale in
Pennsylvania and West Virginia, Woodford Shale in Oklahoma, Haynesville Shale in the East Texas basin and in the Niobrara Shale in Colorado and Wyoming which brings our total acquired program to
approximately 7,500 square miles of 3D data and 1,120 linear miles of 2D data.
- •
- Our backlog increased 47% to $557.6 million at December 31, 2010 from $378.2 million on a pro forma
basis at December 31, 2009.
- •
- Bid activity has continued to be strong in 2010 and early 2011. At March 23, 2011, we had approximately
$1,130.0 million of outstanding bids.
- •
- We launched our new Geotiger Series II highly transportable 4 component (4C) OBC crew to the Canadian Arctic and
commenced operations in the second quarter. This unique crew utilizes the state-of-the-art Sercel Searay 4C OBC system and is capable of being deployed worldwide in
a matter of days via our proprietary Geotiger Series II Marine Fleet. This crew completed its first job in October and is currently operating in Mexico.
- •
- On December 14, 2010, we closed a $30 million private placement of 120,000 shares of a new series of junior preferred stock and warrants to purchase 3,495,000 million shares of our
34
- •
- We have continued to work with the lenders under our revolving credit facility to receive the required waivers and increase the available borrowings under the facility. We may borrow up to $40 million, based on a formula. During 2010, our lenders granted us financial covenant waivers during each of the second, third and fourth quarters. The last amendment of the fourth quarter provides, among other things, adjustments to a monthly maximum total leverage ratio and a monthly minimum interest coverage ratio. It also requires us to adhere to a monthly liquidity test, monthly senior notes interest reserve and monthly cumulative adjusted EBITDA targets commencing with the month ending January 31, 2011 through the month ending December 31, 2011. Furthermore, capital expenditures for the fiscal year 2011 may not exceed $40 million. We complied with these various financial covenants for the months ending January 31, 2011 and February 28, 2011. On April 1, 2011 we entered into a waiver of specific events of default that would have occurred on March 31, 2011 for failure to comply with financial reporting covenant requirements. Additionally, we entered into Amendment No. 4 which modifies certain financial covenant requirements (minimum total leverage ratio and cumulative adjusted EBITDA and our interest cost. The Amendment also changes the maturity date of the revolving credit facility to April 15, 2012. While we believe we will remain in compliance with the revised covenants through December 31, 2011, our actual results may differ from our forecasts, and may be affected by events beyond our control.
common stock to affiliates of Avista, Petroleum Geo-Services ASA, several of our directors and others. The proceeds were used to repay indebtedness and for general corporate purposes.
Liquidity and Capital Resources
Available Liquidity
Our primary sources of cash have been cash flow generated by our seismic data acquisition and seismic data processing segments, sales of debt and equity securities, bank borrowings under our revolving credit facility, equipment financing and trade credit. Our primary uses of cash have been for acquisitions, including the PGS Onshore acquisition, operating expenses associated with our seismic data acquisition and seismic data processing segments, capital expenditures associated with upgrading and expanding our capital asset base and debt service.
As of December 31, 2010, we had available liquidity as follows:
Available cash (in millions): |
|||||
Cash and cash equivalents |
$ | 42.9 | |||
Cash due to customer |
(13.8 | ) | |||
Total available cash |
29.1 | ||||
Undrawn borrowing capacity under revolving credit facility |
17.0 | ||||
Net Available liquidity at December 31, 2010: |
$ | 46.1 | |||
Borrowings under our revolving credit facility are limited by a borrowing base, which was $40 million on December 31, 2010, and which decreases at the end of each month in an amount equal to an interest reserve as defined in the credit agreement. We have certain foreign overdraft facilities in the amount of $3.9 million which were undrawn at December 31, 2010. However, due to limitations on the ability to remit funds to the United States, these have been excluded in the available liquidity table above.
35
The table below summarizes certain measures of liquidity and capital expenditures, as well as our sources of capital from internal and external sources, for the past three years (in thousands).
| |
2010 | 2009 | 2008 | |||||||
|---|---|---|---|---|---|---|---|---|---|---|
Cash and equivalents, at December 31 |
$ | 42,851 | $ | 10,176 | $ | 13,341 | ||||
Working capital, at December 31 |
44,406 | 85,933 | 7,085 | |||||||
Cash flow provided by operating activities |
31,536 | 53,259 | 37,597 | |||||||
Cash flow provided by (used in) investing activities |
20,703 | (349,015 | ) | (43,343 | ) | |||||
Cash flow provided by (used in) financing activities |
(19,564 | ) | 292,591 | 3,962 | ||||||
Capital expenditures (including capital leases) |
47,673 | 38,815 | 77,096 | |||||||
Investment in multi-client data library |
51,035 | 10,716 | — | |||||||
Cash paid for interest |
31,356 | 10,728 | 6,769 | |||||||
Cash flow provided by operating activities
Net cash provided by operating activities was $31.5 million for the year ended December 31, 2010 compared to net cash provided by operating activities of $53.3 million for the year ended December 31, 2009, and $37.6 million for the year ended December 31, 2008. The decrease in operational cash flow in 2010 is primarily due to the operating loss during the period, partially offset by non cash charges as well as receivable collections of $40.9 million.
Cash flow provided by (used in) investing activities
Net cash provided by investing activities was $20.7 million for the year ended December 31, 2010 compared to net cash used in investing activities of $349.0 million for the year ended December 31, 2009, and $43.3 million for the year ended December 31, 2008. The 2010 amounts primarily result from changes in restricted cash for $303.8 million, offset by cash used for the PGS Onshore acquisition of $180.8 million, investments in multi-client data library of $51.0 million and capital expenditures of $47.7 million. During 2009, $303.8 million of proceeds from the issuance of debt and common stock was deposited into escrow accounts for the PGS Onshore acquisition, related debt payoff and other operational purposes. Additional amounts were invested in equipment and multi-client data library.
Cash flow provided by (used in) financing activities
Net cash used in financing activities was $19.6 million for the year ended December 31, 2010 as compared to net cash provided by financing activities of $292.6 million for the year ended December 31, 2009, and $4.0 million for the year ended December 31, 2008. These totals represent the net proceeds and net payments from our debt and equity transactions. The amount in 2009 reflects the issuance of our senior secured notes due 2014.
Other
During 2010, we had an operating loss of $92.1 million, while our cash flow from operating activities was $31.5 million. The difference of $123.6 million is primarily due to non-cash depreciation and amortization charges of $112.9 million. The cash generated by our operations, issuance of senior notes in 2009, and the issuance of preferred shares in December 2010, provided liquidity to meet our financing needs during 2010.
On February 12, 2010, in connection with the closing of the PGS Onshore acquisition we fully extinguished certain borrowings outstanding at December 31, 2009 which totaled approximately $66.7 million. Accordingly, these outstanding balances were classified as current debt as of December 31, 2009. We recorded losses of $1.5 million related to prepayment penalties during the year ended December 31, 2010.
36
Capital Resources
Revolving Credit Facility
On February 12, 2010, we entered into our $50 million revolving credit facility, which initially matured on February 12, 2013. On April 1, 2011, the maturity date was changed to April 15, 2012. See below. Amounts that may be outstanding under the revolving credit facility are limited by a borrowing base which is determined based on the amount of our North American receivables and fixed assets (primarily equipment). The amount that can be borrowed under the revolving credit facility is currently limited to $40.0 million less the interest reserve as defined in the credit agreement.
Borrowings outstanding under the revolving credit facility bear interest at a floating rate based on the greater of: (i) 3% per year, (ii) Prime Rate, (iii) 0.5% above the Federal Funds Rate, or (iv) 1% above one month LIBOR; plus an applicable margin which currently ranges between 4.5% and 5.5% depending on our total leverage ratio. The rate was 8.75% at December 31, 2010. The outstanding balance of this revolving credit facility was $23 million as of December 31, 2010 and $33 million as of February 28, 2011. On three occasions in 2010, we amended the revolving credit facility to waive covenants we would have been unable to comply with without such waivers during each of the second, third and fourth quarters of 2010.
Among other things, we entered into amendments to revise our financial covenants including a monthly maximum total leverage ratio and a monthly minimum interest coverage ratio. The amendments also require that we adhere to a monthly liquidity test, and monthly cumulative adjusted EBITDA targets commencing with the month ending January 31, 2011 through the month ending December 31, 2011. We were in compliance with such covenants as of February 28, 2011. On April 1, 2011, Geokinetics Holdings entered into a waiver of specific events of default that would have occurred on March 31, 2011 for failure to comply with financial reporting covenant requirements. Additionally, we entered into Amendment No. 4 which modifies certain financial covenant requirements (minimum total leverage ratio and cumulative adjusted EBITDA) and our interest cost. The Amendment also changes the maturity date of the revolving credit facility to April 15, 2012. While we believe we will remain in compliance with the revised covenants through December 31, 2011, actual results may differ from our forecasts, and may be affected by events beyond our control.
Borrowings under the revolving credit facility are unconditionally guaranteed by us and each of our existing and each subsequently acquired or organized wholly-owned U.S. direct or indirect material subsidiary. Each of our entities guaranteeing the revolving credit facility will secure the guarantees on a first priority basis with a lien on substantially all of the assets of such guarantor. Borrowings under the revolving credit facility are effectively senior to the Notes with respect to the proceeds of any collateral securing both the revolving credit facility and the Notes pursuant to the terms of an inter-creditor agreement.
Senior Secured Notes Due 2014
On December 23, 2009, Holdings issued $300 million of senior secured notes due 2014 (the "Notes"). The Notes bear interest at the rate of 9.75% per year, payable semi-annually in arrears on June 15 and December 15 of each year, commencing June 15, 2010. The Notes are fully and unconditionally guaranteed, jointly and severally, by us, and by each of our current and future domestic subsidiaries. We may redeem all or part of the notes at a prepayment premium which will decline over time. We will be required to make an offer to repurchase the notes at 101% of the principal amount plus accrued interest if we experience a change of control.
Preferred Stock
In connection with the PGS Onshore acquisition and our December 2009 common stock and Notes offerings, on December 18, 2009, we restructured the Series B-1 Preferred Stock to reduce the
37
conversion price from $25 to $17.436, to increase the dividend of the Series B-1 Preferred Stock to 9.75%, to extend the dates on which we may pay interest in kind and after which we are required to redeem the Series B-1 Preferred Stock until one year after the maturity date of the Notes. Additionally, we agreed to exchange the Series B-2 Preferred Stock for a new series of preferred stock, Series C, plus the issuance of 750,000 shares of our common stock and a fee of $2.1 million, which was 2% of the liquidation value of Series B-2 Preferred Stock. The Series C Preferred Stock is not convertible, and has a dividend rate of 11.75% and an aggregate liquidation amount of $33.5 million. We have the ability to pay dividends on the Series C Preferred Stock in kind or allow them to accrue without being paid, and will not be required to redeem the Series C Preferred Stock for the liquidation amount until December 15, 2015, which is one year after the maturity of the Notes.
In December, 2010, in order to meet working capital needs, we completed a $30 million private placement of 120,000 shares of a new series of junior nonconvertible preferred stock (the "Series D Preferred Stock") and warrants (the "2010 Warrants") to purchase 3,495,000 shares of common stock. Interest expense is included in results of operations for all dividends on the Series D Preferred Stock accrued from the date of issuance. We can choose to pay these dividends in cash or accrue them. The interest rate is 10.50% per annum and compounded quarterly, if paid in cash, and 11.50% per annum and compounded quarterly if accrued but not paid. We are required to redeem Series D Preferred Stock for the liquidation amount until December 15, 2015, which is one year after the maturity of the Notes.
Capital Lease Obligations and Vendor Financing
From time to time, we enter into vendor financing arrangements to purchase certain equipment. The equipment purchased from these vendors is paid over a period of time. As of December 31, 2010, we have four equipment lease agreements with Bradesco Leasing in Brazil with terms of 36 months at a rate of 15.6% per year. The original amount of the leases was approximately $3.0 million and the balance at December 31, 2010 was approximately $1.7 million. During 2011, we may enter into additional capital leases and/or vendor financing to fund expansion and maintenance capital expenditures.
Future Capital Expenditures
As discussed above, we have made, and expect to continue to make, significant investments in capital expenditures. In 2010, we made $47.7 million in capital expenditures, primarily for new vessels for our shallow water operations, new information systems, investments in surveying and drilling equipment for crews relocating from North America and maintenance of our equipment and facilities. As discussed above, our credit facility lenders have placed a maximum amount of capital expenditures for 2011 of $40 million plus approved multi-client data library investments for 2011, the majority of which are pre-funded. This is a decrease of 16% from capital expenditures in 2010. We plan these limited investments in 2011 to be primarily targeted toward expansion of our international operations and capital expenditures.
Meeting Our Liquidity Needs
Our revolving credit facility requires that we maintain certain financial ratios and tests. As discussed above, during 2010, we received waivers of compliance with certain of these financial covenants, and in December 2010, we entered into an amendment to our revolving credit facility which reset these financial covenants for 2011. The amended financial covenants are based on our forecasted results of operations for 2011. We believe the assumptions used to prepare our 2011 forecasts are reasonable. These assumptions include the amount and timing of seismic contracts that will be awarded to us, improvement in our operating efficiency and margin profitability. We have complied with the amended financial covenants for the months ending January 31 and February 28, 2011. On April 1, 2011 we entered into a waiver of specific events of default that would have occurred on March 31, 2011
38
for failure to comply with financial reporting covenant requirements. Additionally, we entered into Amendment No. 4 which modifies certain financial covenant requirements (minimum total leverage ratio and cumulative adjusted EBITDA) and our interest cost. The Amendment also changes the maturity date of the revolving credit facility to April 15, 2012. While we believe we will remain in compliance with the revised covenants through December 31, 2011, our actual results may differ from our forecasts, and may be affected by events beyond our control.
We anticipate that our current cash balances and cash flows from operations in 2011, combined with the available capacity under our revolving credit facility, will be adequate to meet our liquidity needs during 2011. This expectation, however, is subject to risks that the assumptions used to prepare the forecasts upon which the financial covenants in our revolving credit facility are based will not be achieved. Certain of these risks are described under "Item 1B. Risk Factors" in this annual report.
Inflation, Seasonality and Competitive Pricing
We do not believe that inflation has had a significant effect on our business, financial condition, or results of operations during the most recent three years.
Traditionally, our business has been seasonal, with strongest demand in the second half of our fiscal year. During the fourth quarter of 2010, we experienced increases in the level of normal seasonal year-end bid requests by oil and gas companies and seismic contractor customers due to these customers taking a less conservative approach than in recent periods and beginning to increase their spending plans.
In times of decreased demand, our business is subject to increased price competition.
Results of Operations
Summary of Overall Performance for 2010. On a pro forma basis, with the PGS Onshore acquisition, our revenues for 2010 were $132.3 million less than 2009, reflecting a decline in seismic acquisition work. We believe this decline was caused by the reduction in demand for oil and gas caused by the global recession which began in 2008. As a result of these factors, our net loss in 2010 was significantly higher than in 2009.
Results of Operations for Year Ended December 31, 2010 compared to 2009
Operating Revenues. Consolidated revenues for the twelve months ended December 31, 2010 totaled $558.1 million as compared to $511.0 million for the same period of 2009, an increase of 9.2%. The increase in revenues was primarily driven by the addition of the PGS Onshore operations and the contribution from the multi-client data library business in the U.S.
For the twelve months ended December 31, 2010, seismic data acquisition revenue totaled $549.1 million as compared to $500.3 million for the same period of 2009, an increase of 9.8%. North America revenues increased by $116.7 million to a total of $199.9 million, which represents an increase of 140.4% from the same twelve month period in 2009. Revenues increased as a result of higher crew utilization in the United States coupled with revenues from multi-client in both pre-funding deliveries and late sales. Multi-client data library licensing revenues totaled $71.1 million and $10.3 million for the years ended December 31, 2010 and 2009, respectively.
Despite improved revenues in North America, revenues from the international data acquisition segment were negatively impacted by lower utilization from a job mix that included less shallow water work, project commencement delays and weather downtime. Seismic acquisition revenues from international operations were $349.2 million or 63.6% of total seismic data acquisition revenue compared with $417.1 million or 83.4% of total seismic data acquisition related revenue for the same period in 2009.
39
Seismic data processing revenue totaled $9.0 million for the year ended December 31, 2010 as compared to $10.7 million for the same period of 2009, a decrease of 15.6%. The decline in revenue is the result of depressed pricing in North America and internationally. Additionally, the revenue generated from proprietary data processing work has declined slightly due to our increased focus on multi-client work in the United States.
Operating Expenses. Consolidated direct operating costs increased to $454.2 million for the year ended December 31, 2010 from $370.2 million for the same period in 2009. Changes in operating expense as a percentage of revenues is discussed below and is related to overall increased costs related to operating additional PGS Onshore crews in North America and internationally. Seismic acquisition operating expenses from North America increased by $54.6 million to $120.5 million for the twelve months ended December 31, 2010 compared with the same period of 2009. International seismic acquisition expenses increased by $29.2 million to $324.8 million for the twelve months ended December 31, 2010 compared with the same period of 2009.
Seismic acquisition operating expenses increased to $445.3 million for the twelve months ended December 31, 2010 from $361.6 million for the same period of 2009. Seismic acquisition operating expenses as a percentage of revenue were 81.1% for the twelve months ended December 31, 2010 as compared to 72.3% for the same period in the prior year. This increase in operating expenses as a percentage of revenue is a result of higher idle costs in international operations coupled with a change in our job mix globally.
Seismic acquisition operating expenses from North America for the year ended December 31, 2010 were $120.5 million, or 60.3% of total North America seismic data acquisition revenue, compared to $66.0 million, or 79.3% of total North America seismic data acquisition revenue for the same period in 2009. The costs as a percentage of revenue have decreased due to a higher contribution from multi-client data library sales coupled with increased crew efficiency and equipment utilization as a result of the PGS Onshore acquisition.
Seismic acquisition operating expenses from international operations for the year ended December 31, 2010 were $324.8 million, or 93.0% of total international seismic data acquisition revenue, compared to $295.6 million, or 70.9% of total international seismic data acquisition revenue for the same period in 2009. International operating expenses are higher as a result of decreased activity levels due to delays in project awards and project commencements and higher as a percentage of revenue due to certain fixed costs for idle crews and vessels.
Data processing expenses were slightly higher at $8.9 million for the year ended December 31, 2010 compared to $8.6 million for the same period in 2009. To remain competitive, we accepted lower margin jobs while processing a higher volume of data during 2010.
General and Administrative Expenses. General and administrative expenses for the twelve months ended December 31, 2010 were $81.2 million as compared to $53.8 million for the same period of 2009, an increase of $27.4 million or 50.9%. This increase is primarily due to the costs associated with the integration of the PGS Onshore acquisition including severance costs and higher salary expense associated with increased personnel levels.
Depreciation and Amortization Expenses. Depreciation and amortization expense for the twelve months ended December 31, 2010 totaled $112.9 million as compared to $56.9 million for the same period of 2009, an increase of $56.0 million or 98.4%. This is primarily attributable to continued capital expenditures to support international crews along with the amortization of the multi-client investment and the purchase of $104.1 million of PGS Onshore's fixed assets. We incurred capital expenditures of $47.7 million in 2010 as compared to $38.8 million in 2009. Amortization of multi-client data for the years ended December 31, 2010 and 2009 was $38.4 million and $6.6 million, respectively.
40
Interest Expense. Interest expense (net of interest income) for the twelve months ended December 31, 2010 increased by $31.9 million or 533.5% to $37.8 million as compared to approximately $5.9 million for the same period of 2009. This increase is primarily due to interest expense of $32.0 million related to the senior secured Notes due 2014 and respective deferred issue costs and discount accretion. Interest expense also included a $4.9 million charge related to the mandatorily redeemable preferred stock.
Change in Derivative Liabilities. The $6.4 million non-cash loss for the twelve months ended December 31, 2010 compared to a non-cash loss of $7.3 million for the twelve months ended December 31, 2009 is related to recording the change in fair value of the derivatives liabilities. The derivatives were revalued using available market information and commonly accepted valuation methodologies. One of the variables used to determine the fair value of the derivative liabilities is our stock price. When the value of our stock increases, so does the value of the derivatives. Therefore, the increase in our stock price contributed to the non-cash loss. For additional information, see note 8 to notes to consolidated financial statements included elsewhere in this annual report of Form 10-K.
Income Tax. Provision for income taxes for the twelve months ended December 31, 2010 was $4.8 million, as compared to $23.3 million for the same period of 2009, a decrease of $18.5 million or 79.4%. The decrease is mainly due to losses in foreign jurisdictions. In addition, we recorded a $0.8 million interest charge during 2010 on the amounts accrued for uncertain tax positions.
EBITDA and Net Loss. EBITDA (as defined below) decreased 73.9% to $22.8 million for 2010 compared to $87.0 million for 2009. This decrease was due to decreased international revenues combined with decreased activity levels due to delays in project awards and project commencements. In addition, we had increased expenses from the PGS Onshore acquisition. We had a loss applicable to common stockholders of $147.5 million, or ($8.46) per share, for the twelve months ended December 31, 2010, as compared to a loss applicable to common stockholders of $34.1 million, or ($3.14) per share, for the twelve months ended December 31, 2009. The increase in our net loss applicable to stockholders resulted primarily from the same variables impacting EBITDA as well as the increase in interest expense related to the senior secured Notes due 2014 and the mandatorily redeemable preferred stock (described above).
We define EBITDA as net income (loss) (the most directly generally accepted accounting principle or "GAAP" financial measure) before Interest, Taxes, Other Income (Expense) (including foreign exchange gains/losses, gains/losses on disposal of equipment and insurance proceeds, gains/losses from change in fair value of derivative liabilities and other income/expense), and Depreciation and Amortization. "EBITDA," as used and defined by us, may not be comparable to similarly titled measures employed by other companies and is not a measure of performance calculated in accordance with GAAP. EBITDA should not be considered in isolation or as a substitute for operating income, net income or loss, cash flows provided by operating, investing and financing activities, or other income or cash flow statement data prepared in accordance with GAAP. However, we believe EBITDA is useful to an investor in evaluating our operating performance because this measure: (1) is widely used by investors in the energy industry to measure a company's operating performance without regard to items excluded from the calculation of such term, which can vary substantially from company to company depending upon accounting methods and book value of assets, capital structure and the method by which assets were acquired, among other factors; (2) helps investors to more meaningfully evaluate and compare the results of our operations from period to period by removing the effect of our capital structure and asset base from its operating structure; and (3) is used by our management for various purposes, including as a measure of operating performance, in presentations to our board of directors, as a basis for strategic planning and forecasting, and as a component for setting incentive compensation. There are significant limitations to using EBITDA as a measure of performance, including the inability to analyze the effect of certain recurring and non-recurring items that materially
41
affect our net income or loss, and the lack of comparability of results of operations of different companies.
See below for reconciliation from net loss applicable to common stockholders to EBITDA:
| |
For the Year Ended December 31 (in thousands) |
||||||
|---|---|---|---|---|---|---|---|
| |
2010 | 2009 | |||||
Net Loss Applicable to Common Stockholders |
$ | (147,534 | ) | $ | (34,125 | ) | |
Inducements Paid to Preferred Stockholders |
— | 9,059 | |||||
Preferred Stock Dividends and Accretion Costs |
8,850 | 12,731 | |||||
Net Loss |
(138,684 | ) | (12,335 | ) | |||
Income Tax Expense |
4,810 | 23,252 | |||||
Interest Expense, net |
37,827 | 5,971 | |||||
Other Expense (as defined above) |
5,901 | 13,200 | |||||
Depreciation and Amortization |
112,897 | 56,921 | |||||
EBITDA |
$ | 22,751 | $ | 87,009 | |||
Results of Operations for Year Ended December 31, 2009 compared to 2008
Operating Revenues. Revenues for the twelve months ended December 31, 2009 totaled $511.0 million as compared to $474.6 million for the same period of 2008, an increase of 7.7%. This increase in revenue is attributable primarily to our international seismic data acquisition segment. For the twelve months ended December 31, 2009, seismic data acquisition revenue totaled $500.3 million as compared to $462.6 million for the same period of 2008, an increase of 8.1%. This increase in seismic data acquisition revenue is primarily attributable to investment in additional international crew capacity and continued strong demand for our services in niche markets such as OBC and transition zone. Seismic data acquisition revenues for the twelve months ended December 31, 2009 includes $83.2 million or 16.6% from North America, and $417.1 million or 83.4% from international. Seismic data processing revenue totaled $10.7 million for the year ended December 31, 2009 as compared to $12.0 million for the same period of 2008, a decrease of 10.8% due to decreased demand and increased price competition. Revenues include data library licensing revenues of $10.3 million and $0.5 million for the years ended December 31, 2009 and 2008, respectively.
Operating Expenses. Operating expenses for the twelve months ended December 31, 2009 totaled $370.2 million as compared to $370.2 million for the same period of 2008. Of the total operating expenses, seismic data acquisition operating expenses totaled $361.6 million for the twelve months ended December 31, 2009, as compared to $361.3 million for the same period of 2008. While seismic data acquisition revenues increased by 7.7%, data acquisition operating expenses remained the same due to the shift in job mix towards higher margin, international programs. Seismic data acquisition operating expenses for the twelve months ended December 31, 2009 includes $66.0 million, or 18.3%, from North America, and $295.6 million, or 81.7% from international. Seismic data processing operating expenses totaled $8.6 million for the year ended December 31, 2009, as compared to $8.9 million for the same period of 2008, a decrease of 3.4% primarily due to lower activity levels.
General and Administrative Expenses General and administrative expenses for the twelve months ended December 31, 2009 were $53.8 million as compared to $39.3 million for the same period of 2008, an increase of $14.5 million or 36.9%. This increase is primarily the result of salary expenses associated with increased personnel levels due to our overall growth; the strengthening of our infrastructure consisting primarily of information systems implementation costs, severance costs, and costs incurred related to the PGS Onshore acquisition.
42
Depreciation and Amortization Expenses. Depreciation and amortization expense for the twelve months ended December 31, 2009 totaled $56.9 million as compared to $49.0 million for the same period of 2008, an increase of $7.9 million or 16.1%. This is primarily attributable to continued capital expenditures to support international crews along with the amortization of the multi-client investment. We incurred capital expenditures of $38.8 million in 2009 as compared to $77.1 million in 2008. Amortization of multi-client data for the years ended December 31, 2009 and 2008 was $6.6 million and $0.5 million, respectively.
Interest Expense. Interest expense (net of interest income) for the twelve months ended December 31, 2009 decreased by $0.3 million or 4.8% to $5.9 million as compared to approximately $6.2 million for the same period of 2008.
Other. During 2009, we incurred a $2.9 million charge for a bridge commitment we obtained in connection with the signing of the purchase agreement to purchase PGS Onshore.
Change in Derivative Liabilities. The $7.3 million non-cash loss for the year ended December 31, 2009 is related to the change in fair value of the derivatives liabilities. The derivatives were revalued using available market information and commonly accepted valuation methodologies. The recognition of the change in fair value is the result of the adoption of ASC 815-40-15 effective January 1, 2009.
Income Tax. Provision for income taxes for the twelve months ended December 31, 2009 was $23.3 million, as compared to $9.3 million for the same period of 2008, an increase of $14.0 million or 150.5%. The increase is mainly due to increased profitability in foreign jurisdictions and related withholding taxes. The increase is mainly due to increased profitability in foreign jurisdictions, increased activity in deemed profit areas where taxes are calculated as a percentage of revenues and increased withholding taxes on the rental of our United States owned equipment to our foreign subsidiaries. In addition, we recorded a $7.2 million charge during 2009 for an uncertain tax position in one of our foreign operations.
EBITDA and Net Loss. EBITDA (as defined below) increased 33.8% to $87.0 million for 2009 compared to $65.0 million for 2008. This increase was due to increased international revenues and improved international margins, primarily as a result of a higher contribution from shallow water OBC and transition zone projects. We also had better crew utilization and less down time due to longer term contracts. We had a net loss applicable to common stockholders of $34.1 million, or ($3.14) per share, for the twelve months ended December 31, 2009, as compared to a net loss applicable to common stockholders of $5.3 million, or ($0.51) per share, for the twelve months ended December 31, 2008. The increase in our net loss applicable to stockholders is primarily due to $13.3 million of one-time inducement payments to preferred stockholders, the bridge loan fee, and acquisition costs related to the PGS Onshore acquisition and a $7.3 million loss from change in fair value of derivative liabilities.
See below for a reconciliation from net loss applicable to common stockholders to EBITDA:
| |
For the Year Ended December 31 (in thousands) |
||||||
|---|---|---|---|---|---|---|---|
| |
2009 | 2008 | |||||
Net Loss Applicable to Common Stockholders |
$ | (34,125 | ) | $ | (5,339 | ) | |
Preferred Stock Dividends and Inducements Paid to Restructure Preferred Stock |
21,790 | 6,325 | |||||
Net Income (Loss) |
(12,335 | ) | 986 | ||||
Income Tax Expense |
23,252 | 9,268 | |||||
Interest Expense, net |
5,971 | 6,176 | |||||
Other Expense (Income) (as defined above) |
13,200 | (401 | ) | ||||
Depreciation and Amortization |
56,921 | 48,990 | |||||
EBITDA |
$ | 87,009 | $ | 65,019 | |||
43
Inflation and Price Changes. We do not believe that inflation has had a significant effect on our business, financial condition, or results of operations during the most recent three years.
Foreign Currency Exchange Risk. We operate in certain countries where we are exposed to foreign currency exchange risk. As the majority of our contracts are denominated in U.S. dollars, when possible, we mitigate this risk by entering into split-dollar contracts. Under a split-dollar contract, each client invoice is split into a local currency payment and a U.S. dollar payment. The local currency payment is collected locally and used to fund local expenditures, while the U.S. dollar payment is made directly to a U.S. dollar denominated bank account. This reduces our exposure to foreign currency risks.
Off-Balance Sheet Arrangements
We had no off-balance sheet arrangements for the twelve months ended December 31, 2010 that have or are reasonably likely to have a current or future effect on our financial condition, changes in financial condition, revenues or expenses, results of operations, liquidity, capital expenditures, or capital resources that are material to investors.
Contractual Obligations
The following table summarizes our obligations and commitments to make future payments of principal and interest under its long-term debt, capital leases, notes payable, mandatorily redeemable preferred stock and operating leases for the periods specified as of December 31, 2010, (in thousands):
Contractual Obligations Table
| |
Total | Less than 1 year |
2-3 years |
4-5 years |
Over 5 years |
|||||||||||
|---|---|---|---|---|---|---|---|---|---|---|---|---|---|---|---|---|
Long-Term Debt and Capital Lease Obligations |
$ | 325,447 | $ | 1,634 | $ | 23,813 | $ | 300,000 | $ | — | ||||||
Interest on Long-Term Debt |
117,000 | 29,250 | 58,500 | 29,250 | — | |||||||||||
Mandatorily Redeemable Preferred Stock(1) |
67,928 | — | — | 37,767 | 30,161 | |||||||||||
Operational Leases(2) |
26,669 | 13,220 | 8,008 | 4,351 | 1,090 | |||||||||||
Total |
$ | 537,044 | $ | 44,104 | $ | 90,321 | $ | 371,368 | $ | 31,251 | ||||||
Discount on Long-Term Debt and Mandatory Redeemable Preferred Stock |
(27,193 | ) | ||||||||||||||
Total, Net of Discount |
$ | 509,851 | ||||||||||||||
Amount of Commitment Expiration Per Period
| |
Total Amounts Committed |
Less than 1 year |
2-3 years |
4-5 years |
Over 5 years |
|||||||||||
|---|---|---|---|---|---|---|---|---|---|---|---|---|---|---|---|---|
Standby Letters of Credit |
$ | 3,902 | $ | 3,902 | $ | — | $ | — | $ | — | ||||||
- (1)
- Includes
accrued interest.
- (2)
- Includes minimum obligation for marine vessels on renewable 12 month time-charter.
During 2010, we entered into various financing activities as further described in "Liquidity and Capital Resources."
44
Critical Accounting Policies
A critical accounting policy is one that is both important to the presentation of our financial condition and results of operations and requires management to make difficult, subjective or complex accounting estimates. An accounting estimate is an approximation made by management of a financial statement element, item or account in the financial statements. Accounting estimates in our historical consolidated financial statements measure the effects of past business transactions or events, or the present status of an asset or liability. The accounting estimates described below require us to make assumptions about matters that are highly uncertain at the time the estimate is made. Additionally, different estimates that we could have used or changes in an accounting estimate that are reasonably likely to occur could have a material impact on the presentation of our financial condition or results of operations. The circumstances that make these judgments difficult, subjective and/or complex have to do with the need to make estimates about the effect of matters that are inherently uncertain. Estimates and assumptions about future events and their effects cannot be predicted with certainty. We base our estimates on historical experience and on various other assumptions that we believe to be reasonable under the circumstances, the results of which form the basis for making judgments. These estimates may change as new events occur, as more experience is acquired, as additional information is obtained and as our operating environment changes. Our significant accounting policies are discussed in Note 2 to our consolidated financial statements. We believe the following accounting policies involve the application of critical accounting estimates.
Fair Values of Financial Instruments
Effective January 1, 2008, we adopted ASC Topic 820 as it relates to financial assets and financial liabilities, which defines fair value, establishes a framework for measuring fair value under generally accepted accounting principles and expands disclosures about fair value measurements. The provisions of this standard apply to other accounting pronouncements that require or permit fair value measurements.
This guidance defines fair value as the price that would be received to sell an asset or paid to transfer a liability in an orderly transaction between market participants at the measurement date. Hierarchical levels, as defined in this guidance and directly related to the amount of subjectivity associated with the inputs to fair valuations of these assets and liabilities and we have indicated the level of data utilized with respect to each financial instrument fair value disclosure.
We are not a party to any hedge arrangements, commodity swap agreement or other derivative financial instruments. Our seismic data acquisition and seismic data processing segments utilize foreign subsidiaries and branches to conduct operations outside of the United States. These operations expose us to market risks from changes in foreign exchange rates.
Revenue Recognition
Our services are provided under cancelable service contracts. Customer contracts for services vary in terms and conditions. Contracts are either "turnkey" or "term" agreements or a combination of the two. Under turnkey agreements or the turnkey portions thereof, we recognize revenue based upon output measures as work is performed. This method requires that we recognize revenue based upon quantifiable measures of progress, such as square miles or linear kilometers acquired. With respect to those contracts where the customer pays separately for the mobilization of equipment, we recognize such mobilization fees as revenue during the performance of the seismic data acquisition, using the same performance method as for the acquisition work. We also receive revenue for certain third party charges under the terms of the service contracts. We record amounts billed to customers in revenue as the gross amount including third party charges, if applicable, that are paid by the customer. Our turnkey or term contracts generally do not contain cancellation provisions that would prevent us from being compensated for work performed prior to cancellation due to work not being met or work not
45
being performed within a particular timeframe. In some instances, customers are billed in advance of work performed and we recognize the advance billing as deferred revenue.
We account for multi-client data sales as follows:
(a) Pre-funding arrangements—We obtain funding from customers before a seismic project is completed. In return for the pre-funding, the customer typically gains the ability to direct or influence the project specifications, to access data as it is being acquired and to pay discounted prices. We recognize pre-funding revenue as the services are performed on a proportional performance basis usually determined by comparing the completed square miles of a seismic survey to the survey size unless specific facts and circumstances warrant another measure. Progress is measured in a manner generally consistent with the physical progress on the project, and revenue is recognized based on the ratio of the project's progress to date, provided that all other revenue recognition criteria are satisfied.
(b) Late sales—When we grant a license to a customer, the customer is entitled to have access to a specifically defined portion of the multi-client data library. Our customer's license payment is fixed and determinable and typically is required at the time that the license is granted. We recognize revenue for late sales when our customer executes a valid license agreement and has received the underlying data or has the right to access the licensed portion of the data and collection is reasonably assured.
(c) Sales of data jointly owned by us and partner—We have jointly acquired surveys with a partner whereby we share the costs of acquisition and earn license revenues when processed data is delivered by our partner to the ultimate client. As such, these revenues are recognized when the processed data is delivered to the ultimate client.
Deferred revenue consists primarily of customer payments made in advance of work done, progress billings and mobilization revenue, amortized over the term of the related contract.
Multi-Client Data Library
We capitalize all costs directly associated with acquiring and processing the data, including the depreciation of the assets used during production of the surveys. We refer to these costs as our gross multi-client investment. The capitalized cost of the multi-client data is charged to depreciation and amortization in the period the sales occur based on the greater of the percentage of total estimated costs to the total estimated sales in the first five years multiplied by actual sales, known as the sales forecast method, or the straight-line amortization method over five years. This minimum straight-line amortization is recorded only if minimum amortization exceeds the cost of services calculated using the sales forecast method.
We periodically review the carrying value of the multi-client data library. If during any such review, we determine that the future revenue for a multi-client survey is expected to be more or less than the original estimate of total revenue, we decrease or increase (as the case may be) the amortization rate attributable to the future revenue from the multi-client survey. Furthermore, in connection with the review, we evaluate the recoverability of the multi-client data library, and if required under ASC 360 "Accounting for the Impairment and Disposal of Long-Lived Assets," records an impairment charge with respect to the multi-client survey. There were no impairment charges determined for 2010 and 2009.
Derivative Liabilities
We have convertible preferred stock issued and outstanding and common stock warrants issued in connection with a preferred stock issuance in July 2008 and December 2010. Both the convertible preferred stock conversion feature and warrants contain a price protection provision (or down-round provision) which reduces their price in the event we issue additional shares at a more favorable price than the strike price.
46
The Financial Accounting Standard Board ("FASB") accounting and reporting standards for derivative instruments, including certain derivative instruments embedded in other contracts is included in ASC 815-40-15 "Derivatives and Hedging-Contracts in Entity's Own Equity-Scope and Scope Exceptions". This standard provides that an instrument's strike price or the number of shares used to calculate the settlement amount are not fixed if its terms provide for any potential adjustment, regardless of the probability of such adjustment(s) or whether such adjustments are in the entity's control. If equity-linked financial instrument (or embedded feature) is indexed to its own stock, based on the instrument's contingent exercise and settlement provisions, for periods ended after the adoption date of January 1, 2009, the fair value of the conversion feature is bifurcated from the host instrument and recognized as a liability on our consolidated balance sheet. The warrants are recognized at fair value as a liability on our consolidated balance sheet. The fair value of the conversion feature, the warrants and other issuance costs of the preferred stock financing transaction, are recognized as a discount to the preferred stock host. The discount embedded in Series B preferred stock is accreted to the preferred stock host from our paid in capital, treated as a deemed dividend, over the period from the issuance date through the earliest redemption date of the preferred stock. The discount embedded in Series D junior preferred stock is accreted to the preferred stock from the period from issuance date through the redemption date and is recorded in interest expense.
Goodwill
We perform impairment tests on the carrying value of our goodwill on an annual basis. As of December 31, 2010 we used a combination of the Discounted Cash Flow Method and the Subject Company Market approach. The Discounted Cash Flow Method focuses on expected cash flows. In applying this approach, the expected cash flow is projected based on assumptions regarding revenues, direct costs, general and administrative expenses, depreciation, applicable income taxes, capital expenditures and working capital requirements for a finite period of years, which was five years in our test. The projected cash flows and the terminal value, which is an estimate of the value at the end of the finite period and assumes a long-term growth rate, are then discounted to present value to derive an indication of the value of the reporting unit. Due to the economic conditions affecting the industry, we also utilized the Subject Company Market approach which makes a comparison of our projections to reasonably similar publicly traded companies. In weighting the results of the various valuation approaches, we placed more emphasis on the Income Approach. At December 31, 2010, our annual impairment test indicated the fair value of our reporting unit's goodwill exceeded the carrying amount by over 100%.
Recent Accounting Pronouncements
In October 2009, the FASB issued an update to ASC 605, Revenue Recognition. This ASU addresses the accounting for multiple deliverables contained in a single sales arrangement. We adopted this new guidance on January 1, 2011. Accordingly, we apply this guidance to transactions initiated or materially modified on or after January 1, 2011. We are currently evaluating the impact of the adoption of this guidance on our consolidated financial statements.
In January 2010, the FASB issued new accounting guidance to require additional fair value related disclosures including transfers into and out of Levels 1 and 2 and separate disclosures about purchases, sales, issuances, and settlements relating to Level 3 measurements. It also clarifies existing fair value disclosure guidance about the level of disaggregation and about inputs and valuation techniques. This new guidance is effective for the first reporting period beginning after December 15, 2009 except for the requirement to separately disclose purchases, sales, issuances and settlements relating to Level 3 measurements, which is effective for the first reporting period beginning after December 15, 2010. Our adoption of this new guidance did not have a material impact on its financial position, results of operations or cash flows. We have included additional disclosure related to early adoption of the
47
Level 3 related gross disclosure requirement, which is effective in 2011; disclosures had no impact on the consolidated financial statements.
In December 2010, the FASB issued an update to ASC 805, Business Combinations. This ASU addresses the disclosure of comparative financial statements and expands on the supplementary pro forma information for business combinations. We will adopt this ASU prospectively for business combinations occurring on or after December 15, 2010.
Item 7A. Quantitative and Qualitative Disclosures About Market Risk
We are exposed to certain market risks arising from the use of financial instruments in the ordinary course of business. These risks arise primarily as a result of potential changes to operating concentration and credit risk, changes in interest rates and foreign currency exchange rate risks. Additionally, we are exposed to market risk with respect to our own equity securities. These risks are further discussed below.
Concentration and Credit Risk
Our principal market risks include fluctuations in commodity prices which affect demand for and pricing of our services and the risk related to the concentration of our customers in the oil and natural gas industry. Since all of our customers are involved in the oil and natural gas industry, there may be a positive or negative effect on our exposure to credit risk because our customers may be similarly affected by changes in economic and industry conditions. As an example, changes to existing regulations or the adoption of new regulations may unfavorably impact us, our suppliers or our customers. In the normal course of business, we provide credit terms to our customers. Accordingly, we perform ongoing credit evaluations of our customers and maintain allowances for possible losses which, when realized, have been within the range of our expectations. We believe that our unreserved trade receivables at December 31, 2010 of $103.8 million are collectible and that our allowance for doubtful accounts is adequate.
We generally provide services to a relatively small group of key customers that account for a significant percentage of our accounts receivable at any given time. Our key customers vary over time. We extend credit to various companies in the oil and natural gas industry, including our key customers, for the acquisition of seismic data, which results in a concentration of credit risk. This concentration of credit risk may be affected by changes in the economic or other conditions of our key customers and may accordingly impact our overall credit risk. If any of these significant clients were to terminate their contracts or fail to contract for our services in the future because they are acquired, alter their exploration or development strategy, or for any other reason, our results of operations could be affected. For the year ended December 31, 2010, our top ten customers Petróleos Mexicanos ("Pemex"), Petroleo Brasileiro S.A.-Petrobras ("Petrobras"), Eni S.P.A., Sonangol, Oxy USA Inc., BP, Petroleum Company of Trinidad and Tobago Limited ("Petrotrin"), Petrogal Brasil, Almitra Energy Services Sdn. Bhd., and Vintage Production California, LLC. These top 10 customers represented 50% of our consolidated revenue for 2010.
Our two largest customers in 2010, Pemex and Petrobras, accounted for 10% and 8% of total revenue, respectively. Because of the nature of our contracts and customers' projects, our largest customers can change from year to year and the largest customers in any year may not be indicative of the largest customers in any subsequent year.
Interest Rate Risk
We are exposed to changes in interest rates through our fixed rate long-term debt. Typically, the fair market value of fixed rate long-term debt will increase as prevailing interest rates decrease and will decrease as prevailing interest rates increase. The fair value of our long-term debt is estimated based on quoted market prices where applicable, or based on the present value of expected cash flows
48
relating to the debt discounted at rates currently available to us for long-term borrowings with similar terms and maturities. The estimated fair value of our long-term debt was $325 million as of December 31, 2010 and $400 million at December 31, 2009.
We are exposed to the impact of interest rate changes on the outstanding indebtedness under our senior credit facility which has variable interest rates. Amounts drawn under the credit facility bear interest at variable rates based on LIBOR plus a margin or the alternative base rate as defined in the agreement. The interest rate margin applicable to LIBOR advances varies based on our total leverage ratio. The hypothetical impact on an average outstanding balance of our variable rate indebtedness of $20 million from a hypothetical 100 basis point increase in interest rates would be an increase in interest expense of approximately $0.5 million per quarter.
We have cash in bank and restricted cash which, at times, may exceed federally insured limits. Restricted cash includes cash held to collateralize standby letters of credit and performance guarantees. Historically, we have not experienced any losses in such accounts. Recent volatility in financial markets may impact our credit risk on cash and short-term investments. At December 31, 2010, unrestricted and restricted cash and cash equivalents totaled $45.3 million.
Foreign Currency Exchange Rate Risk
We operate in a number of international areas and are involved in transactions denominated in currencies other than the U.S. dollar, which expose us to foreign currency exchange rate risk. We utilize the payment structure of customer contracts to selectively reduce our exposure to exchange rate fluctuations in connection with monetary assets, liabilities and cash flows denominated in certain foreign currencies. We do not hold or issue foreign currency forward contracts, option contracts or other derivative financial instruments for speculative purposes.
We have designated the U.S. dollar as the functional currency for most of our operations in international locations because we contract with customers, purchase equipment and finance capital using the U.S. dollar. In those countries where we have designated the U.S. dollar as the functional currency, certain assets and liabilities of foreign operations are translated at historical exchange rates, revenues and expenses in these countries are translated at the average rate of exchange for the period, and all translation gains or losses are reflected in the period's results of operations.
Our net foreign exchange gain attributable to our international operations was $0.4 million for the year ended December 31, 2010. There are many factors affecting foreign exchange rates and resulting exchange gains and losses, most of which are beyond our control. During the twelve months ended, December 31, 2010, we derived $349.2 million or 62.6% of our revenues from international operations. It is not possible for us to predict the extent to which we may be affected by future changes in exchange rates and exchange controls.
Equity Risk
Under the terms of our Series B-1 Preferred Stock and existing warrants and options to purchase our common stock, the holders of these instruments are given an opportunity to profit from a rise in the market price of our common stock that, upon the conversion of our Series B-1 Preferred Stock and the exercise of the warrants and/or options, could result in dilution in the interests of our other stockholders. As fully described in Note 9 to the Consolidated Financial Statements, Series B-1 stockholders have various additional rights, including dividends, consent of holders to, among other things, enter into a business combination or declare dividends. The holders of our preferred stock have the preemptive right to acquire shares of our common stock that we may offer for cash in the future, other than shares sold in a public offering and the conversion price of the Series B-1 shares is subject to a down-round provision which may increase their holdings in the event of any offering. The terms on which we may obtain additional financing may be adversely affected by the existence and potentially dilutive impact of our Series B-1 Preferred Stock, and common stock options and warrants.
49
We are required to account for the conversion feature preferred stock related embedded derivative and investor warrants as derivative liabilities. Geokinetics is required to mark to market in each reporting quarter the value of the embedded derivative and investor warrants. We revalue these derivative liabilities at the end of each reporting period. Derivative liabilities are presented as a long-term liability on the balance sheet and totaled $38.3 million and $9.3 million as of December 31, 2010 and December 31, 2009, respectively. The periodic change in value of the derivative liabilities is recorded as either non-cash derivative income (if the value of the embedded derivative and investor warrants decrease) or as non-cash derivative expense (if the value of the embedded derivative and investor warrants increase). Although the values of the embedded derivative and warrants are affected by interest rates, the remaining contractual conversion period and our stock volatility, the primary cause of the change in the values will be the value of our common stock. If the stock price goes up, the value of these derivatives will generally increase and if the stock price goes down the value of these derivatives will generally decrease. Our stock has historically been volatile; as a result, periodic gain or loss from change in fair value of derivative liabilities may be material. Change in fair-value of derivatives is detailed in the Condensed Consolidated Statements of Operations under the section Other Income (expenses) and is discussed in the previous section. The loss from the change in fair value of derivative liabilities was $6.4 million and $7.3 million for the years ended December 30, 2010 and 2009, respectively.
Item 8. Financial Statements and Supplementary Data
Our Annual Consolidated Financial Statements, Notes to Consolidated Financial Statements and the reports of UHY LLP ("UHY"), our independent registered public accounting firm, with respect thereto, referred to in the Table of Contents to Consolidated Financial Statements, appear beginning on Page F-1 of this document and are incorporated herein by reference.
Item 9. Changes in and Disagreements with Accountants on Accounting and Financial Disclosure
During the years ended December 31, 2010, 2009 and 2008, there were no disagreements with UHY on any significant accounting principles or practices, financial statement disclosure or auditing scope or procedure, which disagreements, if not resolved to the satisfaction of UHY, would have caused it to make reference thereto in connection with their respective reports on our financial statements for such years. No reportable event as described in paragraph (a)(1)(v) of item 304 of Regulation S-K occurred during the years ended December 31, 2010, 2009, and 2008.
Item 9A. Controls and Procedures
(a) Disclosure Controls and Procedures. We maintain disclosure controls and procedures that are designed to ensure that information required to be disclosed in our reports under the Exchange Act are recorded, processed, summarized and reported within the time periods specified in the SEC's rules and forms, and that such information is accumulated and communicated to management, including our Chief Executive Officer and Chief Financial Officer ("CFO"), as appropriate, to allow timely decisions regarding required disclosure.
Our management including the CEO and CFO have evaluated the effectiveness of our disclosure controls and procedures as of the end of the fiscal year covered by this Annual Report on Form 10-K. As described below under Management's Annual Report on Internal Control over Financial Reporting, we have identified material weaknesses in our internal control over financial reporting (as defined in Exchange Act Rules 13a-15(f) and 15d-15(f)) as of December 31, 2010. As a result of these material weaknesses, our CEO and CFO have concluded that, as of the end of the period covered by this Annual Report on Form 10-K, our disclosure controls and procedures were not effective.
In light of these material weaknesses, in preparing our financial statements as of and for the fiscal year ended December 31, 2010, we performed additional analyses and other post-closing procedures in
50
an effort to ensure our consolidated financial statements included in our Annual Report on Form 10-K for the fiscal year ended December 31, 2010 have been prepared in accordance with accounting principles generally accepted in the United States of America. Additionally, during the first quarter of 2011, we began to implement additional controls and procedures, as discussed below in paragraph (d) of this Item 9A, that are intended to remediate the material weaknesses identified as of December 31, 2010.
(b) Management's Annual Report on Internal Control over Financial Reporting. Our management including the CEO and CFO are responsible for establishing and maintaining adequate internal control over financial reporting. Our internal control system was designed to provide reasonable assurance regarding the reliability of financial reporting and the preparation and fair presentation of published financial statements in accordance with accounting principles generally accepted in the United States of America and includes those policies and procedures that:
- •
- pertain to the maintenance of records that in reasonable detail accurately and fairly reflect the transactions and
dispositions of the our assets;
- •
- provide reasonable assurance that transactions are recorded as necessary to permit preparation of financial statements in
accordance with accounting principles generally accepted in the United States of America, and that our receipts and expenditures are being made only in accordance with authorizations of its management
and directors; and
- •
- provide reasonable assurance regarding prevention or timely detection of unauthorized acquisition, use or disposition of our assets that could have a material effect on our consolidated financial statements.
Because of its inherent limitations, internal control over financial reporting may not prevent or detect misstatements. Projections of any evaluation of the effectiveness of internal control over financial reporting to future periods are subject to the risks that controls may become inadequate because of changes in conditions, or that the degree of compliance with the policies or procedures may deteriorate.
A material weakness is a deficiency, or a combination of deficiencies, in internal control over financial reporting, such that there is a reasonable possibility that a material misstatement of the company's annual or interim financial statements will not be prevented or detected on a timely basis.
Management assessed the effectiveness of our internal control over financial reporting as of December 31, 2010, and in making this assessment, used the criteria set forth by the Committee of Sponsoring Organizations of the Treadway Commission in Internal Control-Integrated Framework in accordance with the standards of the Public Company Accounting Oversight Board (United States). Based on this assessment, management identified the following material weaknesses as of December 31, 2010.
- •
- Entity Level Controls (Control Environment): During 2010,
we did not maintain an effective control environment. The control environment, which is the responsibility of senior management, sets the tone of the organization, influences the control consciousness
of its people, and is the foundation for all other components of internal control over financial reporting. The deficient control environment was reflected in our inability to properly account for
certain operational processes and transactions which were not supportive of an effective and efficient internal control environment. Management has determined that this was primarily attributable to
significant turnover and resulting vacancies in key accounting and finance positions during the year.
- •
- Corporate Financial Reporting Process: Controls over the financial close and reporting processes were deficient in areas related to account reconciliations and analyses, accrual management, deferred expenses, revenue accounting, and payroll accounting. This resulted from our lack of
51
adequate accounting and finance personnel, in terms of numbers, technical expertise and knowledge to address certain financial reporting and system integration requirements for a global company.
These material weaknesses resulted in us recording a number of post-closing adjustments to our 2010 consolidated financial statements. The adjustments primarily affected revenue recognition in North America, non-routine accruals and deferred cost accounts, related to our international operations, including, as applicable, the corresponding income statement accounts. These material weaknesses could result in a material misstatement to our annual or interim consolidated financial statements that would not be prevented or detected. Accordingly, Geokinetics management determined that based on these material weaknesses described above, the internal controls over financial reporting were not effective as of December 31, 2010.
(c) Changes in Internal Controls Over Financial Reporting. We significantly upgraded the accounting and finance staff by hiring professionals with experience in designing, implementing and managing global accounting and finance organizations with effective policies, procedures and processes including required global systems design and integration.
(d) Remediation of the Material Weakness in Internal Control over Financial Reporting. To remediate these material weaknesses, in 2010, management began to implement a remediation program which includes the following:
- •
- Control Environment. We have hired experienced personnel
in key positions in its control environment. These include a Chief Financial Officer (25 years experience), a Chief Accounting Officer (25 years experience), a Chief Information Officer
(28 years of experience), a Vice President of Tax (31 years experience), a Corporate Tax Manager (28 years experience) and a Vice President and Treasurer. These personnel have
extensive experience in the design, implementation and enforcement of an effective control environment.
- •
- Financial Reporting Process. We will continue to assess the adequacy of its overall control environment which provides the foundation for internal controls over financial reporting. The new management team together with the senior operations executives, will re-assess its remediation activities related to entity level controls and financial reporting. We will continue to work to improve transparency in global financial and operational transactions by implementing global accounting disciplines through the development and deployment of uniform/global accounting systems, policies and procedures.
Management believes that these actions and resulting improvement in controls have strengthened the disclosure controls and procedures.
During 2009, management identified a material weakness in its accounting for income tax in its international operations. During 2010, we implemented newly designed tax provision controls, which management has determined remedied the deficiencies that caused such material weakness. Also during 2010, management identified a material weakness in its accounting for derivative liabilities. During July 2010, we engaged a big 4 public accounting firm to advise the management on proper identification, measurement and reporting derivative financial instruments and determination of the related fair values, which management has determined remedied the material weakness.
None.
52
PART III
Item 10. Directors, Executive Officers and Corporate Governance
The information required by Item 10 is incorporated by reference to our definitive proxy statement for our Annual Meeting of Stockholders to be held on June 8, 2011, which we expect to file with the SEC within 120 days after December 31, 2010.
Our Code of Business Conduct and Ethics was adopted by the Board of Directors on December 28, 2006, and applies to our directors, officers and employees, including the principal executive officer and principal financial officer. Our Code of Business Conduct and Ethics is available on our website and www.geokinetics.com under "Investor Relations" and "Corporate Governance."
The certifications of our chief executive officer and chief financial officer pursuant to Section 302 of the Sarbanes-Oxley Act of 2002 are attached as Exhibits 31.1 and 31.2 to this report.
Item 11. Executive Compensation
The information required by Item 11 is incorporated by reference to our definitive proxy statement for our Annual Meeting of Stockholders to be held on June 8, 2011, which we expect to file with the SEC within 120 days after December 31, 2010.
Item 12. Security Ownership of Certain Beneficial Owners and Management and Related Stockholder Matters
The information required with respect to our equity compensation plans is set forth in Item 5 of this Form 10-K. The information required by Item 12 is incorporated by reference to our definitive proxy statement for our Annual Meeting of Stockholders to be held on June 8, 2011, which we expect to file with the SEC within 120 days after December 31, 2010.
Item 13. Certain Relationships and Related Transactions, and Director Independence
The information required by Item 13 is incorporated by reference to our definitive proxy statement for our Annual Meeting of Stockholders to be held on June 8, 2011, which we expect to file with the SEC within 120 days after December 31, 2010.
Item 14. Principal Accounting Fees and Services
The information required by Item 14 is incorporated by reference to our definitive proxy statement for our Annual Meeting of Stockholders to be held on June 8, 2011, which we expect to file with the SEC within 120 days after December 31, 2010.
53
PART IV
Item 15. Exhibits and Financial Statement Schedules
- (a)
- List
of documents as part of this Report:
- (1)
- Consolidated
Financial Statements and Report of Independent Public Accounting Firm: See Index on page F-1.
- (2)
- Financial Statements Schedule
All other schedules are omitted as they are inapplicable or the required information is furnished in our Consolidated Financial Statements or the Notes thereto.
- (3)
- Exhibits (items indicated by an (*) are filed herewith)
| 3.1 | Certificate of Incorporation of the Company (incorporated by reference from Exhibit 3.1 to the Company's Registration Statement on Form S-3 filed on June 26, 2009 (file no. 333-160268)). | ||
3.2 |
Amended and Restated Bylaws of the Company (incorporated by reference from Exhibit 3.2 to the Company's Registration Statement on Form S-3 filed on June 26, 2009 (file no. 333-160268)). |
||
3.3 |
Amendment to the Amended and Restated Bylaws of the Company (incorporated by reference from Exhibit 3.1 to Form 8-K filed on May 17, 2007 (file no. 001-33460)). |
||
4.1 |
First Amended Certificate of Designation of Series C Senior Preferred Stock (incorporated by reference from Exhibit 4.4 to Form 8-K filed on February 16, 2010 (file no. 001-33460)). |
||
4.2 |
Fourth Amended Certificate of Designation of Series B Senior Convertible Preferred Stock (incorporated by reference from Exhibit 4.5 to Form 8-K filed on February 16, 2010 (file no. 001-33460)). |
||
4.3 |
Certificate of Designation of Series D Junior Preferred Stock (incorporated by reference from Exhibit 4.2 to Form 8-K filed on December 15, 2010 (file no. 001-33460)). |
||
10.1 |
2007 Geokinetics Inc. Stock Awards Plan (incorporated by reference from Exhibit 4.1 to Form S-8 filed on July 20, 2007 (file no. 333-144763)) |
||
10.2 |
Series B-2 and Warrant Purchase Agreement, dated July 28, 2008, by and among Geokinetics Inc. and the purchasers named therein. (incorporated by reference from Exhibit 10.3 to Form 8-K filed on July 30, 2008 (file no. 001-33460)). |
||
10.3 |
Warrant, dated July 28, 2008, issued by Geokinetics Inc. to Avista Capital Partners, L.P. (incorporated by reference from Exhibit 10.5 to Form 8-K filed on July 30, 2008 (file no. 001-33460)). |
||
10.4 |
Warrant, dated July 28, 2008, issued by Geokinetics Inc. to Avista Capital Partners (Offshore), L.P. (incorporated by reference from Exhibit 10.5 to Form 8-K filed on July 30, 2008 (file no. 001-33460)). |
||
10.5 |
Employment Agreement by and between Geokinetics Inc. and Richard F. Miles dated October 21, 2008 (incorporated by reference from Exhibit 10.1 to Form 8-K filed on October 27, 2008 (file no. 001-33460)). |
||
10.6 |
Amendment and Exchange Agreement dated December 2, 2009, by and among Geokinetics Inc., Avista Capital Partners, L.P., Avista Capital Partners (Offshore), L.P., and Levant America S.A. (incorporated by reference from Exhibit 10.2 to Form 8-K filed December 4, 2009 (file no. 001-33460)). |
54
| 10.7 | Purchase Agreement, dated December 3, 2009, by and among Geokinetics Inc. and certain of its direct and indirect subsidiaries, and Petroleum Geo-Services ASA and certain of its direct and indirect subsidiaries (incorporated by reference from Exhibit 10.1 to Form 8-K filed December 4, 2009 (file no. 001-33460)). | ||
10.8 |
Underwriting Agreement, dated as of December 14, 2009, among Geokinetics Inc. and RBC Capital Markets Corporation, as representative of the several underwriters named therein (incorporated by reference from Exhibit 1.1 to Form 8-K filed December 16, 2009 (file no. 001-33460)). |
||
10.9 |
Debt Purchase Agreement, dated December 18, 2009 (incorporated by reference from Exhibit 10.1 to Form 8-K filed December 22, 2009 (file no. 001-33460)). |
||
10.10 |
Indenture, dated as of December 23, 2009 (incorporated by reference from Exhibit 4.1 to Form 8-K filed December 28, 2009 (file no. 001-33460)). |
||
10.11 |
Collateral Trust and Intercreditor Agreement, dated as of December 23, 2009 (incorporated by reference from Exhibit 4.2 to Form 8-K filed December 28, 2009 (file no. 001-33460)). |
||
10.12 |
Registration Rights Agreement, dated as of December 23, 2009 (incorporated by reference from Exhibit 4.3 to Form 8-K filed December 28, 2009 (file no. 001-33460)). |
||
10.13 |
Supplemental Indenture, dated as of February 12, 2010 (incorporated by reference from Exhibit 4.2 to Form 8-K filed on February 16, 2010 (file no. 001-33460)). |
||
10.14 |
Second Amended and Restated Registration Rights Agreement, dated February 12, 2010, by and among Geokinetics Inc. and the holders named therein (incorporated by reference from Exhibit 4.3 to Form 8-K filed on February 16, 2010 (file no. 001-33460)). |
||
10.15 |
Credit Agreement, dated as of February 12, 2010 by and among Geokinetics Holdings USA, Inc. and Royal Bank of Canada as administrative and collateral agent to the certain lenders named therein (incorporated by reference from Exhibit 10.1 to Form 8-K filed on February 16, 2010 (file no. 001-33460)). |
||
10.16 |
Guaranty, dated as of February 12, 2010 (incorporated by reference from Exhibit 10.2 to Form 8-K filed on February 16, 2010 (file no. 001-33460)). |
||
10.17 |
Employment Agreement by and between Geokinetics Inc. and Lee Parker dated March 22, 2010 (incorporated by reference from Exhibit 10.5 to Form 10-Q filed on May 7, 2010 (file no. 001-33460)). |
||
10.18 |
Geokinetics Inc. 2010 Stock Awards Plan (incorporated by reference from Exhibit 99.1 to Form S-8 filed on May 14, 2010 (file no. 333-166385)). |
||
10.19 |
Amendment No. 1 to the Credit Agreement, dated as of June 30, 2010, by and among Geokinetics Holdings USA, Inc. and Royal Bank of Canada as administrative and collateral agent to the certain lenders named therein (incorporated by reference from Exhibit 10.1 to Form 8-K filed on July 2, 2010 (file no. 001-33460)). |
||
10.20 |
Waiver and Amendment No. 2 to the Credit Agreement, dated as of October 1, 2010, by and among Geokinetics Holdings USA, Inc. and Royal Bank of Canada as administrative and collateral agent to the certain lenders named therein (incorporated by reference from Exhibit 10.1 to Form 8-K filed on October 5, 2010 (file no. 001-33460)). |
||
10.21 |
Employment Agreement by and between Geokinetics Inc. and Gary L. Pittman dated October 13, 2010 (incorporated by reference from Exhibit 10.1 to Form 8-K filed on October 14, 2010 (file no. 001-33460)). |
55
| 10.22 | Waiver and Amendment No. 3 to the Credit Agreement, dated as of December 13, 2010, by and among Geokinetics Holdings USA, Inc. and Royal Bank of Canada as administrative and collateral agent to the certain lenders named therein (incorporated by reference from Exhibit 10.1 to Form 8-K filed on December 15, 2010 (file no. 001-33460)). | ||
10.23 |
Series D Preferred Stock and Warrant Purchase Agreement dated December 14, 2010 (incorporated by reference from Exhibit 4.1 to Form 8-K filed on December 15, 2010 (file no. 001-33460)). |
||
10.24 |
Form of 2010 Warrants (incorporated by reference from Exhibit 4.3 to Form 8-K filed on December 15, 2010 (file no. 001-33460)). |
||
10.25 |
First Amendment, dated December 14, 2010, to Second Amended and Restated Registration Rights Agreement, by and among Geokinetics Inc. and the holders named therein (incorporated by reference from Exhibit 4.4 to Form 8-K filed on December 15, 2010 (file no. 001-33460)). |
||
10.26 |
Form of Indemnification Agreement by and between Geokinetics Inc. and directors and executive officers (incorporated by reference from Exhibit 10.1 to Form 8-K filed on January 28, 2011 (file no. 001-33460)). |
||
10.27 |
Employment Agreement by and between Geokinetics Inc. and Diana Moore dated February 10, 2011 (incorporated by reference from Exhibit 10.1 to Form 8-K filed on February 10, 2011 (file no. 001-33460)). |
||
12.1* |
Statement Regarding the Computation of Ratio of Earnings to Fixed Charges. |
||
21.1* |
Subsidiaries of the Company. |
||
23.1* |
Consent of UHY LLP. |
||
24.2* |
Power of Attorney (incorporated by reference). |
||
31.1* |
Certification of Chief Executive Officer pursuant to Rules 13a-14(a) and 15d-14(a) of the Securities Exchange Act of 1934, as amended. |
||
31.2* |
Certification of Chief Financial Officer pursuant to Rules 13a-14(a) and 15d-14(a) of the Securities Exchange Act of 1934, as amended. |
||
32.1* |
Certification of Chief Executive Officer and Chief Financial Officer pursuant to 18 U.S.C. Section 1350, as adopted pursuant to Section 906 of the Sarbanes-Oxley Act of 2002. |
56
SIGNATURES
Pursuant to the requirements of Section 13 or 15(d) of the Securities Exchange Act of 1934, the Registrant has duly caused this report to be signed on its behalf by the undersigned, thereunto duly authorized.
GEOKINETICS INC. |
||
Date: April 1, 2011 |
/s/ RICHARD F. MILES Richard F. Miles President and Chief Executive Officer (Authorized Officer) |
|
Date: April 1, 2011 |
/s/ GARY L. PITTMAN Gary L. Pittman Executive Vice President and Chief Financial Officer (Principal Accounting Officer) |
|
Date: April 1, 2011 |
/s/ DIANA S. MOORE Diana S. Moore Vice President and Chief Accounting Officer |
|
Date: April 1, 2011 |
/s/ WILLIAM R. ZIEGLER William R. Ziegler Director (Non-executive Chairman) |
|
Date: April 1, 2011 |
/s/ STEVEN A. WEBSTER Steven A. Webster Director |
|
Date: April 1, 2011 |
/s/ CHRISTOPHER M. HARTE Christopher M. Harte Director |
|
Date: April 1, 2011 |
/s/ GARY M. PITTMAN Gary M. Pittman Director |
|
Date: April 1, 2011 |
/s/ ROBERT L. CABES, JR. Robert L. Cabes, Jr. Director |
57
| Date: April 1, 2011 | /s/ CHRISTOPHER D. STRONG Christopher D. Strong Director |
|
Date: April 1, 2011 |
/s/ ANTHONY TRIPODO Anthony Tripodo Director |
|
Date: April 1, 2011 |
/s/ GOTTFRED LANGSETH Gottfred Langseth Director |
58
TABLE OF CONTENTS
CONSOLIDATED FINANCIAL STATEMENTS
F-1
REPORT OF INDEPENDENT REGISTERED PUBLIC ACCOUNTING FIRM
To the Board of Directors and Stockholders of Geokinetics Inc.:
We have audited the accompanying consolidated balance sheets of Geokinetics Inc. and Subsidiaries (the "Company") as of December 31, 2010 and 2009, and the related consolidated statements of operations, cash flows and stockholders' equity for each of the three years in the period ended December 31, 2010. These financial statements are the responsibility of the Company's management. Our responsibility is to express an opinion on these consolidated financial statements based on our audits.
We conducted our audits in accordance with the standards of the Public Company Accounting Oversight Board (United States). Those standards require that we plan and perform the audits to obtain reasonable assurance about whether the consolidated financial statements are free of material misstatement. An audit includes examining, on a test basis, evidence supporting the amounts and disclosures in the consolidated financial statements. An audit also includes assessing the accounting principles used and significant estimates made by management, as well as evaluating the overall consolidated financial statement presentation. We believe that our audits provide a reasonable basis for our opinion.
In our opinion, the consolidated financial statements referred to above present fairly, in all material respects, the consolidated financial position of Geokinetics Inc. and Subsidiaries as of December 31, 2010 and 2009, and the consolidated results of their operations and their cash flows for each of the three years in the period ended December 31, 2010, in conformity with accounting principles generally accepted in the United States of America.
/s/ UHY LLP
Houston,
Texas
April 1, 2011
F-2
GEOKINETICS INC. AND SUBSIDIARIES
CONSOLIDATED BALANCE SHEETS
(In Thousands)
| |
December 31, | ||||||||
|---|---|---|---|---|---|---|---|---|---|
| |
2010 | 2009 | |||||||
ASSETS |
|||||||||
Current assets: |
|||||||||
Cash and cash equivalents |
$ | 42,851 | $ | 10,176 | |||||
Restricted cash |
2,455 | 121,837 | |||||||
Accounts receivable, net |
165,323 | 143,944 | |||||||
Deferred costs |
22,766 | 14,364 | |||||||
Prepaid expenses |
12,722 | 6,828 | |||||||
Other current assets |
6,568 | 3,660 | |||||||
Total current assets |
252,685 | 300,809 | |||||||
Property and equipment, net |
266,404 | 187,833 | |||||||
Restricted cash to be used for PGS Onshore acquisition |
— | 183,920 | |||||||
Goodwill |
131,299 | 73,414 | |||||||
Multi-client data library, net |
53,212 | 6,602 | |||||||
Deferred financing costs, net |
11,794 | 10,819 | |||||||
Other assets, net |
9,770 | 8,293 | |||||||
Total assets |
$ | 725,164 | $ | 771,690 | |||||
LIABILITIES, MEZZANINE AND STOCKHOLDERS' EQUITY |
|||||||||
Current liabilities: |
|||||||||
Short-term debt and current portion of long-term debt and capital lease obligations |
$ | 1,634 | $ | 68,256 | |||||
Accounts payable |
65,417 | 55,390 | |||||||
Accrued liabilities |
75,694 | 61,814 | |||||||
Deferred revenue |
49,537 | 14,081 | |||||||
Income taxes payable |
15,997 | 15,335 | |||||||
Total current liabilities |
208,279 | 214,876 | |||||||
Long-term debt and capital lease obligations, net of current portion |
319,284 | 296,601 | |||||||
Deferred income taxes |
16,169 | 6,486 | |||||||
Derivative liabilities |
38,271 | 9,317 | |||||||
Mandatorily redeemable preferred stock |
45,265 | 32,104 | |||||||
Other liabilities |
1,122 | — | |||||||
Total liabilities |
628,390 | 559,384 | |||||||
Commitments and contingencies |
|||||||||
Mezzanine equity: |
|||||||||
Preferred stock, Series B Senior Convertible, $10.00 par value; 2,500,000 shares authorized, 319,174 shares issued and outstanding as of December 31, 2010 and 290,197 shares issued and outstanding as of December 31, 2009 |
74,987 | 66,976 | |||||||
Stockholders' equity: |
|||||||||
Common stock, $.01 par value; 100,000,000 shares authorized, 18,118,290 shares issued and 17,804,459 shares outstanding as of December 31, 2010 and 15,578,528 shares issued and 15,296,839 shares outstanding as of December 31, 2009 |
179 | 156 | |||||||
Additional paid-in capital |
230,977 | 215,859 | |||||||
Accumulated deficit |
(209,389 | ) | (70,705 | ) | |||||
Accumulated other comprehensive Income |
20 | 20 | |||||||
Total stockholders' equity |
21,787 | 145,330 | |||||||
Total liabilities, mezzanine and stockholders' equity |
$ | 725,164 | $ | 771,690 | |||||
See accompanying notes to the consolidated financial statements.
F-3
GEOKINETICS INC. AND SUBSIDIARIES
CONSOLIDATED STATEMENTS OF OPERATIONS
(In Thousands, except per share amounts)
| |
Year Ended December 31, | ||||||||||
|---|---|---|---|---|---|---|---|---|---|---|---|
| |
2010 | 2009 | 2008 | ||||||||
Revenues |
|||||||||||
Seismic data acquisition |
$ | 549,116 | $ | 500,283 | $ | 462,576 | |||||
Data processing |
9,018 | 10,683 | 12,022 | ||||||||
Total revenue |
558,134 | 510,966 | 474,598 | ||||||||
Expenses: |
|||||||||||
Seismic data acquisition |
445,300 | 361,525 | 361,377 | ||||||||
Data processing |
8,893 | 8,641 | 8,861 | ||||||||
Depreciation and amortization |
112,897 | 56,921 | 48,990 | ||||||||
General and administrative |
81,190 | 53,791 | 39,341 | ||||||||
Total expenses |
648,280 | 480,878 | 458,569 | ||||||||
Loss on disposal of property and equipment |
(1,910 | ) | (3,759 | ) | (1,255 | ) | |||||
Gain on insurance claim |
— | — | 1,125 | ||||||||
Income (loss) from operations |
(92,056 | ) | 26,329 | 15,899 | |||||||
Other income (expenses): |
|||||||||||
Interest income |
1,767 | 242 | 815 | ||||||||
Interest expense |
(39,594 | ) | (6,213 | ) | (6,991 | ) | |||||
Loss from change in fair value of derivative liabilities |
(6,415 | ) | (7,324 | ) | — | ||||||
Bridge loan commitment fees |
— | (2,910 | ) | — | |||||||
Foreign exchange gain |
365 | 680 | 835 | ||||||||
Other, net |
2,059 | 113 | (304 | ) | |||||||
Total other expenses, net |
(41,818 | ) | (15,412 | ) | (5,645 | ) | |||||
Income (loss) before income taxes |
(133,874 | ) | 10,917 | 10,254 | |||||||
Provision for income taxes: |
|||||||||||
Current expense |
13,986 | 30,374 | 12,186 | ||||||||
Deferred benefit |
(9,176 | ) | (7,122 | ) | (2,918 | ) | |||||
Total provision for income taxes |
4,810 | 23,252 | 9,268 | ||||||||
Net income (loss) |
(138,684 | ) | (12,335 | ) | 986 | ||||||
Inducements paid to preferred stockholders |
— | (9,059 | ) | — | |||||||
Dividend and accretion costs |
(8,850 | ) | (12,731 | ) | (6,325 | ) | |||||
Loss applicable to common stockholders |
$ | (147,534 | ) | $ | (34,125 | ) | $ | (5,339 | ) | ||
For Basic and Diluted Shares: |
|||||||||||
Loss per common share |
$ | (8.46 | ) | $ | (3.14 | ) | $ | (0.51 | ) | ||
Weighted average common shares outstanding |
17,441,423 | 10,875,264 | 10,389,969 | ||||||||
See accompanying notes to the consolidated financial statements.
F-4
GEOKINETICS INC. AND SUBSIDIARIES
CONSOLIDATED STATEMENTS OF STOCKHOLDERS' EQUITY
AND OTHER COMPREHENSIVE INCOME
(In Thousands,
except share amounts)
| |
Common Shares Issued |
Common Stock |
Additional Paid-In Capital |
Accumulated Deficit |
Accumulated Other Comprehensive Income (Loss) |
Total Stockholders' Equity |
|||||||||||||
|---|---|---|---|---|---|---|---|---|---|---|---|---|---|---|---|---|---|---|---|
Balance at December 31, 2007 |
10,471,944 | $ | 105 | $ | 191,212 | $ | (60,372 | ) | $ | 20 | $ | 130,965 | |||||||
Exercise of options |
84,863 | 1 | 577 | — | — | 578 | |||||||||||||
Stock-based compensation |
— | — | 1,934 | — | — | 1,934 | |||||||||||||
Restricted stock issued, net |
23,794 | — | — | — | — | — | |||||||||||||
Fair value of warrants issued |
— | — | 1,547 | — | — | 1,547 | |||||||||||||
Costs of issuance of common stock |
— | — | (5 | ) | — | — | (5 | ) | |||||||||||
Accretion of preferred issuance costs |
— | — | (184 | ) | — | — | (184 | ) | |||||||||||
Accrual of preferred dividend |
— | — | (6,141 | ) | — | — | (6,141 | ) | |||||||||||
Net income |
— | — | — | 986 | — | 986 | |||||||||||||
Balance at December 31, 2008 |
10,580,601 | $ | 106 | $ | 188,940 | $ | (59,386 | ) | $ | 20 | $ | 129,680 | |||||||
Cumulative effect of change in accounting principle |
— | — | (3,413 | ) | 10,075 | — | 6,662 | ||||||||||||
Stock-based compensation |
— | — | 2,174 | — | — | 2,174 | |||||||||||||
Restricted stock issued, net |
247,927 | 2 | — | — | — | 2 | |||||||||||||
Issuance of common stock, net of costs |
4,000,000 | 40 | 33,959 | — | — | 33,999 | |||||||||||||
Issuance of common stock and cash paid as inducement for conversion of preferred stock |
750,000 | 8 | 6,930 | (9,059 | ) | — | (2,121 | ) | |||||||||||
Accretion of preferred issuance costs and discounts |
— | — | (1,674 | ) | — | — | (1,674 | ) | |||||||||||
Accrual of preferred dividend |
— | — | (11,057 | ) | — | — | (11,057 | ) | |||||||||||
Net loss |
— | — | — | (12,335 | ) | — | (12,335 | ) | |||||||||||
Balance at December 31, 2009 |
15,578,528 | $ | 156 | $ | 215,859 | $ | (70,705 | ) | $ | 20 | $ | 145,330 | |||||||
Stock-based compensation |
— | — | 2,888 | — | — | 2,888 | |||||||||||||
Restricted stock issued, net |
178,946 | — | — | — | — | — | |||||||||||||
Accretion of preferred issuance costs and discounts |
— | — | (1,596 | ) | — | — | (1,596 | ) | |||||||||||
Accrual of preferred dividends |
— | — | (7,254 | ) | — | — | (7,254 | ) | |||||||||||
Issuance of common stock to underwriters under overallotment option |
207,200 | 2 | 1,804 | — | — | 1,806 | |||||||||||||
Issuance of common stock for PGS Onshore Acquisition |
2,153,616 | 21 | 19,404 | — | — | 19,425 | |||||||||||||
Cost of issuance of securities |
— | — | (128 | ) | — | — | (128 | ) | |||||||||||
Net loss |
— | — | — | (138,684 | ) | — | (138,684 | ) | |||||||||||
Balance at December 31, 2010 |
18,118,290 | $ | 179 | $ | 230,977 | $ | (209,389 | ) | $ | 20 | $ | 21,787 | |||||||
See accompanying notes to the consolidated financial statements.
F-5
GEOKINETICS INC. AND SUBSIDIARIES
CONSOLIDATED STATEMENTS OF CASH FLOWS
(In Thousands, unless otherwise noted)
| |
Year Ended December 31, | |||||||||||
|---|---|---|---|---|---|---|---|---|---|---|---|---|
| |
2010 | 2009 | 2008 | |||||||||
OPERATING ACTIVITIES |
||||||||||||
Net income (loss) |
$ | (138,684 | ) | $ | (12,335 | ) | $ | 986 | ||||
Adjustments to reconcile net income (loss) to net cash provided by operating activities: |
||||||||||||
Depreciation and amortization |
112,897 | 56,921 | 48,990 | |||||||||
Bad debt expense |
1,549 | 1,110 | 3,541 | |||||||||
Loss on prepayment of debt, amortization of deferred financing costs, and accretion of debt discount |
6,725 | 560 | 336 | |||||||||
Stock-based compensation |
2,888 | 2,174 | 1,934 | |||||||||
Loss on sale of assets and insurance claims |
1,910 | 3,759 | 130 | |||||||||
Deferred income taxes |
(9,176 | ) | (7,122 | ) | (2,918 | ) | ||||||
Change in fair value of derivative liabilities |
6,415 | 7,324 | — | |||||||||
Changes in operating assets and liabilities: |
||||||||||||
Restricted cash, net of financing portion |
(501 | ) | 7,967 | (8,563 | ) | |||||||
Accounts receivable |
40,915 | (53,301 | ) | (27,476 | ) | |||||||
Prepaid expenses and other assets |
(978 | ) | (808 | ) | (3,476 | ) | ||||||
Deferred costs |
(8,402 | ) | 11,008 | (20,512 | ) | |||||||
Accounts payable |
(7,697 | ) | 6,334 | 29,677 | ||||||||
Deferred revenues |
35,456 | 2 | (4,010 | ) | ||||||||
Accrued liabilities and other liabilities |
(11,781 | ) | 29,666 | 18,958 | ||||||||
Net cash provided by operating activities |
31,536 | 53,259 | 37,597 | |||||||||
INVESTING ACTIVITIES |
||||||||||||
Investment in multi-client data library |
(51,035 | ) | (10,716 | ) | — | |||||||
Acquisition, net of cash acquired |
(180,832 | ) | — | — | ||||||||
Proceeds from disposal of property and equipment and insurance claims |
426 | 1,320 | 3,047 | |||||||||
Purchase of other assets |
(3,986 | ) | — | (6,101 | ) | |||||||
Purchases and acquisition of property and equipment |
(47,673 | ) | (35,816 | ) | (40,289 | ) | ||||||
Change in restricted cash |
303,803 | (303,803 | ) | — | ||||||||
Net cash provided by (used in) investing activities |
20,703 | (349,015 | ) | (43,343 | ) | |||||||
FINANCING ACTIVITIES |
||||||||||||
Proceeds from issuance of debt |
51,994 | 207,259 | 224,162 | |||||||||
Proceeds from issuance of mandatorily redeemable preferred stock |
30,000 | — | — | |||||||||
Proceeds from issuance of Senior Secured Notes, net of discount |
— | 294,279 | — | |||||||||
Cash inducement of preferred stock conversion |
— | (2,121 | ) | — | ||||||||
Proceeds from exercised stock options |
— | — | 593 | |||||||||
Proceeds from common stock issuance, net |
1,678 | 33,985 | — | |||||||||
Proceeds from preferred stock issuance |
— | — | 29,137 | |||||||||
Payments on capital lease obligations and vendor financing |
(25,025 | ) | (25,889 | ) | (29,192 | ) | ||||||
Payments on debt |
(73,641 | ) | (204,737 | ) | (220,423 | ) | ||||||
Payments of debt issuance costs |
(4,570 | ) | (10,185 | ) | (315 | ) | ||||||
Net cash provided by (used in) financing activities |
(19,564 | ) | 292,591 | 3,962 | ||||||||
Net increase (decrease) in cash |
32,675 | (3,165 | ) | (1,784 | ) | |||||||
Cash at the beginning of period |
10,176 | 13,341 | 15,125 | |||||||||
Cash at the end of period |
$ | 42,851 | $ | 10,176 | $ | 13,341 | ||||||
Supplemental disclosures of cash flow information (in thousands): |
||||||||||||
Cash disclosures: |
||||||||||||
Interest paid |
$ | 31,356 | $ | 10,728 | $ | 6,769 | ||||||
Income taxes paid |
11,464 | 16,640 | 7,284 | |||||||||
Non-cash disclosures: |
||||||||||||
Capitalized depreciation to multi-client data library |
2,729 | 1,715 | — | |||||||||
Issuance of 750,000 common shares for inducement on preferred stock conversion |
— | 6,938 | — | |||||||||
Purchases of property and equipment under capital lease obligations and vendor financings, net of down payments |
— | 2,999 | 36,807 | |||||||||
See accompanying notes to the consolidated financial statements.
F-6
GEOKINETICS INC. AND SUBSIDIARIES
NOTES TO CONSOLIDATED FINANCIAL STATEMENTS
NOTE 1: Organization
Geokinetics Inc. (collectively with its subsidiaries, the "Company"), a Delaware corporation, founded in 1980, is based in Houston, Texas. The Company is a global provider of seismic data acquisition, processing and interpretation services, and a leader in providing land, marsh and swamp ("Transition Zone") and shallow water ocean bottom cable ("OBC") environment geophysical services. These geophysical services including acquisition of two-dimensional ("2D"), three-dimensional ("3D"), time-lapse four-dimensional ("4D") and multi-component seismic data surveys, data processing and interpretation services and other geophysical services for customers in the oil and natural gas industry, which include many national oil companies, major international oil companies and independent oil and gas exploration and production companies (collectively "E&P companies") in the United States, Canada, Latin America (including Mexico), Africa, the Middle East, Australia/New Zealand and the Far East. Seismic data is used by E&P companies to identify and analyze drilling prospects and maximize successful drilling. In addition, the Company performs a significant amount of work for seismic data library companies that acquire seismic data to license to other E&P companies. Also, the Company maintains its own extensive multi-client data library whereby the Company maintains full or partial ownership of data acquired; client access is provided via licensing agreements. The Company's multi-client data library consists of data covering various areas in the United States and Canada.
Recent Developments
During 2010, the Company received certain waivers of covenants in its revolving credit facility ("RBC credit facility" or "credit facility"). In connection with these waivers, the credit facility agreement was amended to reduce the maximum borrowings available from $50 to $40 million, less the amount of interest accrued and not paid from time to time on its senior secured notes due 2014. In addition, the Company is required to adhere to covenants in the credit facility measured monthly, as more fully described in Note 6 through the month ending December 31, 2011. The Company complied with these various financial covenants for the months ending January 31, 2011 and February 28, 2011. On April 1, 2011, Geokinetics Holdings USA Inc. entered into a waiver of specific events of default that would have occurred on March 31, 2011 for failure to comply with financial reporting covenant requirements. Additionally, the Company entered into Amendment No. 4 which modifies certain financial covenant requirements (minimum total leverage ratio and cumulative adjusted EBITDA) and the Company's interest cost. The Amendment also changes the maturity date of the revolving credit facility to April 15, 2012. While the Company believes it will remain in compliance with the revised covenants through December 31, 2011, actual results may differ from the forecasts, and may be affected by events beyond the Company's control.
On December 14, 2010, the Company closed a $30 million private placement of 120,000 shares of a new series of junior preferred stock (the "Series D Preferred Stock") and warrants (the "2010 Warrants") to purchase 3,495,000 shares of Geokinetics' common stock with affiliates of Avista Capital Partners ("Avista"), Levant America S.A. ("Levant"), Petroleum Geo-Services ASA ("PGS") and certain of its directors. The proceeds provided additional working capital for the Company's operations.
In order to ensure that the Company will have sufficient liquidity to finance the increased business activity, meet existing debt service requirements and finance its business, management has continued to work closely with the lenders under the credit facility, issued additional junior preferred equity securities and is exploring sales of non-core assets. In addition, the Company is enhancing review, approval and monitoring controls around its on-going and backlog contracts to improve efficiency and margin profitability and additional contract cost recoveries, and overall cash management.
F-7
GEOKINETICS INC. AND SUBSIDIARIES
NOTES TO CONSOLIDATED FINANCIAL STATEMENTS (Continued)
NOTE 1: Organization (Continued)
While management believes its 2011 forecasts are reasonable, and that the outcome of the aforementioned programs can be timely achieved, success is dependent on its future operations. Management believes that given its backlog, the increased business in the last few months and those items discussed above, that the Company has the ability to meet its liquidity needs for 2011.
NOTE 2: Basis of Presentation and Significant Accounting Policies
Principles of Consolidation, Basis of Accounting and Presentation
The consolidated financial statements include the accounts of Geokinetics Inc. and its wholly-owned subsidiaries. All significant intercompany transactions have been eliminated in consolidation. The consolidated financial statements of the Company have been prepared on the accrual basis of accounting in accordance with generally accepted accounting principles in the United States of America.
Certain reclassifications of previously reported information have been made to conform to the current year presentation.
Use of Estimates
Management uses estimates and assumptions in preparing consolidated financial statements. Those estimates and assumptions are included in the Company's consolidated financial statements and accompanying notes. The more significant areas requiring the use of management estimates relate to accounting for contracts in process, evaluating the outcome of uncertainties involving claims against or on behalf of the Company, determining useful lives for depreciation and amortization purposes, cash flow projections and fair values used in the determination of asset impairment. While management believes current estimates are reasonable and appropriate, actual results could differ materially from current estimates.
Revenue Recognition
The Company's services are provided under cancelable service contracts. Customer contracts for services vary in terms and conditions. Contracts are either "turnkey" or "term" agreements or a combination of the two. Under turnkey agreements or the turnkey portions thereof, the Company recognizes revenue based upon output measures as work is performed. This method requires that the Company recognize revenue based upon quantifiable measures of progress, such as square miles or linear kilometers acquired. With respect to those contracts where the customer pays separately for the mobilization of equipment, the Company recognizes such mobilization fees as revenue during the performance of the seismic data acquisition, using the same performance method as for the acquisition work. The Company also receives revenue for certain third party charges under the terms of the service contracts. The Company records amounts billed to customers in revenue as the gross amount including third party charges, if applicable, that are paid by the customer. The Company's turnkey or term contracts do not contain cancellation provisions, which would prevent the Company from being compensated for work performed prior to cancellation due to work not being met or work not being performed within a particular timeframe. In some instances, customers are billed in advance of work performed and the Company recognizes the liability as deferred revenue.
F-8
GEOKINETICS INC. AND SUBSIDIARIES
NOTES TO CONSOLIDATED FINANCIAL STATEMENTS (Continued)
NOTE 2: Basis of Presentation and Significant Accounting Policies (Continued)
The Company accounts for multi-client data sales as follows:
(a) Pre-funding arrangements—The Company obtains funding from customers before a seismic project is completed. In return for the pre-funding, the customer typically gains the ability to direct or influence the project specifications, to access data as it is being acquired and to pay discounted prices. The Company recognizes pre-funding revenue as the services are performed on a proportional performance basis usually determined by comparing the completed square miles of a seismic survey to the survey size unless specific facts and circumstances warrant another measure. Progress is measured in a manner generally consistent with the physical progress on the project, and revenue is recognized based on the ratio of the project's progress to date, provided that all other revenue recognition criteria are satisfied.
(b) Late sales—The Company grants a license to a customer, which entitles the customer to have access to a specifically defined portion of the multi-client data library. The customer's license payment is fixed and determinable and typically is required at the time that the license is granted. The Company recognizes revenue for late sales when the customer executes a valid license agreement and has received the underlying data or has the right to access the licensed portion of the data and collection is reasonably assured.
(c) Sales of data jointly owned by us and partner—We have jointly acquired surveys with a partner whereby we share the costs of acquisition and earn license revenues when processed data is delivered to the ultimate client. As such, these revenues are recognized when the processed data is delivered to the ultimate client.
Deferred revenue consists primarily of customer payments made in advance of work done, milestone billings and mobilization revenue amortized over the term of the related contract.
Cash and Cash Equivalents
For purposes of the consolidated statements of cash flows, the Company considers all highly liquid instruments purchased with a maturity of three months or less to be cash equivalents.
Restricted Cash
Total restricted cash consists of short-term investments, primarily certificates of deposit, carried at cost. In the normal course of business, and as of December 31, 2010, this amount is primarily cash collateral for letters of credit and performance guarantees.
Fair Value of Financial Instruments
Effective January 1, 2008, we adopted ASC Topic 820 as it relates to financial assets and financial liabilities, which defines fair value, establishes a framework for measuring fair value under generally accepted accounting principles and expands disclosures about fair value measurements. The provisions of this standard apply to other accounting pronouncements that require or permit fair value measurements.
This guidance defines fair value as the price that would be received to sell an asset or paid to transfer a liability in an orderly transaction between market participants at the measurement date.
F-9
GEOKINETICS INC. AND SUBSIDIARIES
NOTES TO CONSOLIDATED FINANCIAL STATEMENTS (Continued)
NOTE 2: Basis of Presentation and Significant Accounting Policies (Continued)
Hierarchical levels, as defined in this guidance and directly related to the amount of subjectivity associated with the inputs to fair valuations of these assets and liabilities are as follows:
Level 1—Unadjusted quoted prices in active markets that are accessible at the measurement date for identical, unrestricted assets or liabilities.
Level 2—Inputs other than quoted prices included within Level 1 that are observable for the asset or liability, either directly or indirectly, including quoted prices for similar assets or liabilities in active markets; quoted prices for identical or similar assets or liabilities in markets that are not active; inputs other than quoted prices that are observable for the asset or liability (e.g., interest rates); and inputs that are derived principally from or corroborated by observable market data by correlation or other means.
Level 3—Inputs that are both significant to the fair value measurement and unobservable. Unobservable inputs reflect the Company's judgment about assumptions market participants would use in pricing the asset or liability estimated impact to quoted market prices.
Accounts Receivable and Allowance for Doubtful Accounts
Accounts receivable are recorded at cost, less the related allowance for doubtful accounts. Such credit losses have historically been within expectations and the provisions established by the Company. The cyclical nature of the Company's industry may affect the Company's customers' operating performance and cash flows, which could impact the Company's ability to collect on these obligations. Additionally, some of the Company's customers are located in certain international areas that are inherently subject to economic, political and civil risks, which may impact the Company's ability to collect receivables. The Company reviews accounts receivable on a quarterly basis to determine the reasonableness of the allowance.
Property and Equipment
Property and equipment is recorded at cost. Property and equipment acquired in a business combination is recorded at fair value at the date of acquisition. Costs related to the development of internal use software and software developed for license for our customers are capitalized and amortized over the estimated useful life of the software. Depreciation and amortization are provided using the straight-line method over the estimated useful lives of the respective assets or the lesser of the lease term, as applicable. Repairs and maintenance, which are not considered betterments and do not extend the useful life of property, are charged to expense as incurred. When property and equipment are retired or otherwise disposed of, the asset and accumulated depreciation or amortization are removed from the accounts and the resulting gain or loss is reflected in operations.
Long-Lived Assets including Goodwill and Other Acquired Intangible Assets
The Company reviews long-lived assets for impairment whenever events or changes in circumstances indicate the carrying amount of an asset may not be recoverable. Recoverability is measured by a comparison of the carrying amount of an asset to future net cash flows expected to be generated by the asset. If such assets are considered to be impaired, the impairment recognized is measured by the amount by which the carrying amount of the assets exceeds either the fair value or the
F-10
GEOKINETICS INC. AND SUBSIDIARIES
NOTES TO CONSOLIDATED FINANCIAL STATEMENTS (Continued)
NOTE 2: Basis of Presentation and Significant Accounting Policies (Continued)
estimated discounted cash flows of the assets, whichever is more readily measurable. At December 31, 2010 and 2009, management deemed no such assets were impaired.
Goodwill represents the excess of the purchase price over the estimated fair value of the assets acquired net of the fair value of liabilities assumed. Overall accounting for Goodwill (Accounting Standards Codification "ASC" Topic 350-20-35) requires intangible assets with indefinite lives, including goodwill, be evaluated on an annual basis for impairment or more frequently if an event occurs or circumstances change which could potentially result in an impairment.
The impairment test requires the allocation of goodwill and all other assets and liabilities to reporting units. If the fair value of the reporting unit is less than the book value (including goodwill), then goodwill is reduced to its implied fair value and the amount of any write-down is reflected in operations. All of the Company's goodwill is related to its data acquisition segment. While this segment consists of various geographical markets, the Company has concluded that it has only one reporting unit for purposes of the impairment test. The Company performs impairment tests on the carrying value of its goodwill on an annual basis as of December 31. Historically, the Company has used the Income Approach or the Discounted Cash Flow Method, each of which focuses on expected cash flows. In applying this approach, the expected cash flow is projected based on assumptions regarding revenues, direct costs, general and administrative expenses, depreciation, applicable income taxes, capital expenditures and working capital requirements for a finite period of years, which was five years in the Company's test. The projected cash flows and the terminal value, which is an estimate of the value at the end of the finite period and assumes a long-term growth rate, are then discounted to present value to derive an indication of the value of the reporting unit. For the Company's annual assessment as of December 31, 2010, due to the economic conditions affecting the industry, the Company also utilized the Subject Company Valuation Method, which makes a comparison of the Company's projections to reasonably similar publicly traded companies. In weighting the results of the various valuation approaches, the Company placed more emphasis on the Income Approach. At December 31, 2010 and 2009, the Company's annual impairment test indicated the fair value of its reporting unit's goodwill exceeded the carrying amount.
Multi-Client Data Library
The multi-client data library consists of seismic surveys that are licensed to customers on a non-exclusive basis. The Company capitalizes all costs directly associated with acquiring and processing the data, including the depreciation of the assets used in production of the surveys. The capitalized cost of the multi-client data is charged to depreciation and amortization in the period the sales occur based on the greater of the percentage of total estimated costs to the total estimated sales multiplied by actual sales, known as the sales forecast method, or the straight-line amortization method over five years. This minimum straight-line amortization is recorded only if minimum amortization exceeds the cost of services calculated using the sales forecast method.
The Company periodically reviews the carrying value of the multi-client data library. If during any such review, the company determines that the future revenue for a multi-client survey is expected to be more or less than the original estimate of total revenue, the company decreases or increases (as the case may be) the amortization rate attributable to the future revenue from the multi-client survey. Furthermore, in connection with the review, the Company evaluates the recoverability of the multi-client data library, and if required under ASC 360 "Accounting for the Impairment and Disposal of
F-11
GEOKINETICS INC. AND SUBSIDIARIES
NOTES TO CONSOLIDATED FINANCIAL STATEMENTS (Continued)
NOTE 2: Basis of Presentation and Significant Accounting Policies (Continued)
Long-Lived Assets," records an impairment charge with respect to the multi-client survey. There were no impairment charges required for 2010 and 2009.
Other Assets
Certain investments accounted for under the cost method are included in other assets. They are recorded at cost and reviewed periodically if there are events or changes in circumstances that may have a significant adverse effect on the fair value of the investments.
Income Taxes
The Company accounts for income taxes in accordance with ASC Topic 740. Under this method, deferred tax assets and liabilities are computed using the liability method based on the differences between the financial statement and tax basis of assets and liabilities using enacted tax rates in effect for the year in which the differences are expected to reverse.
A valuation allowance is provided, if necessary, to reserve the amount of net operating loss and tax credit carryforwards which the Company may not be able to use as a result of the expiration of maximum carryover periods allowed under applicable tax codes.
The Company applies a more likely than not threshold to the recognition and de-recognition of uncertain tax positions. The Company recognizes the amount of unrecognized tax benefit that has a greater than 50 percent likelihood of being ultimately realized upon settlement. A change in judgment related to the expected ultimate resolution of uncertain tax positions is recognized in earnings in the quarter of such changes.
Derivative Liabilities
The Company has convertible preferred stock issued and outstanding and common stock warrants issued in connection with preferred stock issuances. Both the convertible preferred stock conversion feature and warrants contain price protection provisions (or down-round provisions) which reduces their price in the event the Company issues additional shares at a more favorable price than the strike price.
The Financial Accounting Standard Board ("FASB") accounting and reporting standards for derivative instruments, including certain derivative instruments embedded in other contracts is included in ASC 815-40-15 "Derivatives and Hedging—Contracts in Entity's Own Equity—Scope and Scope Exceptions". This standard provides that an instrument's strike price or the number of shares used to calculate the settlement amount are not fixed if its terms provide for any potential adjustment, regardless of the probability of such adjustment(s) or whether such adjustments are in the entity's control. If an equity-linked financial instrument (or embedded feature) is indexed to its own stock, based on the instrument's contingent exercise and settlement provisions, for periods ended after the adoption date of January 1, 2009, the fair value of the conversion feature is bifurcated from the host instrument and recognized as a liability on the Company's consolidated balance sheet. The warrants are recognized at fair value as a liability on the Company's consolidated balance sheet. The fair value of the conversion feature, the warrants and other issuance costs of the preferred stock financing transaction, are recognized as a discount to the preferred stock host. The discount will be accreted to
F-12
GEOKINETICS INC. AND SUBSIDIARIES
NOTES TO CONSOLIDATED FINANCIAL STATEMENTS (Continued)
NOTE 2: Basis of Presentation and Significant Accounting Policies (Continued)
the preferred stock host from the Company's paid in capital, treated as a deemed dividend, over the period from the issuance date through the earliest redemption date of the preferred stock.
Foreign Exchange Gains and Losses
The Company's operations around the world are largely financed in U.S. dollars and there are significant intra-entity transactions between its international operations and the parent entity, and accordingly, these subsidiaries utilize the U.S. dollar as their functional currency. In accordance with FASB ASC Topic 830, Foreign Currency Matters, those foreign entities translate property and equipment (and related depreciation) and inventories into U.S. dollars at the exchange rate in effect at the time of their acquisition, while other assets and liabilities are translated at year-end rates. Operating results (other than depreciation) are translated at the average rates of exchange prevailing during the year. Transaction gains and losses are included in the determination of net income (loss) and are reflected in "Other income (expenses)" in the accompanying consolidated statements of operations.
Effective January 1, 2008, the functional currency of the Company's UK subsidiary was changed from the UK sterling to the U.S. dollar. Accumulated Other Comprehensive Income (Loss) reported in the consolidated statements of stockholder's equity (deficit) and other comprehensive income (loss) before January 1, 2008, totaled approximately ($20,000) of cumulative foreign currency translation adjustment related to the UK subsidiary prior to changing the functional currency.
The foreign exchange gain was $0.4 million, $0.7 million and $0.8 million for the years ended December 31, 2010, 2009 and 2008, respectively.
Stock-Based Compensation
The Company accounts for stock-based compensation by recognizing all share-based payments to employees, including grants of employee stock options, in the financial statements based on their grant date fair values. Compensation cost for awards granted prior to, but not vested, as of January 1, 2006, would be based on the grant date attributes originally used to value those awards for pro forma purposes. The Company uses the modified prospective transition method, utilizing the Black-Scholes option pricing model for the calculation of the fair value of employee stock options. Under the modified prospective method, the Company would record compensation cost related to unvested stock awards at December 31, 2005, by recognizing the unamortized grant date fair value of these awards over the remaining vesting periods of those awards with no change in historical reported earnings.
As the Company has not declared dividends on its common stock since it became a public entity, no dividend yield was used. The expected life of the options granted is a weighted average term of 6 years for 2010.
Recent Accounting Pronouncements
In October 2009, the FASB issued an update to ASC 605, Revenue Recognition. This ASU addresses the accounting for multiple deliverables contained in a single sales arrangement. The Company adopted this new guidance on January 1, 2011. Accordingly, the Company applies this guidance to transactions initiated or materially modified on or after January 1, 2011. The Company is currently evaluating the impact of the adoption of this guidance on its consolidated financial statements.
F-13
GEOKINETICS INC. AND SUBSIDIARIES
NOTES TO CONSOLIDATED FINANCIAL STATEMENTS (Continued)
NOTE 2: Basis of Presentation and Significant Accounting Policies (Continued)
In January 2010, the FASB issued new accounting guidance to require additional fair value related disclosures including transfers into and out of Levels 1 and 2 and separate disclosures about purchases, sales, issuances, and settlements relating to Level 3 measurements. It also clarifies existing fair value disclosure guidance about the level of disaggregation and about inputs and valuation techniques. This new guidance is effective for the first reporting period beginning after December 15, 2009 except for the requirement to separately disclose purchases, sales, issuances and settlements relating to Level 3 measurements, which is effective for the first reporting period beginning after December 15, 2010. The Company's adoption of this new guidance did not have a material impact on its financial position, results of operations or cash flows. The Company has included additional disclosure related to early adoption of the Level 3 related gross disclosure requirement, which is effective in 2011; disclosures had no impact on the consolidated financial statements.
In December 2010, the FASB issued an update to ASC 805, Business Combinations. This ASU addresses the disclosure of comparative financial statements and expands on the supplementary pro forma information for business combinations. We will adopt this ASU prospectively for business combinations occurring on or after December 15, 2010.
NOTE 3: Acquisition
On December 3, 2009, the Company agreed with Petroleum Geo-Services ASA and certain of its subsidiaries ("PGS") to acquire PGS's worldwide onshore seismic data acquisition and multi-client library business ("PGS Onshore"). The Company closed this transaction on February 12, 2010 (the "Acquisition Date") for a cash and stock consideration valued at $202.8 million. The purchase price is subject to certain additional working capital adjustments after closing. The PGS Onshore acquisition (the "Acquisition") provides the Company a significant business expansion of its Data Acquisition segment into Mexico, North Africa, the Far East, and in the United States, including Alaska. In addition, the Acquisition substantially increased the Company's multi-client data library with new data covering approximately 5,500 square miles of 3D data located primarily in Texas, Oklahoma, Wyoming and Alaska.
The operations of PGS Onshore have been combined with those of the Company since February 12, 2010. Disclosure of earnings of PGS Onshore since the Acquisition is not practicable as it is not being operated as a standalone subsidiary.
The Acquisition Date fair value of the total consideration transferred consisted of the following (in thousands):
Purchase price: |
||||
Cash |
$ | 183,411 | ||
Issuance of 2,153,616 shares of the Company's common stock at market value of $9.02 per share |
19,426 | |||
Total consideration |
$ | 202,837 | ||
F-14
GEOKINETICS INC. AND SUBSIDIARIES
NOTES TO CONSOLIDATED FINANCIAL STATEMENTS (Continued)
NOTE 3: Acquisition (Continued)
The following table summarizes the estimated fair values of the assets acquired and liabilities assumed at the acquisition date (in thousands):
Cash |
$ | 2,579 | |||||
Accounts receivable |
63,843 | ||||||
Prepaid expenses and other current assets |
7,487 | ||||||
Current assets |
73,909 | ||||||
Property and equipment |
104,100 | ||||||
Multi-client data library |
26,700 | ||||||
Other intangible assets |
6,200 | ||||||
Other long-term assets |
1,429 | ||||||
Goodwill |
57,885 | ||||||
Total assets acquired |
270,223 | ||||||
Current liabilities |
47,404 | ||||||
Other long-term liabilities |
1,122 | ||||||
Deferred income taxes |
18,860 | ||||||
Total liabilities assumed |
$ | 67,386 | |||||
Net assets acquired |
$ | 202,837 | |||||
The Acquisition was accounted for by the purchase method, with the purchase price being allocated to the fair value of assets purchased and liabilities assumed.
The allocation of the purchase price included multi-client data library, which consisted of data surveys covering portions of the United States and Canada. Other intangible assets consisted of order backlog and a marine vibrator patented technology license. The fair value for the multi-client data library and other intangibles were estimated using an income approach. Under this method, an intangible asset's fair value is equal to the present value of the incremental after-tax cash flows (excess earnings) attributable solely to the intangible asset over its remaining useful life. To calculate fair value, the Company used probability-weighted cash flows discounted at rates considered appropriate given the inherent risks associated with each type of asset. The Company believes that the level and timing of cash flows appropriately reflect market participant assumptions.
The valuation of the intangible assets acquired and related amortization periods are as follows (in thousands):
| |
Estimated Useful Life |
|
|||||
|---|---|---|---|---|---|---|---|
Order backlog |
2 years | $ | 5,700 | ||||
License agreement |
10 years | 500 | |||||
Total other intangible assets |
$ | 6,200 | |||||
The Company provided deferred taxes and other tax liabilities as part of the acquisition accounting related to the fair market value adjustments for acquired Multi-client data library, property and equipment, intangible assets, and other deferred items as well as for uncertain tax positions taken in
F-15
GEOKINETICS INC. AND SUBSIDIARIES
NOTES TO CONSOLIDATED FINANCIAL STATEMENTS (Continued)
NOTE 3: Acquisition (Continued)
prior year tax returns. An adjustment of $18.9 million was recorded to present the deferred taxes and other tax liabilities at fair value at the purchase date. As part of the purchase agreement, PGS has retained the liability for taxes related to prior years and up to the purchase date and agreed to indemnify the Company for taxes imposed. Accordingly, we have included compensating amounts in receivable only for amounts known as of the purchase date. Should other items become known at a later date related to these prior periods, we would set up a receivable at that time to cover any taxes that could arise.
Goodwill of approximately $57.9 million was recognized for this acquisition and is calculated as the excess of the consideration transferred over the net assets recognized and represents the future economic benefits arising from other assets acquired that could not be individually identified and separately recognized. It specifically includes the expected synergies and other benefits that we believe will result from combining the operations of PGS Onshore with the operations of Geokinetics. The Company allocated the goodwill to the seismic data acquisition business segment in recognition of the estimated present value of the future synergies paid for in this transaction that will directly benefit that segment. Approximately $26.1 million of goodwill is included in the North America reporting unit and $31.8 million was included in the international reporting unit. The entire amount of goodwill of $57.9 million is not deductible for tax purposes.
Costs associated with the Acquisition of approximately $5.2 million and $1.3 million for the years ended December 31, 2010 and 2009, respectively, are included in general and administrative expenses.
The following summarized unaudited pro forma consolidated income statement information for the years ended December 31, 2010 and 2009, assumes that the PGS Onshore acquisition had occurred as of the beginning of the periods presented. The Company has prepared these unaudited pro forma financial results for comparative purposes only. These unaudited pro forma financial results may not be indicative of the results that would have occurred if Geokinetics had completed the acquisition as of the beginning of the periods presented or the results that may be attained in the future. Amounts presented below are in thousands, except for the per share amounts:
| |
Pro forma for the years ended December 31, (Unaudited) |
||||||
|---|---|---|---|---|---|---|---|
| |
2010 | 2009 | |||||
Revenues |
$ | 578,757 | $ | 711,028 | |||
Income (loss) from operations |
$ | (97,292 | ) | $ | 1,590 | ||
Net loss |
$ | (145,905 | ) | $ | (78,052 | ) | |
Dividends and accretion on preferred stock |
$ | (8,850 | ) | $ | (20,379 | ) | |
Net loss applicable to common stockholders |
$ | (154,755 | ) | $ | (98,431 | ) | |
Basic and diluted net loss per common share |
$ | (8.87 | ) | $ | (5.57 | ) | |
NOTE 4: Assets
Restricted Cash
As of December 31, 2010, restricted cash is approximately $2.5 million. As of December 31, 2009, the balance in restricted cash of approximately $303.8 million was deposited into restricted accounts,
F-16
GEOKINETICS INC. AND SUBSIDIARIES
NOTES TO CONSOLIDATED FINANCIAL STATEMENTS (Continued)
NOTE 4: Assets (Continued)
pending completion of the acquisition of PGS Onshore, as required by the Company's senior secured notes due 2014. The Acquisition was completed in February 2010 resulting in a material decrease in restricted cash as of December 31, 2010. The current portion of restricted cash at December 31, 2009, included restricted cash held to collateralize standby letters of credit and performance guarantees for approximately $1.9 million, and escrow deposits to be released upon the consummation of the acquisition of PGS Onshore. The escrow deposits were used to repay the Company's existing revolving credit facility ($44.7 million), substantially all of its capital lease obligations ($12.1 million), vendor financing ($9.9 million), and the remainder ($53.2 million) was used for working capital purposes.
Accounts Receivable
A summary of accounts receivable is as follows (in thousands):
| |
December 31, | ||||||
|---|---|---|---|---|---|---|---|
| |
2010 | 2009 | |||||
Trade |
$ | 103,778 | $ | 100,939 | |||
Unbilled |
48,297 | 33,330 | |||||
Other |
15,767 | 10,842 | |||||
Total accounts receivable |
167,842 | 145,111 | |||||
Less allowance for doubtful accounts |
(2,519 | ) | (1,167 | ) | |||
|
$ | 165,323 | $ | 143,944 | |||
The activity in the allowance for doubtful accounts is as follows (in thousands):
| |
Year Ended December 31, | |||||||||
|---|---|---|---|---|---|---|---|---|---|---|
| |
2010 | 2009 | 2008 | |||||||
Balance at beginning of period |
$ | 1,167 | $ | 3,944 | $ | 1,271 | ||||
Bad debt expense |
1,549 | 1,110 | 3,541 | |||||||
Write-offs, net of recoveries |
(197 | ) | (3,887 | ) | (868 | ) | ||||
Balance at the end of the period |
2,519 | 1,167 | 3,944 | |||||||
F-17
GEOKINETICS INC. AND SUBSIDIARIES
NOTES TO CONSOLIDATED FINANCIAL STATEMENTS (Continued)
NOTE 4: Assets (Continued)
Property and Equipment, net
Property and equipment is comprised of the following (in thousands):
| |
|
December 31, | |||||||
|---|---|---|---|---|---|---|---|---|---|
| |
Estimated Useful Life |
||||||||
| |
2010 | 2009 | |||||||
Field operating equipment |
3-10 years | $ | 311,187 | $ | 209,069 | ||||
Vehicles |
3-10 years | 66,709 | 31,090 | ||||||
Buildings and improvements |
6-39 years | 14,819 | 7,514 | ||||||
Software |
3-5 years | 25,561 | 20,209 | ||||||
Data processing equipment |
3-5 years | 10,136 | 7,819 | ||||||
Furniture and equipment |
3-5 years | 3,253 | 2,428 | ||||||
|
431,665 | 278,129 | |||||||
Less: accumulated depreciation and amortization |
(176,549 | ) | (108,497 | ) | |||||
|
255,116 | 169,632 | |||||||
Operating equipment and vehicles in-transit or under construction |
11,288 | 18,201 | |||||||
|
$ | 266,404 | $ | 187,833 | |||||
The Company reviews the useful life and residual values of property and equipment on an ongoing basis considering the effect of events or changes in circumstances.
Depreciation expense was $68.8 million, $49.5million, and $45.9 million for the years ended December 31, 2010, 2009, and 2008, respectively.
The Company capitalizes interest cost incurred on funds used to construct property and equipment. The capitalized interest is recorded as part of the asset to which it relates and is amortized over the asset's estimated useful life. Interest cost capitalized was $1.1 million in 2010. The Company did not capitalized interest in previous years.
Goodwill
The changes in the carrying amounts of goodwill were as follows (in thousands):
Balance at December 31, 2009 |
$ | 73,414 | ||
Acquisition of PGS Onshore (Note 3) |
57,885 | |||
Balance at December 31, 2010 |
$ | 131,299 | ||
F-18
GEOKINETICS INC. AND SUBSIDIARIES
NOTES TO CONSOLIDATED FINANCIAL STATEMENTS (Continued)
NOTE 4: Assets (Continued)
Multi-Client Data Library, net
At December 31, 2010 and 2009, multi-client seismic library costs and accumulated amortization consisted of the following (in thousands):
| |
December 31, | ||||||
|---|---|---|---|---|---|---|---|
| |
2010 | 2009 | |||||
Acquisition and processing costs |
$ | 99,450 | $ | 14,841 | |||
Less accumulated amortization |
(46,238 | ) | (8,239 | ) | |||
Multi-client data library, net |
$ | 53,212 | $ | 6,602 | |||
Amortization expense for the years ended December 31, 2010, 2009 and 2008, was $38.0 million, $6.6 million and $0.5 million, respectively.
Deferred Financing Costs, net
The Company had deferred financing costs of $11.8 million and $10.8 million as of December 31, 2010 and 2009, respectively.
During 2010, 2009, and 2008, the Company amortized approximately $2.8 million, $0.6 million and $0.4 million of deferred financing costs. Amounts written off upon early extinguishment of debt totaling approximately $0.8 million are included in other income (expense) for the year ended December 31, 2010.
Other Assets, net
At December 31, 2010 and 2009, other assets, net consisted of the following (in thousands):
| |
December 31, | |||||||||||||||||||
|---|---|---|---|---|---|---|---|---|---|---|---|---|---|---|---|---|---|---|---|---|
| |
2010 | 2009 | ||||||||||||||||||
| |
Gross Carrying Value |
Accumulated Amortization |
Total Net Book Value |
Gross Carrying Value |
Accumulated Amortization |
Total Net Book Value |
||||||||||||||
Intangible assets: |
||||||||||||||||||||
Customer lists(1) |
$ | 3,609 | $ | (3,276 | ) | $ | 333 | $ | 3,609 | $ | (2,574 | ) | $ | 1,035 | ||||||
Order backlog(2) |
5,700 | (2,629 | ) | 3,071 | — | — | — | |||||||||||||
License agreement(2) |
500 | (44 | ) | 456 | — | — | — | |||||||||||||
Total other intangible assets |
$ | 9,809 | $ | (5,949 | ) | $ | 3,860 | $ | 3,609 | $ | (2,574 | ) | $ | 1,035 | ||||||
Other: |
||||||||||||||||||||
Cost method investments and other |
4,788 | 7,258 | ||||||||||||||||||
Indemnification receivable from PGS |
1,122 | — | ||||||||||||||||||
Total other |
5,910 | 7,258 | ||||||||||||||||||
Total other assets, net |
$ | 9,770 | $ | 8,293 | ||||||||||||||||
- (1)
- Customer lists were acquired in the acquisitions of Trace Energy Services, Ltd. ("Trace") in December 2005 and Grant Geophysical, Inc ("Grant") in September 2006. Trace's customer list was originally valued at $1.2 million with a fully depreciated net book value as of December 31,
F-19
GEOKINETICS INC. AND SUBSIDIARIES
NOTES TO CONSOLIDATED FINANCIAL STATEMENTS (Continued)
NOTE 4: Assets (Continued)
2010 and $0.2 net book value as of December 31, 2009. Grant's customer list was originally valued at $2.4 million with net book value of $0.3 million as of December 31, 2010 and $0.8 million as of December 31, 2009. The remaining balance will be fully amortized in 2011. Amortization expense for customer lists was $0.7 million and $0.5 million for the years ended December 31, 2010 and 2009, respectively.
- (2)
- Order backlog and license agreement were acquired though the acquisition of PGS Onshore. The scheduled amortization for these assets is $3.1 million in 2011, and $0.1 million in 2012 and each year thereafter through 2015. Amortization expense for order backlog and license agreement was $2.7 million for the year ended December 31, 2010.
NOTE 5: Accrued Liabilities
Accrued liabilities include the following (in thousands):
| |
December 31, | ||||||
|---|---|---|---|---|---|---|---|
| |
2010 | 2009 | |||||
Accrued operating expenses |
$ | 24,433 | $ | 25,065 | |||
Accrued payroll, bonuses and employee benefits |
22,599 | 22,751 | |||||
Taxes payable, other than income |
12,610 | 10,737 | |||||
Accrued interest payable |
1,381 | 909 | |||||
Preferred dividends |
346 | 347 | |||||
Customer deposits |
14,036 | 11 | |||||
Other |
289 | 1,994 | |||||
|
$ | 75,694 | $ | 61,814 | |||
NOTE 6: Debt and Capital Lease Obligations
Long-term debt and capital lease obligations were as follows (in thousands):
| |
December 31, | ||||||
|---|---|---|---|---|---|---|---|
| |
2010 | 2009 | |||||
Revolving credit facilities—4.75% to 8.75% |
$ | 23,000 | $ | 45,883 | |||
Senior Secured Notes, net of discount—9.75% |
295,471 | 294,279 | |||||
Capital lease obligations—15.6% |
1,696 | 14,836 | |||||
Notes payable from vendor financing arrangements—7% to 13.06% |
751 | 9,859 | |||||
|
320,918 | 364,857 | |||||
Less: current portion |
(1,634 | ) | (68,256 | ) | |||
|
$ | 319,284 | $ | 296,601 | |||
Revolving Credit Facility
On February 12, 2010, Geokinetics Holdings USA, Inc., a wholly-owned subsidiary of the Company ("Holdings"), entered into a $50 million revolving credit and letters of credit facility, with a group of lenders lead by RBC (the "RBC Facility" or the "revolving credit facility"). The revolving credit facility initially matured on February 12, 2013. On three occasions in 2010, the Company amended the
F-20
GEOKINETICS INC. AND SUBSIDIARIES
NOTES TO CONSOLIDATED FINANCIAL STATEMENTS (Continued)
NOTE 6: Debt and Capital Lease Obligations (Continued)
revolving credit facility to waive covenants we would have been unable to comply with without such waivers during each of the second, third, and fourth quarters of 2010. On April 1, 2011, the maturity date was changed to April 15, 2012. See below.
At December 31, 2010, the permitted outstanding borrowing amount under the revolver may not exceed the lesser of $40 million less the senior notes interest reserve (unless the proceeds of such borrowings are to be used to pay such senior notes interest when due) and the borrowing base. As a result of the amendments to the revolving credit facility during 2010, the borrowing base is based on a formula reflecting the value assigned by the lenders to our eligible accounts receivable and fixed assets (primarily equipment).
Borrowings outstanding under the revolving credit facility bear interest at a floating rate based on the greater of: (i) 3% per year, (ii) the Prime Rate, (iii) 0.5% above the Federal Funds Rate, or iv) 1% above one month LIBOR; plus an applicable margin from 4.5% to 6.5% depending on the Company's total leverage ratio. At December 31, 2010 and through March 2011, the rate is 8.75%. The outstanding balance of this revolving credit facility was $23 million as of December 31, 2010 and $33.0 million as of February 28, 2011.
Borrowings under the revolving credit facility are guaranteed by Geokinetics and each of its existing and subsequently acquired or organized direct or indirect wholly-owned U.S. subsidiaries. Each of the entities guaranteeing the revolving credit facility will secure the guarantees on a first priority basis with a lien on substantially all of the assets of such guarantor. Borrowings under the facility are effectively senior to the outstanding senior secured notes with respect to the proceeds of any collateral securing both the revolving credit facility and such notes pursuant to an inter-creditor agreement. The facility also contains restrictions on liens, investments, indebtedness, mergers and acquisitions, dispositions, certain payments, and other specific transactions.
Debt covenants include monthly maximum total leverage ratio based on the latest twelve months adjusted Earnings Before Interest, Taxes, Depreciation and Amortization (EBITDA) and a monthly minimum interest coverage ratio based on cumulative adjusted EBITDA from October 2010 thru August 2011 and certain additional measurement periods thereafter. The Company must adhere to a monthly liquidity test, monthly senior notes interest reserve and monthly cumulative adjusted EBITDA targets based on October 2010 thru August 2011 and the latest twelve months thereafter, commencing with the month ending January 31, 2011 through the month ending December 31, 2011. Furthermore, capital expenditures for the fiscal year 2011 may not exceed $40 million plus approved multi-client data library investments for 2011 which are prefunded. The Company was in compliance with such covenants as of February 28, 2011. On April 1, 2011, Holdings entered into a waiver of specific events of default that would have occurred on March 31, 2011 for failure to comply with financial reporting covenant requirements. Additionally, the Company entered into Amendment No. 4 which modifies certain financial covenant requirements (minimum total leverage ratio and cumulative adjusted EBITDA) and the Company's interest cost. The Amendment also changes the maturity date of the revolving credit facility to April 15, 2012. While the Company believes it will remain in compliance with the revised covenants through December 31, 2011, actual results may differ from the forecasts, and may be affected by events beyond the Company's control.
F-21
GEOKINETICS INC. AND SUBSIDIARIES
NOTES TO CONSOLIDATED FINANCIAL STATEMENTS (Continued)
NOTE 6: Debt and Capital Lease Obligations (Continued)
Senior Secured Notes Due 2014
On December 23, 2009, Geokinetics Holdings issued $300 million of 9.75% Senior Secured Notes due 2014 (the "Notes") in a private placement to institutional buyers at an issue price of $294.3 million or 98.093% of the principal amount. The discount is being accreted as an increase to interest expense over the term of the Notes. At December 31, 2010 and 2009, the effective interest rate on the Notes was 10.25%, and 10.25%, respectively, which includes the effect of the discount accretion and excludes deferred financing costs amortization.
The Notes bear interest at the rate of 9.75% per year, payable semi-annually in arrears on June 15 and December 15 of each year. The Notes are fully and unconditionally guaranteed by the Company and by each of the Company's current and future domestic subsidiaries (other than Holdings, which is the issuer of the Notes). The Notes rank pari passu with other senior secured debt; however the Notes are effectively junior to the revolving credit facility as to receipt of proceeds from the collateral pursuant to the terms of an inter-creditor agreement.
Until the second anniversary following their issuance, the Company may redeem up to 10% of the original principal amount of the Notes during each 12-month period at 103% of the principal amount plus accrued interest. Thereafter, the Company may redeem all or part of the Notes at a prepayment premium which will decline over time. The Company will be required to make an offer to repurchase the Notes at 101% of the principal amount plus accrued interest if the Company experiences a change of control. The indenture for the Notes contains customary covenants for non-investment grade indebtedness, including restrictions on the Company's ability to incur indebtedness, to declare or pay dividends and repurchase its capital stock, to invest the proceeds of asset sales, and to engage in transactions with affiliates.
Capital Lease and Vendor Financing Obligations
From time to time, the Company enters into capital leases and vendor financing arrangements to purchase certain equipment. The equipment purchased from these vendors is paid over a period of time.
The Company has four equipment lease agreements with Bradesco Leasing in Brazil with terms of 36 months at a rate of 15.6% per year. The original amount of the leases was approximately $3.0 million and the balances for the years ended December 31, 2010 and 2009 were approximately $1.7 million and $2.7 million, respectively.
Foreign Revolving Credit Lines
The Company maintains various foreign bank overdraft facilities used to fund short-term working capital needs. At December 31, 2010, there were no amounts outstanding under these facilities and the Company had approximately $3.9 million of availability. At December 31, 2009, there were no outstanding balances under these facilities.
Extinguished Obligations
On February 12, 2010, in connection with the closing of the acquisition of PGS Onshore the Company fully extinguished certain borrowings outstanding at December 31, 2009 which totaled approximately $66.7 million. Accordingly, these outstanding balances were classified as current debt as of December 31, 2009. The Company recorded losses related to prepayment penalties during the year
F-22
GEOKINETICS INC. AND SUBSIDIARIES
NOTES TO CONSOLIDATED FINANCIAL STATEMENTS (Continued)
NOTE 6: Debt and Capital Lease Obligations (Continued)
ended December 31, 2010. Details regarding the extinguished obligations and related losses are as follows:
PNC Credit Facility. Until February 12, 2010, the Company had a Revolving Credit, Term Loan and Security Agreement with PNC Bank, National Association ("PNC"), as lead lender, which provided the Company with a $70.0 million revolving credit facility ("Revolver") maturing May 24, 2012. At December 31, 2009, the Company had a balance of $44.6 million drawn under the Revolver. The rate of the PNC Revolver was the prime rate plus 1.5% or 4.75% at December 31, 2009. On February 12, 2010, the outstanding balance of $45.8 million was repaid and the Revolver Agreement was terminated. The Company recorded a loss of $1.0 million on the redemption of the Revolver which consisted of $0.8 million related to the acceleration of costs that were being amortized over the expected life of the facility, and approximately $0.2 million related to prepayment penalties.
CIT Group Equipment Financing. The Company had several equipment lease agreements with CIT Group Equipment Financing, Inc. ("CIT") on seismic and other transportation equipment with terms of up to 36 months and various interest amounts. The original amount of the leases was approximately $39.9 million and the balance at December 31, 2009 was approximately $12.1 million. The Company recorded a loss of approximately $0.3 million on the redemption of these obligations related to prepayment penalties in 2010.
Other Equipment Financing. The Company had several other vendor financing arrangements to purchase certain equipment. At December 31, 2009, these obligations totaled approximately $9.9 million. The Company recorded a loss of $1.0 million related to prepayment penalties to fully extinguish balances outstanding on February 12, 2010.
Bridge Loan Commitment. The Company had a commitment from RBC to make a bridge loan in the amount of $275.0 million. The proceeds from this loan would have been used to finance the acquisition of PGS Onshore and repay the Company's existing indebtedness if the Senior Secured Notes offering was not completed. The Company did not borrow amounts under the bridge loan but paid a commitment fee of approximately $2.9 million, which was accounted for as other expense for the year ended December 31, 2009.
At December 31, 2010, future maturities (principal only) of long-term debt, capital lease obligations, notes payable and mandatorily redeemable preferred stock are as follows (in thousands):
For the Years Ending December 31,
|
|
|||
|---|---|---|---|---|
2011 |
$ | 1,634 | ||
2012 |
813 | |||
2013 |
23,000 | |||
2014 |
300,000 | |||
2015 and thereafter |
67,928 | |||
|
$ | 393,375 | (1) | |
- (1)
- Excludes unamortized discount of $4,529 on long-term debt and $22,663 on mandatorily redeemable preferred stock. See note 7.
F-23
GEOKINETICS INC. AND SUBSIDIARIES
NOTES TO CONSOLIDATED FINANCIAL STATEMENTS (Continued)
NOTE 7: Mandatorily Redeemable Preferred Stock
The Company classifies preferred stock which is not convertible or exchangeable for the Company's common stock as long-term liability in accordance with ASC Topic 480, "Distinguishing liabilities from equity" if it is considered a mandatorily redeemable financial instrument. Dividends paid or accrued will be reflected as interest expense in results of operations.
Series C Mandatorily Redeemable Preferred Stock
In December, 2009, in conjunction with the financing of the acquisition of PGS Onshore, the Company agreed to exchange its series B-2 preferred stock for new series C redeemable preferred stock plus the issuance of 750,000 shares of common stock. As additional consideration for the exchange the Company paid a cash fee of 2% of the liquidation amount, $2.1 million, plus accrued and unpaid dividends of the series B-1 and B-2 preferred stock. The fair value of the series C preferred stock at the date of exchange was $32.1 million. The shares of series C redeemable preferred stock were issued to Avista, and have an aggregate liquidation preference equal to the liquidation preference of the series B-2 preferred stock ($33.5 million), and are not required to be redeemed until one year after the maturity date of the Senior Secured Notes. The series C preferred stock accrues dividends at a rate of 11.75%. Dividends may accrue or may be paid in kind with additional shares of series C preferred stock, at the election of Avista, until December 13, 2015. The series C preferred stock is not convertible or exchangeable for the Company's common stock.
Series D Mandatorily Redeemable Junior Preferred Stock
In December, 2010, the Company completed a $30 million private placement of 120,000 shares of a new series of junior preferred stock (the "Series D Preferred Stock") and warrants (the "2010 Warrants") to purchase 3,495,000 shares of common stock. The series D redeemable preferred stock was issued to related parties including Avista and its affiliates, PGS, Levant America S.A. ("Levant") and directors of the Company. Dividends on the Series D Preferred Stock accrue from the date of issuance and are paid in cash or accrued at the election of Geokinetics at a rate of 10.50% per annum and compounded quarterly, if paid in cash, and 11.50% per annum and compounded quarterly if accrued but not paid. The Series D Preferred Stock is subject to mandatory redemption on December 15, 2015, and subject to redemption at the option of Geokinetics at the liquidation preference of $30 million. The series D preferred stock is not convertible or exchangeable for the Company's common stock. The 2010 Warrants have an initial exercise price of $9.64 per share (subject to adjustment), which was equal to 105% of the closing price of Geokinetics' common stock on December 13, 2010, and expire on December 15, 2016. The preferred stock was issued at a value of $8.3 million. The discount of $21.7 million will be accreted through December 15, 2016. Accretion for the year ended December 31, 2010, was $0.1 million. The effective dividend rate of the Series D Preferred Stock is 56.3%, which includes the effect of the deferred financing costs amortization.
F-24
GEOKINETICS INC. AND SUBSIDIARIES
NOTES TO CONSOLIDATED FINANCIAL STATEMENTS (Continued)
NOTE 7: Mandatorily Redeemable Preferred Stock (Continued)
At December 31, 2010, mandatorily redeemable preferred stock consisted of (in thousands):
| |
December 31, | ||||||||||||||
|---|---|---|---|---|---|---|---|---|---|---|---|---|---|---|---|
| |
2010 | 2009 | |||||||||||||
| |
Shares | $ | Shares | $ | |||||||||||
Series C Mandatorily Redeemable Preferred: |
|||||||||||||||
Issued |
133,982 | $ | 33,495 | 133,982 | $ | 33,495 | |||||||||
Discount, net of accretion |
— | (1,159 | ) | (1,391 | ) | ||||||||||
Accrued interest |
17,089 | 4,272 | — | — | |||||||||||
Series C Mandatorily Redeemable Preferred, net |
151,071 | $ | 36,608 | 133,982 | $ | 32,104 | |||||||||
Series D Mandatorily Redeemable Preferred: |
|||||||||||||||
Issued |
120,000 | $ | 30,000 | — | — | ||||||||||
Discount, net of accretion |
— | (21,504 | ) | — | |||||||||||
Accrued interest |
643 | 161 | — | — | |||||||||||
Series D Mandatorily Redeemable Preferred, net |
120,643 | $ | 8,657 | — | $ | — | |||||||||
Total |
$ | 45,265 | $ | 32,104 | |||||||||||
Series C Mandatorily Redeemable Preferred Stock has liquidation preference over Series D Mandatorily Redeemable Preferred Stock.
NOTE 8: Fair Value
Fair Value Measurements
The Company has categorized its financial assets and liabilities into a three level fair value hierarchy, based on the inputs used in determining fair value.
Following is a description of each category in the fair value hierarchy and the financial assets and liabilities of the Company that are included in the consolidated balance sheets as of December 31, 2010 and 2009.
Level 1—Financial assets and liabilities whose values are based on unadjusted quoted prices in active markets that are accessible at the measurement date for identical, unrestricted assets or liabilities. The company had no assets or liabilities in this category as of December 31, 2010 and 2009.
Level 2—Financial assets and liabilities whose inputs other than quoted prices included within Level 1 that are observable for the asset or liability, either directly or indirectly, including quoted prices for similar assets or liabilities in active markets; quoted prices for identical or similar assets or liabilities in markets that are not active; inputs other than quoted prices that are observable for the asset or liability (e.g., interest rates); and inputs that are derived principally from or corroborated by observable market data by correlation or other means. The company had no assets or liabilities in this category as of December 31, 2010 and 2009.
Level 3—Financial assets and liabilities whose inputs that are both significant to the fair value measurement and unobservable. Unobservable inputs reflect the Company's judgment about assumptions market participants would use in pricing the asset or liability estimated impact to quoted market prices. Accordingly, these fair values may not represent actual values of the financial instruments that could have been realized as of December 31, 2010 or that will be realized in the
F-25
GEOKINETICS INC. AND SUBSIDIARIES
NOTES TO CONSOLIDATED FINANCIAL STATEMENTS (Continued)
NOTE 8: Fair Value (Continued)
future and do not include expenses that could be incurred in an actual sale or settlement. The fair value of the conversion feature embedded in the Series B preferred stock, 2008 Warrants and 2010 Warrants was determined using a Monte Carlo Valuation Model. At December 31, 2010 the assumptions used in the model to determine the fair value of the outstanding warrants included the warrant exercise price of $9.25 per share for the 2008 Warrants, $9.64 per share for the 2010 Warrants, and the Series B conversion price of $16.40 per share. The Company's stock price on December 31, 2010 of $9.29, and volatility of 83.64% were used in all models to determine the fair value. The risk-free discount rate of 0.84%, 2.38% and 1.99%were used for the 2008 Warrants, 2010 Warrants and embedded conversion feature, respectively, based on the remaining life of the instruments.
At December 31, 2009, the assumptions used in the model to determine the fair value of the embedded conversion feature included the Series B conversion price of $17.44 per share on December 31, 2009, discount rate of 3.03% and volatility of 106.31%. The assumptions used in the model to determine the fair value of the 2008 warrants included the warrant conversion price of $9.25 per share, the Company's stock price on December 31, 2009 of $9.62 per share, discount rate of 1.99% and volatility of 106.31%.
The Company's liabilities measured at fair value on a recurring basis were determined using Level 3 inputs as follows (in thousands):
| |
Fair Value Measurements at December 31, 2010 | ||||||||||||
|---|---|---|---|---|---|---|---|---|---|---|---|---|---|
| |
|
Quoted Prices in Active Markets for Identical Assets |
Significant Other Observable Inputs |
Significant Unobservable Inputs |
|||||||||
| |
Total | (Level 1) | (Level 2) | (Level 3) | |||||||||
Conversion feature embedded in Series B Preferred Stock |
$ | 14,142 | $ | — | $ | — | $ | 14,142 | |||||
2008 Warrants |
1,097 | — | — | 1,097 | |||||||||
2010 Warrants |
23,032 | — | — | 23,032 | |||||||||
Total derivative liabilities |
$ | 38,271 | $ | — | $ | — | $ | 38,271 | |||||
| |
Fair Value Measurements at December 31, 2009 | ||||||||||||
|---|---|---|---|---|---|---|---|---|---|---|---|---|---|
| |
|
Quoted Prices in Active Markets for Identical Assets |
Significant Other Observable Inputs |
Significant Unobservable Inputs |
|||||||||
| |
Total | (Level 1) | (Level 2) | (Level 3) | |||||||||
Conversion feature embedded in Preferred Stock |
$ | 7,737 | $ | — | $ | — | $ | 7,737 | |||||
2008 Warrants |
1,580 | — | — | 1,580 | |||||||||
Total derivative liabilities |
$ | 9,317 | $ | — | $ | — | $ | 9,317 | |||||
Beginning January 1, 2009, the Company records derivative liabilities on its balance sheet as derivative liabilities related to certain warrants and the conversion feature embedded in the preferred stock. The accretion of the additional discount to the preferred stock resulting from bifurcating the
F-26
GEOKINETICS INC. AND SUBSIDIARIES
NOTES TO CONSOLIDATED FINANCIAL STATEMENTS (Continued)
NOTE 8: Fair Value (Continued)
Series B conversion feature totaled $0.9 million and $1.4 million for the years ended December 31, 2010 and 2009, respectively.
The fair value of the 2010 Warrants which were issued in connection with the Series D preferred stock issuance on December 14, 2010 was $21.7 million. The assumptions used in the Monte Carlo model to determine the fair value of the Series D warrants upon issuance included the Company's stock price of $8.81, risk-free discount rate of 2.49% and volatility of 83.96%.
A reconciliation of the Company's liabilities measured at fair value on a recurring basis using significant unobservable inputs (Level 3) is as follows as of December 31 (in thousands):
| |
2010 | 2009 | ||||||
|---|---|---|---|---|---|---|---|---|
Balance January 1 |
$ | 9,317 | $ | 1,511 | ||||
Total unrealized gains |
||||||||
Included in earnings |
6,415 | 7,324 | ||||||
Included in other comprehensive income |
— | — | ||||||
Settlements/Issuances |
22,539 | 482 | ||||||
Transfers in and/or out of Level 3 |
— | — | ||||||
Balance December 31 |
$ | 38,271 | $ | 9,317 | ||||
The Company is not a party to any hedge arrangements, commodity swap agreement or any other derivative financial instruments. The seismic data acquisition and seismic data processing segments utilize foreign subsidiaries and branches to conduct operations outside of the United States. These operations expose the Company to market risks from changes in foreign exchange rates.
Estimated Fair Value of Financial Instruments
The carrying amounts of cash and cash equivalents, accounts receivable, and accounts payable and short-term debt approximate their fair value due to the short maturity of those instruments, and therefore, have been excluded from the table below. The fair value of the Notes is determined by multiplying the principal amount by the market price. The fair value of the mandatorily redeemable preferred stock was calculated by using the discounted cash flow method of the income approach. The following table sets forth the fair value of the Company's remaining financial assets and liabilities as of December 31, 2010 and December 31, 2009 (in thousands):
| |
December 31, 2010 | December 31, 2009 | ||||||||||||
|---|---|---|---|---|---|---|---|---|---|---|---|---|---|---|
| |
Carrying Amount |
Fair Value |
Carrying Amount |
Fair Value |
||||||||||
Financial liabilities: |
||||||||||||||
Long-term debt |
$ | 320,918 | $ | 324,862 | $ | 364,857 | $ | 400,000 | ||||||
Mandatorily redeemable preferred stock: |
||||||||||||||
Series C |
36,608 | 44,950 | 32,104 | 32,104 | ||||||||||
Series D |
$ | 8,657 | $ | 28,168 | $ | — | $ | — | ||||||
NOTE 9: Preferred Stock
On December 15, 2006, in connection with the repayment of a $55.0 million subordinated loan, the Company issued 228,683 shares of its Series B Preferred Stock, $10.00 par value, pursuant to the terms
F-27
GEOKINETICS INC. AND SUBSIDIARIES
NOTES TO CONSOLIDATED FINANCIAL STATEMENTS (Continued)
NOTE 9: Preferred Stock (Continued)
of the Securities Purchase Agreement dated September 8, 2006, with Avista Capital Partners, L.P. ("Avista"), an affiliate of Avista and another institutional investor ("the Series B-1 Preferred Stock").
On July 28, 2008, the Company issued 120,000 shares of its Series B Preferred Stock, $10.00 par value ("the Series B-2 Preferred Stock") and warrants to purchase 240,000 shares of Geokinetics common stock to Avista and an affiliate of Avista for net proceeds of $29.1 million. The Company recorded the preferred stock net of the fair value of the 2008 warrants issued and recorded the fair value of the warrants for approximately $1.5 million as additional paid in capital.
Effective December 18, 2009, the Company exchanged the series B-2 preferred stock for new series C redeemable preferred stock (the "Series C Preferred Stock") which is classified as long-term liabilities as described above. The holders of the Series B-1 Preferred Stock and the Company agreed to revision to certain terms as a condition to the exchange of Series B-2 shares, the common stock public offering and agreement for the issuance of shares in connection with the closing of the acquisition of PGS Onshore on the same date. These revised terms included an extension of the redemption date to December 15, 2015, reduction of the conversion rate to $17.436; option dividends may be paid in kind until December 15, 2015; the dividend rate on the series B-1 preferred stock was increased to 9.75%; As additional consideration for the exchange, the Company paid a cash fee of 2% of the liquidation amount, $2.1 million, plus accrued and unpaid dividends of the series B-1 and B-2 preferred stock.
As of December 31, 2010 and 2009, the series B-1 preferred stock is presented as mezzanine equity due to the series B preferred stock characteristics described below.
Each holder of Series B-1 Preferred Stock is also entitled to receive cumulative dividends at the rate of 9.75% per annum on the liquidation preference of $250.00 per share, compounded quarterly. At the Company's option through December 15, 2015, dividends may be paid in additional shares of Series B-1 Preferred Stock. After such date, dividends are required to be paid in cash if declared. Dividends on the Series B Preferred Stock have been paid in kind exclusively to date.
After December 15, 2015, holders of not less than a majority of outstanding shares of Series B-1 Preferred Stock may require payment, upon written notice of the redemption of all outstanding shares of Series B-1 Preferred Stock, in cash, at a price equal to $250.00 per share, plus any accrued dividends.
F-28
GEOKINETICS INC. AND SUBSIDIARIES
NOTES TO CONSOLIDATED FINANCIAL STATEMENTS (Continued)
NOTE 9: Preferred Stock (Continued)
At the Company's option, each share of Series B Preferred Stock is convertible into shares of common stock, immediately upon the sale of common stock at a price per share yielding net proceeds to the Company of not less than $35.00 per share in an under written public offering pursuant to an effective registration statement under the Securities Act of 1933 (the "Securities Act"), which provides net proceeds to the Company and selling stockholders, if any, of not less than $75,000,000.
As long as at least 55,000 shares of Series B Preferred Stock are outstanding, the consent of the holders of a majority of the Company's Series B Preferred Stock is required to, among other things, make any material change to the Company's certificate of incorporation or by-laws, declare a dividend on the Company's common stock, enter into a business combination, increase or decrease the number of members of its board of directors from six and the holders are allowed to elect one member of the board of directors.
If the Company authorizes the issuance and sale of additional shares of its common stock other than pursuant to an underwritten public offering registered under the Securities Act, or for non-cash consideration pursuant to a merger or consolidation approved by its board of directors, the Company must first offer in writing to sell to each holder of its Series B Preferred Stock an equivalent pro rata portion of the securities being issued.
NOTE 10: Common Stock
The holders of common stock have full voting rights on all matters requiring stockholder action, with each share of common stock entitled to one vote. Holders of common stock are not entitled to cumulate votes in elections of directors. No stockholder has any preemptive right to subscribe to an additional issue of any stock or to any security convertible into such stock.
In addition, as long as any shares of the Series B-1 and C Preferred Stock discussed above are outstanding, the Company may not pay or declare any dividends on common stock unless the Company has paid, or at the same time pays or provides for the payment of, all accrued and unpaid dividends on the Series B-1 Preferred Stock. In addition, the credit facilities restrict the Company's ability to pay dividends on common stock. No dividends on common stock have been declared for any periods presented.
On December 18, 2009, the Company issued 4,000,000 shares of its common stock at a public offering price of $9.25 per share. In addition, the Company issued 750,000 shares to Avista in connection with the exchange of the Series B-2 preferred stock for the new series C preferred stock.
On January 14, 2010, in conjunction with the December 18, 2009 common stock issuance, the underwriters of the stock exercised their option to purchase 207,200 shares of common stock for approximately $1.8 million.
On February 12, 2010, the Company issued 2,153,616 shares of its common stock to PGS in connection with the acquisition of PGS Onshore.
F-29
GEOKINETICS INC. AND SUBSIDIARIES
NOTES TO CONSOLIDATED FINANCIAL STATEMENTS (Continued)
NOTE 10: Common Stock (Continued)
Common Stock Warrants
As part of the Trace Acquisition in December 2005, the Company issued 274,105 warrants at an exercise price of $20.00, which expired on December 1, 2010.
As part of the issuance of Series B-2 Preferred Stock on July 28, 2008, the Company issued warrants to purchase 240,000 shares of common stock (the "2008 Warrants") at an exercise price of $20.00, which expire on July 28, 2013. On December 18, 2009, the exercise price of the 2008 Warrants was adjusted to $9.25 as a result of the issuance in December 2009 of common stock in accordance with price adjustment sections of the 2008 Warrants.
In connection with the issuance of Series D Preferred Stock in December 2010, the Company issued warrants to purchase 3,495,000 shares of common stock (the "2010 Warrants"). The 2010 Warrants have an initial exercise price of $9.64 per share (subject to adjustment), which was equal to 105% of the closing price of Geokinetics' common stock on December 13, 2010. The 2010 Warrants expire on December 15, 2016 and are recorded as derivative liabilities in the consolidated balance sheets as of December 31, 2010 and 2009.
At December 31, 2010 and 2009, there were warrants to purchase 3,735,000 and 514,105 shares of common stock outstanding, respectively.
NOTE 11: Employee Benefits
Stock-Based Compensation
The Company adopted the 2010 Stock Awards Plan ("2010 Plan") effective April 1, 2010, the 2007 Stock Awards Plan ("2007 Plan") during May 2007 and the 2002 Stock Awards Plan ("2002 Plan") during March 2002. All Plans provide for granting of (i) incentive stock options, (ii) nonqualified stock options, (iii) stock appreciation rights, (iv) restricted stock awards, (v) phantom stock awards or (vi) any combination of the foregoing to directors, officers and select employees. The Company is authorized to grant a total of 3,150,000 shares of common stock under these three plans: 1,600,000 shares under the 2010 Plan, 750,000 shares under the 2007 Plan and 800,000 shares under the 2002 Plan. At December 31, 2010, 1,174,000 shares remained available for grant under the 2010 Plan, 202,161 shares under the 2007 Plan, and 116,841 shares under the 2002 Plan. Stock option exercises and restricted stock are funded through the issuance of authorized but unissued shares of common stock.
Stock Options
The Company granted both incentive stock options and non-qualified stock options to employees and non-employee directors. The incentive stock options awarded in November 2010 have contractual terms of six years and vest in equal amounts of shares over 3 years starting November 15, 2011. These options have a strike price of $6.60 per share. The stock options awarded in December 2007 have contractual terms of six years and vest over four years starting November 15, 2008, in increments of 15%, 15%, 30% and 40%. These options have a strike price of $28.00 per share. For the non-qualified stock options awarded in December 2005 with an exercise price of $12.50, the contractual terms of 10 years was modified in December 2007 to three years and one month or the options were repriced to an exercise price of $20.00, the market price on the date of award, to address deferred compensation
F-30
GEOKINETICS INC. AND SUBSIDIARIES
NOTES TO CONSOLIDATED FINANCIAL STATEMENTS (Continued)
NOTE 11: Employee Benefits (Continued)
issues, but the options were fully vested when the contractual term was modified. The remaining incentive stock options granted over the time period from June 2004 through October 2010, have contractual terms of 6 or 10 years.
On June 26, 2009, the Company announced the commencement of a voluntary stock option exchange program ("Exchange Offer"). Eligible employees were provided the opportunity to surrender certain outstanding underwater incentive stock options granted in December 2007 with an exercise price of $28.00 in exchange for a lesser amount of replacement incentive stock options with a lower exercise price. The Exchange Offer expired on July 27, 2009. Pursuant to the Exchange Offer, 238,850 eligible stock options were tendered, representing 99.3% of the total stock options eligible for exchange in the Exchange Offer. On July 27, 2009, the Company granted an aggregate of 218,178 new stock options in exchange for eligible stock options surrendered in the Exchange Offer. The exercise price of the new stock option is $14.73, which was the closing price of Geokinetics common stock on July 27, 2009. The incremental change to the Company's unrecognized stock option expense related to these options was not material to the Company's financial results.
The price at which a share of common stock may be purchased upon exercise of an incentive stock option or a nonqualified stock option is determined by the Board of Directors of the Company (the "Board"), but may not be less than, in the case of incentive stock options, the fair market value of
F-31
GEOKINETICS INC. AND SUBSIDIARIES
NOTES TO CONSOLIDATED FINANCIAL STATEMENTS (Continued)
NOTE 11: Employee Benefits (Continued)
common stock subject to the stock option on the date the stock option is granted. Option activity for the years ended December 31, 2010, 2009 and 2008, is summarized as follows:
| |
Number of Options |
Weighted Average Exercise Price |
Weighted Average Remaining Contractual Term |
|||||||
|---|---|---|---|---|---|---|---|---|---|---|
Balance at December 31, 2007 |
559,596 | $ | 21.27 | 6.40 years | ||||||
Expired |
— | — | — | |||||||
Forfeited |
(98,917 | ) | 13.13 | — | ||||||
Exercised |
(83,700 | ) | 7.12 | — | ||||||
Granted |
— | — | — | |||||||
Balance at December 31, 2008 |
376,979 | $ | 26.55 | 5.04 years | ||||||
Exercisable at December 31, 2008 |
86,437 | $ | 21.67 | 5.36 years | ||||||
Balance at December 31, 2008 |
376,979 | 26.55 | 5.04 years | |||||||
Expired |
— | — | — | |||||||
Forfeited |
(55,938 | ) | $ | 22.70 | — | |||||
Exercised |
— | — | — | |||||||
Granted |
— | — | — | |||||||
Balance at December 31, 2009 |
321,041 | $ | 14.62 | 4.05 years | ||||||
Exercisable at December 31, 2009 |
132,309 | $ | 14.04 | 4.22 years | ||||||
Balance at December 31, 2009 |
321,041 | $ | 14.62 | 4.05 years | ||||||
Expired |
— | — | — | |||||||
Forfeited |
(80,278 | ) | 15.52 | — | ||||||
Exercised |
— | — | ||||||||
Granted |
265,700 | 6.62 | — | |||||||
Balance at December 31, 2010 |
506,463 | $ | 12.16 | 4.41 years | ||||||
Exercisable at December 31, 2010 |
169,294 | $ | 18.29 | 2.95 years | ||||||
At December 31, 2010, the aggregate intrinsic value was less than $0.1 million for the 169,294 exercisable shares. For the 506,463 shares vested and expected to vest at December 31, 2010, the aggregate intrinsic value was $0.7 million.
The weighted average grant-date fair value of options granted during the year ended December 31, 2010 was $4.55. The Company did not issue stock options in 2009 or 2008. The fair value of each option granted is estimated on the date of grant, using the Black-Scholes option pricing model. The model assumed a range of volatilities between 76% and 82% and a range of risk-free interest rates between 1.375% and 1.892% for 2010. The total intrinsic value of options exercised during the years ended December 31, 2008 was approximately $1.0 million.
Options outstanding at December 31, 2010, expire between December 2013 and November 2016, and have exercise prices ranging from $4.60 to $28.00.
F-32
GEOKINETICS INC. AND SUBSIDIARIES
NOTES TO CONSOLIDATED FINANCIAL STATEMENTS (Continued)
NOTE 11: Employee Benefits (Continued)
Total compensation expense related to stock options recognized during 2010, 2009 and 2008 totaled $1.0 million, $0.5 million and $0.6 million, respectively.
The fair value of each option award is estimated on the date of grant using a Black-Scholes option pricing model. Expected volatilities are based on a number of factors, including historical volatility of the Company's stock. The Company uses historical data to estimate option exercise and employee termination for determining the estimated forfeitures. The Company uses the "shortcut" method for determining the expected life used in the valuation model. The risk-free rate for periods within the contractual life of the option is based on the U.S. Treasury yield curve in effect at the time of the grant. As the Company has not declared dividends since it became a public entity, no dividend yield is used in the calculation.
Restricted Stock
Restricted stock expense is calculated by multiplying the stock price on the date of award by the number of shares awarded and amortizing this amount over the vesting period of the stock.
The Company recorded compensation expense related to restricted stock of approximately $1.9 million or $0.10 per common share, $1.7 million or $0.15 per common share and $1.3 million or $0.13 per common share for the years ended December 31, 2010, 2009 and 2008, respectively, related to these restricted stock awards whose activity is summarized below:
| |
Number of Shares of Restricted Stock |
|||
|---|---|---|---|---|
Total non vested at December 31, 2007 |
155,962 | |||
Forfeited |
(6,329 | ) | ||
Vested |
(70,451 | ) | ||
Granted to management |
10,000 | |||
Granted to non-management employees |
21,186 | |||
Granted to non-employee directors |
— | |||
Total non vested at December 31, 2008 |
110,368 | |||
Forfeited |
(4,814 | ) | ||
Vested |
(76,726 | ) | ||
Granted to management |
90,000 | |||
Granted to non-management employees |
138,861 | |||
Granted to non-employee directors |
24,000 | |||
Total non vested at December 31, 2009 |
281,689 | |||
Forfeited |
(44,509 | ) | ||
Vested |
(166,149 | ) | ||
Granted to management |
36,000 | |||
Granted to non-management employees |
178,800 | |||
Granted to non-employee directors |
28,000 | |||
Total non vested at December 31, 2010 |
313,831 | |||
F-33
GEOKINETICS INC. AND SUBSIDIARIES
NOTES TO CONSOLIDATED FINANCIAL STATEMENTS (Continued)
NOTE 11: Employee Benefits (Continued)
Because the Company maintained a full valuation allowance on its U.S. deferred tax assets, the Company did not recognize any tax benefit related to stock-based compensation expense for the years ended December 31, 2010, 2009 and 2008.
The Company's future compensation cost related to non-vested stock options and restricted stock not yet recognized at December 31, 2010 is $4.7 million which will be recognized over a weighted average period of 2.16 years.
Employee Retirement Plans
At December 31, 2010, the Company maintained two retirement plans in which the Company's employees were eligible to participate.
U.S. domestic employees participated in a 401(k) plan in which the Company made matching contributions of approximately $1.3 million, $0.9 million, and $0.8 million for 2010, 2009 and 2008, respectively, whereby the Company matched 100% on the first 3% of the employee's contribution and 50% on the second 3% of the employee's contribution.
International employees participated in an international defined contribution plan in which the Company made matching contributions of approximately $0.5 million, $0.3 million, and $0.2 million for 2010, 2009 and 2008, respectively, whereby the Company matched 100% on the first 3% of the employee's contribution and 50% on the second 3% of the employee's contribution.
All employees of the Company paid out of the United States, both domestically and internationally, are eligible to participate effective the first of the month following three months from their hire date.
The Company does not offer any pension or other retirement benefits.
F-34
GEOKINETICS INC. AND SUBSIDIARIES
NOTES TO CONSOLIDATED FINANCIAL STATEMENTS (Continued)
NOTE 12: Loss Per Common Share
The following table sets forth the computation of basic and diluted loss per common share (in thousands except share and per share data):
| |
Year Ended December 31, | |||||||||
|---|---|---|---|---|---|---|---|---|---|---|
| |
2010 | 2009 | 2008 | |||||||
Numerator: |
||||||||||
Loss applicable to common stockholders |
$ | (147,534 | ) | $ | (34,125 | ) | $ | (5,339 | ) | |
Denominator: |
||||||||||
Denominator for basic loss per common share |
17,441,423 | 10,875,264 | 10,389,969 | |||||||
Effect of dilutive securities: |
||||||||||
Stock options |
— | — | — | |||||||
Warrants |
— | — | — | |||||||
Restricted stock |
— | — | — | |||||||
Convertible preferred stock |
— | — | — | |||||||
Denominator for diluted loss per common share |
17,441,423 | 10,875,264 | 10,389,969 | |||||||
Loss per common share: |
||||||||||
Basic and diluted |
$ | (8.46 | ) | $ | (3.14 | ) | $ | (0.51 | ) | |
The calculation of diluted loss per common share for the years ended December 31, 2010, 2009 and 2008, excludes options to purchase 202,200 shares, 208,673 shares and 376,979 shares of common stock, respectively; warrants to purchase 3,735,000, 514,105 shares and 514,105 shares of common stock, respectively; 313,831, 281,689, and 110,368 shares of restricted stock, respectively; and preferred stock convertible into 4,865,457, 4,159,934, and 3,916,290 shares of common stock for the years ended December 31, 2010, 2009 and 2008, respectively, because the effect would be anti-dilutive.
NOTE 13: Segment Information
The Company has two reportable segments: seismic data acquisition and seismic data processing and interpretation. The Company further breaks down its seismic data acquisition segment into two geographic reporting units: North American seismic data acquisition and International seismic data acquisition. The North American and International seismic data acquisition reporting units acquire data for customers by conducting seismic shooting operations in the Gulf Coast, Mid-Continent, California, Appalachian and Rocky Mountain regions of the United States, Western Canada, Canadian Arctic, Latin America, Africa, the Middle East, Australia/New Zealand and the Far East. The data processing and interpretation segment operates processing centers in Houston, Texas and London, United Kingdom to process seismic data for oil and gas exploration companies worldwide.
The accounting policies of the segments are the same as those described in Note 2: "Basis of Presentation and Significant Accounting Policies." The Company evaluates performance based on earnings or loss before interest, taxes, other income (expense) depreciation and amortization. There are no inter-segment sales or transfers.
The Company's reportable segments are strategic business units that offer different services to customers. Each segment is managed separately, has a different customer base, and requires unique and sophisticated technology.
F-35
GEOKINETICS INC. AND SUBSIDIARIES
NOTES TO CONSOLIDATED FINANCIAL STATEMENTS (Continued)
NOTE 13: Segment Information (Continued)
The following table sets forth financial information with respect to our reportable segments (in thousands, except for gross margin percentages):
| |
Year Ended December 31, | ||||||||||||
|---|---|---|---|---|---|---|---|---|---|---|---|---|---|
| |
2010 | 2009 | 2008 | ||||||||||
Revenue: |
|||||||||||||
Data Acquisition |
|||||||||||||
North America |
$ | 199,915 | $ | 83,177 | $ | 177,448 | |||||||
International |
349,201 | 417,106 | 285,128 | ||||||||||
Subtotal Data Acquisition |
549,116 | 500,283 | 462,576 | ||||||||||
Data Processing |
9,018 | 10,683 | 12,022 | ||||||||||
Total |
$ | 558,134 | $ | 510,966 | $ | 474,598 | |||||||
Direct Operating Expenses: |
|||||||||||||
Data Acquisition |
|||||||||||||
North America |
$ | 120,518 | $ | 65,952 | $ | 138,202 | |||||||
International |
324,782 | 295,573 | 223,175 | ||||||||||
Subtotal Data Acquisition |
445,300 | 361,525 | 361,377 | ||||||||||
Data Processing |
8,893 | 8,641 | 8,861 | ||||||||||
Total |
$ | 454,193 | $ | 370,166 | $ | 370,238 | |||||||
Gross Margins: |
|||||||||||||
Data Acquisition |
|||||||||||||
North America |
$ | 79,396 | $ | 17,225 | $ | 39,246 | |||||||
International |
24,420 | 121,533 | 61,953 | ||||||||||
Subtotal Data Acquisition |
103,816 | 138,758 | 101,199 | ||||||||||
Data Processing |
125 | 2,042 | 3,161 | ||||||||||
Total |
$ | 103,941 | $ | 140,800 | $ | 104,360 | |||||||
Gross Margin Percentages: |
|||||||||||||
Data Acquisition |
|||||||||||||
North America |
39.7 | % | 20.7 | % | 22.1 | % | |||||||
International |
7.0 | 29.1 | 21.7 | ||||||||||
Subtotal Data Acquisition |
18.9 | 27.7 | 21.9 | ||||||||||
Data Processing |
1.4 | 19.1 | 26.3 | ||||||||||
Total |
18.6 | % | 27.6 | % | 22.0 | % | |||||||
Segment Depreciation and Amortization: |
|||||||||||||
Data Acquisition |
|||||||||||||
North America |
59,088 | 22,542 | 21,638 | ||||||||||
International |
46,061 | 29,293 | 23,892 | ||||||||||
Subtotal Data Acquisition |
105,149 | 51,835 | 45,530 | ||||||||||
Data Processing |
1,492 | 1,574 | 1,423 | ||||||||||
Corporate |
6,256 | 3,512 | 2,037 | ||||||||||
Total |
112,897 | 56,921 | 48,990 | ||||||||||
Segment Income (Loss): |
|||||||||||||
Data Acquisition |
|||||||||||||
North America |
$ | 13,842 | $ | (16,464 | ) | $ | 15,474 | ||||||
International |
(60,695 | ) | 58,499 | 18,738 | |||||||||
Subtotal Data Acquisition |
(46,853 | ) | 42,035 | 34,212 | |||||||||
Data Processing |
(1,434 | ) | (307 | ) | 1,135 | ||||||||
Corporate |
(90,397 | ) | (54,063 | ) | (34,361 | ) | |||||||
Total |
$ | (138,684 | ) | $ | (12,335 | ) | $ | 986 | |||||
Segment Assets: |
|||||||||||||
Data Acquisition |
|||||||||||||
North America |
$ | 213,109 | $ | 84,831 | $ | 113,757 | |||||||
International |
447,190 | 265,841 | 299,055 | ||||||||||
Subtotal Data Acquisition |
660,299 | 350,672 | 412,812 | ||||||||||
Data Processing |
8,789 | 9,893 | 7,307 | ||||||||||
Corporate |
56,076 | 411,125 | 19,597 | ||||||||||
Total |
$ | 725,164 | $ | 771,690 | $ | 439,716 | |||||||
F-36
GEOKINETICS INC. AND SUBSIDIARIES
NOTES TO CONSOLIDATED FINANCIAL STATEMENTS (Continued)
NOTE 14: Income Taxes
Income (loss) before income taxes attributable to U.S. and foreign operations are as follows (in thousands):
| |
Year Ended December 31, | |||||||||
|---|---|---|---|---|---|---|---|---|---|---|
| |
2010 | 2009 | 2008 | |||||||
U.S. |
$ | (72,773 | ) | $ | (14,494 | ) | $ | (12,098 | ) | |
Foreign |
$ | (61,101 | ) | $ | 25,411 | $ | 22,352 | |||
Total |
$ | (133,874 | ) | $ | 10,917 | $ | 10,254 | |||
The provision for income taxes shown in the consolidated statements of operations consists of current and deferred expense (benefit) as follows:
| |
Year Ended December 31, | ||||||||||
|---|---|---|---|---|---|---|---|---|---|---|---|
| |
2010 | 2009 | 2008 | ||||||||
Current: |
|||||||||||
U.S.—federal and state |
$ | (150 | ) | $ | 200 | $ | 1,844 | ||||
Foreign |
14,136 | 30,174 | 10,342 | ||||||||
Total current |
13,986 | 30,374 | 12,186 | ||||||||
Deferred: |
|||||||||||
U.S.—federal and state |
(6,494 | ) | (5,919 | ) | 15 | ||||||
Foreign |
(2,682 | ) | (1,203 | ) | (2,933 | ) | |||||
Total deferred |
(9,176 | ) | (7,122 | ) | (2,918 | ) | |||||
Total provision for income taxes |
$ | 4,810 | $ | 23,252 | 9,268 | ||||||
The provision for income taxes differs from the amount of income tax determined by applying the U.S. statutory rate to the income/loss before income taxes for the years ended December 31, 2010, 2009 and 2008 as follows:
| |
Year Ended December 31, | |||||||||
|---|---|---|---|---|---|---|---|---|---|---|
| |
2010 | 2009 | 2008 | |||||||
U.S. statutory rate |
$ | (46,856 | ) | $ | 3,821 | $ | 3,944 | |||
Non-deductible expenses |
1,312 | 386 | 366 | |||||||
State taxes, net of benefit |
— | 130 | 420 | |||||||
Effect of foreign tax rate differential |
9,581 | (2,467 | ) | (3,739 | ) | |||||
Foreign withholding taxes |
4,184 | 4,527 | 8,628 | |||||||
Non-deductible derivative losses |
2,245 | 2,563 | — | |||||||
Unrecognized tax benefits |
764 | 7,233 | — | |||||||
Return to accrual items |
4,760 | (4,494 | ) | (1,675 | ) | |||||
Change in valuation allowance |
28,820 | 11,553 | 1,324 | |||||||
Total provision for income taxes |
$ | 4,810 | $ | 23,252 | $ | 9,268 | ||||
F-37
GEOKINETICS INC. AND SUBSIDIARIES
NOTES TO CONSOLIDATED FINANCIAL STATEMENTS (Continued)
NOTE 14: Income Taxes (Continued)
| |
December 31 | |||||||||
|---|---|---|---|---|---|---|---|---|---|---|
| |
2010 | 2009 | ||||||||
Current deferred tax assets: |
||||||||||
Allowance for doubtful accounts |
$ | 730 | $ | 416 | ||||||
Other |
464 | 236 | ||||||||
Total current deferred tax assets |
$ | 1,194 | $ | 652 | ||||||
Noncurrent deferred tax assets: |
||||||||||
Stock-based compensation |
1,066 | 671 | ||||||||
Loss carryforwards—U.S |
85,401 | 62,950 | ||||||||
Loss carryforwards—foreign |
30,922 | 9,336 | ||||||||
Debt on foreign subsidiary leases |
75 | 420 | ||||||||
Multi-client data library |
9,716 | — | ||||||||
Total noncurrent deferred tax assets |
$ | 127,180 | $ | 73,377 | ||||||
Total deferred tax assets |
$ | 128,374 | $ | 74,029 | ||||||
Valuation allowance |
(104,021 | ) | (64,862 | ) | ||||||
Net deferred tax assets |
$ | 24,353 | $ | 9,167 | ||||||
Current deferred tax liabilities |
$ | — | $ | 220 | ||||||
Noncurrent deferred tax liabilities: |
||||||||||
Property and equipment—foreign |
(418 | ) | 845 | |||||||
Property and equipment—U.S |
8,830 | 8,043 | ||||||||
Property—equipment—acquisitions |
24,249 | 6,545 | ||||||||
Other |
7,861 | — | ||||||||
Total noncurrent deferred tax liabilities |
$ | 40,522 | $ | 15,433 | ||||||
Total deferred tax liabilities |
40,522 | 15,653 | ||||||||
Net deferred income tax liability |
$ | 16,169 | $ | 6,486 | ||||||
The valuation allowance for deferred tax assets increased by approximately $39.2 million in 2010. The increase in this allowance was primarily due to an increase of U.S. and foreign net operating losses.
At December 31, 2010, the Company had U.S. tax loss carryforwards of approximately $220.9 million and non-U.S. tax loss carryforwards of approximately $119.2 million which will expire in various amounts beginning in 2011 and ending in 2029. The non-U.S. loss carryforwards expiring in 2011, 2012, 2013, 2014, and 2015 are $1.0 million, $4.3 million, $5.9 million, $11.1 million, and $16.4 million, respectively. There are no U.S. loss carryforwards expiring before 2019. Section 382 imposes limitations on a corporation's ability to utilize net operating loss carryforwards ("NOLs") if the Company experiences an "ownership change." In general terms, an ownership change may result from transactions increasing the ownership percentage of certain stockholders in the stock of the corporation by more than 50 percent over a three year period. In the event of an ownership change, utilization of NOLs would be subject to an annual limitation under Section 382 determined by multiplying the value of the Company at the time of the ownership change by the applicable long-term tax-exempt rate. Any unused annual limitation may be carried over to later years. The amount of the limitation may, under
F-38
GEOKINETICS INC. AND SUBSIDIARIES
NOTES TO CONSOLIDATED FINANCIAL STATEMENTS (Continued)
NOTE 14: Income Taxes (Continued)
certain circumstances, be increased by built-in gains held by the Company at the time of the ownership change that are recognized in the five year period after the ownership change.
As of December 31, 2010, the Company's cash and cash equivalents and restricted cash was held by foreign subsidiaries and are based in U.S. dollar denominated holdings. Additionally, the Company has undistributed earnings of its foreign subsidiaries. Those amounts are considered to be indefinitely reinvested; accordingly, no provision for U.S. federal and state income tax or for any potential foreign withholding taxes has been provided. Upon repatriation of those amounts, the Company would be subject to both U.S. income taxes and withholding tax payable to the various foreign countries. Determination of the amount of the unrecognized deferred tax liability is not practicable; however, unrecognized foreign tax credits may be available to reduce the U.S. liability.
The Company operated under a tax holiday in certain parts of Egypt through 2010.
In conjunction with the acquisition of PGS Onshore, PGS agreed to indemnify Geokinetics for taxes related to prior years and up to the purchase date. An indemnification receivable has been reflected in the Company's accounts receivable, which may be adjusted as the respective tax liabilities are settled.
Uncertainty in Income Taxes
A reconciliation of the change in the unrecognized tax benefits is as follows (in thousands):
| |
Year Ended December 31, | ||||||||||
|---|---|---|---|---|---|---|---|---|---|---|---|
| |
2010 | 2009 | 2008 | ||||||||
Balance at beginning of period |
$ | 7,233 | $ | — | $ | — | |||||
Increase for tax positions related to current year |
764 | 7,233 | — | ||||||||
Lapses in statues of limitations |
— | — | — | ||||||||
Balance at the end of the period |
$ | 7,997 | $ | 7,233 | $ | — | |||||
All additions or reductions to the above liability affect the Company's effective tax rate in the respective period of change. The Company accounts for any applicable interest and penalties on uncertain tax positions as a component of income tax expense which was $764 thousand for the year ended December 31, 2010. At December 31, 2010, the Company had $2.0 million of accrued interest related to unrealized tax benefits. The tax years that remain subject to examination by major tax jurisdictions are from 2004 to 2010.
NOTE 15: Related Party Transactions
Acquisition of PGS Onshore
In connection with the acquisition of PGS Onshore in February 2010, PGS acquired 2.2 million shares of our common stock (representing 12% of the outstanding shares of common stock) and appointed two persons to our board of directors, one of whom was an employee of PGS and the other was independent as defined by the NYSE Amex. Prior to the acquisition, PGS was not affiliated with
F-39
GEOKINETICS INC. AND SUBSIDIARIES
NOTES TO CONSOLIDATED FINANCIAL STATEMENTS (Continued)
NOTE 15: Related Party Transactions (Continued)
us. Following the acquisition, we entered into transactions that were contemplated by the purchase agreement for the acquisition of PGS Onshore. These transactions are summarized below:
Transition Services Agreement. In the transition services agreement, PGS agreed to provide us with office facilities, accounting, information, payroll and human resources following the closing. The services were provided through July 30, 2010 for a fee charged to us by PGS of $3.4 million.
Mexico Data Processing ("Mexico DP") Agreement. Our purchase of the onshore data acquisition business did not include PGS's data processing business in Mexico. In connection with the closing of the PGS Onshore acquisition, we entered into the Mexico Data Processing ("DP") DP Agreement with PGS, in which we agreed to operate data processing contracts in Mexico for PGS's benefit until such time as PGS could arrange for the required consents to the transfer of the contracts to a subsidiary of PGS. We agreed to provide PGS the benefits of these contracts, and PGS agreed to reimburse us for our costs to operate the contracts on PGS's behalf. We amended the Mexico DP Agreement several times during 2010 primarily to extend the term thereof. The contracts were transferred to a subsidiary of PGS in January 22, 2010. Under the Mexico DP Agreement, we spun-off the DP division by $2.1 million in equity, which includes $0.7 million in fixed assets and $0.1 million in cash equivalents.
Libya Agreement. In connection with the closing of the acquisition of PGS onshore, we entered into the Libya Agreement with PGS. In the Libya Agreement, PGS agreed to operate our seismic acquisition business in Libya for our benefit until we could complete the formation of a subsidiary in Libya and acquire the required licenses to own and operate the business in Libya. PGS agreed to provide us the benefits of the Libya seismic acquisition business and we agreed to reimburse PGS for the costs of operating the business for our benefit. We amended the Libya agreement several times in 2010 primarily to extend the term of the agreement. As of March 15, 2011, we have formed a subsidiary in Libya and acquired the licenses necessary to operate our business there, but the civil unrest in Libya has made transfer of the business to us impractical, and we have extended the Libya agreement.
Trinidad receivable. In connection with the closing of the acquisition of PGS Onshore, the parties prepared a closing balance sheet. In connection with the preparation of the closing balance sheet, we agreed with PGS that an account receivable from a company in Trinidad for approximately $1.7 million would be valued at 75% of the amount of the receivable, which resulted in an amount owed to us of $1.3 million. This balance is included in other accounts receivable.
December 2010 Preferred Stock and Warrant Issuance
During December 2010, we issued shares of junior preferred stock and warrants to purchase 3,495,000 shares of our common stock for an exercise price of $9.64 per share (subject to adjustment) for total consideration of $30 million. In connection with the issuance of these securities, the purchasers received a fee of 2% of the amount purchased which was recorded as deferred financing costs in the accompanying financial statements. The following table shows the number of shares of
F-40
GEOKINETICS INC. AND SUBSIDIARIES
NOTES TO CONSOLIDATED FINANCIAL STATEMENTS (Continued)
NOTE 15: Related Party Transactions (Continued)
preferred stock and warrants purchased by certain persons, and the fee paid to them in connection with such purchase:
Name
|
Preferred Stock | Warrants | Purchase Price Paid |
|||||||
|---|---|---|---|---|---|---|---|---|---|---|
Avista(1) |
64,000 | 1,864,000 | $ | 16,000,000 | ||||||
PGS(2) |
40,000 | 1,165,000 | $ | 10,000,000 | ||||||
Steven Webster |
7,000 | 203,875 | $ | 1,750,000 | ||||||
William R. Ziegler |
4,000 | 116,500 | $ | 1,000,000 | ||||||
Christopher Harte(3) |
1,000 | 29,125 | $ | 250,000 | ||||||
- (1)
- The
preferred stock and warrants were purchased by affiliates of Avista Capital Holdings, L.P., and the closing payment was made to Avista Capital Holdings,
L.P.
- (2)
- Includes
subsidiaries of PGS.
- (3)
- The shares were purchased by and fee paid to a family trust affiliated with Mr. Harte.
Mr. Webster is President and Co-Managing Partner of Avista Capital Holdings, L.P.
In addition, we agreed to register for resale with the SEC the common stock that may be purchased upon exercise of the warrants.
William R. Ziegler (non-executive Chairman of Board of Directors)
Mr. Ziegler is of counsel to the New York based law firm of Satterlee Stephens Burke & Burke, LLP. During the fiscal years ended December 31, 2010, 2009 and 2008, such firm billed the Company approximately $9,584, $12,614, and $56,400 respectively, for services rendered.
Other
During 2009, the Company received food, drink, and other catering services for its crews in one of its international locations from a company that was substantially owned by certain employees and former employees of the Company. For the year ended December 31, 2009 the Company paid approximately $3.3 million to this Company. The Company believes that all transactions were arms-length on terms at least as favorable as market rates. The Company stopped receiving services from this Company in the third quarter of 2009.
During 2010, the Company paid fees of approximately $0.5 million for freight broker services provided by Total Connection, a company owned and operated by the spouse of an employee of the Company. Additionally, during 2010, the Company paid fees of approximately $1.0 million for permitting services provided by Complete Geo Land Services, LLC, a company owned and operated by the spouse of an employee of the Company.
NOTE 16: Commitments and Contingencies
The Company is involved in various claims and legal actions arising in the ordinary course of business. With respect to an international labor claim, the Company received an adverse verdict from which its plans to appeal. The Company has recorded the amount of the verdict along with estimated legal expenses relating to various claims arising in the ordinary course of business. Management is of
F-41
GEOKINETICS INC. AND SUBSIDIARIES
NOTES TO CONSOLIDATED FINANCIAL STATEMENTS (Continued)
NOTE 16: Commitments and Contingencies (Continued)
the opinion that none of the claims and actions will have a material adverse impact on the Company's financial position, results of operations or cash flows.
At December 31, 2010, the Company has non-cancelable operating leases for office, warehouse space and equipment with remaining terms ranging from approximately one to six years. Aggregate future minimum lease payments under the various non-cancelable operating leases are as follows (in thousands):
For the Years Ending December 31,
|
|
|||
|---|---|---|---|---|
2011 |
$ | 13,220 | ||
2012 |
4,584 | |||
2013 |
3,424 | |||
2014 |
2,972 | |||
2015 |
1,379 | |||
Thereafter |
1,090 | |||
|
$ | 26,669 | ||
Rental expense in the consolidated financial statements amounted to approximately $69.5 million, $76.0 million and $81.4 million for the years ended December 31, 2010, 2009 and 2008, respectively.
NOTE 17: Significant Risks and Management's Plans
The liquidity of the Company should be considered in light of the cyclical nature of demand for land and transition zone seismic services. These fluctuations have impacted the Company's liquidity as supply and demand factors directly affect pricing.
Market
The Company's ability to meet its obligations depends on its future performance, which in turn is subject to general economic conditions, activity levels in the oil and gas exploration sector, and other factors beyond the Company's control. The Company's ability to sustain profitability in the future is dependent upon several factors, including but not limited to, the following:
Competition
The Company's products and services are highly competitive and characterized by continual changes in technology. Competitive pressures or other factors also may result in significant price competition that could have a material adverse effect on the Company's operations and financial condition.
Technology
Future technological advances could require the Company to make significant capital expenditures to remain competitive. The Company competes in a capital intensive industry. The development of seismic data acquisition equipment has been characterized by rapid technological advancements in recent years, and the Company expects this trend to continue.
F-42
GEOKINETICS INC. AND SUBSIDIARIES
NOTES TO CONSOLIDATED FINANCIAL STATEMENTS (Continued)
NOTE 17: Significant Risks and Management's Plans (Continued)
There can be no assurance that manufacturers of seismic equipment will not develop new systems that have competitive advantages over systems now in use that either render the Company's current equipment obsolete or require the Company to make significant capital expenditures to maintain its competitive position. There can be no assurance that the Company will have the capital necessary to upgrade its equipment to maintain its competitive position or that any required financing therefore will be available on favorable terms. If the Company is unable to raise the capital necessary to update its data acquisition systems to the extent necessary, it may be materially and adversely affected.
NOTE 18: Major Customers
The Company's largest customer in 2010 accounted for 10% of total revenue. The Company's two largest customers in 2009 accounted for 20% and 14% of total revenue, respectively. For the year ended December 31, 2008, no individual customer represented more than 10% of total revenue. For the years ended December 31, 2010, 2009 and 2008, revenue from the top three customers was approximately $138.0 million, $230.0 million, and $88.0 million, representing approximately 25%, 45% and 19% of total revenue, respectively.
In addition, at December 31, 2010, 1 customer, who accounted for 10% of the Company's revenues, accounted for 7% of total accounts receivable in aggregate. At December 31, 2009, two customers, each of who accounted for more than 10% of the Company's accounts receivable, accounted for 73% of total accounts receivable in aggregate. At December 31, 2008, one customer accounted for 19.7% of the Company's accounts receivable in aggregate.
NOTE 19: Concentration of Credit Risk
The Company's primary market risks include fluctuations in commodity prices which affect demand and pricing of services. All of the Company's customers are involved in the oil and natural gas industry, which exposes the Company to credit risk because our customers may be similarly affected by changes in economic and industry conditions. Further, the Company generally provides services and extends credit to a relatively small group of key customers that account for a significant percentage of accounts receivable of the Company at any given time. Due to the nature of the Company's contracts and customers' projects, the largest customers can change from year to year and the largest customers in any year may not be indicative of the largest customers in any subsequent year. If any key customers were to terminate their contracts or fail to contract for future services due to changes in ownership or business strategy or for any other reason, the Company's results of operations could be affected.
Accordingly, the Company performs ongoing customer credit evaluations and maintains allowances for possible losses. Write offs charged against the allowance for bad debt have not exceeded 1.0% of total sales for the years ended December 31 2010, 2009, and 2008. Management believes the unreserved accounts receivables at December 31, 2010, of $103.8 million are collectible and the allowance for doubtful accounts of $2.5 million is adequate.
The Company has cash in banks and short-term investments, including restricted cash, which, at times, may exceed federally insured limits, established in the United States and foreign countries. The Company has not experienced any losses in such accounts and management believes it is not exposed to any significant credit risk on cash and short-term investments.
The Company conducts operations outside the United States in both its seismic data acquisition and data processing segments. These operations expose the Company to market risks from changes in foreign exchange rates. However, to date, the level of activity has not been of a material nature.
F-43
GEOKINETICS INC. AND SUBSIDIARIES
NOTES TO CONSOLIDATED FINANCIAL STATEMENTS (Continued)
NOTE 20: Unaudited Quarterly Financial Data
Summarized quarterly financial data for the years ended December 31, 2010 and 2009 are as follows (in thousands, except per share data):
| |
Quarter Ended | ||||||||||||
|---|---|---|---|---|---|---|---|---|---|---|---|---|---|
2010
|
March 31 | June 30 | September 30 | December 31 | |||||||||
Total revenue |
$ | 105,748 | $ | 119,548 | $ | 134,020 | $ | 198,818 | |||||
Loss from operations |
$ | (18,208 | ) | $ | (29,039 | ) | $ | (25,603 | ) | $ | (19,206 | ) | |
Change in fair value of derivative liabilities |
(1,107 | ) | (3,715 | ) | (3,454 | ) | 1,861 | ||||||
Interest income, interest expense and other, net |
$ | (10,005 | ) | $ | (9,014 | ) | $ | (9,560 | ) | $ | (9,248 | ) | |
Net loss |
$ | (28,759 | ) | $ | (37,789 | ) | $ | (36,249 | ) | $ | (35,887 | ) | |
Loss applicable to common stockholders |
$ | (31,151 | ) | $ | (39,605 | ) | $ | (38,566 | ) | $ | (38,212 | ) | |
Loss per common share: |
|||||||||||||
Basic |
$ | (1.84 | ) | $ | (2.24 | ) | $ | (2.18 | ) | $ | (2.15 | ) | |
Diluted |
$ | (1.84 | ) | $ | (2.24 | ) | $ | (2.18 | ) | $ | (2.15 | ) | |
Weighted average common shares outstanding: |
|||||||||||||
Basic |
16,915 | 17,679 | 17,698 | 17,746 | |||||||||
Diluted |
16,915 | 17,679 | 17,698 | 17,746 | |||||||||
| |
Quarter Ended | ||||||||||||
|---|---|---|---|---|---|---|---|---|---|---|---|---|---|
2009
|
March 31 | June 30 | September 30 | December 31 | |||||||||
Total revenue |
$ | 146,919 | $ | 144,840 | $ | 96,849 | $ | 122,358 | |||||
Income (loss) from operations |
$ | 12,693 | $ | 16,343 | $ | (1,290 | ) | $ | (1,419 | ) | |||
Change in fair value of derivative liabilities |
$ | (470 | ) | $ | (4,159 | ) | $ | (4,999 | ) | $ | 2,304 | ||
Interest income, interest expense and other, net |
$ | (1,477 | ) | $ | (1,617 | ) | $ | (1,232 | ) | $ | (4,553 | ) | |
Net income (loss) |
$ | 5,516 | $ | (776 | ) | $ | (7,738 | ) | $ | (9,338 | ) | ||
Income (loss) applicable to common stockholders |
$ | 3,137 | $ | (3,195 | ) | $ | (10,201 | ) | $ | (23,867 | ) | ||
Income (loss) per common share: |
|||||||||||||
Basic |
$ | 0.30 | $ | (0.30 | ) | $ | (0.95 | ) | $ | (2.07 | ) | ||
Diluted |
$ | 0.30 | $ | (0.30 | ) | $ | (0.95 | ) | $ | (2.07 | ) | ||
Weighted average common shares outstanding: |
|||||||||||||
Basic |
10,470 | 10,579 | 10,776 | 11,547 | |||||||||
Diluted |
10,576 | 10,579 | 10,776 | 11,547 | |||||||||
NOTE 21: Condensed Consolidating Financial Information
The $300 million Senior Secured Notes due 2014 are fully and unconditionally guaranteed, jointly and severally, by the Company, and by each of the Company's current and future domestic subsidiaries (other than Geokinetics Holdings, USA, Inc., which is the issuer of the Notes). The non-guarantor subsidiaries consist of all subsidiaries and branches outside of the United States. Separate condensed consolidating financial statement information for the parent, guarantor subsidiaries and non-guarantor
F-44
GEOKINETICS INC. AND SUBSIDIARIES
NOTES TO CONSOLIDATED FINANCIAL STATEMENTS (Continued)
NOTE 21: Condensed Consolidating Financial Information (Continued)
subsidiaries as of December 31, 2010 and 2009 and for the years ended December 31, 2010, 2009 and 2008 is as follows (in thousands):
| |
BALANCE SHEET December 31, 2010 |
||||||||||||||||||
|---|---|---|---|---|---|---|---|---|---|---|---|---|---|---|---|---|---|---|---|
| |
Guarantor Parent Company |
Issuer Subsidiary |
Guarantor Subsidiaries |
Non- Guarantor Subsidiaries |
Eliminations | Consolidated | |||||||||||||
Assets |
|||||||||||||||||||
Current assets |
$ | 10,819 | $ | — | $ | 71,935 | $ | 169,931 | $ | — | $ | 252,685 | |||||||
Property and equipment, net |
23,408 | — | 220,817 | 22,179 | — | 266,404 | |||||||||||||
Investment in subsidiaries |
174,526 | 377,363 | 48,185 | 370 | (600,444 | ) | — | ||||||||||||
Intercompany accounts |
32,710 | 90,479 | (76,348 | ) | (53,108 | ) | 6,267 | — | |||||||||||
Other non-current assets |
469 | 10,571 | 206,465 | 33,654 | (45,084 | ) | 206,075 | ||||||||||||
Total assets |
$ | 241,932 | $ | 478,413 | $ | 471,054 | $ | 173,026 | $ | (639,261 | ) | $ | 725,164 | ||||||
Liabilities, Mezzanine and Stockholders' Equity |
|||||||||||||||||||
Current liabilities |
$ | 34,675 | $ | 1,566 | $ | 58,300 | $ | 113,279 | $ | 459 | $ | 208,279 | |||||||
Long-term debt and capital lease obligations, net of current portion |
— | 318,471 | — | 813 | — | 319,284 | |||||||||||||
Deferred Income tax and other non-current liabilities |
28,530 | — | 30,558 | 3,468 | — | 62,556 | |||||||||||||
Derivative liabilities |
38,271 | — | — | — | — | 38,271 | |||||||||||||
Total liabilities |
101,476 | 320,037 | 88,858 | 117,560 | 459 | 628,390 | |||||||||||||
Mezzanine equity |
74,987 | — | — | — | — | 74,987 | |||||||||||||
Stockholders' equity |
65,469 | 158,376 | 382,196 | 55,466 | (639,720 | ) | 21,787 | ||||||||||||
Total liabilities, mezzanine and stockholders' equity |
$ | 241,932 | $ | 478,413 | $ | 471,054 | $ | 173,026 | $ | (639,261 | ) | $ | 725,164 | ||||||
F-45
GEOKINETICS INC. AND SUBSIDIARIES
NOTES TO CONSOLIDATED FINANCIAL STATEMENTS (Continued)
NOTE 21: Condensed Consolidating Financial Information (Continued)
| |
BALANCE SHEET December 31, 2009 |
||||||||||||||||||
|---|---|---|---|---|---|---|---|---|---|---|---|---|---|---|---|---|---|---|---|
| |
Guarantor Parent Company |
Issuer Subsidiary |
Guarantor Subsidiaries |
Non- Guarantor Subsidiaries |
Eliminations | Consolidated | |||||||||||||
Assets |
|||||||||||||||||||
Current assets |
$ | 5,117 | $ | 119,893 | $ | 15,237 | $ | 160,562 | $ | — | $ | 300,809 | |||||||
Property and equipment, net |
21,354 | — | 158,949 | 7,530 | — | 187,833 | |||||||||||||
Investment in subsidiaries |
140,139 | 174,526 | 109,182 | (2 | ) | (423,845 | ) | — | |||||||||||
Intercompany accounts |
195,976 | (17,349 | ) | (88,815 | ) | (89,820 | ) | 8 | — | ||||||||||
Other non-current assets |
2,985 | 191,745 | 76,121 | 12,197 | — | 283,048 | |||||||||||||
Total assets |
$ | 365,571 | $ | 468,815 | $ | 270,674 | $ | 90,467 | $ | (423,837 | ) | $ | 771,690 | ||||||
Liabilities, Mezzanine and Stockholders' Equity |
|||||||||||||||||||
Current liabilities |
$ | 110,635 | $ | 731 | $ | 15,479 | $ | 88,031 | $ | — | $ | 214,876 | |||||||
Long-term debt and capital lease obligations, net of current portion |
32,104 | 294,279 | — | 2,322 | — | 328,705 | |||||||||||||
Deferred Income tax and other non-current liabilities |
(6,722 | ) | — | 10,932 | 2,276 | — | 6,486 | ||||||||||||
Derivative liabilities |
9,317 | — | — | — | 9,317 | ||||||||||||||
Total liabilities |
145,334 | 295,010 | 26,411 | 92,629 | — | 559,384 | |||||||||||||
Mezzanine equity |
66,976 | — | — | — | — | 66,976 | |||||||||||||
Stockholders' equity |
153,261 | 173,805 | 244,263 | (2,162 | ) | (423,837 | ) | 145,330 | |||||||||||
Total liabilities, mezzanine and stockholders' equity |
$ | 365,571 | $ | 468,815 | $ | 270,674 | $ | 90,467 | $ | (423,837 | ) | $ | 771,690 | ||||||
F-46
GEOKINETICS INC. AND SUBSIDIARIES
NOTES TO CONSOLIDATED FINANCIAL STATEMENTS (Continued)
NOTE 21: Condensed Consolidating Financial Information (Continued)
| |
STATEMENT OF OPERATIONS Year Ended December 31, 2010 |
|||||||||||||||||||
|---|---|---|---|---|---|---|---|---|---|---|---|---|---|---|---|---|---|---|---|---|
| |
Guarantor Parent Company |
Issuer Subsidiary |
Guarantor Subsidiaries |
Non- Guarantor Subsidiaries |
Eliminations | Consolidated | ||||||||||||||
Total revenue |
$ | 328 | $ | — | $ | 236,697 | $ | 374,214 | $ | (53,105 | ) | $ | 558,134 | |||||||
Equity in earnings of subsidiaries |
(120,228 | ) | — | (46,478 | ) | (17,221 | ) | 183,927 | — | |||||||||||
Expenses: |
||||||||||||||||||||
Seismic acquisition and data processing |
(2,000 | ) | — | 132,130 | 377,168 | (53,105 | ) | 454,193 | ||||||||||||
Depreciation and amortization |
4,908 | — | 98,900 | 9,089 | — | 112,897 | ||||||||||||||
General and administrative |
5,893 | 1,565 | 21,057 | 52,675 | — | 81,190 | ||||||||||||||
Total expenses |
8,801 | 1,565 | 252,087 | 438,932 | (53,105 | ) | 648,280 | |||||||||||||
Loss on disposal of property and equipment |
— | — | (2,585 | ) | 675 | — | (1,910 | ) | ||||||||||||
Loss from operations |
(128,701 | ) | (1,565 | ) | (64,453 | ) | (81,264 | ) | 183,927 | (92,056 | ) | |||||||||
Interest income (expense), net |
(6,033 | ) | (33,494 | ) | 188 | 1,512 | — | (37,827 | ) | |||||||||||
Other income (expenses), net |
(9,043 | ) | 208 | 1,852 | 2,992 | — | (3,991 | ) | ||||||||||||
Loss before income taxes |
(143,777 | ) | (34,851 | ) | (62,413 | ) | (76,760 | ) | 183,927 | (133,874 | ) | |||||||||
Provision for income taxes |
(5,093 | ) | 14 | 145 | 9,744 | — | 4,810 | |||||||||||||
Net loss |
$ | (138,684 | ) | $ | (34,865 | ) | $ | (62,558 | ) | $ | (86,504 | ) | $ | 183,927 | $ | (138,684 | ) | |||
| |
STATEMENT OF CASH FLOWS Year Ended December 31, 2010 |
||||||||||||||||||
|---|---|---|---|---|---|---|---|---|---|---|---|---|---|---|---|---|---|---|---|
| |
Guarantor Parent Company |
Issuer Subsidiary |
Guarantor Subsidiaries |
Non- Guarantor Subsidiaries |
Eliminations | Consolidated | |||||||||||||
Net cash provided by (used in) operating activities |
$ | (12,630 | ) | $ | (15,513 | ) | $ | 53,564 | $ | 6,115 | $ | — | $ | 31,536 | |||||
Net cash provided (used in) investing activities |
(184,818 | ) | 122,971 | (78,166 | ) | (20,116 | ) | 180,832 | 20,703 | ||||||||||
Net cash used in financing activities |
(19,497 | ) | — | — | (67 | ) | — | (19,564 | ) | ||||||||||
Net increase (decrease) in cash |
$ | (216,945 | ) | $ | 107,458 | $ | (24,602 | ) | $ | (14,068 | ) | $ | 180,832 | $ | 32,675 | ||||
F-47
GEOKINETICS INC. AND SUBSIDIARIES
NOTES TO CONSOLIDATED FINANCIAL STATEMENTS (Continued)
NOTE 21: Condensed Consolidating Financial Information (Continued)
| |
STATEMENT OF OPERATIONS Year Ended December 31, 2009 |
|||||||||||||||||||
|---|---|---|---|---|---|---|---|---|---|---|---|---|---|---|---|---|---|---|---|---|
| |
Guarantor Parent Company |
Issuer Subsidiary |
Guarantor Subsidiaries |
Non- Guarantor Subsidiaries |
Eliminations | Consolidated | ||||||||||||||
Total revenue |
$ | — | $ | — | $ | 120,367 | $ | 445,945 | $ | (55,346 | ) | $ | 510,966 | |||||||
Equity in earnings of subsidiaries |
22,673 | — | 38,087 | — | (60,760 | ) | — | |||||||||||||
Expenses: |
||||||||||||||||||||
Seismic acquisition and data processing |
9,940 | — | 60,923 | 365,576 | (66,273 | ) | 370,166 | |||||||||||||
Depreciation and amortization |
3,038 | — | 41,983 | 11,900 | — | 56,921 | ||||||||||||||
General and administrative |
10,737 | — | 9,417 | 33,637 | — | 53,791 | ||||||||||||||
Total expenses |
23,715 | — | 112,323 | 411,113 | (66,273 | ) | 480,878 | |||||||||||||
Loss on disposal of property and equipment |
(1 | ) | — | 314 | 3,446 | — | 3,759 | |||||||||||||
Income (loss) from operations |
(1,041 | ) | — | 45,817 | 31,386 | (49,833 | ) | 26,329 | ||||||||||||
Interest income (expense), net |
(5,201 | ) | (717 | ) | (179 | ) | 126 | — | (5,971 | ) | ||||||||||
Other income (expense), net |
(10,310 | ) | — | (3,034 | ) | 3,903 | — | (9,441 | ) | |||||||||||
Income (loss) before income taxes |
(16,552 | ) | (717 | ) | 42,604 | 35,415 | (49,833 | ) | 10,917 | |||||||||||
Provision for income taxes |
(12,149 | ) | 4 | — | 35,397 | — | 23,252 | |||||||||||||
Net income (loss) |
$ | (4,403 | ) | $ | (721 | ) | $ | 42,604 | $ | 18 | $ | (49,833 | ) | $ | (12,335 | ) | ||||
| |
STATEMENT OF CASH FLOWS Year Ended December 31, 2009 |
||||||||||||||||||
|---|---|---|---|---|---|---|---|---|---|---|---|---|---|---|---|---|---|---|---|
| |
Guarantor Parent Company |
Issuer Subsidiary |
Guarantor Subsidiaries |
Non- Guarantor Subsidiaries |
Eliminations | Consolidated | |||||||||||||
Net cash provided by (used in) operating activities |
$ | 73,813 | $ | 8,556 | $ | 7,479 | $ | (36,589 | ) | $ | — | $ | 53,259 | ||||||
Net cash provided (used in) investing activities |
(12,218 | ) | (303,803 | ) | (35,129 | ) | 2,135 | — | (349,015 | ) | |||||||||
Net cash provided (used in) financing activities |
297,661 | — | (9,002 | ) | 3,932 | — | 292,591 | ||||||||||||
Net increase (decrease) in cash |
$ | 359,256 | $ | (295,247 | ) | $ | (36,652 | ) | $ | (30,522 | ) | $ | — | $ | (3,165 | ) | |||
F-48
GEOKINETICS INC. AND SUBSIDIARIES
NOTES TO CONSOLIDATED FINANCIAL STATEMENTS (Continued)
NOTE 21: Condensed Consolidating Financial Information (Continued)