Attached files
| file | filename |
|---|---|
| 8-K - 8-K - KAPSTONE PAPER & PACKAGING CORP | a10-12776_28k.htm |
| EX-99.1 - EX-99.1 - KAPSTONE PAPER & PACKAGING CORP | a10-12776_2ex99d1.htm |
Exhibit 99.2
|
|
Second Quarter 2010 Review August 4, 2010 Roger W. Stone Chairman and Chief Executive Officer Andrea K. Tarbox Vice President and Chief Financial Officer |
|
|
KapStone 2 Forward Looking Statements The information in this presentation and statements made during this presentation may contain certain forward-looking statements within the meaning of federal securities laws. These statements reflect management’s expectations regarding future events and operating performance. These forward-looking statements involve a number of risks and uncertainties. A list of the factors that could cause actual results to differ materially from those expressed in, or underlying, any forward-looking statements can be found in the Company’s filings with the Securities and Exchange Commission, such as its annual and quarterly reports. The Company disclaims any obligation to revise or update such statements to reflect the occurrence of events after the date of this presentation. |
|
|
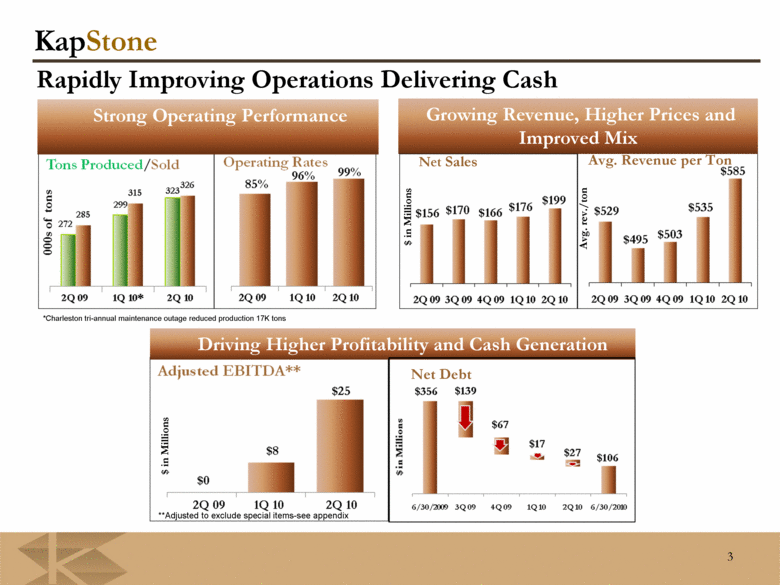
KapStone 3 Rapidly Improving Operations Delivering Cash Avg. Revenue per Ton **Adjusted to exclude special items-see appendix *Charleston tri-annual maintenance outage reduced production 17K tons Strong Operating Performance Growing Revenue, Higher Prices and Improved Mix Driving Higher Profitability and Cash Generation $ in Millions Net Debt $ in Millions Avg. Rev./Ton Net Sales |
|
|
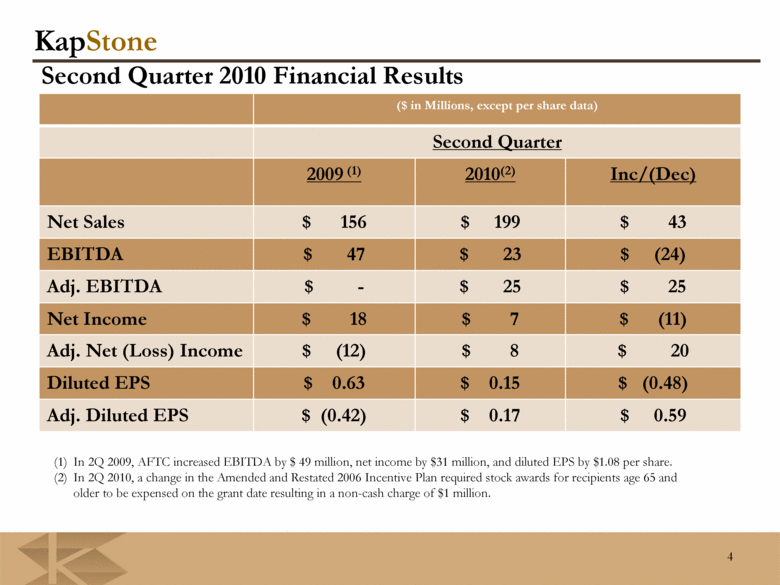
KapStone ($ in Millions, except per share data) Second Quarter 2009 (1) 2010(2) Inc/(Dec) Net Sales $ 156 $ 199 $ 43 EBITDA $ 47 $ 23 $ (24) Adj. EBITDA $ - $ 25 $ 25 Net Income $ 18 $ 7 $ (11) Adj. Net (Loss) Income $ (12) $ 8 $ 20 Diluted EPS $ 0.63 $ 0.15 $ (0.48) Adj. Diluted EPS $ (0.42) $ 0.17 $ 0.59 4 Second Quarter 2010 Financial Results (1) In 2Q 2009, AFTC increased EBITDA by $ 49 million, net income by $31 million, and diluted EPS by $1.08 per share. (2) In 2Q 2010, a change in the Amended and Restated 2006 Incentive Plan required stock awards for recipients age 65 and older to be expensed on the grant date resulting in a non-cash charge of $1 million. |
|
|
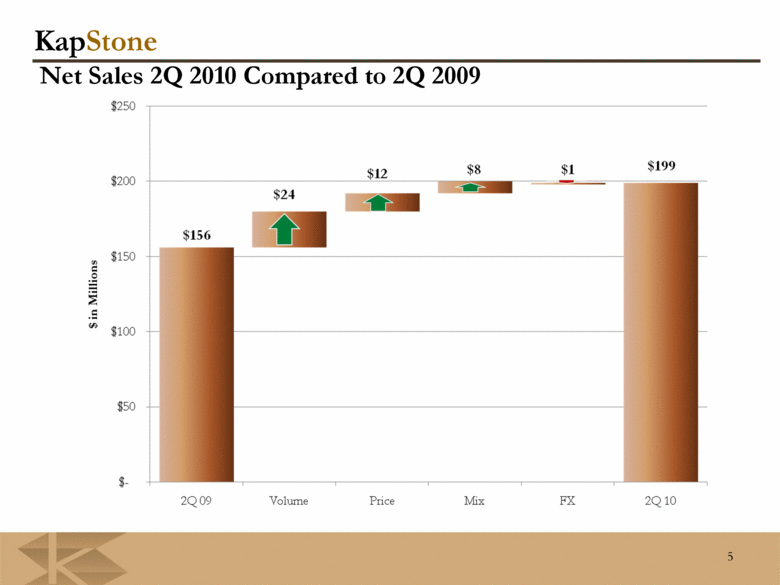
KapStone 5 Net Sales 2Q 2010 Compared to 2Q 2009 |
|
|
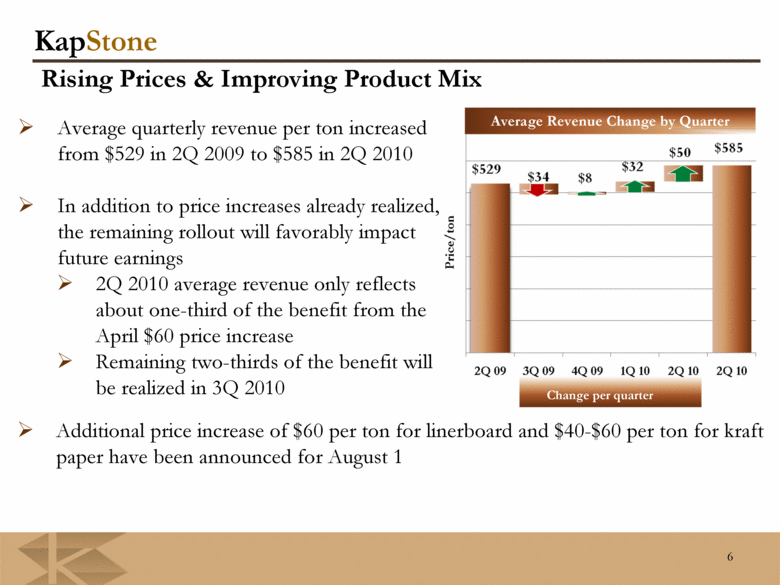
KapStone 6 .. Additional price increase of $60 per ton for linerboard and $40-$60 per ton for kraft paper have been announced for August 1 .. Average quarterly revenue per ton increased from $529 in 2Q 2009 to $585 in 2Q 2010 .. In addition to price increases already realized, the remaining rollout will favorably impact future earnings .. 2Q 2010 average revenue only reflects about one-third of the benefit from the April $60 price increase .. Remaining two-thirds of the benefit will be realized in 3Q 2010 Average Revenue Change by Quarter Change per quarter Rising Prices & Improving Product Mix |
|
|
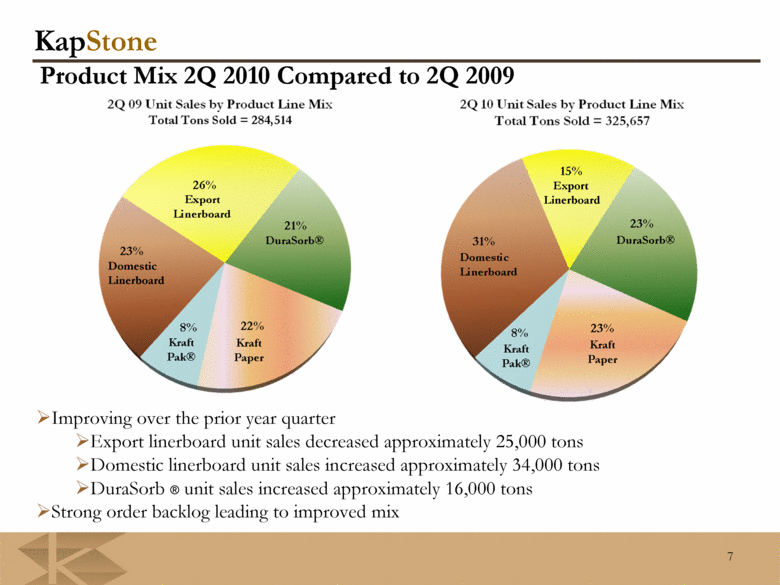
KapStone 7 Product Mix 2Q 2010 Compared to 2Q 2009 ..Improving over the prior year quarter ..Export linerboard unit sales decreased approximately 25,000 tons ..Domestic linerboard unit sales increased approximately 34,000 tons ..DuraSorb ® unit sales increased approximately 16,000 tons ..Strong order backlog leading to improved mix Domestic Linerboard Export Linerboard |
|
|
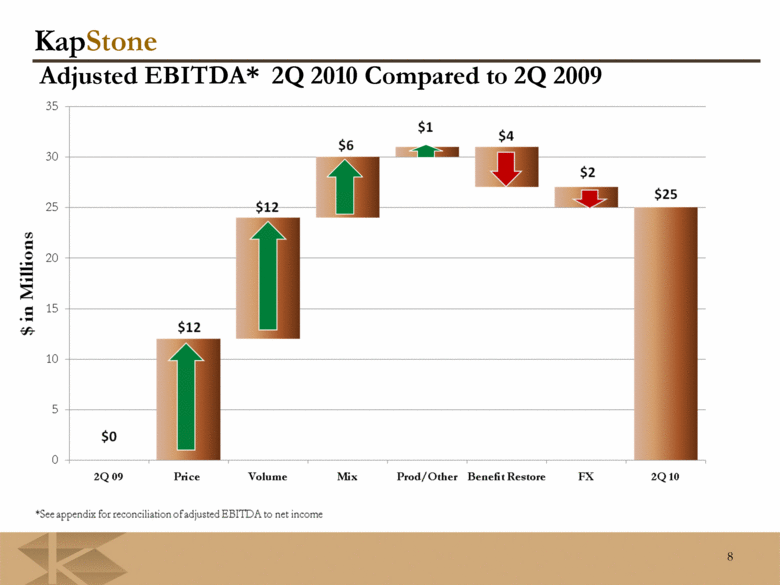
KapStone 8 Adjusted EBITDA* 2Q 2010 Compared to 2Q 2009 |
|
|
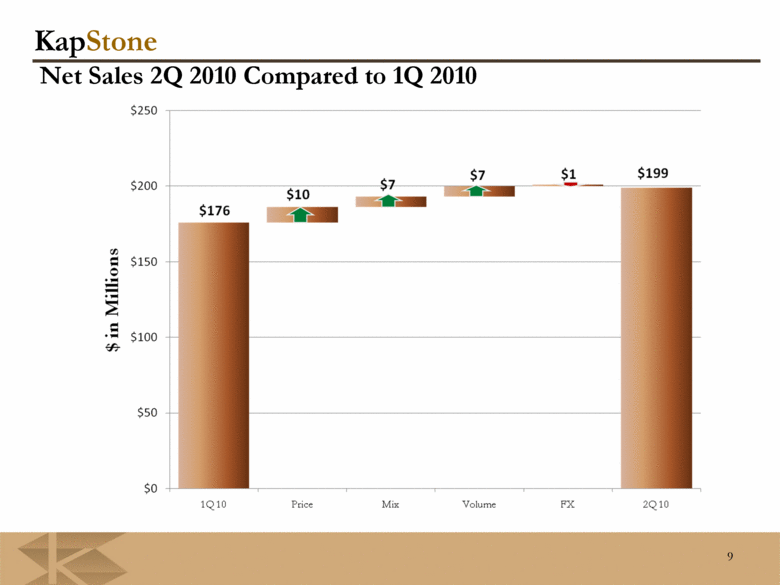
KapStone 9 Net Sales 2Q 2010 Compared to 1Q 2010 |
|
|
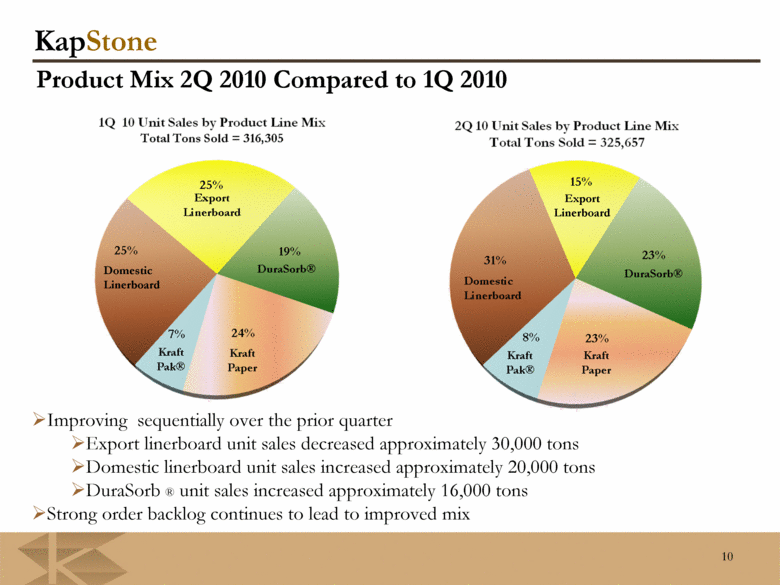
KapStone 10 Product Mix 2Q 2010 Compared to 1Q 2010 ..Improving sequentially over the prior quarter ..Export linerboard unit sales decreased approximately 30,000 tons ..Domestic linerboard unit sales increased approximately 20,000 tons ..DuraSorb ® unit sales increased approximately 16,000 tons ..Strong order backlog continues to lead to improved mix Domestic Linerboard Export Linerboard |
|
|
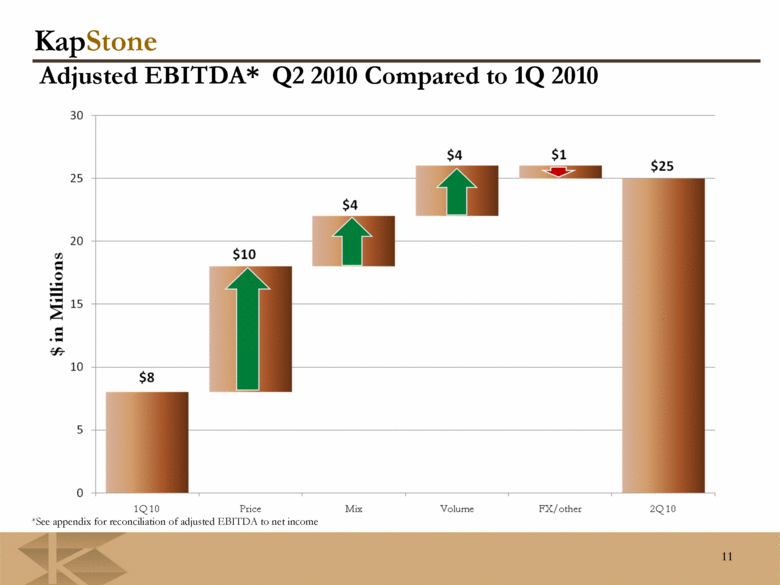
KapStone 11 Adjusted EBITDA* Q2 2010 Compared to 1Q 2010 *See appendix for reconciliation of adjusted EBITDA to net income |
|
|
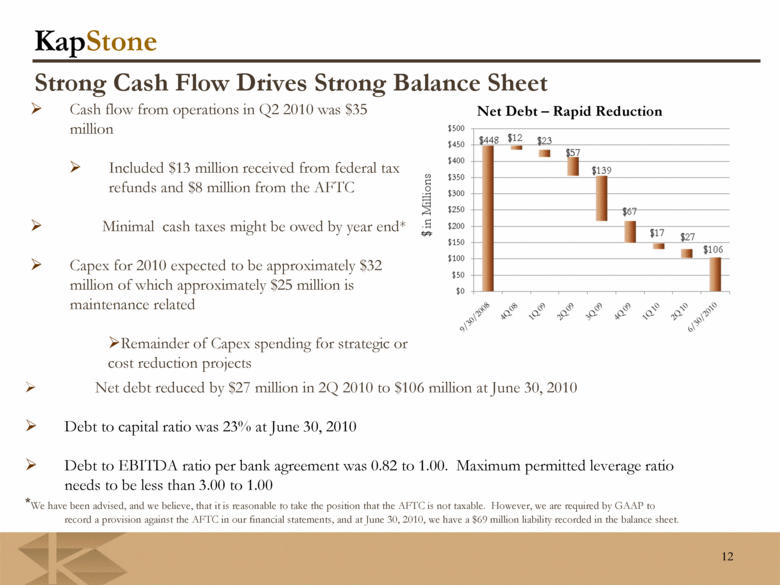
KapStone 12 .. Cash flow from operations in Q2 2010 was $35 million .. Included $13 million received from federal tax refunds and $8 million from the AFTC .. Minimal cash taxes might be owed by year end* .. Capex for 2010 expected to be approximately $32 million of which approximately $25 million is maintenance related ..Remainder of Capex spending for strategic or cost reduction projects Strong Cash Flow Drives Strong Balance Sheet Net Debt – Rapid Reduction .. Net debt reduced by $27 million in 2Q 2010 to $106 million at June 30, 2010 .. Debt to capital ratio was 23% at June 30, 2010 .. Debt to EBITDA ratio per bank agreement was 0.82 to 1.00. Maximum permitted leverage ratio needs to be less than 3.00 to 1.00 *We have been advised, and we believe, that it is reasonable to take the position that the AFTC is not taxable. However, we are required by GAAP to record a provision against the AFTC in our financial statements, and at June 30, 2010, we have a $69 million liability recorded in the balance sheet. |
|
|
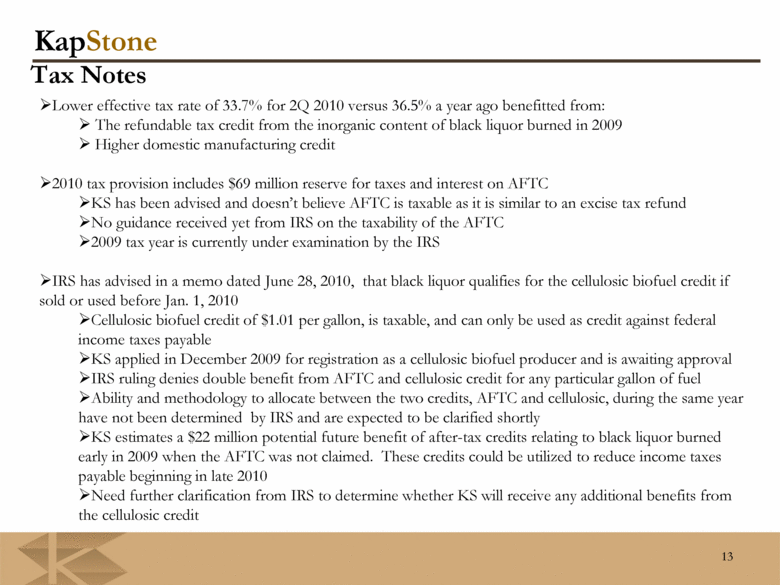
KapStone ..Lower effective tax rate of 33.7% for 2Q 2010 versus 36.5% a year ago benefitted from: .. The refundable tax credit from the inorganic content of black liquor burned in 2009 .. Higher domestic manufacturing credit ..2010 tax provision includes $69 million reserve for taxes and interest on AFTC ..KS has been advised and doesn’t believe AFTC is taxable as it is similar to an excise tax refund ..No guidance received yet from IRS on the taxability of the AFTC ..2009 tax year is currently under examination by the IRS ..IRS has advised in a memo dated June 28, 2010, that black liquor qualifies for the cellulosic biofuel credit if sold or used before Jan. 1, 2010 ..Cellulosic biofuel credit of $1.01 per gallon, is taxable, and can only be used as credit against federal income taxes payable ..KS applied in December 2009 for registration as a cellulosic biofuel producer and is awaiting approval ..IRS ruling denies double benefit from AFTC and cellulosic credit for any particular gallon of fuel ..Ability and methodology to allocate between the two credits, AFTC and cellulosic, during the same year have not been determined by IRS and are expected to be clarified shortly ..KS estimates a $22 million potential future benefit of after-tax credits relating to black liquor burned early in 2009 when the AFTC was not claimed. These credits could be utilized to reduce income taxes payable beginning in late 2010 ..Need further clarification from IRS to determine whether KS will receive any additional benefits from the cellulosic credit 13 Tax Notes |
|
|
Appendix |
|
|
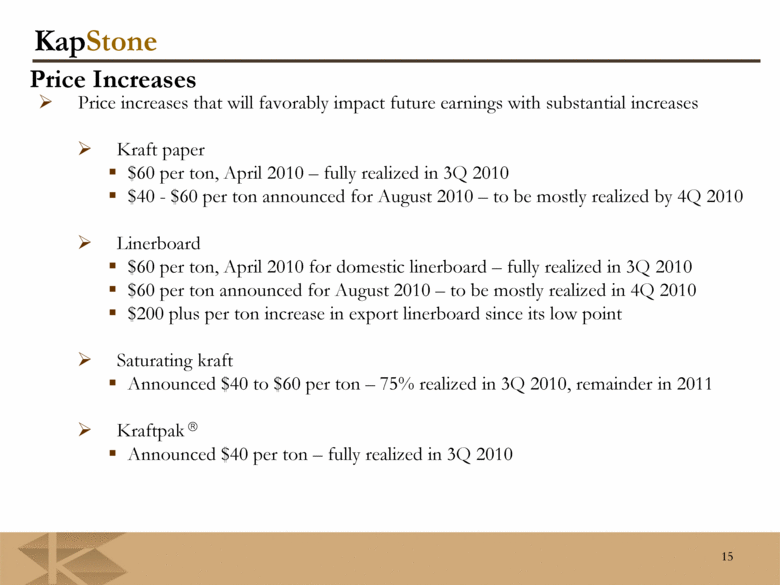
KapStone 15 Price Increases .. Price increases that will favorably impact future earnings with substantial increases .. Kraft paper .. $60 per ton, April 2010 – fully realized in 3Q 2010 .. $40 - $60 per ton announced for August 2010 – to be mostly realized by 4Q 2010 .. Linerboard .. $60 per ton, April 2010 for domestic linerboard – fully realized in 3Q 2010 .. $60 per ton announced for August 2010 – to be mostly realized in 4Q 2010 .. $200 plus per ton increase in export linerboard since its low point .. Saturating kraft .. Announced $40 to $60 per ton – 75% realized in 3Q 2010, remainder in 2011 .. Kraftpak ® .. Announced $40 per ton – fully realized in 3Q 2010 |
|
|
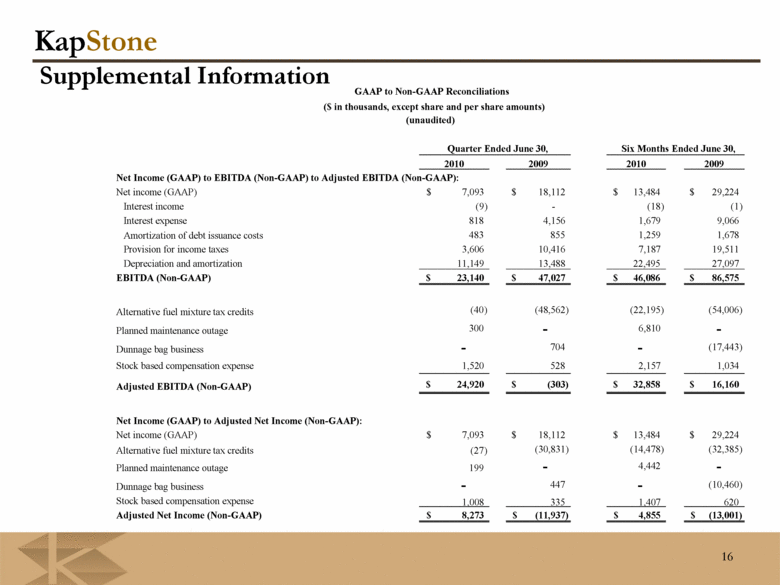
KapStone 16 Supplemental Information 2010 2009 2010 2009 Net Income (GAAP) to EBITDA (Non-GAAP) to Adjusted EBITDA (Non-GAAP): Net income (GAAP) 7,093 $ 18,112 $ 13,484 $ 29,224 $ Interest income (9) - (18) (1) Interest expense 818 4,156 1,679 9,066 Amortization of debt issuance costs 483 855 1,259 1,678 Provision for income taxes 3,606 10,416 7,187 19,511 Depreciation and amortization 11,149 13,488 22,495 27,097 EBITDA (Non-GAAP) 23,140 $ 47,027 $ 46,086 $ 86,575 $ Alternative fuel mixture tax credits (40) (48,562) (22,195) (54,006) Planned maintenance outage 300 - 6,810 - Dunnage bag business - 704 - (17,443) Stock based compensation expense 1,520 528 2,157 1,034 Adjusted EBITDA (Non-GAAP) 24,920 $ (303) $ 32,858 $ 16,160 $ Net Income (GAAP) to Adjusted Net Income (Non-GAAP): Net income (GAAP) 7,093 $ 18,112 $ 13,484 $ 29,224 $ Alternative fuel mixture tax credits (27) (30,831) (14,478) (32,385) Planned maintenance outage 199 - 4,442 - Dunnage bag business - 447 - (10,460) Stock based compensation expense 1,008 335 1,407 620 Adjusted Net Income (Non-GAAP) 8,273 $ (11,937) $ 4,855 $ (13,001) $ Six Months Ended June 30, GAAP to Non-GAAP Reconciliations ($ in thousands, except share and per share amounts) (unaudited) Quarter Ended June 30, |
|
|
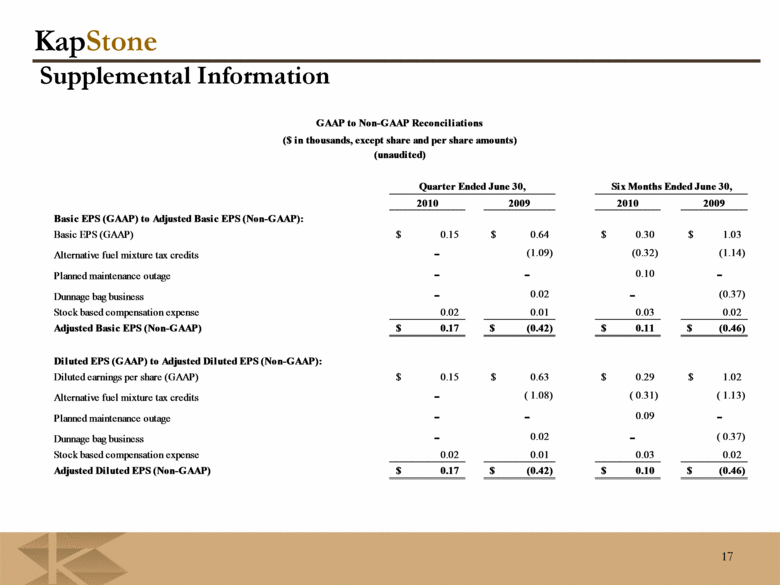
KapStone 17 Supplemental Information 2010 2009 2010 2009 Basic EPS (GAAP) to Adjusted Basic EPS (Non-GAAP): Basic EPS (GAAP) 0.15 $ 0.64 $ 0.30 $ 1.03 $ Alternative fuel mixture tax credits - (1.09) (0.32) (1.14) Planned maintenance outage - - 0.10 - Dunnage bag business - 0.02 - (0.37) Stock based compensation expense 0.02 0.01 0.03 0.02 Adjusted Basic EPS (Non-GAAP) 0.17 $ (0.42) $ 0.11 $ (0.46) $ Diluted EPS (GAAP) to Adjusted Diluted EPS (Non-GAAP): Diluted earnings per share (GAAP) 0.15 $ 0.63 $ 0.29 $ 1.02 $ Alternative fuel mixture tax credits - ( 1.08) ( 0.31) ( 1.13) Planned maintenance outage - - 0.09 - Dunnage bag business - 0.02 - ( 0.37) Stock based compensation expense 0.02 0.01 0.03 0.02 Adjusted Diluted EPS (Non-GAAP) 0.17 $ (0.42) $ 0.10 $ (0.46) $ Six Months Ended June 30, GAAP to Non-GAAP Reconciliations ($ in thousands, except share and per share amounts) (unaudited) Quarter Ended June 30, |

