Attached files
| file | filename |
|---|---|
| 8-K - FORM 8-K - LegacyTexas Financial Group, Inc. | c03777e8vk.htm |

| 1 NASDAQ: VPFG/VPFGD Gary Base - President and Chief Executive Officer Patti McKee - Executive Vice President and Chief Financial Officer Mark Hord- Executive Vice President and General Counsel EXHIBIT 99.1 |
| 2 Safe Harbor Statement When used in filings by ViewPoint Financial Group or ViewPoint Financial Group, Inc. (together, the "Company") with the Securities and Exchange Commission (the "SEC") in the Company's press releases or other public or shareholder communications, and in oral statements made with the approval of an authorized executive officer, the words or phrases "will likely result," "are expected to," "will continue," "is anticipated," "estimate," "project," "intends" or similar expressions are intended to identify "forward-looking statements" within the meaning of the Private Securities Litigation Reform Act of 1995. Such statements are subject to certain risks and uncertainties, including, among other things, changes in economic conditions, legislative changes, changes in policies by regulatory agencies, fluctuations in interest rates, the risks of lending and investing activities, including changes in the level and direction of loan delinquencies and write-offs and changes in estimates of the adequacy of the allowance for loan losses, the Company's ability to access cost-effective funding, fluctuations in real estate values and both residential and commercial real estate market conditions, demand for loans and deposits in the Company's market area, competition, changes in management's business strategies and other factors set forth under Risk Factors in our Form 10-K and Form 10-Q for the quarter ended June 30, 2010, that could cause actual results to differ materially from historical earnings and those presently anticipated or projected. The Company wishes to advise readers that the factors listed above could materially affect the Company's financial performance and could cause the Company's actual results for future periods to differ materially from any opinions or statements expressed with respect to future periods in any current statements. The Company does not undertake - and specifically declines any obligation - to publicly release the result of any revisions which may be made to any forward-looking statements to reflect events or circumstances after the date of such statements or to reflect the occurrence of anticipated or unanticipated events. |
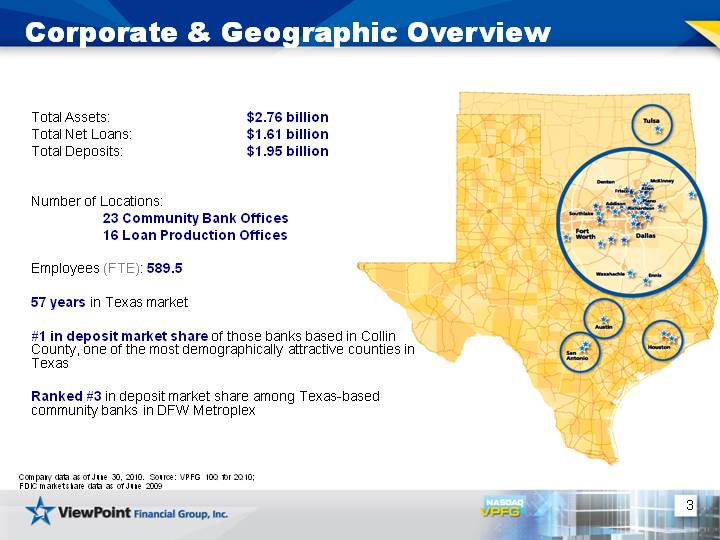
| 3 Total Assets: $2.76 billion Total Net Loans: $1.61 billion Total Deposits: $1.95 billion Number of Locations: 23 Community Bank Offices 16 Loan Production Offices Employees (FTE): 589.5 57 years in Texas market #1 in deposit market share of those banks based in Collin County, one of the most demographically attractive counties in Texas Ranked #3 in deposit market share among Texas-based community banks in DFW Metroplex Corporate & Geographic Overview Company data as of June 30, 2010. Source: VPFG 10Q for 2Q10; FDIC market share data as of June 2009 |
| 4 Completion of Conversion and Offering Successfully Completed Second Step Offering on July 6, 2010: Gross proceeds totaled $198.6 million 92.8% of book value and 1.40 exchange ratio Sold 19,857,337 shares at purchase price of $10 per share New holding company has 34,864,800 shares outstanding; approximate market cap of $349 million as of July 6, 2010. Uses of proceeds may include: Support organic growth through lending in communities we serve Improve our capital position Finance acquisition of branches from other financial institutions or build or lease new branch facilities* Enhance existing products and services and support development of new products and services Finance acquisition of financial institutions or other financial service companies* Invest in securities Other general corporate purposes *We do not currently have any agreements or understandings regarding any specific acquisition transactions. Source: VPFG 10-Q for 2Q10 |
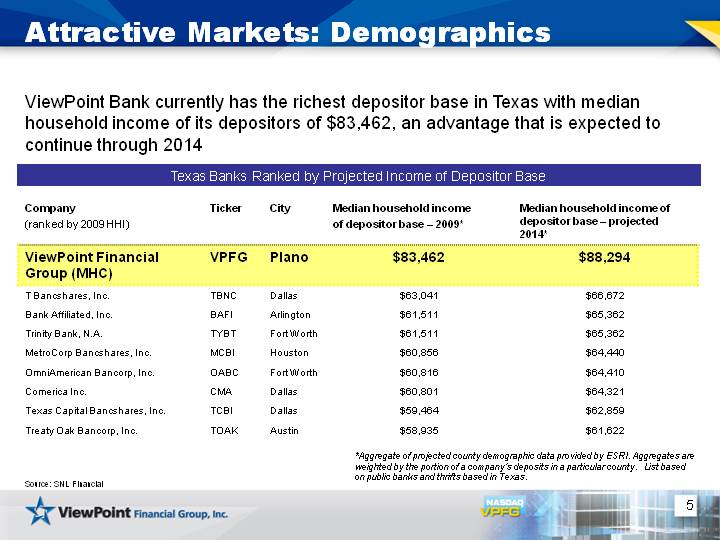
| 5 *Aggregate of projected county demographic data provided by ESRI. Aggregates are weighted by the portion of a company's deposits in a particular county. List based on public banks and thrifts based in Texas. Attractive Markets: Demographics Texas Banks Ranked by Projected Income of Depositor Base Company (ranked by 2009 HHI) Ticker City Median household income of depositor base - 2009* Median household income of depositor base - projected 2014* ViewPoint Financial Group (MHC) VPFG Plano $83,462 $88,294 T Bancshares, Inc. TBNC Dallas $63,041 $66,672 Bank Affiliated, Inc. BAFI Arlington $61,511 $65,362 Trinity Bank, N.A. TYBT Fort Worth $61,511 $65,362 MetroCorp Bancshares, Inc. MCBI Houston $60,856 $64,440 OmniAmerican Bancorp, Inc. OABC Fort Worth $60,816 $64,410 Comerica Inc. CMA Dallas $60,801 $64,321 Texas Capital Bancshares, Inc. TCBI Dallas $59,464 $62,859 Treaty Oak Bancorp, Inc. TOAK Austin $58,935 $61,622 ViewPoint Bank currently has the richest depositor base in Texas with median household income of its depositors of $83,462, an advantage that is expected to continue through 2014 Source: SNL Financial |
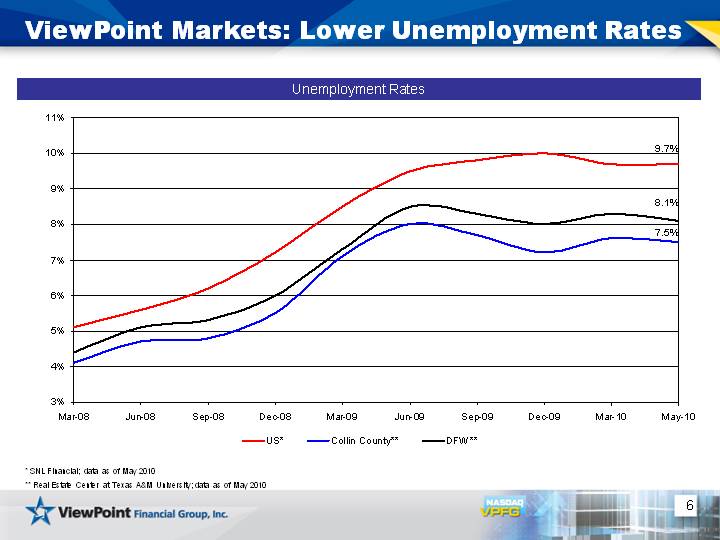
| 6 ViewPoint Markets: Lower Unemployment Rates 3/1/2008 6/1/2008 9/1/2008 12/1/2008 3/1/2009 6/1/2009 9/1/2009 12/1/2009 3/1/2010 4/1/2010 5/31/2010 US* 5.1 5.6 6.2 7.2 8.5 9.5 9.8 10 9.7 9.9 9.7 Collin County** 4.1 4.7 4.8 5.5 7.1 8 7.7 7.2 7.6 7.6 7.5 DFW** 4.4 5.1 5.3 6 7.3 8.5 8.3 8 8.3 8.2 8.1 Unemployment Rates * SNL Financial; data as of May 2010 ** Real Estate Center at Texas A&M University; data as of May 2010 9.7% 8.1% 7.5% |
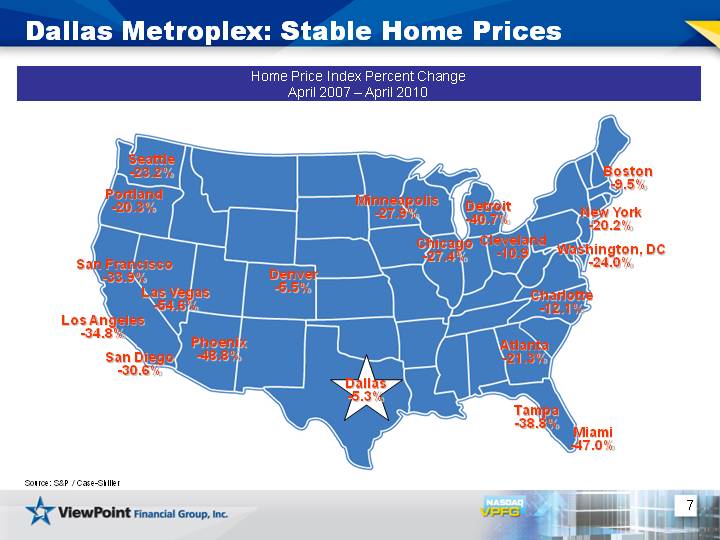
| 7 Home Price Index Percent Change April 2007 - April 2010 Dallas Metroplex: Stable Home Prices Seattle -23.2% San Francisco -33.9% Los Angeles -34.8% San Diego -30.6% Phoenix -48.8% Las Vegas -54.6% Denver -5.5% Minneapolis -27.9% Chicago -27.4% Detroit -40.7% Cleveland -10.9 Boston -9.5% New York -20.2% Washington, DC -24.0% Charlotte -12.1% Atlanta -21.3% Tampa -38.8% Miami -47.0% Portland -20.3% Dallas -5.3% Source: S&P / Case-Shiller |
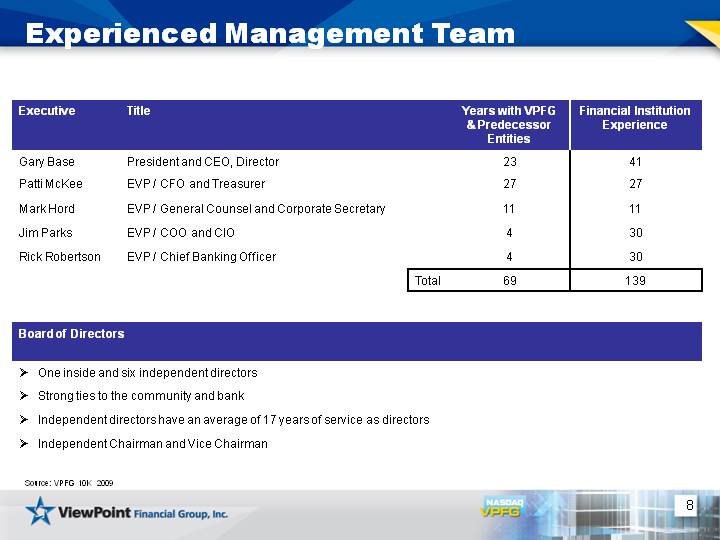
| 8 Experienced Management Team Executive Title Years with VPFG & Predecessor Entities Financial Institution Experience Gary Base President and CEO, Director 23 41 Patti McKee EVP / CFO and Treasurer 27 27 Mark Hord EVP / General Counsel and Corporate Secretary 11 11 Jim Parks EVP / COO and CIO 4 30 Rick Robertson EVP / Chief Banking Officer 4 30 Total 69 139 Board of Directors One inside and six independent directors Strong ties to the community and bank Independent directors have an average of 17 years of service as directors Independent Chairman and Vice Chairman Source: VPFG 10K 2009 |
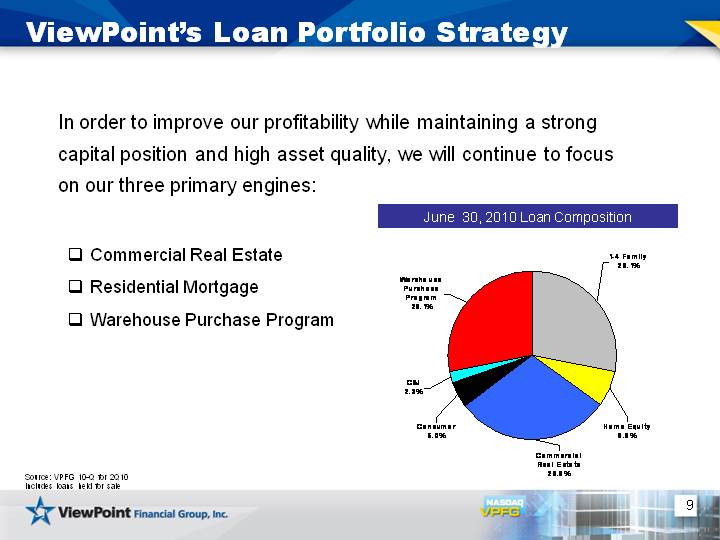
| 9 ViewPoint's Loan Portfolio Strategy In order to improve our profitability while maintaining a strong capital position and high asset quality, we will continue to focus on our three primary engines: Commercial Real Estate Residential Mortgage Warehouse Purchase Program 2nd Qtr 1-4 Family 457049 Home Equity 112469 Commercial Real Estate 480553 Consumer 80558 C&I 37958 Warehouse Purchase Program 455615 June 30, 2010 Loan Composition Source: VPFG 10-Q for 2Q10 Includes loans held for sale |
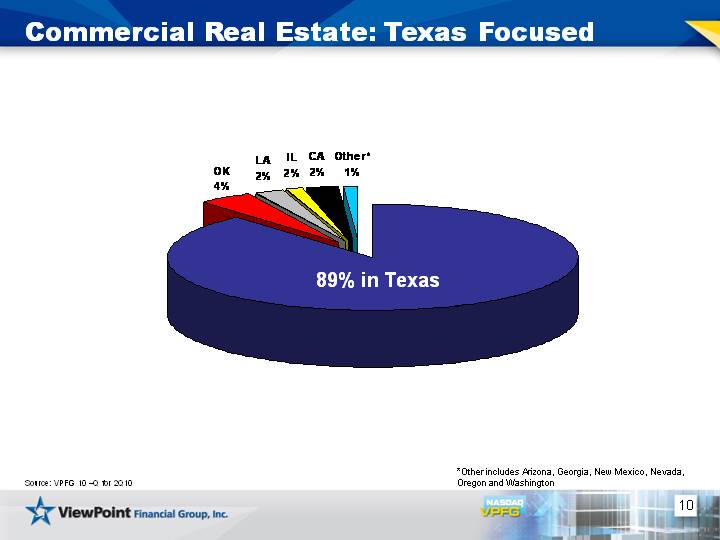
| 10 TX OK LA IL CA Other* Dollar 409282310.39 19925104.74 9396605.56 7200000 11094309.39 5198395.44 *Other includes Arizona, Georgia, New Mexico, Nevada, Oregon and Washington Commercial Real Estate: Texas Focused 89% in Texas Source: VPFG 10 -Q for 2Q10 |
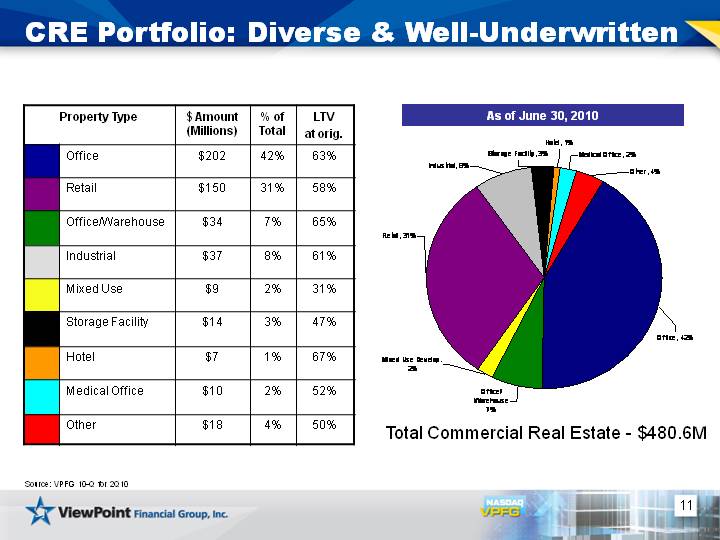
| 11 Office Office/Warehouse Mixed Use Development Retail Industrial Storage Facility Hotel Medical Office Other 0.42 0.07 0.02 0.31 0.08 0.03 0.01 0.02 0.04 CRE Portfolio: Diverse & Well-Underwritten Property Type Property Type $ Amount (Millions) % of Total LTV at orig. Office $202 42% 63% Retail $150 31% 58% Office/Warehouse $34 7% 65% Industrial $37 8% 61% Mixed Use $9 2% 31% Storage Facility $14 3% 47% Hotel $7 1% 67% Medical Office $10 2% 52% Other $18 4% 50% Total Commercial Real Estate - $480.6M Source: VPFG 10-Q for 2Q10 As of June 30, 2010 |
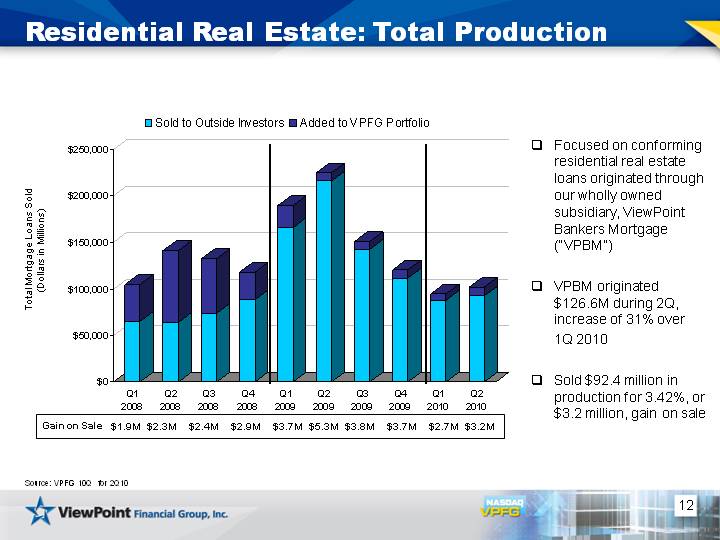
| 12 Residential Real Estate: Total Production Focused on conforming residential real estate loans originated through our wholly owned subsidiary, ViewPoint Bankers Mortgage ("VPBM") VPBM originated $126.6M during 2Q, increase of 31% over 1Q 2010 Sold $92.4 million in production for 3.42%, or $3.2 million, gain on sale Q1 2008 Q2 2008 Q3 2008 Q4 2008 Q1 2009 Q2 2009 Q3 2009 Q4 2009 Q1 2010 Q2 2010 Sold to Outside Investors 65167 64568 73808 88288 165914 215955 142625 111639 88172 92442 Added to VPFG Portfolio 39728 76827 58630 30004 23603 8920 8512 8728 7014 9785 $1.9M $2.3M $2.4M $2.9M $3.7M $5.3M $3.8M Gain on Sale Total Mortgage Loans Sold (Dollars in Millions) $3.7M $2.7M Source: VPFG 10Q for 2Q10 $3.2M |
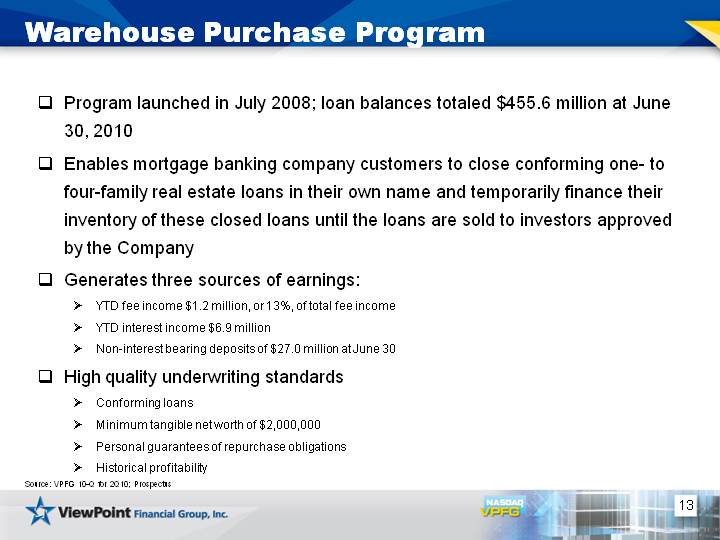
| 13 Warehouse Purchase Program Program launched in July 2008; loan balances totaled $455.6 million at June 30, 2010 Enables mortgage banking company customers to close conforming one- to four-family real estate loans in their own name and temporarily finance their inventory of these closed loans until the loans are sold to investors approved by the Company Generates three sources of earnings: YTD fee income $1.2 million, or 13%, of total fee income YTD interest income $6.9 million Non-interest bearing deposits of $27.0 million at June 30 High quality underwriting standards Conforming loans Minimum tangible net worth of $2,000,000 Personal guarantees of repurchase obligations Historical profitability Source: VPFG 10-Q for 2Q10; Prospectus |
| 14 Capitalize on a position of balance sheet strength to opportunistically grow and acquire new business in economically stable and growing markets, with a focus on Texas Remain focused on our community banking approach, enhance the profitability of existing relationships through product cross-selling and continue to build in- market brand recognition to garner new business opportunities Continue to develop existing lines of business; ensure successful execution through prudent management and risk mitigation Going Forward |
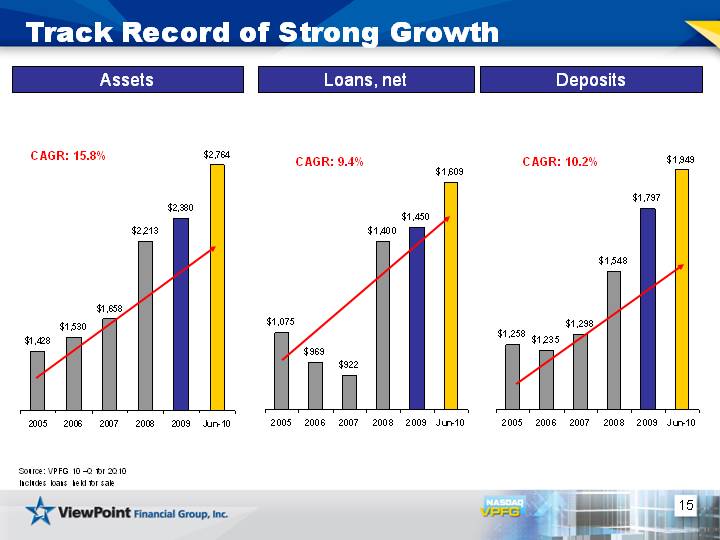
| 15 2005 2006 2007 2008 2009 6/30/2010 1257.727 1234.881 1297.593 1548.09 1796.665 1949 2005 2006 2007 2008 2009 6/30/2010 1075.473 968.664 921.822 1399.592 1449.59 1609 2005 2006 2007 2008 2009 6/30/2010 East 1428.062 1529.76 1658.204 2213.415 2379.504 2764 Track Record of Strong Growth Assets Loans, net Deposits CAGR: 9.4% CAGR: 10.2% CAGR: 15.8% Includes loans held for sale Source: VPFG 10 -Q for 2Q10 |
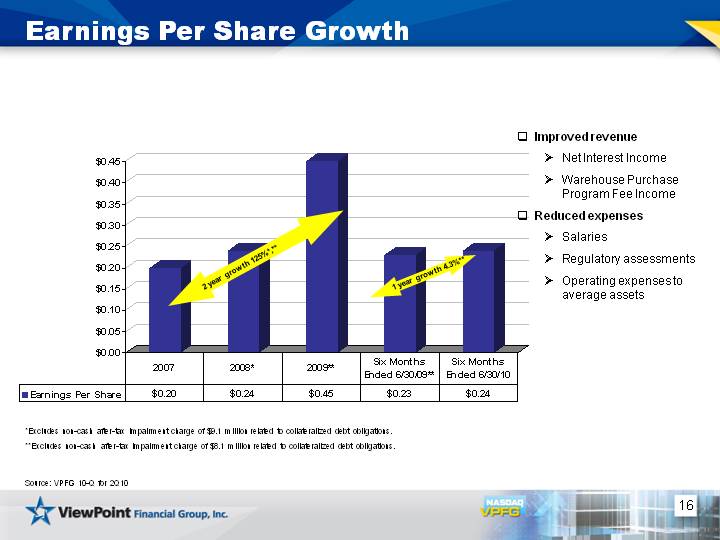
| 16 Earnings Per Share Growth *Excludes non-cash after-tax impairment charge of $9.1 million related to collateralized debt obligations. **Excludes non-cash after-tax impairment charge of $8.1 million related to collateralized debt obligations. 2007 2008* 2009** Six Months Ended 6/30/09** Six Months Ended 6/30/10 Earnings Per Share 0.2 0.24 0.45 0.23 0.24 2 year growth 125%*,** 1 year growth 4.3%** Improved revenue Net Interest Income Warehouse Purchase Program Fee Income Reduced expenses Salaries Regulatory assessments Operating expenses to average assets Source: VPFG 10-Q for 2Q10 |
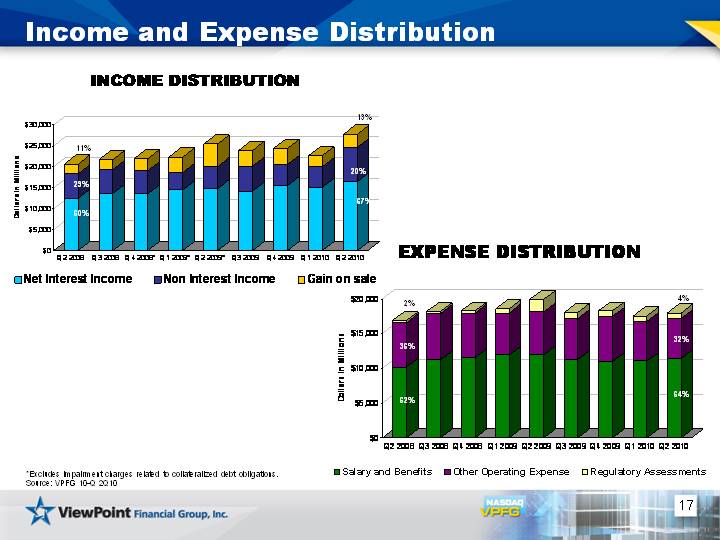
| 17 Income and Expense Distribution Q1 2008 Q2 2008 Q3 2008 Q4 2008* Q1 2009* Q2 2009* Q3 2009 Q4 2009 Q1 2010 Q2 2010 Net Interest Income 11385 12464 13645 13579 14460 14815 14216 15523 15140 16447 Non Interest Income 6185 5849 5756 5493 4188 5281 5938 5071 4900 8169 Gain on sale 1854 2314 2352 2871 3706 5331 3797 3757 2656 3165 *Excludes impairment charges related to collateralized debt obligations. Source: VPFG 10-Q 2Q10 Q1 2008 Q2 2008 Q3 2008 Q4 2008 Q1 2009 Q2 2009 Q3 2009 Q4 2009 Q1 2010 Q2 2010 Salary and Benefits 9773 10232 11234 11584 11911 11965 11304 10968 11047 11450 Other Operating Expense 5855 6378 6656 6423 6063 6226 5921 6556 5717 5757 Regulatory Assessments 299 300 317 309 645 1761 844 768 795 795 67% 13% 20% 11% 60% 29% 2% 36% 62% 64% 4% 32% |
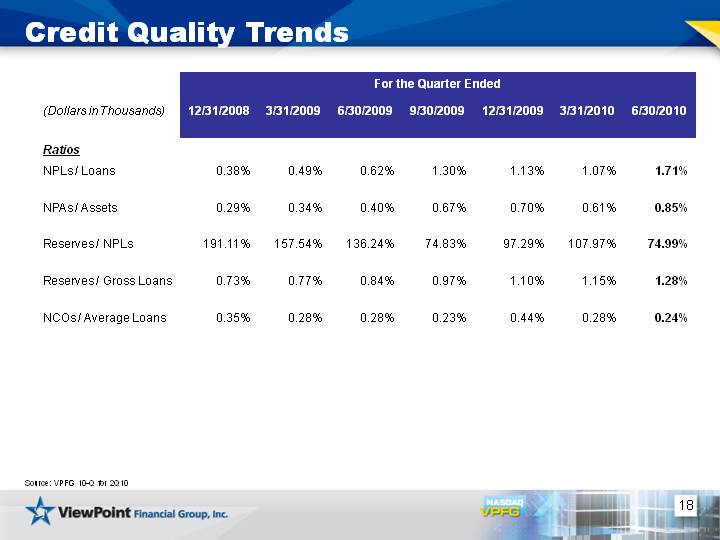
| 18 Credit Quality Trends For the Quarter Ended For the Quarter Ended For the Quarter Ended For the Quarter Ended For the Quarter Ended For the Quarter Ended For the Quarter Ended (Dollars in Thousands) 12/31/2008 3/31/2009 6/30/2009 9/30/2009 12/31/2009 3/31/2010 6/30/2010 Ratios NPLs / Loans 0.38% 0.49% 0.62% 1.30% 1.13% 1.07% 1.71% NPAs / Assets 0.29% 0.34% 0.40% 0.67% 0.70% 0.61% 0.85% Reserves / NPLs 191.11% 157.54% 136.24% 74.83% 97.29% 107.97% 74.99% Reserves / Gross Loans 0.73% 0.77% 0.84% 0.97% 1.10% 1.15% 1.28% NCOs / Average Loans 0.35% 0.28% 0.28% 0.23% 0.44% 0.28% 0.24% Source: VPFG 10-Q for 2Q10 |
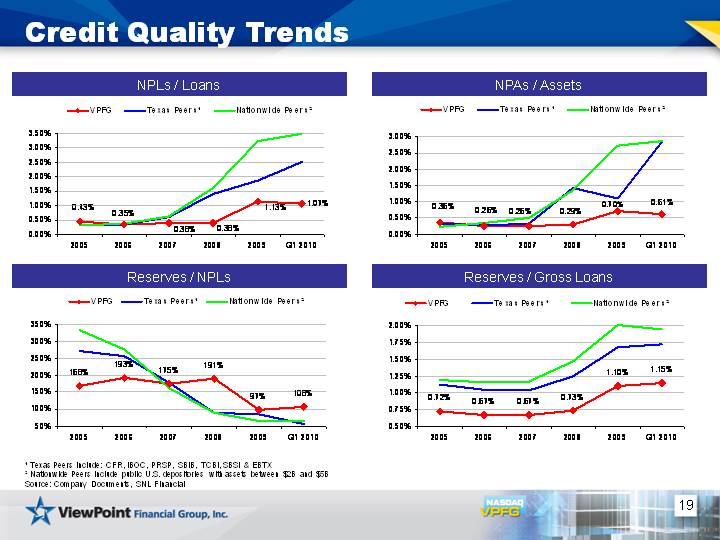
| 19 Credit Quality Trends 2005 2006 2007 2008 2009 Q1 2010 VPFG 0.72 0.67 0.67 0.73 1.1 1.15 Texas Peers1 1.12 1.04 1.03 1.25 1.68 1.72 Nationwide Peers2 1.19 1.16 1.17 1.465 2.01 1.95 2005 2006 2007 2008 2009 Q1 2010 VPFG 0.36 0.26 0.26 0.29 0.7 0.61 Texas Peers1 0.32 0.27 0.32 1.43 1.11 2.83 Nationwide Peers2 0.22 0.335 0.5 1.35 2.72 2.87 2005 2006 2007 2008 2009 Q1 2010 VPFG 167.51 193.03 175.49 191.11 97.29 107.97 Texas Peers1 271.62 256.19 177 88.87 85.32 56.63 Nationwide Peers2 331.455 274.635 162.3 88.965 64.72 64.65 2005 2006 2007 2008 2009 Q1 2010 VPFG 0.43 0.35 0.38 0.38 1.13 1.07 Texas Peers1 0.35 0.35 0.59 1.41 1.86 2.51 Nationwide Peers2 0.31 0.37 0.61 1.61 3.23 3.51 NPAs / Assets NPLs / Loans 1 Texas Peers include: CFR, IBOC, PRSP, SBIB, TCBI, SBSI & EBTX 2 Nationwide Peers include public U.S. depositories with assets between $2B and $5B Source: Company Documents, SNL Financial Reserves / NPLs Reserves / Gross Loans |
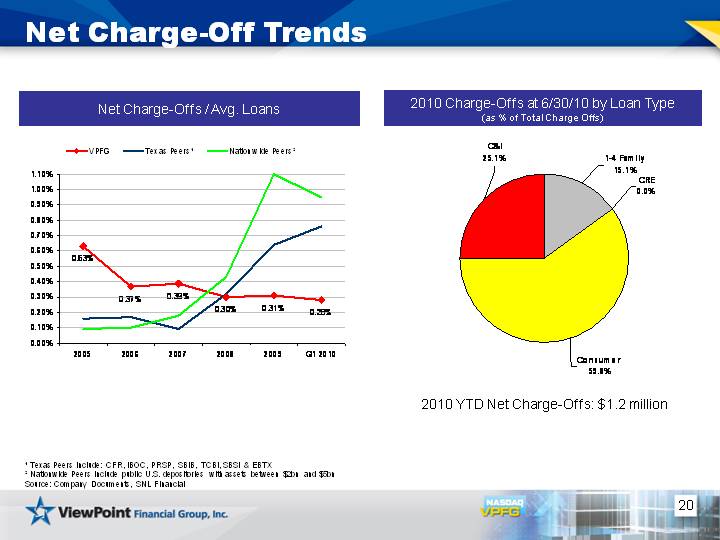
| 20 Net Charge-Off Trends 2009 1-4 Family 188 CRE 0 Consumer 745 C&I 313 2010 Charge-Offs at 6/30/10 by Loan Type (as % of Total Charge Offs) 2005 2006 2007 2008 2009 Q1 2010 VPFG 0.63 0.37 0.39 0.3 0.31 0.28 Texas Peers1 0.16 0.17 0.09 0.32 0.64 0.76 Nationwide Peers2 0.09 0.1 0.18 0.43 1.1 0.95 Net Charge-Offs / Avg. Loans 2010 YTD Net Charge-Offs: $1.2 million 1 Texas Peers include: CFR, IBOC, PRSP, SBIB, TCBI, SBSI & EBTX 2 Nationwide Peers include public U.S. depositories with assets between $2bn and $5bn Source: Company Documents, SNL Financial |
| 21 Disciplined Credit Administration Conservative Lending Practices Management Loan Committee approves loans from $2 to $5 million Global credit oversight by the Bank's Loan Committee Comprised of three independent directors plus the CEO Approves all loans greater than $5 million Detailed loan review process |
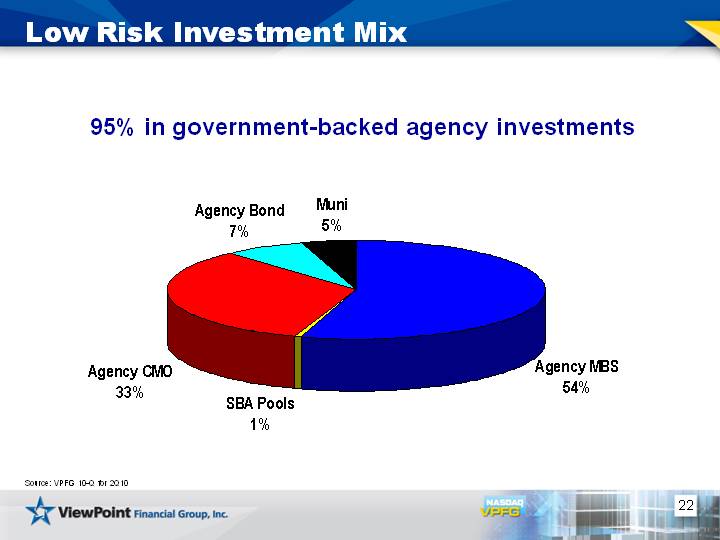
| 22 Low Risk Investment Mix Agency MBS SBA Pools Agency CMO Agency Bond Muni 482885921.21 5666341.45 289944116.13 63443536.77 40462856.76 95% in government-backed agency investments Source: VPFG 10-Q for 2Q10 |
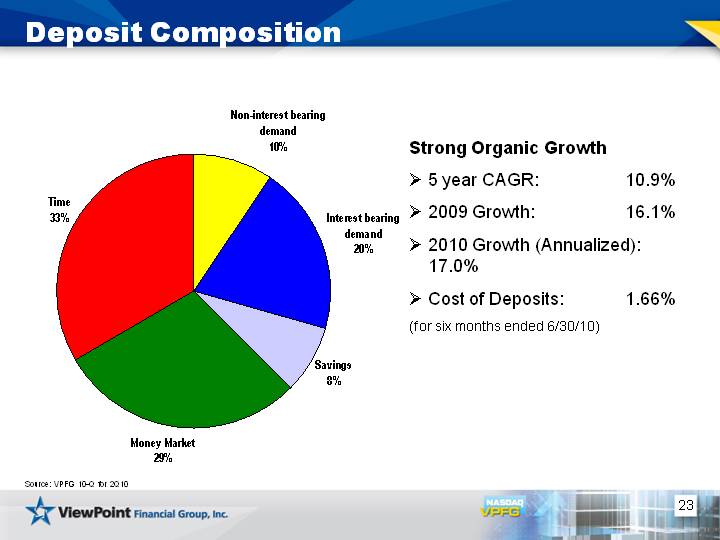
| 23 Deposit Composition Non-interest bearing demand Interest bearing demand Savings Money Market Time 185381 391129 154652 568004 649912 Strong Organic Growth 5 year CAGR: 10.9% 2009 Growth: 16.1% 2010 Growth (Annualized): 17.0% Cost of Deposits: 1.66% (for six months ended 6/30/10) Source: VPFG 10-Q for 2Q10 |
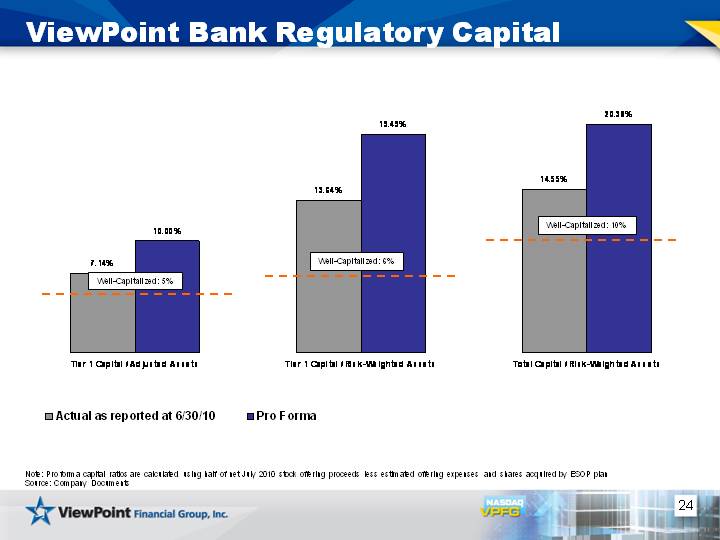
| 24 Tier 1 Capital / Adjusted Assets Tier 1 Capital / Risk-Weighted Assets Total Capital / Risk-Weighted Assets Actual as reported at 6/30/10 7.14 13.64 14.55 Pro Forma 10 19.49 20.38 ViewPoint Bank Regulatory Capital Well-Capitalized: 5% Well-Capitalized: 6% Well-Capitalized: 10% Note: Pro forma capital ratios are calculated using half of net July 2010 stock offering proceeds less estimated offering expenses and shares acquired by ESOP plan Source: Company Documents |
| 25 Highlights One of the largest independent community banking franchises in Texas Economically and demographically one of the strongest market areas in the country Experienced management team with strong local ties Improving profitability due to transition to full service community bank More diversified revenue stream from full complement of commercial and retail products Strong credit metrics reflecting disciplined underwriting standards Currently well capitalized; new capital will assure compliance with any elevated regulatory requirements and support continued growth Positive asset quality comparisons to publicly-traded Texas peers |

| 26 APPENDIX |
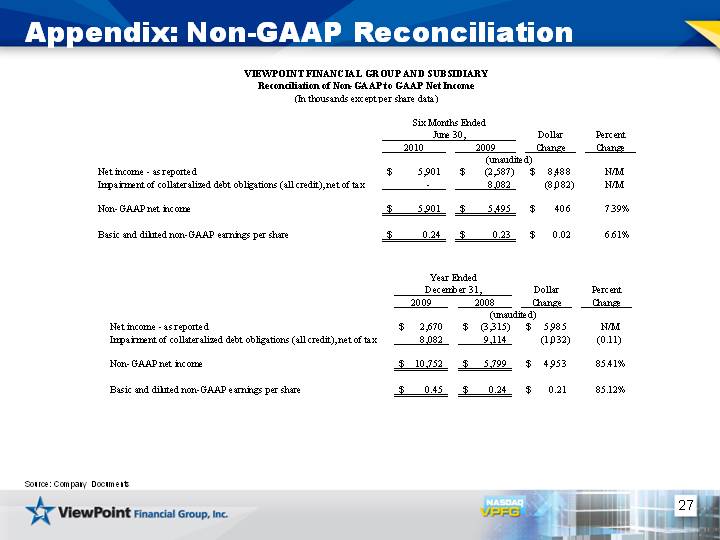
| 27 Appendix: Non-GAAP Reconciliation Source: Company Documents |
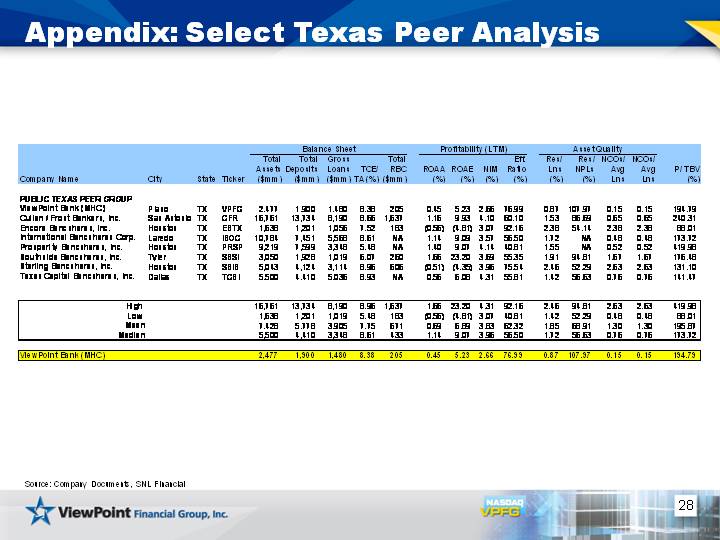
| 28 Appendix: Select Texas Peer Analysis Source: Company Documents, SNL Financial |
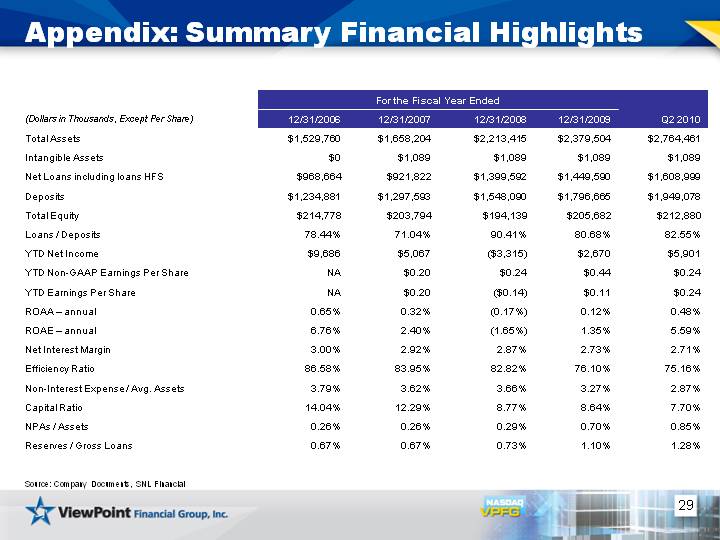
| 29 Appendix: Summary Financial Highlights Source: Company Documents, SNL Financial For the Fiscal Year Ended For the Fiscal Year Ended For the Fiscal Year Ended For the Fiscal Year Ended (Dollars in Thousands, Except Per Share) 12/31/2006 12/31/2007 12/31/2008 12/31/2009 Q2 2010 Total Assets $1,529,760 $1,658,204 $2,213,415 $2,379,504 $2,764,461 Intangible Assets $0 $1,089 $1,089 $1,089 $1,089 Net Loans including loans HFS $968,664 $921,822 $1,399,592 $1,449,590 $1,608,999 Deposits $1,234,881 $1,297,593 $1,548,090 $1,796,665 $1,949,078 Total Equity $214,778 $203,794 $194,139 $205,682 $212,880 Loans / Deposits 78.44% 71.04% 90.41% 80.68% 82.55% YTD Net Income $9,686 $5,067 ($3,315) $2,670 $5,901 YTD Non-GAAP Earnings Per Share NA $0.20 $0.24 $0.44 $0.24 YTD Earnings Per Share NA $0.20 ($0.14) $0.11 $0.24 ROAA - annual 0.65% 0.32% (0.17%) 0.12% 0.48% ROAE - annual 6.76% 2.40% (1.65%) 1.35% 5.59% Net Interest Margin 3.00% 2.92% 2.87% 2.73% 2.71% Efficiency Ratio 86.58% 83.95% 82.82% 76.10% 75.16% Non-Interest Expense / Avg. Assets 3.79% 3.62% 3.66% 3.27% 2.87% Capital Ratio 14.04% 12.29% 8.77% 8.64% 7.70% NPAs / Assets 0.26% 0.26% 0.29% 0.70% 0.85% Reserves / Gross Loans 0.67% 0.67% 0.73% 1.10% 1.28% |