Attached files
| file | filename |
|---|---|
| 8-K - 8-K - GEOKINETICS INC | a10-11596_18k.htm |
| EX-99.1 - EX-99.1 - GEOKINETICS INC | a10-11596_1ex99d1.htm |
Exhibit 99.2
|
|
RBC Capital Markets Global Energy and Power Conference June 7-8, 2010 Investor Presentation |
|
|
2 Forward-Looking Statements This presentation contains forward-looking statements. All forward-looking statements speak only as of the date of this presentation or, in the case of any document incorporated by reference, the date of that document. All subsequent written and oral forward-looking statements attributable to the company or any person acting on the company’s behalf are qualified by the cautionary statements in this section. The company does not undertake any obligation to update or publicly release any revisions to forward-looking statements to reflect events, circumstances or changes in expectations after the date of this report. Actual experience may differ and such differences may be material. Backlog consists of written orders and estimates for our services which we believe to be firm. In many instances contracts are cancelable by customers so we may never realize some or all of our backlog, which may lead to lower than expected financial performance. Forward-looking statements are subject to uncertainties and risks which are disclosed in Geokinetics’ Annual Report on Form 10-K and Quarterly Reports on Form 10-Q. |
|
|
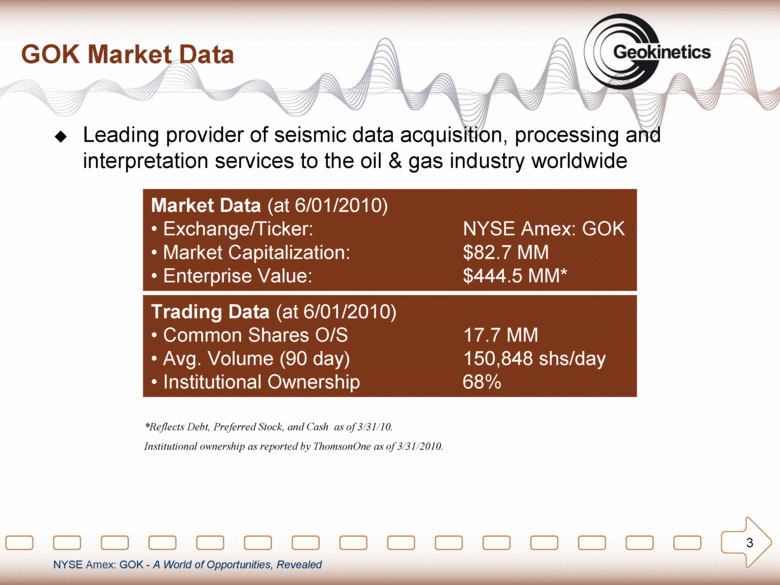
3 GOK Market Data Leading provider of seismic data acquisition, processing and interpretation services to the oil & gas industry worldwide Market Data (at 6/01/2010) Exchange/Ticker: NYSE Amex: GOK Market Capitalization: $82.7 MM Enterprise Value: $444.5 MM* Trading Data (at 6/01/2010) Common Shares O/S 17.7 MM Avg. Volume (90 day) 150,848 shs/day Institutional Ownership 68% *Reflects Debt, Preferred Stock, and Cash as of 3/31/10. Institutional ownership as reported by ThomsonOne as of 3/31/2010. |
|
|
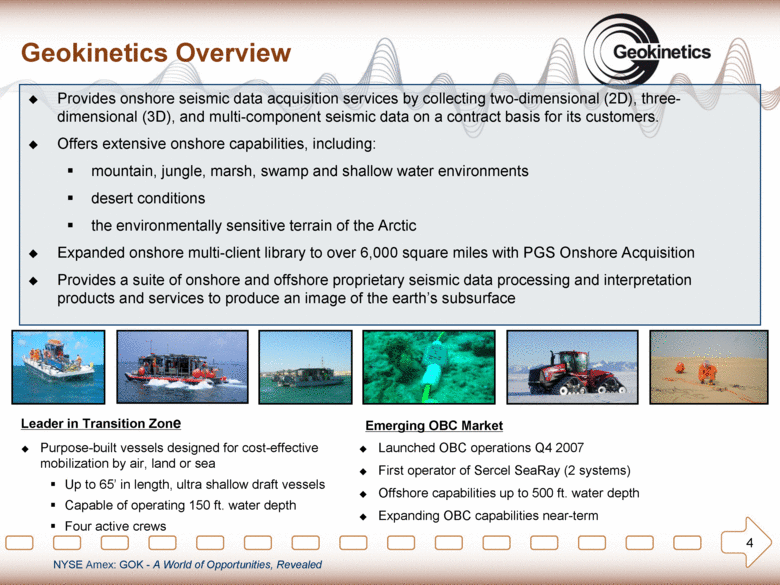
4 Geokinetics Overview Provides onshore seismic data acquisition services by collecting two-dimensional (2D), three-dimensional (3D), and multi-component seismic data on a contract basis for its customers. Offers extensive onshore capabilities, including: mountain, jungle, marsh, swamp and shallow water environments desert conditions the environmentally sensitive terrain of the Arctic Expanded onshore multi-client library to over 6,000 square miles with PGS Onshore Acquisition Provides a suite of onshore and offshore proprietary seismic data processing and interpretation products and services to produce an image of the earth’s subsurface Purpose-built vessels designed for cost-effective mobilization by air, land or sea Up to 65’ in length, ultra shallow draft vessels Capable of operating 150 ft. water depth Four active crews Launched OBC operations Q4 2007 First operator of Sercel SeaRay (2 systems) Offshore capabilities up to 500 ft. water depth Expanding OBC capabilities near-term Leader in Transition Zone Emerging OBC Market |
|
|
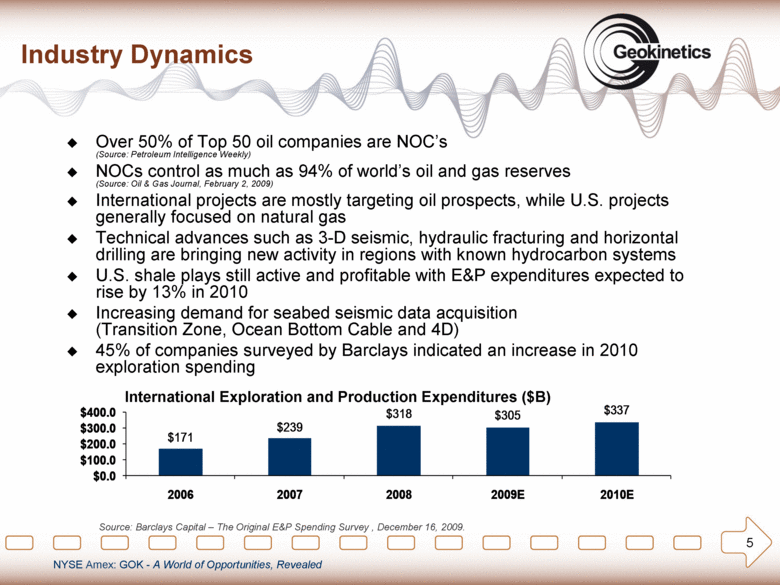
5 Industry Dynamics Over 50% of Top 50 oil companies are NOC’s (Source: Petroleum Intelligence Weekly) NOCs control as much as 94% of world’s oil and gas reserves (Source: Oil & Gas Journal, February 2, 2009) International projects are mostly targeting oil prospects, while U.S. projects generally focused on natural gas Technical advances such as 3-D seismic, hydraulic fracturing and horizontal drilling are bringing new activity in regions with known hydrocarbon systems U.S. shale plays still active and profitable with E&P expenditures expected to rise by 13% in 2010 Increasing demand for seabed seismic data acquisition (Transition Zone, Ocean Bottom Cable and 4D) 45% of companies surveyed by Barclays indicated an increase in 2010 exploration spending Source: Barclays Capital – The Original E&P Spending Survey , December 16, 2009. International Exploration and Production Expenditures ($B) $171 $239 $318 $305 $337 $0.0 $100.0 $200.0 $300.0 $400.0 2006 2007 2008 2009E 2010E |
|
|
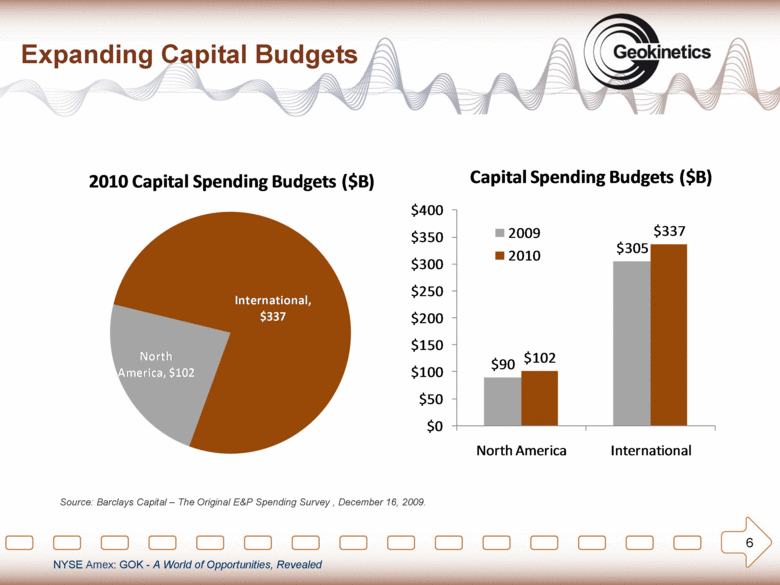
6 Expanding Capital Budgets Source: Barclays Capital – The Original E&P Spending Survey , December 16, 2009. North America, $102 International, $337 2010 Capital Spending Budgets ($B) $90 $305 $102 $337 $0 $50 $100 $150 $200 $250 $300 $350 $400 North America International Capital Spending Budgets ($B) 2009 2010 |
|
|
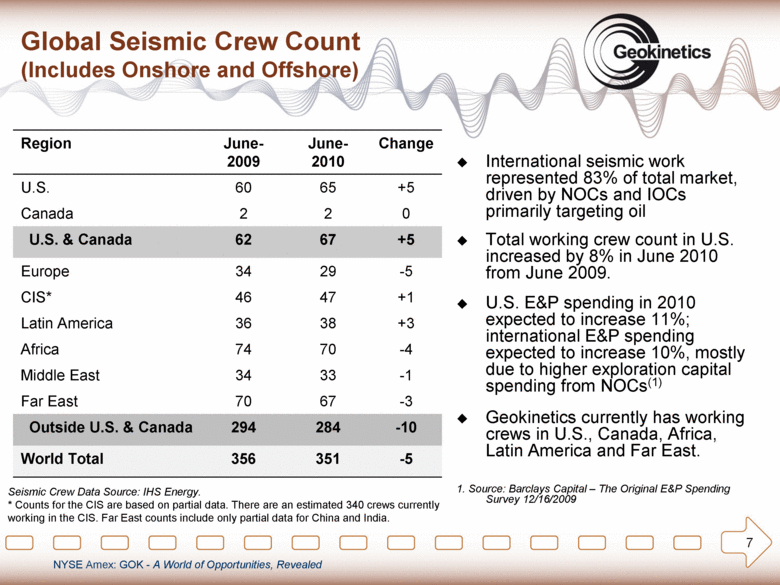
7 Global Seismic Crew Count (Includes Onshore and Offshore) Seismic Crew Data Source: IHS Energy. * Counts for the CIS are based on partial data. There are an estimated 340 crews currently working in the CIS. Far East counts include only partial data for China and India. International seismic work represented 83% of total market, driven by NOCs and IOCs primarily targeting oil Total working crew count in U.S. increased by 8% in June 2010 from June 2009. U.S. E&P spending in 2010 expected to increase 11%; international E&P spending expected to increase 10%, mostly due to higher exploration capital spending from NOCs(1) Geokinetics currently has working crews in U.S., Canada, Africa, Latin America and Far East. 1. Source: Barclays Capital – The Original E&P Spending Survey 12/16/2009 Region June-2009 June-2010 Change U.S. 60 65 +5 Canada 2 2 0 U.S. & Canada 62 67 +5 Europe 34 29 -5 CIS* 46 47 +1 Latin America 36 38 +3 Africa 74 70 -4 Middle East 34 33 -1 Far East 70 67 -3 Outside U.S. & Canada 294 284 -10 World Total 356 351 -5 |
|
|
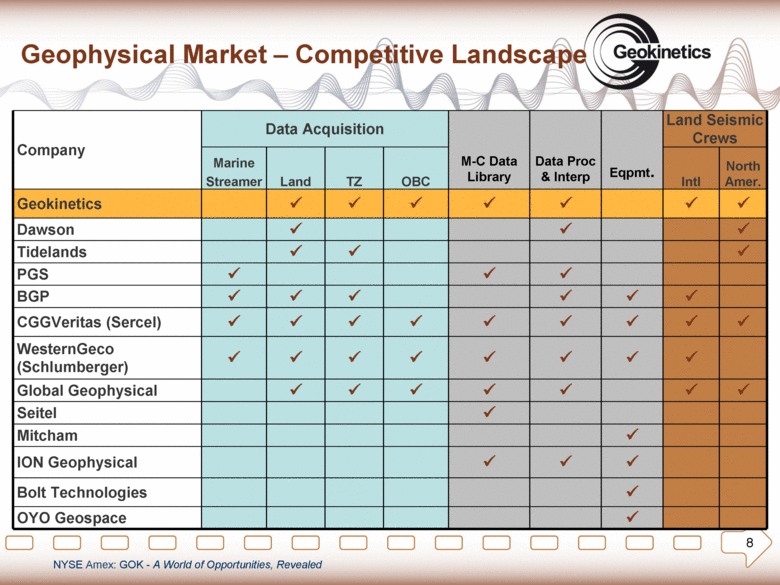
8 Geophysical Market – Competitive Landscape Company Data Acquisition M-C Data Library Data Proc & Interp Eqpmt. Land Seismic Crews Marine Streamer Land TZ OBC Intl North Amer. Geokinetics Dawson Tidelands PGS BGP CGGVeritas (Sercel) WesternGeco (Schlumberger) Global Geophysical Seitel Mitcham ION Geophysical Bolt Technologies OYO Geospace |
|
|
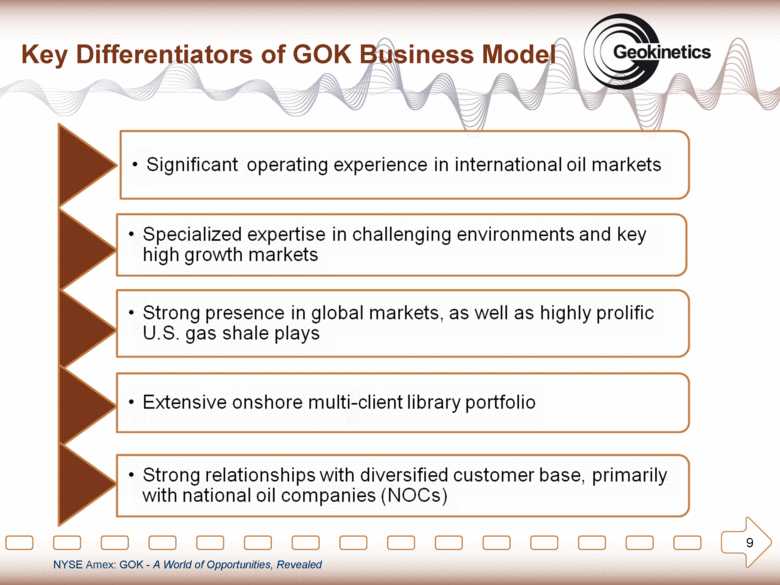
9 Key Differentiators of GOK Business Model Significant operating experience in international oil markets Specialized expertise in challenging environments and key high growth markets Strong presence in global markets, as well as highly prolific U.S. gas shale plays Extensive onshore multi-client library portfolio Strong relationships with diversified customer base, primarily with national oil companies (NOCs) |
|
|
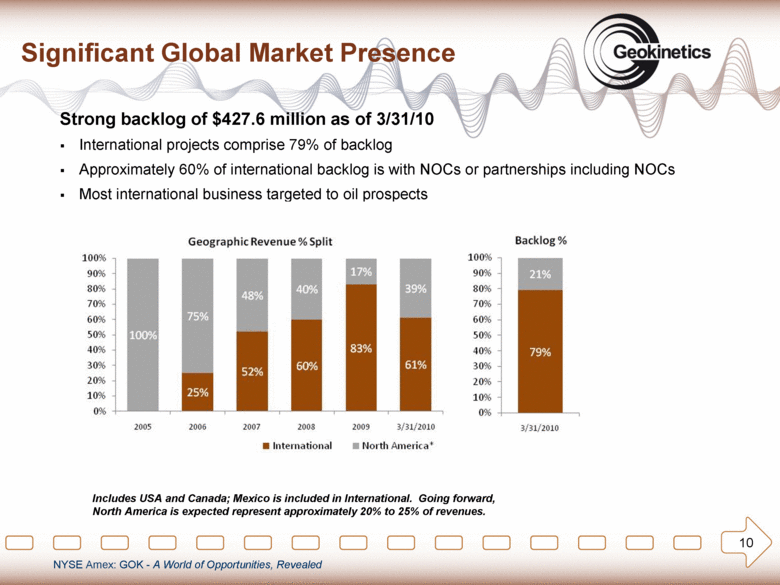
10 Significant Global Market Presence Strong backlog of $427.6 million as of 3/31/10 International projects comprise 79% of backlog Approximately 60% of international backlog is with NOCs or partnerships including NOCs Most international business targeted to oil prospects Includes USA and Canada; Mexico is included in International. Going forward, North America is expected represent approximately 20% to 25% of revenues. |
|
|
Proven International Operating Expertise 11 Global presence - infrastructure / assets / people Fully trained, local management / technicians available in key markets Expertise shared globally Ability to mobilize crews to the most active regions worldwide, as markets dictate, to maximize utilization Crews can be moved easily at a minimal cost Use of common equipment increases productivity and cost savings Crews strategically located worldwide in regions offering long-term work prospects International projects tend to be longer term, up to 2 years Smaller jobs can be consolidated to minimize downtime |
|
|
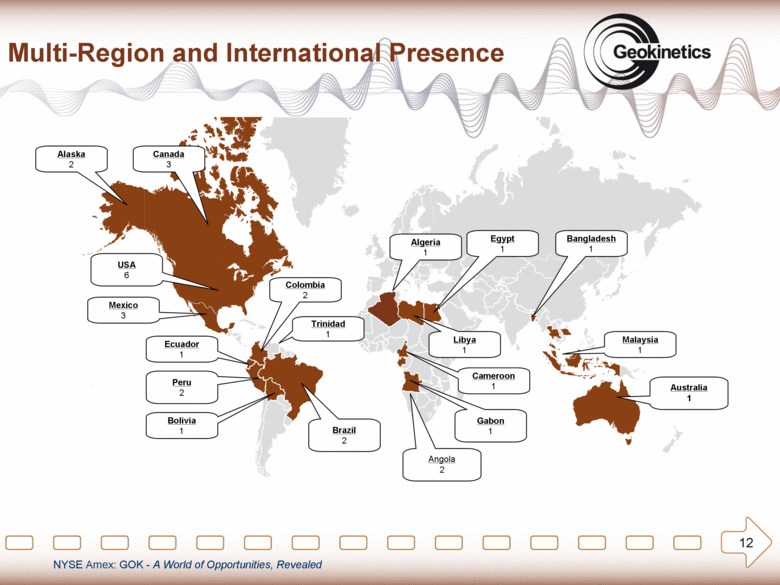
Multi-Region and International Presence 12 Canada 3 USA 6 Mexico 3 Egypt 1 Algeria 1 Alaska 2 Brazil 2 Malaysia 1 Bangladesh 1 Gabon 1 Cameroon 1 Colombia 2 Ecuador 1 Peru 2 Libya 1 Bolivia 1 Trinidad 1 Australia 1 Angola 2 |
|
|
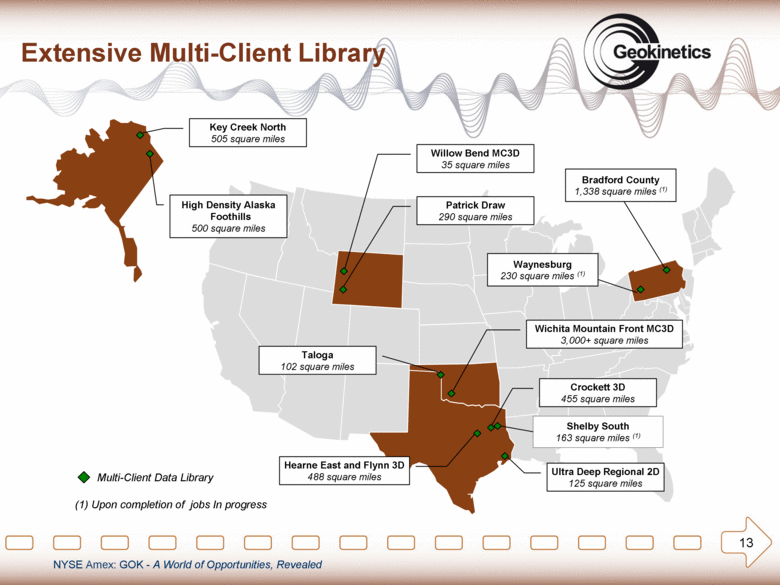
Extensive Multi-Client Library Multi-Client Data Library 13 Willow Bend MC3D 35 square miles Patrick Draw 290 square miles Taloga 102 square miles Wichita Mountain Front MC3D 3,000+ square miles Ultra Deep Regional 2D 125 square miles Hearne East and Flynn 3D 488 square miles Crockett 3D 455 square miles Key Creek North 505 square miles High Density Alaska Foothills 500 square miles Bradford County 1,338 square miles (1) Upon completion of jobs In progress Waynesburg 230 square miles (1) Shelby South 163 square miles (1) |
|
|
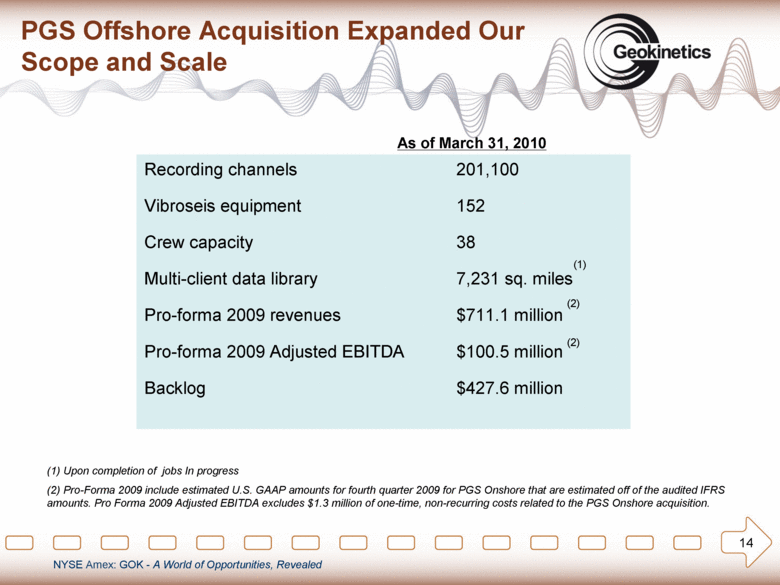
14 PGS Offshore Acquisition Expanded Our Scope and Scale Recording channels Vibroseis equipment Crew capacity Multi-client data library Pro-forma 2009 revenues Pro-forma 2009 Adjusted EBITDA Backlog 201,100 152 38 7,231 sq. miles $711.1 million $100.5 million $427.6 million (1) As of March 31, 2010 Upon completion of jobs In progress (2) Pro-Forma 2009 include estimated U.S. GAAP amounts for fourth quarter 2009 for PGS Onshore that are estimated off of the audited IFRS amounts. Pro Forma 2009 Adjusted EBITDA excludes $1.3 million of one-time, non-recurring costs related to the PGS Onshore acquisition. (2) (2) |
|
|
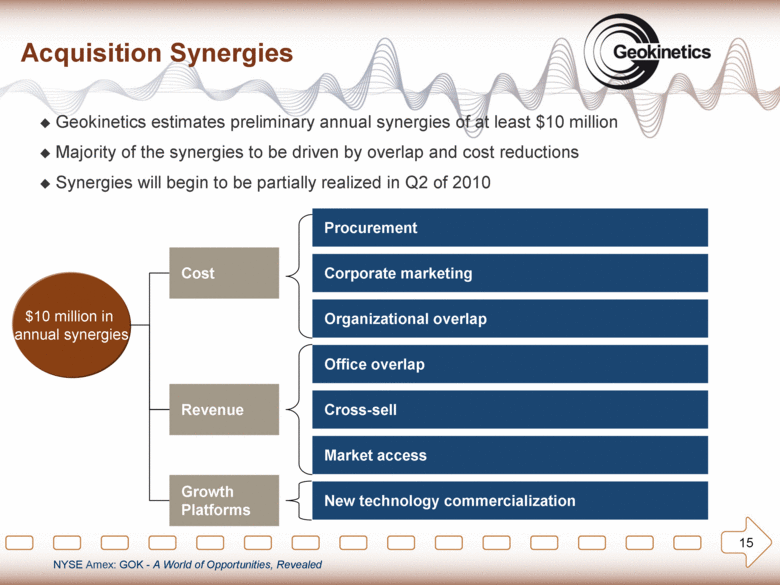
Acquisition Synergies 15 $10 million in annual synergies Cost Revenue Growth Platforms Geokinetics estimates preliminary annual synergies of at least $10 million Majority of the synergies to be driven by overlap and cost reductions Synergies will begin to be partially realized in Q2 of 2010 Procurement Corporate marketing Organizational overlap Office overlap Cross-sell Market access New technology commercialization |
|
|
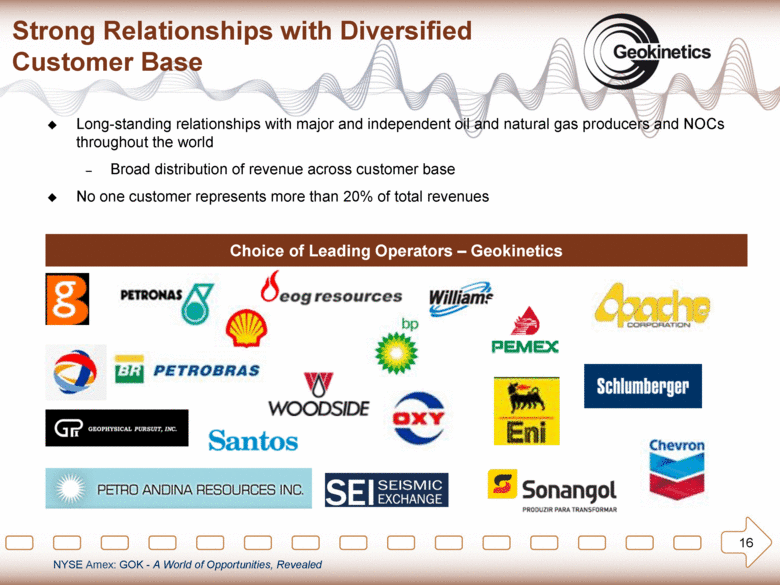
16 Strong Relationships with Diversified Customer Base Choice of Leading Operators – Geokinetics Long-standing relationships with major and independent oil and natural gas producers and NOCs throughout the world Broad distribution of revenue across customer base No one customer represents more than 20% of total revenues |
|
|
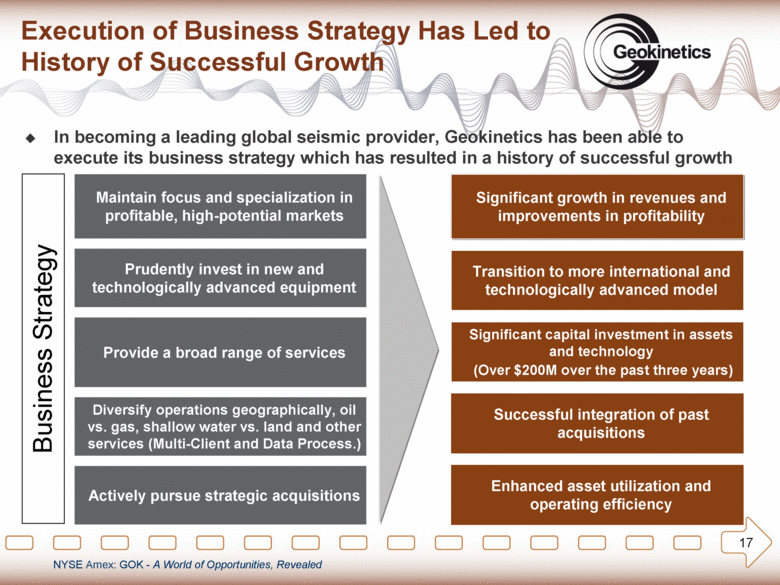
Execution of Business Strategy Has Led to History of Successful Growth Maintain focus and specialization in profitable, high-potential markets 17 Prudently invest in new and technologically advanced equipment Provide a broad range of services Diversify operations geographically, oil vs. gas, shallow water vs. land and other services (Multi-Client and Data Process.) Actively pursue strategic acquisitions In becoming a leading global seismic provider, Geokinetics has been able to execute its business strategy which has resulted in a history of successful growth Successful integration of past acquisitions Significant capital investment in assets and technology (Over $200M over the past three years) Transition to more international and technologically advanced model Significant growth in revenues and improvements in profitability Business Strategy Enhanced asset utilization and operating efficiency |
|
|
Financial Highlights |
|
|
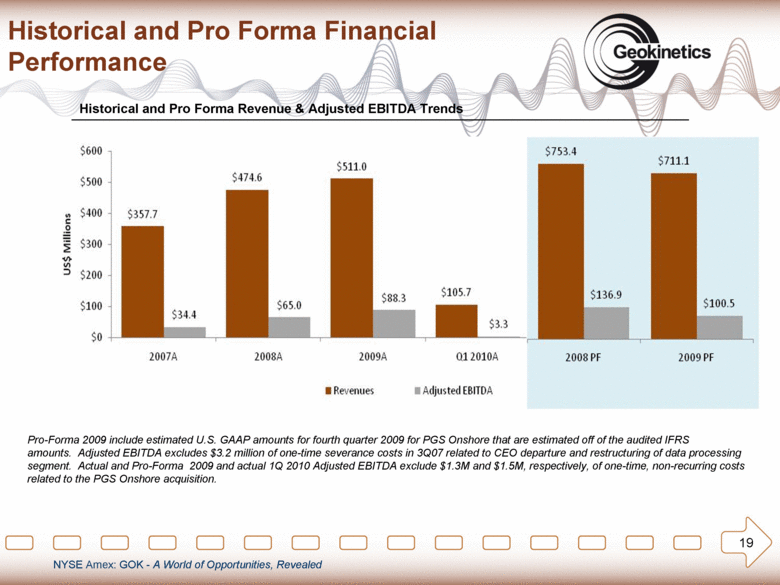
Historical and Pro Forma Financial Performance Historical and Pro Forma Revenue & Adjusted EBITDA Trends 19 Pro-Forma 2009 include estimated U.S. GAAP amounts for fourth quarter 2009 for PGS Onshore that are estimated off of the audited IFRS amounts. Adjusted EBITDA excludes $3.2 million of one-time severance costs in 3Q07 related to CEO departure and restructuring of data processing segment. Actual and Pro-Forma 2009 and actual 1Q 2010 Adjusted EBITDA exclude $1.3M and $1.5M, respectively, of one-time, non-recurring costs related to the PGS Onshore acquisition. |
|
|
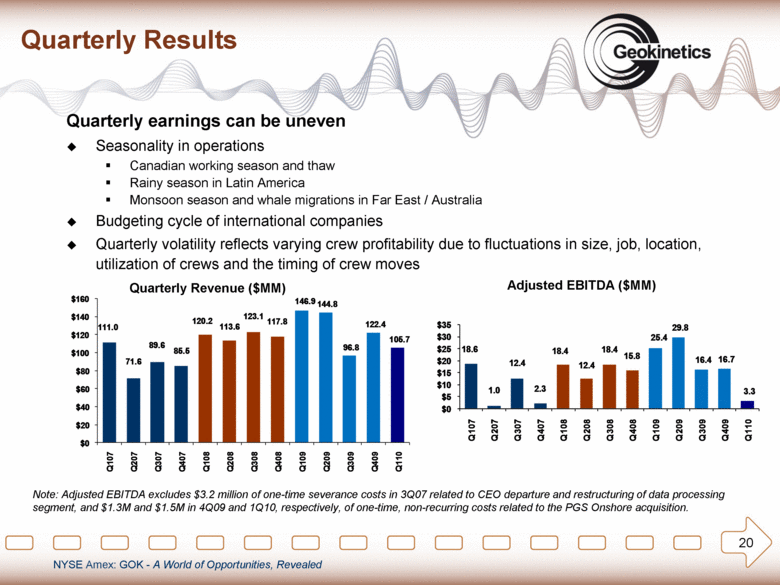
20 Quarterly Results Quarterly earnings can be uneven Seasonality in operations Canadian working season and thaw Rainy season in Latin America Monsoon season and whale migrations in Far East / Australia Budgeting cycle of international companies Quarterly volatility reflects varying crew profitability due to fluctuations in size, job, location, utilization of crews and the timing of crew moves Note: Adjusted EBITDA excludes $3.2 million of one-time severance costs in 3Q07 related to CEO departure and restructuring of data processing segment, and $1.3M and $1.5M in 4Q09 and 1Q10, respectively, of one-time, non-recurring costs related to the PGS Onshore acquisition. Quarterly Revenue ($MM) Adjusted EBITDA ($MM) 111.0 71.6 89.6 85.5 120.2 113.6 123.1 117.8 146.9 144.8 96.8 122.4 105.7 $ 0 $ 20 $ 40 $ 60 $ 80 $ 100 $ 120 $ 140 $ 160 Q 107 Q 207 Q 307 Q 407 Q 108 Q 208 Q 308 Q 408 Q 109 Q 209 Q 309 Q 409 Q 110 18.6 1.0 12.4 2.3 18.4 12.4 18.4 15.8 25.4 29.8 16.4 16.7 3.3 $ 0 $ 5 $ 10 $ 15 $ 20 $ 25 $ 30 $ 35 Q 107 Q 207 Q 307 Q 407 Q 108 Q 208 Q 308 Q 408 Q 109 Q 209 Q 309 Q 409 Q 110 |
|
|
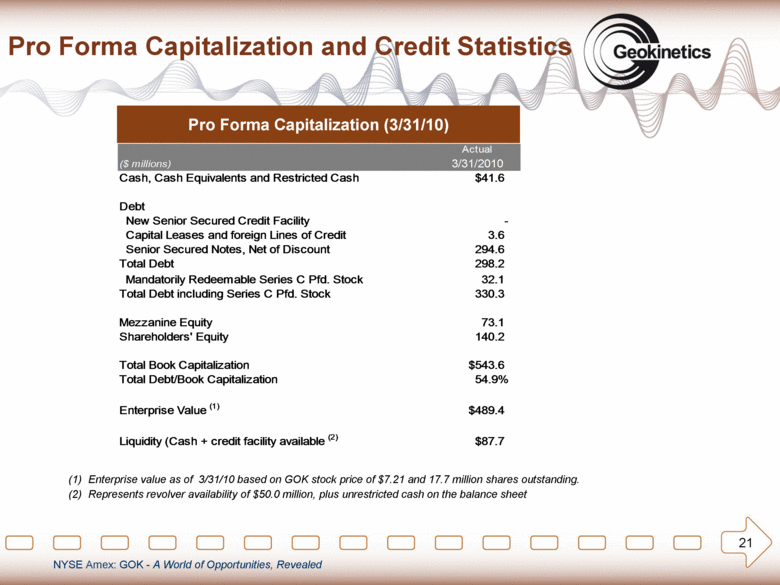
21 Pro Forma Capitalization and Credit Statistics Pro Forma Capitalization (3/31/10) (1) Enterprise value as of 3/31/10 based on GOK stock price of $7.21 and 17.7 million shares outstanding. (2) Represents revolver availability of $50.0 million, plus unrestricted cash on the balance sheet Actual ($ millions) 3/31/2010 Cash, Cash Equivalents and Restricted Cash $41.6 Debt New Senior Secured Credit Facility - Capital Leases and foreign Lines of Credit 3.6 Senior Secured Notes, Net of Discount 294.6 Total Debt 298.2 Mandatorily Redeemable Series C Pfd. Stock 32.1 Total Debt including Series C Pfd. Stock 330.3 Mezzanine Equity 73.1 Shareholders' Equity 140.2 Total Book Capitalization $543.6 Total Debt/Book Capitalization 54.9% Enterprise Value (1) $489.4 Liquidity (Cash + credit facility available (2) $87.7 |
|
|
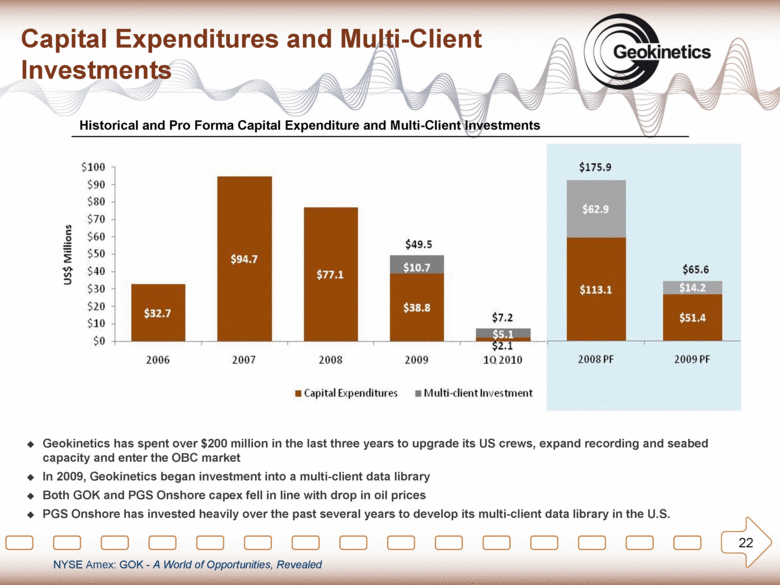
Capital Expenditures and Multi-Client Investments 22 Geokinetics has spent over $200 million in the last three years to upgrade its US crews, expand recording and seabed capacity and enter the OBC market In 2009, Geokinetics began investment into a multi-client data library Both GOK and PGS Onshore capex fell in line with drop in oil prices PGS Onshore has invested heavily over the past several years to develop its multi-client data library in the U.S. Historical and Pro Forma Capital Expenditure and Multi-Client Investments |
|
|
Thank you for your interest. Investor Presentation |

