Attached files
| file | filename |
|---|---|
| 8-K - FORM 8-K - HERITAGE FINANCIAL CORP /WA/ | d8k.htm |
 1
Exhibit 99.1 |
 Forward
Looking Statements 2
“Safe
Harbor”
statement
under
the
Private
Securities
Litigation
Reform
Act
of
1995:
This
presentation
contains
forward-looking
statements
that
are
subject
to risks and uncertainties, including, but not limited to: the credit risks of lending
activities, including changes in the level and trend of loan delinquencies and
write-offs and changes in our allowance for loan losses and provision for loan losses that
may be impacted by deterioration in the housing and commercial real estate markets;
changes in general economic conditions, either nationally or in our market areas; changes in the levels of general interest rates, and the
relative
differences
between
short
and
long
term
interest
rates,
deposit
interest
rates,
our
net
interest
margin
and
funding
sources;
fluctuations
in
the
demand for loans, the number of unsold homes and other properties and fluctuations in real
estate values in our market areas; results of examinations of us by the Board of
Governors of the Federal Reserve System (the “Federal Reserve Board”) and of our bank subsidiaries by the Federal Deposit Insurance
Corporation (the “FDIC”), the Washington State Department of Financial Institutions,
Division of Banks (the “Washington DFI”) or other regulatory authorities,
including the possibility that any such regulatory authority may, among other things, require us to increase our reserve for loan losses, write-
down assets, change our regulatory capital position or affect our ability to borrow funds or
maintain or increase deposits, which could adversely affect our liquidity and earnings;
legislative or regulatory changes that adversely affect our business including changes in regulatory policies and principles, including
the interpretation of regulatory capital or other rules; our ability to control operating
costs and expenses; the use of estimates in determining fair value of certain
of
our
assets,
which
estimates
may
prove
to
be
incorrect
and
result
in
significant
declines
in
valuation;
difficulties
in
reducing
risk
associated
with
the
loans
on
our
balance
sheet;
staffing
fluctuations
in
response
to
product
demand
or
the
implementation
of
corporate
strategies
that
affect
our
workforce
and
potential associated charges; computer systems on which we depend could fail or experience a
security breach; our ability to retain key members of our senior management team; costs
and effects of litigation, including settlements and judgments; our ability to implement our branch expansion strategy; our
ability to successfully integrate any assets, liabilities, customers, systems, and management
personnel we have acquired or may in the future acquire into our operations and our
ability to realize related revenue synergies and cost savings within expected time frames and any goodwill charges related thereto;
changes in consumer spending, borrowing and savings habits; the availability of resources to
address changes in laws, rules, or regulations or to respond to regulatory actions;
adverse changes in the securities markets; inability of key third-party providers to perform their obligations to us; changes in accounting
policies
and
practices,
as
may
be
adopted
by
the
financial
institution
regulatory
agencies
or
the
Financial
Accounting
Standards
Board,
including
additional
guidance and interpretation on accounting issues and details of the implementation of new
accounting methods; other economic, competitive, governmental,
regulatory,
and
technological
factors
affecting
our
operations,
pricing,
products
and
services;
future
legislative
changes
in
the
United
States
Department
of
Treasury
Troubled
Asset
Relief
Program
Capital
Purchase
Program;
and
other
risks
detailed
from
time
to
time
in
our
filings
with
the
Securities
and Exchange Commission.
The Company cautions readers not to place undue reliance on any forward-looking
statements. Moreover, you should treat these statements as speaking only as of the date
they are made and based only on information then actually known to the Company. The Company does not undertake and specifically
disclaims any obligation to revise any forward-looking statements to reflect the
occurrence of anticipated or unanticipated events or circumstances after the date of
such statements. These risks could cause our actual results for 2010 and beyond to differ materially from those expressed in any forward-looking
statements by, or on behalf of, us, and could negatively affect the Company’s operating
and stock price performance. |
 Overview
•
Company & Economic Information
•
Financial Performance
•
Credit Risk Management
•
Peer Group Analysis
•
Strategic Focus
3 |
 4
|
 Corporate
Structure 5
Total assets: $856 million
Branches: 14
Total assets: $155 million
Branches: 6
Financial Highlights
Total Assets
$1.01 billion
Net Loans
$733 million
Total Deposits
$836 million
Tangible Common Equity
$123 million
TARP Preferred
$ 24 million
Loan/Deposit Ratio
87.7%
Coverage Ratio (1)
86.0%
Core Deposit Ratio (2)
79.4%
Net Interest Margin
4.58% (Q1’10) 4.57% (FY2009)
Cost of Funds
1.22% (Q1’10) 1.60% (FY2009)
PTPP ROAA (3)
1.90% (Q1’10) 1.99% (FY2009)
(1) Allowance for loan loss/nonperforming loans
(2) All deposits less brokered CDs and CDs over $100,000
(3) Pre-tax, pre-provision return on average assets
Note: Numbers rounded for presentation purposes only
Financial data as of March 31, 2010 |
 6
Market Share with
Significant Growth Potential
WA State
County
# of
Branches
Deposits
(in millions)
Market
Share %
Market
Rank
Thurston
(Olympia)
5
$370
12.43%
1
Pierce
(Tacoma)
7
$243
2.48%
12
Mason
1
$ 68
17.76%
2
King
(Seattle)
1
$ 36
0.07%
44
Yakima
5
$115
4.91%
8
Kittitas
1
$ 19
3.42%
9
Source: SNL Financial |
 Economic
Outlook •
We have not yet achieved measurable and
sustainable growth in the Pacific Northwest
•
Our local economy will continue to struggle
until unemployment and real estate values
improve
•
However, we are seeing signs of improvement
7 |
 8
|
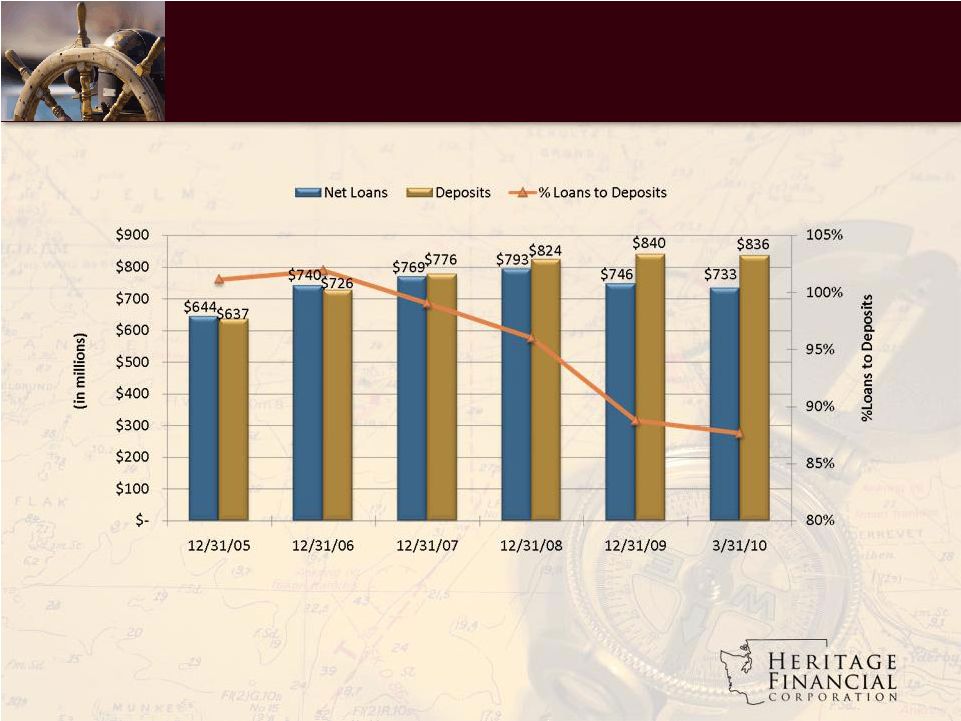 Loan and
Deposit Growth 9
Note: Of the $60 million decrease in loans since 12/31/08, $43 million were in the
construction loan portfolio |
 Diversified
Loan Portfolio 10
Financial data as of March 31, 2010
Total loans: $758 million
Average yield on loans: 6.58% |
 Diversified
Loan Portfolio 11
Commercial Loan Portfolio
Commercial Real Estate Portfolio
Financial data as of March 31, 2010
CRE owner occupied: $187 million
CRE non-owner occupied: $219 million
Total CRE portfolio: $406 million
CRE owner occupied: $187 million
CRE non-owner occupied: $219 million
Commercial and industrial: $197 million
Total Commercial Loans: $603 million |
 Diversified
Loan Portfolio 12
Construction loans: $83 million
Total loans: $758 million
Loan Portfolio
Construction Portfolio
Total construction portfolio reduced 36.2% since Dec. 31, 2008; represents 11.0% of total
portfolio down from 16.1% at Dec. 31, 2008
Financial data as of March 31, 2010 |
 Deposit
Growth 13
Total Avg. Deposits
$616,634 $691,002
$755,252
$787,758 $840,204 $837,719
Compounded Annual Growth Rate since 2005: Certificate of Deposits: 2.9%
Interest-Bearing Transaction Accounts: 11.0%
Non-Interest Bearing Demand Deposits: 9.2% |
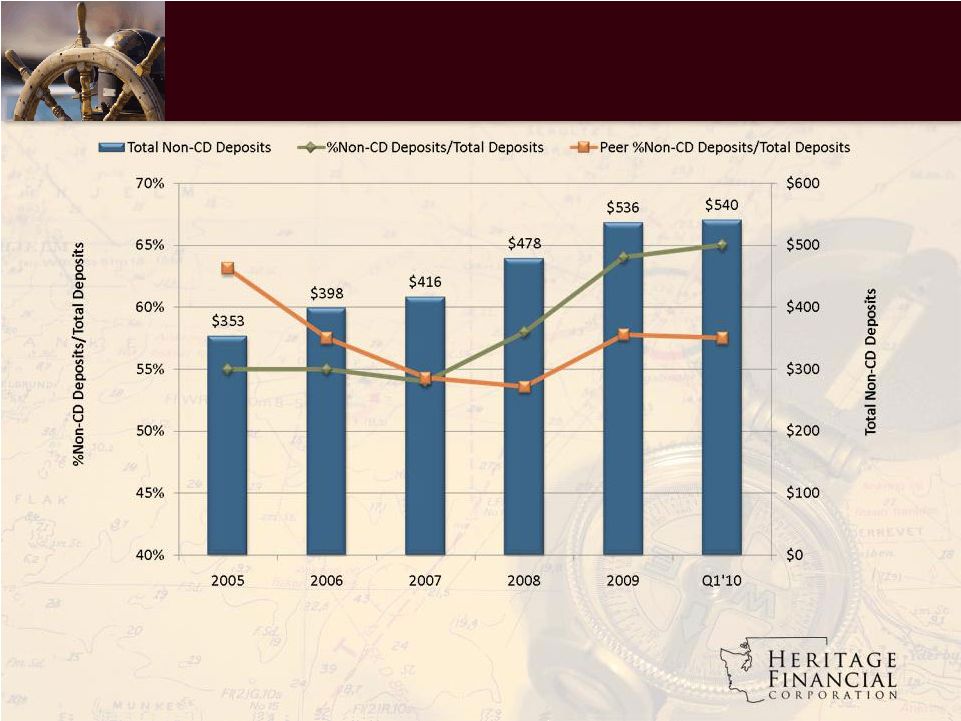 14
Non-CD Deposit Growth
Source: SNL Financial
Regional Peer Group (14) : All NASDAQ banks under $5 billion
in AK, ID, OR, and WA
Ticker Symbols –
BANR, CACB, CASB, COLB, CWLZ, FFNW, HOME, NRIM, PCBK, PRWT, RVSB,
TSBK, WBCO, WCBO |
 15
Stable Net Interest Margin
Source: SNL Financial
Regional Peer Group (14)
All ratios based on most recent reported quarter
Annual
Quarterly |
 Earnings
16
Quarterly Earnings
Annual Earnings |
 Core
Earnings 17
(1) Pre-tax, pre-provision return on average assets |
 Core
Earnings 18
(1) Pre-tax, pre-provision return on average assets |
 Equity
Growth 19
Note:
2008: TARP $24 million preferred securities sold
2009: $46.6 million net common equity raised |
 Strong
Capital Levels 20
Source: SNL Financial
Regional Peer Group (14)
All ratios as of December 31, 2009 |
 21
Total investment securities: $109 million
89% of portfolio is guaranteed by US Gov't
or Agencies
Quality Securities Portfolio
Financial data as of March 31, 2010 |
 22
|
 23
Credit Risk Management
•
Residential construction portfolio decreased
49% since January 2008 and today represents
only 5.5% of total loan portfolio
•
Ongoing CRE loan evaluation and stress
testing shows no measurable weakness
•
A focus to aggressively manage NPA levels
lower as we move through what we believe is
the last half of this credit cycle |
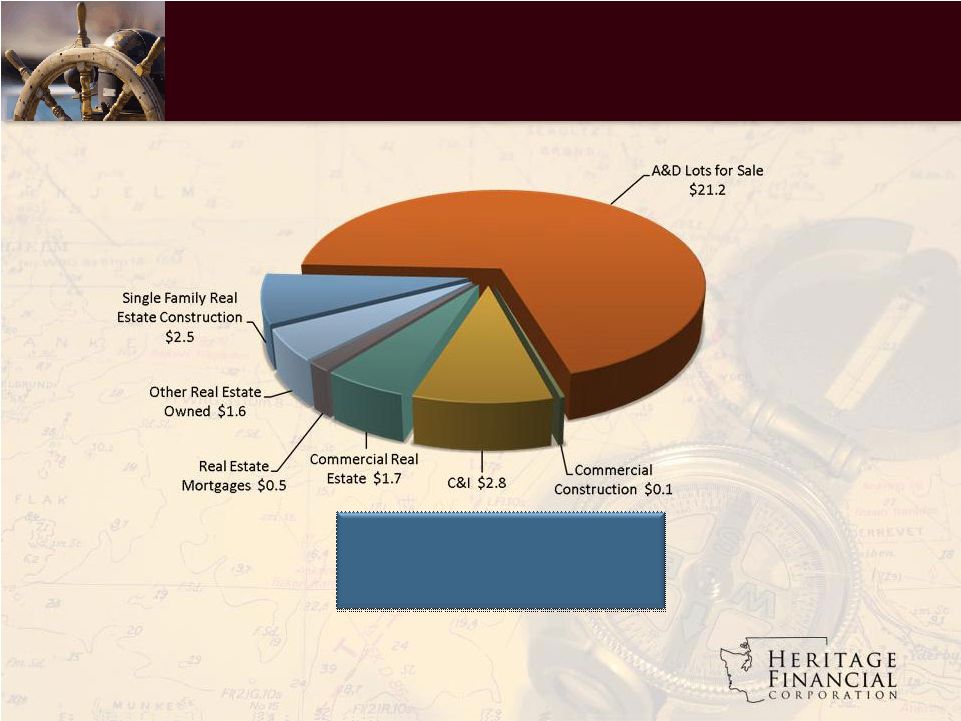 Non-Performing Assets Composition
24
Total nonperforming assets: $30.4 million
Nonperforming assets/total assets: 3.01%
Financial data as of March 31, 2010
Note: Dollars in millions |
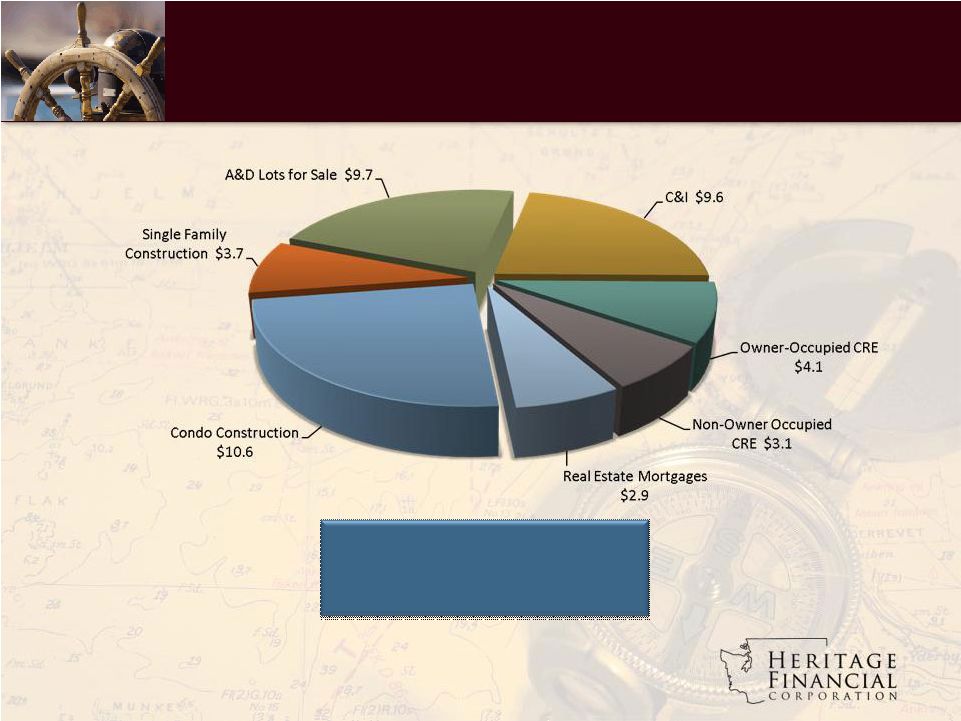 Classified
Loans by Category 25
Total classified loans: $ 43.7 million
Excludes nonperforming loans
Financial data as of March 31, 2010
Classified Loans are the regulatory definition of special mention, substandard, or
doubtful Note: Dollars in millions |
 Classified
Loans by County 26
Notes: Includes nonperforming loans
Financial data as of March 31, 2010 |
 27
Source: SNL Financial
Regional Peer Group (14)
Loan Provisioning |
 Credit Cycle
Risk Profile 28
Credit Quality Ratios
3/31/2010
Loan loss allowance
3.27%
Coverage ratio
86.0%
Nonperforming loans to total loans
3.81%
Nonperforming assets to total assets
3.01%
Pre-Tax, Pre-Provision Earnings
Q1’10
Pre-tax, pre-provision ROAA % / $
1.90% / $4,746 |
 29
|
 Selected Key
Ratios HFWA
Regional Peer
Group Median
HFWA Regional Rank
(out of 14)
National Peer
Group Median
HFWA National Rank
(out of 114)
Coverage Ratio (1)
79.3%
43.2%
#4
65.3%
#38
TCE/TA (2)
12.2%
9.19%
#4
7.43%
#5
PTPP ROAA (3)
1.99%
1.06%
#3
1.24%
#10
Efficiency Ratio
61.3%
64.0%
#4
69.1%
#12
Net Interest Margin
4.57%
4.01%
#4
3.66%
#17
30
(1)
Allowance for loan loss/nonperforming loans
(2)
Tangible common equity/tangible assets
(3) Pre-tax, pre-provision return on average assets
Source: SNL Financial
Ratios as of and for year-ended December 31, 2009
Regional Peer Group (14)
National Peer Group: All publicly traded US commercial banks (114) with assets between $750
million and $1.25 billion |
 Total Return
Performance 31
The above chart assumes that the value of the investment in Heritage’s common stock and
each of the two indices was $100 on December 31, 2004, and that all dividends were
reinvested. |
 32
|
 Strategic
Initiatives 33
•
Organic Growth
–
Renewed effort for organic loan growth
–
Continue focus on Non-CD deposit growth
–
New lender recruitment
–
Acquire/Build 1-2 new branches per year
•
Resume cash dividend payments
•
Continue to pursue FDIC assisted transactions |
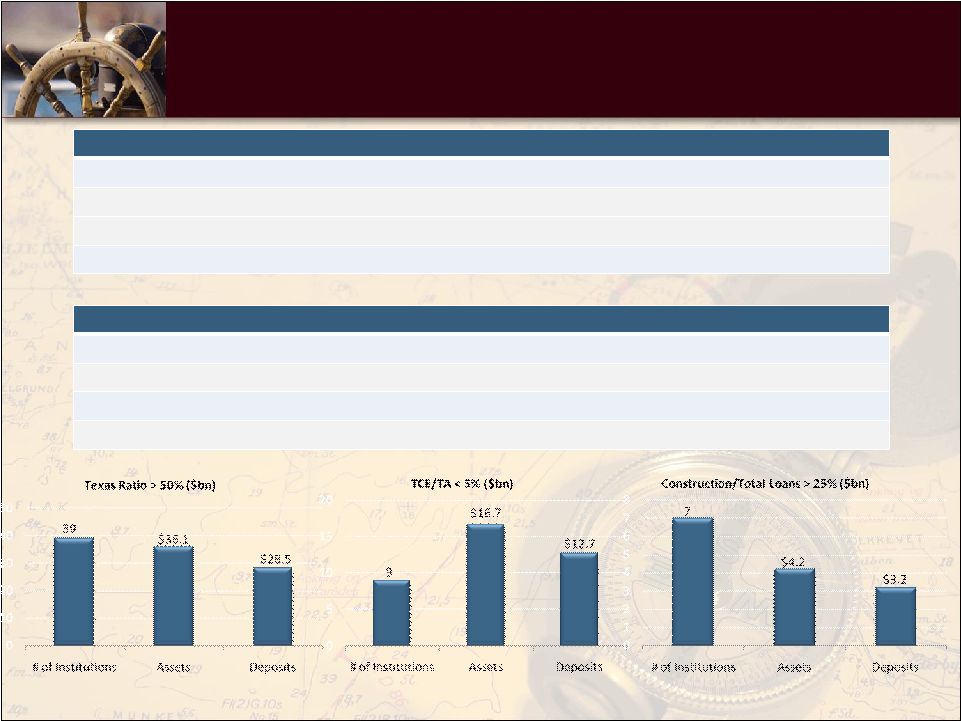 The FDIC
Market Opportunity *Texas Ratio: (NPA + 90 Days PD)/(Tangible Common Equity +
Reserves) 34
Summary of Analysis
19
Washington banks with a Texas Ratio* greater than 100%
14 Washington banks with a Texas Ratio* greater than 100% and assets under $600 million
39 Washington banks with a Texas Ratio* greater than 50%
9 Washington banks with tangible common equity/tangible assets less than 5%
Acquisition Considerations.
Fill-in or expand geographic footprint
Opportunity to take advantage of FDIC loss share agreements
Strengthen market share
Potential to significantly grow our company
Source: SNL Financial data as of March 31, 2010 |
 TARP
•
We have previously communicated:
–
We sold preferred securities to Treasury as a
precautionary strategy
–
We currently have the ability to repurchase these
securities today
–
We are hopeful, we will see sufficient local
economic improvement necessary to repurchase
our preferred securities yet this year
35 |
 Heritage
Highlights •
Community leader with deep roots in the communities
we serve since 1927
•
Experienced and disciplined management team
•
Strong and diversified balance sheet with no
borrowings
•
Solid loan loss coverage ratios and strong core earnings
•
Strong tangible capital levels
•
Historically stable and strong net interest margin
36 |
 37
|