Attached files
| file | filename |
|---|---|
| 10-K - FORM 10-K - NEDAK ETHANOL, LLC | form10k_040110.htm |
| EX-31.1 - SECTION 302 CERTIFICATION/FAGERLAND - NEDAK ETHANOL, LLC | form10kexh311_040110.htm |
| EX-32.2 - SECTION 1350 CERTIFICATION/BORER - NEDAK ETHANOL, LLC | form10kexh322_040110.htm |
| EX-31.2 - SECTION 302 CERTIFICATION/BORER - NEDAK ETHANOL, LLC | form10kexh312_040110.htm |
| EX-32.1 - SECTION 1350 CERTIFICATION/FAGERLAND - NEDAK ETHANOL, LLC | form10kexh321_040110.htm |
Exhibit 13.1
 |
Fiscal Year 2009 Annual Report
April 5, 2010
A letter from the President and General Manager
Dear NEDAK Investor: As I write to you, I’m looking back at a most remarkable five years, with the most recent filled with the first production from your ethanol plant. Many times during those five years we—your Board of Directors and I—wondered if we would ever reach this point; but today we are pleased to be able to report that we can now look back on some periods of positive results.
You need to know that we are completely past the development phase in which we formed the company and then experienced significant construction delays and financial losses accumulating to more than $16,000,000, in total since inception. Days of construction delays are gone and we have entered into a new time of challenge and promise. Looking ahead with a sense of hope and expectation, we renew our attention to the original vision and mission with which we began this project.
The challenges and possibilities of the days to come are different from the past. The final settlement with the construction contractor is done and we now have complete control of our production process and equipment. Ahead, the word “improvement” dominates our thinking—process improvement, equipment improvement and upgrade, training and skill improvement, improvement of feedstock, improvement of steady throughput, and in all of these, improvement of quality. We like to say that we have set our foot on the road of “Continuous Quality Improvement.”
This Annual Report containing our fiscal 2009 financial statements includes discussion of many challenges in the past two years. My message to you in this letter seeks to look forward with lessons learned and our plans and expectations for the future in light of those lessons. Overall, I have two main goals:
|
|
·
|
Increase Unit holder value by continuous improvement of efficiencies while controlling expenses and maximizing revenues.
|
|
|
·
|
Continue to review opportunities to increase revenues through product research and development.
|
Also, we continue with three initiatives which are of great value to NEDAK:
|
|
·
|
We will continue to develop relationships with other ethanol plants to share spare parts, share knowledge of plant performance improvements, and keep the discussions about the ethanol environment open.
|
|
|
·
|
Directors and Management will work closely with governmental officials in an effort to maintain a healthy political climate.
|
|
|
·
|
We are also working through the initial development of standard operating procedures intended to bring production to steady, consistent output of high quality ethanol and distiller’s grains.
|
Our Vision and Mission Statements are provided below in this Annual Report, but first a word about recent experiences. The past year has been difficult to endure for many reasons, but difficulties breed confidence and improve capabilities. We believe we have developed better strategies to improve crush margins, breakeven point operations and profit objectives.
One of the most important facets of this industry is risk management, focused on maintaining balance in the sale of ethanol and the purchase of corn. We must use the commodity forward-contract marketing tool to maintain smooth operations in the operation of an ethanol plant. Throughout the last 16 months, it has been difficult to acquire forward sales contracts for ethanol beyond six or eight weeks out. But, on the other side, it is necessary to forward contract the acquisition of corn in significant quantities into the future. There are risks in this relationship as seen by the financial troubles of many ethanol plants in 2009. When corn is forward-contracted and ethanol cannot be sold to balance, we face the risk that corn prices will fall, followed by ethanol, leaving the plant with excessive expenses in corn purchases, pushing the cost of ethanol above the market price. Even if the decision is made to shut down the plant, rather than operate at a loss, the purchase and resale of that corn will also result in a loss.
For the purpose of balancing these two largest line items of our income statement, we need to hedge the unbalanced side of this equation in the derivative markets to the extent we are able. As we have previously reported, our ability to hedge has been limited because of our working capital and liquidity, which were inhibited primarily by construction delays (which lead to increased costs and decreased production). We have been unable to exercise the scope of hedging needed to maintain balance to take advantage of favorable conditions in corn or ethanol markets. Without adequate reserves of cash and working capital, the potential margin calls in these derivative markets have forced us to forego profit taking when the opportunities have been present. In recent months, cash received in our settlement with the construction contractor has allowed us to engage in limited risk management and marketing efforts. Furthermore, we are awaiting the decision from the USDA on our application for a Business and Industries Guaranteed Loan for working capital of $5,000,000. This application was made by our lender on our behalf on February 16, 2010 and if received, its impact on our capital structure will be heavily influenced by the lender. We anticipate a decision from the USDA by early April, 2010.
We have improved our understanding of the distiller’s grains market. We missed some opportunities throughout the summer and fall of 2009 when the cattle feeder demand for this product was lowest in the annual cycle because the animals were on pasture graze.
With steady production this winter and in the foreseeable future, we are actively marketing this product by contract which seeks to provide distribution through the summer with some level of price support in return for discounted product through the winter. While certainly not guaranteed, we believe it is possible that this marketing strategy can improve 2010 financial performance by more than $2,000,000 over 2009.
In February 2010, the company retained the consulting services of a man who has over 15 years experience operating Delta-T ethanol manufacturing facilities. He is working closely with our operations management to improve, stabilize and develop our Standard Operating Procedures (SOPs). This expertise has already provided great value to us.
The need to continue to refine and develop the SOPs is linked tightly with the education and training of our operations staff. As you can read in the following vision and mission statements, the key to our success is in our people. We have made the commitment and now must follow through to develop the culture in our workplace that allows our people to take ownership and initiative in their jobs, to be proactive and innovative in problem solving, and to focus on the need to strive for Continuous Quality Improvement in all aspects of their activity.
Another significant initiative in recent months and into the future is in the tremendous benefits to be gained with strategic capital investment in equipment. It is obvious that in a company with inadequate working capital, the opportunity to invest in new, upgraded or modified equipment is limited. Nevertheless, the Directors and Management are actively pursuing any capital project that can bring immediate process or productivity improvements with cash flow and payback in the short term.
Finally, in the past year, the significant weaknesses of the community utility infrastructure appeared. In the summer, restricted gas supply was a problem when the surrounding farm irrigation activities drew so much natural gas from the pipeline that we were at times unable to operate the dryer and occasionally lost the process boilers due to inadequate gas pressures. Then, in the winter, the bad weather caused significant losses because of power failures. Most notably, when the power is lost suddenly and we are unable to operate the chillers and keep the temperature down in the fermentation process, the yeast will die, ending the production of ethanol—a significant loss to the company. The loss of corn with limited or no recovery of alcohol is the most significant financial loss we face, because the cost of corn sometimes exceeds 80% the market value of the ethanol. We have worked with our suppliers of both electricity and natural gas to minimize—if not stop altogether—such occurrences, and we are hopeful that 2010 will be much improved over 2009 in this regard.
Looking forward, your Management is confident that we better understand the relationships in the marketplaces in which we operate. We are ready to capture the upside potential of our commodity markets when the opportunities arise and our capital resources allow. As we all know, today’s environment is much different than when we were organized. However, we intend to continue in our efforts to develop our business into a valuable and productive enterprise that will provide returns to you in the future.
 |
Jerome Fagerland,
President and General Manager
 |
Building a Culture of Continuous Quality Improvement
The following statements of vision and mission have been established by the Board of Directors as a guide to management and employees for building workplace culture and customer service, now and into the future:
NEDAK Ethanol, LLC’s vision
is to be a premier manufacturer of ethanol and distiller’s grains with employees who are proactive and who reflect this vision with a culture of continuous improvement in the pursuit of excellence.
All individuals will work to hear the Voice of the Customer and to understand the customer’s needs. We recognize that customers are both internal and external recipients of our work product.
We want to recognize at the highest level, strengths and weaknesses
|
·
|
We want to have a common vision for all NEDAK people – directors, managers, employees and to some extent, vendors
|
|
|
o
|
to build on our strengths
|
|
|
o
|
to move forward, correcting our weaknesses.
|
|
·
|
In order to be effective we need to
|
|
|
o
|
Establish a culture based on stated vision and mission,
|
|
|
o
|
Set and obtain short, mid-term and long-term goals,
|
|
·
|
Our mission must include commitment to the corporate vision and ownership at each level of responsibility in all employees.
|
In order to accomplish our goals of being a premier manufacturer of ethanol and distiller’s grains we need to set a common value system which is directed from the highest levels of management within the company.
NEDAK Director’s vision:
Statement of belief.
We believe that our organization must serve four constituents–
|
|
1.
|
Shareholders,
|
|
|
2.
|
Employees,
|
|
|
3.
|
finished product purchasers,
|
|
|
4.
|
raw goods providers.
|
Statement of philosophy.
The key to our organization is our people, whom we expect to be innovative and to anticipate the future needs of our constituents. We will develop our human resources so that the staff will be well educated in manufacturing our key products and will be rewarded for providing excellence in their production.
Mission statement.
To provide the highest quality of manufactured goods delivered by a highly trained staff which will enhance the quality of life in our community, provide a superior return to our investors and place NEDAK in a leadership position in our market.
|
|
2009 Annual Report
|
Content
|
Page
|
|
Road Map
|
1 |
|
Forward-Looking and Cautionary Statements
|
1 |
|
Company Overview
|
2 |
|
Management’s Discussion & Analysis of Financial Condition and Results of Operation
|
5 |
|
Overview
|
5 |
|
2009 Production Levels and Net Income (Loss)
|
7 |
|
Revenues, Cost of Goods Sold, General & Admin discussion
|
8 |
|
2009 Events and Operational Matters
|
10 |
|
Liquidity and Capital Resources
|
13 |
|
Market Risk
|
15 |
|
Application of Critical Accounting Estimates
|
16 |
|
Off-Balance Sheet Arrangements
|
17 |
|
Our Directors and Officers
|
18 |
|
Changes in and Disagreenents with Accountants
|
18 |
| Market Price and Dividends | 18 |
|
Management’s Responsibility for Financial Information
|
19 |
|
Management’s Report on Internal Control over Financial Reporting
|
19 |
|
Audited Financial Statements for the Years ended December 31, 2009 and 2008
|
|
|
Reports of Independent Registered Public Accounting Firms
|
F-1 |
|
Balance Sheets
|
F-3 |
|
Statements of Operations
|
F-4 |
|
Statements of Changes in Members’ Equity
|
F-5 |
|
Statements of Cash Flows
|
F-6 |
|
Notes to Financial Statements
|
F-7 |
|
|
2009 Annual Report Road Map
This Road Map is designed to provide the reader with some perspective on the information contained in this Annual Report and its contents. The Company Overview section gives a brief overview of the Company. The financial component of this 2009 Annual Report consists of management’s discussion of our financial condition and results of operation, our audited financial statements for the years ended December 31, 2009 and 2008, and the notes to the financial statements.
|
|
·
|
Management’s Discussion & Analysis of Financial Condition and Results of Operation is designed to provide readers with a narrative on the company’s financial results and certain factors that may affect future prospects from the perspective of the company’s management.
|
|
|
·
|
The audited financial statements and related notes provide an overview of the company’s income and cash flow performance and its financial position.
|
Forward-Looking and Cautionary Statements
Certain statements contained in this 2009 Annual Report may constitute forward-looking statements within the meaning of the Private Securities Litigation Reform Act of 1995. These statements involve a number of risks, uncertainties and other factors that could cause actual results to be materially different, as discussed more fully elsewhere in this Annual Report and in the company’s filings with the Securities and Exchange Commission (“SEC”), including the company’s 2009 Form 10-K filed on April 5, 2010.
1
| |
Company Overview
General
NEDAK Ethanol, LLC, a Nebraska limited liability company (the “Company,” “we” or “us”) was formed in 2003 to construct and operate our ethanol plant near Atkinson, Nebraska. We began producing ethanol and distiller’s grains at the plant in December 2008, but did not commence full production until June of 2009. Our ethanol plant will consume approximately 16 to 18 million bushels of locally grown corn annually, and produce approximately 44 million gallons of denatured fuel-grade ethanol and approximately 340,000 tons of wet distillers grains for feed cattle annually. With construction complete, we intend to focus on maintaining and exceeding 100% name plate production of our plant and resolving the challenges of our capital structure existing in our lending arrangements.
Business Model
Our business model is established to add value to our Unit holders’ investment and to the local economy in the small-town, rural community of Holt County, Nebraska.
The addition of value to the agricultural production of this farming community by conversion of corn to ethanol as well as development of the animal feed market for distiller’s grains provides jobs and significant economic activity. Many of our Members are corn producers and cattle feeders. We seek to provide an economic benefit to our community as a vehicle to all nearby producers to reduce their commodity market risk by adding incremental marketing opportunities for consumption of their product into the national blending of unleaded gasoline with ethanol. Before the startup of our operations, the area corn producers were forced to export a significant volume of their product out of the area at a significant transport cost. Our local demand for corn has reduced that cost of transportation and added the indirect market for gasoline as an incremental market place for the distribution of their product.
Additional value is also derived in our business model by the improved nutritional benefits from conversion of corn to distiller’s grain for the cattle feeders. This market is still developing, but the value of distiller’s grains when fed to cattle is an evident advantage above feeding raw corn.
Strategy
In our view, the political and economic climate in the United States and globally has established a permanent marketplace for ethanol. In the past few years the U. S. ethanol production capacity has grown to 12 billion gallons annually, and significant portions of that capacity are owned by direct investment from the largest players in the U. S. fossil fuel markets.
In that marketplace, we produce barely 1/3 of 1% of that domestic capacity. This reality leaves us with strategic challenges. Furthermore, the economic realities leave us with unique financial challenges as compared to most other producers. With approximately half of our assets leveraged with borrowed funding and as a new plant in an industry with approximately a third of all plants nearly fully depreciated and perhaps more than another third recently out of bankruptcy, we have a high interest burden requiring cash as well as a large non-cash depreciation burden to cover. That marketplace is experiencing dramatic swings in potential profitability. In 2009, the “Crush Margin” (the difference between the market prices of ethanol and corn per gallon of ethanol produced) swung from a low of $0.18 to a high of $0.61 per gallon. Combined interest and depreciation alone will be more than $0.21 per gallon for the Company in 2010. Thus, our strategy is to minimize losses and take as great advantage as possible in the marketplace with risk management.
After risk-management, our strategic initiatives include improving production efficiencies, maximizing throughput, controlling expenses, and seeking to increase revenues in an innovative way.
2
Snapshot of our Business
Below are three presentations of key economic drivers of our business: where we sell our product, Chicago Board of Trade (“CBOT”) crush margins, and a trend of reformulated blendstock for oxygenate blending (“RBOB”) pricing compared to ethanol pricing.
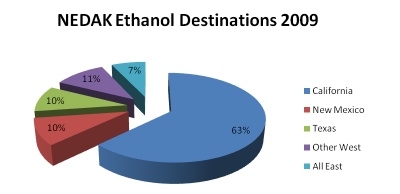
Where we sell our product
We believe that we have an advantage due to our location and the geography of other plant locations across the country. Our westernmost location provides us with a transportation cost advantage when shipping to our western customers. The large population in California is evident in the proportion of our sales delivered into that market, with New Mexico and Texas drawing effectively equal portions of our product as all the rest of the western states. Only 7% of our product has shipped into the eastern U. S. in 2009.
 |
3
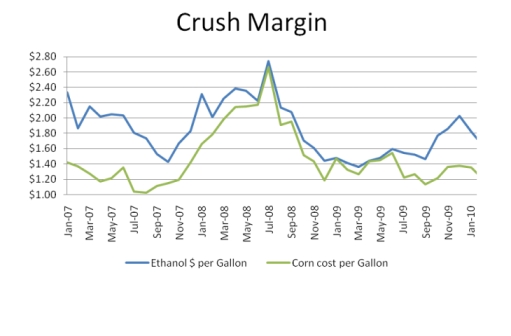
Crush margin & RBOB
The relationship between the cost of corn and the price of ethanol is demonstrated in the following graph. This correlation is clearly primary in our marketplace. The relationship between the cost of gasoline and ethanol is less direct, as shown in the RBOB graph, demonstrating that several times in the last three years, ethanol has actually been priced above the market price of RBOB, which is the unleaded gasoline base for the E10 product that is the dominant product in which ethanol is consumed.
 |
 |
4
| |
Management’s Discussion & Analysis of Financial Condition
and Results of Operation
Overview
We completed full startup of our ethanol plant in June 2009, and have the capacity to annually process approximately 17 million bushels of corn, through a dry milling process, into approximately 44 million gallons of ethanol per year (“mgy”). We also produce approximately 340,000 tons of wet distiller’s grains annually. We are currently operating at approximately 100% capacity.
Our profitability is primarily driven by the relationship between the cost of our primary input, corn, and the price at which we can sell our primary product, ethanol. Our plant needs approximately 16 to 18 million bushels of corn per year, or approximately 47,000 bushels per day, as the feedstock for its dry milling process. The grain supply for our plant is obtained primarily from local markets. The price and availability of corn are subject to significant fluctuations depending upon a number of factors that affect commodity prices in general, including crop conditions, weather, governmental programs and foreign purchases. In recent months, the market price of ethanol has tended to track the market price of corn. However, the market price for energy, and for gasoline in particular, has provided a ceiling for the market price of ethanol without respect for the price of corn. We therefore anticipate that our plant’s profitability will be negatively impacted during periods of high corn prices, especially when the market prices for energy are low. As of March 12, 2010, corn for May 2010 delivery was $3.64 a bushel.
Ethanol prices fell over the final quarter of 2009 as a direct response to falling corn prices. We currently expect ethanol prices will continue to be directly related to the price of corn and believe the industry will need to grow both product delivery infrastructure and demand for ethanol in order to increase production margins in the near and long term. Ethanol annual productive capacity has continually grown since 1980. According to the Renewable Fuels Association, in 2002, ethanol production in the U.S. surpassed two billion gallons, by 2007, production further increased to 6.5 billion gallons, and in 2009 it topped ten billion gallons. Due to general economic difficulties and commodity prices in the last half of 2008, approximately two billion gallons of additional capacity that was planned or already under construction was put on hold, but the Renewable Fuels Association indicates that total ethanol production capacity is now approximately 12 billion gallons. The ethanol industry’s rapid expansion could yield more ethanol than the renewable fuel standard (“RFS”) requirements depending on when idle capacity is brought back online. This means the ethanol industry must continue to generate demand for ethanol beyond the minimum floor set by the RFS in order to support current ethanol prices.
Our other primary source of revenue is the sale of distiller’s grains. Because distillers grains compete with other protein-based animal feed products, the price of distiller’s grains may decrease when the prices of competing feed products decrease. Downward pressure on commodity prices, such as soybeans and corn, will generally cause the price of competing animal feed products to decline, resulting in downward pressure on the price of distiller’s grains, which will result in lower revenues. We currently anticipate an increase in revenues from the sale of distillers grains in 2010 over the level achieved in 2009.
As discussed in greater detail in our Annual Report on Form 10-K, the demand for ethanol is heavily influenced by federal, and in some cases, state, law. Accordingly, our financial performance is tied directly to the continuation of mandates requiring ethanol use, such as the RFS, and other legislation which encourages ethanol production.
Because our financial performance is based upon the interplay of commodities, one of the most important facets of our industry is risk management, focused on maintaining balance in the sale of ethanol and the purchase of corn. To the extent our capital allows, we use commodity forward-contract marketing. When corn is forward-contracted and ethanol cannot be sold to balance, we face the risk that corn prices will fall, followed by ethanol, leaving the plant with excessive expenses in corn purchases, pushing the cost of ethanol above the market price. Even if the decision is made to shut down the plant, rather than operate at a loss, the purchase and resale of that corn will also result in a loss.
Our ability to hedge has been limited because of our working capital and liquidity. Cash received in our settlement with Delta-T has allowed us to engage in limited risk management and marketing efforts, and we are awaiting the decision from the United States
5
Department of Agriculture (“USDA”) on our application for a Business and Industries Guaranteed Loan (“B&I Loan”) for working capital of $5,000,000. If we do receive the B&I Loan, we would have additional working capital available to hedge, subject to our lender’s requirements.
Current Outlook
In the beginning of 2010, we have been forced to continue running the plant at reduced rates due to the poor quality corn crop and increased foreign material in the corn fines. The plant production staff continues to closely monitor the beer column (part of the ethanol manufacturing process) and is making adjustments to the process, minimizing the impact of plugging and fouling on production rates. Adjustments include reducing solids content in the mash going to the beer column, adjusting temperatures in the beer column, and retuning process controllers for temperature and level control. We intend to gradually increase the steady-state rates up to 100% of name-plate capacity and expect we will be able to maintain these production levels into the future and return to profitability during the first quarter of 2010.
Our priorities for early 2010 include modifying our air permit with the Nebraska Department of Environmental Quality (“NDEQ”), correct the beer column pressures which limited production throughput in the fourth quarter of 2009, establishing a protocol for receiving poorer quality corn harvested in 2009, converting our construction loan to an operating line, and acquiring adequate working capital through the USDA for a Business and Industries guaranteed loan for $5,000,000.
We expect to spend at least the next 12 months focused on plant operations, including three primary functions: (i) managing cost-effective purchases of inputs for our production process, (ii) optimizing the production process to reduce manufacturing costs, and (iii) monitoring and evaluating the performance of our marketing agents to ensure effective marketing of our ethanol and distiller’s grains.
6
2009 Production Levels and Net Income (Loss)
Operational production of ethanol and distiller’s grains began in January 2009. For the first four months of 2009, our construction contractor, Delta-T Corporation (“Delta-T”) maintained control of the plant and operated it at partial capacities while completing the construction and repair of numerous construction and design deficiencies. Full production commenced in June 2009 and the control of the plant was delivered to us in July, 2009. We had no production in 2008, nor sales with which we can compare 2009.
Monthly summary of 2009 operations:
|
Ethanol Gallons Produced (000’s)
|
Corn Bushels Ground (000’s)
|
Denatured Yield
|
Tons of Wet DGs Sold (000’s)
|
Tons of Dry DGs Sold (000’s)
|
|||||
|
January
|
2,817
|
1,051
|
2.68
|
22
|
-
|
||||
|
February
|
2,347
|
839
|
2.80
|
22
|
-
|
||||
|
March
|
2,428
|
861
|
2.82
|
24
|
-
|
||||
|
April
|
2,961
|
1,041
|
2.84
|
22
|
-
|
||||
|
May
|
-
|
-
|
-
|
-
|
-
|
||||
|
June
|
3,465
|
1,238
|
2.80
|
10
|
3
|
||||
|
July
|
3,340
|
1,177
|
2.84
|
15
|
3
|
||||
|
August
|
4,011
|
1,416
|
2.83
|
21
|
5
|
||||
|
September
|
3,643
|
1,274
|
2.86
|
22
|
4
|
||||
|
October
|
3,222
|
1,181
|
2.73
|
25
|
1
|
||||
|
November
|
3,733
|
1,376
|
2.71
|
23
|
1
|
||||
|
December
|
3,011
|
1,114
|
2.70
|
24
|
2
|
||||
|
Total
|
34,978
|
12,568
|
2.78
|
230
|
19
|
Quarterly summary of 2009 operations:
|
Ethanol Gallons Produced (000’s)
|
Corn Bushels Ground (000’s)
|
Denatured Yield
|
Tons of Wet DGs Sold (000’s)
|
Tons of Dry DGs Sold (000’s)
|
Net Income (Loss)
(000’s)
|
||||||
|
Quarter 1
|
7,592
|
2,751
|
2.76
|
68
|
-
|
$ (3,843)
|
|||||
|
Quarter 2
|
6,426
|
2,279
|
2.82
|
32
|
3
|
(4,423)
|
|||||
|
Quarter 3
|
10,994
|
3,867
|
2.84
|
58
|
12
|
(3,019)
|
|||||
|
Quarter 4
|
9,966
|
3,671
|
2.71
|
72
|
4
|
2,050
|
|||||
|
Total
|
34,978
|
12,568
|
2.78
|
230
|
19
|
$ (9,235)
|
As can be seen, the production volumes of the third quarter were the best of the year. The third quarter volumes resulted from maximizing throughput in our new plant. Fourth quarter production volumes were hampered by the learning curve around maintenance and cleaning processes as well as severe winter weather causing breakdowns and power failures. Nonetheless, even without the Delta-T settlement income of approximately $3.8 million, profitability improved in the fourth quarter because of improved pricing of distiller’s grains and wider ethanol crush margins.
The first two quarters of 2009 were hurt by decreased production volumes with an incomplete plant and historically poor crush margins, as well as poor demand and prices for distiller’s grains.
7
Summary of our 2009 Income Statement Items:
|
First Half
2009
|
First Half 2009 Percentage
|
Second Half 2009
|
2009 Year
Total
|
2009 Percentage
|
||||||||
|
Revenues
|
$
|
25,285,079
|
100%
|
$
|
42,251,029
|
$
|
67,536,108
|
100%
|
||||
|
Cost of Goods Sold
|
30,709,680
|
121%
|
43,818,627
|
74,528,307
|
110%
|
|||||||
|
Gross Loss
|
(5,424,601)
|
(21%)
|
(1,567,598)
|
(6,992,199)
|
(10%)
|
|||||||
|
General & Admin. Expenses
|
1,242,819
|
5%
|
1,353,863
|
2,596,682
|
4%
|
|||||||
|
Operating Loss
|
(6,667,420)
|
(26%)
|
(2,921,461)
|
(9,588,881)
|
(14%)
|
|||||||
|
Other Income (Expense) net
|
(1,599,244)
|
(7%)
|
1,952,877
|
353,633
|
1%
|
|||||||
|
Net Loss
|
$
|
(8,266,664)
|
(33%)
|
$
|
(968,584)
|
$
|
(9,235,248)
|
(14%)
|
||||
Summary of our second half 2009 Income Statement Items:
|
Second Half
2009
|
Second Half 2009 Percentage
|
Third Quarter 2009
|
Fourth Quarter 2009
|
Fourth Quarter Percentage
|
||||||||
|
Revenues
|
$
|
$42,251,029
|
100%
|
$
|
$20,326,786
|
$
|
$21,924,243
|
100%
|
||||
|
Cost of Goods Sold
|
43,818,627
|
104%
|
21,477,426
|
22,341,201
|
102%
|
|||||||
|
Gross Profit (Loss)
|
(1,567,598)
|
(4%)
|
(1,150,640)
|
416,958
|
2%
|
|||||||
|
General & Admin. Expenses
|
1,353,863
|
3%
|
966,774
|
387,089
|
2%
|
|||||||
|
Operating Loss
|
(2,921,461)
|
(7%)
|
(2,117,414)
|
(804,047)
|
(4%)
|
|||||||
|
Other Income (Expense) net
|
1,952,877
|
5%
|
(902,124)
|
2,855,001
|
13%
|
|||||||
|
Net Loss
|
$
|
($968,584)
|
(2%)
|
$
|
($3,019,538)
|
$
|
$2,050,954
|
9%
|
||||
Improvement is seen in the comparison of the fourth quarter to the third quarter and of the second half to the first half of 2009. The improved crush margin as discussed above under “Quarterly summary of 2009 operations” made the most significant impact in the fourth quarter. Additionally in the fourth quarter, “Other Income,” includes $3,766,567 that was recovered from Delta-T as mitigation of financial losses in construction delays. Finally, our revenues from distiller’s grains improved in the fourth quarter when cattle feedlots moved their cattle off the pasture grass.
Revenues, Cost of Goods Sold, General & Admin discussion
Revenues
Revenues from operations come from two primary sources: sales of ethanol and distiller’s grains. For the twelve months ended December 31, 2009, without freight reimbursements, we received $53,785,224 (approximately 80%) of our revenue from the sale of ethanol and $8,006,646 (approximately 12%) of our revenue from the sale of distiller’s grains. The average selling price for ethanol was $1.56 per gallon, for wet distiller’s grains was $27.05 per ton and for dry, $84.47 per ton. We sold approximately 34.3 million gallons of ethanol in total for the year ended December 31, 2009, with 11.2 million and 10.0 million gallons sold in the third quarter ended September 30, 2009, and the fourth quarter ended December 31, 2009, respectively. We sold approximately 59,000 and 72,000 tons of wet distiller’s grains and 11,000 and 5,000 tons of dried distiller’s grains in the third quarter ended September 30, 2009, and the fourth quarter ended December 31, 2009, respectively.
As reported in the third quarter, there are two price/cost relationships that must improve for us to become profitable. Those two relationships are in (i) the cost of corn compared to the price of ethanol and (ii) the price of distiller’s grain relative to the costs that remain uncovered by the crush margin achieved from the sale of ethanol net of the cost of corn. These two relationships are inherent in the largest numbers in our statement of operations which in descending order are (i) ethanol sales, (ii) corn purchases, and (iii) distiller’s grains revenue.
We expect the price of ethanol, relative to corn costs (the “Crush Margin”) to rise. For the nine months ended September 30, 2009, our revenue from sales of ethanol was only 131% of the cost of our corn. In the three months ended December 31, 2009, it was 148% of the cost of corn. Historically, this relationship is annually at its worst in the first quarter, but we expect improvement. For January and February 2010 combined, this ratio was 124%, which is worse than in the fourth quarter of 2009 but better than the first quarter of 2009. The decreased margin in this period was caused by depressed unleaded gasoline prices and low demand for ethanol relative to supply. Our forecast for this ratio in 2010 is 139%, which we believe will be driven higher by three factors: (i) improvement in the U.S. economy, (ii) continued political support for ethanol and the renewable fuel standard, and (iii) improvement of our ability to negotiate favorable corn costs and contract terms with increased working capital, increased liquidity and steady operations.
8
The timing of the startup of the plant caused additional upward pressure on the high cost of corn in the first nine months of 2009. With construction delays beginning early in 2007 and continuing with disruption into September of 2009, we were unable to enter into any forward contracts for corn during the 2008 harvest, when the most favorable corn costs throughout the year are usually available. Then, during the times when the corn supply was at the lowest part of the annual cycle, we were forced to buy corn from every source possible in order to provide for an extended period of commissioning and startup of the plant.
Finally, we expect the price of distiller’s grains to improve. For the twelve months ended December 31, 2009, sales of distiller’s grains only accounted for 11% of our sales, when both ethanol and distiller’s grains revenues were depressed. As explained above, our strategy is to contract for sales throughout the summer at rates improved over 2009 summer rates in return for reduced rates in the first quarter and spring of 2010. We expect this strategy to result in increases in distiller’s grain revenue in 2010 above 2009.
Cost of Goods Sold
Our cost of goods sold as a percentage of revenues was 110% for the twelve months ended December 31, 2009, which includes the improvement in the fourth quarter when that ratio was 102%. The improvement in the fourth quarter was caused by improved ethanol prices relative to the cost of corn, combined with the improvement of the price of distiller’s grains. Our two primary costs of producing ethanol and distiller’s grains are corn and natural gas costs. As of December 31, 2009, we have forward purchase contracts for delivery of 2,183,000 bushels of corn through December 2010, for a total commitment of approximately $8,255,000. We expect continued volatility in the price of corn, which could significantly impact our cost of goods sold. The following chart provides more detail on our cost of goods sold, and a comparison between the periods.
Corn is the largest component of our cost structure. Through 2009, the cost of corn per gallon of ethanol produced averaged $1.26, with a monthly minimum average of $1.11 and maximum of $1.46.
|
Cost of Goods Sold Items
|
First Half
2009
|
First Half 2009 Percentage
|
Second Half 2009
|
Total Year
2009
|
2009 Percentage
|
||||||||
|
Revenues
|
$
|
25,285,079
|
100%
|
$
|
42,251,029
|
$
|
67,536,108
|
100%
|
|||||
|
Costs:
|
|||||||||||||
|
Corn
|
17,472,787
|
69%
|
26,401,540
|
43,874,327
|
65%
|
||||||||
|
Denaturant & Chemicals
|
1,850,871
|
7%
|
2,404,222
|
4,255,093
|
6%
|
||||||||
|
Ethanol Freight Costs
|
3,410,372
|
13%
|
4,603,239
|
8,013,611
|
12%
|
||||||||
|
Natural Gas and Electricity
|
3,006,839
|
12%
|
5,252,552
|
8,259,391
|
12%
|
||||||||
|
Production Labor
|
1,062,178
|
4%
|
1,236,776
|
2,298,954
|
3%
|
||||||||
|
Supplies and Maintenance
|
522,383
|
2%
|
109,475
|
631,858
|
1%
|
||||||||
|
Property Tax
|
330,000
|
1%
|
778,134
|
1,108,134
|
2%
|
||||||||
| Depreciation |
3,054,250
|
12% | 3,032,689 |
6,089,939
|
9% | ||||||||
| Total Cost of Goods Sold | $ |
30,709,680
|
121% | $ |
43,818,627
|
74,528,307
|
110% | ||||||
9
General and Administrative Expenses
Our general and administrative expense as a percentage of revenues for the six and twelve months ended December 31, 2009 was 3% and 4%, respectively. General and administrative expenses include salaries and benefits of administrative employees, insurance, professional fees and other general administrative costs. The following chart provides more detail on our general and administrative expenses, and a comparison between the periods. Professional fees increased in the second half of 2009, primarily for legal expenses associated with the settlement with Delta-T.
|
General and Administrative
Expense Items
|
First Half
2009
|
First Half 2009 Percentage
|
Second Half 2009
|
Total Year
2009
|
2009 Percentage
|
||||||||
|
Revenues
|
$
|
25,285,079
|
100%
|
$
|
42,251,029
|
$
|
67,536,108
|
100%
|
|||||
|
Costs:
|
|||||||||||||
|
Administrative People Costs
|
461,981
|
2%
|
499,875
|
961,856
|
1%
|
||||||||
|
Professional Fees
|
450,818
|
2%
|
638,459
|
1,089,277
|
2%
|
||||||||
|
Insurance
|
169,921
|
1%
|
191,959
|
361,880
|
1%
|
||||||||
|
Other
|
160,099
|
1%
|
23,570
|
183,669
|
1%
|
||||||||
|
Total General and Administrative Expenses
|
$
|
1,242,819
|
5%
|
$
|
1,353,863
|
$
|
2,596,682
|
4%
|
|||||
2009 Events and Operational Matters
After four months of poor financial performance from start-up in January through April 2009, followed by complete shutdown of the plant for the entire month of May, a decrease in demand for distiller’s grains through the summer, finally in August, we realized improved financial performance, which continued through the fall. In November, our internal, unaudited financial statements showed the first net profit due to improving commodity market pricing for ethanol and corn. We expected this increased profitability to continue in December but were disappointed when both our yield and throughput were depressed as a result of a variety of problems and complications. These problems resulted in very disappointing financial results for the month. The following provides an overview of the material events which impacted our loss of approximately $9,200,000 in 2009.
January - July
We averaged net losses of nearly $1,400,000 per month through the first two quarters of 2009 with losses continuing into the third quarter. This was primarily due to the following reasons, some of which will not occur in the future, and others which we do not expect to occur at the same time in the future:
|
|
·
|
Delta-T limited our production to two-thirds capacity from January through April while it demolished and rebuilt the third fermenter.
|
|
|
·
|
Poor pricing relationships between ethanol and corn. In April, the CBOT Crush Margin bottomed out at $0.1878 per gallon, whereas our break-even Crush Margin is approximately $0.45.
|
|
|
·
|
The construction shutdown of the plant for the entire month of May resulted in zero production that month.
|
|
|
·
|
The depression of the distillers grains market beginning in May.
|
August - October
These three months were most affected by the continued depression of the distiller’s grains markets. The average monthly revenue from distiller’s grains was less than $600,000 in these months. Our 2010 and 2011 forecasts for monthly distiller’s grains revenue are more than $1,000,000 and $1,400,000, respectively. We seek to mitigate distiller’s grain pricing risk by working with local customers to establish annual contracts and improve summer pricing.
Due to the uncertainties in the completion of our plant construction by Delta-T and two years of continuous start-up delays, we were unable to forward contract for summer corn delivery. As a result, we were forced to purchase all corn at spot prices when seasonal fluctuations before harvest caused corn prices to rise. Historically (prior to the start-up of operations), the average basis (reduction from the CBOT price) in this geographic area has been approximately $0.50 per bushel. Because of the inability to forward contract summer corn delivery in 2009, we were unable to benefit from this regional competitive advantage. We estimate the result of this was a cost of more than $250,000 per month through this period. However, considering the market changes associated with start-up of the plant and the incremental demand for corn in the area, we expect the basis to be $0.40 to $0.45 per bushel into the future.
Progressive recovery of our Crush Margins began in April; however, CBOT pricing did not reach our estimated break-even point until late September of 2009. The forward contracting of ethanol sales required for continuous production pushed the improved margins
10
into mid-October, and so the full benefit of profitable Crush Margins was not realized until late October, leading to above break-even results in November.
A number of other issues arose in October which harmed results during a time of increased Crush Margins. They were primarily start-up related and the production team’s learning curve. Furthermore, many of incidents which impacted production were caused by equipment failures which were repaired. The first of the bi-annual cleaning cycles occurred in late October. During this time, the plant was shut down for comprehensive steam cleaning and warranty correction of some minor design failures. We also experienced our first fermentation infection during October. Alcohol yield was reduced in several fermenters, causing the loss of approximately 50,000 bushels of corn at a one-time cost of approximately $250,000. Conveyor failures, molecular sieve valve problems, and a boiler control failure also caused six incidents of downtime totaling 42 hours. Each incident required ramping down and ramping back up to full production rates. It is not possible to accurately measure financial losses from these up-and-down incidents, but a reasonable estimate suggests that nearly 300,000 gallons of ethanol production was lost in October as a result.
November
November 2009 marked a milestone for us, with internal, unaudited financial statements showing a net profit and a production average for the month at name-plate capacity. However, there were 12 incidents of lost production during the month. Additionally, the quality of corn from the 2009 fall harvest was seriously damaged by unfavorable weather throughout the growing season and particularly during harvest.
As the plant was brought back on-line following the scheduled cleaning in October, we intended to increase production rates in order to exceed name-plate capacity and offset the incidental reductions in production and unavoidable shut-downs. However, the combination of this high throughput pressure and the poor corn quality caused a number of plugging incidents in various process vessels. As a result of the increased rates, and in spite of serious lost-time incidents, we realized a profit for the first time in November.
December
Our results from operations in December were not positive. Estimated losses from operations in December were especially disappointing in light of higher Crush Margins. The production problems that started in November became worse in December and resulted in lost production of more than 1,000,000 gallons of ethanol. In addition, poor weather conditions caused multiple power failures which not only caused production losses, but also prevented the cooling of several fermenters, allowing temperatures to rise to the point that fermentation stopped. This caused the waste of corn and significant slow-down in the process for several days following each incident.
The plant produced only 3,011,000 gallons of undenatured ethanol (97,130 gallons/day, 77.3% of rated nameplate capacity) in December - the lowest monthly production since the plant completed its Performance Test in June 2009. The plugging in the beer column persisted and required several cleanings in December, resulting in more lost production.
A blizzard on December 23-24, 2009, caused five electrical power outages totaling 17.5 hours. These power outages had substantial impact on the fermentation process and took more than a week to fully recover from. When the ability to cool the fermenting mash was lost, temperatures rose to over 99° F, killing the yeast and stopping the fermentation process. One of the fermenters had an alcohol level of less than 6% and a sugar level above 18%. High sugar levels cause major plugging in distillation and evaporation systems. To minimize this impact, we were forced to run the plant at greatly reduced rates in order to slowly work the sugar out of the system. The power outages also caused the stripper reboiler to become fouled, resulting in high alcohol levels in the process condensate tank. Process condensate is used to make the mash slurry and this high alcohol content poisoned the yeast and another fermenter was impaired from full fermentation.
Due to the serious impact of electric power outages, we have scheduled a meeting with Nebraska Public Power District to discuss ways to improve the reliability of the power supply to the plant. We are also pursuing the possibility of on-site emergency generators in order to maintain power for cooling the fermenters during a power supply outage. We have included $2,000,000 in the financial forecast for 2011 as a capital expenditure for such generators.
Another design complication that came to light in December and contributed to the fouling and plugging in the process vessels is the return of very fine corn particles by the dust collection system into the ground corn at the beginning of the fermentation process. This was not an issue until November and December, and was caused by the poor quality corn crop. The increased volumes of fine particles in the distillation process increased the plugging and fouling of the beer column and stripper column reboiler. We are in the process of designing a modification to the existing dust collection system in order to remove the foreign matter from the corn as it is
11
being delivered to the plant. All fines from receiving, as well as returns from dust collection, will be removed from their process and mixed into the distiller’s grain product with no impact to the distiller’s grain. We believe this will improve our ability to run the plant at steady-state, name-plate capacity.
Down Time going forward
We experienced significant losses of production from interrupted supply of both natural gas and electricity in 2009 from several causes and seasonal weather patterns. We have since worked closely with our suppliers of those two utilities and have received excellent cooperation from them. System and infrastructure changes have been made for both natural gas and electricity supply in an effort to limit down-time incidents. Additionally, we hired a utility management consultant to assist with acquisition and control of our natural gas supply in a commodity market having a complex and technical infrastructure.
We continue to tune our system and develop our processes and we feel more confident that down-time incidents associated with startup will no longer occur. Since these down-time incidents occurred, our throughput has been steady and product quality has been consistent.
Nonetheless, we do still face weather-related challenges. Electric power supply in the winter is not always consistent due to the severe weather that occurs in our area. We therefore plan to install a backup electric generator in an effort to protect our fermentation process from excessive heat that accumulates in the fermenters when the chillers cannot operate. Such excess heat quickly kills the yeast which stops fermentation and can cause loss by wasting the corn’s starch content. This capital project will be a large one expected to cost between $2,000,000 and $5,000,000. While we hope to complete this project in the summer of 2011, we cannot be certain that we will have adequate working capital resources by that time. Accordingly, until we are able to install the backup electric generator, we do face the risk that weather-related power disruptions could re-occur.
Environmental Compliance
Our operations are subject to environmental laws and regulations adopted by various governmental entities in the jurisdiction in which we operate. These laws require us to investigate and remediate the effects of the release or disposal of materials. We have received Notices of Violation (“NOV”) from the NDEQ arising from failures of emission equipment designed and installed by Delta-T. That equipment includes the plant’s regenerative thermal oxidizer (“RTO”) used to control emissions from the dryer and the CO2 Scrubber used to control emissions from the ethanol process. The RTO had not performed according to the design specified in the Engineering, Procurement and Construction Services Fixed Price Contract dated August 9, 2006 with Delta-T (the “Delta-T Contract”), and we continue to assess methods to resolve the problem. The CO2 Scrubber failed in original compliance testing, and equipment modifications and process adjustments were made, including chemical injection, to remediate the issue. During the startup operations of the plant beginning in January 2009 and continuing through the date of the original compliance testing, Delta-T had operated the plant without these modifications and as a result, we received an NOV in January 2010 which asserted that due to the failure of the CO2 Scrubber, our operation of the plant violated the operating permit issued by the NDEQ. Accordingly, while we believe that we have resolved all of the operational shortfalls cited in the NOVs, it is possible the NDEQ or the Nebraska Office of the Attorney General could assess fines against us as a result of having operated the plant with the equipment before it was operating in compliance. As a result of subsequent negotiations and problem solving in cooperation with the NDEQ, we believe that the chance that any material penalties being assessed is remote.
Construction Contract
The Delta-T Contract provided, among other things: (i) a guarantee of Delta-T’s performance by Delta-T’s parent, Bateman Litwin NV (“Bateman”), (ii) the provision by Delta-T of letters of credit in the amounts of $4,000,000 and $5,500,000 for the benefit of Lender and the Company, respectively, and (iii) a promissory note in the amount of $5,000,000 made by us in favor of Delta-T. Disputes between the parties respecting the letters of credit and other matters resulted in the filing by Delta-T of an action in the District Court of Douglas County, Nebraska, in which the court temporarily restrained us and our lender from making a draw on one of the letters of credit. The parties amended the Delta-T Contract on September 1, 2009 (the “Amendment”). The Amendment resolved asserted claims by both parties and provided the following, among other things: (i) Delta-T would repair certain plant emissions equipment, (ii) Delta-T extended the $5,500,000 letter of credit to September 30, 2010 with conditions added to draw on such letter of credit, (iii) Delta-T was relieved of previously agreed upon punch list responsibility with certain exceptions, (iv) Delta-T relinquished all rights to the $3,995,000 of proceeds held by Lender from the September 2009 draw against the $4,000,000 letter of credit, (v) the $5,000,000 promissory note we made in Delta-T’s favor was extinguished, (vi) Delta-T agreed to dismiss its legal action and dissolve the temporary restraining order, and (vii) except as provided above, no further payments or transfer of funds would be made to or from Delta-T and the Company. The extinguishment of the $5,000,000 promissory note and other contract liabilities were
12
recorded as reductions to property and equipment. The receipt of the $3,995,000 cash, less an estimated $228,000 for costs expected to be incurred, was recognized as a litigation settlement gain in other income.
On March 19, 2010, the Company, Delta-T, Bateman and Bateman Engineering Inc. (“Bateman Engineering”) entered into a Settlement Agreement and Mutual Release (the “Settlement Agreement”), under which, among other things, (i) Delta-T and Bateman authorized us to draw $3,000,000 from a letter of credit, and (ii) we released Delta-T and Bateman from all warranties and other claims under the Delta-T Contract. The Settlement Agreement resolved all outstanding disputes among the Company, Bateman and Delta-T relating to the Delta-T Contract and construction of our ethanol plant.
Liquidity and Capital Resources
Net cash used in operating activities was $4,941,283 for the year ended December 31, 2009 compared to $3,633,438 for the year ended December 31, 2008. In this startup year of 2009 there were a number of changes to our cash position that we do not expect to repeat. In addition to the ordinary and generally anticipated draws and additions to working capital in increasing accounts payable, inventory and receivables that come with the commencement of operations of a business, we received significant benefits from settlement agreements and cash payments from the design and construction contractor, Delta-T. Working capital increased by virtue of this settlement with a reduction of retainage and sales tax payable of $1,700,000 and $400,000 respectively as well as cash received of $3,766,567. Other non-working capital benefits derived from this settlement were used to reduce long term asset values by virtue of concessions made by us, forgoing warranty repairs worth approximately $230,000 and the non-cash extinguishment of a $5,000,000 note payable to Delta-T.
We had expected that our original equity offerings and debt financing would have been sufficient to cover all costs associated with the initial stage of production. However, as of December 31, 2009, we had negative working capital of ($1,281,000), prior to classification of $49.5 million of our debt to current liabilities. We may continue operating at negative margins, depending on commodity prices. If we are unable to generate sufficient cash flows from operations or obtain additional debt or equity financing, our ability to continue operations may be materially hindered, including our ability to enter into derivative positions, and we may be forced to purchase our corn and market our ethanol at spot prices, which would further expose us to market volatility and associated risks. The financial statements included within this Annual Report have been prepared assuming that we will continue as a going concern. Until we are able to obtain additional working capital from operations or outside sources and modify our Credit Agreement covenants or refinance our construction loan, there is substantial doubt as to whether we can continue to operate as a going concern.
Equity Offering
In 2009, in an effort to raise additional working capital to be used primarily to engage in hedging activities, we commenced a private offering of preferred membership units (“Preferred Units”) at a price of $10,000 per Preferred Unit (the “Private Offering”), under which we issued 185.4 Preferred Units. The Preferred Units entitle the holders to: (i) subject to (A) any existing debt-related restrictions we may have, (B) after estimated tax distributions, and (C) upon declaration by the Board of Directors, receive preferred cumulative distributions of 10% (“Preferred Return”) before holders of common Membership Units receive distributions, (ii) then share in their proportionate share of any remaining amounts available for distribution, (iii) first receive a distribution of the issuance price of the Preferred Units, plus any unpaid Preferred Return, upon a liquidation event, and (iv) the right to vote as a class for purposes of determining whether a liquidation event has occurred. Following the third anniversary of the issuance of any Preferred Units, we have the ability to redeem Preferred Units for the original issuance price plus any accrued but unpaid distributions. Depending on market conditions, we may issue Preferred Units in the future.
Credit Facility
We entered into the following agreements with AgCountry Farm Credit Services, FLCA (“Lender”) regarding our senior secured credit facility (“Facility”) for the provision of construction and permanent debt financing for our ethanol plant: a Master Credit Agreement dated February 14, 2007 (the “Master Agreement”), a First Supplement to Master Credit Agreement dated February 14, 2007 (the “First Supplement”), a Second Supplement to Master Credit Agreement dated February 14, 2007 (the “Second Supplement”), a Third Supplement and Forbearance Agreement to Master Credit Agreement dated April 11, 2008 (the “Third Supplement”), a Fourth Supplement and Forbearance Agreement to Master Credit Agreement dated March 27, 2009 (the “Fourth Supplement”), and a Fifth Supplement and Forbearance Agreement to the Master Credit Agreement dated September 30, 2009 (“Fifth Supplement,” together with the Fourth Supplement, Third Supplement, Second Supplement, First Supplement and the Master Agreement, the “Loan Agreements”). As of December 31, 2009, we have borrowed $42,500,000 under the Facility. The Facility consists of a multiple advance construction loan during the construction period; and at construction completion, conversion to a permanent ten year term loan facility, a portion of which can be further converted to a $10 million revolving term loan, subject to certain conditions.
13
Under the Loan Agreements, we made certain customary representations and are subject to customary affirmative and negative covenants, including restrictions on our ability to incur debt, create liens, dispose of assets, pay distributions and to make capital expenditures, and customary events of default (including payment defaults, covenant defaults, cross defaults, construction-related defaults and bankruptcy defaults). We have also agreed to the following with the Lender under the Loan Agreements:
|
|
·
|
Achievement of 100% of our name plate production capacity by May 1, 2009, which we did achieve, and on June 11, 2009, we completed the performance test which meets the Loan Agreements’ performance testing requirements.
|
|
|
·
|
We provided a business plan (“Plan”) to Lender in April 2009, which discussed our ability to return to compliance with the financial covenants under the Loan Agreements. The Plan was updated in July reflecting new forecasts for financial performance and demonstrating compliance with all financial loan covenants for five years. The Plan was significantly revised in August 2009 in anticipation of the Delta-T settlement. Further revisions have been made in connection with the 2010 budgeting process and the February 2010 application to the United Stated Department of Agriculture (“USDA”) for a Business and Industries Guaranteed Loan (the “B&I Loan”) of $5,000,000 for working capital.
|
|
|
·
|
Beginning September 30, 2009, we must obtain Lender’s consent to make any capital expenditures in excess of $500,000.
|
|
|
·
|
Beginning December 31, 2009, we must make annual payments to Lender of 40% of our Net Available Cash (as defined in the Loan Agreements).
|
|
|
·
|
In connection with a $5,000,000 note made payable to Delta-T (now extinguished), we agreed to raise $2,000,000 of additional equity to fund the first $2,000,000 payment on that note. Our directors personally guaranteed our issuance of such equity and purchased 101.4 of the Preferred Units in the Private Offering.
|
Affirmative financial covenants under the Loan Agreement require minimum working capital of $6,000,000, minimum current ratio of 1.20:1.00, minimum tangible net worth of $41,000,000, minimum owners’ equity ratio of 50%, and a minimum fixed charge coverage ratio of 1.25:1.00. As of December 31, 2009 we did not meet those covenants, as follows: our working capital was negative ($1,281,000) (not including current liabilities for term debt previously classified as long term), our current ratio was 0:87 to 1.00 (not including current liabilities for term debt previously classified as long term), our tangible net worth was $39,643,975, our owners' equity ratio was 70%, and our fixed charge coverage ratio was (0.09): 1.00. This resulted in all debt under the Loan Agreement being classified as current liabilities.
Now that the final settlement with Delta-T is complete, we are actively negotiating with the Lender to convert the construction financing to operating lines and to modify the loan covenants to reflect the status of the Company after all changes of the last five years. We cannot predict whether the Lender will agree to modify any of those covenants. To the extent we are unable to modify those covenants, it may not be possible to meet them unless the commodities markets we operate in move in favorable directions. Until we are able to comply with the covenants under the Loan Agreements, the Lender may take a variety of actions, including immediately accelerating the repayment of all outstanding debt under the Loan Agreements. Such acceleration could entitle the Lender to liquidate all of our assets, and would likely lead to our bankruptcy, reorganization or winding up of our affairs.
TIF Note
In June 2007, the City of Atkinson, Nebraska (“City”) issued a tax increment financing Note (the “TIF Note”), the net proceeds of which in the amount of $4,939,925 were paid to us to reimburse us for certain infrastructure improvements relating to our plant. Repayment of the TIF Note is guaranteed by us, but was originally expected to be retired from incremental property tax revenue we pay the City, which are based on the added value of our land and buildings. The TIF Note serves as collateral for a loan with an outstanding balance of $6,579,000 (the “Loan”) as of December 31, 2009. We received the net proceeds of the Loan in the amount of $4,939,925 pursuant to a Loan Agreement we entered into with the lead lending agent, Arbor Bank (“TIF Lender”), under which we have loaned such proceeds to the City in exchange for the TIF Note. The first principal payment was paid on June 1, 2009 from the debt reserve account established with a portion of the original loan funds.
The repayment of the TIF Note was originally expected to be paid from reimbursement of incremental tax revenue that derived from the property improvement with construction of the plant. Construction delays caused delay of the assessment and the payment of taxes, and therefore has affected the schedule of the loan repayment. Furthermore, the economic condition in the ethanol industry has resulted in a number of plants being sold at auction, establishing a market price for ethanol facilities that at times has been far lower than the cost of construction. Generally, the cost of construction for an ethanol facility is approximately $2.00 per gallon. Our cost of construction has been slightly higher, primarily because we had to construct extensions to both the rail lines and the natural gas lines. The assessed value of the real property portion of our plant is significantly less than anticipated as a result of the sale-at-auction transactions of other plants establishing a market value for ethanol facilities at approximately $0.60 per gallon, suggesting a maximum market value for our plant at less than $30,000,000. The Holt County Tax Assessor had established an initial assessment of $14,000,000 for real property (85% complete as of the date of assessment in 2008), and slightly more than $30,000,000 for personal
14
property. The 2008 levy was approximately $2.13 per $100. This assessment suggested an annual property tax cost to us of $937,200.
Without notice to us, TIF Lender sent a formal letter of protest to the Holt County Tax Assessor’s office, trying to increase our real property assessment from $14,000,000 to $51,000,000. That would amount to an increase in tax cost of approximately $788,000 per year. Such tax payments, resulting from the increased tax assessments, would be refunded by the taxing authorities directly to the TIF Lender, which would reduce other cash requirements on the Company by direct satisfaction of interest, principal and debt service reserve fund payment obligations. Any excess would be applied as a prepayment of the Loan. If the tax assessments on the real property are not sufficient, the TIF Lender may require us to prepay significant TIF Loan principal amounts in order to satisfy a 1.20:1.00 debt service coverage ratio requirement.
In negotiation and cooperation with TIF Lender, we appealed to the Holt County Board of Supervisors requesting a transfer of $16,000,000 personal property assessed values to real property causing a net change to tax liability of zero, but increasing the portion of tax payments that would be refunded to TIF Lender in payment of interest and principal. These changes were granted and will be in effect for the tax year 2009, payable in 2010.
On July 6, 2009, the TIF Lender notified us that the Debt Service Reserve Fund was deficient, constituting a default under the Loan. The primary reason for this default was the extended delays and losses associated with startup of the plant. In order to enable resolution of the default, we and the TIF Lender entered into a Forbearance Agreement dated December 31, 2009 (the “Agreement”).
Under the Agreement, we agreed to authorize a transfer from the Debt Service Reserve Fund to satisfy our principal payment due to TIF Lender on December 31, 2009. With the authorization of payment to TIF Lender from the Debt Service Reserve Fund, we are current on all required payments to TIF Lender, but have breached covenants in the TIF Loan requiring immediate replenishment of the Debt Service Reserve Fund. Moreover, we agreed to seek the consent of Lender to (i) grant a security interest and Deed of Trust in favor of the TIF Lender upon us receiving, or being denied, the B&I Loan, (ii) grant a security interest in all reserve funds established under the TIF Loan and (iii) amend to the TIF Loan documents to (a) reduce the TIF Loan’s interest rate from 9.5% to 6.0% for three years, and upon expiration of the three years, the interest rate will be reverted to 9.5%, (b) reduce the Debt Service Reserve Fund to an amount equal to 12 months of principal payments, (c) make the Debt Service Reserve Fund funding contingent on our previous year’s profitability and (d) require the financial covenants and ratios in the TIF Loan documents to be consistent with the financial covenants and ratios to be agreed upon with Lender.
Under the Agreement, the TIF Lender will refrain from exercising any of its rights or remedies under the TIF Loan, including acting on our failure to maintain a sufficient amount in the Debt Service Reserve Fund, for a period beginning on December 31, 2009 and ending on the earlier of (i) March 31, 2010 or (ii) 30 days following the approval of the proposed B&I Loan.
This liability has been classified as a current liability, and will remain so until the resolution of the conversion of the construction loan to an operating loan, the status of the application for a B&I Loan and negotiations to modify the loan covenants to more accurately reflect the current financial position of the Company.
Market Risk
We are exposed to the impact of market fluctuations associated with commodity prices. We anticipate the use of derivative financial instruments as part of an overall strategy to manage market risk, assuming we have sufficient working capital and liquidity to manage such a strategy. We intend, when able, to use cash, futures and option contracts to hedge changes to the commodity prices of corn, natural gas and gasoline. We will not enter into these derivative financial instruments for trading or speculative purposes, nor will we designate these contracts as cash flow or fair value hedges for accounting.
Commodity Price Risk
We are exposed to market risk with respect to the price of ethanol, our principal product, and the price and availability of corn, the principal commodity we use to produce ethanol. Our other primary product is distiller’s grains, and we are also subject to market risk with respect to its price. In general, rising ethanol and distiller’s grains prices should result in higher profit margins, and therefore represent favorable market conditions. Ethanol and distiller’s grains prices are, however, influenced by various factors beyond the control of our management, including the supply and demand for gasoline, the availability of substitutes and the effects of laws and regulations.
Ethanol revenues are controlled in the market place. Our risk management team meets weekly and assesses the balance of forward purchases of corn with forward sales of ethanol and the risks associated with the trends in the marketplace. In recent months, the price
15
for ethanol has closely followed the market prices of corn. The price of unleaded gasoline is also a primary concern in that if the price of ethanol rises above the RBOB price, then the economies do not allow favorable margins for the discretionary blenders and demand for ethanol falls.
Distiller’s grains are primarily marketed into the local cattle feed market. Historically, the summer months bring the lowest seasonal demand for this product. As discussed elsewhere in this Annual Report, we have experienced an extraordinarily long period of startup irregularities and our ability to market distiller’s grains in 2009 was affected by these complications, as well as a deeper seasonal reduction in 2009 than was expected. Consistent production volumes and quality are required to maximize the pricing advantage potential of our favorable geography near large numbers of cattle feeders. Now that we have control of the plant and production, we hope to establish a reputation and relationships with those cattle feeders that will help mitigate the seasonal variability in future years, though ultimately demand for distiller’s grains is not in our control.
Ethanol, corn and energy markets have demonstrated a complex relationship in the past 24 months. Generally speaking, we believe that the price of energy provides a ceiling value for ethanol, particularly in the price of crude oil as driven into the price of unleaded gasoline, otherwise known in the markets as RBOB. However, except when affected by that upward limit, we believe that the price of ethanol follows the price of corn with a high degree of correlation, with the Crush Margin dictated by the market relationships of supply and demand. As discussed above, that Crush Margin has been squeezed in recent months by the oversupply of ethanol capacity, but can be significantly affected by any of several factors, including the relationship of distribution infrastructure and its limits to handle the volume of ethanol that could be produced by the existing capacity while limited by the EPA to 10% blends for regular unleaded gasoline. Also affecting the Crush Margin is the price of oil. In mid 2008, when oil was above $140 a barrel, the cost of RBOB allowed profitable blending of ethanol and Crush Margin, even when corn costs were above $6 and $7 a bushel.
The availability and price of corn is subject to wide fluctuations due to various unpredictable factors which are beyond our control, including weather conditions, farmer planting decisions, governmental policies with respect to agriculture and local, regional, national and international trade, demand and supply. At the end of December 2009, our year-to-date corn cost as a percentage of ethanol sales was 73%, and 65% of gross sales. This was an improvement of 6% and 5% respectively on both measures from September 2009, and we expect to continue to improve this relationship. Forecasts for future years assume that this relationship will be between 73-76% of ethanol revenues and 59-62% of gross revenues.
We expect the annual impact on our results of operations due to a $0.30 per bushel fluctuation in market prices for corn to be approximately $4,890,000, or $0.11 per gallon, assuming our plant continues to operate at 100% name plate capacity (production of 44,000,000 gallons of ethanol annually). We also expect a $0.20 per gallon fluctuation in ethanol market prices to impact annual net income by approximately $8,800,000, a $0.20 per gallon fluctuation in denaturant market prices to impact annual net income by approximately $180,000, and a $0.50 per BTU fluctuation in natural gas market prices to impact annual net income by approximately $630,000.
We seek to minimize the risks from fluctuations in the prices of corn and ethanol through the use of derivative instruments, provided we have sufficient working capital to enter into such instruments and cover any margin requirements necessary to maintain such positions. In practice, as markets move, we will seek to actively manage our risk and adjust hedging strategies as appropriate, provided we have sufficient working capital for such strategies. Although we believe our hedge positions accomplish an economic hedge against our future purchases, they are not designated as such for hedge accounting purposes, which would match the gain or loss on our hedge positions to the specific commodity purchase being hedged. We mark to market our hedge positions, which means as the current market price of our hedge positions changes, the gains and losses are immediately recognized in our cost of goods sold. The immediate recognition of hedging gains and losses can cause net income to be volatile from quarter to quarter due to the timing of the change in the value of the derivative instruments relative to the cost and use of the commodity being hedged. We have recorded gains on derivative instruments of approximately $4,700 and $0 for the twelve months ended December 31, 2009 and 2008, respectively.
In the event we do not have sufficient working capital to enter into hedging strategies to manage our risks, we may be forced to purchase our corn and market our ethanol at spot prices and as a result, we could be further exposed to market volatility and risk.
Application of Critical Accounting Estimates
Management uses estimates and assumptions in preparing these financial statements in accordance with Generally Accepted Accounting Principles (“GAAP”). Those estimates and assumptions affect the reported amounts of assets and liabilities, the disclosure of contingent assets and liabilities, and the reported revenues and expenses. We use estimates and assumptions in accounting for the following significant matters, among others: the allowance for doubtful accounts, useful lives of property and equipment, the valuation of inventory, and inventory purchase commitments, and long-lived asset impairments including the assumptions used to estimate
16
future cash flows, the ability to raise capital, and the ability to comply with certain provisions within the Loan Agreements. Actual results may differ from previously estimated amounts, and such differences may be material to our financial statements. We periodically review estimates and assumptions, and the effects of revisions are reflected in the period in which the revision is made. The following paragraph discusses the most significant estimating process in our financial statements.
Long-lived assets, such as property and equipment, are reviewed for impairment whenever events or changes in circumstances indicate that the carrying amount of an asset may not be recoverable. In accordance with the our policy for evaluating impairment of long-lived assets, we have estimated that the projected future undiscounted cash flows from operations of these facilities exceed their carrying value at December 31, 2009; therefore no impairment loss was recognized. In determining the projected future undiscounted cash flows, we made significant assumptions concerning the future viability of the ethanol industry, the future price of corn in relation to the future price of ethanol and the overall demand for ethanol in relation to production and supply capacity. Changes in the estimated future prices of corn and ethanol used within the analysis can have a significant effect on the determination of impairment given the sensitivity of the analysis. In addition to the impairment analysis performed, we believe that the following factors also indicate that no impairment of long-lived assets has occurred. First, our short time in operation under distress from construction delays, equipment failures and startup complications provides inadequate cost history to assess with reasonable levels of certainty what the cost structure will be going forward. Second, the economic structure of the distiller’s grain markets has been excessively volatile throughout initial plant operations. The cash flow to be generated from sales of distiller’s grains is a critical requirement for us to generate future profitability. Third, the economic recession in the U.S. during the entire startup and operation of the plant further complicated the measurement of our ability to generate future cash flows that are required to document material impairment to the carrying value of our plant assets. In the impairment analysis, we assumed (i) future distiller’s grain revenue will be 12% of gross revenue, (ii) future corn costs will be 70% of ethanol revenue, and (iii) these relationships drive net profitability estimates for 2010 of 3% of gross revenues. If we fail to realize these economic improvements, it is likely in the future, that asset values will need to be adjusted to reflect impaired value because we would be unable to forecast future cash flows sufficient to carry those values.
Off-Balance Sheet Arrangements
We do not have any off-balance sheet arrangements that have or are reasonable likely to have a current or future material effect on our financial condition, results of operations or liquidity.
17
Our Directors and Officers
Below is certain information about our Directors and officers. Additional information about our Directors and officers is provided in our proxy statement for our 2009 Annual Members’ Meeting.
|
|
●
|
Jeff Lieswald, a Director, is a principal of Agland Electric Motor (a retail electric motor reseller) and has worked as an electrician for 22 years.
|
|
|
●
|
Todd Shane, a Director, is a farmer and rancher with HBK Land & Cattle Co.
|
|
|
●
|
Kirk Shane, a Director, is a farmer and rancher.
|
|
|
●
|
Gerald Winings, a Director, is the manager of Atkinson Fertilizer, Inc., a blender and distributor of agricultural fertilizers.
|
|
|
●
|
Everett Vogel, Vice President, a Director and Chairman of the Board, is President and a Director of Stuart Fertilizer and Grain, Inc., a blender and distributor of agricultural fertilizers.
|
|
|
●
|
Paul Seger, a Director, is the owner of Seger Farms.
|
|
|
●
|
Kenneth Osborne, a Director, is the President and a Director of Osborne Construction, Inc.
|
|
|
●
|
Robin Olson, a Director, is a Director of Olson Industries, Inc., a manufacturer of airport light bases, irrigation systems, commercial trash containers, electric utility poles and other galvanized products, and is a Principal of Alpha Galvanizing.
|
|
|
●
|
Clayton Goeke, a Director, is a farmer and rancher.
|
|
|
●
|
Jerome Fagerland is the Company’s President, General Manager and a Director.
|
|
|
●
|
Steve Dennis, a Director, is the owner and manager of O’Neill Grain Co., a grain elevator.
|
|
|
●
|
Paul Corkle, a Director, is a farmer and rancher and owner of Corkle Insurance Agency.
|
|
|
●
|
Timothy Borer, the Secretary, Treasurer and a Director, is a farmer.
|
|
|
●
|
Richard Bilstein, a Director and Vice President of the Board, is a Farm Manager for Don Oppliger Farms.
|
Changes in and Disagreements with Accountants.
We have not had any changes in or disagreements with our accountants in our two most recent fiscal years or any subsequent interim period.
Market Price and Dividends
There is no public trading market for our Membership Units, and our Third Amended and Restated Operating Agreement dated March 4, 2009 (the “Operating Agreement”) contains significant restrictions on the transfer of our Units to ensure that we are not deemed a “publicly traded partnership” and thus taxed as a corporation. Additionally, pursuant to the Operating Agreement, the Board has developed a Unit Transfer Policy which imposes conditions on the transfer of Membership Units.
Subject to the provisions of the Nebraska Limited Liability Company Act (the “Act”), distributions are payable at the discretion of our Board of Directors as provided in our Operating Agreement. The Board has no obligation to distribute profits, if any, to Members. We have not declared or paid any distributions on our Membership Units to date, and distributions on our Common Units are first subject to preferential distributions on our Class A Preferred Units. We anticipate distributing a portion of our net cash flow to our Members in proportion to the Membership Units held and in accordance with our Operating Agreement and any loan covenants to which we may then be subject. By net cash flow, we mean our gross cash proceeds received less any portion, as determined by our Directors in their sole discretion, used to pay or establish reserves for our expenses, debt payments, capital improvements, replacements and contingencies. If our financial performance and loan covenants permit, our Board of Directors will consider cash distributions at times and in amounts that will permit Unit holders to make income tax payments. However, the Board may elect to retain future profits to provide operational financing for the plant, debt retirement and possible plant expansion.
18
| |
Management’s Responsibility for Financial Information
It is the responsibility of management to prepare and present the financial statements in this Annual Report with integrity and objectivity. These financial statements have been prepared in accordance with GAAP. As required, management applies certain estimates and judgments in the preparation of these financial statements.
Wagner and Associates, an independent accounting and management consulting firm, was retained to assist management in their assessment of the effectiveness of our internal controls over financial reporting. That firm is responsible to management to document our internal control structure and to test the structure’s effectiveness, reporting to management any recommendations for improvement as well as providing assurances through testing of the system’s effectiveness. McGladrey & Pullen, LLP, an independent registered public accounting firm, is retained to audit our financial statements.
The Audit Committee of the Board of Directors and is responsible for selection and supervision of accounting management and the independent registered public accounting firm. The Audit Committee meets periodically and privately with the independent registered public accounting firm as well as management to review accounting, auditing, internal control structure and financial reporting matters.
Management’s Report on Internal Control over Financial Reporting
Management is also responsible for establishing and maintaining adequate internal control over financial reporting. Our internal control over financial reporting is a process designed by, or under the supervision of, our CEO and CFO, and effected by our Board of Directors, management and other personnel to provide reasonable assurance regarding the reliability of financial reporting and the preparation of financial statements in accordance with GAAP and includes policies and procedures that:
|
|
(i)
|
Pertain to the maintenance of records that in reasonable detail accurately and fairly reflect our financial transactions,
|
|
|
(ii)
|
Provide reasonable assurance that transactions are recorded as necessary to permit preparation of financial statements in accordance with GAAP, and that our revenues and expenditures are being made only in accordance with authorizations of our management and directors, and
|
|
|
(iii)
|
Provide reasonable assurance regarding the prevention or timely detection of unauthorized acquisition, use or disposition of our assets that could have a material effect on our financial statements.
|
Because of its inherent limitations, internal control over financial reporting may not prevent or detect misstatements. Also, projections of any evaluation of effectiveness to future periods are subject to the risk that controls may become inadequate because of changes in conditions, or that the degree of compliance with policies or procedures may deteriorate.
Management assessed our internal control over financial reporting as of December 31, 2009. Management based its assessment on criteria established in Internal Control-Integrated Framework issued by the Committee of Sponsoring Organizations of the Treadway Commission (“COSO”). Management’s assessment included an evaluation of such elements as the design and operating effectiveness of key financial reporting controls, process documentation, accounting policies and our overall control environment.
Based on this assessment, management concluded that our internal control over financial reporting was effective as of December 31, 2009. This annual report does not include an attestation report of our independent registered public accounting firm regarding internal control over financial reporting. Management’s report was not subject to attestation by the company’s independent registered public accounting firm pursuant to temporary rules of the SEC that permit us to provide only management’s report in this annual report.
19
 |
Report of Independent Registered Public Accounting Firm
To the Board of Directors and Members
NEDAK Ethanol, LLC
We have audited the accompanying balance sheet of NEDAK Ethanol, LLC as of December 31, 2009, and the related statements of operations, changes in members’ equity, and cash flows for the year then ended. These financial statements are the responsibility of the Company’s management. Our responsibility is to express an opinion on these financial statements based on our audit.
We conducted our audit in accordance with standards of the Public Company Accounting Oversight Board (United States). Those standards require that we plan and perform the audit to obtain reasonable assurance about whether the financial statements are free of material misstatement. An audit includes examining, on a test basis, evidence supporting the amounts and disclosures in the financial statements. An audit also includes assessing the accounting principles used and significant estimates made by management, as well as evaluating the overall financial statement presentation. We believe that our audit provides a reasonable basis for our opinion.
In our opinion, the financial statements referred to above present fairly, in all material respects, the financial position of NEDAK Ethanol, LLC and the results of its operations and its cash flows for the year ended December 31, 2009, in conformity with U.S. generally accepted accounting principles.
The financial statements have been prepared assuming that the Company will continue as a going concern. As discussed in Note 2 to the financial statements, there is uncertainty as to the Company’s ability to secure additional funds needed to fund ongoing operations. This raises substantial doubt about the Company's ability to continue as a going concern. Management's plans in regard to these matters are also described in Note 2 to the financial statements. The financial statements do not include any adjustments that might result from the outcome of this uncertainty.
We were not engaged to examine management’s assessment of the effectiveness of NEDAK Ethanol, LLC’s internal control over financial reporting as of December 31, 2009, included in the accompanying Management Report on Internal Control over Financial Reporting and, accordingly, we do not express an opinion thereon.
/s/ McGladrey & Pullen, LLP
Sioux Falls, South Dakota
April 5, 2010
F-1
 |
REPORT OF INDEPENDENT REGISTERED PUBLIC ACCOUNTING FIRM
To the Board of Directors and Members of NEDAK Ethanol, LLC
Atkinson, Nebraska
We have audited the accompanying balance sheet of NEDAK Ethanol, LLC as of December 31, 2008 and the related statements of operations, changes in members’ equity, and cash flows for the year then ended. NEDAK Ethanol, LLC’s management is responsible for these financial statements. Our responsibility is to express an opinion on these financial statements based on our audit.
We conducted our audit in accordance with the standards of the Public Company Accounting Oversight Board (United States). Those standards require that we plan and perform the audit to obtain reasonable assurance about whether the financial statements are free of material misstatement. The company is not required to have, nor were we engaged to perform, an audit of its internal control over financial reporting. Our audit included consideration of internal control over financial reporting as a basis for designing audit procedures that are appropriate in the circumstances, but not for the purpose of expressing an opinion on the effectiveness of the company’s internal control over financial reporting. Accordingly, we express no such opinion. An audit also includes examining, on a test basis, evidence supporting the amounts and disclosures in the financial statements, assessing the accounting principles used and significant estimates made by management, as well as evaluating the overall financial statement presentation. We believe that our audit provides a reasonable basis for our opinion.
In our opinion, the financial statements referred to above present fairly, in all material respects, the financial position of NEDAK Ethanol, LLC as of December 31, 2008 and the results of its operations and its cash flows for the year then ended in conformity with accounting principles generally accepted in the United States of America.
/s/ Boulay, Heutmaker, Zibell & Co. P.L.L.P.
Certified Public Accountants
Minneapolis, Minnesota
April 2, 2009
F-2
|
NEDAK ETHANOL, LLC
|
|||
|
Balance Sheets
|
|||
|
December 31,
|
|||
|
2009
|
|
2008
|
|
|
ASSETS (Note 7)
|
|||
|
Current Assets
|
|||
|
Cash and cash equivalents
|
$ 1,853,959
|
$ 94,691
|
|
|
Restricted short term investment (Note 6)
|
1,153,708
|
1,128,070
|
|
|
Restricted cash (Notes 7 and 8)
|
997,656
|
52,866
|
|
|
Accounts receivable
|
1,149,804
|
182,152
|
|
|
Commodity broker receivable
|
94,391
|
-
|
|
|
Inventory (Note 3)
|
2,971,319
|
1,344,018
|
|
|
Inventory - corn contracts
|
-
|
300,260
|
|
|
Derivative financial instruments (Notes 4 and 9)
|
5,325
|
-
|
|
|
Prepaid expenses and other
|
622,443
|
300,552
|
|
|
Total current assets
|
8,848,605
|
3,402,609
|
|
|
Property and Equipment
|
|||
|
Land and improvements
|
4,408,272
|
4,427,265
|
|
|
Buildings
|
9,102,173
|
9,473,978
|
|
|
Plant equipment
|
73,204,195
|
76,274,960
|
|
|
Office equipment
|
200,575
|
177,894
|
|
|
Vehicles
|
468,617
|
468,617
|
|
|
87,383,832
|
90,822,714
|
||
|
Less accumulated depreciation
|
(6,233,212)
|
(133,932)
|
|
|
Net property and equipment
|
81,150,620
|
90,688,782
|
|
|
Other Assets
|
|||
|
Deposits
|
300,000
|
-
|
|
|
Deferred offering costs
|
-
|
33,033
|
|
|
Restricted cash - TIF (Note 8)
|
-
|
599,042
|
|
|
Debt issuance costs, net of accumulated amortization of $419,256
and $176,720 in 2009 and 2008, respectively
|
1,341,979
|
1,234,514
|
|
|
Total other assets
|
1,641,979
|
1,866,589
|
|
|
Total Assets
|
$ 91,641,204
|
$ 95,957,980
|
|
|
|
|||
|
LIABILITIES AND MEMBERS' EQUITY
|
|||
|
Current Liabilities
|
|||
|
Current maturities of long-term debt (Notes 2, 7 and 8)
|
$ 3,205,471
|
$ 2,425,002
|
|
|
Accounts payable
|
|||
|
Trade
|
1,834,787
|
800,924
|
|
|
Corn
|
2,663,599
|
-
|
|
|
Construction payable (Note 10)
|
-
|
145,586
|
|
|
Accrued interest and other (Note 2)
|
2,425,977
|
1,033,606
|
|
|
Reclassification of long-term debt to current (Notes 2, 7 and 8)
|
45,873,529
|
-
|
|
|
Total current liabilities
|
56,003,363
|
4,405,118
|
|
|
Long-Term Debt, net of Current Maturities (Notes 2, 7, 8 and 10)
|
18,750
|
48,500,783
|
|
|
Commitments and Contingencies (Notes 2, 6 and 10)
|
|||
|
Members’ Equity (Note 5)
|
|||
|
Preferred Units, 185.4 units issued and outstanding
|
1,854,428
|
-
|
|
|
Common units, 5,233 units issued and outstanding
|
49,839,281
|
49,891,449
|
|
|
Accumulated deficit
|
(16,074,618)
|
(6,839,370)
|
|
|
Total members’ equity
|
35,619,091
|
43,052,079
|
|
|
Total Liabilities and Members’ Equity
|
$ 91,641,204
|
$ 95,957,980
|
|
|
See Notes to Financial Statements.
|
|||
F-3
|
NEDAK ETHANOL, LLC
|
||||||||
|
Statements of Operations
|
||||||||
|
|
|
Years Ended December 31,
|
||||||
|
2009
|
2008
|
|||||||
|
|
|
|
|
|||||
|
Revenues
|
$ 67,536,108
|
$ -
|
||||||
|
Cost of Goods Sold
|
74,528,307
|
-
|
||||||
|
Gross Loss
|
(6,992,199)
|
-
|
||||||
|
General and Administrative Expenses
|
2,596,682
|
4,755,272
|
||||||
|
Operating Loss
|
(9,588,881)
|
(4,755,272)
|
||||||
|
Other Income (Expense)
|
||||||||
|
Gain from litigation settlement (Note 10)
|
3,766,567
|
-
|
||||||
|
Interest income
|
44,452
|
82,122
|
||||||
|
Interest expense
|
(3,457,386)
|
(47,156)
|
||||||
|
Other income
|
-
|
478,679
|
||||||
|
Total other income, net
|
353,633
|
513,645
|
||||||
|
Net Loss
|
$ (9,235,248)
|
$ (4,241,627)
|
||||||
|
Weighted Average Common Units
|
||||||||
|
Outstanding - Basic and Diluted
|
5,233
|
5,231
|
||||||
|
Net Loss Per Common Unit - Basic and Diluted
|
$ (1,764.81)
|
$ (810.86)
|
||||||
See Notes to Financial Statements.
F-4
|
NEDAK ETHANOL, LLC
|
||||
|
Statements of Changes in Members' Equity
|
||||
|
Preferred Units
|
Common Units
|
Accumulated Deficit
|
Total
|
|
|
Balance - December 31, 2007
|
$ -
|
$ 49,851,449
|
$ (2,597,743)
|
$ 47,253,706
|
|
Sale of 4 common units at $10,000 per unit, July 2008
|
-
|
40,000
|
-
|
40,000
|
|
Net loss for the year ended December 31, 2008
|
-
|
-
|
(4,241,627)
|
(4,241,627)
|
|
Balance - December 31, 2008
|
-
|
49,891,449
|
(6,839,370)
|
43,052,079
|
|
Sale of 185.44 preferred units at $10,000 per unit, June 2009
|
1,854,428
|
-
|
-
|
1,854,428
|
|
Cost of rising capital
|
-
|
(52,168)
|
-
|
(52,168)
|
|
Net loss for the year ended December 31, 2009
|
-
|
-
|
(9,235,248)
|
(9,235,248)
|
|
Balance - December 31, 2009
|
$ 1,854,428
|
$ 49,839,281
|
$ (16,074,618)
|
$ 35,619,091
|
See Notes to Financial Statements.
F-5
|
NEDAK ETHANOL, LLC
|
||||||
|
Statements of Cash Flows
|
||||||
|
Years Ended December 31,
|
||||||
|
2009
|
2008
|
|||||
|
Cash Flows from Operating Activities
|
||||||
|
Net loss
|
$ (9,235,248)
|
$ (4,241,627)
|
||||
|
Adjustments to reconcile net loss to net cash used in operations:
|
||||||
|
Depreciation and amortization
|
6,341,815
|
123,228
|
||||
|
Change in fair value of derivative financial instruments
|
(5,325)
|
-
|
||||
|
Gain from litigation settlement
|
(3,766,567)
|
-
|
||||
|
Change in operating assets and liabilities
|
||||||
|
Receivables
|
(1,062,043)
|
(162,870)
|
||||
|
Inventory
|
(1,627,301)
|
(1,344,018)
|
||||
|
Inventory - corn contracts
|
300,260
|
677,772
|
||||
|
Prepaid expenses and other
|
(321,891)
|
(123,031)
|
||||
|
Deposits
|
(300,000)
|
-
|
||||
|
Accounts payable
|
3,338,896
|
513,927
|
||||
|
Accrued interest and other
|
1,396,121
|
923,181
|
||||
|
Net cash used in operating activities
|
(4,941,283)
|
(3,633,438)
|
||||
|
Cash Flows from Investing Activities
|
||||||
|
Payments for construction in process
|
-
|
(24,968,329)
|
||||
|
Capital expenditures
|
(181,922)
|
(455,853)
|
||||
|
Net change in restricted cash and investments
|
(371,386)
|
(84,770)
|
||||
|
Refund of investments
|
-
|
1,000
|
||||
|
Net cash used in investing activities
|
(553,308)
|
(25,507,952)
|
||||
|
Cash Flows from Financing Activities
|
||||||
|
Proceeds from construction loan
|
1,700,000
|
28,758,868
|
||||
|
Sale of 185.4 preferred units
|
1,854,428
|
-
|
||||
|
Proceeds from Delta-T letter of credit
|
3,995,000
|
-
|
||||
|
Payment on tax increment financing debt
|
(285,000)
|
-
|
||||
|
Sale of 4 common units
|
-
|
40,000
|
||||
|
Payments of offering costs
|
(10,569)
|
(33,033)
|
||||
|
Debt issuance costs
|
-
|
(133,947)
|
||||
|
Net cash provided by financing activities
|
7,253,859
|
28,631,888
|
||||
|
Increase (Decrease) in Cash and Equivalents
|
1,759,268
|
(509,502)
|
||||
|
Cash and Equivalents – Beginning of Year
|
94,691
|
604,193
|
||||
|
Cash and Equivalents – End of Year
|
$ 1,853,959
|
$ 94,691
|
||||
|
Supplemental Disclosure of Cash Flow Information and Noncash Investing and Financing Activities
|
||||||
|
Cash payments for interest
|
$ 3,655,215
|
$ -
|
||||
|
Debt issuance costs in accounts payable
|
350,000
|
-
|
||||
|
Restricted cash used for interest - capitalized
|
-
|
662,948
|
||||
|
Construction loan proceeds used for interest
|
-
|
1,468,846
|
||||
|
Liquidated damages used to reduce property and equipment and note payable construction loan
|
-
|
3,453,215
|
||||
|
Settlement advance from Delta-T used to reduce property and equipment
|
228,433
|
-
|
||||
|
Deferred offering costs offset against equity
|
52,168
|
-
|
||||
|
Deferred offering costs included in accounts payable
|
8,566
|
-
|
||||
|
Construction costs included in accounts payable
|
-
|
145,586
|
||||
|
Settlement concession from Delta-T forgiving note payable loan and used to reduce property and equipment
|
3,246,785
|
-
|
||||
|
Construction costs included in note payable - contract
|
-
|
3,246,785
|
||||
|
Amortization of debt issuance costs capitalized as Construction in Process
|
-
|
154,910
|
||||
|
Capitalization of accrued interest on member notes
|
3,750
|
-
|
||||
|
See Note to Financial Statements.
|
||||||
F-6
NEDAK ETHANOL, LLC
Notes to Financial Statements
December 31, 2009 and 2008
1. SUMMARY OF SIGNIFICANT ACCOUNTING POLICIES
Nature of Business
NEDAK Ethanol, LLC, a Nebraska limited liability company (the “Company”) operates a 44 million gallon per year ethanol plant in Atkinson, Nebraska. The Company produces and sells fuel ethanol and distillers grains, a co-product of the fuel ethanol production process. Sales of ethanol and distiller’s grains began in January 2009.
Accounting Estimates
Management uses estimates and assumptions in preparing these financial statements in accordance with generally accepted accounting principles (“GAAP”). Those estimates and assumptions affect the reported amounts of assets and liabilities, the disclosure of contingent assets and liabilities, and the reported revenues and expenses. The Company uses estimates and assumptions in accounting for the following significant matters, among others: the allowance for doubtful accounts, useful lives of property and equipment, the valuation of inventory and inventory purchase commitments and long-lived asset impairments including the assumptions used to estimate future cash flows, the ability to raise capital, and the ability to comply with certain provisions within the Company’s credit agreements. Actual results may differ from estimated amounts, and such differences may be material to the Company’s financial statements. The Company periodically reviews estimates and assumptions, and the effects of revisions are reflected in the period in which the revisions are made.
Cash and Cash Equivalents
The Company considers all unrestricted, highly liquid debt instruments with maturity of three months or less at the time of purchase to be cash equivalents. The Company maintains its accounts primarily at one financial institution. At times throughout the year, the Company’s cash and cash equivalents balances exceed amounts insured by the Federal Deposit Insurance Corporation. The Company does not believe it is exposed to any significant credit risk on its cash and cash equivalent balances.
Investments
Restricted short term investments consist of certificates of deposit recorded at the lower of cost or market. These deposits are with the same bank as cash balances are held with. As noted in Note 6, these instruments are restricted as part of letter of credit agreements the Company has entered into.
Restricted Cash
The Company is required to maintain cash balances for two purposes:
· as part of the construction loan / operating line financing as described in Note 7,
· as part of the tax increment financing agreement as described in Note 8.
Accounts Receivable
Credit terms are extended to customers in the normal course of business. The Company performs ongoing credit evaluations of its customers’ financial condition and, generally, requires no collateral.
Accounts receivable are recorded at their estimated net realizable value. Accounts are considered past due if payment is not made on a timely basis in accordance with the Company’s credit terms. Accounts considered uncollectible are written off. The Company’s estimate of the allowance for doubtful accounts is based on historical experience, its evaluation of the current status of receivables, and unusual circumstances, if any. At December 31, 2009 and 2008, the Company was of the belief that an allowance was not considered necessary. It is possible this estimate could change in the future.
Inventory
Inventory is stated at the lower of cost or market on a weighted average cost basis. Market is based on current replacement values not to exceed net realizable values and it is not less than net realizable values reduced by allowances for normal profit margin. Inventory
F-7
NEDAK ETHANOL, LLC
Notes to Financial Statements
December 31, 2009 and 2008
consists of raw materials, work in process, and finished goods. Corn is the primary raw material. Finished goods consist of ethanol and distiller’s grains produced.
Derivative Financial Instruments
The Company is exposed to the impact of market fluctuations associated with commodity prices. It uses derivative financial instruments as part of the overall strategy to manage market risk, as allowed by sufficient working capital and liquidity. The Company, when able, uses cash, futures and option contracts to hedge changes to the commodity prices of corn, ethanol, natural gas and gasoline. The Company will not enter into these derivative financial instruments for trading or speculative purposes, nor does it plan to designate these contracts as cash flow or fair value hedges for accounting.
Derivatives are recognized in the balance sheet at their fair value. The fair value of futures and options is determined by exchange traded market prices. Gains and losses from derivatives that do not qualify as accounting hedges, or are undesignated, must be recognized immediately in earnings and are recorded in cost of goods sold.
Contracts are evaluated to determine whether the contracts are derivatives. Certain contracts that literally meet the definition of a derivative may be exempted as “normal purchases or normal sales”. Normal purchases and normal sales are contracts that provide for the purchase or sale of commodities that will be delivered in quantities expected to be used or sold over a reasonable period in the normal course of business. Contracts that meet the requirements of normal purchases or sales are documented as normal and exempted from accounting as derivatives and, therefore, are not marked to market in the Company’s financial statements. Losses are recognized on such contracts when the contract price is not expected to be realized.
Property and Equipment
Property and equipment is stated at cost. Maintenance and repairs are expensed as incurred; major improvements are capitalized. Depreciation is computed using the straight-line method over the following estimated useful lives:
|
Land improvements
|
20 years
|
|
|
Buildings
|
15-39 years
|
|
|
Office equipment
|
5-7 years
|
|
|
Plant equipment
|
10-20 years
|
|
|
Vehicles
|
5-7 years
|
Depreciation expense for the years ended December 31, 2009 and 2008 was $6,099,280 and $123,228, respectively.
Long-Lived Assets
Long-lived assets, such as property and equipment, are reviewed for impairment whenever events or changes in circumstances indicate that the carrying amount of an asset may not be recoverable. If circumstances require a long-lived asset be tested for possible impairment, the Company first compares future undiscounted cash flows expected to be generated by an asset to the carrying value of the asset. If the carrying value of the long-lived asset is not recoverable on an undiscounted cash flow basis, impairment would be recognized to the extent that the carrying value exceeds its fair value. Fair value would be determined through various valuation techniques including discounted cash flow models, quoted market values and third-party independent appraisals, as considered necessary.
In 2008, the Company completed construction of its ethanol production facilities with nameplate capacity of 44 million gallons per year and a remote rail load-out facility. In accordance with the Company’s policy for evaluating impairment of long-lived assets described above, management has estimated that the projected future undiscounted cash flows from operations of these facilities exceed their carrying value at December 31, 2009; therefore, no impairment loss was recognized. In determining the projected future undiscounted cash flows, the Company has made significant assumptions concerning the future viability of the ethanol industry, the future price of corn in relation to the future price of ethanol and the overall demand for ethanol in relation to production and supply capacity.
F-8
NEDAK ETHANOL, LLC
Notes to Financial Statements
December 31, 2009 and 2008
Debt Issuance Costs
Debt issuance costs are amortized over the term of the related debt by use of the effective interest method. Amortization expense related to debt issuance costs of $242,535 for the year ended December 31, 2009 is included in interest expense. Amortization expense of $133,932 for the year ended December 31, 2008 was included in capitalized interest. Future amortization of debt issuance costs is expected to be as follows: 2010 $246,016, 2011 $225,673, 2012 $203,612, 2013 $183,996, 2014 $155,115, thereafter $327,567.
Revenue Recognition
The Company generally sells ethanol and distiller’s grains pursuant to marketing agreements. Revenues from these products are recorded when the customer has taken title and assumed the risks and rewards of ownership, prices are fixed or determinable and collectability is reasonably assured. Title is generally assumed by the buyer at the Company’s shipping point.
In accordance with the Company’s agreements for the marketing and sale of ethanol and distiller’s grains, marketing fees and commissions due to the marketers are deducted from the gross sales price as earned. Marketing fees and commissions were approximately $700,000 and $0 for the years ended December 31, 2009 and 2008, respectively. Revenue is recorded net of these fees and commissions. Shipping costs incurred in the sale of ethanol are included in Costs of Goods Sold in the Statement of Operations.
Net Income (Loss) per Common Unit
Basic net income (loss) per common unit is computed by dividing net income (loss) by the weighted average number of members’ common units outstanding during the period. Diluted net income per common unit is computed by dividing net income (loss) available to common units by the weighted average number of members’ common units and, if dilutive, members’ common unit equivalents outstanding during the period. There were no member common unit equivalents outstanding during the periods presented and the entire amount of loss was allocated to common units. Accordingly, for all periods presented the Company’s basic and diluted net income per common unit are the same.
Income Taxes
The Company is treated as a partnership for federal and state income tax purposes and generally does not incur income taxes. Instead, income or losses are included in the income tax returns of the Company’s members. Accordingly, no provision or liability for federal or state income taxes has been included in these financial statements. As of December 31, 2009, the Company’s reported basis in its net assets exceeds their tax basis by approximately $10,868,400. Accordingly, a net deferred tax liability of approximately $3,804,000 would be recognized by a debit to income tax expense, if the partnership were a taxable entity.
The Company files income tax returns in the U.S. federal jurisdiction and the state of Nebraska. Management continually evaluates the Company’s tax positions and has concluded that the Company has taken no uncertain tax positions that require adjustment to the financial statements. The Company is no longer subject to U.S. federal, state and local income tax examinations by tax authorities for years before 2006.
Segment Reporting
Operating segments are defined as components of an enterprise for which separate financial information is available that is evaluated regularly by the chief operating decision maker or decision making group in deciding how to allocate resources and in assessing performance. The Company has determined that it has one reportable business segment, the manufacture and marketing of fuel-grade ethanol and the co-products of the ethanol production process. The Company’s chief operating decision maker reviews financial information of the Company as a whole for purposes of assessing financial performance and making operating decisions. Accordingly, the Company considers itself to be operating in a single industry segment.
Subsequent Events
For purposes of these financial statements and all disclosures, subsequent events were evaluated by Management through the date that the Company’s annual report in which these financial statements are included in was filed.
F-9
NEDAK ETHANOL, LLC
Notes to Financial Statements
December 31, 2009 and 2008
2. LIQUIDITY AND MARKET UNCERTAINTIES
The Company has certain risks and uncertainties that it experiences during volatile market conditions such as what the ethanol industry experienced during 2008 and which continued through 2009 and into 2010. These volatilities can have a severe impact on operations.
The Company’s operating and financial performance is largely driven by the prices at which it sells ethanol and the net cost of corn. The price of ethanol is influenced by factors such as supply and demand, the weather, government policies and programs, unleaded gasoline prices and the petroleum markets as a whole. Excess ethanol supply in the market, in particular, puts downward pressure on the price of ethanol. The Company’s largest cost of production is corn. The Company’s cost of corn is generally impacted by factors such as supply and demand, the weather, government policies and programs, and risk management techniques used to protect against the price volatility. The Company is subject to significant risk that its operating margins may be reduced or eliminated due to the relative movements in the market prices of its products and major manufacturing inputs. As a result, market fluctuations in the price of or demand for these commodities can have a significant adverse effect on the Company’s operations and profitability. Due to the current conditions of these commodity markets, the Company may continue to produce negative margins.
As of December 31, 2009, the Company was in default of its Credit Agreement, as further discussed in Note 7. For this reason, the Company has reclassified amounts owing under this loan as current liabilities. Such treatment of the Company’s long term debt will continue, as required by GAAP, until such defaults are cured.
Because of these events and market conditions, there is an increased level of uncertainty with respect to the Company’s ability to obtain sufficient cash flows from operations or debt or equity financing sufficient to cover the liquidity needed for ongoing operations. The Company’s efforts to secure working capital include:
|
|
·
|
The Company and Lender have received approval from the United Stated Department of Agriculture (“USDA”) of a pre-application for a Business and Industries Guaranteed Loan (the “B&I Loan”), and are in the process of preparing full applications for two such loans. The first application in the amount of $5,000,000 for additional working capital was submitted to the USDA on February 16, 2010. The second application will be for refinancing a yet undetermined portion of the $42,500,000 construction loan with Lender.
|
|
|
·
|
The Company applied for a USDA Value Added Producers Grant for Working Capital of $300,000 on November 30, 2009. It is expected to learn the results of award assessments in the second quarter of 2010.
|
|
|
·
|
The Company may, depending on market and other conditions, pursue a private offering of equity.
|
Exclusive of the reclassification of the majority of the Company’s long term debt to current liabilities in 2009, the Company would have had negative working capital of approximately $1,281,000 including only Current Maturities of Long Term Debt that represent normal amortization of principal, as of December 31, 2009. As reported in the Balance Sheet, including the reclassification of long term debt to current liabilities, working capital was approximately a negative $47,155,000.
Accrued liabilities include accrued board compensation of $742,500 and $428,250 as of December 31, 2009 and 2008, respectively, and accounts payable include amounts due to the Company’s grain procurement agent totaling approximately $815,000 as of December 31, 2009, which have had favorable payment terms. If these favorable payment terms cease, more cash may be required.
These financial statements have been prepared assuming the Company will continue as a going concern. Until the Company is able to obtain additional working capital from the above options, for which no assurance can be given, or from operations, in addition to modifying the Credit Agreement covenants or refinancing the construction loan, there is substantial doubt as to whether the Company can continue to operate as a going concern.
3. INVENTORY
Inventory consists of the following:
|
December 31, 2009
|
December 31, 2008
|
|||
|
Raw Materials
|
$
|
1,561,766
|
$
|
994,283
|
|
Work in Process
|
567,410
|
309,238
|
||
|
Finished goods
|
842,143
|
40,497
|
||
|
Total
|
$
|
2,971,319
|
$
|
1,344,018
|
F-10
NEDAK ETHANOL, LLC
Notes to Financial Statements
December 31, 2009 and 2008
4. DERIVATIVE FINANCIAL INSTRUMENTS
The Company hedges a portion of its future corn purchases to the extent considered necessary for minimizing risk from market price fluctuations. Derivative financial instruments recorded on the balance sheet represent the current fair value of the instruments.
As of December 31, 2009, the Company had open positions for 620,000 bushels of corn on the Chicago Board of Trade to hedge its forward corn commitments. Management expects all open positions outstanding as of December 31, 2009 to be realized within the next fiscal year.
The following table provides details regarding the Company’s derivative financial instruments at December 31, 2009, none of which are designated as hedging instruments:
|
Instrument
|
Balance Sheet Location
|
Assets
|
Liabilities
|
|||
|
Commodity contracts
|
Derivative financial instruments
|
$
|
5,325
|
$
|
-
|
The following table provides details regarding the approximate gains from the Company’s derivative financial instruments in the statement of operations, none of which are designated as hedging instruments:
|
Derivatives not
|
Location of Gain
|
Amount of Gain
|
||
|
Designated as Hedging
|
Recognized in
|
Recognized in
|
||
|
Instruments
|
Income
|
Income
|
||
|
Commodity contracts
|
Cost of goods sold
|
$
|
4,703
|
5. MEMBERS’ EQUITY
In March 2009, the Company commenced a private offering for the issuance of up to 1,200 preferred membership units (“Preferred Units”) at $10,000 per Preferred Unit, for a maximum of $12 million. The Preferred Units entitle the holders thereof to:
|
|
i.
|
receive a preferred cumulative distribution of 10% (“Preferred Return”) before holders of common membership units receive distributions subject to:
|
a. any existing debt-related restrictions the Company may have,
b. after estimated tax distributions, and
c. upon declaration by the Board of Directors,
|
|
ii.
|
then share in their proportionate share any remaining amounts available for distribution,
|
|
|
iii.
|
first receive a distribution of the purchase price of the Preferred Units, plus any Preferred Return, upon a liquidation event, and
|
|
|
iv.
|
the right to vote as a class for purposes of determining whether a liquidation event has occurred.
|
|
|
v.
|
Following the third anniversary of the issuance of the Preferred Units, the Company may redeem Preferred Units for the original purchase price plus any accrued but unpaid distributions.
|
As of December 31, 2009, the Company had issued 185.4 Preferred Units, for a total of $1,854,428, of which 101.4 units were issued to Directors of the Company. The accumulated undeclared Preferred Return as of December 31, 2009 was $133,440, and the total liquidation preference of the Preferred Units as of December 31, 2009 was $1,987,868. There is no activity respecting the offering at this time, and no plans for a restart date.
Losses are generally allocated to all units based upon their respective percentage of units held, except that losses are not allocated to Preferred Units if the Preferred Return has not been achieved. For purposes of computing the net loss per common unit, no losses were allocated to the Preferred Units since the Preferred Return has not been achieved.
6. LINE OF CREDIT
In March 2006, the Company entered into a line of credit agreement, in favor of its natural gas transporter (see Note 10) to reserve pipeline space. The Company may draw up to $150,000 until maturity in May 2010. Interest is payable upon the lender’s demand or in May 2010 at a rate of 5.1%. In August 2007, the Company entered into a line of credit agreement, in favor of its natural gas transporter for the service of transporting gas. The Company may draw up to $923,828 until maturity in August 2010. Interest is payable upon the lender’s demand at a rate of 6.79%. These agreements are secured by restricted short term investments totaling $1,153,708 and $1,128,070 as of December 31, 2009 and 2008, respectively. As of December 31, 2009, there were no borrowings outstanding on the lines of credit.
F-11
|
NEDAK ETHANOL, LLC
Notes to Financial Statements
December 31, 2009 and 2008
|
7. LONG-TERM DEBT
|
December 31, 2009
|
December 31, 2008
|
|||
|
Note payable – construction contract
|
$
|
-
|
$
|
3,246,785
|
|
Construction loan under Credit Agreement
|
42,500,000
|
40,800,000
|
||
|
Members’ notes payable
|
18,750
|
15,000
|
||
|
Tax increment financing note (Note 8)
|
6,579,000
|
6,864,000
|
||
|
49,097,750
|
50,925,785
|
|||
|
Less current maturities
|
(3,205,471)
|
(2,425,002)
|
||
|
Less debt previously classified as long term
|
(45,873,529)
|
-
|
||
|
$
|
18,750
|
$
|
48,500,783
|
The maturities of long term debt at December 31, 2009, are as follows:
|
2010
|
$ 49,079,000
|
|
|
2011
|
-
|
|
|
2012
|
18,750
|
|
|
2013
|
-
|
|
|
2014
|
-
|
|
|
After 2014
|
-
|
|
|
Total long-term debt
|
$ 49,097,750
|
If the Company is able to amend the Credit Agreement without acceleration of the loans, for which no assurance can be given, the original estimated maturities of the long term debt at December 31, 2009, would be as follows:
|
2010
|
$ 3,205,471
|
|
|
2011
|
4,904,967
|
|
|
2012
|
5,238,028
|
|
|
2013
|
5,553,939
|
|
|
2014
|
5,911,020
|
|
|
After 2014
|
24,284,325
|
|
|
Total long-term debt
|
$ 49,097,750
|
Notes Payable-Construction Contract
As reported in previous periods, the Company had executed a $5,000,000 promissory note with Delta-T as an incentive to continue construction of the plant past April 2008. The balance of this note was $3,246,785 as of December 31, 2008. In September 2009, the Company’s contract with Delta-T was amended, as discussed in Note 10, to extinguish this debt.
Construction Loan under Credit Agreement
In February 2007, the Company entered into a senior credit facility (“Credit Agreement”) with AgCountry Farm Credit Services, FLCA (“Lender”) for a multiple advance construction loan totaling $42,500,000. The Company is required to make interest payments during the construction phase at the thirty-day LIBOR plus 3.4%, but not less than 6.0%. The interest rate was 6.0% at December 31, 2009. The performance test of the plant was completed in June 2009, but three significant equipment deficiencies prevented final acceptance at that time. The Credit Agreement provides that the construction loan is to be converted at final acceptance to a permanent ten year term loan of $32,500,000 and a $10,000,000 revolving term loan. As of December 31, 2009 and 2008, the Company had $42,500,000 and $40,800,000 outstanding on the construction loan, respectively. The Company is in negotiations with Lender to convert the loan to long term financing as discussed above.
The Credit Agreement requires the Company to maintain certain financial covenants, including minimum working capital of $6,000,000, minimum current ratio of 1.20:1.00, minimum tangible net worth of $41,000,000, minimum owners’ equity ratio of 50%, and a minimum fixed charge coverage ratio of 1.25:1.00, and also includes restrictions on distributions and capital expenditures. As of December 31, 2009 the Company is in violation of the working capital, current ratio, tangible net worth and fixed charge coverage
F-12
NEDAK ETHANOL, LLC
Notes to Financial Statements
December 31, 2009 and 2008
ratio requirements. The Credit Agreement contains certain prepayment fees in the first four years of the scheduled payments, and the loan is secured by substantially all the Company’s assets.
Under the current terms of the Credit Agreement, the Company is required to make level monthly principal and interest payments of approximately $568,000 beginning April 1, 2010 and ending on February 1, 2018. If a guaranteed USDA Business & Industries loan is granted, the amount and terms of conversion of the construction loan to a Term Loan and a Revolving Term Loan for working capital may change.
Under the terms of the Credit Agreement, the Company is required to pay interest on the principal advances monthly at the 30 day LIBOR plus 3.4%, which totaled 6.0% at December 31, 2009. The Company must pay a commitment fee of 0.25% on the unused portion of the revolving promissory note upon conversion to the revolving term loan. In addition, the Company was required to establish and fully fund a $2,400,000 Debt Service Reserve Account on or prior to the loan conversion date, no later than August 1, 2009. At such time, the commitment amount would have been reduced to an amount not to exceed $7,600,000 and the Debt Service Reserve Fund would no longer be required to be funded. This requirement was not met. The Company and Lender are discussing amendments to the terms of the Credit Agreement which may modify the foregoing provisions.
The Company executed a Fourth Supplement and Forbearance Agreement to Master Credit Agreement on March 27, 2009 (the “Fourth Supplement”). In connection with the Fourth Supplement, the Lender required the Company to obtain $1,000,000 of equity or subordinate debt capital by April 30, 2009, which was guaranteed by the Company’s board of directors in addition to the Preferred Units purchased by the Directors discussed in Note 5. The Lender extended this April 30, 2009 date to June 30, 2009 by which time the Company only received $844,428. The payment terms of the additional loan fee of $250,000 from the third amendment to the Credit Agreement were modified to provide that the fee will be paid in five $50,000 quarterly installments beginning on or before January 1, 2010. In addition, the Company undertook to achieve and maintain indefinitely 100% name plate production on or before May 1, 2009. The Fourth Supplement also provided that the interest on the unpaid principal amount of the construction and term loans accrues at a variable interest rate equal to LIBOR plus 5.40%, but not less than 6.00%. In addition to the Fourth Supplement, the Lender delayed required compliance by the Company of certain financial covenants in the Credit Agreement until after September 30, 2009 as well as delayed the requirement to make excess cash flow payments until December 31, 2009. On July 24, 2009, the Lender again declared the Loans in default, due to delinquent payment of fees and interest, deficiency in the raising of equity or subordinated debt, and failure to achieve nameplate production by May 1, 2009.
On September 30, 2009, the Company executed a Fifth Supplement and Forbearance Agreement to the Master Credit Agreement (“Fifth Supplement”) with the Lender, which (i) extended the dates to pay loan and restructure fees to begin on January 1, 2010 with $50,000 per month through January 1, 2011 and an additional payment of $100,000 payable on or before June 30, 2010, (ii) extended the first principal payment until April 1, 2010, (iii) provided for the release of $2,000,000 of restricted cash for the purchase of corn, and (iv) requires the Company to fund a loan reserve fund under the Credit Agreement in the amount of $2,000,000 if the Company receives the Business and Industry Loan Guarantee for $5,000,000 of working capital.
The Company and the Lender are in discussion to revise the Credit Agreement covenants and resolve all outstanding defaults under the Credit Agreement. No assurance can be provided that such Credit Agreement defaults will be successfully resolved.
As discussed in Note 10, on September 1, 2009, the Company reached a settlement with Delta-T which provided for cash payment to the Company from a Delta-T letter of credit of $3,995,000. Under the Fifth Supplement, $3,050,000 was released directly to the Company’s corn marketer to prepay for delivery of corn. The remaining $945,000 remains on deposit with the Lender pending agreement on terms and conversion of the construction loan to operating debt or other agreement to release these funds to the Company. This deposit is included in restricted cash on the balance sheet.
As stated above, the Company and Lender have received approval from the USDA of a pre-application for a Business and Industries Guaranteed Loan. Applications are being prepared for two separate loans. The first application is in the amount of $5,000,000 which would provide additional working capital. The second application will be for refinancing a yet undecided portion of the $42,500,000 construction loan. As part of these arrangements, the remaining portion of the construction loan under the original Credit Agreement would be converted to long term debt.
F-13
NEDAK ETHANOL, LLC
Notes to Financial Statements
December 31, 2009 and 2008
Note Payable to Members
In May 2004, each of the initial 15 members loaned the Company $1,000. The unsecured loans bore interest at 5% per annum with principal and interest due on April 8, 2009. On April 8, 2009, the notes were amended and restated to add accrued interest in the amount of $3,750 to the principal. The unsecured notes, which are classified as long-term debt as of December 31, 2009, continue to bear interest at 5% per annum with principal and interest due on April 8, 2012.
8. TAX INCREMENT FINANCING
In September 2007, the City of Atkinson, Nebraska, (“Issuer”) issued a tax increment financing Note (the “TIF Note”), the net proceeds of which in the amount of $4,939,925 were paid to the Company through a loan (the “TIF Loan”) to reimburse the Company for certain infrastructure improvements relating to the plant. Repayment of the Loan is secured by the Company’s pledge to the lender of the TIF Note (“TIF Lender”) and other obligations relating to the TIF Note. The original amount of the TIF Note was $6,864,000 and bears interest of 9.5%.
In connection with the issuance of the Note, the Issuer and the Company entered into a Redevelopment Contract (“Contract”). Under the Contract, the Note proceeds are to be used for Project costs, for the establishment of special funds held by the Note trustee for interest and principal payments and reserves (the “Capitalized Interest Fund” and the “Debt Service Reserve Fund”), and for debt issuance costs. The Company may not convey, assign, or transfer the project prior to the expiration of a 15 year period without the prior written consent of the Issuer. As of December 31, 2009 and 2008, the Capitalized Interest Fund was approximately $52,500 and $599,000, respectively, and is included in restricted cash on the balance sheet.
The Note is due in semi-annual increments which commence at $139,000 and increase to $444,000, with a final maturity in December 2021. Interest on the Note is payable semi-annually on September 1 and December 1. The interest rate resets on September 1, 2012 and September 1, 2017 to a rate equal to the 5-year U.S. Treasury Constant Maturity index plus 4.75% for the applicable five-year period and the remainder of the term of the TIF Loan, respectively. The Company has the option to redeem or purchase the Note in whole or in part. As of December 31, 2009 and December 31, 2008, the Company had $6,579,000 and $6,864,000 outstanding on TIF Loan, respectively.
On July 6, 2009, the Lender notified the Company that the Debt Service Reserve Fund was deficient, constituting a default under the TIF Loan. The primary reason for this default was the extended delays and losses associated with startup of the Company’s ethanol plant. In order to enable resolution of the Company’s default, the Company and the TIF Lender entered into a Forbearance Agreement dated December 31, 2009 (the “Agreement”).
Under the Agreement, the Company agreed to authorize a transfer from the Debt Service Reserve Fund to satisfy the Company’s principal payment due to TIF Lender on December 31, 2009. With the authorization of payment to TIF Lender from the Debt Service Reserve Fund, the Company became current on all required payments to TIF Lender, but has violated covenants in the TIF Loan requiring immediate replenishment of the Debt Service Reserve Fund. Moreover, the Company agreed to and is attempting to seek the consent of AgCountry Farm Credit Services, FCA (“Lender”) to (i) grant a security interest and Deed of Trust in favor of the TIF Lender upon the Company receiving, or being denied, the B&I Loan, (ii) grant a security interest in all reserve funds established under the TIF Loan and (iii) amend to the TIF Loan documents to (a) reduce the TIF Loan’s interest rate from 9.5% to 6.0% for three years, and upon expiration of the three years, the interest rate will be reverted to 9.5%, (b) reduce the Debt Service Reserve Fund to an amount equal to 12 months of principal payments, (c) make the Debt Service Reserve Fund funding contingent on the Company’s previous year’s profitability and (d) require the financial covenants and ratios in the TIF Loan documents to be consistent with the financial covenants and ratios to be agreed upon with Lender.
Under the Agreement, the TIF Lender shall refrain from exercising any of its rights or remedies under the TIF Loan, including acting on Company’s failure to maintain a sufficient amount in its Debt Service Reserve Fund or meet TIF Loan covenants, for a period beginning on December 31, 2009 and ending on the earlier of (a) March 31, 2010 or (b) 30 days following the approval of the proposed B&I Guaranty.
Due to the default mentioned above, the TIF Loan is classified in current liabilities.
F-14
NEDAK ETHANOL, LLC
Notes to Financial Statements
December 31, 2009 and 2008
9. FAIR VALUE MEASUREMENTS
Accounting standards establish a framework for measuring fair value. That framework provides a fair value hierarchy that prioritizes the inputs to valuation techniques used to measure fair value. The hierarchy gives the highest priority to unadjusted quoted prices in
active markets for identical assets or liabilities (level 1 measurements) and the lowest priority to unobservable inputs (level 3 measurements). The three levels of the fair value hierarchy are described below:Level 1: Inputs to the valuation methodology are unadjusted quoted prices for identical assets or liabilities in active markets that the Company has the ability to access.
Level 2: Significant other observable inputs other than Level 1 prices such as quoted prices for similar assets or liabilities; quoted prices in markets that are not active; or other inputs that are observable or can be corroborated by observable market data.
Level 3: Inputs to the valuation methodology are unobservable and significant to the fair value measurement.
The asset’s or liability’s fair value measurement level within the fair value hierarchy is based on the lowest level of any input that is significant to the fair value measurement. Valuation techniques used need to maximize the use of observable inputs and minimize the use of unobservable inputs.
The following table summarizes by level, within the fair value hierarchy, the Company’s assets (liabilities) that are measured at fair value on a recurring basis at December 31, 2009:
|
Level 1
|
Level 2
|
Level 3
|
Total
|
|
|
Commodity contracts
|
$ 5,325
|
$ -
|
$ -
|
$ 5,325
|
Certain assets and liabilities are measured at fair value on a nonrecurring basis; that is, the items are not measured at fair value on an ongoing basis but are subject to fair value adjustments in certain circumstances (for example, when there is evidence of impairment). As of December 31, 2009, no assets were recorded with any adjustments to fair value measurements.
The carrying values of cash and cash equivalents, restricted cash, restricted short-term investments, accounts receivable, the commodity broker receivable, derivative financial instruments and accounts payable are recorded at or approximate fair value. Management determined it is not practicable to estimate the fair value of the notes payable and long-term debt since these agreements contain unique terms, conditions, and restrictions, which were negotiated at arm’s length, and there was no readily determinable similar instrument on which to base an estimate of fair value.
10. COMMITMENTS AND CONTINGENCIES
Construction Contract
The Company entered into an Engineering, Procurement and Construction Services Fixed Price Contract dated August 9, 2006 with Delta-T, which has been amended with several supplements, amendments and change orders (collectively, the “Delta-T Contract”). The Delta-T Contract provided, among other things: (i) guarantee of Delta-T’s performance by Delta-T’s parent, Bateman Litwin NV, (ii) the provision by Delta-T of letters of credit in the amounts of $4,000,000 and $5,500,000 for the benefit of Lender and the Company, respectively, and (iii) a promissory note in the amount of $5,000,000 made by the Company in favor of Delta-T. Disputes between the parties respecting the letters of credit and other matters resulted in the filing by Delta-T of an action in the District Court of Douglas County, Nebraska, in which the court temporarily restrained the Company and Lender from making a draw on one of the letters of credit. The parties amended the Delta-T Contract on September 1, 2009 (the “Amendment”). The Amendment resolved asserted claims by both parties and provided the following, among other things: (i) Delta-T will repair certain plant emissions equipment, (ii) Delta-T will extend the $5,500,000 letter of credit to September 30, 2010 with conditions added to draw on such letter of credit, (iii) Delta-T is relieved of previously agreed upon punch list responsibility with certain exceptions, (iv) Delta-T relinquished all rights to the $3,995,000 of proceeds held by Lender from the September 2009 draw against the $4,000,000 letter of credit, (v) the $5,000,000 promissory note in Delta-T’s favor was extinguished, (vi) Delta-T agreed to dismiss its legal action and dissolve the temporary restraining order, and (vii) except as provided above, no further payments or transfer of funds shall be made to or from Delta-T and the Company. The extinguishment of the $5,000,000 promissory note and other contract liabilities were recorded as reductions to property and equipment. The receipt of the $3,995,000 cash, less $228,433 for costs expected to be incurred, was recognized as a gain in other income.
On March 19, 2010, the Company, Delta-T, Bateman and Bateman Engineering Inc. (“Bateman Engineering”) entered into a
F-15
NEDAK ETHANOL, LLC
Notes to Financial Statements
December 31, 2009 and 2008
Settlement Agreement and Mutual Release (the “Settlement Agreement”), under which, among other things, (i) Delta-T and Bateman authorized the Company to draw $3,000,000 from a letter of credit, and (ii) the Company released Delta-T and Bateman from all warranties and other claims under the Delta-T Contract. The Settlement Agreement resolved all outstanding disputes among the Company, Bateman and Delta-T relating to the Delta-T Contract and construction of the Company’s ethanol plant.
Plant Management Agreement
In July 2007, the Company entered into an agreement with an unrelated party for the operation and management of the Company’s plant. The Company pays a fixed monthly payment of approximately $114,000 for such services, which will be adjusted annually. The Company is currently paying for process chemicals at a fixed rate per denatured gallon of ethanol produced. The Company also has future obligations for an incentive program that is in effect for the first five years of operation following the Delta-T settlement discussed above. The agreement will terminate on December 31, 2014 unless terminated by either party giving 180 days prior written notice. The Company incurred approximately $1,188,000 and $1,238,500 for these services for the years ended December 31, 2009 and 2008, respectively.
Utility Contracts
In March 2006, the Company entered into an agreement with a natural gas provider for the procurement, and management of natural gas transportation and supply. The Company pays for the natural gas based on actual consumption along with a monthly management fee of $0.07 per MMBtu delivered. The agreement was automatically renewed for an additional two-year term in February 2008. As of March 31, 2010 this contract has been allowed to expire and the Company has entered into a consulting agreement with a management services company who is negotiating for gas supply on the Company’s behalf and making recommendations as to methods and sources of gas procurement on a week by week basis.
In May 2006, the Company entered into an agreement, secured by the Company’s line of credit discussed in Note 6, with a natural gas transporter for the transportation of natural gas. The Company pays the maximum transportation rate unless otherwise agreed for the maximum daily transportation quantity of 2450 MMBtu per day. The agreement is for a ten year period beginning September 2007 and may be extended for another primary term if agreed to by both parties.
In September 2007, the Company entered into an agreement, secured by the Company’s line of credit discussed in Note 6, with a natural gas transporter to expand the pipeline capacity. The Company pays the maximum transportation rate unless otherwise agreed for the maximum daily transportation quantity of 1,000 MMBtu per day. The agreement is for a ten year period beginning September 2007 and may be extended for another primary term if agreed to by both parties.
Transportation Agreement
In July 2007, the Company entered into an agreement with a fuel carrier for the transportation of ethanol from the plant to the load out facility. The Company pays a base fee per gallon unloaded plus a surcharge if above the diesel fuel base. The agreement has a three year term which commenced July 2007 and will automatically renew for additional one-year terms unless terminated by either party by written notice no less than 180 days prior to the ending date of the initial three-year term or of any renewal term.
Marketing Agreements
Ethanol
In November 2006, the Company entered into a marketing agreement with an unrelated party for the sale of its ethanol. The Company pays the marketer a fixed rate fee of $0.01 per net gallon of denatured ethanol for the services provided. The agreement will continue until December 2010. The agreement will automatically renew for an additional one year unless the Company gives four months’ written notice.
The marketer leases rail cars to the Company with varying terms under this agreement, which leases may survive the actual marketing agreement by many years. The Company has lease agreements for 167 rail cars under this agreement. There are 70 cars under leases that expire before the end of 2011 and carry an average monthly rental cost of $387. The remaining leases are for 97 cars and have expiration dates between March 31, 2017 and August 31, 2020, with average monthly rental cost of $668.
F-16
NEDAK ETHANOL, LLC
Notes to Financial Statements
December 31, 2009 and 2008
Revenues from sales to this marketer were approximately $59,906,000 and $0 for the years ended December 31, 2009 and 2008, respectively. Accounts receivable from this marketer were $674,671 as of December 31, 2009.
As of December 31, 2009 the Company has forward contracted sales of ethanol for 4,786,000 gallons of ethanol with an average price of $1.83 per gallon.
Distiller’s Grains
In January 2007, the Company entered into a marketing agreement with an unrelated party to purchase all of the Company’s modified wet distillers grains (“MWDG”). The marketer is to operate in good faith to obtain a market competitive price. The marketer pays the Company the selling price, less a marketing fee equal to $1.50 per ton of MWDG sold at $50 a ton or less or 3.0% of the price of MWDG sold over $50 a ton. The agreement will continue until March of 2011 and renew for an additional two years thereafter unless either party has given four months written notice. Revenue from this marketer was approximately $7,500,000 and $0 for the years ended December 31, 2009 and 2008, respectively. Accounts receivable from this marketer were $332,092 as of December 31, 2009.
Grain Procurement
In December 2006, the Company entered into an agreement with an unrelated party to supply corn required for its production of ethanol. As of January 2009, the parties no longer operate under this agreement. However, the agent continues to provide services to the Company on an at-will basis for nearly all contracts with local producers for the delivery of corn to the Company. The agent is paid a service fee of $0.04 per bushel of grain delivered, and the Company also executes some contracts directly with producers for some of its corn. In the ordinary course of business, the Company will enter into forward purchase contracts for its corn purchases. Management considers these forward contracts to be normal purchases since the corn will be delivered in quantities expected to be used by the Company over a reasonable period in the normal course of business. Purchases directly from the agent totaled approximately $8,261,000 and $2,215,000 for the years ended December 31, 2009 and 2008, respectively.
As of December 31, 2009, the Company had commitments on forward purchase contracts to purchase 2,183,000 bushels of corn at an average price of $3.78 per bushel totaling $8,255,000 for delivery between January 2009 and December 2010. Also, we have commitments on unpriced forward purchase contracts for 740,000 bushels.
Environmental Liabilities
The Company’s operations are subject to environmental laws and regulations adopted by various governmental entities in the jurisdiction in which it operates. These laws require the Company to investigate and remediate the effects of the release or disposal of materials at its location. Accordingly, the Company has adopted policies, practices, and procedures in the areas of pollution control, occupational health, and the production, handling, storage, and use of hazardous materials to prevent material environmental or other damage, and to limit the financial liability which could result from such events. Environmental liabilities are recorded when the liability is probable and the costs can be reasonably estimated.
The Company has received Notices of Violation (“NOV”) from the Nebraska Department of Environmental Quality (“NDEQ”) arising from failures of emission equipment designed and installed by the Company’s design builder, Delta-T Corporation (“Delta-T”). That equipment includes the plant’s regenerative thermal oxidizer (“RTO”) used to control emissions from the dryer and the CO2 Scrubber used to control emissions from the ethanol process.
The RTO had not performed according to the design specified in the Engineering, Procurement and Construction Services Fixed Price Contract dated August 9, 2006 with Delta-T (the “Delta-T Contract”), and the Company continues to assess methods to resolve the problem.
The CO2 Scrubber failed in original compliance testing, and equipment modifications and process adjustments were made, including chemical injection, to remediate the issue. During the startup operations of the plant beginning in January and continuing through the date of the original compliance testing, Delta-T had operated the plant without these modifications and as a result, the Company received an NOV in January 2010 which asserted that due to the failure of the CO2 Scrubber, the Company’s operation of the plant violates the operating permit issued by the NDEQ.
F-17
NEDAK ETHANOL, LLC
Notes to Financial Statements
December 31, 2009 and 2008
Accordingly, while the Company believes it has resolved all of the operational shortfalls cited in the NOVs, it is possible the NDEQ or the Nebraska Office of the Attorney General could assess fines against the Company as a result of having operated the plant with the equipment before it was operating in compliance. As a result of subsequent negotiations and problem solving in cooperation with the NDEQ, the Company believes that the chance that any material penalties being assessed is remote.
11. EMPLOYEE BENEFIT PLAN
The Company has a 401(k) plan (“Plan”) for all eligible employees, as defined by the Plan. The Company provides a matching contribution equal to 100%of the first 5% of each participant’s eligible compensation deferred. The Company recorded $37,062 and $8,794 in operating expenses for the cost of providing benefits under the Plan for the years ended December 31, 2009 and 2008, respectively.
F-18