Attached files
| file | filename |
|---|---|
| EXCEL - IDEA: XBRL DOCUMENT - NEDAK ETHANOL, LLC | Financial_Report.xls |
| EX-32.2 - SECTION 1350/960 CERTIFICATION/BORER - NEDAK ETHANOL, LLC | exhibit322_111111.htm |
| EX-31.1 - SECTION 302 CERTIFICATION/FAGERLAND - NEDAK ETHANOL, LLC | exhibit311_111111.htm |
| EX-32.1 - SECTION 1350/960 CERTIFICATION/FAGERLAND - NEDAK ETHANOL, LLC | exhibit321_111111.htm |
| EX-31.2 - SECTION 302 CERTIFICATION/BORER - NEDAK ETHANOL, LLC | exhibit312_111111.htm |
| EX-4.(II).1 - FIRST AMENDMENT TO FORBEARANCE AND STANDSTILL AGMT - NEDAK ETHANOL, LLC | exhibit4ii1_111111.htm |
| EX-4.(II).2 - SECOND AMENDMENT TO FORBEARANCE AND STANDSTILL AGMT - NEDAK ETHANOL, LLC | exhibit4ii2_111111.htm |
|
UNITED STATES
SECURITIES AND EXCHANGE COMMISSION
Washington, D.C. 20549
|
|||
|
Form 10-Q
|
|||
|
(Mark one)
|
|||
|
R
|
QUARTERLY REPORT UNDER SECTION 13 OR 15(d) OF THE SECURITIES EXCHANGE ACT OF 1934
|
||
|
For the quarterly period ended September 30, 2011
|
|||
|
£
|
TRANSITION REPORT UNDER SECTION 13 OR 15(d) OF THE SECURITIES EXCHANGE ACT OF 1934
|
||
|
For the transition period from _________ to __________
|
|||
|
Commission file number 000-52597
|
|||
|
NEDAK ETHANOL, LLC
|
|||
|
(Exact name of registrant as specified in its charter)
|
|||
|
Nebraska
|
20-0568230
|
||
|
(State or other jurisdiction of incorporation or organization)
|
(I.R.S. Employer Identification No.)
|
||
|
87590 Hillcrest Road, P.O. Box 391, Atkinson, Nebraska 68713
|
|||
|
(Address of principal executive offices)
|
|||
|
(402) 925-5570
|
|||
|
(Registrant’s telephone number, including area code)
|
|||
|
__________________________________________________________________
|
|||
|
(Former name, former address and former fiscal year, of changed since last report)
|
|||
|
Indicate by check mark whether the registrant has (1) filed all reports required to be filed by Section 13 or 15(d) of the Securities Exchange Act of 1934 during the preceding 12 months (or for such shorter period that the registrant was required to file such reports), and (2) has been subject to such filing requirements for the past 90 days. Yes R No £
|
|||
|
Indicate by check mark whether the registrant has submitted electronically and posted on its corporate Web site, if any, every Interactive Data File required to be submitted and posted pursuant to Rule 405 of Regulation S-T during the proceeding 12 months (or for such shorter period that the registrant was required to submit and post such files). Yes R No £
|
|||
|
Indicate by check mark whether the registrant is a large accelerated filer, an accelerated filer, a non-accelerated filer, or a smaller reporting company. See the definitions of “large accelerated filer,” “accelerated filer” and “smaller reporting company” in Rule 12b-2 of the Exchange Act.
|
|||
|
Large accelerated filer £ Accelerated filer £ Non-accelerated filer £ Smaller reporting company R
|
|||
|
Indicate by check mark whether the registrant is a shell company (as defined in Rule 12b-2 of the Exchange Act). Yes £ No R
|
|||
|
As of November 10, 2011, the issuer had 5,233 Common and 185.5 Class A Preferred Membership Units issued and outstanding.
|
|||
TABLE OF CONTENTS
|
PART I—FINANCIAL INFORMATION
|
|||
|
Item Number
|
Item Matter
|
Page Number
|
|
|
Item 1.
|
Condensed Unaudited Financial Statements.
|
1
|
|
|
Item 2.
|
Management’s Discussion and Analysis of Financial Condition and Results of Operations.
|
13
|
|
|
Item 4
|
Controls and Procedures.
|
26
|
|
|
PART II—OTHER INFORMATION
|
|||
|
Item 1.
|
Legal Proceedings.
|
27
|
|
|
Item 1A
|
Risk Factors.
|
27
|
|
|
Item 2.
|
Unregistered Sales of Equity Securities and Use of Proceeds.
|
27
|
|
|
Item 3.
|
Defaults Upon Senior Securities.
|
27
|
|
|
Item 5.
|
Other Information.
|
27
|
|
|
Item 6.
|
Exhibits.
|
27
|
|
|
Signatures
|
29
|
||
i
PART I—FINANCIAL INFORMATION
Item 1. Financial Statements.
|
NEDAK ETHANOL, LLC
|
||
|
Condensed Unaudited Balance Sheets
|
||
|
September 30, 2011
|
December 31, 2010
|
|
|
ASSETS (Note 8)
|
||
|
Current Assets
|
||
|
Cash and cash equivalents
|
$ 796,670
|
$ 1,618,244
|
|
Restricted short term investment (Note 7)
|
1,187,309
|
1,163,581
|
|
Restricted cash (Notes 8, 9 and 11)
|
1,473,619
|
1,043,173
|
|
Receivables
|
||
|
Trade
|
2,315,165
|
2,797,089
|
|
Other (Note 11)
|
100,258
|
16,044
|
|
Inventory (Note 3)
|
2,894,625
|
5,267,330
|
|
Prepaid expenses and other
|
150,942
|
208,190
|
|
Total current assets
|
8,918,588
|
12,113,651
|
|
Property and Equipment, net (Note 5)
|
70,577,075
|
75,160,322
|
|
Deposits
|
550,000
|
550,000
|
|
Debt Issuance Costs, net of accumulated amortization of $862,985 and $696,175 as of September 30, 2011 and December 31, 2010, respectively
|
898,250
|
1,065,060
|
|
Total other assets
|
1,448,250
|
1,615,060
|
|
Total Assets
|
$ 80,943,913
|
$ 88,889,033
|
|
LIABILITIES AND MEMBERS’ EQUITY
|
||
|
Current Liabilities
|
||
|
Current maturities of long-term debt (Notes 2, 8 and 9)
|
$ 6,228,166
|
$ 6,025,417
|
|
Accounts payable
|
||
|
Trade
|
825,416
|
1,244,868
|
|
Corn
|
4,000,164
|
5,322,868
|
|
Construction (Note 11)
|
350,000
|
0
|
|
Accrued liabilities (Note 2)
|
5,196,703
|
4,164,646
|
|
Reclassification of long-term debt to current (Notes 2, 8 and 9)
|
34,376,892
|
38,579,904
|
|
Total current liabilities
|
50,977,341
|
55,337,703
|
|
Long-Term Debt, net of current maturities (Notes 2, 8 and 9)
|
0
|
18,750
|
|
Commitments and Contingencies (Notes 2, 6, 7 and 11)
|
||
|
Members’ Equity (Note 6)
|
||
|
Preferred Units, 185.5 units issued and outstanding as of September 30, 2011 and December 31, 2010
|
1,854,503
|
1,854,503
|
|
Common Units, net of offering costs, 5,233 units issued and outstanding
|
49,839,281
|
49,839,281
|
|
Accumulated deficit
|
(21,727,212)
|
(18,161,204)
|
|
Total members’ equity
|
29,966,572
|
33,532,580
|
|
Total Liabilities and Members’ Equity
|
$ 80,943,913
|
$ 88,889,033
|
See Notes to Condensed Unaudited Financial Statements.
1
|
NEDAK ETHANOL, LLC
|
|||||
|
Condensed Unaudited Statements of Operations
|
|||||
|
Three Months Ended
|
Nine Months Ended
|
||||
|
September 30,
2011
|
September 30,
2010
|
September 30,
2011
|
September 30,
2010
|
||
|
Revenues
|
$ 42,042,633
|
$ 24,446,171
|
$ 114,105,631
|
$ 66,821,910
|
|
|
Cost of Goods Sold
|
42,553,535
|
25,012,122
|
113,725,990
|
69,113,201
|
|
|
Gross Profit (Loss)
|
(510,902)
|
(565,951)
|
379,641
|
(2,291,291)
|
|
|
General and Administrative Expenses
|
677,487
|
733,315
|
1,892,415
|
1,800,256
|
|
|
Operating Loss
|
(1,188,389)
|
(1,299,266)
|
(1,512,774)
|
(4,091,547)
|
|
|
Other Income (Expense)
|
|||||
|
Gain from litigation settlement (Note 11)
|
0
|
0
|
0
|
3,000,000
|
|
|
Loss on sale of asset
|
0
|
0
|
(3,471)
|
0
|
|
|
Interest income
|
3,806
|
6,363
|
15,049
|
24,057
|
|
|
Interest expense
|
(844,467)
|
(840,693)
|
(2,576,542)
|
(2,559,099)
|
|
|
Other income
|
495,722
|
8,939
|
511,730
|
10,394
|
|
|
Total other income (expense)
|
(344,939)
|
(825,391)
|
(2,053,234)
|
475,352
|
|
|
Net Loss
|
$ (1,533,328)
|
$ (2,124,657)
|
$ (3,566,008)
|
$ (3,616,195)
|
|
|
Net Loss Per Common Unit—Basic & Diluted (Note 6)
|
$ (301.94)
|
$ (414.94)
|
$ (707.95)
|
$ (717.54)
|
|
See Notes to Condensed Unaudited Financial Statements.
2
|
NEDAK ETHANOL, LLC
|
||
|
Condensed Unaudited Statements of Cash Flows
|
||
|
Nine Months Ended September 30,
|
||
|
2011
|
2010
|
|
|
Cash Flows from Operating Activities
|
||
|
Net loss
|
$ (3,566,008)
|
$ (3,616,195)
|
|
Adjustments to reconcile net loss to net cash provided by operations:
|
||
|
Depreciation and amortization
|
4,743,336
|
4,788,269
|
|
Loss on sale of asset
|
3,471
|
0
|
|
Loss on dryer fire
|
50,000
|
0
|
|
Change in fair value of derivative financial instruments
|
0
|
5,325
|
|
Change in operating assets and liabilities:
|
||
|
Receivables
|
497,710
|
(1,218,274)
|
|
Inventory
|
2,372,705
|
907,608
|
|
Prepaid expenses and other
|
57,248
|
105,137
|
|
Accounts payable
|
(1,742,156)
|
(190,167)
|
|
Accrued liabilities
|
1,032,057
|
1,844,063
|
|
Net cash provided by operating activities
|
3,448,363
|
2,625,766
|
|
Cash Flows from Investing Activities
|
||
|
Purchases of property and equipment
|
(850,000)
|
(110,617)
|
|
Proceeds from insurance company
|
1,050,000
|
0
|
|
Proceeds from sale of fixed assets
|
3,250
|
0
|
|
Net change in restricted cash and investments
|
(454,174)
|
(85,527)
|
|
Net cash used in investing activities
|
(250,924)
|
(196,144)
|
|
Cash Flows from Financing Activities
|
||
|
Payment on construction loan
|
(4,026,313)
|
(2,684,208)
|
|
Advance on tax increment financing
|
7,300
|
0
|
|
Sale of Preferred Units
|
0
|
75
|
|
Debt issuance costs
|
0
|
(250,000)
|
|
Net cash used in financing activities
|
(4,019,013)
|
(2,934,133)
|
|
Decrease in Cash and Cash Equivalents
|
(821,574)
|
(504,511)
|
|
Cash and Cash Equivalents—Beginning of Period
|
1,618,244
|
1,853,959
|
|
Cash and Cash Equivalents—End of Period
|
$ 796,670
|
$ 1,349,448
|
See Notes to Condensed Unaudited Financial Statements.
3
NEDAK ETHANOL, LLC
Notes to Condensed Unaudited Financial Statements
September 30, 2011
1. SUMMARY OF SIGNIFICANT ACCOUNTING POLICIES
The unaudited interim condensed financial statements of NEDAK Ethanol, LLC (the "Company") reflect all adjustments consisting only of normal recurring adjustments that are, in the opinion of management, necessary for fair presentation of financial position, results of operations and cash flows. The results for the three and nine month periods ended September 30, 2011 are not necessarily indicative of the results that may be expected for a full fiscal year. Certain information and footnote disclosures normally included in annual financial statements prepared in accordance with accounting principles generally accepted in the United States of America ("GAAP") are condensed or omitted pursuant to the rules and regulations of the Securities and Exchange Commission ("SEC"), although the Company believes that the disclosures made are adequate to make the information not misleading. The accompanying balance sheet as of December 31, 2010 is derived from the audited financial statements as of that date. These condensed unaudited financial statements should be read in conjunction with the Company's audited financial statements and notes thereto included in the annual report for the year December 31, 2010, filed as an exhibit to the Form 10-K filed with the SEC.
Nature of Business
The Company operates a 44 million gallon per year ethanol plant in Atkinson, Nebraska, and produces and sells fuel ethanol and distiller's grains, a co-product of the ethanol production process. Sales of ethanol and distiller's grains began in January 2009.
Accounting Estimates
Management uses estimates and assumptions in preparing these financial statements in accordance with GAAP. Those estimates and assumptions affect the reported amounts of assets and liabilities, the disclosure of contingent assets and liabilities, and the reported revenues and expenses. The Company uses estimates and assumptions in accounting for the following significant matters, among others: the allowance for doubtful accounts, useful lives of property and equipment, the valuation of inventory and inventory purchase commitments and long-lived asset impairments including the assumptions used to estimate future cash flows, the ability to raise capital, and the ability to comply with certain provisions within the Company's credit agreements. Actual results may differ from estimated amounts, and such differences may be material to the Company's financial statements. The Company periodically reviews estimates and assumptions, and the effects of revisions are reflected in the period in which the revisions are made.
2. LIQUIDITY AND MARKET UNCERTAINTIES
The Company has certain risks and uncertainties that it experiences during volatile market conditions such as what the ethanol industry has experienced since mid 2008 and which continues through 2011. These volatilities can have a severe impact on operations.
As a commodity processor, the Company's profitability is primarily driven by the relationship between the cost of corn and the price at which the Company can sell its end-products, ethanol and distiller's grains. The price of ethanol is influenced by factors such as supply and demand, the weather, government policies and programs, unleaded gasoline prices and the petroleum markets as a whole. Excess ethanol supply in the market, in particular, puts downward pressure on the price of ethanol. The Company's largest cost of production is corn. The Company's cost of corn is generally impacted by factors such as supply and demand, the weather, government policies and programs, and risk management techniques used to protect against the price volatility. The Company is subject to significant risk that its operating margins may be reduced or eliminated due to the relative movements in the market prices of its products and major manufacturing inputs. As a result, market fluctuations in the price of or demand for these commodities can have a significant adverse effect on the Company's operations and profitability. Due to the current conditions of these commodity markets, the Company may continue to produce negative margins.
4
NEDAK ETHANOL, LLC
Notes to Condensed Unaudited Financial Statements
September 30, 2011
As of September 30, 2011, the Company was in default under its Credit Agreement and its Tax Increment Financing loan, as further discussed in Notes 8 and 9. For this reason, the Company has presented these loans as current liabilities. Such treatment of the Company's long term debt will continue, as required by GAAP, until such defaults are cured.
Because of these events and market conditions, there is an increased level of uncertainty with respect to the Company's ability to obtain sufficient cash flows from operations or debt or equity financing sufficient to cover the liquidity needed for ongoing operations. The Company is having continued discussions with its lenders to resolve defaults under the Credit Agreement and Tax Increment Financing loan, which may include entering into a tolling agreement and obtaining additional capital. A final resolution to the defaults and amortization of the loans will require approval of the lenders and may include requirements for additional capital. The Company has also engaged a firm to undertake a more systematic approach to potential capital sources, and has commenced a private offering as further described in Note 6.
The Company continues to work with its lenders and others to identify the means by which it can improve its capital position. Management believes improved capitalization would better enable the Company to hedge and better manage its market risk in the commodity markets, among other things. Improving its capitalization will likely involve restructuring its debt so that both the debt level and the associated covenants are more compatible with current market conditions, and may also involve the Company issuing equity.
Exclusive of the reclassification of the majority of the Company's long term debt to current liabilities, the Company would have had negative working capital of $7,681,861, which includes restricted cash and investments of $2,660,928, and which includes only current maturities of long term debt that represent normal amortization of principal, as of September 30, 2011. As reported in the balance sheet, including the presentation of long term debt as current liabilities, working capital was a negative $42,058,753 as of September 30, 2011.
Accrued liabilities include accrued board compensation of $1,156,000 and $929,750 as of September 30, 2011 and December 31, 2010, respectively, which has payment terms the Company believes are favorable. If these payment terms change, more cash may be required.
These financial statements have been prepared assuming the Company will continue as a going concern. Until the Company is able to obtain additional working capital from the above options or from operations, for which no assurance can be given, and in addition, modify the Credit Agreement covenants or refinance the construction loan, there is substantial doubt as to whether the Company can continue to operate as a going concern.
3. INVENTORY
Inventory consists of the following:
|
September 30, 2011
|
December 31, 2010
|
|||
|
Finished goods
|
$
|
615,295
|
$
|
3,478,089
|
|
Work in process
|
939,008
|
912,104
|
||
|
Raw materials
|
1,340,322
|
877,137
|
||
|
Total
|
$
|
2,894,625
|
$
|
5,267,330
|
5
NEDAK ETHANOL, LLC
Notes to Condensed Unaudited Financial Statements
September 30, 2011
4. DERIVATIVE FINANCIAL INSTRUMENTS
The Company periodically hedges a portion of its future corn and natural gas purchases for minimizing risk from market price fluctuations. Derivative financial instruments recorded on the balance sheet represent the current fair value of the instruments.
As of September 30, 2011 and December 31, 2010, the Company had no open derivative positions.
The following table provides details regarding the gains from the Company's derivative financial instruments in the statements of operations, none of which are designated as hedging instruments:
|
Derivatives not
|
Location of Gain
(Loss)
|
Amount of Gain (Loss)
|
||||
|
Designated as Hedging
|
Recognized in
|
Recognized in
|
||||
|
Instruments
|
Income
|
Income
|
||||
|
Nine months ended September 30, 2011
Three months ended September 30, 2011
|
Commodity contracts
Commodity contracts
|
Cost of goods sold
Cost of goods sold
|
$
|
-
-
|
||
|
Nine months ended September 30, 2010
Three months ended September 30, 2010
|
Commodity contracts
Commodity contracts
|
Cost of goods sold
Cost of goods sold
|
75,211
(632,055)
|
5. PROPERTY AND EQUIPMENT
Property and equipment consisted of the following as of September 30, 2011 and December 31, 2010:
|
September 30, 2011
|
December 31, 2010
|
||
|
Land and improvements
|
$ 4,408,272
|
$ 4,408,272
|
|
|
Buildings
|
9,121,024
|
9,121,024
|
|
|
Plant equipment
|
73,409,691
|
73,417,242
|
|
|
Vehicles
|
560,383
|
560,383
|
|
|
87,499,370
|
87,506,623
|
||
|
Less accumulated depreciation
|
(16,922,295)
|
(12,346,599)
|
|
|
Net property and equipment
|
$ 70,577,075
|
$ 75,160,322
|
Depreciation expense for the nine months ended September 30, 2011 and 2010 was $4,576,526 and $4,571,350, respectively.
Long-lived assets, such as property and equipment, are reviewed for impairment whenever events or changes in circumstances indicate that the carrying amount of an asset may not be recoverable. In accordance with the Company's policy for evaluating impairment of long-lived assets, management has estimated that the projected future undiscounted cash flows from operations of these facilities exceed their carrying value at September 30, 2011; therefore no impairment loss was recognized.
6
NEDAK ETHANOL, LLC
Notes to Condensed Unaudited Financial Statements
September 30, 2011
6. MEMBERS' EQUITY
As of September 30, 2011 and December 31, 2010, there were 185.5 preferred membership units outstanding ("Class A Units"). The Class A Units entitle the holders thereof, among other things, to receive a preferred cumulative distribution of 10% ("Class A Return") before holders of common membership units receive distributions. Following the third anniversary of the issuance of the Class A Units, the Company may redeem them for the original purchase price plus any accrued but unpaid distributions. The accumulated undeclared Class A Return as of September 30, 2011 was $457,604, and the total liquidation preference of the Class A Units as of September 30, 2011 was $2,312,107. Losses are generally allocated to all unit holders based upon their respective percentage of units held, except that losses are not allocated to Class A Units if the Class A Return has not been achieved.
A reconciliation of net income applicable to common units used in the calculation of net income per common unit for the three and nine months ended September 30, 2011 and 2010 is as follows:
|
Three Months Ended
September 30,
|
Nine Months Ended
September 30,
|
||||
|
2011
|
2010
|
2011
|
2010
|
||
|
Net loss
|
$ (1,533,328)
|
$ (2,124,657)
|
$ (3,566,008)
|
$ (3,616,195)
|
|
|
Preferred Return on Preferred Units
|
(46,743)
|
(46,744)
|
(138,705)
|
(138,716)
|
|
|
Net loss applicable to Common Units
|
$ (1,580,071)
|
$ (2,171,401)
|
$ (3,704,713)
|
$ (3,754,911)
|
|
|
Weighted average Common Units Outstanding -
|
|||||
|
Basic and Diluted
|
5,233
|
5,233
|
5,233
|
5,233
|
|
|
Net loss per Common Unit - Basic and Diluted
|
$ (301.94)
|
$ (414.94)
|
$ (707.95)
|
$ (717.54)
|
|
The Company has commenced a private offering, projected to close by the end of 2011, of up to 1,500 Class B Preferred Units ("Class B Units") at $10,000 per unit. If issued, the Class B Units would entitle their holders, among other things, to (i) a cumulative distribution in preference to holders of the Company's common units, subject to several conditions, including the Company's debt-related restrictions, (ii) a preference in liquidation, and (iii) a right to convert the Class B Units into common units at a specified rate. No Class B Units will be issued unless numerous conditions, some outside of the Company's control, have been fulfilled. The offer and sale of the Class B Units have not been registered under the Securities Act of 1933 and the Class B Units may not be offered or sold in the United States absent registration or an applicable exemption from registration requirements.
7. LINE OF CREDIT
In March 2006, the Company entered into a line of credit agreement in favor of its natural gas transporter to reserve pipeline space. The natural gas transporter may draw up to $150,000 until maturity in May 2012. Interest is payable upon the lender's demand or in May 2012 at an annual rate of .85%. In August 2007, the Company entered into a line of credit agreement in favor of its natural gas transporter for the service of transporting gas. The natural gas transporter may draw up to $923,828. Interest is payable upon the lender's demand at an annual rate of 1.25%. These agreements are secured by restricted short term investments totaling $1,187,309 and $1,163,581 as of September 30, 2011 and December 31, 2010, respectively. As of September 30, 2011 and December 31, 2010, there were no borrowings outstanding on the lines of credit. All lines of credit are automatically renewed upon expiration.
7
NEDAK ETHANOL, LLC
Notes to Condensed Unaudited Financial Statements
September 30, 2011
8. LONG-TERM DEBT
|
September 30, 2011
|
December 31, 2010
|
|||
|
Construction loan under Credit Agreement
|
$
|
34,000,008
|
$
|
38,026,321
|
|
Members' notes payable
|
18,750
|
18,750
|
||
|
Tax increment financing note (Note 9)
|
6,586,300
|
6,579,000
|
||
|
40,605,058
|
44,624,071
|
|||
|
Less current maturities
|
(6,228,166
|
)
|
(6,025,417)
|
|
|
Less debt previously classified as long-term
|
(34,376,892)
|
(38,579,904)
|
||
|
$
|
0
|
$
|
18,750
|
Construction Loan under Credit Agreement
In February 2007, the Company entered into a senior credit facility ("Credit Agreement") with AgCountry Farm Credit Services, FLCA ("Lender") for a multiple advance construction loan totaling $42,500,000. The Company is required to make interest payments during the construction phase at the thirty-day LIBOR plus 3.4%, but not less than 6.0%. The interest rate was 6.0% as of September 30, 2011. The Credit Agreement provides that the construction loan is to be converted at final acceptance to a permanent ten year term loan of $32,500,000 and a $10,000,000 revolving term loan, which has not occurred as of September 30, 2011. As of September 30, 2011 and December 31, 2010, the Company had $34,000,008 and $38,026,321 outstanding on the construction loan, respectively.
Under the current terms of the Credit Agreement, the Company is required to make level monthly principal payments of $447,368 through February 1, 2018.
The Credit Agreement requires the Company to maintain certain financial covenants, including minimum working capital of $6,000,000, minimum current ratio of 1.20:1.00, minimum tangible net worth of $41,000,000, minimum owners' equity ratio of 50%, and a minimum fixed charge coverage ratio of 1.25:1.00, and also includes restrictions on distributions and capital expenditures. As of September 30, 2011, the Company was in violation of the working capital and current ratio covenants (working capital was $(7,681,861) and the current ratio was 0.54:1.00, both exclusive of the debt reclassification), the tangible net worth requirement (tangible net worth was $35,542,662) and the fixed charge coverage ratio (intended to be an annual measure, but using year to date measures and nine months of principal payment that ratio is 0.78:1.00). The Credit Agreement contains certain prepayment fees in the first four years of the scheduled payments, and the loan is secured by substantially all the Company's assets.
On August 6¸ 2010, the Company executed a Sixth Supplement and Forbearance Agreement to the Credit Agreement (the "Sixth Supplement"), under which the Company agreed that the Lender could apply the $3,945,087 it held as collateral under the Credit Agreement to the Company's current obligations under the Credit Agreement, including monthly principal payments, penalties and interest. In exchange for the foregoing among other terms, Lender agreed to refrain from exercising its rights under the Credit Agreement until the earlier of October 1, 2010 or the date of any default under the Sixth Supplement. The TIF Lender (defined in Note 9) filed a suit alleging a breach of the TIF Loan (defined in Note 9), which constituted a breach under the Sixth Amendment, but the Lender has not taken any actions directly related to the breach.
The Company and the Lender remain in discussions to revise the Credit Agreement covenants and resolve outstanding defaults under the Credit Agreement. In light of continuing poor margins in the ethanol industry, the Lender has indicated the Company should focus on mitigation of risk and obtaining additional capital.
Effective February 1, 2011, the Company entered into a Seventh Supplement and Forbearance Agreement with the Lender (the "Seventh Supplement" and together with the Credit Agreement and its supplements, the "Loan Agreements"), under which the Lender agreed to forbear from exercising its enforcement rights under the Loan Agreements until the earliest to occur of June 30, 2011 and the occurrence of an "event of default" under the
8
NEDAK ETHANOL, LLC
Notes to Condensed Unaudited Financial Statements
September 30, 2011
Seventh Supplement. The Company agreed that the Lender may apply the proceeds of a letter of credit issued in connection with the Fifth Supplement and Forbearance Agreement dated September 30, 2009 against any amounts due under the Loan Agreements, at the Lender's sole discretion. In addition, the Company agreed to deliver a comprehensive strategic financial plan, or update the plan previously delivered, to the Lender by March 31, 2011. Furthermore, the Company also committed to raise additional capital prior to expiration of the forbearance period provided in the Seventh Supplement, and the Company is obligated to provide certain financial statements, books, records and budgets to Lender on a periodic basis as set forth in the Seventh Supplement. The Company failed to meet its obligations under the Seventh Supplement and an "event of default" has occurred thereunder. As a result of the "event of default," (i) the principal amount outstanding under the Loan Agreements and any then-accrued but unpaid interest and then-accrued but unpaid fees and costs was accelerated and is immediately due and payable, in addition to other remedies set forth in the Loan Agreements, (ii) the Lender may terminate the Seventh Supplement, (iii) the Lender may terminate the Company's authority to use cash collateral of Lender, (iv) the Lender may protect, exercise and enforce any and all rights and remedies set forth in the Loan Agreements and/or under law or equity, and (v) the Lender may set off any financial obligations against all deposits, credits or rights to payment of the Company with any credits, right to payment or other claims of the Company against the Lender. Lender has not exercised any of the foregoing rights and the Company is in discussions with Lender to address the defaults under the Loan Agreements and corresponding events of default under the Seventh Supplement.
Note Payable to Members
In May 2004, each of the initial 15 members loaned the Company $1,000. The unsecured loans bore interest at 5% per annum with principal and interest due on April 8, 2009. On April 8, 2009, the notes were amended and restated to add accrued interest in the amount of $3,750 to the principal. The unsecured notes continue to bear interest at 5% per annum with principal and interest due on April 8, 2012.
9. TAX INCREMENT FINANCING
In September 2007, the City of Atkinson, Nebraska, ("Issuer") issued a tax increment financing Note (the "TIF Note"), the net proceeds of which in the amount of $4,939,925 were paid to the Company through a loan (the "TIF Loan") to reimburse the Company for certain infrastructure improvements relating to the plant. Repayment of the TIF Loan is secured by the Company's pledge to the lender of the TIF Note ("TIF Lender") and other obligations relating to the TIF Note. The original amount of the TIF Note was $6,864,000 and bears interest of 9.5%.
In connection with the issuance of the TIF Note, the Issuer and the Company entered into a Redevelopment Contract ("Contract"). Under the Contract, the TIF Note proceeds were used for project costs, for the establishment of special funds held by the TIF Note trustee for interest and principal payments and reserves (the "Capitalized Interest Fund" and the "Debt Service Reserve Fund"), and for debt issuance costs. As of September 30, 2011 and December 31, 2010, the Capitalized Interest Fund was approximately $6,500 and is included in restricted cash on the balance sheet.
Payments on the Note are due in semi-annual increments which commenced at $139,000 on June 1, 2009 and increase to $444,000, with a final maturity in December 2021. Interest on the TIF Note is payable semi-annually on September 1 and December 1. The interest rate resets on September 1, 2012 and September 1, 2017 to a rate equal to the 5-year U.S. Treasury Constant Maturity index plus 4.75% for the applicable five-year period and the remainder of the term of the TIF Loan, respectively. The Company has the option to redeem or purchase the TIF Note in whole or in part. As of September 30, 2011 and December 31, 2010, the Company had $6,586,300 and $6,579,000 outstanding on the TIF Loan, respectively.
On July 6, 2009, the TIF Lender notified the Company that the Debt Service Reserve Fund was deficient, constituting a default under the TIF Loan. The Company and the TIF Lender entered into a Forbearance Agreement dated December 31, 2009 (the "TIF Forbearance"). The Company and the TIF Lender failed to extend the TIF Forbearance or reach other arrangements containing similar forbearance obligations by May 15, 2010, and the
9
NEDAK ETHANOL, LLC
Notes to Condensed Unaudited Financial Statements
September 30, 2011
Company received a Notice of Default dated June 30, 2010 from the TIF Lender indicating that the Company was in default under the TIF Note due to nonpayment of $464,768 owing on June 1, 2010, and that the Debt Service Reserve Fund remained deficient by an amount of $588,553. Due to these defaults, the TIF Loan is classified as a current liability.
On August 12, 2010, the TIF Lender filed a lawsuit against the Company in the District Court of Douglas County, Nebraska alleging that the Company failed to make certain payments due under the TIF Note and failed to maintain the Debt Service Reserve Fund. In addition, the lawsuit stated that the TIF Lender accelerated the maturity of the TIF Note. The TIF Lender sought in the lawsuit repayment of $7,039,126 due as of August 9, 2010, plus such additional amounts as become due and owing under the TIF Note, with interest accruing after August 9, 2010 at the rate of 9.5% until the judgment is paid. On April 20, 2011, the court granted a partial summary judgment motion filed by the TIF Lender, subject to a hearing to determine costs and interest. The matter is still pending and TIF Lender has agreed to stay the proceedings as described below.
As amended on October 31, 2011, the Company entered into a Forbearance and Standstill Agreement with the TIF Lender (as amended, the "TIF Forbearance Agreement"), under which the TIF Lender agreed to forbear from exercising its enforcement rights under the TIF Loan until the earliest to occur of (i) November 30, 2011, (ii) the Lender taking any action to enforce its rights or remedies against the Company and (iii) and the occurrence of an "event of default" under the TIF Forbearance Agreement that is not cured within the applicable cure period. The TIF Lender agreed to stay the legal proceedings until the forbearance period expired or the TIF Forbearance Agreement was terminated. In addition, the Company agreed to make an initial payment to the TIF Lender of $25,000 and pay TIF Lender $25,000 per month through September 2011, which is applied first to certain expenses, then to late charges, then to interest and then to principal.
Under the terms of the Contract, a portion of the real estate taxes paid by the Company are to be used to make principal and interest payments on the TIF Note. However, the Company did not pay certain real estate taxes. The Company has accrued the full amounts of 2009 and 2010 real estate taxes all past due as of September 30, 2011 as well as nine twelfths of the total 2011, real estate taxes payable in May and September 2012 in accrued expenses on the balance sheet.
As provided in the TIF Forbearance Agreement, the TIF Lender reduced the accrued interest receivable from the Company by $464,474 as a result of the TIF Lender's purchase from the county of the past due 2009 Real Property Tax that was payable by the Company to the county tax assessor. This was recognized as a reduction in real estate tax expense as of June 30, 2011. Total accrued Real and Personal Property Tax payable by the Company as of September 30, 2011 was $2,499,550.
10. FAIR VALUE MEASUREMENTS
Accounting standards establish a framework for measuring fair value. That framework provides a fair value hierarchy that prioritizes the inputs to valuation techniques used to measure fair value. The hierarchy gives the highest priority to unadjusted quoted prices in active markets for identical assets or liabilities (level 1 measurements) and the lowest priority to unobservable inputs (level 3 measurements). The three levels of the fair value hierarchy are described below:
Level 1: Inputs to the valuation methodology are unadjusted quoted prices for identical assets or liabilities in active markets that the Company has the ability to access.
Level 2: Significant other observable inputs other than Level 1 prices such as quoted prices for similar assets or liabilities; quoted prices in markets that are not active; or other inputs that are observable or can be corroborated by observable market data.
Level 3: Inputs to the valuation methodology are unobservable and significant to the fair value measurement.
10
NEDAK ETHANOL, LLC
Notes to Condensed Unaudited Financial Statements
September 30, 2011
The asset's or liability's fair value measurement level within the fair value hierarchy is based on the lowest level of any input that is significant to the fair value measurement. Valuation techniques used need to maximize the use of observable inputs and minimize the use of unobservable inputs.
There were no assets or liabilities measured at fair value on a recurring or nonrecurring basis as of September 30, 2011 or December 31, 2010.
The carrying values of cash and cash equivalents, restricted cash, restricted short-term investments, accounts receivable, and accounts payable are recorded at or approximate fair value. Management determined it is not practicable to estimate the fair value of the notes payable and long-term debt since these agreements contain unique terms, conditions, and restrictions, which were negotiated at arm's length, and there was no readily determinable similar instrument on which to base an estimate of fair value.
11. CONCENTRATIONS, COMMITMENTS AND CONTINGENCIES
Major Customers
Approximately 99% of the Company's ethanol revenues are received from a single ethanol marketer through sales on the spot market by Tenaska BioFuels, LLC ("Tenaska"). Beginning in the third quarter of 2011, the Company pays Tenaska a marketing fee of 1.25% of the contract price of ethanol sold for its marketing services. As of September 30, 2011, the Company had forward contracted sales of ethanol with Tenaska for 290,000 gallons of ethanol at an average fixed price of $2.365 per gallon, for delivery in October 2011. Revenues from ethanol sales to Tenaska were $36,528,000 and $97,606,000 in the three and nine month periods ended September 30, 2011, respectively. Accounts receivable from Tenaska as of September 30, 2011 and December 31, 2010 were $1,389,000 and $1,517,400, respectively.
Gain from Litigation Settlement
A gain of $3,000,000 was recognized on March 19, 2010 in connection with a settlement with the Company's contractor for the facility, previously disclosed. The remaining funds from the settlement are held in restricted cash and are used to satisfy certain amounts due the Lender under the Credit Agreement.
Plant Management Agreement
In July 2007, the Company entered into an agreement with an unrelated party for the operation and management of the Company's plant. The Company pays a fixed monthly payment of approximately $120,434 for such services, which are adjusted annually. The unrelated party also supplies process chemicals, which the Company is currently paying for at a fixed rate per denatured gallon of ethanol produced. The contract allows for potential future payments in an incentive program intended to be based on operational improvements and Company profitability. The agreement will terminate on December 31, 2014 unless terminated by either party giving 180 days prior written notice. The Company incurred approximately $381,000 and $1,143,000 for these services for the three and nine month periods ended September 30, 2011, respectively, and $377,000 and $1,111,000 for these services for the three and nine month periods September 30, 2010, respectively.
Utility Contracts
The Company entered into a consulting service contract for management of its needs for natural gas in plant operations. The three services of natural gas procurement required to operate the plant are transport, distribution and
11
NEDAK ETHANOL, LLC
Notes to Condensed Unaudited Financial Statements
September 30, 2011
supply. The physical supply of natural gas to operate the plant is purchased from various companies based on bids established by the Company's Risk Management Committee with the advice of the management services company. The gas is transported by Kinder Morgan pursuant to various contracts with the Company, and delivered to the local gas company, Source Gas, which distributes the gas to the plant.
Transportation Agreement
The Company is party to an agreement with a fuel carrier for the transportation of ethanol from the plant to the load out facility. The Company pays a base fee per gallon unloaded plus a surcharge if above the diesel fuel base. The agreement commenced in July 2007 and automatically renewed for an additional one-year term in July 2011, and will continue to automatically renew for additional one-year terms unless terminated by either party by written notice no less than 180 days prior to the ending date of the renewal term.
Rail Car Leases
The Company has lease agreements for 137 rail cars. There are 29 cars under leases that expire before the end of 2011 and carry an average monthly rental cost of $400. The remaining 108 cars have expiration dates between May 31, 2017 and August 31, 2020, with an average monthly rental cost of $658.
Environmental Liabilities
The Company's operations are subject to environmental laws and regulations adopted by various governmental entities in the jurisdiction in which it operates. These laws require the Company to investigate and remediate the effects of the release or disposal of materials at its location. Accordingly, the Company has adopted policies, practices, and procedures in the areas of pollution control, occupational health, and the production, handling, storage, and use of hazardous materials to prevent material environmental or other damage, and to limit the financial liability which could result from such events. Environmental liabilities are recorded when the liability is probable and the costs can be reasonably estimated.
Dryer Damage
On March 22, 2011, a fire caused approximately $1,200,000 of damage to a dryer. The Company expects its insurer to pay for the damage, less the $50,000 deductible which was expensed in Cost of Goods Sold as a Maintenance and Repair Expense, as of June 30, 2011 at the completion of the dryer repair. As of June 30, 2011, the dryer repair was complete and the dryer was online. As of September 30, 2011, the Company had received $1,050,000 from its insurer and had $100,000 owing from its insurer in receivables and $350,000 owed to vendors as accounts payable in connection with such repairs.
Hail Damage
On September 21, 2010, a hail storm caused damage to the roof coverings within the plant. As of September 30, 2011 the Company received a $496,000 insurance claim, which is recognized as other income. Management expects that the plant will be able to continue to operate normally, without repairing the hail damage.
12
Item 2. Management's Discussion and Analysis of Financial Condition and Results of Operations.
Forward Looking Statements
This quarterly report on Form 10-Q of NEDAK Ethanol, LLC (the "Company," "we" or "us") contains forward-looking statements that involve future events, our future performance and our expected future operations and actions. In some cases you can identify forward-looking statements by the use of words such as "may," "should," "anticipate," "believe," "expect," "plan," "future," "intend," "could," "estimate," "predict," "hope," "potential," "continue," or the negative of these terms or other similar expressions. These forward-looking statements are only our predictions and involve numerous assumptions, risks and uncertainties. Our actual results or actions may differ materially from these forward-looking statements for many reasons, including the following factors:
|
|
·
|
Overcapacity in the ethanol industry;
|
|
|
·
|
Fluctuations in the price and market for ethanol and distiller's grains;
|
|
|
·
|
Availability and costs of products and raw materials, particularly corn and natural gas;
|
|
|
·
|
Our ability to obtain the debt and equity financing necessary to operate our plant and our ability to meet the associated covenants;
|
|
|
·
|
Changes in our business strategy, capital improvements or development plans;
|
|
|
·
|
Mechanical difficulties in operation of the plant;
|
|
|
·
|
Changes in the environmental regulations that apply to our plant site and operations and our ability to comply with environmental regulations;
|
|
|
·
|
Our ability to hire and retain key employees for the operation of the plant;
|
|
|
·
|
Changes in general economic conditions or the occurrence of certain events causing an economic impact in the agricultural, oil or automobile industries;
|
|
|
·
|
Changes in the weather and economic conditions impacting the availability and price of corn and natural gas;
|
|
|
·
|
Changes in federal and/or state laws (including the elimination of any federal and/or state ethanol tax incentives);
|
|
|
·
|
Changes and advances in ethanol production technology; and competition from alternative fuel additives;
|
|
|
·
|
Lack of transport, storage and blending infrastructure preventing ethanol from reaching high demand markets;
|
|
|
·
|
Our ability to generate free cash flow to invest in our business and service our debt;
|
|
|
·
|
Volatile commodity and financial markets;
|
|
|
·
|
Changes in interest rates and lending conditions; and
|
|
|
·
|
Results of our hedging strategies.
|
|
|
|
Our actual results or actions could and likely will differ materially from those anticipated in the forward-looking statements for many reasons, including the reasons described in this report. We are not under any duty to update the forward-looking statements contained in this report. We cannot guarantee future results, levels of activity, performance or achievements. We caution you not to put undue reliance on any forward-looking statements, which speak only as of the date of this report. You should read this report and the documents that we reference in this report and have filed as exhibits completely and with the understanding that our actual future results may be materially different from what we currently expect. We qualify all of our forward-looking statements by these cautionary statements.
Overview, Status and Recent Developments
We completed full startup of our ethanol plant in June 2009, and have the capacity to annually process approximately 18 million bushels of corn, through a dry milling process, into approximately 44 million gallons of ethanol per year. We also produce approximately 340,000 tons of wet distiller's grains ("WDG") annually. We are currently operating at approximately 117% capacity.
Our plant needs approximately 47,000 bushels of corn per day as the feedstock for its dry milling process. The grain supply for our plant is obtained primarily from local markets. The price and availability of corn are subject to
13
significant fluctuations depending upon a number of factors that affect commodity prices in general, including crop conditions, weather, governmental programs and foreign purchases. As a commodity processor, our profitability is primarily driven by the relationship between the cost of corn and the price at which we can sell our end-products, ethanol and WDG. Since we have been operational, the price of ethanol has usually tracked closely with the cost of corn.
Although the corn-ethanol Crush Margin—the difference between the cost of corn in each gallon and the price of ethanol—has varied from time to time, revenues from sales of ethanol have usually covered our variable costs of operations, leaving our fixed costs to be covered by our WDG revenues. As of October 28, 2011, corn for November 2011 delivery was $6.55 per bushel and the corresponding ethanol sales price was $2.753 per gallon on the Chicago Board of Trade ("CBOT"), resulting in a gross Crush Margin of $0.414 per gallon.
Because of the way our costs have been covered during our first two and a half years of operations, our profitability has tended to improve with higher corn costs. Cattle feeders compare our WDG prices to the price they would otherwise pay for feed corn, which means that generally speaking throughout our operations, higher corn prices have tended to increase our WDG revenues. So long as the price of ethanol covers our variable costs with a sufficient Crush Margin and our fixed costs are covered by WDG prices, higher corn costs support higher WDG prices and increase our profitability. Since these commodity price relationships are complex and not necessarily correlated, these trends could change at any time, and our profitability could be hindered by higher corn prices. At some point, increased corn costs will decrease the Crush Margin to the point where WDG prices cannot compensate and our profitability would correspondingly decrease.
As described below under "Liquidity and Capital Resources—Credit Facility," we have been actively working with our lenders to resolve defaults under our credit agreements, change the way we manage our commodity risk and identify sources of additional capital to meet our working capital needs. In connection with that process, we modified or terminated several of our pre-existing contracts for the sale of ethanol and WDG and the purchase of corn and natural gas. Currently, we are considering entering into a substitute marketing agreement or toll processing agreement in conjunction with our capitalization efforts discussed below, which we believe could allow us to more effectively manage risk and will reduce our working capital needs. While those discussions are on-going, we have established a relationship with Tenaska Biofuels, LLC ("Tenaska"). Although we have not entered into any long-term agreement with Tenaska, we are working closely with Tenaska for the purchase of corn and have been selling all of our ethanol through Tenaska.
WDG Revenues
As noted above, WDG sales are a key revenue stream driving our profitability. Generally, because distiller's grains compete with other protein-based animal feed products, the price of distiller's grains will usually decrease when the prices of competing feed products decrease. Downward pressure on commodity prices, such as corn and soybeans, will generally cause the price of competing animal feed products to decline, resulting in downward pressure on the price of WDG, which will decrease our revenues. The opposite is also true as shown in the first nine months of 2011. As corn costs throughout 2011 have been significantly higher than 2010, revenues from WDG have increased in 2011 over 2010. That increase is especially significant in the third quarter, when demand is at the seasonal low point in the annual cycle.
These cost/price relationships have borne out throughout 2011 compared to 2010, but it is also important to note that the comparison of third quarter to second quarter is greatly affected by the demand pressures in a marketplace when grain costs are high or low. The economic benefit of WDGs over corn to the cattle feeders is greater when both corn and WDG prices are high. In 2010, when corn was less costly, the economic benefit of WDGs in the diet was not as great as it has been in 2011 when both corn and WDG pricing has been significantly higher. Thus, in the third quarter of 2011, when the general demand for grain in the diet is less important because green grass is abundant, the higher cost structure caused the demand for WDGs to be greater compared to the third quarter of 2010.
14
Also contributing to the comparative doubling of WDG revenue in the third quarter of 2011 over the third quarter of 2010 was a significant reduction in both competitive supply and demand of WDGs in the marketplace. Late in 2009 and through the summer of 2010, a large local ethanol facility increased the amount of WDG available in the marketplace. Additionally, a local feedlot closed, which decreased local demand for distiller's grains. In the fall of
2010, the local feedlot resumed operations and our competitor's WDG production was converted to dried distiller's grain production for the export market. This has increased our WDG sales since September 2010, with third quarter 2011 revenues 183% higher than the same period in 2010.
Subsequent to quarter end, as the 2011 corn harvest and the availability of new crop corn approached in October, commodity prices for corn and ethanol began to decline from the highs of quarter three. However, we expect that fourth quarter 2011 WDG revenues will continue to compare favorably over the same period of 2010 even though both the cost structure and supply pressures had already changed in the fourth quarter of 2010 because of the increased stability of the distiller's grains market. We believe this is because the market increasingly views WDGS as both an economically and nutritionally preferable feed ingredient as compared to corn, as well as a product that improves the wellbeing and appetite for the cattle.
And finally, we believe continued improvements in plant operational productivity, operating processes and formulation may improve our financial results going forward.
As of September 30, 2011, we had no material amounts of WDG contracted to sell.
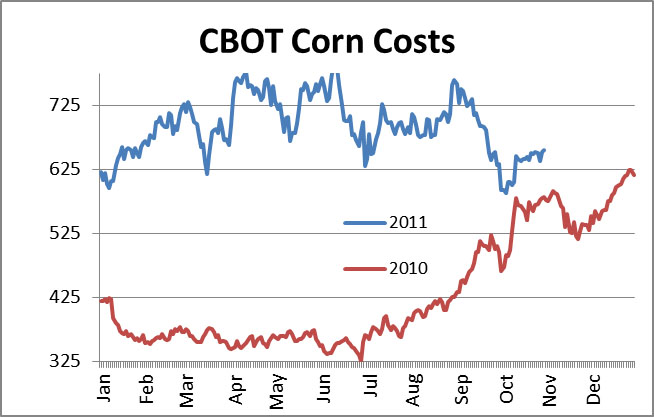
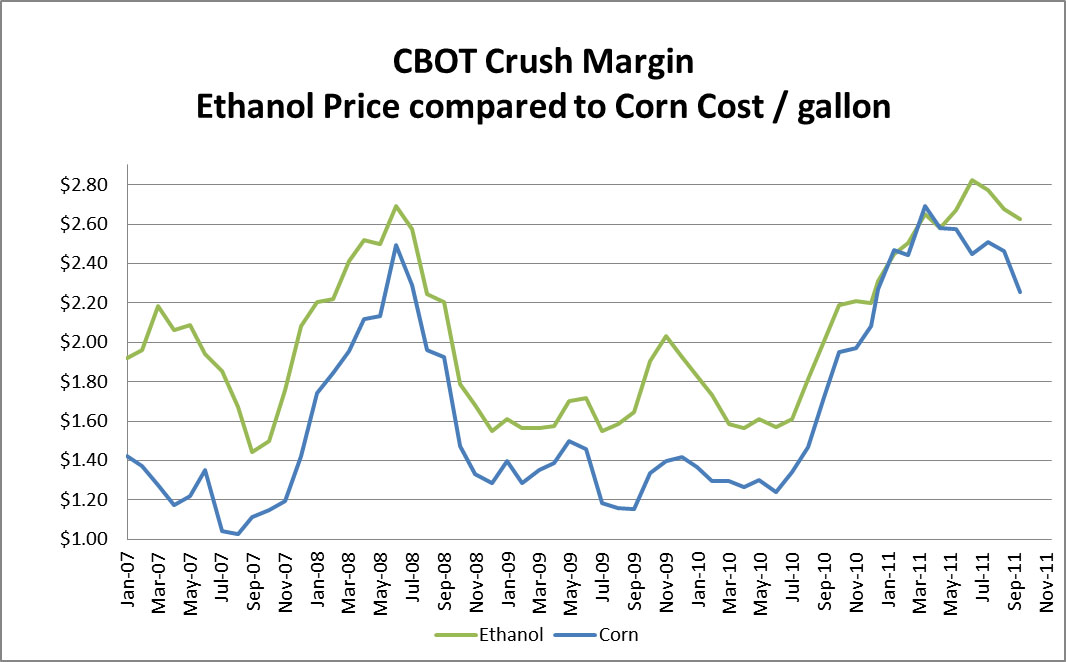
The following graph demonstrates the relationship between the CBOT cost of corn and the price of ethanol since January, 2007. In the fourth quarter of 2009, the Crush Margin improved for a short time and it continued strong into February 2010. This data shows that there are no trends or seasonal patterns impacting the ethanol marketplace, and instead that the ethanol market has been a work in progress for five years.
2011 began with a never-before seen relationship between corn and ethanol. For several months, corn cost more than the price at which the ethanol derived from it could be sold. That negative relationship continued through the second quarter of 2011 and finally changed near the middle of June. The gross Crush Margin has continued to be positive throughout the third quarter of 2011 and continues in the fourth. The average Crush Margin since the beginning of July has been approximately $0.20 per gallon, with the high point of $0.43 at the end of July. That gross Crush Margin was above $0.40 for only three days, and has fluctuated between $0.10 and $0.33 per gallon since.
15
Ethanol Market Factors
The price of ethanol is largely driven by supply and demand on the national markets, as well as regulatory requirements born by fuel blenders. Annual U.S. ethanol production capacity grew continually from 1980 through the middle of 2009. According to the Renewable Fuels Association ("RFA"), in 2002, annual U.S. ethanol production surpassed two billion gallons, and in 2009 it topped ten billion gallons.
The Renewable Fuels Standard ("RFS"). The RFS was created by the Energy Policy Act of 2005 (the "2005 Act"), established the RFS2 standard for blending renewable fuels into automobile fuel in 2011 at 13.95 billion gallons, of which 2.56 billion gallons must come from non-corn based ethanol, leaving a maximum requirement of 11.4 billion gallons of corn based ethanol to be blended in 2011.
On September 26, 2011, the RFA published their monthly report, US Ethanol Capacities, which reported that total U.S. nameplate capacity was 14.7 billion gallons and operating production was 14.1 billion gallons, with 246 million gallons under construction in the U.S. Projecting this 14.7 billion gallons of capacity at only 115% of nameplate would produce nearly 17 billion gallons of ethanol annually. That is more than five billion gallons of excess capacity beyond the 2010 RFS standard. Therefore, in order to support current ethanol prices, the ethanol industry must generate significant demand for ethanol beyond the minimum floor set by the Environmental Protection Agency ("EPA") under the RFS or voluntarily restrict production to levels that more closely match actual consumption.
E10/E15 Blend Rates. In response to a request by Growth Energy, an ethanol industry trade association, under section 211(f)(4) of the Clean Air Act, the EPA granted a partial waiver to allow fuel and fuel additive manufacturers to introduce gasoline that contains more than 10 volume percent (vol%) ethanol and up to 15 vol% ethanol ("EPA15") for use in model year ("MY") 2001 and newer light duty motor vehicles, subject to several conditions. On October 13, 2010, the EPA granted a partial waiver for E15 for use in MY2007 and newer "light-duty vehicles" (which include cars, light-duty trucks and medium-duty passenger vehicles). On January 21, 2011, the EPA granted a partial waiver for E15 for use in MY2001-2006 light-duty vehicles. These decisions were based on test results provided by the U.S. Department of Energy ("DOE") and other information regarding the potential effect of E15 on vehicle emissions. Taken together, the two actions allow, but do not require, E15 to be introduced into commerce for use in MY2001 and newer light-duty vehicles if conditions for mitigating, misfueling and
16
ensuring fuel quality are met. The EPA is in the process of completing work on regulations that would provide a more practical means of meeting the conditions.
The Volumetric Ethanol Excise Tax Credit ("VEETC"). The VEETC currently provides ethanol blenders with a tax credit of $0.45 per gallon of ethanol blended into gasoline and is set to expire on December 31, 2011. We believe that the VEETC primarily benefits ethanol blenders, as opposed to producers, and as a result, failure to extend the VEETC may have a negative impact on ethanol demand, but we do not anticipate any such negative impact will be material to us, and may be offset by corresponding political benefits. We expect the RFS to continue to drive demand for ethanol.
Corn Ethanol Price Correlation. As shown in the graph above, throughout the last four years ethanol, and corn prices rose and fell together with a high level of correlation. We have no reason to expect this to change in the foreseeable future. On a macro basis, we also believe that both product delivery infrastructure and demand for ethanol must increase in order to increase ethanol profit margins over both the near and long term.
On August 30, 2011, corn reached the high point of the third quarter 2011 on the CBOT at $7.635 per bushel. On that same date, ethanol closed at $2.93 per gallon, which accounted for a gross Crush Margin of $0.195. In the second quarter, the high point for corn on the CBOT was on June 10 at $7.87 per bushel. On that same day, ethanol closed at $2.78 per gallon, which resulted in a negative Crush Margin of ($0.035) per gallon. By the end of October 2011, the corn cost had declined modestly to the $5.90 - $6.50 range, while ethanol had declined to the $2.60 - $2.75 range, which resulted in a gross Crush Margin of nearly $0.45 per gallon - a $0.50 improvement from the middle of the year.
We believe that since the beginning of the global recession in mid 2009, the fluctuating U.S. demand for ethanol has been primarily driven by two variables: (1) the level of on-hand inventory of ethanol in the domestic blender pipeline and storage, and to a lesser extent, (2) the sale of ethanol to South America as the weather and economies affect the sugar crop and the production of sugar-based ethanol there. The Crush Margin tends to increase in the short term (week to week) when shortages in blender inventories cause immediate demand pressure. Less dramatically, we believe that the net export of U.S. ethanol to Brazil as a result of the Brazilian sugar crop shortages caused longer term (month to month) increases in the 2010 average Crush Margins. These dynamics have continued throughout the nine months of 2011.
We believe these short and medium term fluctuations in the Crush Margin will continue to cover our variable ethanol production costs, and until the domestic ethanol distribution infrastructure grows and domestic demand for ethanol increases, the Crush Margin will have a muted impact on our profitability.
Risk Management
Because our financial performance is primarily based on commodity prices, one of the most important facets of our industry is risk management, focused on maintaining balance in the sale of ethanol and the purchase of corn. Historically, and to the extent we had available working capital, we have used commodity forward-contract marketing. The preferred position is to purchase corn and sell a matching amount of ethanol for future delivery when the margins are profitable. When corn is forward-contracted and ethanol cannot be sold to balance, we face the risk that corn prices will fall, followed by ethanol, leaving the plant with excessive expenses in corn purchases, pushing the cost of ethanol above the market price. Even if the decision is made to shut down the plant, rather than operate at a loss, the purchase and resale of that corn will also result in a loss. Alternatively, we have been limited to using nearby spot purchases of corn and sales of ethanol for prompt delivery. We are continuing to explore other marketing arrangements and possibly a toll processing agreement to reduce our exposure to commodity price risk and more efficiently manage our working capital.
Production Matters
As in the first half of 2011, we have generated average production volume above 110% of our nameplate capacity in the third quarter, during which time daily rates have often gone above 117% of nameplate. We hope to continue to improve equipment and processes until we achieve daily production rates that require an application to the Nebraska Department of Environmental Quality ("NDEQ") to increase our Air Quality Permit production limit beyond our
17
current 117% of nameplate. These trends compare to the first three quarters of 2010 very favorably, when we were forced to run the plant at reduced rates due to poor quality corn and increased foreign material in the corn fines. Throughout 2011, we have gradually increased the steady-state rates up to and past 100% of our plant's name-plate capacity.
Results of Operations
We continued to experience improvements in production rates and consistency of throughput in the first three quarters of 2011, as compared to the same periods of 2010. These improvements were the result of many operational improvement initiatives, including fermentation formulation, and recipe changes, temperature controls, processing rates, implementation of process standard operating procedures and balancing of run rates.
Comparison of year-to-year Third Quarter and First Nine Months' Production
|
Third Quarter
|
Variance
|
First Nine Months
|
Variance
|
|||
|
Production Quantities
|
2011
|
2010
|
Increase
(decrease)
|
2011
|
2010
|
Increase
(decrease)
|
|
Ethanol (000’s gallons)
|
12,336
|
12,137
|
(83)
|
37,123
|
35,174
|
1,949
|
|
Wet Distiller's Grain (000's tons)
|
80
|
72
|
8
|
271
|
219
|
52
|
|
Distiller’s Grain (000’s tons)
|
6
|
10
|
(4)
|
6
|
19
|
(13)
|
|
Corn (000’s bushels ground)
|
4,383
|
4,364
|
19
|
13,155
|
12,638
|
522
|
|
Yield (Undenatured gal/BU)
|
2.81
|
2.78
|
(0.03)
|
2.82
|
2.78
|
0
|
Summary of Monthly 2011 year-to-date operations:
|
Ethanol Gallons
Produced (000’s)
|
Corn Bushels
Ground (000’s)
|
Denatured Yield
(Gallons / Bushel)
|
Tons of WDG
Sold (000’s)
|
Tons of Dry DGs
Sold (000’s)
|
||||||||||
|
2011
|
2010
|
2011
|
2010
|
2011
|
2010
|
2011
|
2010
|
2011
|
2010
|
|||||
|
January
|
4,320
|
3,446
|
1,545
|
1,240
|
2.80
|
2.78
|
34
|
25
|
0
|
0.4
|
||||
|
February
|
3,939
|
3,563
|
1,367
|
1,278
|
2.88
|
2.79
|
31
|
26
|
0
|
0.1
|
||||
|
March
|
4,300
|
4,125
|
1,519
|
1,490
|
2.83
|
2.77
|
32
|
26
|
0
|
2.1
|
||||
|
April
|
3,950
|
3,475
|
1,395
|
1,240
|
2.83
|
2.80
|
30
|
26
|
0
|
2.5
|
||||
|
May
|
4,338
|
4,254
|
1,544
|
1,542
|
2.81
|
2.76
|
34
|
25
|
0
|
1.6
|
||||
|
June
|
3,940
|
4,174
|
1,403
|
1,484
|
2.81
|
2.81
|
30
|
19
|
0.5
|
2.5
|
||||
|
July
|
4,156
|
3,900
|
1,484
|
1,412
|
2.74
|
2.76
|
24
|
22
|
2.0
|
3.8
|
||||
|
August
|
4,438
|
4,167
|
1,587
|
1,490
|
2.73
|
2.80
|
30
|
21
|
3.5
|
4.6
|
||||
|
September
|
3,742
|
4,070
|
1,311
|
1,462
|
2.78
|
2.78
|
26
|
29
|
0
|
1.7
|
||||
|
Total
|
37,123
|
35,174
|
13,155
|
12,638
|
2.82
|
2.78
|
271
|
219
|
6.0
|
19.3
|
||||
Year over year comparisons were generally better throughout the first nine months of 2011 over 2010. Improved corn quality in 2011 over 2010 resulted in the improved yields, but a small decrease in yield in the third quarter may have been caused by the delivery of corn from the bottom of the bins as both the national and local supply of corn dropped to extraordinarily low levels because of the poor harvest in 2010.
Process improvements continued throughout the first nine months of 2011, resulting in the greater production volumes. There are two exceptions in the monthly production numbers. High sulfate levels in June 2011 decreased production. Low production volumes in September were caused first by the bi-annual shutdown resulting in a 300,000 gallon reduction. This shut-down is ordinarily scheduled for October, but was moved a month earlier to minimize the effect of the short corn supply of the 2010 harvest. As harvest approached and corn stocks throughout the county dropped to very low levels, the flow of corn into our facility did drop below full supply levels. In
18
response to this reduced flow of corn, we were forced to take another two days of shutdown, which reduced production for the week by 400,000 gallons. If those production losses were avoided, September volumes would have been second largest of the year based on the current high levels of daily production and conversion yields.
Nevertheless, steady throughput and improved distribution of WDG also increased during the first nine months of 2011 over the same period of 2010. In the first nine months of 2010 and 2011, 19,300 and 6,000 tons, respectively, of distiller's grains sold were dried. If those distiller's grains had remained fully hydrated, total sales of distiller's grains in the first nine months of 2011 would have been 12,000 tons greater than in the first nine months of 2010.
Revenues, Cost of Goods Sold, General & Administrative Costs
Comparison of our third quarter 2011 and 2010 Statement of Operations Items:
|
Third Quarter 2011
|
Third Quarter 2011 Percentage
|
Third Quarter 2010
|
Third Quarter 2010 Percentage
|
||||||
|
Revenues
|
$
|
42,042,633
|
100%
|
$
|
24,446,171
|
100%
|
|||
|
Cost of Goods Sold
|
42,553,535
|
101%
|
25,012,122
|
102%
|
|||||
|
Gross Profit
|
(510,902)
|
-1%
|
(565,951)
|
-2%
|
|||||
|
General & Admin. Expenses
|
677,487
|
2%
|
733,315
|
3%
|
|||||
|
Operating Income (Loss)
|
(1,188,389)
|
-3%
|
(1,299,266)
|
-5%
|
|||||
|
Other Income (Expense) net
|
(344,939)
|
-1%
|
(825,391)
|
-3%
|
|||||
|
Net Income (Loss)
|
$
|
(1,533,328)
|
-4%
|
$
|
(2,124,657)
|
-9%
|
|||
Comparison of our first three quarters of 2011 and 2010 Statement of Operations Items:
|
First Three Quarters 2011
|
First Three Quarters 2011 Percentage
|
First Three Quarters 2010
|
First Three Quarters 2010 Percentage
|
||||||
|
Revenues
|
$
|
114,105,631
|
100%
|
$
|
66,821,910
|
100%
|
|||
|
Cost of Goods Sold
|
113,725,990
|
100%
|
69,113,201
|
103%
|
|||||
|
Gross Profit
|
379,641
|
0%
|
(2,291,291)
|
-3%
|
|||||
|
General & Admin. Expenses
|
1,892,415
|
2%
|
1,800,256
|
3%
|
|||||
|
Operating Income (Loss)
|
(1,512,774)
|
-1%
|
(4,091,547)
|
-6%
|
|||||
|
Other Income (Expense) net
|
(2,053,234)
|
-2%
|
475,352
|
1%
|
|||||
|
Net Income (Loss)
|
$
|
(3,566,008)
|
-2%
|
$
|
(3,616,195)
|
-5%
|
Revenues
Our revenues from operations come from two primary sources: sales of ethanol and distiller's grains. In the third quarter of 2011, our revenue from the sale of ethanol was approximately 86% of our total revenues, with the sale of distiller's grains constituting 14%. While we sold an additional million gallons of ethanol in the third quarter of
19
2011 compared to the same quarter of 2010 (13.2 and 12.2 million gallons, respectively), third quarter 2011 revenues per gallon of ethanol were $2.74, as compared to $1.69 in the same period of 2010.
Pricing strategies for WDG in the third quarter of 2010 and 2011 were very different. In 2010, we were in a depressed market with both a supply glut (a large nearby producer was unable to dry the product out of its new facility) and weak demand (a large local feedlot was temporarily shut down). In the third quarter, the average revenue for WDG was $57.24 and $22.55 per ton in 2011 and 2010, respectively. This generated approximately $2,977,000 more revenue in 2011 over 2010 - a 183% increase.
There are two price/cost relationships that must improve for us to be profitable. Those two relationships are (i) the Crush Margin and (ii) the price of distiller's grain compared to our costs other than the cost of corn. These two relationships are inherently the largest numbers in our statement of operations which in descending order are (i) ethanol sales, (ii) corn purchases, and (iii) distiller's grains revenue. Because these relationships are primarily driven by market prices throughout, we believe the only way we can improve them is to increase our working capital to better hedge and forward contract, as discussed elsewhere in this report.
Other Income (Expense)
On March 19, 2010, we entered into a Settlement Agreement and Mutual Release (the "Settlement Agreement") with our plant constructor, Delta-T Corporation ("Delta-T"), its parent, Bateman Litwin NV ("Bateman") and Bateman Engineering, Inc. ("Bateman Engineering") under which, among other things, Delta-T and Bateman authorized us to draw $3,000,000 from a letter of credit. The receipt of the $3,000,000 was recognized as a gain in other income in the first quarter of 2010.
Cost of Goods Sold
Comparison of our third quarter 2011 and 2010 Cost of Goods Sold Items:
|
Third Quarter
2011
|
Third Quarter
2011
Percentage
|
Third Quarter
2010
|
Third Quarter
2010
Percentage
|
||||||
|
Revenues
|
$
|
42,042,633
|
100%
|
$
|
24,446,171
|
100%
|
|||
|
Cost of Goods Items:
|
|||||||||
|
Corn
|
35,101,401
|
83%
|
16,580,232
|
68%
|
|||||
|
Denaturant and Chemicals
|
1,799,018
|
4%
|
1,346,362
|
6%
|
|||||
|
Ethanol Freight Costs
|
497,067
|
1%
|
1,788,966
|
7%
|
|||||
|
Natural Gas and Electricity
|
2,221,018
|
5%
|
2,357,314
|
10%
|
|||||
|
Production Labor
|
691,016
|
2%
|
940,003
|
4%
|
|||||
|
Supplies and Maintenance
|
465,981
|
1%
|
176,635
|
1%
|
|||||
|
Property Tax
|
240,000
|
1%
|
285,000
|
1%
|
|||||
|
Depreciation
|
1,538,034
|
4%
|
1,537,610
|
6%
|
|||||
|
Total Cost of Goods Sold
|
$
|
42,553,535
|
101%
|
$
|
25,012,122
|
102%
|
20
Comparison of our first three quarters of 2011 and 2010 Statement of Operations Items:
|
First Three
Quarters 2011
|
First Three
Quarters 2011
Percentage
|
First Three
Quarters 2010
|
First Three
Quarters 2010 Percentage
|
||||||
|
Revenues
|
$
|
114,105,631
|
100%
|
$
|
66,821,910
|
100%
|
|
Cost of Goods Items:
|
|||||||||
|
Corn
|
92,030,637
|
81%
|
44,835,683
|
67%
|
|||||
|
Denaturant and Chemicals
|
6,200,960
|
5%
|
4,085,062
|
6%
|
|||||
|
Ethanol Freight Costs
|
1,499,963
|
1%
|
4,861,343
|
7%
|
|||||
|
Natural Gas and Electricity
|
5,920,548
|
5%
|
6,530,795
|
10%
|
|||||
|
Production Labor
|
2,038,107
|
2%
|
2,620,163
|
4%
|
|||||
|
Supplies and Maintenance
|
1,216,024
|
1%
|
791,725
|
1%
|
|||||
|
Property Tax
|
255,526
|
0%
|
829,770
|
1%
|
|||||
|
Depreciation
|
4,564,225
|
4%
|
4,558,660
|
7%
|
|||||
|
Total Cost of Goods Sold
|
$
|
113,725,990
|
100%
|
$
|
69,113,201
|
103%
|
Our cost of goods sold ("COGS") as a percentage of revenues in the third quarter of 2011 improved - at 101% - from 102% in the third quarter of 2010. This improvement was largely caused by increased ethanol revenues. However, several elements of COGS declined in the third quarter of 2011. The largest change was in the cost and offsetting revenues for ethanol transport by rail. In 2010, the marketer required us to pay the rail freight costs directly to the railroads and then reimbursed us for those costs. Beginning in the fourth quarter of 2010, we changed marketers and the new marketer maintains all the rail freight accounts with the railroads, resulting in a reduction of both the revenues and the ethanol freight components of COGS in our income statement - from 7% of revenues in 2010 to 1% in 2011.
Corn is the largest component of our cost structure. Our cost of corn per gallon of ethanol produced averaged $2.48 in the first three quarters of 2011 and $2.85 in the third quarter of 2011, compared to $1.27 in the first three quarters of 2010 and $1.29 in the third quarter of 2010. For the first time since startup of the plant, during most of the third quarter of 2011, the CBOT cost of corn per bushel to produce each gallon of ethanol (divided by 2.8) was greater than the price of ethanol, sometimes with a negative Crush Margin of $0.15 per gallon, which increased our COGS. However, the improvement in WDG pricing did offset the impact on our COGS. The poor Crush Margins continued throughout the third quarter of 2011, but have since risen above $0.25 per gallon and as high as $0.34.
Yield - the number of gallons of ethanol we produce for each bushel of corn ground - will impact our COGS. Despite significant increases in the prices of both corn and ethanol in the third quarter of 2011 over the third quarter of 2010, our improved yield (caused in part by better corn quality) helped to temper COGS as compared to Revenue, as shown above in the chart "Comparison of year-to-year Third Quarter and First Nine Months Production". As corn is more expensive, improved yield is more important. The price for both corn and ethanol doubled in 2011, while all other costs did not. As shown above in the chart "Summary of Monthly 2011 year-to-date operations," our yield improved in the first nine months of 2011 over the same period of 2010 from 2.78 gallons per bushel to 2.82. Thus, we produced 526,000 more gallons of ethanol in the nine months of 2011 from the 13,155,000 bushels of corn ground than would have been produced at the 2010 yield level. This contributed $1,391,040 of revenue in the first nine months of 2011 with no additional purchase of corn. Without this yield improvement, the cost of corn as a percentage of total revenues would have been 82% - 1% higher than actual. Therefore, in the table immediately above, corn cost as a percentage of revenues increased in the first nine months of 2011 14% over the first nine months of 2010, but without the improved corn quality and improved yields, our corn cost as a percentage of our revenues would have increased 15% in the same period.
Other COGS improvements in both the third quarter and the first nine months of 2011 versus the same periods of 2010, such as utilities, resulted from increased production volume and revenues in 2011 over 2010. Steady state production and improvements in both effective and efficient production methods also have improved general production performance.
21
General and Administrative Expenses
Comparison of our third quarter 2011 and 2010 General and Administrative Expense Items:
|
Third
Quarter 2011
|
Third Quarter
2011
Percentage
|
Third
Quarter 2010
|
Third Quarter
2010
Percentage
|
||||||
|
Revenues
|
$
|
42,042,633
|
100%
|
$
|
24,446,171
|
100%
|
|||
|
General and Administrative Expenses:
|
|||||||||
|
Administrative Human Resources Costs
|
254,613
|
1%
|
270,594
|
1%
|
|||||
|
Professional Fees
|
279,037
|
1%
|
256,743
|
1%
|
|||||
|
Insurance
|
82,058
|
0%
|
99,304
|
0%
|
|||||
|
Other
|
61,779
|
0%
|
106,674
|
0%
|
|||||
|
Total General and Administrative Expenses
|
$
|
677,487
|
2%
|
$
|
733,315
|
3%
|
|||
Comparison of our first three quarters of 2011 and 2010 General and Administrative Expense Items:
|
First Three
Quarters
2011
|
First Three
Quarters 2011
Percentage
|
First Three
Quarters
2010
|
First Three
Quarters 2010 Percentage
|
||||||
|
Revenues
|
$
|
114,105,631
|
100%
|
$
|
66,821,910
|
100%
|
|||
|
General and Administrative Expenses:
|
|||||||||
|
Administrative Human Resources Costs
|
802,810
|
1%
|
751,811
|
1%
|
|||||
|
Professional Fees
|
690,256
|
1%
|
587,027
|
1%
|
|||||
|
Insurance
|
248,030
|
0%
|
276,612
|
0%
|
|||||
|
Other
|
151,319
|
0%
|
184,806
|
0%
|
|||||
|
Total General and Administrative Expenses
|
$
|
1,892,415
|
2%
|
$
|
1,800,256
|
3%
|
General and administrative expenses as a percentage of revenues were mostly unchanged in both the first nine months and third quarter of 2011 from the same periods of 2010. However, there were some that were proportionate to the increases in revenue.
Professional fees remained at approximately 1% of revenues and increased in the first nine months of 2011 over 2010 caused by the negotiations with our lenders and our recapitalization efforts described below. Actual insurance costs declined in the first nine months of 2011 from 2010 levels modestly, with a 10% reduction in premiums on renewal.
Environmental Compliance
We are subject to regulations on emissions from the U.S. Environmental Protection Agency ("EPA") and the NDEQ. The EPA's and NDEQ's environmental regulations are subject to change and often such changes are not favorable to industry. Consequently, even if we have the proper permits now, we may be required to invest or spend considerable resources to comply with future environmental regulations. Environmental laws and regulations require us to investigate and remediate the effects of the release or disposal of materials. As previously reported, we received Notices of Violation ("NOV") from the NDEQ in January 2010 arising from failures of emission equipment designed and installed by our construction contractor, which we believe have been resolved.
Liquidity and Capital Resources
As of September 30, 2011, we had negative working capital of $7,681,861, prior to the presentation of $34,376,892 of our debt as current liabilities. We may resume operating at negative margins, depending on commodity prices. If we are unable to generate sufficient cash flows from operations or obtain additional debt or equity financing, our ability to continue operations may be materially hindered, including our ability to enter into derivative positions, and
22
we may be forced to continue purchasing our corn and marketing our ethanol at spot prices, which would continue to expose us to market volatility and associated risks. The unaudited financial statements included in this report have been prepared assuming that we will continue as a going concern. Until we are able to obtain additional working capital from operations or outside sources and modify our credit agreement covenants or refinance our construction loan, there is substantial doubt as to whether we can continue to operate as a going concern.
As we have reported in the past, we continue to work with our lenders and others to identify the means by which we can improve our capital position. We believe improved capitalization would better enable us to hedge and better manage our market risk in the commodity markets, among other things. Improving our capitalization will likely involve restructuring our debt so that both our debt level and the associated covenants are more compatible with current market conditions, and may also involve our issuing equity in one or more private placements on terms which we cannot predict at this time.
Credit Facility
We entered into the following agreements with AgCountry Farm Credit Services, FLCA ("Lender") regarding our senior secured credit facility ("Facility") for the provision of construction and permanent debt financing for our ethanol plant: a Master Credit Agreement dated February 14, 2007 (the "Master Agreement"), and several supplements including the Seventh Supplement and Forbearance agreement to the Master Credit Agreement effective February 1, 2011 (the "Seventh Supplement" and together with the Master Agreement, the "Loan Agreements"). As of September 30, 2011, we had $34,000,008 outstanding under the Facility.
We did not comply with the terms of the Seventh Supplement, and as a result, all of our debt under the Loan Documents, including interest, was accelerated, due and payable. Our default under the Seventh Supplement triggered a variety of possible remedies in favor of the Lender, such as foreclosing on our assets. However, we remain in discussions with Lender as described below and it has not exercised any such remedies.
Under the Loan Agreements, we made certain customary representations and are subject to customary affirmative and negative covenants, including restrictions on our ability to incur debt, create liens, dispose of assets, pay distributions and to make capital expenditures, and customary events of default (including payment defaults, covenant defaults, cross defaults, construction-related defaults and bankruptcy defaults).
Affirmative financial covenants under the Loan Agreements require us to maintain minimum working capital of $6,000,000, minimum current ratio of 1.20:1.00, minimum tangible net worth of $41,000,000, minimum owners' equity ratio of 50%, and a minimum fixed charge coverage ratio of 1.25:1.00. As of September 30, 2011, we did not meet the following covenants: our working capital was negative $7,681,861 (not including current liabilities for term debt previously classified as long term), our current ratio was .54 to 1.00 (not including current liabilities for term debt previously classified as long term), our tangible net worth was $35,542,662, and our fixed charge coverage ratio was .78:1.00. This resulted in all debt under the Loan Agreement to continue to be classified as current liabilities.
In addition, we have also agreed to the following with the Lender under the Loan Agreements, among other things:
|
|
·We must obtain Lender's consent to make any capital expenditures in excess of $500,000.
|
|
|
·We must make annual payments to Lender of 40% of our Net Available Cash (as defined in the Loan Agreements).
|
|
|
·We must make monthly payments of principal and interest.
|
We are actively negotiating with the Lender to convert the construction financing to operating lines and to modify the loan covenants to reflect current industry economics. These negotiations have taken a considerable amount of time due to the number of lenders involved, our overall liquidity and the interests of a diverse group of stakeholders. We cannot predict whether the Lender will agree to modify any of those covenants, but we do expect a resolution soon. To the extent we are unable to modify those covenants, it may not be possible to meet them unless the commodities markets we operate in move in favorable directions. Until we are able to comply with the covenants under the Loan Agreements, the Lender may take a variety of actions, including immediately accelerating the
23
repayment of all outstanding debt under the Loan Agreements. Such acceleration could entitle the Lender to liquidate all of our assets, and would likely lead to our bankruptcy, reorganization or winding up of our affairs.
TIF Note
In June 2007, the City of Atkinson, Nebraska ("City") issued a tax increment financing Note (the "TIF Note"), the net proceeds of which in the amount of $4,939,925 were paid to us to reimburse us for certain infrastructure improvements relating to our plant. Repayment of the TIF Note is guaranteed by us, but was originally expected to be retired from incremental property tax revenue we pay the City, which are based on the added value of our land and buildings. The TIF Note serves as collateral for a loan with an outstanding principal balance of $6,586,300 (the "Loan") as of September 30, 2011. We received the net proceeds of the Loan under a Loan Agreement with the lead lending agent, Arbor Bank ("TIF Lender"), under which we loaned the proceeds to the City in exchange for the TIF Note. This liability has been classified as a current liability, and will remain so until the resolution of the TIF Lawsuit described below.
On August 12, 2010, the TIF Lender filed a lawsuit (the "TIF Lawsuit") against us in the District Court of Douglas County, Nebraska alleging that we failed to make certain payments due under the TIF Note and failed to maintain the required debt service reserve fund. In addition, the lawsuit states that the TIF Lender has accelerated the maturity of the TIF Note. The TIF Lawsuit provides that as of August 9, 2010, the amount due and owing under the TIF Note was $7,039,126, and the TIF Lender seeks payment of that amount, plus such additional amounts as become due and owing under the TIF Note, with interest accruing after August 9, 2010 at the rate of 9.5% until the judgment is paid. We entered into a Forbearance and Standstill Agreement with TIF Lender, most recently extended on October 31, 2011 (the "TIF Forbearance"), under which TIF Lender agreed to forebear from enforcing its rights under the TIF Loan until the earliest of (i) November 30, 2011, (ii) Lender acting to enforce its rights under the Loan Agreements, or (iii) a default under the TIF Forbearance. In connection with the TIF Forbearance, TIF Lender agreed to stay the TIF Lawsuit, and we agreed to pay TIF Lender $25,000 through September 2011.
Plan of Operations for the Next 12 Months
In addition to the financial objectives discussed above, we expect to spend at least the next 12 months focused on plant operations, including three primary functions: (i) management of cost effective purchasing of inputs for our production process, (ii) optimizing the production process in such a way as to minimize manufacturing costs, and (iii) monitoring and evaluating the performance of our marketing agents to ensure effective marketing of our ethanol and distiller's grains. In addition, we are in discussions to implement a tolling agreement and other alternate marketing arrangements to improve our ability to manage commodity price risk as described below.
Market Risk
We are exposed to the impact of market fluctuations associated with commodity prices. We may use derivative financial instruments as part of an overall strategy to manage market risk, assuming we have sufficient working capital and liquidity to manage such a strategy, or we may transfer risk management to Tenaska under a long term arrangement. If we do not transfer risk management to Tenaska, then subject to available working capital, we may, when able, use cash, futures and option contracts to hedge changes to the commodity prices of corn, natural gas and gasoline. We will not enter into these derivative financial instruments for trading or speculative purposes, nor will we designate these contracts as cash flow or fair value hedges for accounting. However, our ability to undertake any hedging activities has been limited due to our limited working capital. We cannot presently predict if or when we may modify our risk management profile through an arrangement with Tenaska or any other party.
Commodity Price Risk
We are exposed to market risk with respect to the price of ethanol, our principal product, and the price and availability of corn, the principal commodity we use to produce ethanol. Our other primary product is distiller's grains, and we are also subject to market risk with respect to its price. In general, rising ethanol and distiller's grains prices should result in higher profit margins, and therefore represent favorable market conditions. Ethanol and
24
distiller's grains prices are, however, influenced by various factors beyond the control of our management, including the supply and demand for gasoline, the availability of substitutes and the effects of laws and regulations.
Ethanol revenues are based on its market price, which is largely driven by the supply and demand in the national marketplace. Our risk management team meets weekly and assesses the balance of forward purchases of corn with forward sales of ethanol and the risks associated with the trends in the marketplace. Throughout the majority of the last year and a half, the price of ethanol has closely followed the market price of corn. The price of unleaded gasoline is also a primary concern in that if the price of ethanol rises above the reformulated gasoline blendstock for oxygen blending ("RBOB") price, then the economies do not allow favorable margins for the discretionary blenders and demand for ethanol falls.
Distiller's grains are primarily sold into the local cattle feed market. Historically, the summer months bring the lowest seasonal demand for this product. Consistent production volumes and quality are required to maximize the pricing potential of our favorable geography near a large number of cattle feeders. We continue to work to establish a reputation and relationships with those cattle feeders that will help mitigate the seasonal variability in future years, though ultimately demand for distiller's grains is not in our control.
Ethanol, corn and energy markets have demonstrated a complex relationship in the past 24 months. Generally speaking, we believe that the price of energy provides a ceiling value for ethanol, particularly in the price of crude oil as driven into the price of unleaded gasoline, otherwise known in the markets as RBOB. However, except when affected by that upward limit, we believe that the price of ethanol follows the price of corn with a high degree of correlation, with the Crush Margin dictated by the market relationships of supply and demand. As discussed above, that Crush Margin has been squeezed in recent months by the oversupply of ethanol capacity, but can be significantly affected by any of several factors, including the relationship of distribution infrastructure and its limits to handle the volume of ethanol that could be produced by the existing capacity while limited by the EPA to 10% blends for regular unleaded gasoline. The price of oil also affects the Crush Margin. In mid 2008, when oil was above $140 a barrel, the cost of RBOB allowed profitable blending of ethanol with a favorable Crush Margin, even when corn costs were above $6 and $7 a bushel.
The availability and price of corn is subject to wide fluctuations due to various unpredictable factors which are beyond our control, including weather conditions, farmer planting decisions, governmental policies with respect to agriculture and local, regional, national and international trade, demand and supply. In the third quarter of 2011, our corn cost as a percentage of ethanol sales was 97%, and was 83% of gross sales.
We expect the annual impact on our results of operations due to a $0.30 per bushel fluctuation in market prices for corn to be approximately $4,890,000, or $0.11 per gallon, assuming our plant operates at 100% name plate capacity (production of 44,000,000 gallons of ethanol annually). We also expect a $0.20 per gallon fluctuation in ethanol market prices to impact annual net income by approximately $8,800,000, a $0.20 per gallon fluctuation in denaturant market prices to impact annual net income by approximately $180,000, and a $0.50 per BTU fluctuation in natural gas market prices to impact annual net income by approximately $630,000.
We seek to minimize the risks from fluctuations in the prices of corn and ethanol through the use of derivative instruments, provided we have sufficient working capital to enter into such instruments and cover any margin requirements necessary to maintain such positions. In practice, as markets move, we will seek to actively manage our risk and adjust hedging strategies as appropriate, provided we have sufficient working capital for such strategies. Although we believe any hedge positions will accomplish an economic hedge against our future purchases, they will not be designated as such for hedge accounting purposes, which would match the gain or loss on our hedge positions to the specific commodity purchase being hedged. We mark to market our hedge positions, which means as the current market price of our hedge positions changes, the gains and losses are immediately recognized in our cost of goods sold. The immediate recognition of hedging gains and losses can cause net income to be volatile from quarter to quarter due to the timing of the change in the value of the derivative instruments relative to the cost and use of the commodity being hedged. There was a loss of $0 and $632,055 on derivative instruments for the three months ended September 30, 2011 and 2010, respectively.
25
In the event we do not have sufficient working capital to enter into hedging strategies to manage our risks, we may be forced to continue purchasing our corn and market our ethanol at spot prices and as a result, we could continue to be exposed to market volatility and risk. However, as discussed above, we are negotiating with Tenaska to transfer much of our risk management to Tenaska.
Application of Critical Accounting Estimates
Management uses estimates and assumptions in preparing these financial statements in accordance with Generally Accepted Accounting Principles ("GAAP"). Those estimates and assumptions affect the reported amounts of assets and liabilities, the disclosure of contingent assets and liabilities, and the reported revenues and expenses. We use estimates and assumptions in accounting for the following significant matters, among others: the allowance for doubtful accounts, useful lives of property and equipment, the valuation of inventory, and inventory purchase commitments, and long-lived asset impairments including the assumptions used to estimate future cash flows, the ability to raise capital, and the ability to comply with certain provisions within the Loan Agreements. Actual results may differ from previously estimated amounts, and such differences may be material to our financial statements. We periodically review estimates and assumptions, and the effects of revisions are reflected in the period in which the revision is made. The following paragraph discusses the most significant estimating process in our financial statements.
Long-lived assets, such as property and equipment, are reviewed for impairment whenever events or changes in circumstances indicate that the carrying amount of an asset may not be recoverable. In accordance with the our policy for evaluating impairment of long-lived assets, we have estimated that the projected future undiscounted cash flows from operations of these facilities exceed their carrying value at September 30, 2011; therefore no impairment loss was recognized. In determining the projected future undiscounted cash flows, we made significant assumptions concerning the future viability of the ethanol industry, the future price of corn in relation to the future price of ethanol and the overall demand for ethanol in relation to production and supply capacity. Changes in the estimated future prices of corn and ethanol used within the analysis can have a significant effect on the determination of impairment given the sensitivity of the analysis. In addition to the impairment analysis performed, we believe that the following factors also indicate that no impairment of long-lived assets has occurred. First, our short time in operation under distress from construction delays, equipment failures and startup complications provides inadequate cost history to assess with reasonable levels of certainty what the cost structure will be going forward. Second, the economic structure of the distiller's grain markets has been excessively volatile throughout initial plant operations. The cash flow to be generated from sales of distiller's grains is a critical requirement for us to generate future profitability. Third, the economic recession in the U.S. during the entire startup and operation of the plant further complicated the measurement of our ability to generate future cash flows that are required to document material impairment to the carrying value of our plant assets. In the impairment analysis, we assumed (i) future distiller's grain revenue will be 17% of gross revenue, (ii) future corn costs will be 87% of ethanol revenue, and (iii) these relationships drive EBIDTA estimates for 2011 of 8% of gross revenues. If we fail to realize these economic improvements, it is likely in the future, that asset values will need to be adjusted to reflect impaired value because we would be unable to forecast future cash flows sufficient to carry those values.
Off-Balance Sheet Arrangements
We do not have any off-balance sheet arrangements that have or are reasonable likely to have a current or future material effect on our financial condition, results of operations or liquidity.
Item 4. Controls and Procedures.
Our management, including our President (our principal executive officer), Jerome Fagerland, along with our Treasurer (our principal financial officer), Timothy Borer, have reviewed and evaluated the effectiveness of our disclosure controls and procedures (as defined in Rule 15d-15 under the Securities Exchange Act of 1934), as of September 30, 2011. Based upon this review and evaluation, these officers believe that our disclosure controls and procedures are presently effective.
26
Changes in Internal Control Over Financial Reporting
Management has evaluated, with the participation of our President, any change in our internal control over financial reporting (as defined in Rules 13a-15(f) and 15d-15(f) under the Securities Exchange Act of 1934) that occurred during the period covered by this Quarterly Report on Form 10-Q. There was no change in our internal control over financial reporting identified in that evaluation that occurred during the fiscal period covered by this Quarterly Report on Form 10-Q that has materially affected, or is reasonably likely to materially affect, our internal controls over financial reporting.
PART II
Item 1. Legal Proceedings.
On August 12, 2010, the TIF Lender filed a lawsuit against us in the District Court of Douglas County, Nebraska alleging that we failed to make certain payments due under the TIF Note and failed to maintain the required debt service reserve fund. In addition, the lawsuit stated that the TIF Lender accelerated the maturity of the TIF Note. The TIF Lender sought in the lawsuit repayment of $7,039,126 due as of August 9, 2010, plus such additional amounts as become due and owing under the TIF Note, with interest accruing after August 9, 2010 at the rate of 9.5% until the judgment is paid. We entered into the TIF Forbearance, under which TIF Lender agreed to forebear from enforcing its rights under the TIF Loan until the earliest of (i) November 30, 2011, (ii) Lender acting to enforce its rights under the Loan Agreements, or (iii) a default under the TIF Forbearance. In connection with the TIF Forbearance, TIF Lender agreed to stay the TIF Lawsuit, and we agreed to pay TIF Lender $25,000 a month during the term of the TIF Forbearance.
Item 1A. Risk Factors.
Not Applicable.
Item 2. Unregistered Sales of Equity Securities and Use of Proceeds.
None.
Item 3. Defaults Upon Senior Securities.
We did not comply with the terms of the Seventh Supplement, and as a result, all of our debt under the Loan Documents, including interest, was accelerated, due and payable. Our default under the Seventh Supplement would allow a variety of remedies in favor of the Lender, such as foreclosing on our assets. However, we remain in discussions with Lender as described above and it has not exercised any such remedies.
Item 4. (Removed and Reserved)
Item 5. Other Information.
The Company has commenced a private offering, projected to close by the end of 2011, of up to 1,500 Class B Preferred Units ("Class B Units") at $10,000 per unit. If issued, the Class B Units would entitle their holders, among other things, to (i) a cumulative distribution in preference to holders of the Company's common units, subject to several conditions, including the Company's debt-related restrictions, (ii) a preference in liquidation, and (iii) a right to convert the Class B Units into common units at a specified rate. No Class B Units will be issued unless numerous conditions, some outside of the Company's control, have been fulfilled. The offer and sale of the Class B Units have not been registered under the Securities Act of 1933 and the Class B Units may not be offered or sold in the United States absent registration or an applicable exemption from registration requirements.
Item 6. Exhibits.
| 4(ii).1 | First Amendment to Forbearance and Standstill Agreement between NEDAK Ethanol, LLC and Arbor Bank effective as of September 30, 2011. |
|
4(ii).2
|
Second Amendment to Forbearance and Standstill Agreement between NEDAK Ethanol, LLC and Arbor Bank effective as of October 31, 2011.
|
|
31.1
|
Rule 13a-14(a)/15d-14(a) Certification (pursuant to Section 302 of the Sarbanes-Oxley Act of 2002) executed by Chief Executive Officer.
|
|
31.2
|
Rule 15d-14(a) Certification (pursuant to Section 302 of the Sarbanes-Oxley Act of 2002) executed by Chief Financial Officer.
|
|
32.1
|
Rule 15d-14(b) Certifications (pursuant to Section 906 of the Sarbanes-Oxley Act of 2002) executed by the Chief Executive Officer.
|
27
|
32.2
|
Rule 15d-14(b) Certifications (pursuant to Section 906 of the Sarbanes-Oxley Act of 2002) executed by the Chief Financial Officer.
|
|
101.XML
|
XBRL Instance Document
|
|
101.XSD
|
XBRL Taxonomy Schema
|
|
101.CAL
|
XBRL Taxonomy Calculation Database
|
|
101.LAB
|
XBRL Taxonomy Label Linkbase
|
|
101.PRE
|
XBRL Taxonomy Presentation Linkbase
|
28
SIGNATURES
In accordance with the requirements of the Exchange Act, the Registrant has caused this report to be signed on its behalf by the undersigned, thereunto duly authorized.
|
NEDAK ETHANOL, LLC
|
||
|
Date: November 14, 2011
|
/s/ Jerome Fagerland
|
|
|
Jerome Fagerland, President
|
||
|
Date: November 14, 2011
|
/s/ Timothy Borer
|
|
|
Timothy Borer, Treasurer and Secretary
|
29