Attached files
| file | filename |
|---|---|
| EX-31.2 - CERTIFICATION PURSUANT TO 17 CFR 240.13(A)-14(A) - NEDAK ETHANOL, LLC | form10qex312_081210.htm |
| EX-32.1 - CERTIFICATION PURSUANT TO 18 U.S.C. SECTION 1350 - NEDAK ETHANOL, LLC | form10qex321_081210.htm |
| EX-31.1 - CERTIFICATION PURSUANT TO 17 CFR 240.13(A)-14(A) - NEDAK ETHANOL, LLC | form10qex311_081210.htm |
| EX-32.2 - CERTIFICATION PURSUANT TO 18 U.S.C. SECTION 1350 - NEDAK ETHANOL, LLC | form10qex322_081210.htm |
| EX-10.1 - SIXTH SUPPLEMENT AND FORBEARANCE AGREEMENT - NEDAK ETHANOL, LLC | form10qexh101_081210.htm |
|
UNITED STATES
SECURITIES AND EXCHANGE COMMISSION
Washington, D.C. 20549
|
|||
|
Form 10-Q
|
|||
|
(Mark one)
|
|||
|
R
|
QUARTERLY REPORT UNDER SECTION 13 OR 15(d) OF THE SECURITIES EXCHANGE ACT OF 1934
|
||
|
For the quarterly period ended June 30, 2010
|
|||
|
£
|
TRANSITION REPORT UNDER SECTION 13 OR 15(d) OF THE SECURITIES EXCHANGE ACT OF 1934
|
||
|
For the transition period from _________ to __________
|
|||
|
Commission file number 000-52597
|
|||
|
NEDAK ETHANOL, LLC
|
|||
|
(Exact name of registrant as specified in its charter)
|
|||
|
Nebraska
|
20-0568230
|
||
|
(State or other jurisdiction of incorporation or organization)
|
(I.R.S. Employer Identification No.)
|
||
|
87590 Hillcrest Road, P.O. Box 391, Atkinson, Nebraska 68713
|
|||
|
(Address of principal executive offices)
|
|||
|
(402) 925-5570
|
|||
|
(Registrant’s telephone number, including area code)
|
|||
|
__________________________________________________________________
|
|||
|
(Former name, former address and former fiscal year, of changed since last report)
|
|||
|
Indicate by check mark whether the registrant has (1) filed all reports required to be filed by Section 13 or 15(d) of the Securities Exchange Act of 1934 during the preceding 12 months (or for such shorter period that the registrant was required to file such reports), and (2) has been subject to such filing requirements for the past 90 days. Yes R No £
|
|||
|
Indicate by check mark whether the registrant has submitted electronically and posted on its corporate Web site, if any, every Interactive Data File required to be submitted and posted pursuant to Rule 405 of Regulation S-T during the proceeding 12 months (or for such shorter period that the registrant was required to submit and post such files). Yes £ No R
|
|||
|
Indicate by check mark whether the registrant is a large accelerated filer, an accelerated filer, a non-accelerated filer, or a smaller reporting company. See the definitions of “large accelerated filer,” “accelerated filer” and “smaller reporting company” in Rule 12b-2 of the Exchange Act.
|
|||
|
Large accelerated filer £ Accelerated filer £ Non-accelerated filer £ Smaller reporting company R
|
|||
|
Indicate by check mark whether the registrant is a shell company (as defined in Rule 12b-2 of the Exchange Act). Yes £ No R
|
|||
|
As of August 1, 2010, the issuer had 5,233 Common and 185.5 Class A Preferred Membership Units issued and outstanding.
|
|||
TABLE OF CONTENTS
|
PART I—FINANCIAL INFORMATION
|
|||
|
Item Number
|
Item Matter
|
Page Number
|
|
|
Item 1.
|
Condensed Unaudited Financial Statements.
|
1
|
|
|
Item 2.
|
Management’s Discussion and Analysis of Financial Condition and Results of Operations.
|
16
|
|
|
Item 4T.
|
Controls and Procedures.
|
28
|
|
|
PART II—OTHER INFORMATION
|
|||
|
Item 1.
|
Legal Proceedings.
|
28
|
|
|
Item 2.
|
Unregistered Sales of Equity Securities and Use of Proceeds.
|
28
|
|
|
Item 3.
|
Defaults Upon Senior Securities.
|
28
|
|
|
Item 5.
|
Other Information.
|
29
|
|
|
Item 6.
|
Exhibits.
|
29
|
|
|
Signatures
|
30
|
||
i
PART I—FINANCIAL INFORMATION
Item 1. Financial Statements.
|
NEDAK ETHANOL, LLC
|
||||||||
|
Condensed Unaudited Balance Sheets
|
||||||||
|
June 30,
2010
|
December 31,
2009
|
|||||||
|
ASSETS (Note 7)
|
||||||||
|
Current Assets
|
||||||||
|
Cash and equivalents
|
$
|
434,758
|
$
|
1,853,959
|
||||
|
Restricted short term investment (Note 6)
|
1,163,581
|
1,153,708
|
||||||
|
Restricted cash (Notes 7, and 8 and 10)
|
4,014,435
|
997,656
|
||||||
|
Accounts receivable
|
1,517,409
|
1,149,804
|
||||||
|
Commodity broker receivable
|
13,532
|
94,391
|
||||||
|
Inventory (Notes 3 and 9)
|
1,962,395
|
2,971,319
|
||||||
|
Derivative financial instruments (Notes 4 and 9)
|
-
|
5,325
|
||||||
|
Prepaid expenses and other
|
917,165
|
622,443
|
||||||
|
Total current assets
|
10,023,275
|
8,848,605
|
||||||
|
Property and Equipment
|
||||||||
|
Land and improvements
|
4,408,272
|
4,408,272
|
||||||
|
Buildings
|
9,121,024
|
9,102,173
|
||||||
|
Plant equipment
|
73,204,195
|
73,204,195
|
||||||
|
Office equipment
|
200,575
|
200,575
|
||||||
|
Vehicles
|
560,383
|
468,617
|
||||||
|
87,494,449
|
87,383,832
|
|||||||
|
Less accumulated depreciation
|
(9,262,675)
|
(6,233,212)
|
||||||
|
Net property and equipment
|
78,231,774
|
81,150,620
|
||||||
|
Other Assets
|
||||||||
|
Deposits
|
300,000
|
300,000
|
||||||
|
Debt issuance costs, net of accumulated amortization of $573,775 and $419,256 as of June 30, 2010 and December 31, 2009
|
1,187,460
|
1,341,979
|
||||||
|
Total other assets
|
1,487,460
|
1,641,979
|
||||||
|
Total Assets
|
$
|
89,742,509
|
$
|
91,641,204
|
||||
|
LIABILITIES AND MEMBERS’ EQUITY
|
||||||||
|
Current Liabilities
|
||||||||
|
Current maturities of long-term debt (Notes 2, 7 and 8)
|
$
|
6,296,789
|
$
|
3,205,471
|
||||
|
Accounts payable
|
||||||||
|
Trade
|
1,495,633
|
1,834,787
|
||||||
|
Corn
|
2,113,664
|
2,688,561
|
||||||
|
Accrued liabilities (Note 2)
|
3,802,570
|
2,401,015
|
||||||
|
Reclassification of long-term debt to current (Notes 2, 7 and 8)
|
41,887,475
|
45,873,529
|
||||||
|
Total current liabilities
|
55,596,131
|
56,003,363
|
||||||
|
Long-Term Debt, net of Current Maturities (Notes 2, 7, 8 and 10)
|
18,750
|
18,750
|
||||||
|
Commitments and Contingencies (Notes 2, 6 and 10)
|
||||||||
|
Members’ Equity (Note 5)
|
||||||||
|
Preferred Units, 185.5 and 185.4 units issued and outstanding as of June 30, 2010 and December 31, 2009, respectively
|
1,854,503
|
1,854,428
|
||||||
|
Common Units, net of offering costs, 5,233 units issued and outstanding
|
49,839,281
|
49,839,281
|
||||||
|
Accumulated deficit
|
(17,566,156)
|
(16,074,618)
|
||||||
|
Total members’ equity
|
34,127,628
|
35,619,091
|
||||||
|
Total Liabilities and Members’ Equity
|
$
|
89,742,509
|
$
|
91,641,204
|
||||
|
See Notes to Condensed Unaudited Financial Statements.
|
||||||||
1
|
NEDAK ETHANOL, LLC
|
||||
|
Condensed Unaudited Statements of Operations
|
||||
|
Three Months Ended June 30,
|
||||
|
2010
|
2009
|
|||
|
Revenues
|
$
|
21,444,494
|
$
|
11,978,882
|
|
Cost of Goods Sold
|
23,195,969
|
14,827,531
|
||
|
Gross Loss
|
(1,751,475)
|
(2,848,649)
|
||
|
General and Administrative Expenses
|
610,043
|
732,291
|
||
|
Operating Loss
|
(2,361,518)
|
(3,580,940)
|
||
|
Other Income (Expense)
|
||||
|
Interest income
|
9,226
|
12,109
|
||
|
Interest expense
|
(867,407)
|
(854,061)
|
||
|
Other expenses
|
1,194
|
-
|
||
|
Total other income (expense), net
|
(856,987)
|
(841,952)
|
||
|
Net Loss
|
$
|
(3,218,505)
|
$
|
(4,422,892)
|
|
Weighted Average Common Units
Outstanding—Basic & Diluted
|
5,233
|
5,233
|
||
|
Net Income (Loss) Per Common Unit—Basic & Diluted (Note 5)
|
$
|
(615.04)
|
$
|
(845.19)
|
|
See Notes to Condensed Unaudited Financial Statements.
|
||||
2
|
NEDAK ETHANOL, LLC
|
||||
|
Condensed Unaudited Statements of Operations
|
||||
|
Six Months Ended June 30,
|
||||
|
2010
|
2009
|
|||
|
Revenues
|
$
|
42,375,739
|
$
|
25,285,079
|
|
Cost of Goods Sold
|
44,101,079
|
30,709,680
|
||
|
Gross Loss
|
(1,725,340)
|
(5,424,601)
|
||
|
General and Administrative Expenses
|
1,066,941
|
1,242,819
|
||
|
Operating Loss
|
(2,792,281)
|
(6,667,420)
|
||
|
Other Income (Expense)
|
||||
|
Gain from litigation settlement (Note 10)
|
3,000,000
|
-
|
||
|
Interest income
|
17,694
|
28,404
|
||
|
Interest expense
|
(1,718,406)
|
(1,627,648)
|
||
|
Other expenses
|
1,455
|
-
|
||
|
Total other income (expense), net
|
1,300,743
|
(1,599,244)
|
||
|
Net Loss
|
$
|
(1,491,538)
|
$
|
(8,266,664)
|
|
Weighted Average Common Units
Outstanding—Basic & Diluted
|
5,233
|
5,233
|
||
|
Net Loss Per Common Unit—Basic & Diluted (Note 5)
|
$
|
(285.03)
|
$
|
(1,579.72)
|
|
See Notes to Condensed Unaudited Financial Statements.
|
||||
3
|
NEDAK ETHANOL, LLC
|
|||||||||||||||
|
Condensed Unaudited Statements of Cash Flows
|
|||||||||||||||
|
Six Months Ended June 30,
|
|||||||||||||||
|
2010
|
2009
|
||||||||||||||
|
Cash Flows from Operating Activities
|
|||||||||||||||
|
Net loss
|
$
|
(1,491,538)
|
$
|
(8,266,664)
|
|||||||||||
|
Adjustments to reconcile net loss to net cash used in operations:
|
|||||||||||||||
|
Depreciation and amortization
|
3,183,982
|
3,187,089
|
|||||||||||||
|
Lower of cost or market adjustment on inventory
|
452,784
|
-
|
|||||||||||||
|
Change in fair value of derivative financial instruments
|
5,325
|
-
|
|||||||||||||
|
Gain from litigation settlement
|
(3,000,000)
|
-
|
|||||||||||||
|
Change in operating assets and liabilities:
|
|||||||||||||||
|
Receivables
|
(286,746)
|
(2,103,683)
|
|||||||||||||
|
Inventory
|
556,140
|
(733,332)
|
|||||||||||||
|
Prepaid expenses and other
|
(294,722)
|
(77,805)
|
|||||||||||||
|
Deposits
|
-
|
(300,000)
|
|||||||||||||
|
Accounts payable
|
(814,051)
|
4,853,908
|
|||||||||||||
|
Accrued liabilities
|
1,401,555
|
1,076,826
|
|||||||||||||
|
Net cash provided by (used in) operating activities
|
(287,271)
|
(2,363,661)
|
|||||||||||||
|
Cash Flows from Investing Activities
|
|||||||||||||||
|
Capital expenditures
|
(110,617)
|
(165,325)
|
|||||||||||||
|
Net change in restricted cash and investments
|
(26,652)
|
(3,537,645)
|
|||||||||||||
|
Net cash used in investing activities
|
(137,269)
|
(3,702,970)
|
|||||||||||||
|
Cash Flows from Financing Activities
|
|||||||||||||||
|
Proceeds from construction loan
|
-
|
779,376
|
|||||||||||||
|
Payment on construction loan
|
(894,736)
|
-
|
|||||||||||||
|
Sale of Preferred Units
|
75
|
1,844,428
|
|||||||||||||
|
Proceeds from Delta-T letter of credit
|
-
|
3,995,000
|
|||||||||||||
|
Payment on tax increment financing
|
-
|
(139,000)
|
|||||||||||||
|
Payments for deferred offering costs
|
-
|
(10,568)
|
|||||||||||||
|
Debt issuance costs
|
(100,000)
|
-
|
|||||||||||||
|
Net cash provided by (used in) financing activities
|
(994,661)
|
6,469,236
|
|||||||||||||
|
Increase (Decrease) in Cash and Equivalents
|
(1,419,201)
|
402,605
|
|||||||||||||
|
Cash and Equivalents—Beginning of Period
|
1,853,959
|
94,691
|
|||||||||||||
|
Cash and Equivalents—End of Period
|
$
|
434,758
|
$
|
497,296
|
|||||||||||
|
See Notes to Condensed Unaudited Financial Statements.
|
|||||||||||||||
4
NEDAK ETHANOL, LLC
Notes to Condensed Unaudited Financial Statements
June 30, 2010
1. SUMMARY OF SIGNIFICANT ACCOUNTING POLICIES
The unaudited interim condensed financial statements of NEDAK Ethanol, LLC (the “Company”) reflect all adjustments consisting only of normal recurring adjustments that are, in the opinion of management, necessary for fair presentation of financial position, results of operations and cash flows. The results for the three and six month periods ended June 30, 2010 is not necessarily indicative of the results that may be expected for a full fiscal year. Certain information and footnote disclosures normally included in annual financial statements prepared in accordance with accounting principles generally accepted in the United States of America (“GAAP”) are condensed or omitted pursuant to the rules and regulations of the Securities and Exchange Commission (“SEC”), although the Company believes that the disclosures made are adequate to make the information not misleading. The accompanying balance sheet as of December 31, 2009 is derived from the audited financial statements as of that date. These condensed unaudited financial statements should be read in conjunction with the Company’s audited financial statements and notes thereto included in the annual report for the year December 31, 2009, filed as an exhibit to the Form 10-K filed with the SEC.
Nature of Business
The Company operates a 44 million gallon per year ethanol plant in Atkinson, Nebraska, and produces and sells fuel ethanol and distillers grains, a co-product of the ethanol production process. Sales of ethanol and distillers grains began in January 2009.
Accounting Estimates
Management uses estimates and assumptions in preparing these financial statements in accordance with GAAP. Those estimates and assumptions affect the reported amounts of assets and liabilities, the disclosure of contingent assets and liabilities, and the reported revenues and expenses. The Company uses estimates and assumptions in accounting for the following significant matters, among others: the allowance for doubtful accounts, useful lives of property and equipment, the valuation of inventory and inventory purchase commitments and long-lived asset impairments including the assumptions used to estimate future cash flows, the ability to raise capital, and the ability to comply with certain provisions within the Company’s credit agreements. Actual results may differ from estimated amounts, and such differences may be material to the Company’s financial statements. The Company periodically reviews estimates and assumptions, and the effects of revisions are reflected in the period in which the revisions are made.
2. LIQUIDITY AND MARKET UNCERTAINTIES
The Company has certain risks and uncertainties that it experiences during volatile market conditions such as what the ethanol industry experienced during 2008 and which continued through 2009 and into 2010. These volatilities can have a severe impact on operations.
In 2009, the Company completed construction of its ethanol production facilities with nameplate capacity of 44 million gallons per year and a remote rail load-out facility. In accordance with the Company’s policy for evaluating impairment of long-lived assets, management has estimated that the projected future undiscounted cash flows from operations of these facilities exceed their carrying value as of June 30, 2010; therefore, no impairment loss was recognized. In determining the projected future undiscounted cash flows, the Company has made significant assumptions concerning the future viability of the ethanol industry, the future price of corn in relation to the future price of ethanol and the overall demand for ethanol in relation to production and supply capacity.
The Company’s operating and financial performance is largely driven by the prices at which it sells ethanol and the net cost of corn. The price of ethanol is influenced by factors such as supply and demand, the weather, government policies and programs, unleaded gasoline prices and the petroleum markets as a whole. Excess ethanol supply in the market, in particular, puts downward pressure on the price of ethanol. The Company’s largest cost of production is
5
NEDAK ETHANOL, LLC
Notes to Condensed Unaudited Financial Statements
June 30, 2010
corn. The Company’s cost of corn is generally impacted by factors such as supply and demand, the weather, government policies and programs, and risk management techniques used to protect against the price volatility. The Company is subject to significant risk that its operating margins may be reduced or eliminated due to the relative movements in the market prices of its products and major manufacturing inputs. As a result, market fluctuations in the price of or demand for these commodities can have a significant adverse effect on the Company’s operations and profitability. Due to the current conditions of these commodity markets, the Company may continue to generate negative margins.
As of June 30, 2010, the Company was in default of its Credit Agreement and its Tax Increment Financing, as further discussed in Notes 7 and 8. For this reason, the Company has reclassified amounts owing under these loans as current liabilities. Such treatment of the Company’s long term debt will continue, as required by GAAP, until such defaults are cured.
Because of these events and market conditions, there is an increased level of uncertainty with respect to the Company’s ability to obtain sufficient cash flows from operations or debt or equity financing sufficient to cover the liquidity needed for ongoing operations. The Company’s efforts to secure working capital include:
|
|
·
|
The Company has received notice that an application for a United States Department of Agriculture (“USDA”) Value Added Producers Grant for working capital of $300,000 on November 30, 2009 was accepted and expects to receive funding after receipt of instructions from the local USDA office.
|
|
|
·
|
The Company and its lender have received conditional approval from the USDA of an application for a Business and Industries Guaranteed Loan (the “B&I Loan”) in the amount of $5,000,000 for additional working capital. Final USDA approval for the B&I Loan is conditioned on reaching a 40% net worth ratio and final approval by the Company’s lender. As of June 30, 2010, the Company’s net equity was 38% of its total assets. The lender has also indicated it will require certain other conditions, including an additional capital contribution to the Company.
|
|
|
·
|
At the end of the second quarter of 2010, the Company has expanded efforts to mitigate the liquidity shortfall needed for ongoing operations and the working capital required by effective risk management practices to include discussions with firms offering tolling arrangements for production volumes and other contracting alternatives to improve risk management results and reduce working capital as well as additional sources of capital.
|
|
|
·
|
The Company has continued discussions with the lenders to identify alternative actions to resolve defaults under the Credit Agreement and Tax Increment Financing including obtaining additional capital and changes to marketing strategies to reduce market risk.
|
Exclusive of the reclassification of the majority of the Company’s long term debt to current liabilities, the Company would have had negative working capital of $3,685,381, which includes restricted cash and investments of $5,178,016, and which includes only Current Maturities of Long Term Debt that represent normal amortization of principal, as of June 30, 2010. As reported in the Balance Sheet, the reclassification of long term debt to current liabilities resulted in negative working capital of $45,572,856 as of June 30, 2010.
Accrued liabilities include accrued board compensation of $772,250 and $742,500 as of June 30, 2010 and December 31, 2009, respectively, and accounts payable-corn include amounts owing to the Company’s grain procurement agent totaling approximately $735,642 and $815,000 as of June 30, 2010 and December 31, 2009, respectively, which have had favorable payment terms. If these favorable payment terms cease, more cash may be required.
These financial statements have been prepared assuming the Company will continue as a going concern. Until the Company is able to obtain additional working capital from the above options, for which no assurance can be given, or from operations, in addition to modifying the Credit Agreement covenants or refinancing the construction loan, there is substantial doubt as to whether the Company can continue to operate as a going concern.
6
NEDAK ETHANOL, LLC
Notes to Condensed Unaudited Financial Statements
June 30, 2010
3. INVENTORY
Inventory consists of the following:
|
June 30, 2010
|
December 31, 2009
|
|||
|
Raw Materials
|
$
|
322,961
|
$
|
1,561,766
|
|
Work in Process
|
504,374
|
567,410
|
||
|
Finished goods
|
1,135,060
|
842,143
|
||
|
Total
|
$
|
1,962,395
|
$
|
2,971,319
|
4. DERIVATIVE FINANCIAL INSTRUMENTS
The Company seeks to hedge a portion of its future corn and natural gas purchases to the extent considered necessary for minimizing risk from market price fluctuations. However, as of June 30, 2010, the Company had no open positions for corn on the Chicago Board of Trade to hedge its forward corn commitments and no open positions for natural gas. Derivative financial instruments recorded on the balance sheet represent the current fair value of the instruments.
There were no derivative financial instruments as of June 30, 2010. The following table provides details regarding the Company’s derivative financial instruments as of December 31, 2009, none of which are designated as hedging instruments:
|
Instrument
|
Balance Sheet Location
|
Assets
|
Liabilities
|
|||||
|
December 31, 2009
|
Commodity contracts
|
Derivative financial instruments
|
$
|
5,325
|
$
|
-
|
The following table demonstrates the Company’s gains from derivative financial instruments in the statements of operations, none of which are designated as hedging instruments:
|
Derivatives not
|
Location of Gain
|
Amount of Gain
|
||||
|
Designated as Hedging
|
Recognized in
|
Recognized in
|
||||
|
Instruments
|
Income
|
Income
|
||||
|
Six months ended June 30, 2010
Three months ended June 30, 2010
|
|
Commodity contracts
Commodity contracts
|
Cost of goods sold
Cost of goods sold
|
$
|
707,266
18,304
|
|
|
Six months ended June 30, 2009
Three months ended June 30, 2009
|
Commodity contracts
Commodity contracts
|
|
Cost of goods sold
Cost of goods sold
|
-
-
|
5. MEMBERS’ EQUITY
As of June 30, 2010, there were 185.5 preferred membership units (“Preferred Units”) at $10,000 per unit. The Preferred Units entitle the holders thereof, among other things, to receive a preferred cumulative distribution of 10% (“Preferred Return”) before holders of common membership units receive distributions. Following the third anniversary of the issuance of the Preferred Units, the Company may redeem Preferred Units for the original purchase price plus any accrued but unpaid distributions. The accumulated undeclared Preferred Return as of June 30, 2010 was $225,412, and the total liquidation preference of the Preferred Units as of June 30, 2010 was $2,079,915.
Losses are generally allocated to all units based upon their respective percentage of units held, except that losses are not allocated to Preferred Units if the Preferred Return has not been achieved. For purposes of computing the net
7
NEDAK ETHANOL, LLC
Notes to Condensed Unaudited Financial Statements
June 30, 2010
loss per common unit for the three and six months ended June 30, 2010 and 2009, no losses were allocated to the Preferred Units since the Preferred Return has not been achieved.
6. LINE OF CREDIT
In March 2006, the Company entered into a line of credit agreement in favor of its natural gas transporter (see Note 10) to reserve pipeline space. The Company may draw up to $150,000. Interest is payable upon the lender’s demand or in May 2011 at a rate of 3.35%. In August 2007, the Company entered into a line of credit agreement in favor of its natural gas transporter for the service of transporting gas. The Company may draw up to $923,828. Interest is payable upon the lender’s demand at a rate of 3.75%. These agreements are secured by restricted short term investments totaling $1,163,581 as of June 30, 2010 and $1,153,708 as of December 31, 2009. As of June 30, 2010 and December 31, 2009, there were no borrowings outstanding on the lines of credit.
7. LONG-TERM DEBT
|
June 30, 2010
|
December 31, 2009
|
|||
|
Construction loan under Credit Agreement
|
$
|
41,605,264
|
$
|
42,500,000
|
|
Members’ notes payable
|
18,750
|
18,750
|
||
|
Tax increment financing note (Note 8)
|
6,579,000
|
6,579,000
|
||
|
48,203,014
|
49,097,750
|
|||
|
Less current maturities under original terms
|
(6,296,789)
|
(3,205,471)
|
||
|
Less reclassified long-term debt to current
|
(41,887,475)
|
(45,873,529)
|
||
|
$
|
18,750
|
$
|
18,750
|
Construction Loan under Credit Agreement
In February 2007, the Company entered into a senior credit facility (“Credit Agreement”) with AgCountry Farm Credit Services, FLCA (“Lender”) for a multiple advance construction loan totaling $42,500,000. The Company was required to make interest payments during the construction phase at the thirty-day LIBOR plus 3.4%, but not less than 6.0%. The interest rate was 6.0% as of June 30, 2010. The performance test of the plant was completed in June 2009, but three significant equipment deficiencies prevented final acceptance at that time. The Credit Agreement provides that the construction loan is to be converted at final acceptance to a permanent ten year term loan of $32,500,000 and a $10,000,000 revolving term loan. The Company is in negotiations with Lender to convert the loan to long term financing.
The Credit Agreement requires the Company to maintain certain financial covenants, including minimum working capital of $6,000,000, minimum current ratio of 1.20:1.00, minimum tangible net worth of $41,000,000, minimum owners’ equity ratio of 50%, and a minimum fixed charge coverage ratio of 1.25:1.00, and also includes restrictions on distributions and capital expenditures. As of June 30, 2010, the Company was not in compliance with the working capital covenants (working capital was $(3,685,381) exclusive of the debt reclassification), the current ratio requirement (a current ratio of 0.73:1.00 without debt reclassification), the tangible net worth requirement (tangible net worth was $38,844,143) and the fixed charge coverage ratio (intended to be an annual measure, but using year to date measures and six months of principal payment that ratio is 0.67 : 1.00). The Credit Agreement contains certain prepayment fees in the first four years of the scheduled payments, and the loan is secured by substantially all the Company’s assets.
Under the terms of the Credit Agreement, the Company is required to make level monthly principal payments of approximately $447,368 beginning April 1, 2010 and ending on February 1, 2018. If the B&I Loan is granted, the amount and terms of conversion of the construction loan to a Term Loan and a Revolving Term Loan for working capital may change. Two principal payments were made in April, 2010 for the April 1 and May 1, 2010 payments. The Company has not made payments due on June 1, July 1 or August 1 in order to conserve working capital. The Lender has the ability to make payments of both principal and interest from the restricted cash held on account at the
8
NEDAK ETHANOL, LLC
Notes to Condensed Unaudited Financial Statements
June 30, 2010
Lender. However, the Lender has not yet started to do so as of July 30, 2010. This leaves principal and interest payments unpaid and delinquent.
Under the terms of the Credit Agreement, the Company must pay a commitment fee of 0.25% on the unused portion of the revolving promissory note upon conversion to the revolving term loan. In addition, the Company was required to establish and fully fund a $2,400,000 Debt Service Reserve Account on or prior to the loan conversion date, no later than August 1, 2009. At such time, the commitment amount would have been reduced to an amount not to exceed $7,600,000 and the Debt Service Reserve Fund would no longer be required to be funded. This requirement was not met. The Company and Lender are discussing amendments to the terms of the Credit Agreement which may modify the foregoing provisions.
The Company executed a Fourth Supplement and Forbearance Agreement to Master Credit Agreement on March 27, 2009 (the “Fourth Supplement”). In connection with the Fourth Supplement, the Lender required the Company to obtain $1,000,000 of equity or subordinate debt capital by April 30, 2009, which was guaranteed by the Company’s board of directors in addition to the Preferred Units purchased by the Directors discussed in Note 5. The Lender extended this April 30, 2009 date to June 30, 2009 by which time the Company only received $844,428. The payment terms of the additional loan fee of $250,000 from the third amendment to the Credit Agreement were modified to provide that the fee will be paid in five $50,000 quarterly installments beginning on or before January 1, 2010. In addition, the Company undertook to achieve and maintain indefinitely 100% name plate production on or before May 1, 2009. The Fourth Supplement also provided that the interest on the unpaid principal amount of the construction and term loans accrues at a variable interest rate equal to LIBOR plus 5.40%, but not less than 6.00%. In addition to the Fourth Supplement, the Lender delayed required compliance by the Company of certain financial covenants in the Credit Agreement until after September 30, 2009 as well as delayed the requirement to make excess cash flow payments until December 31, 2009. On July 24, 2009, the Lender again declared the Company in default, due to delinquent payment of fees and interest, deficiency in the raising of equity or subordinated debt, and failure to achieve nameplate production by May 1, 2009.
On September 30, 2009, the Company executed a Fifth Supplement and Forbearance Agreement to the Master Credit Agreement (“Fifth Supplement”) with the Lender, which (i) extended the dates to pay loan fees of $250,000 to begin on January 1, 2010 with $50,000 per quarter through January 1, 2011 and restructure fees of $100,000 with an additional payment of $100,000 payable on or before June 30, 2010, (the first payment of $50,000 was made on January 31, 2010 and the Company has instructed the Lender to take subsequent payments from the restricted cash held on account at the Lender), (ii) extended the first principal payment until April 1, 2010, (iii) provided for the release of $2,000,000 of restricted cash for the purchase of corn, and (iv) requires the Company to fund a loan reserve fund under the Credit Agreement in the amount of $2,000,000 if the Company receives the B&I Loans for $5,000,000 of working capital.
On August 6¸2010, the Company executed a Sixth Supplement and Forbearance Agreement to the Master Credit Agreement (the “Sixth Supplement”), under which the Company agreed that Lender could apply the $3,945,087 it holds as collateral under the Credit Agreement to our current obligations under the Credit Agreement, including monthly payments, penalties and interest. The Company also agreed to provide the Lender with a comprehensive plan within 30 days of the date of the Sixth Supplement to resolve the Company’s working capital deficiencies by the end of the forbearance period. In exchange for the foregoing, Lender agreed to refrain from exercising its rights under the Credit Agreement until the earlier of October 1, 2010 or the date of any default under the Sixth Supplement.
The Company and the Lender remain in discussions to revise the Credit Agreement covenants and resolve outstanding defaults under the Credit Agreement. The B&I Loan is pending the Company meeting the net worth requirement set by USDA and resolution with the Lender regarding its conditions for extension of the loan. In light of continuing poor margins in the ethanol industry, the Lender has indicated the Company should focus on mitigation of risk and obtaining additional capital.
9
NEDAK ETHANOL, LLC
Notes to Condensed Unaudited Financial Statements
June 30, 2010
Note Payable to Members
In May 2004, each of the initial 15 members loaned the Company $1,000. The unsecured loans bore interest at 5% per annum with principal and interest due on April 8, 2009. On April 8, 2009, the notes were amended and restated to add accrued interest in the amount of $3,750 to the principal. The unsecured notes, which are classified as long-term debt as of June 30, 2010, continue to bear interest at 5% per annum with principal and interest due on April 8, 2012.
8. TAX INCREMENT FINANCING
In September 2007, the City of Atkinson, Nebraska, (“Issuer”) issued a tax increment financing Note (the “TIF Note”), the net proceeds of which in the amount of $4,939,925 were paid to the Company through a loan (the “TIF Loan”) to reimburse the Company for certain infrastructure improvements relating to the plant. Repayment of the Loan is secured by the Company’s pledge to the lender of the TIF Note (“TIF Lender”) and other obligations relating to the TIF Note. The original amount of the TIF Note was $6,864,000 and bears interest of 9.5%.
In connection with the issuance of the Note, the Issuer and the Company entered into a Redevelopment Contract (“Contract”). Under the Contract, the Note proceeds are to be used for Project costs, for the establishment of special funds held by the Note trustee for interest and principal payments and reserves (the “Capitalized Interest Fund” and the “Debt Service Reserve Fund”), and for debt issuance costs. The Company may not convey, assign, or transfer the project prior to the expiration of a 15 year period without the prior written consent of the Issuer. As of June 30, 2010 and December 31, 2009, the Capitalized Interest Fund was approximately $57,000 and $52,500 respectively, and is included in restricted cash on the balance sheet.
The Note is due in semi-annual increments which commence at $139,000 and increase to $444,000, with a final maturity in December 2021. Interest on the Note is payable semi-annually on September 1 and December 1. The interest rate resets on September 1, 2012 and September 1, 2017 to a rate equal to the 5-year U.S. Treasury Constant Maturity index plus 4.75% for the applicable five-year period and the remainder of the term of the TIF Loan, respectively. The Company has the option to redeem or purchase the Note in whole or in part. As of June 30, 2010 and December 31, 2009, the Company had $6,579,000 outstanding on the TIF Loan.
On July 6, 2009, the Lender notified the Company that the Debt Service Reserve Fund was deficient, constituting a default under the TIF Loan. The primary reason for this default was the extended delays and losses associated with startup of the Company’s ethanol plant. In order to enable resolution of the Company’s default, the Company and the TIF Lender entered into a Forbearance Agreement dated December 31, 2009 (the “Agreement”).
Under the Agreement, the Company agreed to authorize a transfer from the Debt Service Reserve Fund to satisfy the Company’s principal payment due to TIF Lender on December 31, 2009. With the authorization of payment to TIF Lender from the Debt Service Reserve Fund, the Company became current on all required payments to TIF Lender, but has violated covenants in the TIF Loan requiring immediate replenishment of the Debt Service Reserve Fund. Moreover, the Company agreed to and is attempting to seek the consent of Lender to (i) grant a security interest and Deed of Trust in favor of the TIF Lender upon the Company receiving, or being denied, the B&I Loan, (ii) grant a security interest in all reserve funds established under the TIF Loan and (iii) amend to the TIF Loan documents to (a) reduce the TIF Loan’s interest rate from 9.5% to 6.0% for three years, and upon expiration of the three years, the interest rate will revert to 9.5%, (b) reduce the Debt Service Reserve Fund to an amount equal to 12 months of principal payments, (c) make the Debt Service Reserve Fund funding contingent on the Company’s previous year’s profitability and (d) require the financial covenants and ratios in the TIF Loan documents to be consistent with the financial covenants and ratios to be agreed upon with Lender.
Under the Agreement, the TIF Lender agreed to refrain from exercising any of its rights or remedies under the TIF Loan, including acting on Company’s failure to maintain a sufficient amount in its Debt Service Reserve Fund or meet TIF Loan covenants, for a period beginning on December 31, 2009 and ending on the earlier of (a) March 31, 2010 or (b) 30 days following the approval of the proposed B&I Loans. This Forbearance Agreement expired, and the TIF Lender extended the standstill date to May 15, 2010. The Company and the TIF Lender failed to extend the
10
NEDAK ETHANOL, LLC
Notes to Condensed Unaudited Financial Statements
June 30, 2010
Agreement or reach other arrangements containing similar forbearance obligations by May 15, 2010, and the Company received a Notice of Default dated June 30, 2010 from the TIF Lender indicating that the Company was in default under the TIF Note due to nonpayment of $464,768 owing on June 1, 2010, and that the Debt Service Reserve Fund remained deficient by an amount of $588,553. Because of these defaults, the TIF Lender may (i) charge the Company an interest rate of 4% over the interest rate the Lender would otherwise be able to charge the Company, (ii) charge the Company a late charge of 5% for payments which are more than 10 days overdue, (iii) accelerate the entire amount of principal outstanding under the TIF Loan (which was $6,579,000 as of June 30, 2010) and (iv) exercise any other rights available to it under Agreement or at law. Due to these defaults, the TIF Loan is classified as a current liability.
9. FAIR VALUE MEASUREMENTS
Accounting standards establish a framework for measuring fair value. That framework provides a fair value hierarchy that prioritizes the inputs to valuation techniques used to measure fair value. The hierarchy gives the highest priority to unadjusted quoted prices in active markets for identical assets or liabilities (level 1 measurements) and the lowest priority to unobservable inputs (level 3 measurements). The three levels of the fair value hierarchy are described below:
Level 1: Inputs to the valuation methodology are unadjusted quoted prices for identical assets or liabilities in active markets that the Company has the ability to access.
Level 2: Significant other observable inputs other than Level 1 prices such as quoted prices for similar assets or liabilities; quoted prices in markets that are not active; or other inputs that are observable or can be corroborated by observable market data.
Level 3: Inputs to the valuation methodology are unobservable and significant to the fair value measurement.
The asset’s or liability’s fair value measurement level within the fair value hierarchy is based on the lowest level of any input that is significant to the fair value measurement. Valuation techniques used need to maximize the use of observable inputs and minimize the use of unobservable inputs.
The following table summarizes by level, within the fair value hierarchy, the Company’s assets (liabilities) that were measured at fair value on a recurring basis as of December 31, 2009:
|
Commodity contracts
|
Level 1
|
Level 2
|
Level 3
|
Total
|
||||
|
December 31, 2009
|
$
|
5,325
|
-
|
$
|
-
|
$
|
5,325
|
There were no assets or liabilities measured at fair value on a recurring basis as of June 30, 2010.
Certain assets and liabilities are measured at fair value on a nonrecurring basis; that is, the items are not measured at fair value on an ongoing basis but are subject to fair value adjustments in certain circumstances (for example, when there is evidence of impairment).
The following table summarizes by level, within the fair value hierarchy, the Company’s assets that were measured at fair value on a nonrecurring basis during the six months ended June 30, 2010:
|
Inventory
|
Level 1
|
Level 2
|
Level 3
|
Total
|
||||
|
June 30, 2010
|
$
|
-
|
$
|
-
|
$
|
1,962,395
|
$
|
1,962,395
|
11
NEDAK ETHANOL, LLC
Notes to Condensed Unaudited Financial Statements
June 30, 2010
Inventory was reduced by $134,444 as of June 30, 2010 to reflect its fair value, based upon the estimated selling price of ethanol and distillers grains, less estimated transportation costs, and production costs for work in process and raw materials.
The carrying values of cash and cash equivalents, restricted cash, restricted short-term investments, accounts receivable, the commodity broker receivable, derivative financial instruments and accounts payable are recorded at or approximate fair value. Management determined it is not practicable to estimate the fair value of the notes payable and long-term debt since these agreements contain unique terms, conditions, and restrictions, which were negotiated at arm’s length, and there was no readily determinable similar instrument on which to base an estimate of fair value.
10. COMMITMENTS AND CONTINGENCIES
Construction Contract
The Company entered into an Engineering, Procurement and Construction Services Fixed Price Contract dated August 9, 2006 with Delta-T Corporation (“Delta-T”), which has been amended with several supplements, amendments and change orders (collectively, the “Delta-T Contract”). The Delta-T Contract provided, among other things: (i) guarantee of Delta-T’s performance by Delta-T’s parent, Bateman Litwin NV (“Bateman”), (ii) the provision by Delta-T of letters of credit in the amounts of $4,000,000 and $5,500,000 for the benefit of Lender and the Company, respectively, and (iii) a promissory note in the amount of $5,000,000 made by the Company in favor of Delta-T. Disputes between the parties respecting the letters of credit and other matters resulted in the filing by Delta-T of an action in the District Court of Douglas County, Nebraska, in which the court temporarily restrained the Company and Lender from making a draw on one of the letters of credit. The parties amended the Delta-T Contract on September 1, 2009 (the “Amendment”). The Amendment settled certain asserted claims by both parties and provided the following, among other things: (i) Delta-T would repair certain plant emissions equipment, (ii) Delta-T would extend the $5,500,000 letter of credit to September 30, 2010 with conditions added to draw on such letter of credit, (iii) Delta-T was relieved of previously agreed upon punch list responsibility with certain exceptions, (iv) Delta-T relinquished all rights to the $3,995,000 of proceeds held by Lender from the September 2009 draw against the $4,000,000 letter of credit, (v) the $5,000,000 promissory note in Delta-T’s favor was extinguished, (vi) Delta-T agreed to dismiss its legal action and dissolve the temporary restraining order, and (vii) except as provided above, no further payments or transfer of funds shall be made to or from Delta-T and the Company. The extinguishment of the $5,000,000 promissory note and other contract liabilities were recorded as reductions to property and equipment. The receipt of the $3,995,000 cash, less $228,433 for costs expected to be incurred, was recognized as gain in other income during the fourth quarter of 2009.
On March 19, 2010, the Company, Delta-T, Bateman and Bateman Engineering Inc. (“Bateman Engineering”) entered into a Settlement Agreement and Mutual Release (the “Settlement Agreement”), under which, among other things, (i) Delta-T and Bateman authorized the Company to draw $3,000,000 from a letter of credit, and (ii) the Company released Delta-T and Bateman from all warranties and other claims under the Delta-T Contract. The Settlement Agreement settled all outstanding disputes among the Company, Bateman and Delta-T relating to the Delta-T Contract and construction of the Company’s ethanol plant. The receipt of the $3,000,000 was recognized as a gain in other income during the three months ended March 31, 2010, and is included in restricted cash as of June 30, 2010.
Plant Management Agreement
In July 2007, the Company entered into an agreement with an unrelated party for the operation and management of the Company’s plant. The Company pays a fixed monthly payment of approximately $120,434 for such services, which will be adjusted annually. The Company is currently paying for process chemicals at a fixed rate per denatured gallon of ethanol produced. The Company also has future obligations for an incentive program that is in effect for the first five years of operation following the Delta-T settlement discussed above. The agreement will terminate on December 31, 2014 unless terminated by either party giving 180 days prior written notice. The
12
NEDAK ETHANOL, LLC
Notes to Condensed Unaudited Financial Statements
June 30, 2010
Company incurred approximately $372,000 and $742,000 for these services for the three and six month periods ended June 30, 2010 and $260,000 and $526,000 for these services for the three and six month periods ended June 30, 2009, respectively.
Utility Contracts
In March 2006, the Company entered into an agreement with a natural gas provider for the procurement, and management of natural gas transportation and supply. The Company pays for the natural gas based on actual consumption along with a monthly management fee of $0.07 per MMBtu delivered. The agreement was automatically renewed for an additional two-year term in February 2008. As of March 31, 2010 this contract was allowed to expire and the Company has entered into a consulting agreement with a management services company who is negotiating for gas supply on the Company’s behalf and making recommendations as to methods and sources of gas procurement on a week by week basis. The new management monthly fee is $3,683 which replaces the $0.07 per MMBtu variable cost.
In May 2006, the Company entered into an agreement, secured by the Company’s line of credit discussed in Note 6, with a natural gas transporter for the transportation of natural gas. The Company pays the maximum transportation rate unless otherwise agreed for the maximum daily transportation quantity of 2450 MMBtu per day. The agreement is for a ten year period beginning September 2007 and may be extended for another primary term if agreed to by both parties.
In September 2007, the Company entered into an agreement, secured by the Company’s line of credit discussed in Note 6, with a natural gas transporter to expand the pipeline capacity. The Company pays the maximum transportation rate unless otherwise agreed for the maximum daily transportation quantity of 1,000 MMBtu per day. The agreement is for a ten year period beginning September 2007 and may be extended for another primary term if agreed to by both parties.
In April 2010, the Company entered into an agreement to expand the transport reservation by an additional 500 MMBtu per day, bringing the guaranteed transport volume to 3,950 MMBtu per day. This additional reservation is for a period of one year and ends in March 2011.
Transportation Agreement
In July 2007, the Company entered into an agreement with a fuel carrier for the transportation of ethanol from the plant to the load out facility. The Company pays a base fee per gallon unloaded plus a surcharge if above the diesel fuel base. The agreement has a three year term which commenced July 2007 and will automatically renew for additional one-year terms unless terminated by either party by written notice no less than 180 days prior to the ending date of the initial three-year term or of any renewal term.
Marketing Agreements
Ethanol
In November 2006, the Company entered into a marketing agreement with an unrelated party for the sale of its ethanol. The Company pays the marketer a fixed rate fee of $0.01 per net gallon of denatured ethanol for the services provided. The agreement will continue until December 2010. The agreement will automatically renew for an additional one year unless the Company gives four months’ written notice.
The marketer leases rail cars to the Company with varying terms under this agreement, which leases may survive the actual marketing agreement by many years. The Company has lease agreements for 141 rail cars under this agreement. There are 45 cars under leases that expire before the end of 2011 and carry an average monthly rental cost of $352. The remaining 96 cars have expiration dates between March 31, 2017 and August 31, 2020 with average monthly rental costs of $707.
13
NEDAK ETHANOL, LLC
Notes to Condensed Unaudited Financial Statements
June 30, 2010
Revenues from sales to this marketer were approximately $17,472,000 and $34,603,000 for the three and six month periods ended June 30, 2010 and $9,114,000 and $18,737,000 for the three and six month periods ended June 30, 2009, respectively. Accounts receivable from this marketer were $995,986 and $674,671 as of June 30, 2010 and December 31, 2009, respectively.
As of June 30, 2010, the Company has forward contracted sales of ethanol for 4,540,000 gallons of ethanol under variable price arrangements.
Distillers Grains
In January 2007, the Company entered into a marketing agreement with an unrelated party to purchase all of the Company’s modified wet distillers grains (“MWDG”). The marketer is to operate in good faith to obtain a market competitive price. The marketer pays the Company the selling price, less a marketing fee equal to $1.50 per ton of MWDG sold at $50 a ton or less or 3.0% of the price of MWDG sold over $50 a ton. The agreement will continue until March of 2011 and renew for an additional two years thereafter unless either party has given four months written notice. Revenue from this marketer was approximately $2,432,919 and $4,869,669 for the three and six month periods ended June 30, 2010 and $1,575,000 and $3,716,000 for these services for the three and six month periods ended June 30, 2009, respectively. Accounts receivable from this marketer were $228,681 and $332,092 as of June 30, 2010 and December 31, 2009, respectively.
Grain Procurement
In December 2006, the Company entered into an agreement with an unrelated party to supply corn required for its production of ethanol. As of January 2009, the parties no longer operate under this agreement. However, the agent continues to provide services to the Company on an at-will basis for nearly all contracts with local producers for the delivery of corn to the Company. The agent is paid a service fee of $0.04 per bushel of grain delivered, and the Company also executes some contracts directly with producers (which include directors) for some of its corn. In the ordinary course of business, the Company will enter into forward purchase contracts for its corn purchases. Management considers these forward contracts to be normal purchases since the corn will be delivered in quantities expected to be used by the Company over a reasonable period in the normal course of business. Purchases directly from the agent totaled approximately $4,381,000 and $1,377,000 for the quarters ended June 30, 2010 and 2009, respectively.
As of June 30, 2010, the Company had commitments on forward purchase contracts to purchase 1,141,277 bushels of corn at an average price of $3.43 per bushel totaling $3,915,000 for delivery between July 1, 2010 and July 2011. Also, the Company had commitments on un-priced forward purchase contracts for 1,272,403 bushels, for delivery between July 2010 and September 2010. The final price for these contracts will be determined based on cash price at the time of delivery.
Environmental Liabilities
The Company’s operations are subject to environmental laws and regulations adopted by various governmental entities in the jurisdiction in which it operates. These laws require the Company to investigate and remediate the effects of the release or disposal of materials at its location. Accordingly, the Company has adopted policies, practices, and procedures in the areas of pollution control, occupational health, and the production, handling, storage, and use of hazardous materials to prevent material environmental or other damage, and to limit the financial liability which could result from such events. Environmental liabilities are recorded when the liability is probable and the costs can be reasonably estimated.
The Company has received Notices of Violation (“NOV”) from the Nebraska Department of Environmental Quality (“NDEQ”) arising from failures of emission equipment designed and installed by Delta-T. That equipment includes
14
NEDAK ETHANOL, LLC
Notes to Condensed Unaudited Financial Statements
June 30, 2010
the plant’s regenerative thermal oxidizer (“RTO”) used to control emissions from the dryer and the CO2 Scrubber used to control emissions from the ethanol process.
The RTO had not performed according to the design specified in the Delta-T Contract, and the Company continues to assess methods to resolve the problem. The CO2 Scrubber failed in original compliance testing, and equipment modifications and process adjustments were made, including chemical injection, to remediate the issue. During the startup operations of the plant beginning in January 2009 and continuing through the date of the original compliance testing, Delta-T had operated the plant without these modifications and as a result, the Company received an NOV in January 2010 which asserted that due to the failure of the CO2 Scrubber, the Company’s operation of the plant violated the operating permit issued by the NDEQ.
While the Company believes it has resolved all of the operational shortfalls cited in the NOVs, it is possible the NDEQ or the Nebraska Office of the Attorney General could assess fines against the Company as a result of having operated the plant with the equipment before it was operating in compliance. As a result of subsequent negotiations and problem solving in cooperation with the NDEQ, the Company believes that the possibility of any material penalties being assessed is remote.
15
Item 2. Management's Discussion and Analysis of Financial Condition and Results of Operations.
Forward Looking Statements
This quarterly report on Form 10-Q of NEDAK Ethanol, LLC (the “Company,” “we” or “us”) contains forward-looking statements that involve future events, our future performance and our expected future operations and actions. In some cases you can identify forward-looking statements by the use of words such as “may,” “should,” “anticipate,” “believe,” “expect,” “plan,” “future,” “intend,” “could,” “estimate,” “predict,” “hope,” “potential,” “continue,” or the negative of these terms or other similar expressions. These forward-looking statements are only our predictions and involve numerous assumptions, risks and uncertainties. Our actual results or actions may differ materially from these forward-looking statements for many reasons, including the following factors:
|
|
·
|
Overcapacity in the ethanol industry;
|
|
|
·
|
Fluctuations in the price and market for ethanol and distillers grains;
|
|
|
·
|
Availability and costs of products and raw materials, particularly corn and natural gas;
|
|
|
·
|
Our ability to obtain the debt and equity financing necessary to operate our plant and our ability to meet the associated covenants;
|
|
|
·
|
Changes in our business strategy, capital improvements or development plans;
|
|
|
·
|
Mechanical difficulties in operation of the plant;
|
|
|
·
|
Changes in the environmental regulations that apply to our plant site and operations and our ability to comply with environmental regulations;
|
|
|
·
|
Our ability to hire and retain key employees for the operation of the plant;
|
|
|
·
|
Changes in general economic conditions or the occurrence of certain events causing an economic impact in the agricultural, oil or automobile industries;
|
|
|
·
|
Changes in the weather and economic conditions impacting the availability and price of corn and natural gas;
|
|
|
·
|
Changes in federal and/or state laws (including the elimination of any federal and/or state ethanol tax incentives);
|
|
|
·
|
Changes and advances in ethanol production technology; and competition from alternative fuel additives;
|
|
|
·
|
Lack of transport, storage and blending infrastructure preventing ethanol from reaching high demand markets;
|
|
|
·
|
Our ability to generate free cash flow to invest in our business and service our debt;
|
|
|
·
|
Volatile commodity and financial markets;
|
|
|
·
|
Changes in interest rates and lending conditions; and
|
|
|
·
|
Results of our hedging strategies.
|
Our actual results or actions could and likely will differ materially from those anticipated in the forward-looking statements for many reasons, including the reasons described in this report. We are not under any duty to update the forward-looking statements contained in this report. We cannot guarantee future results, levels of activity, performance or achievements. We caution you not to put undue reliance on any forward-looking statements, which speak only as of the date of this report. You should read this report and the documents that we reference in this report and have filed as exhibits completely and with the understanding that our actual future results may be materially different from what we currently expect. We qualify all of our forward-looking statements by these cautionary statements.
Overview, Status and Recent Developments
We completed full startup of our ethanol plant in June 2009, and have the capacity to annually process approximately 17 million bushels of corn, through a dry milling process, into approximately 44 million gallons of ethanol per year. We also produce approximately 340,000 tons of wet distillers grains annually. We are currently operating at approximately 108% capacity.
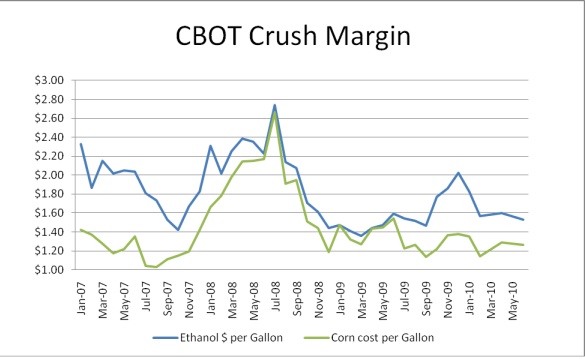
Our profitability is driven by the relationship between the cost of our primary input, corn, and the price at which we can sell our primary product, ethanol (“Crush Margin”). We use a conversion rate of 2.8 gallons produced per bushel of corn to report Crush Margins in this quarterly report. Our plant needs approximately 47,000 bushels of
16
corn per day as the feedstock for its dry milling process. The grain supply for our plant is obtained primarily from local markets. The price and availability of corn are subject to significant fluctuations depending upon a number of factors that affect commodity prices in general, including crop conditions, weather, governmental programs and foreign purchases. Often the market price of ethanol has tended to track the market price of corn. However, at the same time, the market price for energy (gasoline in particular) has provided a ceiling for the market price of ethanol without regard to the price of corn. We therefore anticipate that our plant’s profitability will be negatively impacted during periods of high corn prices, especially when the market prices for energy are low. As of July 31, 2010, our flat price cash bid for August 2010 corn was $3.49 a bushel.
Our original business plan and resulting equity and financing arrangements provided for a minimum of $10,000,000 of working capital for our commodities risk management practice. In the first half of 2010, we have been unable to take advantage of certain opportunities because of the lack of adequate working capital when the commodities market offered a Crush Margin that could have improved our financial results. We did experience profitable operations during those short periods when spot market pricing and costs for ethanol and corn yielded sales revenue and raw material costs with a profitable Crush Margin. As we have previously reported, adequate working capital and liquidity have not been available and as a result, we have been forced to remain in those spot markets and have generated losses from operations for the first half of 2010. These losses accumulated at a time when other ethanol producers were able to operate with profits from risk management activities which more than offset negative margins inherent in the spot markets for ethanol and corn.
Notwithstanding limitations on our risk management due to the lack of working capital, we have continued to address plant and equipment capability variables and improvements in operating and administrative cost structures which we expect to enhance our future financial performance.
Throughout 2009, our production capabilities were tested and we ended the year with only 82% of nameplate production, reflecting portions of 2009 during which certain equipment necessary for full production was not operable. By the end of the first quarter of 2010, we had addressed the equipment limitations and reached approximately 100% nameplate production for the quarter. During the second quarter of 2010, we achieved 108% nameplate production.
We have recently compared our cost structure to a peer group comprised of single site ethanol producers with similar capacities. After comparing that information throughout recent months of steady production at full capacity, we believe that our cost structure—excluding interest and depreciation—is generally competitive. As a new plant, we have an interest burden and depreciation burden that are not shared with older peers, but other costs are comparable throughout our operating statements.
Because we believe our cost structure is generally competitive, we have determined that achieving the capability to better manage commodity price risks is the most important factor of our business for the foreseeable future. Our efforts to date have focused on mitigation of commodity risk through traditional hedging matching corn purchases and ethanol sales contracts. However, our ability to effectively utilize these methods has been restricted by limited working capital, which we have attempted to remedy by acquiring additional liquidity and working capital through new equity or financing. At the end of the second quarter of 2010, we began discussions with several firms offering tolling agreements and other alternate marketing arrangements. In contrast to our current practice of contracting for the purchase of corn and sale of ethanol through separate companies, under a tolling agreement the tolling partner both provides the corn (and may provide the natural gas) and markets the ethanol and distillers grains produced. Payments to the ethanol plant under a tolling agreement vary. In some cases, the ethanol plant is paid a flat processing fee per gallon of ethanol produced. In other cases, the ethanol plant receives a payment based on the crush margin between the cost of inputs and value of outputs. We are also exploring marketing arrangements in which separate contracts for purchase of corn and sale of ethanol and distillers grains with a single company, along with an agreement to net the amounts due under all of the contracts. In both cases the ethanol plant benefits from reduced working capital needs because the value of inventory and accounts receivable are held by the tolling partner. In addition, the agreements can provide the ethanol producer access to additional risk management tools to be implemented by the marketing partner. We cannot provide any assurance whether we will undertake a tolling arrangement which is acceptable to us.
17
We believe that both product delivery infrastructure and demand for ethanol must improve in order to increase Crush Margins in the long term. Ethanol annual productive capacity has continually grown since 1980. According to the Renewable Fuels Association, in 2002 ethanol production in the U.S. surpassed two billion gallons, by 2007 production further increased to 6.5 billion gallons, and in 2009 it topped ten billion gallons. The Renewable Fuels Association indicates that total ethanol production capacity is now approximately 12 billion gallons. Currently, the renewable fuel standard (“RFS”) supports demand at volumes effectively equal to national production capacity. Furthermore, current ethanol prices should encourage blending demand since ethanol costs less than reformulated blend stock for oxygenate blending (“RBOB”). However, the physical distribution infrastructure does not allow for efficient movement of ethanol to all areas of the country. Also, a United States Environmental Protection Agency (“EPA”)-imposed limit of 10% blend for use in vehicles that are not designed as flex-fuel vehicles continues to depress the market price and demand for ethanol. We believe that these two obstacles will improve in the medium term.
The first half of 2010 (like the first half of 2009) did not follow the historical trends in the ethanol industry of summer increases of Crush Margins. Crush Margins were characteristically poor in the first quarter of the year, although unusually strong demand in the beginning of the first quarter 2010 supported a strong margin during part of our 2010 first quarter. However, winter weather later in the first quarter caused reduced driving demand for gasoline, the Chicago Board of Trade (“CBOT”) Crush Margin declined from $0.47 at December 31, 2009 to $0.29 as of April 30, 2010. At the end of the first quarter, the Crush Margin was $0.31. During the second quarter, there were two short periods during which Crush Margins increased temporarily, but each time the corn/ethanol gap closed again to historically low levels. We believe that the lower Crush Margins have caused primarily by continued uncertainty in the US economic recovery and slow increases of demand for automobile fuels. In the last days of the second quarter 2010, the EPA again delayed its ruling on whether to allow an increase from 10% to 12%-15% blend of ethanol in regular unleaded gasoline to be used in all vehicles. On June 30, 2010, the Crush Margin was $0.264.
In the following graph, the variance in the relationship between the CBOT cost of corn and the price of ethanol for the previous three plus years is demonstrated. It is clear that the industry margins began to deteriorate in the third quarter of 2007, which were exacerbated with the global economic distress of 2008. Some stability returned to the corn market in the third quarter of 2009, but continued distress in the general economy kept the Crush Margin tight until the end of 2009. In the fourth quarter of 2009, the Crush Margin improved for a short time as the fuel blenders ran low of ethanol inventories and some recovery in the larger economy pushed demand up, and around Thanksgiving it peaked around $0.65 and it continued strong clear into February 2010. This high Crush Margin in the first quarter of 2010 is remarkable because the Crush Margin is historically the lowest at this time of year in the ethanol industry.
The unusual 2010 market activity continued in the late spring of 2010, when the Crush Margin failed to increase with the traditional Memorial Day driving demand increase. We believe that the continuing weakness in the U.S. economy is currently keeping the Crush Margin excessively tight.
18
 |
Our secondary source of revenue is the sale of distillers grains. Because distillers grains compete with other protein-based animal feed products, the price of distillers grains may decline when the prices of competing feed products are low. Downward pressure on commodity prices, such as soybeans and corn, will generally cause the price of competing animal feed products to decline, resulting in downward pressure on the price of distillers grains, which will result in lower revenues for ethanol producers. In addition, local supply and demand can also impact prices of distillers grains in our market area. In 2009, a single large ethanol plant in northeast Nebraska started production. The new plant reportedly has the ability to dry its distillers grains, but the majority of the distillers grains produced by it during start up were sold as wet distillers grains. As a result, the price of wet distillers grains in eastern Nebraska has been depressed, which significantly impacted the price of wet distillers grains received by us. We currently anticipate an increase in revenues from the sale of distillers grains in 2010 over the level achieved in 2009, however no assurances can be made.
Other key factors affecting our profitability are federal and state laws requiring environmental and plant safety controls. Finally, with the development of full operations, we have undertaken, where possible, a risk management strategy hedging our corn and natural gas with the use of commodity derivative contracts to balance our risk of loss caused by market volatility. Our lack of working capital hindered our ability to hedge and therefore maximize Crush Margins in the second quarter of 2010, as we otherwise may have been able to lock in a higher Crush Margin for the second quarter of 2010 through such hedging in the first quarter of 2010. Accordingly, we believe our results of operations for the second quarter of 2010 were not as favorable due to these challenges.
Results of Operations
Throughout the first half of 2010, we have experienced significant improvements in production rates and consistency of throughput. In the month of June 2010, our plant achieved 111% of nameplate capacity with a method and standard operating procedure that provides us with some confidence that we will be able to continue to do so in the future.
Comparison year-to-year Second Quarter and First Half Production
|
Production
|
Second Quarter
|
2010 Increase / (Decrease)
|
First Half of Year
|
2010 Increase / (Decrease)
|
||
|
2010
|
2009
|
2010
|
2009
|
|||
|
Ethanol (000’s gallons)
|
11,903
|
6,426
|
5,477
|
23,037
|
14,018
|
9,019
|
|
Distillers Grain (000’s tons)
|
81
|
35
|
46
|
161
|
109
|
52
|
|
Corn (000’s bushels ground)
|
4,268
|
2,279
|
1,989
|
8,274
|
5,030
|
3,244
|
|
Yield (Denatured gal/BU)
|
2.79
|
2.82
|
(0.03)
|
2.78
|
2.79
|
(0.01)
|
19
Summary of Monthly 2010 year-to-date operations:
|
Ethanol Gallons Produced (000’s)
|
Nameplate
|
Corn Bushels Ground (000’s)
|
Denatured Yield (Gallons / Bushel)
|
Tons of Wet DGs Sold (000’s)
|
Tons of Dry DGs Sold (000’s)
|
||||||
|
2010
|
2009
|
% 2010
|
2010
|
2009
|
2010
|
2009
|
2010
|
2009
|
2010
|
2009
|
|
|
January
|
3,446
|
2,817
|
88%
|
1,240
|
1,051
|
2.78
|
2.68
|
25
|
22
|
0.4
|
0
|
|
February
|
3,563
|
2,347
|
101%
|
1,278
|
839
|
2.79
|
2.80
|
26
|
22
|
0.1
|
0
|
|
March
|
4,125
|
2,428
|
106%
|
1,490
|
861
|
2.77
|
2.82
|
26
|
24
|
2.1
|
0
|
|
April
|
3,475
|
2,961
|
90%
|
1,240
|
1,041
|
2.80
|
2.84
|
26
|
23
|
2.5
|
0
|
|
May
|
4,254
|
0
|
109%
|
1,542
|
0
|
2.76
|
0
|
25
|
0
|
1.6
|
0
|
|
June
|
4,174
|
3,465
|
111%
|
1,484
|
1,238
|
2.81
|
2.80
|
19
|
10
|
2.5
|
3
|
|
Total
|
23,037
|
14,018
|
101%
|
8,274
|
5,030
|
2.78
|
2.79
|
147
|
101
|
9.2
|
3
|
The first half of 2010 was different from the first half of 2009 due to many factors. Production in the first half of 2009 was depressed because we were in the final construction phase. The increased volume in the first half of 2010 is a 64% improvement over 2009. However, the 52,000 ton improvement during the first half 2010 compared to 2009 in distillers grains production is distorted because a portion of the output was dried. Of the 161,000 tons produced in the first half of 2010, approximately 11,000 tons were dry. Had that product been fully hydrated, the volume of production would also have reflected the 64% improvement.
Revenues, Cost of Goods Sold, General & Administrative Costs
Comparison of our second quarter 2010 and 2009 Statement of Operations Items:
|
Second Quarter
2010
|
Second Quarter 2010 Percentage
|
Second Quarter 2009
|
Second Quarter 2009 Percentage
|
||||||
|
Revenues
|
$
|
21,444,494
|
100%
|
$
|
11,978,882
|
100%
|
|||
|
Cost of Goods Sold
|
23,195,969
|
108%
|
14,827,531
|
124%
|
|||||
|
Gross Loss
|
(1,751,475)
|
(8%)
|
(2,848,649)
|
(24%)
|
|||||
|
General & Admin. Expenses
|
610,043
|
3%
|
732,291
|
6%
|
|||||
|
Operating Loss
|
(2,361,518)
|
(11%)
|
(3,580,940)
|
(30%)
|
|||||
|
Other Income (Expense), net
|
(856,987)
|
(4%)
|
(841,952)
|
(7%)
|
|||||
|
Net Loss
|
$
|
(3,218,505)
|
(15%)
|
$
|
(4,422,892)
|
(37%)
|
|||
Comparison of our first half 2010 and 2009 Statement of Operations Items:
|
First Half
2010
|
First Half 2010 Percentage
|
First Half 2009
|
First Half 2009 Percentage
|
||||||
|
Revenues
|
$
|
42,375,739
|
100%
|
$
|
25,285,079
|
100%
|
|||
|
Cost of Goods Sold
|
44,101,079
|
104%
|
30,709,680
|
121%
|
|||||
|
Gross Loss
|
(1,725,340)
|
(4%)
|
(5,424,601)
|
(21%)
|
|||||
|
General & Admin. Expenses
|
1,066,941
|
3%
|
1,242,819
|
5%
|
|||||
|
Operating Loss
|
(2,792,281)
|
(7%)
|
(6,667,420)
|
(26%)
|
|||||
|
Other Income (Expense), net
|
1,300,743
|
3%
|
(1,599,244)
|
(6%)
|
|||||
|
Net Loss
|
$
|
(1,491,538)
|
(4%)
|
$
|
(8,266,664)
|
(33%)
|
|||
Revenues
Our revenues from operations come from two primary sources: sales of ethanol and distillers grains. In first half of 2010, without freight reimbursements, our revenue from the sale of ethanol was approximately 82.5% of our total revenues, with the sale of distillers grains constituting 12%. The average selling price for ethanol in the second quarter 2010 was $0.24 less than the first quarter average of $1.69, to $1.45 per gallon. Throughout the first six months of 2010, our average price for ethanol was $1.55 per gallon, compared to $1.46 in the first six
20
months of 2009. We sold approximately 12.3 million gallons of ethanol in the second quarter of 2010 and 6.1 million gallons in the second quarter of 2009, and 22.8 million gallons in the first half of 2010, compared to 13.2 million gallons in the first half of 2010.
During the first six months of 2010, our pricing for both wet and dry distillers grains decreased from the first six months of 2009. Our wet distillers grains pricing per ton was $27.94 in the first quarter 2010 (compared to $30.96 in the first quarter 2009) and $26.09 in the second quarter 2010 (compared to $35.69 in the second quarter of 2009), with an average of $26.82 for the first half of 2010 (compared to $32.49 for the first half of 2009). Our dry distillers grains pricing in the first quarter 2010 was $95.53 per ton (we did not produce any dry distillers grains in the first quarter of 2009) to $87.74 per ton in the second quarter 2010 (compared to $118.15 in the second quarter 2009), with an average of $89.95 per ton in the first half of 2010 (compared to $118.15 in the first half of 2010).
There are two price/cost relationships that must improve for us to become profitable. Those two relationships are (i) the Crush Margin and (ii) the price of distillers grain compared to the costs that are not covered by the Crush Margin resulting from the sale of ethanol, net of the cost of corn. These two relationships are inherently the largest numbers in our statement of operations which in descending order are (i) ethanol sales, (ii) corn purchases, and (iii) distillers grains revenue. Because these relationships are primarily driven by market prices throughout, we believe the only way we can improve them is to increase our working capital to better hedge and forward contract, as discussed elsewhere in this report.
Cost of Goods Sold
|
Second Quarter 2010
|
Second Quarter 2009
|
||||||||
|
Amount
|
Percentage
|
Amount
|
Percentage
|
||||||
|
Revenues
|
$
|
21,444,494
|
100%
|
$
|
11,978,882
|
100%
|
|||
|
Cost of Goods Items:
|
|||||||||
|
Corn
|
15,262,689
|
71%
|
8,364,639
|
70%
|
|||||
|
Denaturant and Chemicals
|
1,468,241
|
7%
|
941,397
|
8%
|
|||||
|
Ethanol Freight Costs
|
1,926,882
|
9%
|
1,606,668
|
13%
|
|||||
|
Natural Gas and Electricity
|
1,732,657
|
8%
|
1,300,039
|
11%
|
|||||
|
Production Labor
|
636,602
|
3%
|
491,180
|
4%
|
|||||
|
Supplies and Maintenance
|
388,842
|
2%
|
264,260
|
2%
|
|||||
|
Property Tax
|
259,770
|
1%
|
330,000
|
3%
|
|||||
|
Depreciation
|
1,520,286
|
7%
|
1,529,348
|
13%
|
|||||
|
Total Cost of Goods Sold
|
$
|
23,195,969
|
108%
|
$
|
14,827,531
|
124%
|
|||
|
First Half 2010
|
First Half 2009
|
||||||||
|
Amount
|
Percentage
|
Amount
|
Percentage
|
||||||
|
Revenues
|
$
|
42,375,739
|
100%
|
$
|
25,285,079
|
100%
|
|||
|
Cost of Goods Items:
|
|||||||||
|
Corn
|
28,018,863
|
66%
|
17,472,787
|
69%
|
|||||
|
Denaturant and Chemicals
|
2,738,700
|
6%
|
1,850,871
|
7%
|
|||||
|
Ethanol Freight Costs
|
3,653,723
|
9%
|
3,410,372
|
13%
|
|||||
|
Natural Gas and Electricity
|
4,173,482
|
10%
|
3,006,839
|
12%
|
|||||
|
Production Labor
|
1,268,289
|
3%
|
1,062,178
|
4%
|
|||||
|
Supplies and Maintenance
|
682,203
|
2%
|
522,383
|
2%
|
|||||
|
Property Tax
|
544,770
|
1%
|
330,000
|
1%
|
|||||
|
Depreciation
|
3,021,049
|
7%
|
3,054,250
|
12%
|
|||||
|
Total Cost of Goods Sold
|
$
|
44,101,079
|
104%
|
$
|
30,709,680
|
121%
|
|||
Our cost of goods sold as a percentage of revenues in the second quarter of 2010 was improved, at 108% from 124% in the second quarter of 2009. This improvement was primarily from lower corn costs in 2010. In the startup months of early 2009, we were forced to purchase corn with very little forward planning because of the uncertain schedule as we drew to the end of the construction period. This caused the cost of corn to increase,
21
which continued all through the spring and summer until the harvest season in the fall, when the annual cycle of corn cost drops to its seasonal low point.
Corn is the largest component of our cost structure. Our cost of corn per gallon of ethanol produced averaged $1.21 in the first half of 2010 and $1.28 in the second quarter of 2010, compared to $1.25 in the first half of 2009 and $1.30 in the second quarter of 2009. This relationship is almost entirely driven by the relative average cost of corn in the periods, which decreased in 2010. Yield will affect this relationship, but as demonstrated in the tables above, there was very little difference between the 2009 and 2010 yields, with even an inverse relationship with the 2009 yield which was better than 2010 because of the quality of the corn crops in those years.
Other cost of goods improvements in both the second quarter and the first half 2010 versus the same periods of 2009 resulted from our increase in production volume in 2010 compared to two-thirds capacity in the first half of 2009, and we had no production in May, 2009. For example, full capacity in 2010 improved the ratio of ethanol freight costs to revenues, from 13% in the both the second quarter and first half of 2009 to 9% in the same periods of 2010. Approximately $1,000,000 of this cost is in our annual fixed lease costs for rail cars. A significant portion of our fleet was idle because of our reduced production in 2009, and we used all of our fleet in the first half of 2010.
Property tax increased in the first half of 2010 and supplies and maintenance increased in both the second quarter and the first half of 2010, over the same periods of 2009 due to the timing of our plant being turned over to us by our contractor, Delta-T Corporation (“Delta-T”) in 2009.
General and Administrative Expenses
|
Second Quarter 2010
|
Second Quarter 2009
|
||||||||
|
Amount
|
Percentage
|
Amount
|
Percentage
|
||||||
|
Revenues
|
$
|
21,444,494
|
100%
|
$
|
11,978,882
|
100%
|
|||
|
Administrative Human Resources Costs
|
261,857
|
1%
|
238,074
|
2%
|
|||||
|
Professional Fees
|
206,086
|
1%
|
289,071
|
2%
|
|||||
|
Insurance
|
88,981
|
0%
|
108,956
|
1%
|
|||||
|
Other
|
53,119
|
0%
|
96,190
|
1%
|
|||||
|
Total General and Administrative Expenses
|
$
|
610,043
|
3%
|
$
|
732,291
|
6%
|
|||
|
First Half 2010
|
First Half 2009
|
||||||||
|
Amount
|
Percentage
|
Amount
|
Percentage
|
||||||
|
Revenues
|
$
|
42,375,739
|
100%
|
$
|
25,285,079
|
100%
|
|||
|
Administrative Human Resources Costs
|
481,216
|
1%
|
461,981
|
2%
|
|||||
|
Professional Fees
|
330,285
|
1%
|
450,818
|
2%
|
|||||
|
Insurance
|
177,308
|
0%
|
169,921
|
1%
|
|||||
|
Other
|
78,132
|
0%
|
160,099
|
1%
|
|||||
|
Total General and Administrative Expenses
|
$
|
1,066,941
|
3%
|
$
|
1,242,819
|
5%
|
|||
Administrative and general expenses have been reduced across the board from the second quarter of 2009 to the second quarter of 2010 with one exception—human resources costs. Health insurance, payroll taxes, and miscellaneous administrative costs increased as we moved to full production levels in 2010. However, despite the increased aggregate cost, because the plant increased to full production with significantly increased revenues, people costs compared to revenues declined by nearly half from 1.8% to 1.1% of total revenues.
Professional fees also declined in the second quarter 2010 compared to 2009, primarily because we resolved a dispute with our construction contractor, as well as a stabilization of operations in our second year of production. Insurance costs declined in the second quarter of 2010 with the elimination of builder’s risk insurance costs, and
22
other costs declined in the second quarter of 2010 because we incurred higher startup costs in the second quarter of 2009.
Environmental Compliance
Our operations are subject to environmental laws and regulations adopted by various governmental entities in the jurisdiction in which we operate. These laws require us to investigate and remediate the effects of the release or disposal of materials. We have received Notices of Violation (“NOV”) from the Nebraska Department of Environmental Quality (“NDEQ”) arising from failures of emission equipment designed and installed by Delta-T. That equipment includes the plant’s regenerative thermal oxidizer (“RTO”) used to control emissions from the dryer and the CO2 Scrubber used to control emissions from the ethanol process. The RTO had not performed according to the design specified in our contract with Delta-T, and we continue to assess methods to resolve the problem. The CO2 Scrubber failed in original compliance testing, and equipment modifications and process adjustments were made, including chemical injection, to remediate the issue. During the startup operations of the plant beginning in January 2009 and continuing through the date of the original compliance testing, Delta-T had operated the plant without these modifications and as a result, we received an NOV in January 2010 which asserted that due to the failure of the CO2 Scrubber, our operation of the plant violated the operating permit issued by the NDEQ. Accordingly, while we believe that we have resolved all of the operational shortfalls cited in the NOVs, it is possible the NDEQ or the Nebraska Office of the Attorney General could assess fines against us as a result of having operated the plant with the equipment before it was operating in compliance. As a result of subsequent negotiations and problem solving in cooperation with the NDEQ, we believe that the chance that any material penalties being assessed is remote.
Construction Contract
We were a party to an Engineering, Procurement and Construction Services Fixed Price Contract dated August 9, 2006 with Delta-T (the “Delta-T Contract”). The parties amended the Delta-T Contract on September 1, 2009, which resolved asserted claims by both parties and provided, among other things, that we would receive $3,995,000, which, less an estimated $228,000 for costs expected to be incurred, was recognized as a litigation settlement gain in other income in the fourth quarter of 2009. On March 19, 2010, we, Delta-T, and its affiliates entered into a Settlement Agreement and Mutual Release (the “Settlement Agreement”). The Settlement Agreement settled all outstanding disputes among us, Delta-T and its affiliate relating to the Delta-T Contract and construction of our ethanol plant. The receipt of the $3,000,000 under the Settlement Agreement was recognized as a gain in other income during the three months ended March 31, 2010.
Liquidity and Capital Resources
The comparison of our cash activities during both the second quarters and the first halves of 2010 and 2009 is characterized by our status as a startup company focused on financing receivables and inventory in 2009 to an operating company requiring ordinary course payables, inventories and receivables in 2010. In the first half of 2009, significant operating losses of more than $8 million resulted in a net consumption of cash of $2.4 million, compared to more modest operating losses in the first half of 2010 which resulted in a net consumption of cash of $287,000.
Comparing the first halves of 2009 and 2010, there is significant change from settlements with Delta-T, but the largest difference in the changing cash position of the Company is in the change in accounts payable. In the first half of 2009, during startup of the Company, corn producers allowed the Company terms that provided for payment of corn 24 days after delivery. That contributed $4.8 million of working capital to fund corresponding increases in receivables and inventories. There were ordinary fluctuations in the levels of these items in the current six month period.
We may continue operating at negative margins, depending on commodity prices. If we are unable to generate sufficient cash flows from operations or obtain additional debt or equity financing, our ability to continue operations may be materially hindered, including our ability to enter into derivative positions, and we may be forced to continue purchasing our corn and marketing our ethanol at spot prices, which would continue to expose us to market volatility and associated risks. The unaudited financial statements included in this report have been
23
prepared assuming that we will continue as a going concern. Until we are able to obtain additional working capital from operations or outside sources and modify our credit agreement covenants or refinance our construction loan, there is substantial doubt as to whether we can continue to operate as a going concern.
We have limited ability to use traditional hedging strategies for price risk management so we are exploring the use of tolling agreements and other alternate marketing arrangements under which the tolling partner both provides the corn (and may provide the natural gas) and markets the ethanol and distillers grains produced. We expect that this would reduce the working capital needed because the value of inventory and accounts receivable may be held by the tolling partner. In addition, the agreements may provide the ethanol producer access to additional risk management tools to be implemented by the marketing partner. We cannot provide any assurance whether we will undertake a tolling arrangement which is acceptable to us.
Credit Facility
We entered into loan agreements (collectively, the “Loan Agreements”) with AgCountry Farm Credit Services, FLCA (“Lender”) regarding our senior secured credit facility, including a Master Credit Agreement dated February 14, 2007, as amended. As of June 30, 2010, we have borrowed $42,500,000 under the loan facility, which consists of a multiple advance construction loan; and the conversion to a permanent ten year term loan facility, a portion of which can be further converted to a $10 million revolving term loan, subject to certain conditions.
Under the Loan Agreements, we made certain customary representations and are subject to customary affirmative and negative covenants, including restrictions on our ability to incur debt, create liens, dispose of assets, pay distributions and to make capital expenditures, and customary events of default (including payment defaults, covenant defaults, cross defaults, construction-related defaults and bankruptcy defaults).
Affirmative financial covenants under the Loan Agreements require minimum working capital of $6,000,000, minimum current ratio of 1.20:1.00, minimum tangible net worth of $41,000,000, minimum owners’ equity ratio of 50%, and a minimum fixed charge coverage ratio of 1.25:1.00. As of June 30, 2010, we were not in compliance with the working capital covenants (working capital was $(3,685,381) exclusive of the debt reclassification), the current ratio requirement (a current ratio of 0.73:1.00 without debt reclassification), the tangible net worth requirement (tangible net worth was $38,844,143) and the fixed charge coverage ratio (intended to be an annual measure, but using year to date measures and six months of principal payment that ratio is 0.67:1.00). Our failure to meet such covenants over the last year, among other defaults, resulted in all debt under the Loan Agreements being classified as current liabilities.
On August 6¸2010, we and Lender executed a Sixth Supplement and Forbearance Agreement to the Master Credit Agreement (the “Sixth Supplement”), under which we agreed that Lender could apply the $3,945,087 it holds as collateral under the Loan Agreements to our current obligations under the Loan Agreements, including monthly payments, penalties and interest. We also agreed to provide the Lender with a comprehensive plan within 30 days of the date of the Sixth Supplement to resolve our working capital deficiencies discussed above by the end of the forbearance period. In exchange for the foregoing, Lender agreed to refrain from exercising its rights under the Loan Agreements until the earlier of October 1, 2010 or the date of any default under the Sixth Supplement.
On February 19, 2010 we applied to the United Stated Department of Agriculture (“USDA”) for a Business and Industries Guaranteed Loan (the “B&I Working Capital Loan”) of $5,000,000 for working capital. We and Lender have received conditional approval from USDA for the B&I Working Capital Loan during the second quarter, subject to our reaching a 40% net worth ratio and obtaining final approval of the loan by the Lender. The Lender has also indicated it will require certain other conditions, including an additional capital contribution.
We are actively negotiating with the Lender to convert the construction financing to operating lines and to modify the loan covenants to reflect our status after the changes of the last five years. We cannot predict whether the Lender will agree to modify any of those covenants. To the extent we are unable to modify those covenants it may not be possible to meet them unless the commodities markets we operate in move in favorable directions. Until we are able to comply with the covenants under the Loan Agreements, the Lender may take a variety of actions, including immediately accelerating the repayment of all outstanding debt under the Loan Agreements.
24
Such acceleration could entitle the Lender to liquidate all of our assets, and would likely lead to our bankruptcy, reorganization or winding up of our affairs. In light of continuing poor margins in the ethanol industry, the Lender has indicated the Company should focus on mitigation of risk and obtaining additional capital.
TIF Note
We received a tax increment financing note (the “TIF Note”) in 2007, which serves as collateral for a loan with an outstanding balance of $6,579,000 (the “Loan”) as of June 30, 2010. We received the net proceeds of the Loan in the amount of $4,939,925 pursuant to a Loan Agreement we entered into with the lead lending agent, Arbor Bank (“TIF Lender”). On July 6, 2009, the TIF Lender notified us that our debt service reserve fund under the Loan was deficient, constituting a default. The primary reason for this default was the extended delays and losses associated with startup of the plant. In order to resolve the default, we and the TIF Lender entered into a Forbearance Agreement dated December 31, 2009 (the “Agreement”). Under the Agreement, the TIF Lender refrained from exercising any of its rights or remedies under the TIF Loan, including acting on our failure to maintain a sufficient amount in the debt service reserve fund until the earlier of (i) March 31, 2010 or (ii) 30 days following the approval of the proposed B&I Working Capital Loan.
We failed to extend the Agreement or reach other arrangements containing similar forbearance obligations by May 15, 2010, and we received a Notice of Default dated June 30, 2010 from the TIF Lender indicating that we were in default under the TIF Note due to nonpayment of $464,768 owing on June 1, 2010, and that the Debt Service Reserve Fund remained deficient by an amount of $588,553. As a result of such defaults, the TIF Lender may (i) charge us an interest rate of 4% over the interest rate the Lender would otherwise be able to charge, (ii) charge us a late charge of 5% of a payment if the payment is more than 10 days overdue, (iii) accelerate the entire amount of principal outstanding under the TIF Loan, and (iv) exercise any other rights available to it under Agreement or at law. The payment due on June 1, 2010 was withheld. Due to these defaults, the TIF Loan was classified in current liabilities.
Plan of Operations for the Next 12 Months
In addition to the organizational, financial and administrative objectives discussed above, we expect to spend at least the next 12 months focused on plant operations, including three primary functions: (i) management of cost effective purchasing of inputs for our production process, (ii) optimizing the production process in such a way as to minimize manufacturing costs, and (iii) monitoring and evaluating the performance of our marketing agents to ensure effective marketing of our ethanol and distillers grains. In addition, we are in discussions with several firms offering tolling agreements and other alternate marketing arrangements to improve our ability to manage commodity price risk (see description below.)
Market Risk
We are exposed to the impact of market fluctuations associated with commodity prices. We anticipate the use of derivative financial instruments as part of an overall strategy to manage market risk, once we have sufficient working capital and liquidity to manage such a strategy. We intend, when able, to use cash, futures and option contracts to hedge changes to the commodity prices of corn, natural gas and gasoline. We will not enter into these derivative financial instruments for trading or speculative purposes, nor will we designate these contracts as cash flow or fair value hedges for accounting.
As an alternative to traditional hedging strategies, we are exploring the use of tolling agreements and other alternate marketing arrangements. In contrast to our current practice of contracting for the purchase of corn and sale of ethanol through separate companies, under a tolling agreement the tolling partner both provides the corn (and may provide the natural gas) and markets the ethanol and distillers grains produced. Payments to the ethanol plant under a tolling agreement vary, ranging from payment of a flat processing fee per gallon of ethanol produced to a payment based on the crush margin between the cost of inputs and value of outputs. We are also exploring marketing arrangements in which separate contracts for purchase of corn and sale of ethanol and distillers grains with a single company, along with an agreement to net the amounts due under all of the contracts. In both cases the ethanol plant benefits from reduced working capital needs because the value of inventory and accounts receivable are held by the tolling partner. In addition, the agreements may provide the ethanol producer access to
25
additional risk management tools to be implemented by the marketing partner. We cannot provide any assurance whether we will undertake a tolling arrangement which is acceptable to us.
Commodity Price Risk
We are exposed to market risk with respect to the price of ethanol, our principal product, and the price and availability of corn, the principal commodity we use to produce ethanol. Our other primary product is distillers grains, and we are also subject to market risk with respect to its price. In general, rising ethanol and distillers grains prices should result in higher profit margins, and therefore represent favorable market conditions. Ethanol and distillers grains prices are, however, influenced by various factors beyond the control of our management, including the supply and demand for gasoline, the availability of substitutes and the effects of laws and regulations.
Ethanol revenues are controlled in the market place. Our risk management team meets weekly and assesses the balance of forward purchases of corn with forward sales of ethanol and the risks associated with the trends in the marketplace. In recent months, the price for ethanol has closely followed the market prices of corn. The price of unleaded gasoline is also a primary concern in that if the price of ethanol rises above the RBOB price, then the economies do not allow favorable margins for the discretionary blenders and demand for ethanol falls.
Distillers grains are primarily marketed into the local cattle feed market. Historically, the summer months bring the lowest seasonal demand for this product. Consistent production volumes and quality are required to maximize the pricing advantage potential of our favorable geography near large numbers of cattle feeders. Now that we have control of the plant and production, we hope to establish a reputation and relationships with those cattle feeders that will help mitigate the seasonal variability in future years, though ultimately demand for distillers grains is not in our control.
Ethanol, corn and energy markets have demonstrated a complex relationship in the past 24 months. Generally speaking, we believe that the price of energy provides a ceiling value for ethanol, particularly in the price of crude oil as driven into the price of unleaded gasoline, otherwise known in the markets as RBOB. However, except when affected by that upward limit, we believe that the price of ethanol follows the price of corn with a high degree of correlation, with the Crush Margin dictated by the market relationships of supply and demand. As discussed above, that Crush Margin has been squeezed in recent months by the oversupply of ethanol capacity, but can be significantly affected by any of several factors, including the relationship of distribution infrastructure and its limits to handle the volume of ethanol that could be produced by the existing capacity while limited by the EPA to 10% blends for regular unleaded gasoline. Also affecting the Crush Margin is the price of oil. In mid 2008, when oil was above $140 a barrel, the cost of RBOB allowed profitable blending of ethanol and Crush Margin, even when corn costs were above $6 and $7 a bushel.
The availability and price of corn is subject to wide fluctuations due to various unpredictable factors which are beyond our control, including weather conditions, farmer planting decisions, governmental policies with respect to agriculture and local, regional, national and international trade, demand and supply. At the end of June 2010, our year-to-date corn cost as a percentage of ethanol sales was 79%, which was a 12% improvement from 91% over the first half of 2009 and 66% of gross sales, an improvement of 3% from 69% in the first half of 2009.
We expect the annual impact on our results of operations due to a $0.30 per bushel fluctuation in market prices for corn to be approximately $4,890,000, or $0.11 per gallon, assuming our plant continues to operate at 100% name plate capacity (production of 44,000,000 gallons of ethanol annually). We also expect a $0.20 per gallon fluctuation in ethanol market prices to impact annual net income by approximately $8,800,000, a $0.20 per gallon fluctuation in denaturant market prices to impact annual net income by approximately $180,000, and a $0.50 per BTU fluctuation in natural gas market prices to impact annual net income by approximately $630,000.
We seek to minimize the risks from fluctuations in the prices of corn and ethanol through the use of derivative instruments, provided we have sufficient working capital to enter into such instruments and cover any margin requirements necessary to maintain such positions. In practice, as markets move, we will seek to actively manage our risk and adjust hedging strategies as appropriate, provided we have sufficient working capital for such strategies. Although we believe our hedge positions accomplish an economic hedge against our future purchases,
26
they are not designated as such for hedge accounting purposes, which would match the gain or loss on our hedge positions to the specific commodity purchase being hedged. We mark to market our hedge positions, which means as the current market price of our hedge positions changes, the gains and losses are immediately recognized in our cost of goods sold. The immediate recognition of hedging gains and losses can cause net income to be volatile from quarter to quarter due to the timing of the change in the value of the derivative instruments relative to the cost and use of the commodity being hedged. We have recorded gains on derivative instruments of $18,304 and $0 for the three months ended June 30, 2010 and 2009, respectively.
In the event we do not have sufficient working capital to enter into hedging strategies to manage our risks, we may be forced to continue purchasing our corn and marketing our ethanol at spot prices and as a result, we could continue to be exposed to market volatility and risk.
Application of Critical Accounting Estimates
Management uses estimates and assumptions in preparing these financial statements in accordance with Generally Accepted Accounting Principles (“GAAP”). Those estimates and assumptions affect the reported amounts of assets and liabilities, the disclosure of contingent assets and liabilities, and the reported revenues and expenses. We use estimates and assumptions in accounting for the following significant matters, among others: the allowance for doubtful accounts, useful lives of property and equipment, the valuation of inventory, and inventory purchase commitments, and long-lived asset impairments including the assumptions used to estimate future cash flows, the ability to raise capital, and the ability to comply with certain provisions within the Loan Agreements. Actual results may differ from previously estimated amounts, and such differences may be material to our financial statements. We periodically review estimates and assumptions, and the effects of revisions are reflected in the period in which the revision is made. The following paragraph discusses the most significant estimating process in our financial statements.
Long-lived assets, such as property and equipment, are reviewed for impairment whenever events or changes in circumstances indicate that the carrying amount of an asset may not be recoverable. In accordance with the our policy for evaluating impairment of long-lived assets, we have estimated that the projected future undiscounted cash flows from operations of these facilities exceed their carrying value at June 30, 2010; therefore no impairment loss was recognized. In determining the projected future undiscounted cash flows, we made significant assumptions concerning the future viability of the ethanol industry, the future price of corn in relation to the future price of ethanol and the overall demand for ethanol in relation to production and supply capacity. Changes in the estimated future prices of corn and ethanol used within the analysis can have a significant effect on the determination of impairment given the sensitivity of the analysis. In addition to the impairment analysis performed, we believe that the following factors also indicate that no impairment of long-lived assets has occurred. First, our short time in operation under distress from construction delays, equipment failures and startup complications provides inadequate cost history to assess with reasonable levels of certainty what the cost structure will be going forward. Second, the economic structure of the distillers grain markets has been excessively volatile throughout initial plant operations. The cash flow to be generated from sales of distillers grains is a critical requirement for us to generate future profitability. Third, the economic recession in the U.S. during the entire startup and operation of the plant further complicated the measurement of our ability to generate future cash flows that are required to document material impairment to the carrying value of our plant assets. In the impairment analysis, we assumed (i) future distillers grain revenue will be 13% of gross revenue, (ii) future corn costs will be 75% of ethanol revenue, and (iii) these relationships drive net profitability estimates for 2010 of 3% of gross revenues. If we fail to realize these economic improvements, it is likely in the future, that asset values will need to be adjusted to reflect impaired value because we would be unable to forecast future cash flows sufficient to carry those values.
Off-Balance Sheet Arrangements
We do not have any off-balance sheet arrangements that have or are reasonable likely to have a current or future material effect on our financial condition, results of operations or liquidity.
27
Item 4. Controls and Procedures.
Our management, including our President (our principal executive officer), Jerome Fagerland, along with our Treasurer (our principal financial officer), Timothy Borer, have reviewed and evaluated the effectiveness of our disclosure controls and procedures (as defined in Rule 15d-15 under the Exchange Act of 1934), as of June 30, 2010. Based upon this review and evaluation, these officers believe that our disclosure controls and procedures are presently effective in ensuring that material information related to us is recorded, processed, summarized and reported within the time periods required by the forms and rules of the Securities and Exchange Commission.
Changes in Internal Control Over Financial Reporting
Management has evaluated, with the participation of our President, any change in our internal control over financial reporting (as defined in Rules 13a-15(f) and 15d-15(f) under the Exchange Act of 1934) that occurred during the period covered by this Quarterly Report on Form 10-Q. There was no change in our internal control over financial reporting identified in that evaluation that occurred during the fiscal period covered by this Quarterly Report on Form 10-Q that has materially affected, or is reasonably likely to materially affect, our internal controls over financial reporting.
PART II
Item 1. Legal Proceedings.
None.
Item 2. Unregistered Sales of Equity Securities and Use of Proceeds.
None.
Item 3. Defaults Upon Senior Securities.
In addition to certain other defaults previously reported, as of June 30, 2010, we were not in compliance with the working capital covenants (working capital was $(3,685,381) exclusive of the debt reclassification), the current ratio requirement (a current ratio of 0.73:1.00 without debt reclassification), the tangible net worth requirement (tangible net worth was $38,844,143) and the fixed charge coverage ratio (intended to be an annual measure, but using year to date measures and six months of principal payment that ratio is 0.67:1.00) required under the Loan Agreements. Following execution of the Sixth Supplement, principal and interest due have been paid and there are no remaining payment deficiencies.
We failed to extend the Agreement with TIF Lender or reach other arrangements containing similar forbearance obligations by May 15, 2010, and we received a Notice of Default dated June 30, 2010 from the TIF Lender indicating that we were in default under the TIF Note due to nonpayment of $464,768 owing on June 1, 2010, and that the Debt Service Reserve Fund remained deficient by an amount of $588,553.
Item 4. (Removed and Reserved)
28
Item 5. Other Information.
The Company held its annual Members’ meeting on June 16, 2010 (the “Meeting”), at which Paul Corkle, Paul Seger, Kirk Shane, Todd Shane and Gerald Winings were each re-elected to serve as Directors until the 2013 annual Members’ meeting. The following Directors who were not up for re-election at the Meeting continue their respective terms: Jeff Lieswald, Kenneth Osborne, Steve Dennis, Timothy Borer, Richard Bilstein, Jerome Fagerland, Clayton Goeke, Robin Olson and Everett Vogel. The Directors re-elected at the Meeting received votes respecting their re-election as follows:
|
Nominee
|
Votes For
|
Votes Against
|
Abstentions
|
|
Paul Corkle
|
2090.4 | 20 | 0 |
|
Paul Seger
|
2091.4 | 19 | 0 |
|
Kirk Shane
|
2091.4 | 19 | 0 |
|
Todd Shane
|
2091.4 | 19 | 0 |
|
Gerald Winings
|
2091.4 | 19 | 0 |
On August 6¸2010, we and Lender executed the Sixth Supplement, under which we agreed that Lender could apply the $3,945,087 it holds as collateral under the Loan Agreements to our current obligations under the Loan Agreements, including monthly payments, penalties and interest. We also agreed to provide the Lender with a comprehensive plan within 30 days of the date of the Sixth Supplement to resolve our working capital deficiencies discussed above by the end of the forbearance period. In exchange for the foregoing, Lender agreed to refrain from exercising its rights under the Loan Agreements until the earlier of October 1, 2010 or the date of any default under the Sixth Supplement.
Item 6. Exhibits.
|
10.1
|
Sixth Supplement and Forbearance Agreement to the Master Credit Agreement dated July 30, 2010 by and among NEDAK Ethanol, LLC and AgCountry Farm Credit Services, FLCA.
|
|
31.1
|
Rule 13a-14(a)/15d-14(a) Certification (pursuant to Section 302 of the Sarbanes-Oxley Act of 2002) executed by Chief Executive Officer.
|
|
31.2
|
Rule 15d-14(a) Certification (pursuant to Section 302 of the Sarbanes-Oxley Act of 2002) executed by Chief Financial Officer.
|
|
32.1
|
Rule 15d-14(b) Certifications (pursuant to Section 906 of the Sarbanes-Oxley Act of 2002) executed by the Chief Executive Officer.
|
|
32.2
|
Rule 15d-14(b) Certifications (pursuant to Section 906 of the Sarbanes-Oxley Act of 2002) executed by the Chief Financial Officer.
|
29
SIGNATURES
In accordance with the requirements of the Exchange Act, the Registrant has caused this report to be signed on its behalf by the undersigned, thereunto duly authorized.
|
NEDAK ETHANOL, LLC
|
||
|
Date: August 13, 2010
|
/s/ Jerome Fagerland
|
|
|
Jerome Fagerland, President
|
||
|
Date: August 13, 2010
|
/s/ Timothy Borer |
|
|
Timothy Borer, Treasurer and Secretary
|
||
30