Attached files
| file | filename |
|---|---|
| EX-23.2 - EXHIBIT 23.2 - STEINWAY MUSICAL INSTRUMENTS INC | a2197135zex-23_2.htm |
| EX-31.1 - EXHIBIT 31.1 - STEINWAY MUSICAL INSTRUMENTS INC | a2197135zex-31_1.htm |
| EX-23.1 - EXHIBIT 23.1 - STEINWAY MUSICAL INSTRUMENTS INC | a2197135zex-23_1.htm |
| EX-32.1 - EXHIBIT 32.1 - STEINWAY MUSICAL INSTRUMENTS INC | a2197135zex-32_1.htm |
| EX-31.2 - EXHIBIT 31.2 - STEINWAY MUSICAL INSTRUMENTS INC | a2197135zex-31_2.htm |
| EX-21.1 - EXHIBIT 21.1 - STEINWAY MUSICAL INSTRUMENTS INC | a2197135zex-21_1.htm |
| EX-32.2 - EXHIBIT 32.2 - STEINWAY MUSICAL INSTRUMENTS INC | a2197135zex-32_2.htm |
UNITED STATES SECURITIES AND EXCHANGE COMMISSION
Washington, D.C. 20549
FORM 10-K
ý |
ANNUAL REPORT PURSUANT TO SECTION 13 OR 15(d) OF THE SECURITIES EXCHANGE ACT OF 1934 FOR THE FISCAL YEAR ENDED DECEMBER 31, 2009 |
|
o |
TRANSITION REPORT PURSUANT TO SECTION 13 OR 15(d) OF THE SECURITIES EXCHANGE ACT OF 1934 |
COMMISSION FILE NUMBER 001-11911
STEINWAY MUSICAL INSTRUMENTS, INC.
(Exact name of registrant as specified in its charter)
| DELAWARE | 35-1910745 | |
| (State or Other Jurisdiction of Incorporation or Organization) | (I.R.S. Employer Identification No.) | |
800 South Street, Suite 305, Waltham, Massachusetts (Address of Principal Executive Offices) |
02453 (Zip Code) |
|
Registrant's telephone number, including area code (781) 894-9770 |
||
Securities registered pursuant to Section 12(b) of the Act:
| Title of each class |
Name of each exchange on which registered |
|
|---|---|---|
| Ordinary Common Shares, $.001 par value | New York Stock Exchange |
Securities registered pursuant to Section 12(g) of the Act: None
Indicate
by check mark whether the registrant is a well-known seasoned issuer, as defined in Rule 405 of the Securities Act.
Yes o No ý
Indicate by check mark if the registrant is not required to file reports pursuant to Section 13 or 15(d) of the Act. Yes o No ý
Indicate by check mark whether the registrant (1) has filed all reports required to be filed by Section 13 or 15(d) of the Securities Exchange Act of 1934 during the preceding 12 months (or for such shorter period that the registrant was required to file such reports), and (2) has been subject to such filing requirements during the past 90 days. Yes ý No o
Indicate by check mark whether the registrant has submitted electronically and posted on its corporate Website, if any, every Interactive Data File required to be submitted and posted pursuant to Rule 405 of Regulation S-T (§232.405 of this chapter) during the preceding 12 months (or for such shorter period that the registrant was required to submit and post such files). Yes o No o
Indicate by check mark if disclosure of delinquent filers pursuant to Item 405 of Regulation S-K is not contained herein, and will not be contained, to the best of registrant's knowledge, in definitive proxy or information statements incorporated by reference in Part III of the Form 10-K or any amendment to this Form 10-K. o
Indicate by check mark whether the registrant is a large accelerated filer, an accelerated filer, a non-accelerated filer, or a smaller reporting company.
| Large accelerated filer o | Accelerated filer ý | Non-accelerated filer o | Smaller Reporting Company o |
Indicate by check mark whether the registrant is a shell company (as defined in Rule 12b-2 of the Exchange Act). Yes o No ý
The aggregate market value of the Common Stock held by non-affiliates of the registrant was $42,891,731 as of June 30, 2009.
Number of shares of Common Stock outstanding as of March 8, 2010: |
Class A | 477,952 | ||
|
Ordinary | 9,817,816 | ||
|
Total | 10,295,768 |
DOCUMENTS INCORPORATED BY REFERENCE
Part III – Items 10-14 – Definitive Proxy Statement of the Registrant to be filed pursuant to Regulation 14A, Parts I-IV – Final Prospectus of the Registrant dated August 1, 1996 filed pursuant to Rule 424(b).
Note Regarding Forward-Looking Statements
Certain statements contained throughout this Annual Report on Form 10-K are "forward-looking statements" within the meaning of Section 21E of the Securities Exchange Act of 1934, as amended. These forward-looking statements represent our present expectations or beliefs concerning future events. We caution readers that such statements are necessarily based on certain assumptions that are subject to risks and uncertainties, which could cause actual results to differ materially from those indicated in this report. These risk factors include, but are not limited to, the factors discussed in Item 1A of this report. We encourage investors to read Item 1A carefully. Undue reliance should not be placed on the forward-looking statements contained in this report. These statements, like all statements contained in this report, speak only as of the date of this report (unless another date is indicated) and we undertake no obligation to update or revise the statements except as required by law.
Note Regarding Incorporation By Reference
The Securities and Exchange Commission ("SEC") allows us to disclose certain information by referring the reader to other documents we have filed with the SEC. The information to which we refer is "incorporated by reference" into this Annual Report on Form 10-K. Please read that information.
Company History
Steinway Musical Instruments, Inc., through its wholly owned subsidiaries, is a global leader in the design, manufacture, marketing and distribution of high quality musical instruments. We are the largest domestic manufacturer of musical instruments. Whenever we refer to the "Company" or to "us," or use the terms "we" or "our" in this annual report, we are referring to Steinway Musical Instruments, Inc. and its subsidiaries.
Steinway Musical Instruments, Inc., formerly Selmer Industries, Inc., was incorporated in 1993. We are a Delaware corporation with our principal executive offices located at 800 South Street, Suite 305, Waltham, Massachusetts 02453, and our telephone number is (781) 894-9770. Through our corporate website, www.steinwaymusical.com, we provide access free of charge to all of our filings with the SEC, including our Annual Reports on Form 10-K, quarterly reports on Form 10-Q, and current reports on Form 8-K. These reports are available immediately following filing with the SEC. Information contained on or connected to our website is not incorporated by reference into this Annual Report on Form 10-K and should not be considered part of this report or any other filing that we make with the SEC. Additionally, the SEC maintains an Internet site at www.sec.gov that contains reports, proxy and information statements and other information regarding issuers like us that file electronically with the SEC.
Financial Information by Segment and Geographic Location
Information on business segments and geographic areas in which we operated for the years ended December 31, 2009, 2008 and 2007 is contained in Note 17 to the Consolidated Financial Statements included in this report.
Musical Instrument Industry
We operate two reportable segments within the musical instrument industry: pianos and band & orchestral instruments.
1
Pianos – The overall piano market is comprised of two main categories: grand pianos and upright pianos. Steinway & Sons pianos compete in the high-end segment of the market, whereas our Boston and Essex lines compete in the mid-priced segment of the piano market.
Steinway realizes the majority of its profit from high-end grand piano sales. Our results are generally more affected by economic cycles, demographics, and the public's continued interest in music than by industry trends. The current economic crisis has led to reduced sales in the United States, the world's largest piano market, and in our overseas markets.
Band & Orchestral Instruments – Historically, demand for band & orchestral instruments in the domestic market have been more significantly impacted by factors such as demographic trends than by macroeconomic cycles. However, the recent financial crisis has impaired the ability of some dealers to obtain the credit necessary to purchase inventory. In addition, in some areas of the United States, the downturn has led to cuts in state budgets which may negatively impact school music programs in the short term.
Studies have emphasized the importance of music education in a child's development and many school band directors promote band programs as social organizations rather than the first step of intensive music study. We expect this emphasis on music education and steady demographic trends to contribute to a relatively stable domestic market in the long term.
Imports into the domestic market from offshore low-cost producers have created a highly price sensitive domestic market where manufacturers have implemented aggressive pricing programs in an attempt to maintain market share positions. Imported instruments have also allowed dealers to source their own proprietary lines in an attempt to improve their margins. To remain competitive in this market, we import some student woodwind and brass instruments, primarily entry-level, made to our specifications. The impact of lower priced imported instruments has also led to consolidation within the industry, leaving Conn-Selmer, Yamaha and Jupiter as the top three remaining full line competitors.
Business and Products
Piano Segment
The Family of Steinway-Designed Pianos is a comprehensive offering of the world's finest pianos at three distinct price points to suit every buyer looking to purchase a fine quality piano. The family is comprised of our three brands: Steinway & Sons, Boston and Essex.
Steinway & Sons grand pianos, handcrafted in New York and Germany, are considered to be the highest quality pianos in the world and have one of the most widely recognized and prestigious brand names. We also offer Steinway & Sons upright pianos as well as two mid-priced lines of pianos under the Boston and Essex brand names.
Steinway & Sons Pianos – Steinway & Sons pianos differ from all others in design specifications, materials used and the assembly process. We offer two premium-priced product lines under the Steinway & Sons brand: grand pianos and upright pianos. Grand pianos historically have accounted for the majority of our production. We offer seven sizes of the grand piano ranging from the 5'1" baby grand to the largest 9' concert grand. The smaller grands are sold to both individual and institutional customers, while the concert grands are sold primarily to institutions. Steinway & Sons grand pianos are premium pianos in terms of quality and price, with retail prices for ebony pianos generally ranging from $49,000 to $124,000 in the United States. Limited edition pianos and pianos with special veneers sell for retail prices of up to $189,000. Steinway & Sons also offers art case pianos designed by either Steinway master craftsmen or renowned artisans. These unique creations often feature exteriors of elaborate marquetry and intricate hand-painting. Many of these pianos are created to commemorate special events and anniversaries.
2
In 2009, we sold 1,752 grand pianos, of which 916 units were shipped from our New York facility to dealers in the Americas. The remaining 836 units were shipped from our German facility primarily to Europe and Asia. Our upright pianos are intended to satisfy the needs of institutions and other customers who are constrained by space limitations. We also provide services such as repair, replacement part sales, tuning and regulation of pianos, and restoration. Restoration services range from repairs of minor damage to complete restorations of vintage pianos.
Boston and Essex Pianos – Our Boston and Essex lines allow us to compete in the mid-priced category. In 2009, we significantly enhanced the Boston piano with the introduction of the Boston Performance Edition. The improvements in materials, specifications and performance put Boston at the top of the mid-priced range, just below Steinway & Sons.
With certain limited exceptions, we allow only Steinway & Sons dealers to carry Boston and Essex pianos, thereby ensuring that these pianos will be marketed as complementary product lines to the Steinway & Sons line. These pianos, which were designed by us and are produced for us in Asia, provide our dealers with an opportunity to realize better margins in this price range while capturing sales that would have otherwise gone to a competitor. Also, since our research indicates that the vast majority of Steinway customers have previously owned another piano, Boston and Essex pianos provide future Steinway piano customers with the opportunity to join the Steinway family of owners sooner. The Family of Steinway-Designed Pianos increases our business with our dealers, making us their primary supplier in many instances. Retail prices for Boston upright and grand pianos generally range from $7,000 to $48,000 in the United States. Retail prices for Essex pianos range from $4,000 to $19,000 in the United States. Sales of Boston and Essex pianos accounted for 22% of our piano division revenue and 74% of piano unit sales in 2009.
Band Segment
We are the largest domestic producer of band & orchestral instruments and offer a complete line of brass, woodwind, percussion and string instruments with well-known brand names. We have complemented our domestic manufacturing strategy with a sourcing strategy from Asia to remain competitive in the marketplace. Over the past few years, we have established relationships with several overseas manufacturers to produce entry-level student instruments to our design specifications. To ensure that our imported instruments meet our expectations, we have our own quality assurance staff in China to monitor and evaluate our instrument suppliers.
In 2009, sales of sourced products accounted for approximately 38% of our band division revenue. In addition to entry-level student woodwind and brass instruments from Asia, which comprise 10% of our total band sales, we also import other products such as saxophones, outfit drums and accessories.
Woodwind and Brass Instruments – We manufacture piccolos, flutes, clarinets, oboes, bassoons, trumpets, French horns, tubas, and trombones in our manufacturing facilities in Indiana and Ohio. We sell student level instruments in three distinct product groupings: "good" entry-level imported instruments, "better" mid-priced instruments, which are either imported or manufactured by us, and "best" instruments, which are primarily manufactured by us. In addition, we also manufacture intermediate and professional level woodwind and brass instruments. Sales of woodwind and brass instruments accounted for 64% of our band division revenue in 2009.
We sell our woodwind and brass products under the brand names Bach, Selmer, Selmer Paris, C.G. Conn, Leblanc, King, Armstrong, Holton, Yanagisawa, Vito, Emerson, Avanti, Noblet, Artley, and Benge. Suggested retail prices generally range from $300 to $2,500 for student instruments and from $1,100 to $14,000 for intermediate and professional instruments. We often customize the products that we sell to professional musicians so that the product meets requested design specifications or has certain sound
3
characteristics. We believe that specialization of products helps maintain a competitive edge in quality and product design. Our specialized woodwind and brass instruments sell for up to $34,000.
We are the exclusive U.S. distributor for Yanagisawa saxophones and Selmer Paris saxophones, clarinets and trumpets. The Selmer Paris saxophone is one of the best selling professional saxophones in the world. Selmer Paris, in turn, has exclusive distribution rights to some of our brass instruments in France.
Percussion Instruments – We manufacture, source, and distribute acoustical and tuned percussion instruments, including outfit drums, marching drums, concert drums, marimbas, xylophones, vibraphones, orchestra bells, and chimes. We manufacture percussion products in North Carolina and Illinois under the Ludwig and Musser brand names. Ludwig is considered a leading brand name in acoustical drums and timpani and Musser has a strong market position in tuned percussion products. Suggested retail prices range from $500 to $5,600 for acoustical drum outfits and from $1,000 to $17,700 for tuned percussion instruments, with specialized tuned instruments purchased by symphonies and orchestras selling for up to $23,000. Sales of percussion instruments accounted for 15% of our band division revenue in 2009.
String Instruments – We distribute violins, violas, cellos, and basses. Products are sold under the brand names Glaesel, Scherl & Roth, and William Lewis & Son. Suggested retail prices generally range from $400 to $3,000 for student instruments and from $1,400 to $5,300 for intermediate and advanced instruments, with specialized instruments selling for up to $16,000. Components are primarily imported from Europe and Asia and adjusted at our factory in Ohio. Sales of string instruments accounted for 2% of our band division revenue in 2009.
Accessories – We manufacture mouthpieces and distribute accessories such as music stands, batons, mallets, straps, mutes, reeds, pads, chin rests, strings, bows, cases and instrument care products. Sales of accessories accounted for 19% of our band division revenue in 2009.
Customers
Piano Segment
Most of our piano sales are to individuals, both professional artists and amateur pianists. A majority of our Boston and Essex customers are between 35 and 45 years old and have an intermediate level of musical skill. They hold graduate degrees and report annual household income over $100,000. Our Steinway & Sons customers are slightly older, between 40 and 50 years old, and have an advanced level of musical skill. They also hold graduate degrees but report income over $300,000.
We also sell pianos to institutions such as concert halls, universities, music schools, houses of worship, hotels, and retirement homes. Approximately 23% of pianos sold in 2009 were to institutional customers. We have developed the "All-Steinway School" program to focus on increasing piano sales to music schools, as this market segment is typically less sensitive to economic cycles. Institutions can earn the "All-Steinway School" designation by owning essentially all Steinway-designed pianos, enabling them to provide their students and faculties with the best instruments possible for the study of music, from the practice room to the recital hall. The number of "All-Steinway Schools" grew 14% in 2009, to 113 schools and conservatories worldwide.
Market size and volume trends are difficult to quantify for international piano markets, as there is no single source for worldwide sales data. Outside the United States, our strongest market shares are in Germany, Austria, Switzerland, the United Kingdom, France, and Italy. We believe that we hold an average grand piano market share of approximately 15% in these countries. In recent years, we began penetrating former Eastern Bloc countries and we expect growth in this region in the coming years.
4
Outside of the United States, China is currently the second largest grand piano market in the world. With our three piano lines, we believe our market share of grand piano units is currently 8% in China. Our unit sales in China grew over 6% in 2009 and we expect a large portion of our long-term growth to come from this market.
In 2009, our piano sales had the following geographic breakdown based on customer location: approximately 35% in the United States, 36% in Europe, 10% in Japan, 9% in China, and the remaining 10% primarily in other Asian countries. Our largest piano dealer accounted for approximately 3% of piano sales in 2009, while the top 15 accounts represented 25% of piano sales.
Band Segment
Band & orchestral instruments are sold to student, amateur and professional musicians, and institutions. The majority of our instruments are purchased or rented from dealers by students enrolled in music education programs in the United States. Traditionally, students join school bands or orchestras at age 10 or 11 and learn on beginner level instruments, progressing to intermediate or professional level instruments in high school or college. We estimate that approximately 75% of our domestic band sales are generated through educational programs. The remaining domestic band sales are to amateur or professional musicians or performing groups, including orchestras and symphonies. Student level instruments accounted for approximately 60% of band & orchestral unit sales and approximately 30% of instrument revenues in 2009, with intermediate and professional instruments representing the balance.
Historically, over 80% of our band sales have been in the United States. In recent years, Asian and European markets have presented significant opportunities for growth due to the quality of our instruments and the strength of our brand names.
In 2009, approximately 75% of band sales were in the United States, 11% in Europe and the remaining 14% primarily in Japan and Canada. Our largest group of band dealers under common control accounted for approximately 12% of band sales in 2009, while the top 15 accounts represented approximately 40% of band sales.
Sales and Marketing
Piano Segment
We distribute our pianos worldwide through nearly 200 independent dealers who operate approximately 300 showrooms. We also have company operated selection centers in Tokyo and Shanghai which serve our dealers in Japan and China. In addition, we also sell our pianos through eleven company operated retail showrooms: six in the United States and five in Europe. Sales to dealers accounted for approximately 75% of piano segment revenue in 2009. The remaining 25% was generated from sales made directly by us at one of our eleven company operated retail showrooms.
We employ district sales managers whose responsibilities include developing close working relationships with piano dealers. These highly experienced professionals provide dealers with sales training and technical support, and develop sales and marketing programs for the consumer and institutional markets. These sales managers are also responsible for promoting the Steinway Artist Program.
Steinway Artist Program – Steinway Artists are world-class pianists who voluntarily endorse Steinway & Sons by selecting the Steinway piano. Our Steinway Artist program is unique in that we do not pay artists to endorse our instruments. To become a Steinway Artist, a pianist must not only meet certain performance and professional criteria, he or she must also own a Steinway piano. We use these renowned artists in our marketing programs to help reinforce recognition of the Steinway brand name
5
and its association with quality. The Steinway Artist Program currently includes approximately 1,600 of the world's finest pianists who perform on Steinway pianos.
Young Steinway Artist Program – Often a formal affiliation with Steinway & Sons has not been possible for an emerging artist since all Steinway Artists must personally own a Steinway piano. The financial realities of developing a career can often make that requirement difficult for many otherwise deserving young musicians. In an effort to reach out to young pianists at an early point in their burgeoning careers, we recently developed the Young Steinway Artist Program. This program allows us to consider pianists between 16 and 35 years of age who own either a Boston or an Essex piano. The select group of talented musicians chosen for the Young Steinway Artist Program will have the distinction of an affiliation with the Steinway Artist family as well as access to the worldwide resources of Steinway & Sons.
Concert and Artist Piano Bank – To ensure that all pianists, especially Steinway Artists, have a broad selection of instruments to meet their individual touch and tonal preferences, we maintain the Concert and Artist Piano Bank. The Piano Bank includes approximately 450 instruments worldwide. Of these instruments, approximately 320 are located in the United States. In New York City alone, the Piano Bank includes approximately 120 instruments. Approximately 50% of these pianos are housed at local concert venues and the remaining instruments are at Steinway Hall where they are made available for various occasions. The remaining domestic-based pianos are leased to dealers around the country who actively support the Steinway Artist program. The Piano Bank promotes our instruments in the music industry and provides management with continual feedback on the quality and performance of recently produced instruments from our most critical customer, the professional pianist. The Piano Bank instruments are generally sold after four or five years and replaced with new pianos.
Band Segment
Our band & orchestral, string and percussion instruments and related accessories are distributed worldwide through approximately 1,500 independent musical instrument dealers and distributors.
In North America, we market our products through district sales managers and telemarketing representatives who are responsible for sales within assigned geographic territories. Each district sales manager is also responsible for developing relationships with band & orchestral directors. These directors represent all levels of music educators, from those who teach elementary school children through those involved at the college and professional levels. These individuals are the primary influencers in the choice of an instrument brand as they will generally refer students to designated dealers for the purchase of instruments.
As part of our band director outreach and support strategy, we have developed Conn-Selmer Institute ("CSI"). Originally created to help graduating music education majors transition into teaching careers, we have expanded CSI to include a program for experienced music educators who want a refresher course. We also have an educational director who travels extensively throughout the United States, lecturing and motivating students, educators and parents on the value of music in a child's development. We believe that our well-established, long-standing relationships with influential music educators are an important component of our distribution strategy and that our CSI efforts will further enhance these relationships.
To reach international markets, we primarily sell our instruments through distributors. Our international sales staff includes regional sales directors who have direct contact with our customers in Europe, Latin America and Asia.
6
We support our dealers and distributors through incentive programs, advertising and promotional activities. We reach our customers through trade shows, educator conferences, print media, direct mail, telemarketing, the Internet and personal sales calls. We also actively advertise in educator and trade publications and provide educational materials, catalogs and product specifications to students, educators, dealers and distributors.
Competition
Piano Segment
Steinway & Sons Pianos – The level of competition our pianos face depends on the market definition. Steinway & Sons pianos hold a unique position at the top of the grand piano market, both in terms of quality and price. While there are many makers of pianos, only a few compete directly with our Steinway brand. Other manufacturers of primarily higher priced pianos include Bösendorfer and Fazioli.
Because Steinway pianos are built to last for generations, a relatively large market exists for used Steinways. It is difficult to estimate the significance of used piano sales because most are conducted in the private aftermarket. However, we believe that used Steinway pianos provide the most significant competition in the high end piano market.
Boston and Essex Pianos – Our mid-priced pianos compete with brands such as Bechstein, Schimmel, Kawai, and Yamaha. By working with manufacturers in Asia, we have been able to enjoy labor costs and manufacturing efficiencies similar to those of some of our primary competitors while offering consumers the added benefit of pianos designed by Steinway & Sons.
Band Segment
We are the largest domestic producer of band & orchestral instruments and we have leading market shares with many of our professional level instruments. Yamaha, a Japanese corporation, is our largest competitor. New entrants into the domestic market generally experience difficulty competing due to the need for both brand recognition and an effective distribution system.
Due to the growth of offshore manufacturers and the ease of international trade, competition for sales of student level instruments in the United States has intensified in recent years. These producers benefit from low labor costs, enabling them to offer instruments at highly competitive prices. Imported instruments have also allowed dealers to source their own proprietary lines in an attempt to improve their margins. It is difficult to quantify the impact of imported musical instruments since the majority of offshore manufacturers do not report data through industry channels.
Patents and Trademarks
Steinway & Sons pioneered the development of the modern piano with over 150 patents granted since our founding. While we have several patents effective and pending in the United States and in several foreign countries, we do not believe our business is materially dependent upon any single patent.
We also have some of the most well-known brand names in the music industry. Our piano trademarks include Steinway, Steinway & Sons, the Lyre design, Boston, Heirloom Collection, Crown Jewel Collection and Essex. Our band & orchestral trademarks include Bach, Selmer, C.G. Conn, Leblanc, King, Armstrong, Ludwig, Musser, Holton, Vito, Glaesel, Scherl & Roth, Emerson, William Lewis & Son, and Benge. We consider our trademarks to be important and valuable assets. It is possible that the termination, expiration or infringement of one or more of our trademarks may have an adverse effect on our business, depending on the trademark and the jurisdiction. Accordingly, we maintain trademark registrations in appropriate jurisdictions on an ongoing basis and vigorously pursue any infringement by competitors or other third parties.
7
Raw Materials, Component Parts, and Sourced Products
Our raw materials consist primarily of metals and woods. The majority of these materials is sourced from the Americas, with the balance coming from Europe, Asia and Africa. We manufacture our own piano plates and keys to ensure quality and availability of these component parts. Component parts for string and percussion instruments are imported from Europe and Asia. We have had adequate supplies of raw materials and component parts in the past and do not expect any disruption to the supply of these items during 2010 or in the future.
Currently, our Boston pianos are sourced from a single manufacturer, as are many of our Essex piano models, our Selmer Paris instruments and certain other component parts. Some of our entry-level band instruments are also sourced from single manufacturers. We continually scrutinize these suppliers and the quality of products that they manufacture for us and we believe that we have a sufficient number of qualified band instrument suppliers to ensure availability of all offered products in the upcoming year.
Labor
As of December 31, 2009, we employed 1,746 people, consisting of 1,193 hourly production workers and 553 salaried employees. Of the 1,746 employees, 1,255 were employed in the United States and the remaining 491 were employed primarily in Europe.
Approximately 45% of our workforce in the United States is represented by labor unions. In April 2006, employees at our brass instrument manufacturing facility in Elkhart, Indiana, who were represented by Local 364 of the United Auto Workers ("UAW"), went on strike. By the end of 2006, we had hired a sufficient number of replacement workers to operate the plant. In November of 2007, the employees voted to decertify the UAW as the exclusive bargaining representative at the plant and, in July of 2009, the National Labor Relations Board confirmed the results of the decertification.
The following table indicates the union representation and the current status of our collective bargaining agreements in the United States:
| Location |
Union affiliation |
Type of manufacturing |
Number of employees |
Agreement expiration |
|||||
|---|---|---|---|---|---|---|---|---|---|
| Springfield, OH | Glass, Molders, Pottery, Plastics & Allied Workers | Piano plates | 16 | November 8, 2010 | |||||
| Eastlake, OH | United Auto Workers | Band instruments | 235 | February 15, 2011 | |||||
| Elkhart, IN | United Auto Workers | Band instrument warehouse | 9 | March 31, 2012 | |||||
| LaGrange, IL | Carpenters | Percussion instruments | 21 | November 21, 2010 | |||||
| New York, NY | United Furniture Workers | Pianos | 281 | December 31, 2012(1) | |||||
- (1)
- Our previous labor contract with employees at our piano manufacturing facility in New York expired on December 31, 2009, as we negotiated the terms of a new agreement. We recently reached an agreement with the union's representatives on a new three-year contract which we expect to be ratified shortly.
In Germany, all employees other than management are represented by the workers' council. Nevertheless, most employment contract conditions are settled in collective bargaining agreements made between various trade unions and the employer organizations to which we belong. Our agreement with employees at our piano facility in Hamburg, Germany, expired on November 30, 2009. After direct negotiations failed to result in a new agreement, we entered into a non-binding arbitration process. This arbitration produced a compromise which we expect will be ratified shortly.
8
An investment in our Company involves risk. In addition to the other information in this report, prospective investors should carefully consider the following risks before making an investment. The risks described below are not the only risks we face. There may be additional risks and uncertainties that we do not presently know of or that we currently consider immaterial. All of these risks could adversely affect our business, financial condition, or results of operations.
We operate in competitive markets
Our success depends upon our ability to maintain our share of the musical instrument market by providing the best instruments at prices equal to or below our competitors providing instruments of comparable quality. Increased competition could lead to price reductions, fewer large sales to institutions, reduced operating margins and loss of market share.
Our Steinway pianos currently compete with brands sold by Bösendorfer and Fazioli, which primarily produce and market pianos at the high end of the market. Because of the potential savings associated with buying a used instrument, as well as the durability of the Steinway piano, a relatively large market exists for used Steinway pianos. It is difficult to estimate the significance of used piano sales, because most are conducted in the private aftermarket. However, we believe that used Steinway pianos provide the most significant competition in the high end piano market.
Our mid-priced pianos compete with brands such as Bechstein, Schimmel, Kawai, and Yamaha. By working with manufacturers in Asia, we have been able to enjoy labor costs and manufacturing efficiencies similar to those of our primary competitors. Also, with certain limited exceptions, we allow only Steinway dealers to carry the Boston and Essex piano lines, thereby ensuring that these pianos will be marketed as complementary product lines to the Steinway line.
Our band & orchestral division competes with a number of domestic and Asian manufacturers of musical instruments, including Jupiter and Yamaha. Any of our competitors may concentrate their resources upon efforts to compete in our markets. In addition, Asian musical instrument manufacturers have made significant strides in recent years to improve their product quality. They now offer a broad range of quality products at highly competitive prices and represent a significant competitive challenge for us. Our failure to compete effectively could have a negative impact on our results of operations.
Economic downturns and changes in consumer preferences could adversely affect our business
Our business is subject to a number of general economic factors, many of which are out of our control, that may, among other things, result in a decrease in sales and net income. Sales of musical instruments are dependent in part upon discretionary consumer spending, which may be affected by general economic conditions. For example, Steinway, which represents more than half of our net sales, sells a relatively small number of Steinway & Sons grand pianos each year (1,752 in 2009). Given the small number of pianos we sell, even a slight decrease in sales could adversely affect our profitability. Band & orchestral sales are also dependent upon the continued interest of school-aged children in playing musical instruments. Any decrease in consumer spending, reduction in school budgets or decrease in school-aged children's interest in music could result in decreased sales, which could adversely affect our business and operating results.
We generate most of our sales through independent dealers and distributors
We depend on a network of independent dealers and distributors to distribute all of our band instruments and a majority of our pianos. If our dealers are unsuccessful, they will reduce their purchases from us. This would negatively impact our sales and production rates. In addition, a significant number of our U.S. dealers finance their inventory purchases through third parties. One of
9
the largest firms closed its financing operation in 2009. Since the number of financing options available to our dealers has been reduced, a prolonged worldwide financial crisis could also result in decreased purchases, which would adversely affect our business and operating results.
We could be subject to work stoppages or other business interruptions as a result of our unionized work force
A significant portion of our hourly employees are represented by various union locals and covered by collective bargaining agreements. These agreements contain various expiration dates and must be renegotiated upon expiration. If we are unable to negotiate any of our collective bargaining agreements on satisfactory terms prior to expiration, we could experience disruptions in our operations which could have a material adverse effect on our operations.
Any significant disruption in our supply from key suppliers could delay production and adversely affect our sales
Our Boston piano line, some of our Essex piano models, our Selmer Paris instruments, and many of our student level band & orchestral instruments are sourced from single foreign manufacturers. We are highly dependent on the availability of essential materials and purchased components from our suppliers, some of which may be available only from limited resources. Moreover, we are dependent upon the availability of our suppliers to provide material that meets specifications, quality standards and delivery schedules. Our suppliers' failure to provide expected raw materials or component parts would adversely affect production schedules and profitability.
Although we have had adequate supplies of raw materials and component parts in the past, there is no assurance that we may not experience serious interruptions in the future. Our continued supply of materials is subject to a number of risks including: 1) the destruction of our suppliers' facilities or their distribution infrastructure; 2) work stoppages or strikes by our suppliers' employees; 3) the failure of our suppliers to provide materials of the requisite quality; 4) the failure of essential equipment at our suppliers' plants; 5) the failure or shortage of supply of raw materials to our suppliers; and 6) contractual amendments and disputes with our suppliers.
We cannot assure investors that our suppliers will continue to provide products to us at attractive prices or at all, or that we will be able to obtain such products in the future from these or other providers on the scale and within the time periods we require. Furthermore, we cannot assure investors that substitute raw materials or component parts will meet the strict specification and quality standards we impose. If we are not able to obtain key materials, supplies, components or sourced instruments on a timely basis and at affordable costs, or we experience significant delays or interruptions of their supply, it could have a material adverse effect on our business, financial condition and results of operations.
We experience inherent concentration of credit risk in our accounts receivable
We establish reserves for accounts receivable and notes receivable. We review overall collectibility trends and customer characteristics such as debt leverage, solvency, and outstanding balances in order to develop our reserve estimates. Historically, a large portion of our sales have been generated by our top 15 customers. As a result, we experience some inherent concentration of credit risk in our accounts receivable due to its composition and the relative proportion of large customer receivables to the total. This is especially true at our band division, which characteristically has the majority of our consolidated accounts receivable balance. We consider the credit health and solvency of our customers when extending credit and when we develop our receivable reserve estimates. If our customers fail to pay a significant portion of outstanding receivable balances, it would have a negative impact on our results of operations.
10
We may be unable to successfully integrate acquisitions of related companies into our business
We have historically acquired other businesses whose operations or product lines complement our existing business. We continually explore new opportunities to enter into business combinations with other companies in order to maintain and grow our revenues and market presence. These potential transactions with other companies create risks such as difficulty in assimilating the personnel, customers, technology, products and operations with our personnel, customers, technology, products and operations; disruption of our ongoing business, including loss of management focus on existing businesses; and impairment of relationships with existing executives, employees, customers and business partners. In addition, we may not be able to identify suitable candidates for these transactions or obtain financing or otherwise make these transactions on acceptable terms. Furthermore, the benefits that we anticipate from these potential transactions may not develop as expected and we cannot be sure that we will recover our investment in any such strategic transaction.
Shifts in our product mix may result in declines in our gross margins and profit levels
Our gross margins vary among our product groups and have fluctuated from quarter to quarter as a result of shifts in product mix (that is, how much of each product type we sell in any particular quarter). The introduction of new band instruments, decreases in average selling prices and shifts in the proportion of student level instruments to professional level instruments may cause variances in our gross margins. We also experience variances in our gross margins as a result of shifts in the proportion of our piano retail sales to wholesale sales, as well as changes in amounts of piano sales to territories where we realize more favorable pricing.
Failure of our new products to gain market acceptance may adversely affect our operating results
New products may not achieve significant market acceptance or generate sufficient sales to permit us to recover development, manufacturing and marketing costs associated with these products. Achieving market acceptance for new products may also require substantial marketing efforts and expenditures to expand consumer demand. These requirements could strain our management, financial and operational resources. Furthermore, failure of our new products to achieve market acceptance could prevent us from maintaining our existing customer base, gaining new customers or expanding our markets and could have a material adverse effect on our business, financial condition and results of operations.
Since we have a limited number of facilities, any loss of use of any of our facilities could adversely affect our operations
Our operations with respect to specific products are concentrated in a limited number of manufacturing facilities. Because we are heavily dependent on each of these facilities, our operations may be adversely affected if we experience a disruption in business at any particular facility for a prolonged period of time because we may not have adequate substitute facilities available to us.
We may face difficulties or delays renewing leases or re-leasing space in our office building
We derive rental income from our building on West 57th Street in New York City. The master lease that was in effect for ten years expired at the end of 2008; therefore, we no longer have guaranteed rental income. Changes in local market conditions, such as an oversupply of properties, including space available by sublease, may make it more difficult for us to lease space at attractive rental rates or at all. If we were unable to lease a significant amount of space in our building on economically favorable lease terms, including the cost of required renovations or concessions to tenants, our cash flow could decrease which would adversely affect our business and operating results.
11
Our operations may subject us to liabilities for environmental matters, the costs of which could be material
Our manufacturing operations involve the use, handling, storage, treatment and disposal of materials and waste products that may be toxic or hazardous. Consequently, we are subject to numerous federal, state and local environmental laws and regulations, specifically those relating to discharges to air, water and land, the handling and disposal of solid and hazardous waste, and the cleanup of properties contaminated by hazardous substances. Many environmental laws impose strict, retroactive, joint and several liability broadly upon owners and operators of properties, including with respect to environmental matters that occurred prior to the time the party became an owner or operator. In addition, we may have liability with respect to third-party sites to which we sent wastes for disposal in the past. Our potential liability at any of these sites is affected by many factors including, but not limited to, the method of remediation, our portion of the hazardous substances at the site relative to that of other responsible parties, the number of responsible parties, the financial capabilities of other parties, and contractual rights and obligations.
We have obligations and liabilities with respect to the remediation of current and former properties and third-party waste disposal sites. The liabilities and obligations in some cases are covered by an indemnification agreement and we have accrued liabilities for sites where the liability is probable and can be estimated. We cannot guarantee the indemnitor will continue to fund the cleanup liability or that the actual costs of cleanup will not exceed our present accruals. Furthermore, we may be required to fund additional remedial programs in connection with other current, former or future facilities.
Future events, such as the discovery of additional contamination or other information concerning past releases of hazardous substances at our manufacturing sites (or at sites to which we sent wastes for disposal), changes in existing environmental laws or their interpretation, and more rigorous efforts by regulatory authorities, may require additional expenditures by us to modify operations, install pollution control equipment, clean contaminated sites or curtail our operations. These expenditures could have a material negative impact on our operations.
In addition, we could be affected by future laws or regulations imposed in response to climate change concerns. Because it is uncertain what laws will be enacted, we cannot predict whether or not these laws or regulations could have a material adverse effect on our business, financial condition and results of operations.
We may not be able to protect our proprietary information
We rely in part on patent, trade secret, unfair competition, trade dress and trademark laws to protect our rights to aspects of our business and products, including product designs, proprietary manufacturing processes and technologies. The laws of many foreign countries do not protect proprietary rights to the same extent as laws in the United States. In addition, although we may have rights to a particular trademark in a given country, we may not have similar rights to that trademark in other countries.
Changes in our effective tax rates could affect future results
As an international Company, we are subject to taxation in the United States and various other foreign jurisdictions in which we do business. Some of these foreign jurisdictions have higher statutory rates than those in the United States, and certain of our international earnings are also taxable in the United States. Accordingly, our effective tax rates will vary depending on the relative proportion of foreign to U.S. income and absorption of foreign tax credits, changes in the valuation of our deferred tax assets and liabilities, and changes in tax laws. In addition, we are subject to examination of our income tax returns by the U.S. Internal Revenue Service and other tax authorities. We regularly assess
12
the likelihood of adverse outcomes resulting from these examinations to determine the adequacy of our income tax reserves and expense. Should actual events or results differ from our current expectations, charges or credits to our income tax expense reserves and income tax expense may become necessary. Any such adjustments could have a significant impact on our results of operations.
Our foreign operations are exposed to risks associated with foreign regulations, exchange rate fluctuations, trade restrictions and political, economic and social instability
We manufacture, market and distribute our products worldwide. As a result, we are subject to the risks normally associated with foreign operations. For example, foreign regulations may limit our ability to produce and sell some of our products or repatriate profits to the United States. In addition, a foreign government may impose trade or foreign exchange restrictions or increased tariffs, which could adversely affect our operations. Our operations may also be negatively impacted by political, economic and social instability in foreign countries in which we operate. We are also exposed to risks associated with foreign currency fluctuations. A change in the exchange rates of the U.S. dollar, the Japanese yen, the British pound, the Chinese yuan and renminbi, or the euro relative to each other or other foreign currencies could have a negative impact on us. Although we sometimes engage in transactions to protect against risks associated with foreign currency fluctuations, we cannot be sure that these fluctuations will not have an adverse effect on us. Sales outside the United States accounted for 49% of our net sales in 2009.
The requirements of complying with various federal regulations may strain our resources
As a public company, we are subject to various federal regulations, including the reporting requirements of the Sarbanes-Oxley Act. Sarbanes-Oxley requires that we maintain effective disclosure controls and procedures, corporate governance standards, and internal controls over financial reporting. Although we devote significant time and resources to ensure ongoing compliance with the reporting requirements of Sarbanes-Oxley, we can give no assurance that we will continue to meet these requirements in the future or that reportable conditions or material weakness in our internal controls and procedures may not arise despite our best efforts to prevent them. While we have taken and continue to take all steps necessary to comply with Sarbanes-Oxley, including maintaining effective internal controls, our failure to meet the requirements of Sarbanes-Oxley or other federal regulations could negatively impact our business, financial condition and results of operations.
Further issuances of equity securities may be dilutive to current shareholders
Our ability to execute our business strategy depends on our access to an appropriate blend of debt financing and equity financing. The interests of our existing shareholders could be diluted if additional equity securities are issued to finance future developments, acquisitions, or repay indebtedness.
Messrs. Kirkland and Messina exercise significant control over us, which could adversely affect investors
Mr. Kyle R. Kirkland, Chairman of the Board, and Mr. Dana D. Messina, Chief Executive Officer, hold in the aggregate 100% of our Class A common stock, representing approximately 83% of the voting power of our Company's capital stock. So long as Messrs. Kirkland and Messina continue to hold a majority of the voting power, they will be able, acting together, to exercise a controlling influence over our Company, including with respect to the composition of our board of directors and, through it, the direction and policies of the Company. We cannot assure that Messrs. Kirkland and Messina will not pursue other business interests that will conflict with investors' interests.
Item 1B. Unresolved Staff Comments
None.
13
We own most of our manufacturing and warehousing facilities, as well as the building that includes Steinway Hall in New York City. The remaining Steinway retail stores are leased. Substantially all of the domestic real estate has been pledged to secure our debt. The following table lists our significant owned and leased facilities:
| Location |
Owned/ Leased |
Approximate Floor Space (Square Feet) |
Type of Facility and Activity Performed |
||||
|---|---|---|---|---|---|---|---|
| Long Island City, NY | Owned | 450,000 | Piano manufacturing; restoration center; administrative offices | ||||
| New York, NY | Owned | 217,000 | Piano retail store/showroom; office rental property | ||||
| Melville, NY | Leased | 9,200 | Piano retail store/showroom | ||||
| Westport, CT | Leased | 11,000 | Piano retail store/showroom | ||||
| Coral Gables, FL | Leased | 6,000 | Piano retail store/showroom | ||||
| Paramus, NJ | Leased | 4,000 | Piano retail store/showroom | ||||
| West Hollywood, CA | Leased | 3,800 | Piano retail store/showroom | ||||
| Springfield, OH | Owned | 110,000 | Piano plate manufacturing | ||||
| Hamburg, Germany | Owned | 221,000 | Piano manufacturing; executive offices | ||||
| Leased | 6,000 | Piano retail store/showroom | |||||
| Munich, Germany | Leased | 15,000 | Piano retail store/showroom | ||||
| Dusseldorf, Germany | Leased | 6,200 | Piano retail store/showroom | ||||
| Berlin, Germany | Leased | 7,000 | Piano retail store/showroom/service workshop | ||||
| Remscheid, Germany | Leased | 25,000 | Piano key manufacturing | ||||
| Wilkow, Poland | Owned | 10,000 | Piano key manufacturing | ||||
| Shanghai, China | Leased | 22,000 | Piano warehouse/showroom/workshop | ||||
| London, England | Leased | 10,000 | Piano retail store/showroom | ||||
| Leased | 6,000 | Piano workshop/storage | |||||
| Tokyo, Japan | Leased | 9,000 | Piano selection center; warehouse | ||||
| Leased | 2,000 | Administrative offices | |||||
| Eastlake, OH | Owned | 160,000 | Brass instrument manufacturing | ||||
| Elkhart, IN | Owned | 150,000 | Brass instrument manufacturing | ||||
| Owned | 88,000 | Woodwind manufacturing; warehouse; office | |||||
| Owned | 81,000 | Warehouse | |||||
| Owned | 25,000 | Administrative offices | |||||
| Elkhorn, WI | Owned | 58,000 | Former brass instrument manufacturing; held for sale | ||||
| Kenosha, WI | Owned | 95,000 | Former woodwind manufacturing and warehouse; held for sale | ||||
| LaGrange, IL | Owned | 35,000 | Percussion instrument manufacturing | ||||
| Monroe, NC | Leased | 114,000 | Percussion instrument manufacturing; warehouse | ||||
| Cleveland, OH | Leased | 35,000 | String instrument manufacturing | ||||
| London, England | Leased | 8,000 | Band instrument office; warehouse | ||||
We spent $4.6 million for capital improvements in 2009 consisting primarily of production equipment and machinery, plant and facility improvements, and software and computer system upgrades. We expect capital spending in 2010 to be in the range of $3.0 to $4.0 million, relating to similar items, along with $1.0 to $2.0 million for improvements and renovations at our building in New York City.
14
General
We are involved in certain legal proceedings regarding environmental matters, which are described below. Further, in the ordinary course of business, we are party to various legal actions that management believes are routine in nature and incidental to the operation of the business. While the outcome of such actions cannot be predicted with certainty, we believe that, based on our experience in dealing with these matters, their ultimate resolution will not have a material adverse impact on our business, financial condition or results of operations or prospects.
Environmental Matters
We are required to comply with various federal, state, local and foreign environmental laws, including those relating to discharges to air, water and land, the handling and disposal of solid and hazardous waste and the cleanup of properties contaminated by hazardous substances, including chlorinated solvents. Our operations are subject to environmental laws and regulations that require us to obtain and maintain permits from regulatory authorities. Non-compliance with environmental laws and regulations or the permits we have been issued could give rise to significant fines, penalties and other costs. We currently do not expect to incur material expenditures relating to environmental compliance in 2010.
Certain environmental laws, such as the Comprehensive Environmental Response, Compensation, and Liability Act, as amended ("CERCLA"), impose strict, retroactive, joint and several liability upon persons responsible for releases of hazardous substances, which liability is broadly construed. Under CERCLA and other laws, we may have liability for investigation and cleanup costs and other damages relating to our current or former properties, or third-party sites to which we sent wastes for disposal. Our potential liability at any of these sites is affected by many factors including, but not limited to, the method of remediation, our portion of the hazardous substances at the site relative to that of other parties, the number of responsible parties, the financial capabilities of other parties, and contractual rights and obligations.
We are continuing an existing environmental remediation plan at a facility we acquired in 2000. We estimate our costs, which approximate $0.7 million, over a 12-year period. We have accrued approximately $0.6 million for the estimated remaining cost of this remediation program, which represents the present value total cost using a discount rate of 4.54%.
A summary of expected payments associated with this project is as follows:
| |
Environmental Payments |
|||||||
|---|---|---|---|---|---|---|---|---|
2010 |
$ | 72 | ||||||
2011 |
61 | |||||||
2012 |
61 | |||||||
2013 |
61 | |||||||
2014 |
61 | |||||||
Thereafter |
363 | |||||||
Total |
$ | 679 | ||||||
In 2004, we acquired two manufacturing facilities from G. Leblanc Corporation, now Grenadilla, Inc. ("Grenadilla"), for which environmental remediation plans had already been established. In connection with the acquisition, we assumed the existing accrued liability of approximately $0.8 million for the cost of these remediation activities. Based on a review of past and
15
ongoing investigatory and remedial work by our environmental consultants, and discussions with state regulatory officials, as well as recent sampling, we estimate the remaining costs of such remedial plans to be $1.8 million. Pursuant to the purchase and sale agreement, we have sought indemnification from Grenadilla for anticipated costs above the original estimate. We filed a claim against the escrow and recorded a corresponding receivable for this amount in prepaid expenses and other current assets in our consolidated balance sheet. Based on the current estimated costs of remediation, this receivable totaled $2.1 million as of December 31, 2009 and 2008. We reached an agreement with Grenadilla whereby current environmental costs are paid directly out of the escrow. Should the escrow be reduced to zero, we would seek reimbursement from Grenadilla for these additional costs. However, we cannot be assured that we will be able to recover such costs.
Based on our past experience and currently available information, the matters described above, as well as our other liabilities and compliance costs arising under environmental laws, are not expected to have a material impact on our capital expenditures, earnings or competitive position in an individual year. However, some risk of environmental liability is inherent in the nature of our current and former business and we may, in the future, incur material costs to meet current or more stringent compliance, cleanup, or other obligations pursuant to environmental laws.
16
Item 5. Markets for Registrant's Common Equity, Related Stockholder Matters and Issuer Purchases of Equity Securities
Our Ordinary common stock is traded on the New York Stock Exchange ("NYSE") under the "LVB" symbol. On June 5, 2009, we submitted an unqualified certification to the NYSE regarding our compliance with NYSE corporate governance listing standards as of the date of certification. The following table sets forth, for the periods indicated, the high and low share prices of our Ordinary common stock as reported on the NYSE.
| Year Ended December 31, 2009 |
High |
Low |
|||||
|---|---|---|---|---|---|---|---|
First Quarter |
$ | 18.46 | $ | 6.83 | |||
Second Quarter |
14.40 | 10.11 | |||||
Third Quarter |
12.83 | 9.81 | |||||
Fourth Quarter |
16.09 | 11.16 | |||||
| Year Ended December 31, 2008 |
High |
Low |
|||||
|---|---|---|---|---|---|---|---|
First Quarter |
$ | 30.10 | $ | 23.61 | |||
Second Quarter |
30.58 | 24.34 | |||||
Third Quarter |
30.00 | 24.95 | |||||
Fourth Quarter |
28.48 | 14.86 | |||||
We have two classes of common stock: Class A and Ordinary. With the exception of disparate voting power, both classes are substantially identical. Each share of Class A common stock entitles the holder to 98 votes. Holders of Ordinary common stock are entitled to one vote per share. Class A common stock shall automatically convert to Ordinary common stock if, at any time, the Class A common stock is not owned by an original Class A holder.
As disclosed on Form 8-K filed with the SEC on November 5, 2009, we entered into an agreement with Samick Musical Instruments Co., Ltd. ("Samick") for a private placement of 1,700,000 shares of our ordinary common stock at a price of $16 per share. Samick was also granted the right to purchase by March 31, 2010 an additional 1,700,000 million shares of ordinary common stock at an exercise price of $16 per share. This transaction was exempt from registration under section 4.(2) of the Securities Act of 1933 since Samick is an accredited investor within the meaning of Rule 501 under the Securities Act by virtue of paragraph (a)(3) thereof.
Holders of Record – As of March 4, 2010, there were 3,033 beneficial shareholders of our Ordinary common stock and two holders of record of the Class A common stock.
Dividends – Under our domestic credit facility agreement and the indenture for our senior note debt, we are permitted, within certain limitations, to pay cash dividends on our common stock. On February 13, 2007, we declared a dividend of $3.00 per share for shareholders of record as of February 23, 2007. This dividend payment, which amounted to $25.2 million, was paid on March 7, 2007. Although the limits under our debt agreements increase as we accumulate earnings over time, we do not anticipate paying additional cash dividends on our common stock in the foreseeable future.
The payment of any future dividends will be determined by the Board of Directors in light of conditions then existing, including our results of operations, financial condition, cash requirements, limitations or restrictions in debt agreements, tax treatment of dividends, business conditions and other factors.
17
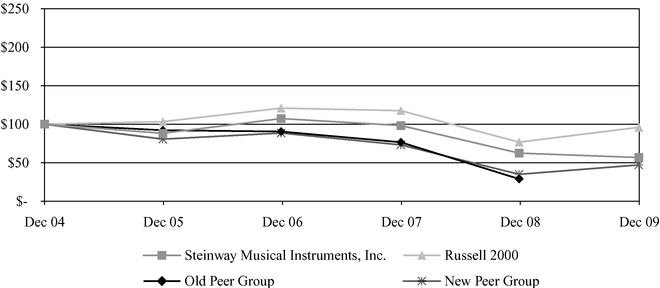
Performance Graph – The following line graph compares the yearly percentage change in our cumulative total shareholder return on our Ordinary common stock for the period from December 31, 2004 to December 31, 2009 to the cumulative total return for the Russell 2000 Stock Index ("Russell 2000") and the cumulative total return for a peer group ("Peer Group") consisting of La-Z-Boy, Inc., Harley-Davidson, Inc., Callaway Golf Company, and Marine Products Corp. Marine Products Corp. replaced Fleetwood Enterprises, which was previously in the Peer Group, after Fleetwood filed for bankruptcy protection.
The Peer Group was selected by management based on the status of each as a manufacturer and/or distributor of consumer goods in the luxury, leisure, or furniture categories. The performance graph assumes a $100 investment on December 31, 2004 in each of our Ordinary common stock, the Russell 2000, and the common stock of the Peer Group. Steinway Musical Instruments, Inc. is included in the Russell 2000. Total shareholder return for Steinway Musical Instruments, Inc., as well as the Russell 2000 and the Peer Group, is based on the cumulative amount of dividends for a period (assuming dividend reinvestment) and the difference between the share price at the beginning and at the end of the period.
Cumulative Total Return
| |
December 31, | ||||||||||||||||||
|---|---|---|---|---|---|---|---|---|---|---|---|---|---|---|---|---|---|---|---|
| |
2004 | 2005 | 2006 | 2007 | 2008 | 2009 | |||||||||||||
Steinway Musical Instruments, Inc. |
$ | 100.00 | $ | 88.15 | $ | 107.29 | $ | 98.27 | $ | 62.41 | $ | 56.71 | |||||||
Russell 2000 |
100.00 | 103.32 | 120.89 | 117.57 | 76.65 | 95.98 | |||||||||||||
Old Peer Group |
100.00 | 92.15 | 90.45 | 76.55 | 28.79 | N/A | |||||||||||||
New Peer Group |
100.00 | 80.59 | 88.54 | 73.13 | 34.84 | 47.11 | |||||||||||||
Purchases of Equity Securities by the Issuer
None.
18
Equity Compensation Plans
The following table sets forth the equity compensation plan information for our Employee Stock Purchase Plan and our Stock Plans, which are described in Note 12:
| |
Number of securities to be issued upon exercise of outstanding options, warrants and rights |
Weighted- average exercise price of outstanding options, warrants and rights |
Number of securities remaining available for future issuance under equity compensation plans (excluding securities reflected in column (a)) |
|||||||
|---|---|---|---|---|---|---|---|---|---|---|
| Plan Category | (a) | (b) | (c) | |||||||
| Equity compensation plans approved by security holders: | ||||||||||
1996 Stock Plan |
372,376 |
$ |
20.80 |
– |
||||||
| 2006 Stock Plan | 756,900 | 20.51 | 243,100 | |||||||
| 2006 Purchase Plan | 24,382 | 9.65 | 257,478 | |||||||
| Total | 1,153,658 | $ | 20.37 | 500,578 | ||||||
19
Item 6. Selected Financial Data
The following table sets forth our selected consolidated financial data as of and for each of the five years in the period ended December 31, 2009, as derived from our audited financial statements. The table should be read in conjunction with our Consolidated Financial Statements, including the footnotes, and "Management's Discussion and Analysis of Financial Condition and Results of Operations" included elsewhere in this report, as well as previously filed Annual Reports on Form 10-K.
(In thousands except share and per share data)
| Years Ended December 31, | 2009(1) | 2008(2) | 2007 | 2006(3) | 2005 | ||||||||||||
|---|---|---|---|---|---|---|---|---|---|---|---|---|---|---|---|---|---|
Income statement data: |
|||||||||||||||||
Net sales |
$ | 306,436 | $ | 387,413 | $ | 406,314 | $ | 384,620 | $ | 387,143 | |||||||
Gross profit |
84,913 | 115,290 | 123,486 | 107,407 | 111,534 | ||||||||||||
Income from operations |
13,271 | 21,193 | 35,202 | 18,378 | 34,837 | ||||||||||||
Net income (loss) |
5,336 | 8,186 | 15,410 | (668 | ) | 13,792 | |||||||||||
Earnings (loss) per share |
|||||||||||||||||
Basic |
$ | 0.60 | $ | 0.96 | $ | 1.81 | $ | (0.08 | ) | $ | 1.71 | ||||||
Diluted |
$ | 0.60 | $ | 0.95 | $ | 1.78 | $ | (0.08 | ) | $ | 1.67 | ||||||
Weighted average shares: |
|||||||||||||||||
Basic |
8,855,138 | 8,557,761 | 8,521,700 | 8,303,770 | 8,069,721 | ||||||||||||
Diluted |
8,859,554 | 8,629,647 | 8,647,300 | 8,303,770 | 8,265,234 | ||||||||||||
Balance sheet data (at December 31): |
|||||||||||||||||
Cash |
$ | 65,873 | $ | 44,380 | $ | 37,304 | $ | 30,409 | $ | 34,952 | |||||||
Current assets |
293,906 | 297,267 | 285,729 | 282,678 | 295,731 | ||||||||||||
Total assets |
449,790 | 453,318 | 457,678 | 447,175 | 455,655 | ||||||||||||
Current liabilities |
46,696 | 62,554 | 66,986 | 66,048 | 71,881 | ||||||||||||
Total debt |
158,240 | 186,750 | 176,266 | 178,411 | 204,692 | ||||||||||||
Stockholders' equity |
196,496 | 157,081 | 163,779 | 158,001 | 148,830 | ||||||||||||
Other financial data: |
|||||||||||||||||
Capital expenditures |
$ | 4,552 | $ | 5,338 | $ | 4,967 | $ | 5,549 | $ | 5,004 | |||||||
Cash dividends declared per common share |
$ | – | $ | – | $ | 3.00 | $ | – | $ | – | |||||||
Margins: |
|||||||||||||||||
Gross profit |
27.7% | 29.8% | 30.4% | 27.9% | 28.8% | ||||||||||||
Operating |
4.3% | 5.5% | 8.7% | 4.8% | 9.0% | ||||||||||||
- (1)
- In
2009, our results were beneficially impacted by a gain on extinguishment of debt of $3.4 million. This was partially offset by the
$1.0 million impairment of trademarks associated with our online music business. Earnings per share was diluted by the issuance of 1,700,000 shares of our Ordinary common stock in November
2009. These items are described more fully in "Item 7. Management's Discussion and Analysis of Financial Condition and Results of Operations."
- (2)
- In
2008, our results were adversely impacted by the impairment of our band division goodwill of $8.6 million and facility
rationalization charges, including property impairment and severance costs totaling $1.3 million. This was partially offset by a gain on extinguishment of debt of $0.6 million. These
items are described more fully in "Item 7. Management's Discussion and Analysis of Financial Condition and Results of Operations."
- (3)
- In 2006, our results were adversely affected by a significant increase in our provision for doubtful accounts, which resulted from the bankruptcy filings of two large band division customers; the loss on extinguishment of debt of $9.7 million; and the strike at our Elkhart, Indiana brass instrument manufacturing facility. These items are described more fully in our Annual Report on Form 10-K for the period ended December 31, 2006.
20
Item 7. Management's Discussion and Analysis of Financial Condition and Results of Operations (Tabular Amounts in Thousands)
Introduction
The following discussion provides an assessment of the results of our operations and liquidity and capital resources together with a brief description of certain accounting policies. Accordingly, the following discussion should be read in conjunction with our Consolidated Financial Statements and the Notes to Consolidated Financial Statements included within this report.
Overview
We, through our operating subsidiaries, are one of the world's leading manufacturers of musical instruments. Our strategy is to capitalize on our strong brand names, leading market positions, strong distribution networks, and quality products.
Piano Segment – Sales of our pianos are influenced by general economic conditions, demographic trends and general interest in music and the arts. The operating results of our piano segment are primarily affected by Steinway & Sons grand piano sales. Given the total number of these pianos that we sell in any year (1,752 sold in 2009), a slight change in units sold can have a material impact on our business and operating results. Our results are also influenced by sales of Boston and Essex pianos, which together represented 74% of total piano units sold and 22% of total piano revenues in 2009. Our Boston piano line and many of our Essex piano models are sourced from Asia by single manufacturers. The ability of these manufacturers to produce and ship products to us could impact our business and operating results. A breakdown of sales by our divisions and their geographic location can be found in Note 17 to the financial statements. In 2009, our piano sales had the following geographic breakdown based on customer location: approximately 35% in the United States, 36% in Europe, 10% in Japan, 9% in China, and the remaining 10% primarily in other Asian countries. For the year ended December 31, 2009, our piano segment sales were $180.0 million, representing 59% of our total revenues.
Piano Outlook for 2010 – Similar to 2009, we expect a challenging year for our piano segment with respect to sales and gross profit. We anticipate the domestic market will be as challenging as the major overseas markets. We will continue to manage production levels so as not to build excess inventory and believe the headcount reductions made in 2009 will enable us to operate our facilities more efficiently. We will continue to monitor and restrict expenses, as well as assist our dealers through the U.S. credit crisis without undue risk to receivable collectibility. We currently have sufficient manufacturing capacity to meet anticipated or increased demand.
Band Segment – Our student band instrument sales are influenced by trends in school enrollment, general attitudes toward music and the arts, and our ability to provide competitively priced products to our dealer network. Management estimates that 75% of our domestic band sales are generated through educational programs; the remainder is to amateur or professional musicians or performing groups, including symphonies and orchestras.
In recent years we expanded our offerings of sourced products to include quality, competitively priced instruments that have our brand names and are built to our specifications. Our product offerings are tailored to the needs of traditional school music dealers who provide full-service rental programs to beginning band students, as well as music retailers and e-commerce dealers selling directly to end consumers from their stores or through the Internet. We believe our product offerings have helped us remain competitive at various price points and will continue to do so in the future.
21
In 2009, beginner instruments accounted for approximately 60% of band & orchestral unit shipments and approximately 30% of band instrument revenues, with intermediate and professional instruments representing the balance. In 2009, approximately 75% of band sales were in the United States, 11% in Europe and the remaining 14% primarily in Japan and Canada. For the year ended December 31, 2009, our band sales were $126.4 million, representing 41% of our total revenues.
Band Outlook for 2010 – We expect margins to improve, although sales will remain somewhat challenging this year for our band division. Our dealers continue to be adversely impacted by the credit crisis and order only what they need and can readily sell. We have reduced production of certain instruments so as not to build excess inventory, and continue to monitor order levels so we may build sufficient inventory to meet demand. We made headcount reductions in 2009 and will continue to restrict expenses. Similar to the piano division, we are helping our dealers through the U.S. credit crisis without undue risk to receivable collectibility. We currently have sufficient manufacturing capacity to meet anticipated or increased demand.
Inflation and Foreign Currency Impact – Although we cannot accurately predict the precise effect of inflation on our operations, we do not believe that inflation has had a material effect on sales or results of operations in recent years.
Sales to customers outside the United States represented 49% of consolidated sales in 2009. We record sales in euro, Japanese yen, British pounds, and Chinese renminbi. In 2009, we generated 79% of our international sales through our piano segment. Foreign exchange rate changes reduced reported sales by approximately $2.6 million in the current year. Although currency fluctuations affect international sales, they also affect cost of sales and related operating expenses. Consequently, they generally have not had a material impact on operating income. We use financial instruments such as forward exchange contracts and currency options to reduce the impact of exchange rate fluctuations on firm and anticipated cash flow exposures and certain assets and liabilities denominated in currencies other than the functional currency of the affected division. We do not purchase currency-related financial instruments for purposes other than exchange rate risk management.
Taxes – We are subject to U.S. income taxes as well as tax in several foreign jurisdictions in which we do business. Some of these foreign jurisdictions have higher statutory rates than the United States. In addition, certain of our operations are subject to both U.S. and foreign taxes. However, in such cases we receive a credit against our U.S. taxes for foreign taxes paid equal to the percentage that such foreign income (as adjusted for reallocated interest) represents of the total income subject to U.S. tax. Accordingly, our effective tax rates will vary depending on the relative proportion of foreign to U.S. income and the absorption of foreign tax credits in the United States.
In 2009, we were able to use over 80% of the foreign tax credits generated during the year. We recognized a benefit of $0.6 million for the excess foreign tax credits generated. There are $1.0 million of foreign tax credits due to expire in the event they are not utilized in our 2009 federal return. Currently, we do not anticipate using these credits. However, since they were fully reserved in a prior period, their expiration will have no impact on our effective rate. Should we be able to use these credits, it would beneficially impact our rate in 2010. Our overall effective tax rate for 2009 was 37.3%, which is comprised of 35.8% relating to current period operations and 1.5% relating to discrete items such as uncertain tax positions and settlements with taxing authorities.
In 2008, we were able to use approximately 60% of the foreign tax credits generated during the year. We recognized a benefit of $0.9 million for the excess foreign tax credits generated, net of reserves, which were recorded based on our recent historical foreign tax credit usage trends and anticipated ratios of foreign source income to domestic income in the future. Our rate was beneficially impacted by $1.1 million in reduction of taxes, interest, and penalties associated with uncertain tax
22
positions that were settled during the year. Accordingly, our overall effective tax rate was 37.7% in 2008.
In 2007, we recognized a benefit of approximately $0.3 million due to the reduction in German tax rates and were able to use a majority, but not all, of our foreign tax credits. We carried forward $1.7 million of credits, and recognized the full benefit for the excess foreign tax credits generated. However, our rate was adversely impacted by approximately $0.6 million of taxes, penalties, and interest associated with uncertain tax positions. Accordingly, our overall effective tax rate was 39.5% in 2007.
Results of Operations
Fiscal Year 2009 Compared to Fiscal Year 2008
| |
For the years ended December 31, | |
Change | |||||||||||||||||
|---|---|---|---|---|---|---|---|---|---|---|---|---|---|---|---|---|---|---|---|---|
| |
2009 | |
2008 | |
$ | % | ||||||||||||||
Net sales |
||||||||||||||||||||
Band |
$ | 126,437 | $ | 159,047 | (32,610 | ) | (20.5 | ) | ||||||||||||
Piano |
179,999 | 228,366 | (48,367 | ) | (21.2 | ) | ||||||||||||||
Total sales |
306,436 | 387,413 | (80,977 | ) | (20.9 | ) | ||||||||||||||
Cost of sales |
||||||||||||||||||||
Band |
98,058 | 124,752 | (26,694 | ) | (21.4 | ) | ||||||||||||||
Piano |
123,465 | 147,371 | (23,906 | ) | (16.2 | ) | ||||||||||||||
Total cost of sales |
221,523 | 272,123 | (50,600 | ) | (18.6 | ) | ||||||||||||||
Gross profit |
||||||||||||||||||||
Band |
28,379 | 22.4% | 34,295 | 21.6% | (5,916 | ) | (17.3 | ) | ||||||||||||
Piano |
56,534 | 31.4% | 80,995 | 35.5% | (24,461 | ) | (30.2 | ) | ||||||||||||
Total gross profit |
84,913 | 115,290 | (30,377 | ) | (26.3 | ) | ||||||||||||||
|
27.7% | 29.8% | ||||||||||||||||||
Operating expenses |
70,666 |
84,220 |
(13,554 |
) |
(16.1 |
) |
||||||||||||||
Facility rationalization and |
976 | 9,877 | (8,901 | ) | (90.1 | ) | ||||||||||||||
Total operating expenses |
71,642 | 94,097 | (22,455 | ) | (23.9 | ) | ||||||||||||||
Income from operations |
13,271 |
21,193 |
(7,922 |
) |
(37.4 |
) |
||||||||||||||
Other income, net |
(1,847 |
) |
(536 |
) |
(1,311 |
) |
244.6 |
|||||||||||||
Gain on extinguishment of debt |
(3,434 | ) | (636 | ) | (2,798 | ) | 439.9 | |||||||||||||
Net interest expense |
10,045 | 9,218 | 827 | 9.0 | ||||||||||||||||
Non-operating expenses |
4,764 | 8,046 | (3,282 | ) | (40.8 | ) | ||||||||||||||
Income before income taxes |
8,507 |
13,147 |
(4,640 |
) |
(35.3 |
) |
||||||||||||||
Income tax provision |
3,171 |
37.3% |
4,961 |
37.7% |
(1,790 |
) |
(36.1 |
) |
||||||||||||
Net income |
$ |
5,336 |
$ |
8,186 |
(2,850 |
) |
(34.8 |
) |
||||||||||||
Overview – The same economic conditions discussed above negatively impacted both the piano and band divisions' revenue throughout 2009. Piano division revenue was adversely affected by the current economic crisis as well as our dealers' access to available financing. Piano margins continued to be negatively impacted by lower production volume at both of our manufacturing facilities. Band division sales decreased as a result of reduced demand, similar credit restrictions, and dealers' tendency to only order products that can be resold quickly. However, band margins improved due largely to lower cash
23
discounts and sales program costs. In an effort to mitigate the impact of lower gross profit, management has reduced headcount, lowered salaries, suspended or reduced benefits, and taken other cost saving measures throughout the Company.
Piano division results include the operations of our online music business, which recognized an impairment charge of $1.0 million on its trademark assets due to a decline in estimated forecasted discounted cash flows as a result of the economic downturn. No charge was taken against any other intangible assets and no other events or circumstances have occurred subsequent to our annual testing in July 2009 which would indicate impairment.
Net Sales – Net sales decreased $81.0 million due to decreases in both the band and piano division revenues of 21%. Band division revenues decreased $32.6 million on a 32% decrease in unit shipments. This was mitigated by a shift from beginner level instruments towards higher priced intermediate and professional level instruments. Piano revenues, which included $8.4 million of online music retail sales, deteriorated $48.4 million in the current period.
Domestically, Steinway grand unit shipments dropped 39%, while mid-priced piano unit shipments decreased 22%, resulting in $27.6 million lower revenues. Overseas Steinway grand unit shipments decreased 23% and mid-priced piano line shipments decreased 10%, causing the $20.8 million deterioration in sales. This includes a $2.6 million reduction in revenues attributable to foreign exchange. We experienced reduced demand at both the wholesale and retail levels worldwide, although our mid-priced piano lines have been less affected by the economic downturn.
Gross Profit – Gross profit fell $30.4 million due to lower sales at both divisions and lower margins at the piano division. The band division's gross margin increased slightly, from 21.6% to 22.4% during the period. Pension costs increased $3.3 million due primarily to pension asset portfolio deterioration. This was more than offset by reduced cash discounts and sales program costs, which were $3.7 million higher in the year-ago period. The absence of severance costs associated with our facility rationalization project, which were $0.9 million in the year-ago period, and the shift in mix to certain higher margin accessories and brass instruments mitigated the unabsorbed overhead resulting from lower production.
Piano segment gross profit dropped $24.5 million during the period. Domestically, piano margins decreased from 28.9% to 26.4% as the factory produced 37% fewer Steinway grand pianos than in the year-ago period in order to manage inventory levels. This resulted in higher unabsorbed overhead and product costs, which adversely impacted the margin. Overseas margins went from 41.3% to 35.4% as our factory in Germany also reduced production of Steinway grands by 35% compared to 2008.
Operating Expenses – Operating expenses were $13.6 million lower due to several factors. Sales and marketing expenses decreased $9.1 million due to lower salaries, commissions, and bonuses, as well as decreased spending for trade shows and advertising. Due to reductions in headcount, wages, benefits, and outside services, general and administrative costs were $4.6 million less than in 2008.
Facility Rationalization and Impairment Charges – Facility rationalization and impairment charges decreased $8.9 million. We wrote off $8.6 million of band division goodwill in the year-ago period, whereas in the current period, impairment charges were limited to the $1.0 million write down of trademarks associated with our online music business.
Non-operating Expenses – Non-operating expenses decreased $3.3 million due to the extinguishment of $10.9 million of our Senior Notes, which resulted in a $3.4 million net gain, as compared to the $0.6 million gain in 2008. Other income, net increased $1.3 million over the year ago period. Foreign exchange losses were $0.9 million more than in the year ago period. However, these expenses were more than offset by the shift from losses to gains on our Supplemental Executive Retirement Plan
24
("SERP") assets and increased net income from our Steinway Hall property. Net interest expense was $0.9 million higher due to lower interest income on band division financed receivables.
Results of Operations
Fiscal Year 2008 Compared to Fiscal Year 2007
| |
For the years ended December 31, | |
Change | |||||||||||||||||
|---|---|---|---|---|---|---|---|---|---|---|---|---|---|---|---|---|---|---|---|---|
| |
2008 | |
2007 | |
$ | % | ||||||||||||||
Net sales |
||||||||||||||||||||
Band |
$ | 159,047 | $ | 171,124 | (12,077 | ) | (7.1 | ) | ||||||||||||
Piano |
228,366 | 235,190 | (6,824 | ) | (2.9 | ) | ||||||||||||||
Total sales |
387,413 | 406,314 | (18,901 | ) | (4.7 | ) | ||||||||||||||
Cost of sales |
||||||||||||||||||||
Band |
124,752 | 136,870 | (12,118 | ) | (8.9 | ) | ||||||||||||||
Piano |
147,371 | 145,958 | 1,413 | 1.0 | ||||||||||||||||
Total cost of sales |
272,123 | 282,828 | (10,705 | ) | (3.8 | ) | ||||||||||||||
Gross profit |
||||||||||||||||||||
Band |
34,295 | 21.6% | 34,254 | 20.0% | 41 | 0.1 | ||||||||||||||
Piano |
80,995 | 35.5% | 89,232 | 37.9% | (8,237 | ) | (9.2 | ) | ||||||||||||
Total gross profit |
115,290 | 123,486 | (8,196 | ) | (6.6 | ) | ||||||||||||||
|
29.8% | 30.4% | ||||||||||||||||||
Operating expenses |
84,220 |
88,156 |
(3,936 |
) |
(4.5 |
) |
||||||||||||||
Facility rationalization and |
9,877 | 128 | 9,749 | 7,616.4 | ||||||||||||||||
Total operating expenses |
94,097 | 88,284 | 5,813 | 6.6 | ||||||||||||||||
Income from operations |
21,193 |
35,202 |
(14,009 |
) |
(39.8 |
) |
||||||||||||||
Other income, net |
(536 |
) |
(59 |
) |
(477 |
) |
808.5 |
|||||||||||||
Gain on extinguishment of debt |
(636 | ) | – | (636 | ) | 100.0 | ||||||||||||||
Net interest expense |
9,218 | 9,771 | (553 | ) | (5.7 | ) | ||||||||||||||
Non-operating expenses |
8,046 | 9,712 | (1,666 | ) | (17.2 | ) | ||||||||||||||
Income before income taxes |
13,147 |
25,490 |
(12,343 |
) |
(48.4 |
) |
||||||||||||||
Income tax provision |
4,961 |
37.7% |
10,080 |
39.5% |
(5,119 |
) |
(50.8 |
) |
||||||||||||
Net income |
$ |
8,186 |
$ |
15,410 |
(7,224 |
) |
(46.9 |
) |
||||||||||||
Overview – The facility rationalization project at our band division was completed, and production at closed plants was moved into existing plants. However, the U.S. economic crisis adversely impacted fourth quarter band revenues, since dealers only ordered products that they could resell quickly. Nevertheless, margins improved despite the $0.9 million incurred due to plant closures.
Piano division revenues and margins decreased due to domestic piano results. Fewer Steinway grand unit sales and the adverse impact of domestic manufacturing facility shutdowns, which were taken in an effort to control inventory, were the primary causes. Piano division results include the operations of our online music division.
Our fall budgeting and planning process provides multi-year cash flow projections which we use to conduct our annual impairment testing of intangible assets. Recent decreases in order volume, the adverse impact of unavailable sourced products, delays in producing new product lines, and recent
25
economic events, coupled with other factors, caused us to lower sales expectations. As a result, our future anticipated cash flows at the band division were reduced and our goodwill was determined to be impaired. Accordingly, we recorded an $8.6 million charge during the period to fully write off this asset. Analyses of band division trademarks and other assets during the fall indicated no other impairment, so no further charges have been taken. Our analysis of the piano division's intangible assets in the fall indicated no impairment charge was required. We performed an update of our analysis as of December 31, 2008 due to current economic conditions. No other impairments were noted.
Net Sales – Net sales decreased $18.9 million which is attributable to both band and domestic piano division performance. Band division revenues decreased $12.1 million, virtually all of which was caused by the 38% decrease in brass and woodwind unit shipments in the fourth quarter. This was mitigated by a shift towards higher priced intermediate and professional level instruments and improved percussion instrument sales. Piano revenue, which included $5.0 million of online music retail sales, deteriorated $6.8 million due to the $8.2 million decrease in domestic piano revenues. Steinway grand unit shipments decreased 16% and mid-priced piano line shipments decreased 8% domestically as demand fell at both the wholesale and retail level. Overseas piano sales improved $1.3 million, which includes $5.5 million in foreign currency translation. Steinway grand unit shipments were 10% lower, although mid-priced piano line shipments remained stable.
Gross Profit – Gross profit fell $8.2 million due to lower domestic piano sales and margins. Although we incurred $0.9 million in severance and other charges associated with the facility rationalization project, band gross profit was consistent due to the $2.4 million reduction in pension and retirement benefit costs. Unabsorbed overhead and production variances were also lower than in 2007.
Piano segment gross profit dropped $8.2 million primarily due to the decline in domestic piano sales. The overseas margin remained unchanged from the prior period at 41.3%. Domestically, margins dropped from 34.5% to 28.9% due to the 25% reduction in production, which was implemented in order to control inventory levels. The absence of a higher margin limited edition piano, lower margins on mid-priced piano shipments due to unfavorable exchange rates, and higher physical inventory adjustments, which were atypically favorable in 2007, were also factors in the margin deterioration.
Operating Expenses – Operating expenses were $3.9 million lower primarily due to the $1.7 million reduction in bad debt expense. Advertising expenses, salaries, commissions, and professional fees also decreased.
Facility rationalization and impairment charges – Facility rationalization and impairment charges of $9.9 million are comprised of $8.6 million associated with the write off of goodwill discussed above and $1.3 million in facility impairment charges at band locations that have been closed or sold.
Non-operating Expenses – Non-operating expenses decreased $1.7 million due to the $0.6 million gain on extinguishment of $5.8 million of our Senior Notes. A $0.6 million shift from foreign exchange losses to foreign exchange gains also contributed to the improvement. Lower legal fees associated with the West 57th street building were offset by losses on our SERP assets.
26
Net interest expense decreased $0.6 million primarily due to the extinguishment of $5.8 million of our bond debt early in the year. Fewer borrowings on our domestic line of credit also contributed to the improvement.
Liquidity and Capital Resources
We have relied primarily upon cash provided by operations, supplemented as necessary by seasonal borrowings under our working capital lines, to finance our operations, repay or repurchase long-term indebtedness, finance acquisitions, and fund our capital expenditures. Our overseas divisions, particularly those in Asia, are normally in a borrowing position on their lines. These borrowings are likely to be less than $5.0 million at any given time. In 2007, domestic borrowings peaked at $28.9 million, due to the dividend we issued in March 2007, coupled with seasonal borrowings and the semi-annual interest payment on our bonds. In 2008, our domestic line went virtually unused until the fourth quarter, when we borrowed $30.0 million to ensure short-term liquidity. We paid down $15.0 million of that balance prior to December 31, 2008. In 2009, we utilized our domestic line of credit most of the year, and our borrowings reached a high of $34.9 million, largely to ensure short-term liquidity by maintaining a substantial cash balance. However, we paid down our domestic borrowings in November and December and had nothing outstanding as of December 31, 2009.
Cash Flows – Our statements of cash flows are summarized as follows:
| For the years ended December 31, | 2009 | 2008 | 2007 | ||||||||
|---|---|---|---|---|---|---|---|---|---|---|---|
Net income: |
$ | 5,336 | $ | 8,186 | $ | 15,410 | |||||
Changes in operating assets and liabilities |
10,206 | (21,988 | ) | 8,297 | |||||||
Other adjustments to reconcile net income to cash flows from operating activities |
8,374 | 20,773 | 10,358 | ||||||||
Cash flows from operating activities |
23,916 | 6,971 | 34,065 | ||||||||
Cash flows from investing activities |
(5,347 | ) | (7,655 | ) | (4,760 | ) | |||||
Cash flows from financing activities |
2,858 | 9,084 | (23,217 | ) | |||||||
In 2009, cash flows from operating activities increased $16.9 million. Reduced production and purchasing resulted in an improvement of cash provided by inventory of $25.9 million while cash used for liabilities decreased $1.9 million due to fewer purchases and controlled spending. The beneficial impact of these items more than offset the decrease in net income.
In 2008, cash flows from operating activities decreased $27.1 million. Cash used for inventory increased $24.5 million due to the band division, which experienced an unexpected inventory buildup due to a $12.1 million reduction in sales, virtually all of which occurred in the fourth quarter. Also, cash used for liability related items increased $17.7 million due to large pension contributions, tax related payments, and reductions in employee benefit and deferred income accruals. These items exceeded the positive impact of cash provided by accounts receivable, which increased $14.1 million largely due to more stringent credit criteria at the band division.
In 2007, cash flows from operating activities increased $4.8 million primarily due to the $16.1 million shift from net loss to net income. Cash provided by operating liabilities decreased $2.3 million due to lower environmental, legal, and other liabilities. Cash provided by inventory decreased $2.9 million, as we continued to carry excess inventory at our domestic piano division.
In 2009, cash used for investing activities dropped $2.3 million. In 2008, we acquired Arkiv and Clickpoint and paid out $3.2 million related to acquisitions (See Note 3). In 2009, acquisition activity was limited to the purchase of a retail store in Dusseldorf, Germany for $0.8 million. Although capital expenditures were $0.8 million lower than the year-ago period, proceeds from sales of property were lower by the same amount. In 2008, cash used for investing activities increased $2.9 million due to our
27
acquisitions of Arkiv and Clickpoint. In 2007, cash used for investing activities increased $1.0 million, largely due to the absence of securities sales which occurred in the prior year.
In 2009, cash provided by financing activities decreased $6.2 million. Although we received $27.8 million in proceeds from sales of our stock, we utilized $15.0 million to pay off our domestic line of credit, $2.7 million to pay down our foreign borrowings, and $7.3 million to repurchase $10.9 million in principal of our Senior Notes. In 2008, cash provided by financing activities shifted $32.3 million largely due to the $15.0 million outstanding borrowing on our domestic line of credit, in comparison to the use of $25.2 million used to pay dividends in 2007. Despite this dividend payment and $0.9 million less in proceeds from issuance of stock, cash used for financing activities in 2007 decreased $8.8 million because we did not have any debt restructuring activities, as in the prior year.
Capital Expenditures – Our capital expenditures consist primarily of production equipment, plant and facility improvements, and software and computer system upgrades. We expect capital spending in 2010 to be in the range of $3.0 to $4.0 million, relating to similar items, along with $1.0 to $2.0 million for improvements and renovations at our building in New York City.
Seasonality – Consistent with industry practice, we sell band instruments almost entirely on credit utilizing the two financing programs described below. Due to these programs, we have large working capital requirements during certain times of the year when band instrument receivable balances reach highs of approximately $40 to $45 million in August and September, and lesser requirements when they are at lows of approximately $30 to $35 million in January and February. The financing options, intended to assist dealers with the seasonality inherent in the industry and facilitate the rent-to-own programs offered to students by many retailers, also allow us to match our production and delivery schedules. The following forms of financing are offered to qualified band instrument dealers:
- a)
- Receivable dating – Payments on purchases made from October through August of the
following year are due in October. Dealers are offered discounts for early payment.
- b)
- Note receivable financing – Dealers that meet certain credit qualifications may convert open accounts to a note payable to us. The note program is offered primarily in October and coincides with the receivable dating program. The terms of the notes generally include payment over a nine to twelve month period with interest ranging from 7.5% to 10.0% (generally 4% to 5% over prime). Interest rates are contingent upon credit ratings and borrowing periods. In certain situations, we have offered long-term arrangements for up to thirty six months. In most instances, the note receivable is secured by dealer inventories and receivables.
Other Financing Arrangements – We established a program in 2009 to provide financing to certain domestic piano dealers. As of December 31, 2009, the total financing available to these dealers was less than $1.0 million. Beyond this program, we generally do not provide extended financing arrangements to our piano dealers. Typically, if financing is required by a dealer, we will facilitate arrangements through a third party provider. We generally provide no guarantees with respect to these arrangements.
Off-Balance Sheet Arrangements – We currently do not have any off-balance sheet arrangements that have, or are reasonably likely to have a current or future effect on our financial condition, changes in financial condition, revenues or expenses, results of operations, liquidity, capital expenditures or capital resources that is material to investors.
Pensions and Other Postretirement Benefits – When determining the amounts to be recognized in the consolidated financial statements related to our domestic pension, we used a long-term rate of return on plan assets of 9%, which was developed with input from our actuaries and our investment committee, and is consistent with that of prior years. We believe that 9% is consistent with the
28
historical long-term return trends on our domestic pension assets and our expectations for future returns. The discount rate utilized for determining future pension and other postretirement benefit obligations for our domestic plans is based on a long-term bond yield curve which matches the expected benefit payment period under the plan. The bonds used have been rated Aa or AA or better by recognized rating agencies, are non-callable, and have at least $250.0 million par outstanding to ensure they are sufficiently marketable. The discount rates used for December 31, 2009 and 2008 were 5.95% and 6.54% for our domestic pension plan and 5.83% and 6.70% for our postretirement benefit obligation plan.
The weighted-average discount rates (5.69% and 6.30% as of December 31, 2009 and 2008, respectively) and rates of return (6.00% as of December 31, 2009 and 2008) on plan assets for our foreign pension and other postretirement benefit plans were similarly developed utilizing long-term rates of return and discount rates reasonably expected to occur in the applicable jurisdiction.
Borrowing Activities and Availability – We have a domestic credit facility with a syndicate of domestic lenders (the "Credit Facility"). The Credit Facility provides us with a potential borrowing capacity of $110.0 million in revolving credit loans, and expires on September 29, 2011. It also provides for borrowings at either London Interbank Offering Rate ("LIBOR") plus a range from 1.25% to 1.75% or as-needed borrowings at an alternate base rate, plus a range from 0.00% to 0.25%; both ranges depend upon availability at the time of borrowing. Borrowings are collateralized by our domestic accounts receivable, inventory and fixed assets.
Our non-domestic credit facilities provide for borrowings equivalent to $27.5 million as of December 31, 2009. There have been no material changes to our borrowing abilities overseas, and we typically are in a borrowing position of less than $5.0 million at any given time. Our non-domestic credit facilities are discussed more fully in Note 11 to the consolidated financial statements.
At December 31, 2009, our total outstanding indebtedness amounted to $158.9 million, consisting of $158.3 million of Senior Notes due March 1, 2014 and $0.5 million of notes payable to foreign banks. We had nothing outstanding on our domestic line of credit as of December 31, 2009. Cash interest paid was $13.6 million in 2009, $12.4 million in 2008, and $13.5 million in 2007.
All of our debt agreements contain covenants that place certain restrictions on us, limiting our ability to incur additional indebtedness, to make investments in other entities, and make cash dividend payments. We were in compliance with all such covenants as of December 31, 2009 and do not anticipate any compliance issues in 2010. Our domestic debt agreements contain limitations, based on net income (among other things), on the amount of discretionary repurchases we may make of our Ordinary common stock. Our intent and ability to repurchase additional Ordinary common stock either directly from shareholders or on the open market is directly affected by this limitation.
We experience long production and inventory turnover cycles, which we constantly monitor since fluctuations in demand can have a significant impact on these cycles. In normal economic conditions, we are able to effectively utilize cash flow from operations to fund our debt and capital requirements and pay off our seasonal borrowings on our domestic line of credit. However, given the current global economy, we anticipate a challenging market for both our piano and band divisions in 2010. Despite this, we do not anticipate any adverse impact on our liquidity as we received $27.2 million in proceeds from a sale of stock in November 2009. We also entered into a contract to sell an additional 1,700,000 shares at a price of $16.00 by March 31, 2010, and currently expect to receive an additional $27.2 million in early 2010.
We intend to manage accounts receivable and credit risk, and control inventory levels via reduced purchases and production schedules. We have also taken measures to minimize non-critical expenditures, and have forgone salary increases and discretionary benefit program contributions. Our
29
intention is to manage cash outflow, maintain sufficient operating cash on hand to meet short-term requirements, and minimize credit facility borrowings.
We do not have any current plans or intentions that will have a material impact on our liquidity in 2010, although we may consider acquisitions or debt reductions that may require funding from operations or from our credit facilities. Other than those described, we are not aware of any trends, demands, commitments, or costs of resources that are expected to materially impact our liquidity or capital resources. Accordingly, we believe that cash on hand, together with cash flows anticipated from operations and available borrowings under the Credit Facility and non-domestic credit facilities, will be adequate to meet our debt service requirements, fund continuing capital requirements and satisfy our working capital and general corporate needs through 2010.
Contractual Obligations – The following table provides a summary of our contractual obligations at December 31, 2009.
| |
Payments due by period | |||||||||||||||
|---|---|---|---|---|---|---|---|---|---|---|---|---|---|---|---|---|
| Contractual Obligations |
Total | Less than 1 year |
1 - 3 years | 3 - 5 years | More than 5 years |
|||||||||||
Long-term debt(1) |
$ | 205,043 | $ | 11,622 | $ | 22,165 | $ | 171,256 | $ | – | ||||||
Capital leases |
19 | 11 | 8 | – | – | |||||||||||
Operating leases(2) |
261,122 | 5,977 | 10,240 | 8,397 | 236,508 | |||||||||||
Purchase obligations(3) |
25,659 | 25,455 | 204 | – | – | |||||||||||
Other non-current liabilities(4) |
42,256 | 6,097 | 5,624 | 4,633 | 25,902 | |||||||||||
Total |
$ | 534,099 | $ | 49,162 | $ | 38,241 | $ | 184,286 | $ | 262,410 | ||||||
Notes to Contractual Obligations:
- (1)
- Long-term
debt represents long-term debt obligations, the fixed interest on our Senior Notes, and the variable
interest on our other loans. We estimated the future variable interest obligation using the applicable December 31, 2009 rates. The nature of our long-term debt obligations is
described more fully in the "Borrowing Availability and Activities" section of "Liquidity and Capital Resources."
- (2)
- Approximately
$246.2 million of our operating lease obligations are attributable to the land lease associated with Steinway Hall, which
has eighty eight years remaining, and is described in Note 13 in the Notes to Consolidated Financial Statements included within this filing; the remainder is attributable to the leasing of
other facilities and equipment.
- (3)
- Purchase
obligations consist of firm purchase commitments for raw materials, finished goods, and equipment.
- (4)
- Our other non-current liabilities consist primarily of the long-term portion of our pension obligations, which are described in Note 14 in the Notes to Consolidated Financial Statements included within this filing, and obligations under employee and consultant agreements, which are described in Note 13 in the Notes to the Consolidated Financial Statements included within this filing. We have not included $0.4 million of uncertain tax positions within this schedule due to the uncertainty of the payment date, if any.
Critical Accounting Estimates
The SEC has issued disclosure guidance for "critical accounting policies." The SEC defines "critical accounting policies" as those that require application of management's most difficult,
30
subjective or complex judgments, often as a result of the need to make estimates about the effect of matters that are inherently uncertain and may change in subsequent periods.
Management is required to make certain estimates and assumptions during the preparation of the consolidated financial statements. These estimates and assumptions impact the reported amounts of assets and liabilities and disclosures of contingent assets and liabilities as of the date of the consolidated financial statements. Estimates and assumptions are reviewed periodically and the effects of revisions are reflected in the consolidated financial statements in the period they are determined to be necessary. Actual results could differ significantly from those estimates.
The significant accounting policies are described in Note 2 of the Notes to Consolidated Financial Statements included herein. Not all of these significant accounting policies require management to make difficult, subjective or complex judgments or estimates. However, management considers the following to be critical accounting policies based on the definition above.
Accounts Receivable
We establish reserves for accounts receivable and notes receivable. We review overall collectibility trends and customer characteristics such as debt leverage, solvency, and outstanding balances in order to develop our reserve estimates. Historically, a large portion of our sales at both our piano and band divisions has been generated by our top 15 customers. As a result, we experience some inherent concentration of credit risk in our accounts receivable due to its composition and the relative proportion of large customer receivables to the total. This is especially true at our band division, which characteristically has a majority of our consolidated accounts receivable balance. We consider the credit health and solvency of our customers when developing our receivable reserve estimates.
Inventory
We establish inventory reserves for items such as lower-of-cost-or-market and obsolescence. We review inventory levels on a detailed basis, concentrating on the age and amounts of raw materials, work-in-process, and finished goods, as well as recent usage and sales dates and quantities to help develop our estimates. Ongoing changes in our business strategy, including a shift from batch processing to single piece production flow, coupled with increased offshore sourcing, could affect our ability to realize the current cost of our inventory, and are considered by management when developing our estimates. We also establish reserves for anticipated book-to-physical adjustments based upon our historical level of adjustments from our annual physical inventories. We account for our inventory using standard costs. Accordingly, variances between actual and standard costs that are not abnormal in nature are capitalized into inventory and released based on calculated inventory turns. Abnormal costs are expensed in the period in which they occur.
Workers' Compensation and Self-Insured Health Claims
We establish self-insured workers' compensation and health claims reserves based on our trend analysis of data provided by third-party administrators regarding historical claims and anticipated future claims.
Warranty
We establish reserves for warranty claims based on our analysis of historical claims data, recent claims trends, and the various lengths of time for which we warranty our products.
31
Long-lived Assets
We review long-lived assets, such as property, plant, and equipment, for impairment whenever events or changes in circumstances indicate that the carrying amount of an asset may not be recoverable. We measure recoverability by comparing the carrying amount of the asset to the estimated future cash flows the asset is expected to generate.
We establish long-lived intangible assets based on estimated fair values, and amortize finite-lived intangibles over their estimated useful lives. We test our goodwill and indefinite-lived trademark assets for impairment annually or on an interim basis if events or circumstances indicate that the fair value of an asset may have decreased below its carrying value. Our assessment is based on several analyses, including a comparison of net book value to estimated fair values, market capitalization, and multi-year cash flows.
Pensions and Other Postretirement Benefit Costs
We make certain assumptions when calculating our benefit obligations and expenses. We base our selection of assumptions, such as discount rates and long-term rates of return, on information provided by our actuaries, investment advisors, investment committee, current rate trends, and historical trends for our pension asset portfolio. Our benefit obligations and expenses can fluctuate based on the assumptions management selects.
Income Taxes
We record valuation allowances for certain deferred tax assets related to foreign tax credit carryforwards and state net operating loss carryforwards. When assessing the realizability of deferred tax assets, we consider whether it is more likely than not that the deferred tax assets will be fully realized. The ultimate realization of these assets is dependent upon many factors, including the ratio of foreign source income to overall income and generation of sufficient future taxable income in the states for which we have loss carryforwards. When establishing or adjusting valuation allowances, we consider these factors, as well as anticipated trends in foreign source income and tax planning strategies which may impact future realizability of these assets.
A liability has been recorded for uncertain tax positions. When analyzing these positions, we consider the probability of various outcomes which could result from examination, negotiation, or settlement with various taxing authorities. The final outcome on these positions could differ significantly from our original estimates due to the following: expiring statutes of limitations; availability of detailed historical data; results of audits or examinations conducted by taxing authorities or agents that vary from management's anticipated results; identification of new tax contingencies; release of applicable administrative tax guidance; management's decision to settle or appeal assessments; or the rendering of court decisions affecting our estimates of tax liabilities; as well as other factors.
Stock-Based Compensation
We grant stock-based compensation awards which generally vest over a specified period. When determining the fair value of stock options and subscriptions to purchase shares under the employee stock purchase plan ("Purchase Plan"), we use the Black-Scholes option valuation model, which requires input of certain management assumptions, including dividend yield, expected volatility, risk-free interest rate, expected life of stock options granted during the period, and the life applicable to the Purchase Plan subscriptions. The estimated fair value of the options and subscriptions to purchase shares, and the resultant stock-based compensation expense, can fluctuate based on the assumptions used by management.
32
Environmental Liabilities
We make certain assumptions when calculating our environmental liabilities. We base our selection of assumptions, such as cost and length of time for remediation, on data provided by our environmental consultants, as well as information provided by regulatory authorities. We also make certain assumptions regarding the indemnifications we have received from others, including whether remediation costs are within the scope of the indemnification, the indemnifier's ability to perform under the agreement, and whether past claims have been successful. Our environmental obligations and expenses can fluctuate based on management's assumptions.
We believe the assumptions made by management provide a reasonable basis for the estimates reflected in our financial statements.
Recent Accounting Pronouncements
In September 2009, we adopted Financial Accounting Standards Board ("FASB") Accounting Standards Codification ("ASC") 105-10, "Generally Accepted Accounting Principles – Overall." FASB ASC 105-10 establishes the FASB Accounting Standards Codification ("Codification") to become the source of authoritative U.S. generally accepted accounting principles ("U.S. GAAP") recognized by the FASB to be applied by nongovernmental entities. Rules and interpretive releases of the SEC under authority of federal securities laws are also sources of authoritative U.S. GAAP for SEC registrants. The adoption of this standard did not have a material impact on our consolidated financial statements.
In June 2009, the FASB issued a new accounting standard, ASC 810, which changes the consolidation rules as they relate to variable interest entities. Specifically, the new standard makes significant changes to the model for determining who should consolidate a variable interest entity, and also addresses how often this assessment should be performed. We will be required to comply with this new standard on January 1, 2010. We do not expect the adoption will have a material impact on our consolidated financial statements.
In August 2009, the FASB issued a new accounting standard, Accounting Standards Update ("ASU") 2009-05, which provides additional guidance on the measurement of liabilities at fair value. Specifically, when a quoted price in an active market for the identical liability is not available, the new standard requires that the fair value of a liability be measured using one or more of the valuation techniques that should maximize the use of relevant observable inputs and minimize the use of unobservable inputs. In addition, an entity is not required to include a separate input or adjustment to other inputs relating to the existence of a restriction that prevents the transfer of a liability. We were required to comply with this standard in the fourth quarter of 2009. The adoption of this standard did not have a material impact on our consolidated financial statements.
In January 2010, the FASB issued 2010-06, which amends the existing fair value measurements and disclosures guidance. These amendments require a greater level of disaggregated information as well as more disclosure around valuation techniques and inputs to fair value measurements. The amendments also provide guidance on employers' disclosures about postretirement benefit plan assets to require that disclosures be provided by classes of assets instead of by major categories of assets. We will be required to comply with this new standard on January 1, 2010. We do not expect the adoption will have a material impact on our consolidated financial statements.
Item 7A. Quantitative and Qualitative Disclosures About Market Risk
Foreign Currency Risk
We are subject to market risk associated with changes in foreign currency exchange rates and interest rates. We mitigate some of our cash flow exposure to foreign currency fluctuations by holding forward foreign currency contracts. These contracts are not designated as hedges for accounting
33
purposes. The contracts relate primarily to intercompany transactions and are not used for trading or speculative purposes. The fair value of these contracts is sensitive to changes in foreign currency exchange rates. As of December 31, 2009, a 10% negative change in foreign currency exchange rates from market rates would decrease the fair value of the contracts by $0.4 million. Gains and losses on the foreign currency exchange contracts are defined as the difference between the contract rate at its inception date and the current forward rate. However, we would offset any such gains and losses by corresponding losses and gains, respectively, on the related asset or liability.
Interest Risk
Our interest rate exposure is limited primarily to interest rate changes on our variable rate debt. Our revolving loans bear interest at rates that fluctuate with changes in PRIME, LIBOR, TIBOR, and EURIBOR and are therefore sensitive to changes in market interest rates. For the year ended December 31, 2009, a hypothetical 10% increase in interest rates would have increased our interest expense by less than $0.1 million.
Our long-term debt includes $158.3 million of Senior Notes with a fixed interest rate. Accordingly, there would be no immediate impact on our interest expense associated with these Senior Notes due to fluctuations in market interest rates. However, based on a hypothetical 10% immediate decrease in market interest rates, the fair value of our Senior Notes, which would be sensitive to such interest rate changes, would be increased by approximately $1.3 million as of December 31, 2009.
34
Item 8. Financial Statements And Supplementary Data
35
REPORT OF UHY LLP, INDEPENDENT REGISTERED PUBLIC ACCOUNTING FIRM
To
the Board of Directors and Stockholders
Steinway Musical Instruments, Inc.
We have audited the accompanying consolidated balance sheets of Steinway Musical Instruments, Inc. and subsidiaries (the "Company") as of December 31, 2009 and 2008, and the related consolidated statements of operations, stockholders' equity, and cash flows for the years then ended. These financial statements are the responsibility of the Company's management. Our responsibility is to express an opinion on these financial statements based on our audits.
We conducted our audits in accordance with the standards of the Public Company Accounting Oversight Board (United States). Those standards require that we plan and perform the audit to obtain reasonable assurance about whether the financial statements are free of material misstatement. An audit includes examining, on a test basis, evidence supporting the amounts and disclosures in the financial statements. An audit also includes assessing the accounting principles used and significant estimates made by management, as well as evaluating the overall financial statement presentation. We believe that our audits provide a reasonable basis for our opinion.
In our opinion, the consolidated financial statements referred to above present fairly, in all material respects, the consolidated financial position of the Company as of December 31, 2009 and 2008, and the consolidated results of its operations and its cash flows for the years then ended in conformity with accounting principles generally accepted in the United States of America.
We also have audited, in accordance with the standards of the Public Company Accounting Oversight Board (United States), the effectiveness of the Company's internal control over financial reporting as of December 31, 2009, based on criteria established in Internal Control – Integrated Framework issued by the Committee of Sponsoring Organizations of the Treadway Commission (COSO), and our report dated March 10, 2010 expressed an unqualified opinion on the effectiveness of the Company's internal control over financial reporting.
/s/ UHY LLP
Boston,
Massachusetts
March 10, 2010
36
REPORT OF INDEPENDENT REGISTERED PUBLIC ACCOUNTING FIRM
To
the Board of Directors and Stockholders of
Steinway Musical Instruments, Inc.
Waltham, Massachusetts
We have audited the consolidated statements of operations, stockholders' equity, and cash flows of Steinway Musical Instruments, Inc. and subsidiaries ("the Company") for the year ended December 31, 2007. These financial statements are the responsibility of the Company's management. Our responsibility is to express an opinion on the financial statements based on our audit.
We conducted our audit in accordance with the standards of the Public Company Accounting Oversight Board (United States). Those standards require that we plan and perform the audit to obtain reasonable assurance about whether the financial statements are free of material misstatement. An audit includes examining, on a test basis, evidence supporting the amounts and disclosures in the financial statements. An audit also includes assessing the accounting principles used and significant estimates made by management, as well as evaluating the overall financial statement presentation. We believe that our audit provides a reasonable basis for our opinion.
In our opinion, such consolidated financial statements present fairly, in all material respects, the results of Steinway Musical Instruments, Inc. and subsidiaries' operations and their cash flows for the year ended December 31, 2007, in conformity with accounting principles generally accepted in the United States of America.
The Company adopted Financial Accounting Standards Board ("FASB") Interpretation No. 48, Accounting for Uncertainty in Income Taxes – an interpretation of FASB Statement No. 109, effective January 1, 2007.
/s/ DELOITTE & TOUCHE LLP
Boston,
Massachusetts
March 17, 2008
37
Steinway Musical Instruments, Inc. and Subsidiaries
CONSOLIDATED STATEMENTS OF OPERATIONS
(In Thousands Except Share and Per Share Data)
| For the years ended December 31, | 2009 | 2008 | 2007 | ||||||||
|---|---|---|---|---|---|---|---|---|---|---|---|
Net sales |
$ | 306,436 | $ | 387,413 | $ | 406,314 | |||||
Cost of sales |
221,523 | 272,123 | 282,828 | ||||||||
Gross profit |
84,913 |
115,290 |
123,486 |
||||||||
Operating expenses: |
|||||||||||
Sales and marketing |
38,742 | 47,804 | 48,393 | ||||||||
Provision for doubtful accounts |
1,161 | 714 | 2,442 | ||||||||
General and administrative |
29,083 | 33,693 | 35,005 | ||||||||
Amortization |
1,306 | 1,131 | 786 | ||||||||
Other operating expenses |
374 | 878 | 1,530 | ||||||||
Facility rationalization and impairment charges |
976 | 9,877 | 128 | ||||||||
Total operating expenses |
71,642 | 94,097 | 88,284 | ||||||||
Income from operations |
13,271 |
21,193 |
35,202 |
||||||||
Other income, net |
(1,847 |
) |
(536 |
) |
(59 |
) |
|||||
Gain on extinguishment of debt |
(3,434 | ) | (636 | ) | – | ||||||
Interest income |
(1,830 | ) | (3,049 | ) | (3,687 | ) | |||||
Interest expense |
11,875 | 12,267 | 13,458 | ||||||||
Total non-operating expenses |
4,764 | 8,046 | 9,712 | ||||||||
Income before income taxes |
8,507 |
13,147 |
25,490 |
||||||||
Income tax provision |
3,171 |
4,961 |
10,080 |
||||||||
Net income |
$ |
5,336 |
$ |
8,186 |
$ |
15,410 |
|||||
Earnings per share – basic |
$ |
0.60 |
$ |
0.96 |
$ |
1.81 |
|||||
Earnings per share – diluted |
$ |
0.60 |
$ |
0.95 |
$ |
1.78 |
|||||
Weighted average shares: |
|||||||||||
Basic |
8,855,138 | 8,557,761 | 8,521,700 | ||||||||
Diluted |
8,859,554 | 8,629,647 | 8,647,300 | ||||||||
See notes to consolidated financial statements.
38
Steinway Musical Instruments, Inc. and Subsidiaries
CONSOLIDATED BALANCE SHEETS
(In Thousands Except Share and Per Share Data)
| December 31, | 2009 | 2008 | ||||||
|---|---|---|---|---|---|---|---|---|
Assets |
||||||||
Current assets: |
||||||||
Cash |
$ | 65,873 | $ | 44,380 | ||||
Accounts, notes and other receivables, net |
45,073 | 60,581 | ||||||
Inventories, net |
158,030 | 166,508 | ||||||
Prepaid expenses and other current assets |
13,499 | 14,156 | ||||||
Deferred tax assets |
11,431 | 11,642 | ||||||
Total current assets |
293,906 | 297,267 | ||||||
Property, plant and equipment, net |
89,538 |
88,708 |
||||||
Trademarks |
15,284 | 16,148 | ||||||
Goodwill |
24,063 | 23,708 | ||||||
Other intangibles, net |
4,183 | 5,568 | ||||||
Other assets |
12,663 | 12,380 | ||||||
Long-term deferred tax asset |
10,153 | 9,539 | ||||||
Total assets |
$ |
449,790 |
$ |
453,318 |
||||
Liabilities and stockholders' equity |
||||||||
Current liabilities: |
||||||||
Debt |
$ | 537 | $ | 3,325 | ||||
Accounts payable |
9,764 | 16,947 | ||||||
Other current liabilities |
36,395 | 42,282 | ||||||
Total current liabilities |
46,696 | 62,554 | ||||||
Long-term debt |
157,703 |
183,425 |
||||||
Deferred tax liabilities |
7,124 | 6,263 | ||||||
Pension and other postretirement benefit liabilities |
35,766 | 37,543 | ||||||
Other non-current liabilities |
6,005 | 6,452 | ||||||
Total liabilities |
253,294 | 296,237 | ||||||
Commitments and contingent liabilities |
||||||||
Stockholders' equity: |
||||||||
Class A common stock, $.001 par value, 5,000,000 shares authorized, 477,952 shares issued and outstanding |
– | – | ||||||
Ordinary common stock, $.001 par value, 90,000,000 shares authorized, 11,844,592 and 10,082,083 shares issued in 2009 and 2008, respectively, and 9,817,816 and 8,055,307 shares outstanding in 2009 and 2008, respectively |
12 | 11 | ||||||
Additional paid-in capital |
125,192 | 96,180 | ||||||
Retained earnings |
126,415 | 121,079 | ||||||
Accumulated other comprehensive loss |
(7,851 | ) | (12,917 | ) | ||||
Treasury stock, at cost (2,026,776 shares of Ordinary common stock in 2009 and 2008) |
(47,272 | ) | (47,272 | ) | ||||
Total stockholders' equity |
196,496 | 157,081 | ||||||
Total liabilities and stockholders' equity |
$ |
449,790 |
$ |
453,318 |
||||
See notes to consolidated financial statements.
39
Steinway Musical Instruments, Inc. and Subsidiaries
CONSOLIDATED STATEMENTS OF CASH FLOWS
(In Thousands)
| For the years ended December 31, | 2009 | 2008 | 2007 | ||||||||||
|---|---|---|---|---|---|---|---|---|---|---|---|---|---|
Cash flows from operating activities: |
|||||||||||||
Net income |
$ | 5,336 | $ | 8,186 | $ | 15,410 | |||||||
Adjustments to reconcile net income to cash |
|||||||||||||
Depreciation and amortization |
10,370 | 10,928 | 10,477 | ||||||||||
Amortization of bond discount, net |
152 | 162 | 165 | ||||||||||
Gain on extinguishment of debt |
(3,434 | ) | (636 | ) | – | ||||||||
Facility rationalization charges |
– | 1,322 | – | ||||||||||
Goodwill and trademark impairment |
976 | 8,555 | – | ||||||||||
Stock-based compensation expense |
1,207 | 1,115 | 1,103 | ||||||||||
Excess tax benefits from stock-based awards |
– | (4 | ) | (410 | ) | ||||||||
Tax benefit from stock option exercises |
– | 5 | 735 | ||||||||||
Deferred tax benefit |
(1,679 | ) | (2,035 | ) | (3,925 | ) | |||||||
Provision for doubtful accounts |
1,161 | 714 | 2,442 | ||||||||||
Purchase of trading securities |
(51 | ) | (229 | ) | (211 | ) | |||||||
Other |
(328 | ) | 876 | (18 | ) | ||||||||
Changes in operating assets and liabilities: |
|||||||||||||
Accounts, notes and other receivables |
15,363 | 13,642 | (428 | ) | |||||||||
Inventories |
6,310 | (19,584 | ) | 4,876 | |||||||||
Prepaid expenses and other assets |
47 | (2,620 | ) | (376 | ) | ||||||||
Accounts payable |
(7,235 | ) | 4,257 | (4,712 | ) | ||||||||
Other current and non-current liabilities |
(4,279 | ) | (17,683 | ) | 8,937 | ||||||||
Cash flows from operating activities |
23,916 | 6,971 | 34,065 | ||||||||||
Cash flows from investing activities: |
|||||||||||||
Capital expenditures |
(4,552 | ) | (5,338 | ) | (4,967 | ) | |||||||
Proceeds from sales of property, plant and equipment |
25 | 854 | 207 | ||||||||||
Acquisition of businesses, net of cash acquired |
(820 | ) | (3,181 | ) | – | ||||||||
Cash flows from investing activities |
(5,347 | ) | (7,665 | ) | (4,760 | ) | |||||||
Cash flows from financing activities: |
|||||||||||||
Borrowings under lines of credit |
277,245 | 36,092 | 171,883 | ||||||||||
Repayments under lines of credit |
(294,913 | ) | (20,717 | ) | (174,473 | ) | |||||||
Repayments of long-term debt, net of discount |
(7,280 | ) | (4,981 | ) | – | ||||||||
Proceeds from issuance of common stock |
27,806 | 817 | 4,150 | ||||||||||
Purchase of treasury stock |
– | (2,131 | ) | – | |||||||||
Dividends paid |
– | – | (25,187 | ) | |||||||||
Excess tax benefits from stock-based awards |
– | 4 | 410 | ||||||||||
Cash flows from financing activities |
2,858 | 9,084 | (23,217 | ) | |||||||||
Effects of foreign exchange rate changes on cash |
66 |
(1,314 |
) |
807 |
|||||||||
Increase in cash |
21,493 | 7,076 | 6,895 | ||||||||||
Cash, beginning of year |
44,380 | 37,304 | 30,409 | ||||||||||
Cash, end of year |
$ | 65,873 | $ | 44,380 | $ | 37,304 | |||||||
Supplemental cash flow information: |
|||||||||||||
Interest paid |
$ | 13,646 | $ | 12,444 | $ | 13,510 | |||||||
Income taxes paid |
$ | 5,744 | $ | 14,150 | $ | 11,964 | |||||||
See notes to consolidated financial statements.
40
Steinway Musical Instruments, Inc. and Subsidiaries
CONSOLIDATED STATEMENTS OF STOCKHOLDERS' EQUITY
(In Thousands Except Share Data)
| |
Common Stock |
Additional Paid-In Capital |
Retained Earnings |
Accumulated Other Comprehensive Income (Loss) |
Treasury Stock |
Total Stockholders' Equity |
||||||||||||||
|---|---|---|---|---|---|---|---|---|---|---|---|---|---|---|---|---|---|---|---|---|
Balance, January 1, 2007 |
$ | 10 | $ | 90,266 | $ | 125,711 | $ | (10,550 | ) | $ | (47,436 | ) | $ | 158,001 | ||||||
Cumulative effect of adoption of revised accounting guidance for uncertain tax positions |
(2,757 |
) |
(2,757 |
) |
||||||||||||||||
Comprehensive income: |
||||||||||||||||||||
Net income |
15,410 | 15,410 | ||||||||||||||||||
Foreign currency translation adjustment |
5,232 | 5,232 | ||||||||||||||||||
Changes in pension and other postretirement benefits, net |
7,091 | 7,091 | ||||||||||||||||||
Total comprehensive income |
27,733 | |||||||||||||||||||
Dividends paid |
(25,187 | ) | (25,187 | ) | ||||||||||||||||
Exercise of 175,424 options for shares of common stock |
1 | 1,720 | (260 | ) | 2,144 | 3,605 | ||||||||||||||
Tax benefit of options exercised |
735 | 735 | ||||||||||||||||||
Stock-based compensation |
1,103 | 1,103 | ||||||||||||||||||
Issuance of 26,252 shares of common stock |
546 | 546 | ||||||||||||||||||
Balance, December 31, 2007 |
11 | 94,370 | 112,917 | 1,773 | (45,292 | ) | 163,779 | |||||||||||||
Comprehensive loss: |
||||||||||||||||||||
Net income |
8,186 | 8,186 | ||||||||||||||||||
Foreign currency translation adjustment |
(3,991 | ) | (3,991 | ) | ||||||||||||||||
Changes in pension and other postretirement benefits, net |
(10,699 | ) | (10,699 | ) | ||||||||||||||||
Total comprehensive loss |
(6,504 | ) | ||||||||||||||||||
Exercise of 6,500 options for shares of common stock |
(24 | ) | 151 | 127 | ||||||||||||||||
Stock-based compensation |
1,115 | 1,115 | ||||||||||||||||||
Tax benefit of options exercised |
5 | 5 | ||||||||||||||||||
Issuance of 29,379 shares of common stock |
690 | 690 | ||||||||||||||||||
Purchase of 80,300 shares of treasury stock |
(2,131 | ) | (2,131 | ) | ||||||||||||||||
Balance, December 31, 2008 |
11 | 96,180 | 121,079 | (12,917 | ) | (47,272 | ) | 157,081 | ||||||||||||
Comprehensive income: |
||||||||||||||||||||
Net income |
5,336 | 5,336 | ||||||||||||||||||
Foreign currency translation adjustment |
2,230 | 2,230 | ||||||||||||||||||
Changes in pension and other postretirement benefits, net |
2,836 | 2,836 | ||||||||||||||||||
Total comprehensive income |
10,402 | |||||||||||||||||||
Stock-based compensation |
1,207 | 1,207 | ||||||||||||||||||
Issuance of 1,762,509 shares of common stock |
1 | 27,805 | 27,806 | |||||||||||||||||
Balance, December 31, 2009 |
$ | 12 | $ | 125,192 | $ | 126,415 | $ | (7,851 | ) | $ | (47,272 | ) | $ | 196,496 | ||||||
See notes to consolidated financial statements.
41
Steinway
Musical Instruments, Inc. and Subsidiaries
NOTES TO CONSOLIDATED FINANCIAL STATEMENTS
Years Ended December 31, 2009, 2008, and 2007
(Tabular Amounts in Thousands Except Share and Per Share Data)
1. Nature of Business
Steinway Musical Instruments, Inc. and subsidiaries (the "Company") is one of the world's leading manufacturers of musical instruments. The Company, through its piano ("Steinway") and band ("Conn-Selmer") divisions, manufactures and distributes products within the musical instrument industry. Steinway produces the highest quality piano in the world and has one of the most widely recognized and prestigious brand names. Conn-Selmer is the leading domestic manufacturer of band & orchestral instruments and related accessories, including complete lines of brass, woodwind, percussion and string instruments. Selmer Paris saxophones, Bach Stradivarius trumpets, C.G. Conn French horns, Leblanc clarinets, King trombones and Ludwig snare drums are considered by many to be the finest such instruments in the world. In February 2009, we acquired a retail store in Dusseldorf, Germany. Results for this entity, which are not material, have been included within the piano segment since the date of acquisition.
Throughout these financial statements "we," "us," and "our" refer to Steinway Musical Instruments, Inc. and subsidiaries taken as a whole.
2. Significant Accounting Policies
Principles of Consolidation – Our consolidated financial statements include the accounts of all direct and indirect subsidiaries, all of which are wholly owned. All intercompany balances have been eliminated in consolidation.
Use of Estimates – The preparation of financial statements in conformity with accounting principles generally accepted in the United States of America requires us to make estimates and assumptions that affect the reported amounts of assets and liabilities, the disclosure of assets and contingent liabilities at the date of the financial statements, and the reported amounts of revenues and expenses during the reporting period. Actual results could differ from those estimates. The significant estimates in the financial statements include accounts receivable reserves, inventory reserves, workers' compensation and self-insured health claims, warranty reserves, impairment of long-lived assets, pension and other post retirement benefit cost assumptions, stock-based compensation assumptions, deferred income tax valuation allowances, uncertain tax positions, and environmental liabilities.
Revenue Recognition – Generally, revenue for wholesale transactions is recognized upon shipment following receipt of a valid dealer order. Retail revenue is generally recognized upon delivery to the customer in accordance with the customer's purchase agreement, and restoration revenue is recognized based on the completed contract method. Revenue from restoration services and rentals is not material to the consolidated financial statements and is included within net sales. Shipping and handling fees billed to customers are not material and are included within net sales and the related costs are reported within cost of sales. We provide for the estimated costs of warranties, discounts and returns at the time of revenue recognition.
Inventories – Inventories are stated at the lower of cost, determined on a first-in, first-out basis, or market.
Depreciation and Amortization – Property, plant and equipment are recorded at cost. Depreciation is provided using the straight-line method over the estimated useful lives of the assets. Leasehold
42
improvements are amortized using the straight-line method over the estimated useful lives of the improvements or the remaining term of the respective lease, whichever is shorter. Estimated useful lives are as follows:
Buildings and improvements |
15 – 40 years | |
Leasehold improvements |
5 – 15 years | |
Machinery, equipment and tooling |
3 – 10 years | |
Office furniture and fixtures |
3 – 10 years | |
Concert and Artist and rental pianos |
15 years |
When impairment indicators are present, we evaluate the recoverability of our long-lived assets by comparing the estimated future cash flows expected to be generated by those assets to their carrying value. Should the assessment indicate an impairment, the affected assets are written down to fair value. Assets held-for-sale are included in prepaid expenses and other current assets and are recorded at the lower of cost or net realizable value. We had $1.3 million of such assets, which are comprised of two facilities no longer in use, as of December 31, 2009 and 2008.
Goodwill, Trademarks, and Other Intangible Assets – Intangible assets other than goodwill and indefinite-lived trademarks are amortized on a straight-line basis over their estimated useful lives. Deferred financing costs are amortized over the repayment periods of the underlying debt. We test our goodwill and trademarks for impairment annually, or on an interim basis if events or circumstances indicate that the fair value of an asset has decreased below its carrying value.
We performed our annual goodwill and intangible asset impairment test as of July 31, 2009. Based on our analysis, it was determined that a portion of the trademarks associated with the online music business of the piano division was impaired. Our fall budgeting and planning process provides multi-year cash flows which we use to conduct our annual impairment testing of intangible assets. This testing indicated a decline in estimated forecasted discounted cash flows expected by the online music business largely as a result of the economic downturn. Accordingly, we wrote down the trademarks by $1.0 million during the period. Our analysis of the other piano and band division trademarks did not indicate an impairment; therefore, no charge was taken against those assets or any other intangible assets attributable to those divisions. No other events or circumstances occurred subsequent to our annual impairment test which would have indicated that these assets may be impaired.
In 2008, our annual impairment testing indicated a decline in the estimated forecasted discounted cash flows for the band division. Accordingly, we wrote off all of the $8.6 million in goodwill attributable to that division. We did not recognize any impairments for the year ended December 31, 2007.
Advertising – Advertising costs are expensed as incurred. Advertising expense was $5.1 million for the year ended December 31, 2009, $7.1 million for the year ended December 31, 2008, and $9.0 million for the year ended December 31, 2007.
43
Accounts, Notes and Other Receivables, Net – Accounts, notes and other receivables are recorded net of allowances for bad debts, discounts and returns.
| December 31, | 2009 | 2008 | |||||
|---|---|---|---|---|---|---|---|
Accounts receivable |
$ | 43,346 | $ | 58,982 | |||
Notes and other receivables |
15,370 | 17,494 | |||||
Accounts, notes and other receivables, gross |
58,716 | 76,476 | |||||
Allowance for doubtful accounts |
(11,088 | ) | (12,546 | ) | |||
Allowance for discounts and returns |
(2,555 | ) | (3,349 | ) | |||
Accounts, notes and other receivables, net |
$ | 45,073 | $ | 60,581 | |||
A summary of the activity in the allowance for doubtful accounts is as follows:
| For the years ended December 31, | 2009 | 2008 | 2007 | |||||||
|---|---|---|---|---|---|---|---|---|---|---|
Beginning balance |
$ | 12,546 | $ | 13,570 | $ | 17,869 | ||||
Additions charged to costs and expenses |
1,161 | 714 | 2,442 | |||||||
Foreign currency translation adjustments |
29 | (76 | ) | 25 | ||||||
Deductions and other |
(2,648 | ) | (1,662 | ) | (6,766 | ) | ||||
Ending balance |
$ | 11,088 | $ | 12,546 | $ | 13,570 | ||||
Income Taxes – We provide for income taxes using an asset and liability approach. We compute deferred income tax assets and liabilities annually for differences between the financial statement and tax bases of assets and liabilities that will result in taxable or deductible amounts in the future based on enacted tax laws and rates applicable to the periods in which the differences are expected to affect taxable income. When necessary, we establish valuation allowances to reduce deferred tax assets to the amount that more likely than not will be realized.
We report income tax-related interest and penalties as a component of income tax expense. We file income tax returns at the U.S. federal, state, and local levels, as well as in several foreign jurisdictions. With few exceptions, our returns are no longer subject to examinations for years before 2006.
The liability for uncertain tax positions decreased $1.0 million in 2009 as a result of settlements with state and local taxing authorities. Although we believe our tax estimates are appropriate, the final determination of tax audits and any related litigation could result in changes in our estimates.
Foreign Currency Translation and Remeasurement – We translate assets and liabilities of non-U.S. operations into U.S. dollars at year end rates, and revenues and expenses at average rates of exchange prevailing during the year. We report the resulting translation adjustments as a separate component of accumulated other comprehensive income or loss. We recognize foreign currency transaction gains and losses in the consolidated statements of operations as incurred.
Foreign Currency Exchange Contracts – We enter into foreign currency exchange contracts to mitigate the risks from foreign currency fluctuations on certain intercompany transactions. These contracts are not designated as hedging instruments for accounting purposes, and are not used for trading or speculative purposes. Gains and losses arising from fluctuations in exchange rates are recognized at the end of each reporting period. Such gains and losses offset the foreign currency exchange gains or losses associated with the corresponding receivable, payable, or forecasted transaction. We have credit risk to the extent the counterparties are unable to fulfill their obligations on the foreign currency exchange contracts. However, we enter into these contracts with reputable financial institutions and believe we have no significant credit risk.
44
Stock-Based Compensation – We have an employee stock purchase plan ("Purchase Plan") and stock award plans ("Stock Plans"), which are described in Note 12.
We measure the grant date fair value of equity awards given to employees in exchange for services and recognize that cost over the period that such services are performed. The cost of share-based awards is recognized on a straight-line basis over the award's requisite service period. We estimate the fair value of our stock option awards and employee stock purchase plan rights on the date of grant using the Black-Scholes option valuation model. See Note 12 for additional information regarding our stockholders' equity and stock arrangements.
Earnings per Common Share – Basic earnings per common share is computed using the weighted-average number of common shares outstanding during each year. Diluted earnings per common share reflects the dilutive impact of shares subscribed under the Purchase Plan and effect of our outstanding options using the treasury stock method, except when such options would be antidilutive.
A reconciliation of the weighted-average shares used for the basic and diluted computations is as follows:
| For the years ended December 31, | 2009 | 2008 | 2007 | |||||||
|---|---|---|---|---|---|---|---|---|---|---|
Weighted-average shares for basic earnings per share |
8,855,138 | 8,557,761 | 8,521,700 | |||||||
Dilutive effect of stock options |
4,416 | 71,886 | 125,600 | |||||||
Weighted-average shares for diluted earnings per share |
8,859,554 | 8,629,647 | 8,647,300 | |||||||
Antidilutive options not included in our diluted earnings per common share calculation totaled 1,129,276 as of December 31, 2009, 454,840 as of December 31, 2008, and 22,500 as of December 31, 2007.
Environmental Matters – Potential environmental liabilities are recorded when it is probable that a loss has been incurred and its amount can reasonably be estimated. (See Note 13.)
Segment Reporting – We have two reportable segments: the piano segment and the band & orchestral instrument segment. We consider these two segments reportable as they are managed separately and the operating results of each segment are separately reviewed and evaluated by our senior management on a regular basis. The Company's chief operating decision maker is the Chief Executive Officer.
Retirement Plans – We have defined benefit pension plans covering a majority of our employees, including certain employees in foreign countries. Certain domestic hourly employees are covered by multi-employer defined benefit pension plans to which we make contributions. We also provide postretirement health care and life insurance benefits to certain eligible hourly retirees and their dependents.
Benefits under the pension and other postretirement benefit plans are generally based on age at retirement and years of service and, for some pension plans, benefits are also based on the employee's annual earnings. The net cost of our pension and other postretirement plans is determined using the projected unit credit method and several actuarial assumptions, the most significant of which are the discount rate, the long-term rate of asset return, and current rate trends. A portion of these costs is not recognized in net earnings in the year incurred because it is allocated to product costs and reflected in inventory at the end of a reporting period.
Accumulated Other Comprehensive Income (Loss) – Comprehensive income (loss) is comprised of net income, foreign currency translation adjustments, and pension liabilities, and is reported in the
45
consolidated statements of stockholders' equity for all periods presented. The components of accumulated other comprehensive income (loss) are as follows:
| |
Foreign Currency Translation Adjustment |
Pension & Other Post-Retirement Benefits |
Tax Impact of Pension & Other Post-Retirement Benefits |
Accumulated Other Comprehensive Income (Loss) |
|||||||||
|---|---|---|---|---|---|---|---|---|---|---|---|---|---|
Balance, January 1, 2007 |
$ | 3,809 | $ | (23,235 | ) | $ | 8,876 | $ | (10,550 | ) | |||
Activity |
5,232 | 11,619 | (4,528 | ) | 12,323 | ||||||||
Balance, December 31, 2007 |
9,041 | (11,616 | ) | 4,348 | 1,773 | ||||||||
Activity |
(3,991 | ) | (18,369 | ) | 7,670 | (14,690 | ) | ||||||
Balance, December 31, 2008 |
5,050 | (29,985 | ) | 12,018 | (12,917 | ) | |||||||
Activity |
2,230 | 5,095 | (2,259 | ) | 5,066 | ||||||||
Balance, December 31, 2009 |
$ | 7,280 | $ | (24,890 | ) | $ | 9,759 | $ | (7,851 | ) | |||
Recent Accounting Pronouncements – In September 2009, we adopted Financial Accounting Standards Board ("FASB") Accounting Standards Codification ("ASC") 105-10, "Generally Accepted Accounting Principles – Overall." FASB ASC 105-10 establishes the FASB Accounting Standards Codification ("Codification") to become the source of authoritative U.S. generally accepted accounting principles ("U.S. GAAP") recognized by the FASB to be applied by nongovernmental entities. Rules and interpretive releases of the Securities and Exchange Commission ("SEC") under authority of federal securities laws are also sources of authoritative U.S. GAAP for SEC registrants. The adoption of this standard did not have a material impact on our consolidated financial statements.
In June 2009, the FASB issued a new accounting standard, ASC 810, which changes the consolidation rules as they relate to variable interest entities. Specifically, the new standard makes significant changes to the model for determining who should consolidate a variable interest entity, and also addresses how often this assessment should be performed. We will be required to comply with this new standard on January 1, 2010. We do not expect the adoption will have a material impact on our consolidated financial statements.
In August 2009, the FASB issued a new accounting standard, Accounting Standards Update ("ASU") 2009-05, which provides additional guidance on the measurement of liabilities at fair value. Specifically, when a quoted price in an active market for the identical liability is not available, the new standard requires that the fair value of a liability be measured using one or more of the valuation techniques that should maximize the use of relevant observable inputs and minimize the use of unobservable inputs. In addition, an entity is not required to include a separate input or adjustment to other inputs relating to the existence of a restriction that prevents the transfer of a liability. We were required to comply with this standard in the fourth quarter of 2009. The adoption of this standard did not have a material impact on our consolidated financial statements.
In January 2010, the FASB issued 2010-06, which amends the existing fair value measurements and disclosures guidance. These amendments require a greater level of disaggregated information as well as more disclosure around valuation techniques and inputs to fair value measurements. The amendments also provide guidance on employers' disclosures about postretirement benefit plan assets to require that disclosures be provided by classes of assets instead of by major categories of assets. We will be required to comply with this new standard on January 1, 2010. We do not expect the adoption will have a material impact on our consolidated financial statements.
46
3. Acquisitions
In May 2008 we acquired 100% of the membership interest in ArkivMusic, LLC, an online retailer of classical music. We have included the operating results and net assets of Arkiv in our financial statements since the date of acquisition.
We acquired Arkiv because its product and customer base are complementary to ours, and we are therefore able to cross-market our products. Under terms of the membership purchase agreement, we disbursed $3.0 million for the purchase price, and owe additional installment payments of $0.5 million in each of the subsequent three years. We disbursed $0.5 million in 2009 in accordance with this section of the agreement.
We are also obligated to pay an amount equal to 5% of the net operating profits of Arkiv, if any, in 2010, the sum of which is not to exceed $2.5 million. We had no obligation for 2009 under this section of the agreement.
The final purchase price is dependent upon a calculation derived from the 2010 net operating profits which, when finalized, may result in an additional payment of not more than $11.0 million. In the event that we terminate a particular former owner without cause and do not offer one of the other former owners the vacated position, we are required to make a mandatory final purchase price payment of $8.3 million. The purchase price is based on the acquisition cost determination of $4.8 million and has been allocated to acquired assets and assumed liabilities as of May 16, 2008 as follows:
Current assets |
$ | 351 | |||
Property, plant, and equipment |
33 | ||||
Trademarks |
2,231 | ||||
Non-compete agreements |
250 | ||||
Customer relationships |
425 | ||||
Website and developed technology |
1,987 | ||||
Accounts payable |
(499 | ) | |||
Other current liabilities |
(25 | ) | |||
Subtotal |
4,753 | ||||
Less: Installment payments |
(1,605 | ) | |||
Cash acquired |
(162 | ) | |||
Total cash paid |
$ | 2,986 | |||
Subsequent footnotes providing details of our significant balance sheet accounts include the impact of the Arkiv acquisition as of December 31, 2008. In 2009, we recorded an impairment charge of $1.0 million associated with the trademarks acquired in this transaction. This impairment is discussed more fully in Note 6.
In July 2008, we acquired the stock of 4 Real Investments, Inc., which did business as Clickpoint Software, Inc. ("Clickpoint"). Our Chairman, Kyle Kirkland, and Chief Executive Officer, Dana Messina, were shareholders of Clickpoint as of the date of acquisition. We paid approximately $0.2 million for this acquisition, of which $0.1 million was paid to our Chairman, $0.1 million to our Chief Executive Officer, and the residual amount of less than $0.1 million to the remaining owners. The purchase price has been allocated primarily to website and developed technology.
In February 2009 we acquired a retail store in Dusseldorf, Germany ("Dusseldorf") for $0.8 million. Subsequent footnotes providing details of our significant balance sheet accounts include the impact of the Dusseldorf acquisition as of December 31, 2009.
47
| December 31, | 2009 | 2008 | |||||
|---|---|---|---|---|---|---|---|
Raw materials |
$ | 18,413 | $ | 17,930 | |||
Work-in-process |
42,121 | 51,057 | |||||
Finished goods |
97,496 | 97,521 | |||||
|
$ | 158,030 | $ | 166,508 | |||
A summary of the activity in the inventory reserves is as follows:
| For the years ended December 31, | 2009 | 2008 | 2007 | |||||||
|---|---|---|---|---|---|---|---|---|---|---|
Beginning balance |
$ | 12,558 | $ | 10,554 | $ | 9,277 | ||||
Additions charged to costs and expenses |
2,194 | 3,457 | 2,046 | |||||||
Foreign currency translation adjustments |
21 | (98 | ) | 125 | ||||||
Deductions and reclassifications |
(2,587 | ) | (1,355 | ) | (894 | ) | ||||
Ending balance |
$ | 12,186 | $ | 12,558 | $ | 10,554 | ||||
5. Property, Plant and Equipment, Net
| December 31, | 2009 | 2008 | |||||
|---|---|---|---|---|---|---|---|
Land |
$ | 19,686 | $ | 19,510 | |||
Buildings and improvements |
70,646 | 69,680 | |||||
Leasehold improvements |
5,290 | 4,159 | |||||
Machinery, equipment and tooling |
61,223 | 60,131 | |||||
Office furniture and fixtures |
11,794 | 12,495 | |||||
Concert and Artist and rental pianos |
24,603 | 20,465 | |||||
Construction-in-progress |
2,040 | 1,408 | |||||
|
195,282 | 187,848 | |||||
Less accumulated depreciation |
(105,744 | ) | (99,140 | ) | |||
|
$ | 89,538 | $ | 88,708 | |||
Depreciation expense was $9.1 million in 2009, $9.8 million in 2008, and $9.7 million in 2007.
48
6. Goodwill, Trademarks, and Other Intangible Assets
| December 31, | 2009 | 2008 | ||||||
|---|---|---|---|---|---|---|---|---|
Non-amortizing intangible assets: |
||||||||
Goodwill |
$ | 24,063 | $ | 23,708 | ||||
Trademarks |
$ | 15,284 | $ | 16,148 | ||||
Amortizing intangible assets: |
||||||||
Gross deferred financing costs |
$ | 5,333 | $ | 5,640 | ||||
Accumulated amortization |
(3,135 | ) | (2,636 | ) | ||||
Deferred financing costs, net |
$ | 2,198 | $ | 3,004 | ||||
Gross non-compete agreements |
$ | 250 | $ | 750 | ||||
Accumulated amortization |
(81 | ) | (469 | ) | ||||
Non-compete agreements, net |
$ | 169 | $ | 281 | ||||
Gross customer relationships |
$ | 506 | $ | 425 | ||||
Accumulated amortization |
(166 | ) | (53 | ) | ||||
Customer relationships, net |
$ | 340 | $ | 372 | ||||
Gross website and developed technology |
$ | 2,176 | $ | 2,176 | ||||
Accumulated amortization |
(700 | ) | (265 | ) | ||||
Website and developed technology, net |
$ | 1,476 | $ | 1,911 | ||||
Total other intangibles |
$ | 8,265 | $ | 8,991 | ||||
Accumulated amortization |
(4,082 | ) | (3,423 | ) | ||||
Other intangibles, net |
$ | 4,183 | $ | 5,568 | ||||
49
The changes in the carrying amounts of goodwill and trademarks are as follows:
| |
Piano Segment |
Band Segment |
Total | ||||||||
|---|---|---|---|---|---|---|---|---|---|---|---|
Goodwill: |
|||||||||||
Balance, January 1, 2008 |
$ | 24,352 | $ | 8,555 | $ | 32,907 | |||||
Impairment charge |
– | (8,555 | ) | (8,555 | ) | ||||||
Foreign currency translation impact |
(644 | ) | – | (644 | ) | ||||||
Balance, December 31, 2008 |
23,708 | – | 23,708 | ||||||||
Foreign currency translation impact |
355 | – | 355 | ||||||||
Balance, December 31, 2009 |
$ | 24,063 | $ | – | $ | 24,063 | |||||
| |
Piano Segment |
Band Segment |
Total | ||||||||
|---|---|---|---|---|---|---|---|---|---|---|---|
Trademarks: |
|||||||||||
Balance, January 1, 2008 |
$ | 8,295 | $ | 5,824 | $ | 14,119 | |||||
Additions based on preliminary purchase price allocation to acquired assets |
2,231 | – | 2,231 | ||||||||
Foreign currency translation impact |
(202 | ) | – | (202 | ) | ||||||
Balance, December 31, 2008 |
10,324 | 5,824 | 16,148 | ||||||||
Impairment charge |
(976 | ) | – | (976 | ) | ||||||
Foreign currency translation impact |
112 | – | 112 | ||||||||
Balance, December 31, 2009 |
$ | 9,460 | $ | 5,824 | $ | 15,284 | |||||
The impairment charges above are described in Note 3. Deferred financing costs were impacted by our repurchases of $5.8 million and $10.9 million of our Senior Notes in March 2008 and 2009, respectively. These repurchases are described more fully in Note 11. Trademarks, non-compete agreements, customer relationships, and website and developed technology were impacted by the acquisitions of Arkiv, Clickpoint, and Dusseldorf, which are described more fully in Note 3. Once our amortizing assets are fully amortized, these assets are removed from both the gross and accumulated amortization balances. The weighted-average amortization period for deferred financing costs is seven years, and the weighted-average amortization period of all other amortizable intangible assets is five years. The following table summarizes amortization expense, which includes amortization of deferred financing costs:
| For the years ended December 31, | 2009 | 2008 | 2007 | |||||||
|---|---|---|---|---|---|---|---|---|---|---|
Total amortization expense |
$ | 1,306 | $ | 1,131 | $ | 786 | ||||
50
The following table shows the estimated amortization expense for intangible assets for each of the five succeeding fiscal years:
| For the years ended December 31, | Amount | ||||
|---|---|---|---|---|---|
2010 |
$ | 1,217 | |||
2011 |
1,152 | ||||
2012 |
1,035 | ||||
2013 |
685 | ||||
2014 |
78 | ||||
Thereafter |
16 | ||||
Total |
$ | 4,183 | |||
7. Other Assets
| December 31, | 2009 | 2008 | |||||
|---|---|---|---|---|---|---|---|
Notes receivable |
$ | 2,338 | $ | 3,370 | |||
Marketable securities |
1,563 | 1,242 | |||||
Deposits |
6,100 | 5,656 | |||||
Other assets |
2,662 | 2,112 | |||||
Total |
$ | 12,663 | $ | 12,380 | |||
Deposits include $3.5 million and $2.7 million set aside for potential workers' compensation liabilities, $2.1 million for environmental remediation, and $0.4 million and $0.7 million for collateral as of December 31, 2009 and 2008, respectively. The use of these funds is therefore restricted unless we replace the deposits with a letter of credit of a similar amount.
8. Other Current Liabilities
| December 31, | 2009 | 2008 | |||||
|---|---|---|---|---|---|---|---|
Accrued payroll and related benefits |
$ | 9,326 | $ | 14,100 | |||
Current portion of pension and other postretirement benefit liabilities |
1,456 | 1,357 | |||||
Accrued warranty expense |
1,553 | 1,451 | |||||
Accrued interest |
3,675 | 4,022 | |||||
Deferred income |
7,210 | 7,531 | |||||
Environmental liabilities |
2,377 | 2,577 | |||||
Income and other taxes payable |
3,383 | 2,557 | |||||
Other accrued expenses |
7,415 | 8,687 | |||||
Total |
$ | 36,395 | $ | 42,282 | |||
51
Accrued warranty expense is recorded at the time of sale for instruments that have a warranty period ranging from one to ten years. The accrued expense recorded is generally based on historical warranty costs as a percentage of sales and is adjusted periodically following an analysis of warranty activity. A summary of the activity in accrued warranty expense is as follows:
| For the years ended December 31, | 2009 | 2008 | 2007 | |||||||
|---|---|---|---|---|---|---|---|---|---|---|
Accrued warranty expense: |
||||||||||
Beginning balance |
$ | 1,451 | $ | 1,541 | $ | 1,888 | ||||
Additions |
945 | 1,044 | 798 | |||||||
Claims and reversals |
(865 | ) | (1,075 | ) | (1,200 | ) | ||||
Foreign currency translation |
22 | (59 | ) | 55 | ||||||
Ending balance |
$ | 1,553 | $ | 1,451 | $ | 1,541 | ||||
9. Other Income, Net
| For the years ended December 31, | 2009 | 2008 | 2007 | |||||||
|---|---|---|---|---|---|---|---|---|---|---|
West 57th Building income |
$ | (6,234 | ) | $ | (4,653 | ) | $ | (4,653 | ) | |
West 57th Building expenses |
4,553 | 3,363 | 3,284 | |||||||
Foreign exchange (gain) loss, net |
758 | (169 | ) | 469 | ||||||
Miscellaneous, net |
(924 | ) | 923 | 841 | ||||||
Total |
$ | (1,847 | ) | $ | (536 | ) | $ | (59 | ) | |
Prior to January 1, 2009, our building on West 57th Street in New York City was under a master lease agreement whereby all of our interest in the building was leased back to the owner of the land. Rental expense on the land and rental income associated with the master lease were included, along with other real estate costs, in Other Income, Net. The master lease agreement expired on December 31, 2008 and, therefore, we engaged an outside company to manage this property. West 57th Street building income includes all rent and other income attributable to the property; and West 57th Street building expenses include the land lease, real estate taxes, depreciation, and other building costs. Since we retain a portion of the leasable space for our own retail store use, we have allocated a ratable portion of the building cost to sales and marketing expenses.
10. Income Taxes
The components of the income tax provision are as follows:
| For the years ended December 31, | 2009 | 2008 | 2007 | ||||||||
|---|---|---|---|---|---|---|---|---|---|---|---|
U.S. federal: |
|||||||||||
Current |
$ | – | $ | 33 | $ | 3,474 | |||||
Deferred |
(1,333 | ) | (1,557 | ) | (2,976 | ) | |||||
U.S. state and local: |
|||||||||||
Current |
293 | (1,308 | ) | 548 | |||||||
Deferred |
(247 | ) | 356 | (25 | ) | ||||||
Foreign: |
|||||||||||
Current |
4,557 | 8,271 | 9,983 | ||||||||
Deferred |
(99 | ) | (834 | ) | (924 | ) | |||||
Total |
$ | 3,171 | $ | 4,961 | $ | 10,080 | |||||
52
The components of income before income taxes are as follows:
| For the years ended December 31, | 2009 | 2008 | 2007 | |||||||
|---|---|---|---|---|---|---|---|---|---|---|
U.S. operations |
$ | (5,466 | ) | $ | (11,920 | ) | $ | (88 | ) | |
Non-U.S. operations |
13,973 | 25,067 | 25,578 | |||||||
Total |
$ | 8,507 | $ | 13,147 | $ | 25,490 | ||||
Our income tax provision differed from that using the statutory U.S. federal rate as follows:
| For the years ended December 31, | 2009 | 2008 | 2007 | ||||||||
|---|---|---|---|---|---|---|---|---|---|---|---|
Statutory federal rate applied to income before |
$ | 2,977 | $ | 4,599 | $ | 8,922 | |||||
Increase (decrease) in income taxes resulting from: |
|||||||||||
Foreign income taxes (net of federal benefit)(1) |
451 | 1,554 | 1,406 | ||||||||
German tax rate change(2) |
– | – | (325 | ) | |||||||
State income taxes (net of federal benefit) |
34 | 14 | 966 | ||||||||
Benefit of excess foreign tax credits(3) |
(612 | ) | (931 | ) | (1,666 | ) | |||||
Benefit of state net operating losses(4) |
(146 | ) | (216 | ) | – | ||||||
Other |
467 | (59 | ) | 777 | |||||||
Income tax provision |
$ | 3,171 | $ | 4,961 | $ | 10,080 | |||||
- (1)
- Includes
the impact of foreign taxes in excess of the U.S. statutory rate of 35% as well as foreign income also subject to U.S. tax, less the
foreign tax credit allowed in the current year.
- (2)
- In
2007, Germany passed legislation that reduced the rate at which certain of our operations pay tax. Upon passage of the legislation, we
recognized a reduction of $0.3 million of our deferred tax liabilities based on the change in rate. This legislation was effective in 2008.
- (3)
- Represents
the impact of excess foreign taxes eligible to offset future U.S. taxes. No valuation allowance was recorded against foreign tax
credits generated in 2009 and 2008. In 2008, a valuation allowance of $1.9 million relating to foreign tax credits generated in 2007 and 2006 was recorded.
- (4)
- Represents the impact of state net operating losses fully reserved in a prior period which are available to offset current taxable income at the state level.
At December 31, 2009, accumulated retained earnings of non-U.S. subsidiaries totaled $20.1 million. We provided $0.7 and $0.3 million in 2009 and 2008, respectively, for U.S. income taxes for earnings that were distributed. No additional provision has been made for undistributed earnings of non-U.S. subsidiaries because our current intention is to reinvest the remaining earnings for the foreseeable future.
53
The components of net deferred taxes are as follows:
| December 31, | 2009 | 2008 | |||||||
|---|---|---|---|---|---|---|---|---|---|
Deferred tax assets: |
|||||||||
Uniform capitalization and reserve adjustments to inventory |
$ | 5,223 | $ | 4,874 | |||||
Allowance for doubtful accounts |
3,100 | 3,726 | |||||||
Accrued expenses and other current assets and liabilities |
6,411 | 6,454 | |||||||
OCI – pension and OPEB plans |
9,759 | 12,018 | |||||||
Net operating losses |
2,021 | 2,500 | |||||||
Foreign tax credits |
20,110 | 21,387 | |||||||
Other |
1,075 | 1,111 | |||||||
Total deferred tax assets |
47,699 | 52,070 | |||||||
Deferred tax liabilities: |
|||||||||
Pension contributions |
(3,221 | ) | (4,340 | ) | |||||
Property, plant and equipment |
(15,219 | ) | (16,188 | ) | |||||
Intangibles |
(4,928 | ) | (5,063 | ) | |||||
Total deferred tax liabilities |
(23,368 | ) | (25,591 | ) | |||||
Net deferred taxes before valuation allowances |
24,331 | 26,479 | |||||||
Valuation allowances |
(9,871 | ) | (11,561 | ) | |||||
Net deferred taxes |
$ | 14,460 | $ | 14,918 | |||||
The valuation allowances generally take into consideration limitations imposed upon the use of the tax attributes and reduce the value of such items to the likely net realizable amount. The valuation allowances relate to foreign tax credits and state net operating loss carryforwards generated in excess of amounts we more likely than not expect to utilize. Gross state tax net operating loss carryforwards totaled $61.2 million as of December 31, 2009 and expire in varying amounts from 2010 through 2029. Our foreign tax credits expire in varying amounts from 2010 through 2019.
Valuation allowances decreased $1.7 million during 2009 and increased $1.8 million during 2008. Valuation allowances relating to the acquisition of Steinway totaled $2.5 million as of December 31, 2009 and 2008. The difference, if any, results primarily from exchange rate fluctuations. If these valuation allowances are removed, the reversal would reduce goodwill.
With respect to uncertain tax positions, we have $0.1 million and $1.0 million accrued for the payment of interest as of December 31, 2009 and 2008, respectively. For the year ended December 31, 2009, we incurred/derecognized $0.8 million in interest expense and less than $0.1 million in penalties related to uncertain tax positions. For the year ended December 31, 2008, we derecognized $0.6 million in interest expense and $0.5 million in penalties related to uncertain tax positions.
As of December 31, 2009 and 2008, we had less than $0.1 million and $0.9 million, respectively, recorded in other current liabilities and $0.4 million in other non-current liabilities, related to uncertain tax positions in the accompanying consolidated balance sheet. Although we believe our tax estimates are appropriate, the final determination of tax audits and any related litigation could result in favorable or unfavorable changes in our estimates.
54
A reconciliation of the beginning and ending amount of unrecognized tax benefits is as follows:
| |
2009 | 2008 | |||||
|---|---|---|---|---|---|---|---|
Balance, January 1, |
$ | 2,663 | $ | 6,619 | |||
Gross increase – tax positions taken in a prior year |
4 | 236 | |||||
Gross decrease – tax positions taken in a prior year |
(59 | ) | (884 | ) | |||
Gross increase – tax positions taken in the current year |
3 | 105 | |||||
Gross decrease – settlements with taxing authorities |
– | (24 | ) | ||||
Payments |
(48 | ) | (1,652 | ) | |||
Reclassification to income taxes payable |
– | (874 | ) | ||||
Lapse of statute of limitations |
(583 | ) | (863 | ) | |||
Balance, December 31, |
$ | 1,980 | $ | 2,663 | |||
Currently, we do not believe that our tax reserves will decrease significantly during 2010. The total amount of unrecognized tax benefits which would affect our effective tax rate, if recognized, was $0.4 million as of December 31, 2009 and 2008.
We file income tax returns in the U.S. federal jurisdiction and various state, local, and foreign jurisdictions. With few exceptions, our returns are no longer subject to U.S. federal, state and local, or non-U.S. income tax examinations for years before 2006.
11. Long-Term Debt
In March 2009 we repurchased $10.9 million of our Senior Notes at prices ranging from 65.500% to 68.000% plus accrued interest. In March 2008, we repurchased $5.8 million of our Senior Notes at a price of 86.625% plus accrued interest. As a result, we recorded net gains on extinguishment of debt, a summary of which is as follows:
| |
2009 | 2008 | ||||||
|---|---|---|---|---|---|---|---|---|
Principal repurchased |
$ | 10,924 | $ | 5,750 | ||||
Less: |
||||||||
Cash paid |
(7,280 | ) | (4,981 | ) | ||||
Deferred financing costs write-off |
(160 | ) | (101 | ) | ||||
Bond discount write-off |
(50 | ) | (32 | ) | ||||
Net gain on extinguishment of debt |
$ | 3,434 | $ | 636 | ||||
Our long-term debt consists of the following:
| December 31, | 2009 | 2008 | |||||
|---|---|---|---|---|---|---|---|
Senior Notes |
$ | 158,326 | $ | 169,250 | |||
Unamortized bond discount |
(623 | ) | (825 | ) | |||
Domestic line of credit |
– | 15,000 | |||||
Open account loans, payable on demand to a foreign bank |
537 | 3,325 | |||||
Total |
158,240 | 186,750 | |||||
Less current portion |
537 | 3,325 | |||||
Long-term debt |
$ | 157,703 | $ | 183,425 | |||
55
Scheduled payments of long-term debt as of December 31, 2009 are as follows:
| |
Amount | |||
|---|---|---|---|---|
2010 |
$ | 537 | ||
2011 |
– | |||
2012 |
– | |||
2013 |
– | |||
2014 |
158,326 | |||
Total |
$ | 158,863 | ||
We have a domestic credit facility with a syndicate of domestic lenders (the "Credit Facility"). The Credit Facility provides us with a potential borrowing capacity of $110.0 million in revolving credit loans, and expires on September 29, 2011. It also provides for borrowings at either London Interbank Offering Rate ("LIBOR") plus a range from 1.25% to 1.75% or as-needed borrowings at an alternate base rate, plus a range from 0.00% to 0.25%; both ranges depend upon availability at the time of borrowing. Borrowings are collateralized by our domestic accounts receivable, inventory and fixed assets. We had nothing outstanding on this Credit Facility as of December 31, 2009.
Our non-domestic credit facilities originating from two German banks provide for borrowings by foreign subsidiaries of up to €15.8 million ($22.6 million at the December 31, 2009 exchange rate), net of borrowing restrictions of €1.8 million ($2.6 million at the December 31, 2009 exchange rate) and are payable on demand. These borrowings are collateralized by most of the assets of the borrowing subsidiaries. A portion of the loans can be converted into a maximum of £0.8 million ($1.2 million at the December 31, 2009 exchange rate) for use by our U.K. branch and ¥300 million ($3.2 million at the December 31, 2009 exchange rate) for use by our Japanese subsidiary. Our Chinese subsidiary also has the ability to convert the equivalent of up to €2.5 million into U.S. dollars or Chinese yuan ($3.6 million at the December 31, 2009 exchange rate). Euro loans bear interest at rates of Euro Interbank Offered Rate ("EURIBOR") plus a margin determined at the time of borrowing. Margins fluctuate based on the loan amount and the borrower's bank rating. The remaining demand borrowings bear interest at rates of LIBOR plus 0.8% for British pound loans (no outstanding borrowings at December 31, 2009), LIBOR plus 1.0% for U.S. dollar loans of our Chinese subsidiary (no outstanding borrowings at December 31, 2009), and Tokyo Interbank Offered Rate ("TIBOR") plus 1.3% for Japanese yen loans. We had nothing outstanding as of December 31, 2009 on these credit facilities.
Our Japanese subsidiary also maintains a separate revolving loan agreement that provides additional borrowing capacity of up to ¥460 million ($4.9 million at the December 31, 2009 exchange rate) based on eligible inventory balances. The revolving loan agreement bears interest at an average 30-day TIBOR rate plus 0.9% (outstanding borrowings at 1.2% at December 31, 2009) and expires on January 31, 2010. As of December 31, 2009, we had $0.5 million outstanding on this revolving loan agreement.
All of our debt agreements contain covenants that place certain restrictions on us, including our ability to incur additional indebtedness, to make investments in other entities, and to pay cash dividends. We were in compliance with all such covenants as of December 31, 2009.
12. Stockholders' Equity and Stock Arrangements
Our common stock is comprised of two classes: Class A and Ordinary. With the exception of disparate voting power, both classes are substantially identical. Each share of Class A common stock entitles the holder to 98 votes. Holders of Ordinary common stock are entitled to one vote per share. Class A common stock shall automatically convert to Ordinary common stock if, at any time, the Class A common stock is not owned by an original Class A holder. As of December 31, 2009 our
56
Chairman and our Chief Executive Officer collectively owned 100% of the Class A common shares, representing approximately 83% of the combined voting power of the Class A common stock and Ordinary common stock.
Employee Stock Purchase Plan – Under our 2006 Employee Stock Purchase Plan (the "Purchase Plan") substantially all employees may purchase Ordinary common stock through payroll deductions at a purchase price equal to 85% of the lower of the fair market values as of the beginning or end of each twelve-month offering period. Stock purchases under the Purchase Plan are limited to 5% of an employee's annual base earnings. We reserved 400,000 shares for issuance under this plan and may grant options to purchase shares up to ten years from the plan's commencement on August 1, 2006. In 2007, we registered 400,000 shares for potential issuance under this plan. Shares issued under the 2006 Employee Stock Purchase Plan were 62,509 and 29,379 during 2009 and 2008, respectively.
Stock Plans – The 2006 Stock Plan provides for the granting of 1,000,000 stock options (including incentive stock options and non-qualified stock options), stock appreciation rights and other stock awards to certain key employees, consultants and advisors. Our stock options generally have five-year vesting terms and ten-year option terms. In 2007, we registered 1,000,000 shares for potential issuance under this plan. As of December 31, 2009, no shares have been issued under this plan and 756,900 stock options are outstanding.
The 1996 Stock Plan, as amended, provided for the granting of 1,500,000 stock options (including incentive stock options and non-qualified stock options), stock appreciation rights and other stock awards to certain key employees, consultants and advisors. This plan expired as of July 31, 2006 and 250,400 shares went unused. However, this plan still has vested and unvested options outstanding. We reserved 721,750 treasury stock shares to issue under this plan. We reached our registered share limitation in early 2007, and have since issued 98,974 shares of treasury stock to cover options exercised, with 372,376 remaining options outstanding. Since in most instances the average cost of the treasury stock exceeded the price of the options exercised, the difference between the proceeds received and the average cost of the treasury stock issued resulted in a reduction of retained earnings of less than $0.1 million during the twelve months ended December 31, 2008. No options were exercised during the twelve months ended December 31, 2009.
The compensation cost and the income tax benefit recognized for the Stock Plans and Purchase Plan are as follows:
| For the years ended December 31, | 2009 | 2008 | 2007 | ||||||||
|---|---|---|---|---|---|---|---|---|---|---|---|
Compensation cost included in: |
|||||||||||
Basic and diluted income per share |
$ | 0.11 | $ | 0.11 | $ | 0.11 | |||||
Stock-based compensation expense |
1,207 | 1,115 | 1,103 | ||||||||
Income tax benefit |
203 | 187 | 183 | ||||||||
We measure the fair value of options on their grant date, including the valuation of the option feature implicit in our Purchase Plan, using the Black-Scholes option-pricing model. The risk-free interest rate is based on the weighted-average of U.S. Treasury rates over the expected life of the stock option or the contractual life of the option feature in the Purchase Plan. The expected life of a stock option is based on historical data of similar option holders. We segregate our employees into two groups based on historical exercise and termination behavior. The expected life of the option feature in the Purchase Plan is the same as its contractual life. Expected volatility is based on historical volatility of our stock over the expected life of the option, as our options are not readily tradable.
57
Key assumptions used to apply this pricing model to the Stock Plans are as follows:
| For the years ended December 31, | 2009 | 2008 | 2007 | |||||||
|---|---|---|---|---|---|---|---|---|---|---|
Risk free interest rate |
3.10% | 3.42% | 4.59% | |||||||
Weighted average expected life (in years) |
7.4 | 7.2 | 8.1 | |||||||
Expected volatility of underlying stock |
32.6% | 25.9% | 25.1% | |||||||
Expected dividends |
n/a | n/a | n/a | |||||||
The weighted-average fair values of options granted under the Stock Plans are as follows:
| For the years ended December 31, | 2009 | 2008 | 2007 | |||||||
|---|---|---|---|---|---|---|---|---|---|---|
Stock Plan |
$ | 4.70 | $ | 9.94 | $ | 13.61 | ||||
The following table sets forth information regarding the Stock Plans:
| |
Number of Options |
Weighted- Average Exercise Price |
Remaining Contractual Life (in years) |
Aggregate Intrinsic Value (not in 000s) |
|||||||||
|---|---|---|---|---|---|---|---|---|---|---|---|---|---|
Outstanding at January 1, 2009 |
807,216 | $ | 24.92 | ||||||||||
Granted |
355,000 | 11.20 | |||||||||||
Forfeited |
(32,940 | ) | 24.95 | ||||||||||
Outstanding at December 31, 2009 |
1,129,276 | $ | 20.61 | 6.9 | $ | 1,669,735 | |||||||
Exercisable at December 31, 2009 |
470,556 | $ | 22.66 | 4.0 | $ | 2,410 | |||||||
Vested or expected to vest at December 31, 2009 |
1,019,683 | $ | 20.51 | 6.7 | $ | 1,458,940 | |||||||
There were no options exercised during the year ended December 31, 2009. The total intrinsic value of the options exercised during the twelve months ended December 31, 2008 and 2007 was less than $0.1 million and $2.4 million, respectively.
As of December 31, 2009, there was $4.0 million of unrecognized compensation cost related to nonvested share-based compensation arrangements granted under the Stock Plan. This compensation cost is expected to be recognized over a period of approximately four years.
Key assumptions used to apply the Black-Scholes pricing model to the Purchase Plan are as follows:
| For the years ended December 31, | 2009 | 2008 | 2007 | |||||||
|---|---|---|---|---|---|---|---|---|---|---|
Risk-free interest rate |
1.66% | 3.84% | 5.00% | |||||||
Weighted-average expected life of option feature (in years) |
1.0 | 1.0 | 1.0 | |||||||
Expected volatility of underlying stock |
26.1% | 25.6% | 25.2% | |||||||
Expected dividends |
n/a | n/a | n/a | |||||||
The weighted-average fair value of the option feature in the Purchase Plan is as follows:
| For the years ended December 31, | 2009 | 2008 | 2007 | |||||||
|---|---|---|---|---|---|---|---|---|---|---|
Option feature in Purchase Plan |
$ | 5.44 | $ | 7.93 | $ | 7.23 | ||||
58
The following tables set forth information regarding the Purchase Plan:
| |
Number of Options |
Weighted- Average Exercise Price |
Remaining Contractual Life (in years) |
Aggregate Intrinsic Value (not in 000s) |
|||||||||
|---|---|---|---|---|---|---|---|---|---|---|---|---|---|
Outstanding at January 1, 2009 |
11,828 | $ | 23.36 | ||||||||||
Shares subscribed |
77,358 | 9.67 | |||||||||||
Exercised |
(62,509 | ) | 9.68 | ||||||||||
Canceled, forfeited, or expired |
(2,295 | ) | 9.67 | ||||||||||
Outstanding at December 31, 2009 |
24,382 | $ | 9.65 | 0.6 | $ | 153,119 | |||||||
As reported in the consolidated statements of cash flows, cash received from option exercises under the Stock Plan for the periods ended December 31, 2008 and 2007 was $0.8 million and $4.2 million, respectively. Cash flows from tax benefits resulting from tax deductions in excess of the compensation cost recognized for stock-based awards under a fair value basis (excess tax benefits) are required to be classified as a cash flow from financing activities. Accordingly, for the period ended December 31, 2008, less than $0.1 million of excess tax benefits has been classified as an outflow from operating activities and an inflow from financing activities in the statement of cash flows. For the period ended December 31, 2008, less than $0.1 million of total tax benefit from stock option exercises is included as a cash inflow from operating activities.
On November 5, 2009, we entered into a private placement transaction agreement with Samick Musical Instruments Co., Ltd. ("Samick") which gave Samick the right to immediately purchase 1,700,000 shares of our ordinary common stock at a price of $16.00 per share. Samick purchased 1,700,000 shares on November 5, 2009, which resulted in a cash payment to us of $27.2 million. Samick also has the right to purchase an additional 1,700,000 shares, also at a price of $16.00 per share, by March 31, 2010.
13. Commitments and Contingent Liabilities
Lease Commitments – We lease various facilities and equipment under non-cancelable operating lease arrangements. These leases expire at various times through 2022. Rent expense was $3.7 million for the year ended December 31, 2009, $6.2 million for the year ended December 31, 2008, and $5.8 million for the year ended December 31, 2007.
In March 1999, we acquired the building on West 57th Street in New York City that includes the Steinway Hall retail store for approximately $30.8 million. We entered into a ninety-nine year land lease as part of the transaction. Annual rent payable under the land lease is $2.8 million through 2018 and will be adjusted every twenty years thereafter to the greater of the existing rent or 4% of the fair market value of the land and building combined. Rent expense is being recognized on a straight-line basis over the initial twenty-year fixed rent period.
59
Future minimum lease payments for our non-cancelable operating leases, excluding the land lease discussed above, and future rental income associated with our building on West 57th street, are as follows:
| For the years ending December 31, | Lease Payments |
Lease Income |
|||||
|---|---|---|---|---|---|---|---|
2010 |
$ | 3,187 | $ | 3,102 | |||
2011 |
2,571 | 1,382 | |||||
2012 |
2,089 | 1,366 | |||||
2013 |
1,487 | 1,360 | |||||
2014 |
1,330 | 890 | |||||
Thereafter |
4,240 | 5,071 | |||||
Total |
$ | 14,904 | $ | 13,171 | |||
We also lease pianos to institutions in the U.K. Operating lease income associated with this lease program is as follows:
| For the years ending December 31, | Lease Income |
|||
|---|---|---|---|---|
2010 |
$ | 302 | ||
2011 |
283 | |||
2012 |
254 | |||
2013 |
247 | |||
2014 |
242 | |||
Thereafter |
239 | |||
Total |
$ | 1,567 | ||
Employment Agreements and Other Obligations – We maintain employment agreements with certain employees and consultants, including our Chairman and Chief Executive Officer. Most of these agreements have one-year terms and contain automatic renewal provisions. Our obligation under these agreements at current compensation levels is approximately $3.6 million per year.
The Chairman and Chief Executive Officer collectively hold 100% of the Class A common shares, representing 83% of the combined voting power of the Class A common stock and Ordinary common stock. Further, these individuals have established a limited liability corporation to which we pay reimbursement of certain rent, overhead and travel-related expenses. These expenses totaled $0.3 million for the year ended December 31, 2009, $0.2 million for the year ended December 31, 2008, and $0.3 million for the year ended December 31, 2007. We included $0.1 million in accounts payable related to these expenses at December 31, 2009. Nothing was included in accounts payable related to these expenses at December 31, 2008. We included less than $0.1 million in accounts payable related to these expenses at December 31, 2007.
Financing Obligations – We established a program in 2009 to provide financing to certain domestic piano dealers. As of December 31, 2009, the total financing available to these dealers was less than $1.0 million. Beyond this program, we generally do not provide extended financing arrangements to our piano dealers. Typically, if financing is required by a dealer, we will facilitate arrangements through a third party provider. We generally provide no guarantees with respect to these arrangements.
Legal and Environmental Matters – We are involved in certain legal proceedings regarding environmental matters, which are described below. Further, in the ordinary course of business, we are party to various legal actions that we believe are routine in nature and incidental to the operation of
60
our business. While the outcome of such actions cannot be predicted with certainty, we believe that, based on our experience in dealing with these matters, their ultimate resolution will not have a material adverse impact on our business, financial condition, results of operations or prospects.
Certain environmental laws, such as the Comprehensive Environmental Response, Compensation, and Liability Act, as amended ("CERCLA"), impose strict, retroactive, joint and several liability upon persons responsible for releases of hazardous substances, which liability is broadly construed. Under CERCLA and other laws, we may have liability for investigation and cleanup costs and other damages relating to our current or former properties, or third-party sites to which we sent wastes for disposal. Our potential liability at any of these sites is affected by many factors including, but not limited to, the method of remediation, our portion of the hazardous substances at the site relative to that of other parties, the number of responsible parties, the financial capabilities of other parties, and contractual rights and obligations.
We are continuing an existing environmental remediation plan at a facility we acquired in 2000. We estimate our costs, which approximate $0.7 million, over a 12-year period. We have accrued approximately $0.6 million for the estimated remaining cost of this remediation program, which represents the present value total cost using a discount rate of 4.54%. A summary of expected payments associated with this project is as follows:
| |
Environmental Payments |
|||
|---|---|---|---|---|
2010 |
$ | 72 | ||
2011 |
61 | |||
2012 |
61 | |||
2013 |
61 | |||
2014 |
61 | |||
Thereafter |
363 | |||
Total |
$ | 679 | ||
In 2004, we acquired two manufacturing facilities from G. Leblanc Corporation, now Grenadilla, Inc. ("Grenadilla"), for which environmental remediation plans had already been established. In connection with the acquisition, we assumed the existing accrued liability of approximately $0.8 million for the cost of these remediation activities. Based on a review of past and ongoing investigatory and remedial work by our environmental consultants, and discussions with state regulatory officials, as well as recent sampling, we estimate the remaining costs of such remedial plans to be $1.8 million. Pursuant to the purchase and sale agreement, we have sought indemnification from Grenadilla for anticipated costs above the original estimate. We filed a claim against the escrow and recorded a corresponding receivable for this amount in prepaid expenses and other current assets in our consolidated balance sheet. Based on the current estimated costs of remediation, this receivable totaled $2.1 million as of December 31, 2009 and 2008. We reached an agreement with Grenadilla whereby certain current environmental costs are paid directly out of the escrow. Should the escrow be reduced to zero, we would seek reimbursement from Grenadilla for these additional costs. However, we cannot be assured that we will be able to recover such costs.
Based on our past experience and currently available information, the matters described above, as well as our other liabilities and compliance costs arising under environmental laws, are not expected to have a material impact on our capital expenditures, earnings or competitive position in an individual year. However, some risk of environmental liability is inherent in the nature of our current and former business and we may, in the future, incur material costs to meet current or more stringent compliance, cleanup, or other obligations pursuant to environmental laws.
61
14. Retirement Plans
We have defined benefit pension plans covering the majority of our employees, including certain employees in foreign countries. Certain domestic hourly employees are covered by multi-employer defined benefit pension plans to which we make contributions. These contributions totaled $0.7 million in 2009 and $1.0 million in 2008 and 2007. The corresponding pension plan assets and liabilities belong to third parties and, accordingly, are not reflected in this Note or our consolidated financial statements.
One of these multi-employer plans was deemed to be in critical status and, as a result, the trustees adopted a rehabilitation plan effective in March 2009 designed to improve the plan's funding status over time. This rehabilitation plan ceased all death benefits, lump sum payments and similar disbursements, reduced the benefit accruals to the lowest level allowed by law, and established two contribution schedules providing for higher contributions from participating employers. As part of our normal labor negotiations over a new three year collective bargaining agreement ("CBA"), we adopted the preferred contribution schedule under which we will increase our previous contributions by 5.5% for each of the three years covered by the new CBA. Had we decided not to participate in the rehabilitation program, we would likely have effected a withdrawal from the plan, which would have given rise to a significant liability associated with underfunded accumulated benefit obligations for our employee participants. While we currently believe it is unlikely we would choose to withdraw from this plan, should the rehabilitation effort not be successful or if other participating employers decide to leave the plan, our course of action may change in the future.
All of our domestic pension plans have been combined under a master trust, "The Steinway Musical Pension Plan," to facilitate plan monitoring and plan investment management.
The funded status of the plans is measured as the difference between the plan assets at fair value and the projected benefit obligation. We have recognized the aggregate of all underfunded plans in other current and pension and other postretirement benefit liabilities. The portion of the amount by which the actuarial present value of benefits included in the projected benefit obligation exceeds the fair value of plan assets, payable in the next twelve months, is reflected in other current liabilities. The balance of the liability is included in pension and other postretirement benefit liabilities. The measurement date for our pension and other postretirement plans is December 31.
During 2007 we recognized a curtailment loss of $1.2 million due to a significant reduction in expected years of future service from the striking workers of the Elkhart, Indiana brass instrument manufacturing facility. The curtailment loss represents the previously unrecognized prior service cost which, absent the strike, would have been recognized over the years of service expected to be rendered.
During 2009 our CBA with the striking workers of the Elkhart, Indiana brass instrument manufacturing facility was terminated as the result of the union's decertification. The termination of the agreement triggered a remeasurement of both the benefit obligation and assets of the domestic plan. The benefit obligation and net periodic pension cost were measured using a discount rate of 6.2%, and plan assets were measured using an expected rate of return of 9.0%. As a result, our long term pension liability decreased by $3.3 million and our accumulated other comprehensive income increased by $2.0 million, net of tax. We also recognized a curtailment loss of $0.2 million, which represents the remaining unrecognized prior service cost for this group.
62
The following table sets forth the funded status and amounts recognized for our defined benefit pension plans:
| |
Domestic Plan | Foreign Plans | |||||||||||||
|---|---|---|---|---|---|---|---|---|---|---|---|---|---|---|---|
| December 31, | 2009 | 2008 | 2009 | 2008 | |||||||||||
Change in benefit obligation: |
|||||||||||||||
Benefit obligation, beginning of year |
$ | 54,547 | $ | 55,386 | $ | 28,092 | $ | 36,479 | |||||||
Service cost |
352 | 414 | 567 | 812 | |||||||||||
Interest cost |
3,422 | 3,410 | 1,750 | 1,887 | |||||||||||
Plan participants' contributions |
9 | 9 | 50 | 59 | |||||||||||
Amendments |
– | 487 | – | – | |||||||||||
Actuarial loss (gain) |
3,339 | (2,142 | ) | 2,269 | (5,986 | ) | |||||||||
Foreign currency exchange rate changes |
– | – | 1,274 | (3,239 | ) | ||||||||||
Benefits paid |
(3,182 | ) | (3,017 | ) | (1,461 | ) | (1,920 | ) | |||||||
Benefit obligation, end of year |
58,487 | 54,547 | 32,541 | 28,092 | |||||||||||
Change in plan assets: |
|||||||||||||||
Fair value of plan assets, beginning of year |
40,573 | 59,081 | 4,276 | 6,681 | |||||||||||
Actual return on plan assets |
10,867 | (20,500 | ) | 813 | (946 | ) | |||||||||
Employer contributions |
153 | 5,000 | 2,032 | 2,017 | |||||||||||
Employee contributions |
9 | 9 | 50 | 59 | |||||||||||
Foreign currency exchange rate changes |
– | – | 509 | (1,615 | ) | ||||||||||
Benefits paid |
(3,182 | ) | (3,017 | ) | (1,461 | ) | (1,920 | ) | |||||||
Fair value of plan assets, end of year |
48,420 | 40,573 | 6,219 | 4,276 | |||||||||||
Funded status |
$ | (10,067 | ) | $ | (13,974 | ) | $ | (26,322 | ) | $ | (23,816 | ) | |||
Amounts recognized on the statement of financial position consist of: |
|||||||||||||||
Pension and other post retirement benefit liabilities |
$ | (10,067 | ) | $ | (13,974 | ) | $ | (26,322 | ) | $ | (23,816 | ) | |||
Net amount recognized |
$ | (10,067 | ) | $ | (13,974 | ) | $ | (26,322 | ) | $ | (23,816 | ) | |||
The weighted-average assumptions used to determine our benefit obligations are as follows:
| |
Domestic Plan | Foreign Plans | |||||||||||
|---|---|---|---|---|---|---|---|---|---|---|---|---|---|
| December 31, | 2009 | 2008 | 2009 | 2008 | |||||||||
Discount rate |
5.95% | 6.54% | 5.69% | 6.30% | |||||||||
Rate of compensation increase |
n/a | n/a | 2.77% | 3.16% | |||||||||
The weighted-average assumptions used to determine our net periodic benefit cost are as follows:
| |
Domestic Plan | Foreign Plans | |||||||||||||||||
|---|---|---|---|---|---|---|---|---|---|---|---|---|---|---|---|---|---|---|---|
| For the years ended December 31, | 2009 | 2008 | 2007 | 2009 | 2008 | 2007 | |||||||||||||
Discount rate |
6.42% | 6.34% | 5.75% | 6.32% | 5.36% | 4.61% | |||||||||||||
Expected return on assets |
9.00% | 9.00% | 9.00% | 6.00% | 6.00% | 6.00% | |||||||||||||
Rate of compensation increase |
n/a | n/a | n/a | 3.22% | 3.51% | 3.38% | |||||||||||||
The fiscal 2009 weighted-average discount rate of 6.42% for the domestic pension plan represents a rate of 6.54% from January 1 to July 31 and, post plan remeasurement, a rate of 6.19% from August 1 to December 31.
63
The components of net pension expense for the years ended December 31 are as follows:
| For the years ended December 31, | 2009 | 2008 | 2007 | ||||||||
|---|---|---|---|---|---|---|---|---|---|---|---|
Domestic Plan: |
|||||||||||
Service cost |
$ | 352 | $ | 414 | $ | 552 | |||||
Interest cost |
3,422 | 3,410 | 3,230 | ||||||||
Expected return on plan assets |
(3,613 | ) | (5,135 | ) | (4,969 | ) | |||||
Amortization of prior service cost |
167 | 205 | 386 | ||||||||
Recognized actuarial loss |
2,379 | 48 | 551 | ||||||||
Curtailment loss |
241 | – | 1,249 | ||||||||
Net periodic pension cost (benefit) |
$ | 2,948 | $ | (1,058 | ) | $ | 999 | ||||
Foreign Plans: |
|||||||||||
Service cost |
$ | 567 | $ | 812 | $ | 946 | |||||
Interest cost |
1,750 | 1,887 | 1,667 | ||||||||
Expected return on plan assets |
(293 | ) | (370 | ) | (372 | ) | |||||
Recognized actuarial loss |
8 | 88 | 293 | ||||||||
Net periodic pension cost |
$ | 2,032 | $ | 2,417 | $ | 2,534 | |||||
Estimated amounts that will be amortized from accumulated other comprehensive income (loss) into net periodic benefit cost in 2010 are as follows:
| |
Domestic Plan | Foreign Plans | |||||
|---|---|---|---|---|---|---|---|
Net actuarial loss |
$ | 1,968 | $ | 142 | |||
Prior service cost |
113 | n/a | |||||
Amounts recognized in accumulated other comprehensive income (loss) as of December 31, 2009 and 2008 are as follows:
| |
Domestic Plan | Foreign Plans | |||||||||||
|---|---|---|---|---|---|---|---|---|---|---|---|---|---|
| December 31, | 2009 | 2008 | 2009 | 2008 | |||||||||
Net actuarial loss (gain) |
$ | 23,562 | $ | 29,855 | $ | 1,454 | $ | (394 | ) | ||||
Prior service cost |
800 | 1,208 | – | – | |||||||||
Income taxes |
(9,745 | ) | (12,425 | ) | (385 | ) | 133 | ||||||
Total |
$ | 14,617 | $ | 18,638 | $ | 1,069 | $ | (261 | ) | ||||
The projected benefit obligation, accumulated benefit obligation, and fair value of plan assets for pension plans with accumulated benefit obligations in excess of plan assets were as follows:
| |
2009 | 2008 | |||||
|---|---|---|---|---|---|---|---|
Projected benefit obligation |
$ | 91,028 | $ | 82,639 | |||
Accumulated benefit obligation |
90,304 | 81,274 | |||||
Fair value of plan assets |
54,639 | 44,849 | |||||
The accumulated benefit obligation for our domestic pension plan was $58.5 million as of December 31, 2009 and $54.5 million as of December 31, 2008. The accumulated benefit obligation for our foreign pension plans was $31.8 million as of December 31, 2009 and $26.7 million as of December 31, 2008.
Our domestic pension plan assets are held in a master trust and are overseen by our Investment Committee, which is comprised of members of senior executive management and an independent
64
director with significant investment experience. The Investment Committee is assisted by a registered investment advisory firm.
The Investment Committee is responsible for setting the policy that provides the framework for management of the plan assets. In accordance with its responsibilities and charter, the Investment Committee meets on a regular basis to review the performance of the plan assets and compliance with the investment policy. The policy sets forth an investment structure for managing plan assets, including setting the asset allocation ranges, which are expected to provide an appropriate level of diversification and investment return over the long term while maintaining sufficient liquidity to pay the benefits of the plan. Asset allocation ranges are set to produce the highest overall return taking into account investment risks that are prudent and reasonable given prevailing market conditions. In developing the asset allocation ranges, third party asset allocation studies are periodically performed that consider the current and expected positions of the plan assets and funded status. Based on these studies and other appropriate information, the Investment Committee establishes asset allocation ranges taking into account acceptable risk targets and associated returns.
The investment policy asset allocation ranges for the plan, as set by the Investment Committee, for the years ended December 31, 2009 and December 31 2008, were as follows:
| Asset category: | Minimum | Maximum | |||||
|---|---|---|---|---|---|---|---|
Domestic equity securities |
25% | 90% | |||||
International and other equity securities |
0% | 50% | |||||
International debt securities |
0% | 20% | |||||
Domestic debt securities |
10% | 50% | |||||
Other |
0% | 10% | |||||
Cash |
0% | 5% | |||||
The Investment Committee determines the specific allocation of the plan's investments within various asset classes. The plan utilizes select investment strategies which are executed through separate account or fund structures with external investment managers who demonstrate experience and expertise in the appropriate asset classes and styles. The selection of investment managers is done with careful evaluation of all aspects of performance and risk, due diligence of internal operations and controls, reputation, systems evaluation and a review of investment manager's policies and processes. The plan also utilizes unleveraged exchange traded funds that track indicies. Investment performance is monitored frequently against appropriate benchmarks and compared to compliance guidelines with the assistance of third party performance evaluation tools and metrics.
Consistent with the objective of maximizing return while minimizing risk, multiple investment strategies are employed to diversify risk such that no single investment or investment manager presents a significant exposure to the total investment portfolio. Plan assets are invested in numerous diversified strategies with the intent to minimize correlations. This allows for diversification of returns. Further, within each strategy, guidelines are established which set forth the list of authorized investments, the typical portfolio characteristics and diversification required by limiting the amount that can be invested by sector, country and issuer. As a result, the plan is not significantly exposed to any single entity, investment manager, sector or international location.
The Investment Committee reviews our domestic benefit obligations no less than annually with the objective of maintaining a 90% funded status for the projected benefit obligation. Whenever possible, our annual contribution is expected to cover the short-term liquidity requirements of the plan, so as to maintain the plan's assets for long-term investment. The performance goal set for the plan's assets is to achieve a long-term rate of return no less than 8.5%.
For the periods ended December 31, 2009, 2008, and 2007 we used an assumed long-term rate of return on domestic plan assets of 9%. This rate is based on the long-term (20 – 30 years) rates of
65
return for the assets held. Accordingly, we expect that the actual rate of return for any given year will differ from the assumed rate and, therefore, do not adjust this assumption based on such differences. Because our monitoring criteria creates a bias in favor of funds that out-perform their benchmarks, we limit the adjustment to our rate of return assumption to changes in the underlying long term rate of return for stocks generally.
The domestic pension plan assets are stated at fair value. Investments in equity securities are valued at the last reported sales price. Investments in debt securities are generally valued using methods based upon market transactions for comparable securities and various relationships between securities which are generally recognized by institutional traders. Our insurance contract is valued based upon our insurance carrier's estimate of fair value, which is reviewed internally based on historic returns and current market conditions. Investments in private equity partnerships, which purchase undervalued commercial real estate, are estimated at fair market value based on partnership financial statements generated from independent appraised values that take into account projected income and expense of the property, as well as recent sales of similar properties.
The domestic pension plan also has a $2.0 million unfunded investment commitment to another private equity partnership focused on commercial real estate.
The fair value of our domestic pension plan assets by asset category and by level (as described in Note 16) at December 31, 2009 were as follows:
| |
Level 1 | Level 2 | Level 3 | Total | ||||||||||
|---|---|---|---|---|---|---|---|---|---|---|---|---|---|---|
Cash and cash equivalents |
$ | 360 | $ | 360 | ||||||||||
Equity securities: |
||||||||||||||
U.S. small-cap |
837 | 837 | ||||||||||||
U.S. large-cap |
9,398 | 9,398 | ||||||||||||
International large-cap |
6,590 | 6,590 | ||||||||||||
Emerging markets |
1,310 | 1,310 | ||||||||||||
Global natural resources |
10,019 | 10,019 | ||||||||||||
Debt securities: |
||||||||||||||
Global senior floating rate debt(1) |
6,103 | 6,103 | ||||||||||||
U.S. fixed income |
3,857 | 3,857 | ||||||||||||
Global bond fund |
952 | 952 | ||||||||||||
Alternative investments: |
||||||||||||||
U.S. flex fund(2) |
3,100 | 3,100 | ||||||||||||
Global flex fund(2) |
879 | 879 | ||||||||||||
Insurance contract(3) |
1,820 | 1,820 | ||||||||||||
Private equity partnerships(4) |
– | – | 3,195 | 3,195 | ||||||||||
|
$ | 43,405 | $ | – | $ | 5,015 | $ | 48,420 | ||||||
- (1)
- Adjustable
rate senior debt with below investment grade ratings of BB+ or less and an average maturity of less than one year.
- (2)
- Flex
funds actively invest in equity and debt securities that are both investment grade and non-investment grade. Investment grade
securities have a rating equivalent to a Standard & Poors rating of BBB- or better. The flex funds also invest in cash and cash equivalents.
- (3)
- We
invest in an insurance contract with full participation rights that calculates investment returns using the investment year method.
- (4)
- Investments in private equity funds are predominantly invested in U.S. commercial real estate.
66
The reconciliation of the beginning and ending balances of the fair value measurements using significant unobservable inputs (Level 3) is as follows:
| |
Insurance Contract |
Private Equity Partnership |
Total | |||||||
|---|---|---|---|---|---|---|---|---|---|---|
Balance, January 1, 2009 |
$ | 1,801 | $ | 2,719 | $ | 4,520 | ||||
Actual return on plan assets: |
||||||||||
Relating to assets still held |
41 | (63 | ) | (22 | ) | |||||
Related to assets sold during the period |
– | (75 | ) | (75 | ) | |||||
Purchases, sales, and settlements |
(22 | ) | 614 | 592 | ||||||
Transfers in and/or out of Level 3 |
– | – | – | |||||||
Balance, December 31, 2009 |
$ | 1,820 | $ | 3,195 | $ | 5,015 | ||||
Domestic plan assets include 52,631 shares of the Company's Ordinary common stock, which was valued at $0.8 million as of December 31, 2009 and $0.9 million as of December 31, 2008. This represents approximately 2% of the total plan assets as of December 31, 2009 and 2008, respectively.
We made a contribution of $0.2 million to our domestic pension plan in 2009 and a $5.0 million contribution to our domestic pension plan in 2008. Based on federal laws and regulations, we are not required to make a contribution to our domestic plan in 2010 under governmental guidelines. We are currently evaluating what amount, if any, we intend to contribute to this plan in 2010. The domestic plan invests a small portion of its assets in a group annuity contract. Shortly after December 31, 2009, this contract was terminated. The assets and benefit obligation associated with this contract are no longer our responsibility. The impact to our financial statements as a result of this settlement was not material.
Our foreign pension plans in Germany and the U.K. are governed locally in accordance with specific jurisdictional requirements. Our German plans do not hold assets and pay participant benefits when due. Expected 2010 benefit payments under these plans are $1.3 million.
Assets held in the U.K. plan are the responsibility of local trustees, which consist of a local management member and participant, a member-nominated participant, and an independent advisor. The U.K. plan invests primarily in foreign corporate bonds and foreign equities that approximate the trustees' target allocation of 45% debt securities and 55% equity securities. Target allocations have been designed to cover the U.K. plan's future benefit obligation and are review annually. Investment performance is monitored regularly to attain the funding goals. These investments are valued primarily using quoted prices in active markets (Level 1). There were no investments with unobservable (Level 3) inputs.
For the periods ended December 31, 2009, 2008, and 2007, we used an assumed long-term rate of return on the U.K. plan assets of 6.00%. Contributions to this plan totaled $0.8 million in 2009 and $0.7 million in 2008. We anticipate contributing approximately $0.9 million to this plan in 2010.
67
The domestic and foreign pension plans expect to pay benefits in each year from 2010 through 2019 as follows:
| |
Domestic Plan | Foreign Plans | |||||
|---|---|---|---|---|---|---|---|
2010 |
$ | 3,491 | $ | 1,493 | |||
2011 |
3,557 | 1,545 | |||||
2012 |
3,658 | 1,587 | |||||
2013 |
3,796 | 1,694 | |||||
2014 |
3,941 | 1,821 | |||||
2015 - 2019 |
21,433 | 10,112 | |||||
Total |
$ | 39,876 | $ | 18,252 | |||
We provide postretirement health care and life insurance benefits to certain eligible hourly retirees and their dependents. As a result of terminating our CBA, which is described below, we have a limited number of participants receiving health care benefits under this plan as of December 31, 2009. Once these participants reach age 65 and are eligible for Medicare, no postretirement health care benefits will be provided under this plan. We will continue to pay the full amount of life insurance costs for eligible plan participants located at a different facility and covered by a different union contract.
During 2007 the postretirement benefit plan had a curtailment and negative plan amendment relating to the elimination of medical benefits for retired participants of the Elkhart, Indiana brass instrument manufacturing facility. We recognized a curtailment loss of $0.1 million relating to the acceleration of unrecognized transition obligation associated with the portion of future years of service that, as a result of the curtailment, are no longer expected to be rendered. The remaining $0.1 million of previously unrecognized transition obligation was used to offset the negative plan amendment of $0.7 million resulting in $0.6 million of prior service cost to be amortized over a period of approximately eleven years.
On July 30, 2009, we recognized a plan amendment relating to the termination of our CBA and the elimination of medical and life insurance benefits for former employees of the Elkhart, Indiana brass instrument manufacturing facility. The termination of the CBA triggered a remeasurement of the benefit obligation and postretirement benefit cost, which were measured using a discount rate of 6.1%. As a result, our long term postretirement benefit obligation decreased by $0.4 million and our accumulated other comprehensive income increased by $0.2 million, net of tax. We will recognize the reduction in our postretirement benefit obligation over a period of approximately seven years as a reduction of prior service costs.
68
The following table sets forth the funded status of our postretirement benefit plan and accrued postretirement benefit cost reflected in our consolidated balance sheets:
| December 31, | 2009 | 2008 | |||||||
|---|---|---|---|---|---|---|---|---|---|
Change in benefit obligation: |
|||||||||
Benefit obligation, beginning of year |
$ | 1,110 | $ | 1,735 | |||||
Service cost |
6 | 5 | |||||||
Interest cost |
59 | 68 | |||||||
Plan participants' contributions |
3 | 9 | |||||||
Actuarial loss (gain) |
154 | (660 | ) | ||||||
Benefits paid |
(27 | ) | (47 | ) | |||||
Plan amendment |
(472 | ) | – | ||||||
Benefit obligation, end of year |
833 | 1,110 | |||||||
Fair value of plan assets |
– | – | |||||||
Funded status |
$ | (833 | ) | $ | (1,110 | ) | |||
Amounts recognized on the statement of financial position consist of: |
|||||||||
Other current and long-term pension and other postretirement benefit liabilities |
$ | (833 | ) | $ | (1,110 | ) | |||
The assumed weighted-average discount rate used to determine benefit obligations as of December 31, 2009 and 2008 was 5.83% and 6.70%, respectively. The assumed weighted-average discount rate used to determine our fiscal 2009 net postretirement benefit cost was 6.29% consisting of 6.69% from January 1 to July 31 and, post plan remeasurement, 6.07% from August 1 to December 31. The assumed weighted-average discount rate used to determine our net postretirement benefit cost was 6.20% for the year ended December 31, 2008 and 5.75% for the year ended December 31, 2007. The annual assumed rate of increase in the per capita cost of covered health care benefits was 10.00% in 2010 and is assumed to decrease gradually to 5.00% in 2020, and remain at that level thereafter.
Net postretirement benefit costs are as follows:
| For the years ended December 31, | 2009 | 2008 | 2007 | |||||||
|---|---|---|---|---|---|---|---|---|---|---|
Service cost |
$ | 6 | $ | 5 | $ | 7 | ||||
Interest cost |
59 | 68 | 130 | |||||||
Net loss recognition |
– | – | 36 | |||||||
Amortization of transition obligation |
– | – | 29 | |||||||
Amortization of prior service cost |
(78 | ) | (52 | ) | (9 | ) | ||||
Curtailment loss |
– | – | 140 | |||||||
Net postretirement benefit cost (benefit) |
$ | (13 | ) | $ | 21 | $ | 333 | |||
Estimated amounts to be amortized from accumulated other comprehensive income (loss) into net postretirement benefit cost in 2010 include prior service costs of $0.1 million.
69
Amounts recognized in accumulated other comprehensive income (loss) as of December 31, 2009 and 2008 are as follows:
| December 31, | 2009 | 2008 | |||||
|---|---|---|---|---|---|---|---|
Net actuarial loss (gain) |
$ | 19 | $ | (133 | ) | ||
Prior service benefit |
(945 | ) | (551 | ) | |||
Income taxes |
371 | 274 | |||||
Total |
$ | (555 | ) | $ | (410 | ) | |
As of December 31, 2009, we have a limited number of participants receiving medical benefits under this plan. As a result, the assumed health care cost trends do not have a significant effect on the amounts reported. The domestic postretirement health care and life insurance plan expects to pay benefits in each year from 2010 through 2019 as follows:
| For the years ended December 31, | |
|||
|---|---|---|---|---|
2010 |
$ | 176 | ||
2011 |
66 | |||
2012 |
59 | |||
2013 |
49 | |||
2014 |
49 | |||
Thereafter |
255 | |||
Total |
$ | 654 | ||
We sponsor several 401(k) retirement savings plans for eligible employees. By December 31, 2009 all of these plans, barring one, were discretionary. Contributions are determined annually by the Board of Directors. No contributions were made to these plans for 2009. Contributions to these plans approximated $0.3 million for 2008 and $0.7 million for 2007. Non-discretionary contributions approximated $0.1 million for December 31, 2009 and $0.4 million for each of the years ended December 31, 2008 and 2007.
We have a supplemental executive retirement plan ("SERP") for a select group of our executives who constitute a "top hat" group as defined by ERISA. Discretionary employer contributions made to this plan, as determined annually by the Board of Directors, are held in a rabbi trust. The SERP assets are included in our financial statements within other assets (see Notes 7 and 16). We made no contribution to the SERP in 2009 or 2008 and do not anticipate making a contribution in 2010.
15. Foreign Currency Exchange Contracts
One of our German divisions, whose functional currency is the euro, secures option and forward contracts for Japanese yen, British pounds, and U.S. dollars to mitigate cash flow exposure to currency fluctuations. Our band division, whose functional currency is the U.S. dollar, began securing options and forwards in 2008 for the same reason. At December 31, 2009, our divisions held option and forward contracts to sell £0.5 million, sell ¥240.0 million, and purchase $7.7 million. These instruments have various maturity dates through August 2011. At December 31, 2008, our divisions held option and forward contracts to sell £1.2 million, sell ¥325.4 million, purchase $10.8 million, and purchase €1.8 million. These instruments had various maturity dates through June 2011. At December 31, 2007, the German division had forward contracts to sell £1.3 million. These instruments had various maturity dates through June 2008. Since we do not designate these instruments as hedges for accounting purposes, we carry these instruments at fair value and recognize the change in fair value in earnings. Net amounts were not material during the years ended December 31, 2009, 2008, or 2007.
70
16. Fair Values of Financial Instruments
Our financial instruments consist primarily of foreign currency contracts (see Note 15), marketable equity securities, and debt. Certain of these items are required to be recorded in the financial statements at fair value, while other are required to be recorded at historical cost.
The financial assets and liabilities recorded at fair value are measured on a recurring or non-recurring basis. Financial assets and liabilities measured on a recurring basis are those that are adjusted to fair value each time financial statements are prepared. Financial assets and liabilities measured on a non-recurring basis are those that are adjusted to fair value when a significant event occurs. In determining fair value of financial assets and liabilities, we use various valuation techniques. The availability of inputs observable in the market varies from instrument to instrument and depends on a variety of factors including the type of instrument, whether the instrument is actively traded, and other characteristics particular to the transaction. For many financial instruments, pricing inputs are readily observable in the market, the valuation methodology used is widely accepted by market participants, and the valuation does not require significant management discretion. For other financial instruments, pricing inputs are less observable in the market and may require management judgment.
We assess the inputs used to measure fair value using the following three-tier hierarchy, which indicates the extent to which inputs used are observable in the market.
| Level 1 | Valuation is based upon unadjusted quoted prices for identical instruments traded in active markets. | ||||
Level 2 |
Valuation is based upon quoted prices for identical or similar instruments such as interest rates, foreign currency exchange rates, commodity rates and yield curves, and model-based valuation techniques for which all significant assumptions are observable in the market. |
||||
Level 3 |
Valuation is generated from model-based techniques that use at least one significant assumption not observable in the market. These unobservable assumptions include management's own judgments about the assumptions market participants would use in pricing the asset or liability. Valuation techniques include use of option pricing models, discounted cash flow models and similar techniques. (We do not have any assets or liabilities carried at Level 3 fair value.) |
We value our foreign currency contracts using internal models with observable inputs, including currency forward and spot prices. Estimated fair value has been determined as the difference between the current forward rate and the contract rate, multiplied by the notional amount of the contract, or upon the estimated fair value of purchased option contracts.
71
The following table presents information about our assets and liabilities measured at fair value on a recurring basis as of December 31, 2009 and 2008 and the fair value hierarchy of the valuation techniques we utilized.
| |
December 31, 2009 |
December 31, 2008 |
||||||
|---|---|---|---|---|---|---|---|---|
Financial assets: |
||||||||
Trading securities(1) – Level 1 |
$ | 1,623 | $ | 1,242 | ||||
Foreign currency contracts(2) – Level 2 |
82 | 584 | ||||||
|
$ | 1,705 | $ | 1,826 | ||||
Financial liabilities: |
||||||||
Foreign currency contracts(2) – Level 2 |
$ | 3 | $ | 55 | ||||
- (1)
- Our
trading securities pertain to the SERP and are held in a rabbi trust. We record a corresponding liability for the same amount in our
financial statements, which represents our obligation to SERP participants.
- (2)
- Our foreign currency contracts pertain to obligations or potential obligations to purchase or sell euros, pounds, U.S. dollars, and yen under various option and forward contracts.
We base the estimated fair value of our debt on institutional quotes currently available to us. The historical cost net carrying value and estimated fair value are as follows:
| |
December 31, 2009 | December 31, 2008 | ||||||||||||
|---|---|---|---|---|---|---|---|---|---|---|---|---|---|---|
| |
Net Carrying Value |
Estimated Fair Value |
Net Carrying Value |
Estimated Fair Value |
||||||||||
Financial liabilities: |
||||||||||||||
Debt |
$ | 158,863 | $ | 144,218 | $ | 187,575 | $ | 135,954 | ||||||
The carrying values of accounts, notes and other receivables, marketable equity securities, and accounts payable approximate fair value.
Our marketable equity securities pertain to the SERP and are included as a component of other assets (see Notes 7 and 14). Investments in marketable equity securities are categorized as trading, available-for-sale, or held-to-maturity. As of December 31, 2009, 2008 and 2007 we held only trading securities. Gross unrealized holding gains and losses on these trading securities were as follows:
| For the years ended December 31, | 2009 | 2008 | 2007 | |||||||
|---|---|---|---|---|---|---|---|---|---|---|
Gains |
$ | 617 | $ | 130 | $ | 186 | ||||
Losses |
$ | 921 | $ | 783 | $ | 138 | ||||
17. Segment Information
As discussed in Note 2, we have identified two reportable segments: the piano segment and the band & orchestral instrument segment. We consider these two segments reportable as they are managed separately and the operating results of each segment are separately reviewed and evaluated by our senior management on a regular basis. We have classified the results of our online music division in "U.S. Piano Segment" as we believe its results are not material and its products and customer base are most correlated with piano operations. Information reported under each geographic heading is based on the location of our facility responsible for generating such activity, regardless of the location of the external customer. This is consistent with how our chief operating decision maker reviews and evaluates performance.
72
Intercompany transactions are generally recorded at a small discount from comparable third-party prices. Income from operations for the reportable segments includes intercompany profit, as well as certain corporate costs allocated to the segments based primarily on revenue. Amounts reported as "Other & Elim" include those corporate costs that were not allocated to the reportable segments and the remaining intercompany profit elimination. It also includes corporate assets, elimination of intercompany interest, and investments in subsidiaries that do not eliminate within the segments. The following tables present information about our reportable segments:
| |
Piano Segment | Band & Orchestral Segment | |
|
||||||||||||||||||||||||
|---|---|---|---|---|---|---|---|---|---|---|---|---|---|---|---|---|---|---|---|---|---|---|---|---|---|---|---|---|
| |
Other & Elim |
|
||||||||||||||||||||||||||
| |
U.S. | Germany | Other | Total | U.S. | Other | Total | Consolidated | ||||||||||||||||||||
2009 |
||||||||||||||||||||||||||||
Revenues from external customers |
$ | 80,167 | $ | 56,229 | $ | 43,603 | $ | 179,999 | $ | 121,503 | $ | 4,934 | $ | 126,437 | $ | – | $ | 306,436 | ||||||||||
Operating profit (loss) |
(3,240 | ) | 9,792 | 4,257 | 10,809 | 5,538 | 506 | 6,044 | (3,582 | ) | 13,271 | |||||||||||||||||
Interest income |
(40 | ) | (89 | ) | (89 | ) | (218 | ) | (1,577 | ) | – | (1,577 | ) | (35 | ) | (1,830 | ) | |||||||||||
Interest expense |
7,941 | 29 | 195 | 8,165 | 6,844 | – | 6,844 | (3,134 | ) | 11,875 | ||||||||||||||||||
Depreciation and amortization |
4,579 | 1,839 | 486 | 6,904 | 2,857 | – | 2,857 | 609 | 10,370 | |||||||||||||||||||
Income tax provision (benefit) |
989 | 2,959 | 1,214 | 5,162 | (407 | ) | 54 | (353 | ) | (1,638 | ) | 3,171 | ||||||||||||||||
Net income (loss) |
(9,990 | ) | 6,310 | 2,974 | (706 | ) | 2,022 | (988 | ) | 1,034 | 5,008 | 5,336 | ||||||||||||||||
Capital expenditures |
2,114 | 1,115 | 92 | 3,321 | 1,159 | 33 | 1,192 | 39 | 4,552 | |||||||||||||||||||
Property, plant and equipment |
52,900 | 16,914 | 3,996 | 73,810 | 15,614 | 33 | 15,647 | 81 | 89,538 | |||||||||||||||||||
Total assets |
137,234 | 99,718 | 29,953 | 266,905 | 225,526 | 5,450 | 230,976 | (48,091 | ) | 449,790 | ||||||||||||||||||
2008 |
||||||||||||||||||||||||||||
Revenues from external customers |
$ | 107,769 | $ | 72,621 | $ | 47,976 | $ | 228,366 | $ | 151,583 | $ | 7,464 | $ | 159,047 | $ | – | $ | 387,413 | ||||||||||
Operating profit (loss) |
3,422 | 21,371 | 3,920 | 28,713 | (4,023 | ) | (1,153 | ) | (5,176 | ) | (2,344 | ) | 21,193 | |||||||||||||||
Interest income |
(92 | ) | (389 | ) | (178 | ) | (659 | ) | (2,222 | ) | – | (2,222 | ) | (168 | ) | (3,049 | ) | |||||||||||
Interest expense |
8,284 | 88 | 174 | 8,546 | 7,058 | 114 | 7,172 | (3,451 | ) | 12,267 | ||||||||||||||||||
Depreciation and amortization |
4,386 | 1,825 | 462 | 6,673 | 3,555 | 41 | 3,596 | 659 | 10,928 | |||||||||||||||||||
Income tax provision (benefit) |
(578 | ) | 5,495 | 1,097 | 6,014 | (1,447 | ) | (264 | ) | (1,711 | ) | 658 | 4,961 | |||||||||||||||
Net income (loss) |
(2,982 | ) | 16,867 | 2,937 | 16,822 | (8,041 | ) | (1,065 | ) | (9,106 | ) | 470 | 8,186 | |||||||||||||||
Capital expenditures |
2,042 | 1,405 | 240 | 3,687 | 1,605 | 21 | 1,626 | 25 | 5,338 | |||||||||||||||||||
Property, plant and equipment |
52,674 | 16,144 | 2,786 | 71,604 | 17,009 | 18 | 17,027 | 77 | 88,708 | |||||||||||||||||||
Total assets |
145,009 | 93,347 | 28,432 | 266,788 | 229,458 | 9,195 | 238,653 | (52,123 | ) | 453,318 | ||||||||||||||||||
2007 |
||||||||||||||||||||||||||||
Revenues from external customers |
$ | 115,939 | $ | 69,427 | $ | 49,824 | $ | 235,190 | $ | 163,389 | $ | 7,735 | $ | 171,124 | $ | – | $ | 406,314 | ||||||||||
Operating profit (loss) |
10,620 | 20,733 | 4,260 | 35,613 | 2,040 | 582 | 2,622 | (3,033 | ) | 35,202 | ||||||||||||||||||
Interest income |
(158 | ) | (175 | ) | (152 | ) | (485 | ) | (3,045 | ) | – | (3,045 | ) | (157 | ) | (3,687 | ) | |||||||||||
Interest expense |
8,488 | 54 | 278 | 8,820 | 7,518 | 253 | 7,771 | (3,133 | ) | 13,458 | ||||||||||||||||||
Depreciation and amortization |
4,138 | 1,593 | 383 | 6,114 | 3,567 | 98 | 3,665 | 698 | 10,477 | |||||||||||||||||||
Income tax provision (benefit) |
3,468 | 6,956 | 1,376 | 11,800 | (228 | ) | 113 | (115 | ) | (1,605 | ) | 10,080 | ||||||||||||||||
Net income (loss) |
(1,044 | ) | 13,580 | 3,333 | 15,869 | (2,688 | ) | 220 | (2,468 | ) | 2,009 | 15,410 | ||||||||||||||||
Capital expenditures |
1,276 | 1,854 | 131 | 3,261 | 1,644 | 40 | 1,684 | 22 | 4,967 | |||||||||||||||||||
Property, plant and equipment |
52,254 | 16,950 | 2,984 | 72,188 | 20,330 | 1,525 | 21,855 | 107 | 94,150 | |||||||||||||||||||
Total assets |
140,765 | 94,581 | 27,208 | 262,554 | 234,501 | 13,306 | 247,807 | (52,683 | ) | 457,678 | ||||||||||||||||||
18. Quarterly Financial Data (Unaudited)
In 2009, results for the first quarter were favorably impacted by a $3.4 million gain on extinguishment of $10.9 million of our bonds. In the third quarter, results were unfavorably impacted by $1.0 million in impairment charges taken on the intangible assets associated with our online music business.
In 2008, results for the first quarter were beneficially impacted by a $0.6 million gain on extinguishment of $5.8 million of our bonds, which offset charges of $0.4 million of severance and inventory write-down charges associated with our facility rationalization project. In the second quarter, results were adversely impacted by $1.6 million in charges comprised of severance costs and impairment charges associated with our facility rationalization project. In the third quarter, results were adversely impacted by a goodwill impairment charge of $8.6 million at our band division.
The following is a summary of unaudited results of operations, in thousands except share and per share data. The variance between the $.60 earnings per share reported in the Consolidated Statement
73
of Operations for 2009 and the sum of the quarterly earnings per share of $.56 reported below is due to the sale of 1,700,000 shares of Ordinary common stock in November 2009 and the resultant impact on the earnings per share calculations for the fourth quarter.
| For the years ended December 31, | 2009 | |||||||||||||
|---|---|---|---|---|---|---|---|---|---|---|---|---|---|---|
| |
First Quarter |
Second Quarter |
Third Quarter |
Fourth Quarter |
||||||||||
Net sales |
$ | 69,991 | $ | 72,113 | $ | 82,634 | $ | 81,698 | ||||||
Gross profit |
18,609 | 18,898 | 23,405 | 24,001 | ||||||||||
Net income (loss) |
1,005 | (620 | ) | 637 | 4,314 | |||||||||
Basic earnings (loss) per share |
$ | 0.12 | $ | (0.07 | ) | $ | 0.07 | $ | 0.44 | |||||
Diluted earnings (loss) per share |
$ | 0.12 | $ | (0.07 | ) | $ | 0.07 | $ | 0.44 | |||||
Weighted average shares: |
||||||||||||||
Basic |
8,533,259 | 8,533,259 | 8,581,343 | 9,772,691 | ||||||||||
Diluted |
8,535,278 | 8,533,259 | 8,583,320 | 9,778,632 | ||||||||||
| For the years ended December 31, | 2008 | |||||||||||||
|---|---|---|---|---|---|---|---|---|---|---|---|---|---|---|
| |
First Quarter |
Second Quarter |
Third Quarter |
Fourth Quarter |
||||||||||
Net sales |
$ | 94,186 | $ | 98,521 | $ | 100,488 | $ | 94,218 | ||||||
Gross profit |
27,392 | 29,045 | 29,929 | 28,924 | ||||||||||
Net income (loss) |
1,975 | 3,045 | (260 | ) | 3,426 | |||||||||
Basic earnings (loss) per share |
$ | 0.23 | $ | 0.35 | $ | (0.03 | ) | $ | 0.40 | |||||
Diluted earnings (loss) per share |
$ | 0.23 | $ | 0.35 | $ | (0.03 | ) | $ | 0.40 | |||||
Weighted average shares: |
||||||||||||||
Basic |
8,579,203 | 8,580,318 | 8,538,264 | 8,533,259 | ||||||||||
Diluted |
8,654,843 | 8,670,687 | 8,538,264 | 8,545,689 | ||||||||||
74
Item 9. Changes in and Disagreements With Accountants on Accounting and Financial Disclosure
On April 3, 2008, the Board of Directors of Steinway Musical Instruments, Inc. (the "Company"), based on its Audit Committee's recommendation, dismissed Deloitte & Touche LLP ("D&T") as the Company's independent registered public accountants and approved the engagement of UHY LLP ("UHY") to serve as the Company's independent registered public accountants for the fiscal year 2008. This action was subsequently approved by the shareholders.
D&T's reports on the Company's financial statements for the year ended December 31, 2007 did not contain an adverse opinion or disclaimer of opinion, nor were they qualified or modified as to uncertainty, audit scope or accounting principles.
During the year ended December 31, 2007 and through the date of dismissal of D&T, there were no disagreements with D&T on any matter of accounting principles or practices, financial statement disclosure, or auditing scope or procedure which, if not resolved to D&T's satisfaction, would have caused them to make reference to the subject matter in connection with their report on the Company's consolidated financial statements for such years; and there were no reportable events, as listed in Item 304(a)(1)(v) of Regulation S-K.
The Company provided D&T with a copy of the disclosures in the preceding two paragraphs and requested in writing that D&T furnish the Company with a letter addressed to the Securities and Exchange Commission ("SEC") stating whether or not they agree with such disclosures. D&T provided a letter, dated April 8, 2008 stating its agreement with such statements. The letter was then filed with the SEC.
During the year ended December 31, 2007 and through the date of the Audit Committee's decision, the Company did not consult UHY with respect to the application of accounting principles to a specified transaction, either completed or proposed, or the type of audit opinion that might be rendered on the Company's consolidated financial statements, or any other matter or reportable events listed in Items 304(a)(2)(i) and (ii) of Regulation S-K.
Item 9A. Controls and Procedures
Disclosure Controls and Procedures
Our principal executive officer and our principal financial officer, after evaluating together with management the design and operation of our disclosure controls and procedures have concluded that our disclosure controls and procedures (as defined in Exchange Act Rules 13a-15(e) and 15d-15(e)) were effective as of December 31, 2009, the end of the period covered by this report.
Internal Control Over Financial Reporting
There were changes in our Company's internal control over financial reporting that occurred during the fourth quarter of 2009 which resulted from control improvement and remediation efforts. These changes have not materially affected, and are not likely to materially affect, our Company's internal control over financial reporting.
75
MANAGEMENT'S ANNUAL REPORT ON INTERNAL CONTROL OVER FINANCIAL REPORTING
The management of Steinway Musical Instruments, Inc. and its subsidiaries (the "Company") is responsible for establishing and maintaining adequate internal control over financial reporting as defined in Rules 13a-15(f) and 15d-15(f) under the Securities Exchange Act of 1934. The Company's internal control over financial reporting is a process designed by, or under the supervision of, the Company's principal executive and principal financial officers, and effected by the Company's board of directors, management and other personnel, to provide reasonable assurance regarding the reliability of financial reporting and the preparation of the Company's financial statements for external purposes in accordance with generally accepted accounting principles. Internal control over financial reporting includes those policies and procedures that:
- (1)
- pertain
to the maintenance of records that, in reasonable detail, accurately and fairly reflect the transactions and dispositions of the assets of the
Company;
- (2)
- provide
reasonable assurance that transactions are recorded as necessary to permit preparation of financial statements in accordance with generally accepted
accounting principles;
- (3)
- provide
reasonable assurance that receipts and expenditures of the Company are being made only in accordance with authorizations of management and directors
of the Company; and
- (4)
- provide reasonable assurance regarding prevention or timely detection of unauthorized acquisition, use or disposition of the Company's assets that could have a material effect on the financial statements.
Internal Control over financial reporting includes the controls themselves, monitoring and internal auditing practices and actions taken to correct deficiencies as identified.
Because of its inherent limitations, internal control over financial reporting may not prevent or detect misstatements. Also, projections of any evaluation of effectiveness to future periods are subject to the risk that controls may become inadequate because of changes in conditions, or that the degree of compliance with the policies or procedures may deteriorate.
The Company's management assessed the effectiveness of the Company's internal control over financial reporting as of December 31, 2009. In making this assessment, the Company's management used the criteria set forth by the Committee of Sponsoring Organizations of the Treadway Commission (COSO) in Internal Control – Integrated Framework. Management reviewed the results of its assessment with the Audit Committee of its Board of Directors.
Based on its assessment, management determined that, as of December 31, 2009, the Company's internal control over financial reporting is effective.
76
UHY LLP, the independent registered public accounting firm that audited the financial statements included in this annual report, audited the Company's internal control over financial reporting as stated in their report, which appears below.
| By: | /s/ Dana D. Messina Dana D. Messina Chief Executive Officer March 10, 2010 |
|||
By: |
/s/ Dennis M. Hanson Dennis M. Hanson Chief Financial Officer March 10, 2010 |
77
REPORT OF UHY LLP, INDEPENDENT REGISTERED PUBLIC ACCOUNTING FIRM
To
the Board of Directors and Stockholders
Steinway Musical Instruments, Inc.
We have audited the internal control over financial reporting of Steinway Musical Instruments, Inc. and subsidiaries (the "Company") as of December 31, 2009, based on criteria established in Internal Control – Integrated Framework issued by the Committee of Sponsoring Organizations of the Treadway Commission (COSO). The Company's management is responsible for maintaining effective internal control over financial reporting and for its assessment of the effectiveness of internal control over financial reporting, included in Part II, Item 9A of this Form 10-K. Our responsibility is to express an opinion on the Company's internal control over financial reporting based on our audits.
We conducted our audit in accordance with the standards of the Public Company Accounting Oversight Board (United States). Those standards require that we plan and perform the audit to obtain reasonable assurance about whether effective internal control over financial reporting was maintained in all material respects. Our audit included obtaining an understanding of internal control over financial reporting, assessing the risk that a material weakness exists, testing and evaluating the design and operating effectiveness of internal control, and performing such other procedures as we considered necessary in the circumstances. We believe that our audit provides a reasonable basis for our opinion.
A company's internal control over financial reporting is a process designed to provide reasonable assurance regarding the reliability of financial reporting and the preparation of financial statements for external purposes in accordance with accounting principles generally accepted in the United States of America. A company's internal control over financial reporting includes those policies and procedures that (1) pertain to the maintenance of records that, in reasonable detail, accurately and fairly reflect the transactions and dispositions of the assets of the company; (2) provide reasonable assurance that transactions are recorded as necessary to permit preparation of financial statements in accordance with accounting principles generally accepted in the United States of America, and that receipts and expenditures of the company are being made only in accordance with authorizations of management and directors of the company; and (3) provide reasonable assurance regarding prevention or timely detection of unauthorized acquisition, use, or disposition of the company's assets that could have a material effect on the financial statements.
Because of its inherent limitations, internal control over financial reporting may not prevent or detect misstatements. Also, projections of any evaluation of effectiveness to future periods are subject to the risk that controls may become inadequate because of changes in conditions, or that the degree of compliance with the policies or procedures may deteriorate.
In our opinion, the Company maintained, in all material respects, effective internal control over financial reporting as of December 31, 2009, based on criteria established in Internal Control – Integrated Framework issued by the Committee of Sponsoring Organizations of the Treadway Commission.
78
We also have audited, in accordance with the standards of the Public Company Accounting Oversight Board (United States), the consolidated balance sheets of the Company as of December 31, 2009 and 2008, and the related consolidated statements of operations, stockholders' equity and cash flows for the years then ended. Our report dated March 10, 2010, expressed an unqualified opinion on those financial statements.
/s/ UHY LLP
Boston,
Massachusetts
March 10, 2010
79
None.
PART III
Item 10. Directors, Executive Officers and Corporate Governance
The information called for by this item is hereby incorporated by reference to the Registrant's definitive Proxy Statement for the fiscal year ended December 31, 2009, which Proxy Statement will be filed with the Securities and Exchange Commission no later than 120 days after the end of the fiscal year covered by this report.
Item 11. Executive Compensation
The information called for by this item is hereby incorporated by reference to the Registrant's definitive Proxy Statement for the fiscal year ended December 31, 2009, which Proxy Statement will be filed with the Securities and Exchange Commission no later than 120 days after the end of the fiscal year covered by this report.
Item 12. Security Ownership of Certain Beneficial Owners and Management and Related Stockholder Matters
The information called for by this item is hereby incorporated by reference to the Registrant's definitive Proxy Statement for the fiscal year ended December 31, 2009, which Proxy Statement will be filed with the Securities and Exchange Commission no later than 120 days after the end of the fiscal year covered by this report.
Item 13. Certain Relationships and Related Transactions, and Director Independence
The information called for by this item is hereby incorporated by reference to the Registrant's definitive Proxy Statement for the fiscal year ended December 31, 2009, which Proxy Statement will be filed with the Securities and Exchange Commission no later than 120 days after the end of the fiscal year covered by this report.
Item 14. Principal Accounting Fees and Services
The information called for by this item is hereby incorporated by reference to the Registrant's definitive Proxy Statement for the fiscal year ended December 31, 2009, which Proxy Statement will be filed with the Securities and Exchange Commission no later than 120 days after the end of the fiscal year covered by this report.
80
PART IV
Item 15. Exhibits, Financial Statement Schedules
- (a)
- The following documents are filed as a part of this report:
| 1. |
Financial Statements |
Sequential Page Number |
||||
|---|---|---|---|---|---|---|
|
Report of Independent Registered Public Accounting Firm |
36 |
||||
|
Report of Independent Registered Public Accounting Firm |
37 | ||||
|
Consolidated Statements of Operations |
38 | ||||
|
Consolidated Balance Sheets as of December 31, 2009 and 2008 |
39 | ||||
|
Consolidated Statements of Cash Flows for the |
40 | ||||
|
Consolidated Statements of Stockholders' Equity for the |
41 | ||||
|
Notes to Consolidated Financial Statements |
42 | ||||
2. |
Exhibits: The Exhibits listed below are filed as part of, or incorporated by reference into, this report. |
|||||
Exhibit No. |
Description
|
|||
|---|---|---|---|---|
| 3.1 | Restated Certificate of Incorporation of Registrant(4) | |||
| 3.2 | Bylaws of Registrant(2) | |||
| 3.3 | Amendment No. 1 to Bylaws of Registrant(3) | |||
| 3.4 | Amendment No. 2 to Bylaws of Registrant(11) | |||
| 4.1 | Indenture, dated as of February 23, 2006, among Steinway Musical Instruments, Inc., as Issuer; the subsidiary guarantors; and the Bank of New York Trust Company, N.A., as Trustee(7) | |||
| 10.1 | Employment Agreement dated as of August 29, 2007 by and between Steinway & Sons and Thomas Kurrer(11) | |||
| 10.2 | Employment Agreement dated as of August 29, 2007 by and between Steinway, Inc. and Ronald Losby(11) | |||
| 10.3 | Employment Agreement dated August 29, 2007 by and between Steinway Musical Instruments, Inc. and Dennis Hanson(11) | |||
| 10.4 | Employment Agreement dated August 29, 2007 by and between Steinway Musical Instruments, Inc. and Dana Messina(11) | |||
| 10.5 | Employment Agreement dated August 29, 2007 by and between Steinway Musical Instruments, Inc. and Kyle Kirkland(11) | |||
| 10.6 | Distribution Agreement, dated November 1, 1952, by and between H. & A. Selmer, Inc. and Henri Selmer & Cie(1) | |||
| 10.7 | Employment Agreement dated October 17, 2002 between Conn-Selmer, Inc. and John M. Stoner, Jr.(5) | |||
81
| 10.8 | Third Amended and Restated Credit Agreement, dated as of September 29, 2006, among Conn-Selmer, Inc., f/k/a The Selmer Company, Inc., and the surviving corporation of the merger of United Musical Instruments USA, Inc., United Musical Instruments Holdings, Inc. and The SMI Trust with and into Conn-Selmer, Inc., Steinway, Inc., Boston Piano Company, Inc., and together with Conn-Selmer and Steinway, as borrowers, those signatories identified as guarantors, the lenders, and GMAC Commercial Finance LLC (successor by merger to GMAC Commercial Credit, LLC), as Administrative Agent(8) | |||
| 10.9 | First Amendment to the Third Amended and Restated Credit Agreement, dated as of December 12, 2007, among Conn-Selmer, Inc., f/k/a The Selmer Company, Inc., and the surviving corporation of the merger of United Musical Instruments, USA, Inc., United Musical Instruments Holdings, Inc. and The SMI Trust with and into Conn-Selmer, Inc., Boston Piano Company, Inc., and together with Conn-Selmer and Steinway, as borrowers, those signatories identified as guarantors, the lenders, and GMAC Commercial Finance LLC (successor by merger to GMAC Commercial Credit, LLC), as Administrative Agent(13) | |||
| 10.10 | Second Amendment and Waiver to the Third Amended and Restated Credit Agreement, dated as of May 9, 2008, to the Existing Credit Agreement, by and among Conn-Selmer, Inc. and Steinway, Inc., those signatories identified as guarantors, the lenders, and GMAC Commercial Finance LLC, as Administrative Agent(15) | |||
| 10.11 | Third Amendment and Waiver to the Third Amended and Restated Credit Agreement, dated as of July 10, 2009, to the Existing Credit Agreement, by and among Conn-Selmer, Inc. and Steinway, Inc., those signatories identified as guarantors, the lenders, and GMAC Commercial Finance LLC, as Administrative Agent(15) | |||
| 10.12 | Agreement between Conn-Selmer, Inc. and U.A.W. Local 2359(13) | |||
| 10.13 | Labor Contract Agreement between Musser Division and Carpenter Local 1027 Mill-Cabinet-Industrial Division affiliate of Chicago Regional Council of Carpenters of the United Brotherhood of Carpenters and Jointers of America(12) | |||
| 10.14 | Summary Description of Compensation for Non-Employee Directors(9) | |||
| 10.15 | Steinway Musical Instruments, Inc. 2006 Stock Compensation Plan(10) | |||
| 10.16 | Steinway Musical Instruments, Inc. 2006 Employee Stock Purchase Plan(10) | |||
| 10.17 | Subscription Agreement dated as of November 5, 2009, by and among Samick Musical Instruments Co, Ltd., and Steinway Musical Instruments, Inc.(15) | |||
| 14.0 | Code of Ethics and Professional Conduct(6) | |||
| 16.1 | Letter Regarding the Change in Certifying Accountant – Deloitte & Touche LLP(14) | |||
| 21.1 | List of Subsidiaries of the Registrant | |||
| 23.1 | Consent of Independent Registered Public Accounting Firm – UHY LLP | |||
| 23.2 | Consent of Independent Registered Public Accounting Firm – Deloitte & Touche LLP | |||
| 31.1 | Certification of the Chief Executive Officer Pursuant to Section 302 of the Sarbanes-Oxley Act of 2002 | |||
| 31.2 | Certification of the Chief Financial Officer Pursuant to Section 302 of the Sarbanes-Oxley Act of 2002 | |||
| 32.1 | Certification of the Principal Executive Officer pursuant to 18 U.S.C. Section 1350, as adopted pursuant to Section 906 of the Sarbanes-Oxley Act of 2002 | |||
| 32.2 | Certification of the Principal Financial Officer pursuant to 18 U.S.C. Section 1350, as adopted pursuant to Section 906 of the Sarbanes-Oxley Act of 2002 |
82
- (1)
- Previously
filed with the Commission on February 8, 1994 as an exhibit to the Registrant's Registration Statement on
Form S-1.
- (2)
- Previously
filed with the Commission on May 14, 1996 as an exhibit to the Registrant's Registration Statement on
Form S-1.
- (3)
- Previously
filed with the Commission on July 5, 1996 as an Exhibit to the Registrant's Amendment No. 1 to Registration Statement
on Form S-1.
- (4)
- Previously
filed with the Commission on March 27, 1997 as an exhibit to the Registrant's Annual Report on Form 10-K.
- (5)
- Previously
filed with the Commission on March 18, 2003 as an exhibit to the Registrant's Annual Report on Form 10-K.
- (6)
- Previously
filed with the Commission on March 31, 2005 as an exhibit to the Registrant's Annual Report on Form 10-K.
- (7)
- Previously
filed with the Commission on February 27, 2006 as an exhibit to the Registrant's Current Report on
Form 8-K.
- (8)
- Previously
filed with the Commission on October 4, 2006 as an exhibit to the Registrant's Current Report on
Form 8-K.
- (9)
- Previously
filed with the Commission on May 15, 2007 in the Registrant's Current Report on Form 8-K.
- (10)
- Previously
filed with the Commission on July 17, 2007 as an exhibit to the Registrant's Registration Statement on
Form S-8.
- (11)
- Previously
filed with the Commission on August 31, 2007 as an exhibit to the Registrant's Current Report on
Form 8-K.
- (12)
- Previously
filed with the Commission on January 31, 2008 as an exhibit to the Registrant's Current Report on
Form 8-K.
- (13)
- Previously
filed with the Commission on March 17, 2008 as an exhibit to the Registrant's Annual Report on
Form 10-K.
- (14)
- Previously
filed with the Commission on April 8, 2008 as an exhibit to the Registrant's Current Report on Form 8-K.
- (15)
- Previously
filed with the Commission on August 7, 2009 as an exhibit to the Registrant's Quarterly Report on Form 10-Q.
- (16)
- Previously filed with the Commission on November 5, 2009 as an exhibit to the Registrant's Current Report on Form 8-K.
83
Pursuant to the requirements of Section 13 or 15(d) of the Securities Exchange Act of 1934, the Registrant has duly caused this report to be signed on its behalf by the undersigned, thereunto duly authorized.
| Steinway Musical Instruments, Inc. | ||||||
By: |
/s/ Dana D. Messina Dana D. Messina |
March 10, 2010 (Date) |
||||
Pursuant to the requirements of the Securities Exchange Act of 1934, this report has been signed by the following persons on behalf of the registrant and in the capacities listed below on March 10, 2010:
| Signature |
Title |
|
|---|---|---|
| /s/ Dana D. Messina Dana D. Messina |
Director and Chief Executive Officer (Principal Executive Officer) | |
/s/ Dennis M. Hanson Dennis M. Hanson |
Chief Financial Officer (Principal Financial and Accounting Officer) |
|
/s/ Kyle R. Kirkland Kyle R. Kirkland |
Chairman of the Board |
|
/s/ John M. Stoner, Jr. John M. Stoner, Jr. |
Director |
|
/s/ Thomas Kurrer Thomas Kurrer |
Director |
|
/s/ Peter McMillan Peter McMillan |
Director |
|
/s/ A. Clinton Allen A. Clinton Allen |
Director |
|
/s/ Rudolph K. Kluiber Rudolph K. Kluiber |
Director |
|
/s/ David Lockwood David Lockwood |
Director |
|
/s/ Jong Sup Kim Jong Sup Kim |
Director |
84