Attached files
Table of Contents
UNITED STATES
SECURITIES AND EXCHANGE COMMISSION
Washington, D.C. 20549
FORM 10-K
(Mark One)
| x | ANNUAL REPORT PURSUANT TO SECTION 13 OR 15(d) OF THE SECURITIES EXCHANGE ACT OF 1934 |
For the fiscal year ended January 1, 2010
OR
| ¨ | TRANSITION REPORT PURSUANT TO SECTION 13 OR 15(d) OF THE SECURITIES EXCHANGE ACT OF 1934 |
Commission file number 000-29617
INTERSIL CORPORATION
(Exact name of Registrant as specified in its charter)
| Delaware | 59-3590018 | |
| (State or other jurisdiction of incorporation or organization) |
(I.R.S. Employer Identification No.) | |
| 1001 Murphy Ranch Road, Suite 1 Milpitas, California |
95035 | |
| (Address of principal executive offices) | (Zip Code) | |
408-432-8888
Registrant’s telephone number, including area code
Securities registered pursuant to Section 12(b) of the Act:
| Title of class |
Name of each exchange on which registered | |
| Class A Common Stock, par value $0.01 per share | The NASDAQ Stock Market LLC |
Securities registered pursuant to Section 12(g) of the Act:
None
Indicate by check mark whether the registrant is a well-known seasoned issuer, as defined in Rule 405 of the Securities Act. Yes x No ¨
Indicate by check mark if the registrant is not required to file reports pursuant to Section 13 or Section 15(d) of the Act. Yes ¨ No x
Indicate by check mark whether the registrant (1) has filed all reports required to be filed by Section 13 or 15(d) of the Securities Exchange Act of 1934 (“Act”) during the preceding 12 months (or for such shorter period that the registrant was required to file such reports), and (2) has been subject to such filing requirements for the past 90 days. Yes x No ¨
Indicate by check mark whether the registrant has submitted electronically and posted on its corporate Web site, if any, every Interactive Data File required to be submitted and posted pursuant to Rule 405 of Regulation S-T (§232.405 of this chapter) during the preceding 12 months (or for such shorter period that the registrant was required to submit and post such files. Yes x No ¨
Indicate by check mark if disclosure of delinquent filers pursuant to Item 405 of Regulation S-K (§229.405 of this chapter) is not contained herein, and will not be contained, to the best of the Registrant’s knowledge, in definitive proxy or information statements incorporated by reference in Part III of this Form 10-K or any amendment to this Form 10-K. ¨
Indicate by check mark whether the registrant is a large accelerated filer, an accelerated filer, a non-accelerated filer, or a smaller reporting company. See the definitions of “large accelerated filer,” “accelerated filer” and “smaller reporting company” in Rule 12b-2 of the Exchange Act.
| Large accelerated filer | x | Accelerated filer | ¨ | |||||
| Non-accelerated filer | ¨ | Smaller reporting company | ¨ | |||||
Indicate by check mark whether the registrant is a shell company (as defined in Rule 12b-2 of the Act). Yes ¨ No x
The aggregate market value of our Class A Common Stock, par value $.01 per share, held by non-affiliates (based upon the closing sale price of $12.29 on the Nasdaq Global Select Market) on July 2, 2009 was approximately $1,502.5 million.
As of February 19, 2010, there were 123,015,706 shares of our Class A Common Stock, par value $.01 per share, outstanding.
The information required by Part III of this Annual Report on Form 10-K, to the extent not set forth herein, is incorporated by reference from the Registrant’s definitive Proxy Statement for the Annual Meeting of Shareholders to be held May 5, 2010.
Table of Contents
INTERSIL CORPORATION
FORM 10-K
January 1, 2010
2
Table of Contents
PART I.
| Item 1. | Business |
Forward Looking Statements
This Annual Report on Form 10-K contains statements relating to expected future results and business trends of Intersil Corporation that are based upon our current estimates, expectations, assumptions and projections about our industry, as well as upon certain views and beliefs held by management, that are “forward-looking statements” as defined in the Private Securities Litigation Reform Act of 1995. Words such as “anticipates,” “expects,” “intends,” “plans,” “believes,” “seeks,” “estimates,” “may,” “will,” and variations of these words or similar expressions are intended to identify “forward-looking statements.” In addition, any statements that refer to expectations, projections, or other characterizations of future events or circumstances, including any underlying assumptions, are “forward-looking statements.” Such statements are not guarantees of future performance and are subject to certain risks, uncertainties, and assumptions that are difficult to predict. Therefore, undue reliance should not be placed on such statements as our actual results may differ materially and adversely from those expressed in any “forward-looking statement” as a result of various factors. These factors include, but are not limited to:
| • | industry and global economic and market conditions, such as the cyclical nature of the semiconductor industry and the markets addressed by our and our customers’ products; |
| • | successful development of new products; |
| • | new product performance and quality; |
| • | manufacturing difficulties, such as the availability and extent of utilization of manufacturing capacity and raw materials; |
| • | the failure of our suppliers or outsource providers to perform their obligations in a manner consistent with our expectations; |
| • | pricing pressures and other competitive factors, such as competitors’ new products; |
| • | changes in product mix; |
| • | product obsolescence; |
| • | legal challenges to our products and technology, such as intellectual property infringement and misappropriation claims; |
| • | the need for additional capital; |
| • | legislative, tax, accounting, or regulatory changes or changes in their interpretation; |
| • | the ability to develop and implement new technologies and to obtain protection of the related intellectual property; |
| • | the timing of new product introductions; |
| • | the successful integration of acquisitions; |
| • | demand for, and market acceptance of, new and existing products; |
| • | the extent and timing that customers order and use our products and services in their production or business; |
| • | competitors with significantly greater financial, technical, manufacturing and marketing resources; |
| • | fluctuations in manufacturing yields; |
| • | procurement shortage; |
| • | transportation, communication, demand, information technology or supply disruptions based on factors outside our control such as natural disasters, wars, and terrorist activities; |
| • | changes in import export regulations; and |
| • | exchange rate fluctuations. |
These “forward-looking statements” are made only as of the date hereof, and we undertake no obligation to update or revise the “forward-looking statements,” whether as a result of new information, future events or otherwise.
General
We design, develop, manufacture and market high-performance analog and mixed-signal integrated circuits (“ICs”). We believe our product portfolio addresses some of the largest opportunities within the high-end consumer, industrial, computing and communications markets.
3
Table of Contents
Business Strategy
Our business strategy emphasizes the following key elements:
| • | Focus on Large Vertical Markets. We focus our investments on markets with the potential for high growth. We believe that the demand for ICs in our focused markets will be higher than that in the overall semiconductor industry. |
| • | Broaden our Product Portfolio. We have and will continue to increase our investments in the design of general purpose proprietary products and continue to develop application-specific standard products for high-growth vertical markets. |
| • | Maintain Technology Leadership. We have more than 650 research and development employees working on innovative solutions for analog and mixed-signal architectures. In conjunction with these efforts, we continue to expand our strong intellectual property position by seeking to increase our existing portfolio of over 1,100 patents. |
| • | Maintain Quality Customer Service. Quality customer service is critical to our customer retention and sales growth. Through our customer relations initiatives, we believe we distinguish ourselves from our competitors. Additionally, our sales force, authorized representatives and distributors provide customer information programs and support for our comprehensive global customer service efforts. |
| • | Partner with Leaders in Semiconductor Markets, Products and Services |
| • | Partner with Leaders in our Target Markets. We partner with industry leaders in each of our target markets to deliver advanced technology for rapidly emerging applications. Our customer base of industry leaders illustrates the acceptance of our products to date, and we continue to partner with these customers and others to develop and market our next generation products. Our applications and design engineers support our customers’ end product development. |
| • | Utilize Specialty Expertise in Manufacturing Services. We employ high-volume and specialty suppliers of products and services in our industry. We outsource a substantial portion of our wafer needs as well as assembly, test and packaging requirements. We utilize merchants who specialize in those products and services and deliver them at reasonable cost. This reduces our capital requirements and enhances our flexibility in managing our ever-changing business. |
Background
Our mission is to provide differentiated, high-performance analog and mixed-signal ICs that meet our customers’ needs and exceed their expectations. Our objective is to grow our business faster than our peers. We were formed in August 1999 when we acquired the semiconductor business of Harris Corporation (“Harris”) and began operating as Intersil. We began our transformation into a high-performance analog and mixed-signal company in 2002 with the acquisition of Elantec Semiconductor, Inc. (“Elantec”), the divestiture of our wireless networking business in 2003, the 2004 acquisition of Xicor, Inc. (“Xicor”) and the 2007 acquisition of Planet ATE, Inc. (“Planet ATE”). During fiscal year 2008, we acquired D2Audio Corporation (“D2Audio”), Kenet, Incorporated (“Kenet”) and Zilker Labs (“Zilker”). During fiscal year 2009, we acquired Quellan Inc. (“Quellan”) and initiated the acquisition of Rock Semiconductor (“Rock”).
Our internet address is www.intersil.com. We post the following filings on our website as soon as reasonably practicable after they are electronically filed with the Securities and Exchange Commission (the “SEC”): our annual reports on Form 10-K, our quarterly reports on Form 10-Q, our current reports on Form 8-K, the filings of our officers and directors pursuant to Section 16(a) of the Securities Exchange Act of 1934 (“the Exchange Act”), our proxy statements on Schedule 14A related to our annual shareholders’ meeting and any amendments to any of those reports or statements filed or furnished pursuant to Section 13(a) or 15(d) of the Act. All such filings are available free of charge on our website. We have adopted a Corporate Code of Ethics, which is applicable to our Senior Financial Officers, including our Chief Executive Officer, Chief Financial Officer, Treasurer and other persons performing similar functions. A copy of the Code of Ethics is available on our website or free of charge upon request. The content on any website referred to in this filing is not incorporated by reference into this filing unless expressly noted otherwise.
The public may read and copy any materials filed by us with the SEC at the SEC’s Public Reference Room at 100 F Street, NE, Washington, DC 20549 and may obtain information on the operation of the Public Reference Room by calling the SEC at 1-800-SEC-0330. The SEC maintains an Internet site that contains reports, proxy and information statements, and other information regarding issuers that file electronically with the SEC at http://www.sec.gov.
4
Table of Contents
Products and Technology
Our product strategy is focused on broadening our portfolio of Application-Specific Standard Products (“ASSP”) and General Purpose Proprietary Products (“GPPP”) which are targeted within the high-end consumer, industrial, computing and communications markets.
High-End Consumer
Our high-end consumer products include our gaming, light sensors, optical storage, displays and handheld products. These products target high growth applications such as electronic game systems, DVD players and recorders, MP3 players, GPS systems, liquid crystal display (“LCD”) televisions, data converters and smart cell phones. The high-end consumer category represented 25% of our sales in fiscal year 2009.
Industrial
Our industrial products include our operational amplifiers, bridge driver power management products, switches and multiplexers, and other standard analog and power management products. These products target end markets including medical imaging, energy management, automotive, solar generating devices, military and factory automation. The industrial products category represented 20% of our sales in fiscal year 2009.
Communications
Our communications group is made up of our line drivers, broadband and hot plug power management products and high speed converters targeted to applications in markets such as DSL (Digital Subscriber Line), home gateway, satellite, networking, cellular base station and networking/switching equipment. The communications category represented 22% of our sales in fiscal year 2009.
Computing
Our computing category includes desktop, server and notebook power management, including core power devices and other power management products for peripheral devices. The computing category represented 33% of our sales in fiscal year 2009.
Glossary
Analog integrated circuits - The circuits in analog chips operate with voltage and current varying in a continuous fashion; in contrast, digital chips only use and create voltages or currents at discrete levels, with no intermediate values. Some examples of analog chips are operational amplifiers, voltage references, and comparators.
Bridge driver power management—a bridge driver is a device that supplies (i.e., drives) or accepts power in the form of voltage and current into a circuit that consists of a load connecting (i.e., bridging) two or more switching elements. An example of a bridge driver is a device that opens and closes switches arranged to cause a motor to start, control speed, stop, and reverse direction. Power management from/to those devices is an element of the technology.
Broadband power management—Broadband is a term which refers to a signaling method which includes or handles a relatively wide range of frequencies which may be divided into channels. Power management from/to those devices is an element of the technology.
Cellular Base Station—consists of transmission and reception equipment, including the base station antenna, which connects a cellular phone to the network.
DVD (digital video disc) recorder—also known as a DVD burner, is an optical disc recorder that records video onto blank writable DVD media.
GPS (Global Positioning System) systems—devices that use the Global Navigation Satellite System, which is comprised of more than two dozen GPS satellites in medium Earth orbit, transmitting signals allowing GPS receivers to determine the receiver’s location, speed and direction.
High speed (power) converters—a circuit which converts a source of direct current from one voltage to another. Converters are important in portable electronic devices such as cellular phones and laptop computers, which are supplied with power from batteries. Such electronic devices often contain several sub-circuits with each sub-circuit requiring a unique voltage level different than that supplied by the battery.
5
Table of Contents
Hot plug power management—hot plugging, also known as hot swapping, is the ability to remove and replace components of a machine, usually a computer, while it is operating. A well-known example of this functionality is the universal serial bus (USB) that allows users to add or remove peripheral components. Power management from/to those devices is an element of the technology.
Line driver—an amplifier used to improve the transmission reliability of a digital signal over a metallic transmission line, to longer physical distances, by driving the input to the line with a higher than normal signal level.
Mixed-signal integrated circuits—A mixed-signal integrated circuit is any integrated circuit that has both analog circuits and digital circuits on a single semiconductor die. Examples of mixed-signal integrated circuits include analog-to-digital/digital-to-analog converters, digitally controlled potentiometers, and real time clocks.
MP3 players—devices that play digital audio in the MPEG-1 Audio Layer 3 format, more commonly referred to as MP3, which is an encoding and compression format designed to greatly reduce the amount of data required to represent the audio content.
Multiplexer—also known as ‘mux’ is a device that combines several input signals into a single output signal in such a manner that each of the input signals subsequently can be recovered.
Operational amplifiers—usually referred to as an ‘op-amp’—captures weak signals from various inputs and amplifies them for processing. Op-amps are among the most widely used electronic devices today, being utilized in a vast array of consumer, industrial, and scientific devices.
Smart Cell Phones—a device that allows a user to make telephone calls, but also adds features that one might find on a computer—such as the ability to access the internet, send and receive e-mail and edit Office documents.
Vertical markets—focus on specific end-use applications such as cell phones, personal computers and flat-panel televisions. Vertical markets are distinct from horizontal markets in that horizontal markets focus on general purpose IC products that can be used in thousands of applications such as data converters, voltage regulators, and many other IC component products.
Geographic Financial Summary
We operate exclusively in the semiconductor industry and primarily the high-performance analog and mixed-signal sector of that industry. Substantially all revenues result from the sales of semiconductor products. All intercompany revenues and balances have been eliminated. The revenues noted in this section are based on shipping destination.
A summary of the operations by geographic area is summarized below ($ in millions):
| Year Ended | |||||||||
| January 1, 2010 |
January 2, 2009 |
December 28, 2007 | |||||||
| United States Operations |
|||||||||
| Net revenues |
$ | 98.1 | $ | 136.5 | $ | 129.3 | |||
| Tangible long-lived assets |
64.6 | 70.0 | 77.0 | ||||||
| International Operations |
|||||||||
| Net revenues |
513.3 | 633.2 | 627.7 | ||||||
| Tangible long-lived assets |
37.7 | 42.8 | 32.6 | ||||||
We market our products for sale to customers, including distributors, primarily in China, the U.S., South Korea, Taiwan and Japan. A summary of percent of revenues by country is summarized below and shows countries where values exceeded 10% in any one year presented:
| Year Ended | |||||||||
| January 1, 2010 |
January 2, 2009 |
December 28, 2007 |
|||||||
| Revenues by country |
|||||||||
| China (includes Hong Kong) |
49 | % | 42 | % | 41 | % | |||
| United States |
16 | 18 | 17 | ||||||
| South Korea |
11 | 12 | 13 | ||||||
In addition to those in the table above, our customers in each of Taiwan, Japan, Germany, Singapore, Thailand and Netherlands accounted for at least 1% of our total revenues in fiscal year 2009.
6
Table of Contents
Three distributor customers, one original equipment manufacturer (“OEM”) customer and two contract manufacturers, each accounting for at least 5% of our revenues, totaled 54% of revenues in fiscal year 2009. One distributor, Aeco Technology Co., LTD, represented 14% of revenues during fiscal year 2009 and 16% of aggregate net accounts receivable as of January 1, 2010. The loss of any one or more of these customers could result in a materially negative impact on our business.
Sales, Marketing and Distribution
In fiscal year 2009, we derived 52% of our revenues from OEM customers, original design manufacturer (“ODM”) customers, and contract manufacturers. We derived 48% of our revenues through distributors and value added resellers.
Our sales organization is supported by customer service and logistics organizations throughout the world. Product orders flow to our fabrication facility or to foundries where the semiconductor wafers are made. Most of our semiconductors are assembled and tested at the facilities of independent subcontractors. Finished products are then shipped to customers either indirectly via third parties or directly via company-managed warehouses in the United States, Asia/Pacific and Europe.
To serve our customer base, we maintain a highly focused sales team, which focuses on those major accounts that are strategic to our marketing and product strategies. Our direct geographical sales organizations sell products in regions throughout the world. The geographical sales force works closely with a network of distributors and manufacturers’ representatives, creating a worldwide selling network. Dedicated direct sales organizations operate in the North American, European, Japanese, and Asia/Pacific markets. We strategically locate sales offices near major OEM and ODM customers throughout the world. The technical applications organization is deployed alongside the direct sales force, ensuring both applications and product/customer focus. Our dedicated marketing organization supports field sales and is aligned by specific product group.
Manufacturers’ representatives generally do not offer products that compete directly with our products, but may offer complementary items manufactured by others. Manufacturers’ representatives do not maintain product inventory; instead, customers place large quantity orders either directly with us or through these manufacturers’ representatives. Smaller quantity orders are typically placed through distributors.
Distributors handle a wide variety of products, including products sold by other companies that compete with our products. Some of our sales to distributors include agreements allowing for market price fluctuations and/or the right to return some unsold merchandise. Some of our distribution agreements contain an industry standard stock rotation provision allowing for minimum levels of inventory returns or scrap. In our experience, these inventory returns can usually be resold. We recognize revenue shipped to North American distributors when the distributor sells the product. We generally recognize sales made to international distributors when product is shipped to the international distributors and provisions are recorded on those sales for expected price fluctuations and returns.
Research and Development
We believe that the continued introduction of new products in our target markets is essential to our growth. We incurred costs of $145.1 million, $143.6 million and $134.4 million on research and development projects for 2009, 2008 and 2007 respectively, including share-based payment expense. We believe that we must continue to innovate, enhance and expand our products and services to maintain our leadership position, and we intend to achieve this through in-house research and development and, occasionally, selective acquisitions. As of January 1, 2010, we had more than 650 employees engaged in research and development. Historically, we have introduced hundreds of new products each year over many different product families and serving many different markets.
Manufacturing
We sell many product types that utilize silicon wafers containing integrated circuits. Our business is dependent upon reliable fabrication, packaging and testing of these wafers. We fabricate wafers of integrated circuits in our Florida manufacturing facility. We also have wafers of integrated circuits manufactured by leading foundry suppliers such as IBM Microelectronics, Taiwan Semiconductor Manufacturing Company and United Microelectronics Corporation. We believe that our strategy of employing internal and foundry suppliers provides an increased level of flexibility and capacity to meet production demand. In addition, this strategy significantly reduces the ongoing capital investment required to maintain our production capabilities. During fiscal year 2009, we internally produced approximately 16% of our wafers and outsourced the remaining 84% from foundry partners.
Following fabrication, wafers are subject to packaging and testing processes. The majority of these processes are performed by independent subcontractors located in Malaysia, China, Taiwan and the Philippines. However, we maintain assembly and test capabilities for certain products in Florida and California.
In the recent past, we have not experienced delays in obtaining raw materials. However our reliance on foundry partners for silicon wafers, the building block of our products, is critical and the relative importance of this part of the supply chain continues to increase, increasing our risk of incurring a production-limiting shortfall. As is typical in the industry, we must allow for significant
7
Table of Contents
lead times in delivery of certain materials. The production of integrated circuits, from wafer fabrication through packaging and final testing, may take from eight to sixteen weeks. We manufacture thousands of product types and our customers typically require delivery within a short period of time following their order. To consistently meet these requirements, we maintain a substantial work-in-process and finished goods inventory. Manufacture, assembly and testing of integrated circuits is a complex process. Normal risks include errors and interruptions in the production process, defects and shortages in raw materials, disruptions at supplier locations, unexpected demand, as well as other risks, all of which can have an unfavorable impact to production costs, gross margins and our ability to meet customer demand.
Backlog
Our product sales are made pursuant to purchase orders that are generally booked up to six months in advance of delivery. Our standard terms and conditions of sale provide that these orders become non-cancelable thirty days prior to scheduled delivery for standard products and ninety days prior to scheduled delivery for semi-custom and custom products. Backlog is influenced by several factors, including market demand, pricing and customer order patterns in reaction to product lead times.
Additionally, we believe backlog can fall faster than consumption rates in periods of weak end-market demand since production lead times can be shorter. Conversely, we believe backlog can grow faster than consumption in periods of strong end-market demand as production and delivery times increase and some customers may increase orders in excess of their current consumption to reduce their own risk of production disruptions.
Our six-month backlog as of January 1, 2010 was $157.4 million compared to the six-month backlog as of January 2, 2009 of $86.9 million. Although not always the case, as discussed in the foregoing paragraph, backlog can be a leading indicator of near-term revenue performance.
See “Business Outlook” elsewhere in this Management’s Discussion and Analysis of Financial Condition and Results of Operations relating to expected revenues in the near term.
Seasonality
The high-end consumer and computing markets generally experience relatively weak demand in the first half of each year and stronger demand in the second half of each year.
Competition
The high performance analog and mixed-signal market is extremely competitive. We compete in our target markets with many companies that may have significantly greater financial, technical, manufacturing and marketing resources than us, including but not limited to Texas Instruments, Analog Devices, Linear Technology, and Maxim Integrated Products. We compete on the basis of technical performance, product features, customized design, price, availability, quality, and sales and technical support. Our ability to compete successfully depends on elements both within and outside of our control, including successful and timely development of new products and manufacturing processes, product performance and quality, manufacturing yields, product availability, intellectual property protection obtained by us and our competitors, customer service, pricing, industry trends and general economic trends.
Trademarks and Patents
We own rights to a number of trademarks and patents that are important to our business. Our trademarks do not expire as long as we continue to use them in our business. We have registered some of our trademarks with the U.S. Patent and Trademark Office and other foreign governmental trademark authorities. These registrations provide rights in addition to basic trademark rights. As long as we comply with renewal and other procedures specified by the applicable trademark laws, these additional rights will not expire. Our corporate policy is to protect proprietary products by obtaining patents for these products when practicable. We currently possess over 1,100 U.S. and foreign patents and have approximately 780 U.S. and foreign patents pending. The expiration dates of these patents range from 2010 to 2028.
Employees
Our worldwide workforce consisted of 1,503 employees (full- and part-time) as of January 1, 2010. None of our employees are subject to a collective bargaining agreement. In April 2008, we announced a plan to consolidate our internal foundries and reduce the related workforce. In November 2008, in response to the deteriorating global economic environment, we announced further restructuring efforts, that when combined with the foundry consolidation, would reduce our world-wide workforce by approximately 9%. As of January 1, 2010, we have completed substantially all of our existing restructuring initiatives.
8
Table of Contents
Environmental Matters
We believe that our operations are substantially in compliance with applicable environmental requirements. Our costs and capital expenditures to comply with environmental regulations have been immaterial during the last three fiscal years. However, we are subject to numerous federal, state and international environmental laws and regulatory requirements. From time to time, we become involved in investigations or litigations of various potential environmental issues concerning activities at our facilities or former facilities or remediation as a result of past activities (including past activities of companies we have acquired). Further, we may receive notices from the U.S. Environmental Protection Agency or equivalent state or international environmental agencies that we are a potentially responsible party under the Comprehensive Environmental Response, Compensation and Liability Act (commonly known as the “Superfund Act”) and/or equivalent laws. Such notices assert potential liability for cleanup costs at various sites, which may include sites owned by us, sites we previously owned and treatment or disposal sites not owned by us, allegedly containing hazardous substances attributable to us from past operations. While it is not feasible to predict the outcome of many of these proceedings, in the opinion of our management, any payments we may be required to make as a result of such claims in existence will not have a material adverse effect on our financial condition, results of operations or cash flows. To the extent any contamination was caused prior to August 1999, Intersil is indemnified against any associated environmental liabilities. This indemnification does not expire, nor does it have a maximum amount.
| Item 1A. | RISK FACTORS |
You should carefully consider and evaluate all of the information in this Annual Report on Form 10-K, including the risk factors listed below. The risks described below are not the only ones facing us. Additional risks not now known to us or that we currently deem immaterial may also impair our business operations. If any of these risks occur, our business could be materially harmed. If our business is harmed, the trading price of our Class A common stock could decline.
As discussed in “Forward Looking Statements” in Item 1 above, this Annual Report on Form 10-K contains forward-looking statements that involve risks and uncertainties. Our actual results could differ materially from those anticipated in the forward looking statements, including as a result of the risks described in the cautionary statements in this “Risk Factors” section and elsewhere in this Annual Report on Form 10-K, in our other filings with the SEC, and in material incorporated by reference. We undertake no duty to update or revise any forward-looking statements, whether as a result of new information, future events or otherwise.
RISK FACTORS RELATING TO GENERAL BUSINESS CONDITIONS
Our quarterly revenues and operating results are unpredictable and are likely to fluctuate.
Our revenues and operating results may fluctuate significantly from quarter to quarter due to a number of factors, not all of which are in our control. We manage our expense levels based in part on our expectations of future revenues. If revenue levels in a particular quarter do not meet our expectations, our operating results may be adversely affected. Because our operating expenses are based in part on anticipated future revenues, and a certain amount of those expenses are relatively fixed, a change in the timing of recognition of revenue and/or the level of gross profit can unfavorably affect operating results in a particular quarter. Factors that may cause our financial results to fluctuate unpredictably include, but are not limited to:
| • | industry and global economic and market conditions, such as the cyclical nature of the semiconductor industry and the markets addressed by our and our customers’ products; |
| • | global economic weakness, including insufficient credit available for our customers to purchase our products; |
| • | demand for, and market acceptance of, new and existing products; |
| • | successful development of new products; |
| • | timing of new product introductions and new product performance and quality; |
| • | successful integration of acquisitions; |
| • | manufacturing difficulties, such as the availability and utilization of manufacturing capacity and raw materials; |
| • | failure of our suppliers or outsource providers to perform their obligations consistent with our expectations; |
| • | pricing pressures and other competitive factors, such as competitors’ new products; |
| • | competitors with significantly greater financial, technical, manufacturing and marketing resources; |
| • | changes in product mix; |
| • | fluctuations in manufacturing yields; |
| • | product obsolescence; |
| • | the ability to develop and implement new technologies and to obtain protection of the related intellectual property; |
9
Table of Contents
| • | legal challenges to our products and technology, such as intellectual property infringement and misappropriation claims; |
| • | customer service; |
| • | the extent that customers order and use our products and services in their business; |
| • | legislative, tax, accounting, or regulatory changes or changes in their interpretation; |
| • | transportation, communication, demand, information technology or supply disruptions based on factors outside our control such as natural disasters, wars, and terrorist activities; |
| • | exchange rate fluctuations; and |
| • | the need for additional capital. |
Economic conditions could materially adversely affect our revenues and results of operations.
Our operations and performance depend significantly on worldwide economic conditions. Uncertainty about current global economic conditions poses a risk as consumers and businesses may postpone spending in response to tighter credit, negative financial news and/or declines in income or asset values, which could have a material negative effect on the demand for our products and services. Other factors that could influence demand include continuing increases in fuel and other energy costs, conditions in the residential real estate and mortgage markets, labor and healthcare costs, access to credit, consumer confidence, and other macroeconomic factors affecting consumer spending behavior. These and other economic factors could have a material adverse effect on demand for our products and services and on our financial condition and operating results.
The current financial turmoil affecting the banking system and financial markets and the possibility that financial institutions may consolidate or go out of business have resulted in a tightening in the credit markets, a low level of liquidity in many financial markets and extreme volatility in fixed income, credit, currency and equity markets. The credit crisis could cause a number of negative effects on our business, including insolvency of key suppliers resulting in product delays; inability of customers, including channel partners, to obtain credit to finance purchases of our products and/or customer, including channel partner, insolvencies; and failure of derivative counterparties and other financial institutions negatively impacting our treasury operations. Other income and expense could vary materially from expectations depending on gains or losses realized on the sale or exchange of financial instruments; impairment charges related to debt securities as well as equity and other investments; interest rates; cash balances; and changes in fair value of derivative instruments. The current volatility in the financial markets and overall economic uncertainty increases the risk that the actual amounts realized in the future on our financial instruments could differ significantly from the fair values currently assigned to them. Uncertainty about current global economic conditions could also continue to increase the volatility of our stock price.
Downturns in the macroeconomic business cycle could reduce our revenues and profitability.
The semiconductor industry is highly cyclical, which could create significant variation in our operating results. The markets in which we compete may experience downturns in the future that negatively affect our sales. A macroeconomic downturn may cause us to experience a significant decrease in our operating income margins as a result of declining sales and resulting industry changes such as product mix, price competition and costs associated with the need for continual and rapid introduction of new products.
The markets for our products depend on continued end-user demand for consumer and business electronics products as well as products in communications and industrial markets. Such demand may be adversely affected by national or global economic uncertainties, such as continuing increases in oil prices, fluctuating interest rates, subprime mortgage failures and other disruptions in credit markets, and other matters that contribute to reductions in consumer or corporate spending. As a result our revenues and gross margins could be adversely affected.
Business interruptions could harm our business.
Our worldwide operations could be subject to natural disasters and other business disruptions, which could harm our future revenue and financial condition and increase our costs and expenses. For example, our internal wafer fabrication facility is located on the east coast of Florida. Operations at these facilities experience disruptions during tropical storms and hurricanes. Further, our corporate headquarters is located near major earthquake fault lines in California and we have been unable to obtain earthquake insurance at reasonable costs and limits. In the event of a major hurricane, earthquake, or other natural or manmade disaster, we could experience loss of life of our employees, destruction of facilities or other business interruptions, any of which could materially adversely affect us. In addition, the operations of our suppliers could be subject to natural disasters and other business disruptions, which could cause shortages and price increases in various essential materials. If the operations of our suppliers are affected by natural disasters or business disruptions, we may have to reduce our manufacturing operations. Such disruptions could, in the future, have a material adverse effect on us.
We are also heavily reliant on third party freight firms for nearly all of our shipments from vendors, from our foundries to assembly and test sites, primarily in Asia, and for shipments to customers of our final product. This includes ground and air freight
10
Table of Contents
and may also include seaborne freight. Any significant disruption of such freight business globally or in certain parts of the world, particularly where our operations are concentrated, could materially affect our ability to generate revenues. Business interruption insurance may not provide enough protection to compensate us for losses that may occur. Accordingly, any of these disruptions could significantly harm our business.
Our business has been and is expected to continue to be characterized by average selling prices (“ASPs”) that decline over relatively short time periods, which can negatively affect our results of operations unless we are able to sell more units, reduce our costs, and introduce new products with higher ASPs or some combination thereof.
ASPs for our products historically have declined over relatively short time periods. For example, in fiscal year 2009 our ASPs decreased by approximately six percent compared with fiscal year 2008; and in fiscal year 2007 our ASPs decreased by approximately ten percent compared with fiscal year 2006. Declining sales prices at the product level has been a phenomenon of the semiconductor industry for much of its existence. While fiscal year 2008 did not reflect this decline due to the rapidly changing economic environment, we expect sales prices will decline in the foreseeable future. We are unable to predict pricing conditions for any future periods. When our average selling prices decline, our net sales and net income decline unless we are able to compensate by selling more units, reduce our costs or introduce new, higher margin products that incorporate advanced features.
RISK FACTORS RELATING TO PRODUCTION OPERATIONS
Production time and the cost of our products could increase if we were to lose one of our suppliers or if one of those suppliers increased the prices of raw materials.
Our operating results could be adversely affected if we were unable to obtain adequate supplies of raw materials in a timely manner or if the costs of raw materials increased significantly. Our manufacturing operations depend upon obtaining adequate supplies of raw materials on a timely basis. We purchase raw materials, such as silicon wafers, from a limited number of suppliers on a just-in-time basis. From time to time, suppliers may extend lead times, limit supplies or increase prices due to capacity constraints or other factors.
Because we depend on third party foundries and other manufacturing subcontractors to manufacture, assemble and test some of our products, we may experience delays beyond our control in delivering those products to our customers.
We use both internal wafer fabrication facilities and third-party wafer fabrication foundries in manufacturing our products. We intend to continue to rely on third party foundries and other specialist suppliers for most of our manufacturing requirements and most of our assembly and testing requirements. However, certain of these third party foundries are not obligated to supply products to us for any specific period, in any specific quantity or at any specific price. As a result, we cannot directly control semiconductor delivery schedules, which could lead to product shortages, quality assurance problems and increases in the cost of our products. We may experience delays and we cannot be sure that we will be able to obtain semiconductors within the time frames and in the volumes required by us at an affordable cost or at all. Any disruption in the availability of wafers and other semiconductor materials or any problems associated with the delivery, quality or cost of the fabrication, assembly and testing of our products could significantly hinder our ability to deliver our products to our customers and may result in a decrease in sales of our products. If the third party foundries we currently use are unable to provide our products, we may be required to seek new foundries and we cannot be certain that their services will be available at favorable terms or that sufficient capacity will be available in a reasonable time period.
In addition, the manufacture of our products is a highly complex and precise process, requiring production in a highly controlled environment. Changes in manufacturing processes or the inadvertent use of defective or contaminated materials by a third party foundry could adversely affect the foundry’s ability to achieve acceptable manufacturing yields and product reliability. If the third party foundries we currently use do not achieve adequate yields or product reliability, our customer relationships could suffer. This could ultimately lead to a loss of sales of our products and have a negative effect on our reputation, business, financial condition and/or results of operations.
We rely on manufacturing capacity located in geologically unstable areas, which could affect the availability of supplies and services.
We rely on wafer fabrication foundries and other test, assembly and packaging subcontractors in geologically unstable locations around the world. This reliance involves risks associated with the impact of earthquakes and other natural disasters on us, including temporary loss of capacity, availability and cost of key raw materials and equipment and availability of key services including transport. Any prolonged inability on the part of these foundries and/or subcontractors to serve us as a result of fire, natural disaster, unavailability of electric power or otherwise, could have a material adverse effect on our results of operations and financial condition.
11
Table of Contents
Delays in production at new facilities, in implementing new production techniques or in curing problems associated with technical equipment malfunctions may lower yields and reduce our revenues and profitability.
Our manufacturing processes are highly complex, require advanced and costly equipment and are continuously modified to improve yields and product performance. Impurities or other difficulties in the manufacturing process can lower yields. Our manufacturing efficiency is an important factor in our future profitability and we may not be able to maintain our manufacturing efficiency or increase manufacturing efficiency to the same extent as our competitors.
In addition, as is common in the semiconductor industry, we may experience difficulty in beginning production at new facilities or in effecting transitions to new manufacturing processes. Resultant delays may range in length from one month to six months. During the past five years we have experienced one material delay (six months) of starting production at a new facility. As a consequence, we suffered delays in product deliveries and reduced yields. We may experience manufacturing problems in achieving acceptable yields or experience product delivery delays in the future as a result of, among other things, capacity constraints, construction delays, upgrading or expanding existing facilities or changing our process technologies, any of which could result in a loss of future revenues. Increases in fixed costs and operating expenses related to increases in production capacity may adversely affect our operating results if revenues do not increase proportionately.
We rely on a limited number of packaging subcontractors that may not have adequate capacity or the financial resources to meet our product delivery requirements.
We rely on a limited number of independent packaging subcontractors with whom we do not have long-term contracts. A substantial majority of the IC wafers we fabricate or purchase from our outside foundries are sent to our packaging subcontractors for packaging and assembly. Our reliance on these subcontractors involves significant risks to us, including the possibility that the subcontractors will lack adequate capacity or the financial resources to deliver our products at the times and in the quantities that we request, the subcontractors will eliminate process technologies necessary for our products and the quality of our products will suffer from our lack of control over packaging and delivery. These subcontractors may discontinue doing business with us for a variety of reasons, including economic factors. As a result, we may experience product delivery and quality assurance problems, which in turn may harm our reputation and operating results.
If our products contain defects or fail to achieve industry reliability standards, our reputation may be harmed, and we may incur significant unexpected expenses and lose sales opportunities. Our insurance coverage for such events may be insufficient.
Our products may contain undetected errors or defects. Errors and defects may:
| • | cause delays in product introductions and shipments; |
| • | result in increased costs and diversion of development resources; |
| • | cause us to incur increased charges due to obsolete or unusable inventory; |
| • | require design modifications; or |
| • | decrease market acceptance or customer satisfaction with these products, resulting in product returns and lost sales. |
In addition, we may not find defects or failures timely, which may result in loss or delay in market acceptance and could significantly harm our operating results. Our current or potential customers also might seek to recover from us any losses resulting from defects or failures in our products. Further, such claims might be significantly higher than the revenues and profits we receive from the products involved, as we are usually a component supplier with limited value content relative to the value of a complete system or sub-system. Liability claims could require us to spend significant time and money in litigation or to pay significant damages for which we may have insufficient insurance coverage. Any of these claims, whether or not successful, could seriously damage our reputation and business.
RISK FACTORS RELATING TO R&D, ENGINEERING, INTELLECTUAL PROPERTY AND NEW TECHNOLOGIES
We may be unsuccessful in developing and selling new products required to maintain or expand our business.
We operate in a dynamic environment characterized by price erosion, rapid technological change, and design and other technological obsolescence. Our competitiveness and future success depend on our ability to achieve design wins for our products with current and future customers and introduce new or improved products that meet customer needs while achieving favorable margins. A failure to achieve design wins, to introduce these new products in a timely manner or to achieve market acceptance for these products, could harm our business.
The introduction of new products presents significant business challenges because product development commitments and expenditures must be made well in advance of the related revenues. The success of a new product depends on accurate forecasts of long-term market demand, future technological developments and a variety of specific implementation factors, including:
| • | timely and efficient completion of process design and development; |
12
Table of Contents
| • | timely and efficient implementation of manufacturing and assembly processes; |
| • | product performance; |
| • | the quality and reliability of the product; and |
| • | effective marketing, sales and service. |
The failure of our products to achieve market acceptance due to these or other factors could harm our business.
We use a significant amount of intellectual property in our business. If we are unable to protect this intellectual property, we could lose our right to prevent others from using our key technologies, resulting in decreased revenues.
Our future success and competitive position depend in part upon our ability to develop or obtain and subsequently maintain proprietary technology used in our principal products. We rely on intellectual property rights, including, but not limited to, rights existing under patent, trade secret, trademark, maskwork and copyright law, to protect this technology. Some of our technology is not covered by any patent or patent application, and there are risks that:
| • | some of the more than 1,100 patents that we own may be invalidated, circumvented, or challenged; |
| • | the patents that we own may not provide competitive advantages to us; or |
| • | some of our pending or future patent applications may not be issued with the initially sought scope of the claims sought by it, if issued at all. |
Further, others may develop technologies that are similar or superior to our technology, duplicate our technology or design around our patents. In addition, effective patent, trademark, copyright, maskwork and trade secret protection may be unavailable, limited or not applied for in certain foreign countries.
We also seek to protect our proprietary technology, including technology that may not be patented or patentable, in part by confidentiality agreements and, if applicable, inventors’ rights agreements with our collaborators, advisors, employees and consultants. We cannot assure that these agreements will always be undertaken or will not be breached or that we will have adequate remedies for any breach.
Some of our current licenses to use others’ technology and intellectual property are scheduled to expire periodically over the next several years, unless extended. We will need to negotiate renewals of these agreements or obtain the technology and intellectual property from alternative sources. We may not be able to obtain alternative technology and intellectual property, or renewals on substantially similar terms as those that currently exist or at all.
The failure to protect our intellectual property, to extend its existing license agreements, or utilize alternative technology could adversely affect our revenues.
Products that we manufacture and sell, or products formerly produced and sold by us and now manufactured and sold by purchasers of business that we have divested, may infringe other parties’ intellectual property rights. We may have to pay others for infringement and misappropriation of their intellectual property rights, suspend the manufacture, use or sale of some affected products, or incur the cost of defending in a litigation, resulting in significant expense to us.
The semiconductor industry is characterized by vigorous protection and pursuit of intellectual property rights. We have received, and may receive in the future, notices of claims of infringement and misappropriation of other parties’ proprietary rights. In the event of an adverse decision in a patent, trademark, copyright, maskwork or trade secret action, we could be required to withdraw the product or products found to be infringing from the market or redesign products offered for sale or under development. We have, at times, assumed indemnification obligations in favor of our customers that could be triggered upon an allegation or finding of our infringement of other parties’ proprietary rights. We have also, at times, assumed indemnification obligations in favor of the purchasers of businesses that we have divested that could be triggered upon an allegation or finding of infringement of other parties’ proprietary rights by those purchasers.
These indemnification obligations would be triggered for reasons including the sale or supply of a product that was later discovered to infringe another party’s proprietary rights. Whether or not these infringement claims are successfully asserted, we would likely incur significant costs and diversion of our resources with respect to the defense of these claims. To address any potential claims or actions asserted against us or those we have indemnified, we may seek to obtain a license under a third party’s intellectual property rights. However, in such an instance, a license may not be available on commercially reasonable terms, if at all. Litigation could result in significant expense to us, adversely affecting sales of the challenged product or technology and diverting the efforts of our technical and management personnel, whether or not the litigation is determined in our favor. In the event of an adverse outcome in any litigation, we may be required to:
| • | pay substantial damages, which may include enhanced damages for willful infringement, and incur significant attorneys’ fees; |
13
Table of Contents
| • | indemnify customers for damages they might suffer if the products they purchase from us infringe intellectual property rights of others; |
| • | indemnify purchasers of businesses that we have divested for damages they might suffer if certain of the products they sell infringe intellectual property rights of others; |
| • | stop our manufacture, use, sale or importation of infringing products; |
| • | expend significant resources to develop or acquire non-infringing technology; |
| • | discontinue the use of some processes; or |
| • | obtain licenses to intellectual property rights covering products and technology that we may, or have been found to, infringe or misappropriate such intellectual property rights. |
We are subject to litigation risks.
We are, from time to time, subject to legal claims. We are involved in a variety of routine legal matters that arise in the normal course of business. We believe it is unlikely that the final outcome of these legal claims will have a material adverse effect on our consolidated financial position or results of operation. However, claims, the claims process, and litigation are inherently uncertain and unpredictable. An unfavorable resolution of any particular legal claim or proceeding could have a material adverse effect on our consolidated financial position or results of operations.
RISK FACTORS RELATING TO INTERNATIONAL OPERATIONS
Our future success depends on international sales and the management of global operations.
Non-U.S. sales accounted for approximately 84% of our revenue in fiscal year 2009. We expect that international sales will continue to account for a significant majority of our total revenue in future years. We are subject to various challenges related to the management of global operations, and international sales are subject to risks including, but not limited to:
| • | trade balance issues; |
| • | economic and political conditions; |
| • | changes in currency controls; |
| • | differences in our ability to acquire and enforce our intellectual property and contract rights in varying jurisdictions; |
| • | our ability to develop relationships with local suppliers; |
| • | compliance with U.S. laws and regulations; |
| • | compliance with international laws and regulations, including the European Union’s Restriction of Hazardous Substances (“RoHS”), which bans lead and certain other substances from products put on the market; |
| • | fluctuations in interest and currency exchange rates; |
| • | the need for technical support resources in different locations; |
| • | our ability to secure and retain qualified people for the operation of our business; and |
| • | the actions of foreign sovereign governments. |
Many of the challenges noted above are applicable in China, which is a large and fast growing market for semiconductors and therefore an area of additional and continued growth for our business. As the business volume between China and the rest of the world grows, there is inherent risk, based on the complex relationships between China, Taiwan, Japan, and the United States, that political and diplomatic influences might lead to trade disruptions which would adversely affect our business with China and/or Taiwan and perhaps the entire Asia/Pacific region. A significant trade disruption in these areas could have a material, adverse impact on our future revenue and profits.
Fluctuations in the exchange rate of the U.S. dollar and foreign currencies could increase operating expenses and negatively affect our financial performance and results of operations.
While we and our subsidiaries transact business primarily in U.S. dollars, and most of our revenues are denominated in U.S. dollars, a portion of the costs and revenues is denominated in other currencies, such as the Euro and the Japanese Yen. As a result, changes in the exchange rates of these currencies or any other applicable currencies to the U.S. dollar will affect the costs of goods sold and operating margins and could result in exchange losses. The impact of future exchange rate fluctuations on results of operations cannot be accurately predicted. From time to time, we have engaged in, and may continue to engage in, exchange rate hedging activities in an effort to mitigate the impact of exchange rate fluctuations. However, any hedging technique that we may implement may not be effective or may result in foreign exchange hedging losses.
14
Table of Contents
We are subject to export restrictions and laws affecting trade and investments.
As a global company headquartered in the United States, we are subject to U.S. laws and regulations that limit and restrict the export of some of our products. Compliance with these laws has not significantly limited our operations or our sales in the recent past but could significantly limit them in the future. We maintain an export compliance program but there are risks that the compliance controls could be circumvented, exposing us to legal liabilities. We must also comply with export restrictions and laws imposed by other countries affecting trade and investments. Although these restrictions and laws have not significantly restricted our operations in the recent past, there is a risk that they could do so in the future.
RISK FACTORS RELATING TO SALES, MARKETING AND COMPETITION
Our business is very competitive, and increased competition could reduce gross margins and the value of an investment in our company.
The semiconductor industry and the semiconductor product market specifically are intensely competitive. Competition is based on price, product performance, quality, reliability and customer service. The gross margins realizable in our markets can differ across regions, depending on the economic strength of end-product markets in those regions. Even in strong markets, price pressures may emerge as competitors attempt to gain more market share by lowering prices. Competition in the various markets in which we participate comes from companies of various sizes, many of which are larger and have greater financial and other resources than we have and thus can better withstand adverse economic or market conditions. Some of our competitors may have better established supply or development relationships with our current and potential customers. Competitors include manufacturers and designers of standard semiconductors, application-specific integrated circuits, and fully customized integrated circuits, as well as customers who develop their own integrated circuit products. In addition, companies not currently in direct competition with us may introduce competing products with superior performance attributes in the future.
We compete against larger, more established entities as well as foreign and other market entrants and our market share may be reduced if we are unable to respond to our competitors effectively.
The semiconductor industry is characterized by price erosion, rapid technological change, and design and other technological obsolescence. We compete with domestic and international semiconductor companies, some of which have substantially greater financial and other resources to pursue engineering, manufacturing, marketing and distribution of their products. We expect continued competition from existing competitors as well as competition from new entrants in the semiconductor market, especially Asian-based producers. Our ability to compete successfully in the rapidly evolving area of integrated circuit technology depends on several factors, including:
| • | success in designing and manufacturing new products that implement new technologies; |
| • | protection of our proprietary products, processes, trade secrets and know-how; |
| • | maintaining high product quality and reliability; |
| • | pricing policies of our competitors; |
| • | performance of competitors’ products; |
| • | ability to deliver in large volume on a timely basis; |
| • | marketing, manufacturing and distribution capability; and |
| • | financial strength. |
To the extent that our products achieve market success, competitors typically seek to offer competitive products or lower prices, which, if successful, could harm our business.
We depend upon the continued demand for our products in the high-end consumer, communications, industrial and computing markets for a significant portion of our net revenues.
We realize substantially all of our net revenues from products sold in the high-end consumer, communications, industrial and computing markets. Therefore, our success currently depends on the continued acceptance of our products within these markets and our ability to continue to develop and introduce new products on a timely basis for these markets. These markets may experience changes in demand that will adversely affect our business and operating results.
We may not be able to satisfy rapidly increasing demand for our products on a timely basis and increased production may lead to overcapacity and lower prices.
Historically, the often cyclical nature of the semiconductor industry has resulted in sustained and short-term periods when demand for our products has increased or decreased rapidly. During these periods of rapid increases in demand, our available capacity
15
Table of Contents
(both our internal capacity and our arranged supply and subcontracted capacities) may not be sufficient to satisfy the available demand. In addition, we may not be able to expand our workforce and operations in a sufficiently timely manner, procure adequate resources, or locate additional, qualified third-party suppliers, to respond effectively to changes in demand for our existing products or to the demand for new products requested by our customers. As a result, our future business could be materially and adversely affected. Conversely, if we expand our operations and workforce too rapidly or procure excessive resources in anticipation of increased demand for our products, and such demand does not materialize as we expect, our operating results may be adversely affected. These capacity expansions by us and other directly competitive analog and mixed-signal IC manufacturers could also lead to overcapacity in our served and target markets which could lead to price erosion that would adversely impact our operating results.
Rapidly decreasing demand for our products could result in higher costs, excess inventory and price erosion.
Factors such as an economic downturn could result in a sudden decrease in demand for our products, adversely affecting our operational results. Overcapacity could result in higher product costs due to contractual obligations, excess inventory, inventory write-downs and price erosion.
Difficulties in estimating the amount and timing of sales to our customers could harm our operating results.
It is difficult for us to forecast accurately the timing and amount of sales to our customers, which include distributors and original equipment manufacturers. Customers generally take a long time to evaluate products and technologies before committing to design our products into their systems. Moreover, our business is characterized by short-term orders and shipment schedules, and customer orders typically may be canceled or rescheduled on short notice to us and without significant penalty to our customers. We do not have substantial non-cancelable backlog and often we are forced to obtain inventory and materials from our manufacturing subcontractors in advance of anticipated customer demand. Because we incur expenses, many of which are fixed, based in part on our forecasts of future revenue, our operating results could be harmed if sales levels are below our expectations.
Most of our distributors and resellers, who represent approximately 48% of net sales, can terminate their contract with us with little or no notice. The termination of a distributor could result in a materially negative impact on our business, including net sales and accounts receivable.
In fiscal year 2009, our distributors and value-added resellers accounted for approximately 48% of our net sales. We generally do not have non-cancelable, long-term contracts with these parties and most can terminate their agreement with us with little or no notice. One distributor accounted for 14% of our net sales in fiscal year 2009. The termination of a significant distributor or reseller could impact our net sales and limit our access to certain end-customers. It could also result in the return of any excess inventory they hold as the distributor. Since many distributors simply resell our products, they generally operate on low profit margins. If a distributor or reseller were to terminate their agreement with us or go out of business, our unsecured accounts receivable from them are subject to collection risk.
RISK FACTORS RELATING TO ENVIRONMENTAL REGULATIONS, GOVERNMENTAL REGULATIONS, INCLUDING TAXES, AND FINANCIAL REPORTING RULES AND REGULATIONS
Environmental liabilities and other governmental regulatory matters could force us to expend significant capital and incur substantial costs.
We are subject to various environmental laws relating to the management, disposal and remediation of hazardous materials and the discharge of pollutants into the environment. We are also subject to laws relating to workplace safety and worker health which, among other things, regulate employee exposure to hazardous substances. Harris Corporation has agreed to indemnify us for substantially all environmental liabilities related to events or activities occurring before our acquisition of their semiconductor business. This indemnification does not expire, nor is it subject to a dollar limitation.
The nature of our ongoing operations exposes us to the risk of liabilities with respect to environmental matters, including those relating to the on- and off-site disposal and release of hazardous materials, and there can be no assurance that material costs will not be incurred in connection with such liabilities.
Based on our experience, we believe that the future cost of compliance with existing environmental and health and safety laws (and liability for known environmental conditions) even without the indemnity from Harris will not have a material adverse effect on our business, financial condition or results of operations. However, we cannot predict:
| • | what environmental or health and safety legislation or regulations will be enacted in the future; |
| • | how existing or future laws or regulations will be enforced, administered or interpreted; |
| • | the amount of future expenditures which may be required to comply with these environmental or health and safety laws or to respond to future cleanup matters or other environmental claims; or |
| • | the extent of our obligations to the purchasers of our environmentally challenged sites. |
16
Table of Contents
Our financial results may be adversely impacted by higher than expected tax rates, exposure to additional income tax liabilities and the adoption of new accounting pronouncements regarding income tax accounting.
As a global company, our effective tax rate is highly dependent upon the geographic composition of worldwide earnings and tax regulations governing each region. We are subject to income taxes in both the United States and various foreign jurisdictions and significant judgment is required to determine worldwide tax liabilities. Our effective tax rate, as well as the actual tax ultimately payable, could be adversely affected by changes in the mix of earnings between countries with differing statutory tax rates, in the valuation of deferred tax assets, in tax laws or by material audit assessments, which could affect our profitability. In particular, the carrying value of deferred tax assets, which are predominantly in the United States, is dependent on our ability to generate future taxable income in the United States. In addition, the amount of income taxes we pay is subject to ongoing audits in various jurisdictions and a material assessment by a governing tax authority could affect our profitability.
In fiscal year 2007, we adopted the provisions of the Financial Accounting Standards Board’s Financial Interpretation No. 48, “Accounting for Uncertainty in Income Taxes” (FIN 48) (ASC 740.10). FIN 48 requires us to record our tax expense differently than we might otherwise have done in the past based on various estimates of probabilities of sustaining certain tax positions. As a result of this and other factors, our tax expense could be more volatile than in the past. Volatility in tax expense contributes to volatility in reported financial results.
Accounting pronouncements are moving toward “fair value” accounting, which also may lead to more volatility in reported earnings, resulting in a decline in our stock price.
In recent years, new accounting pronouncements and guidance have been promulgated by the Financial Accounting Standards Board that require companies to regularly attempt to determine or estimate the fair value of certain assets and liabilities and adjust those amounts to reflect the revised estimates. Recent pronouncements have broadened this trend to direct how to estimate and account for fair value measurements as well as give companies the option to apply fair value measurements more broadly to many financial assets and liabilities. For us, particularly regarding indefinite-lived intangible assets (“goodwill”), certain other “long-lived assets” such as property, plant and equipment, and stock-based compensation, these standards increase the likelihood that we will encounter a situation requiring a significant adverse adjustment to our statement of operations and earnings per share measures. Such an adverse and significant adjustment to our operating results might cause our investors and the analysts who follow our industry to change their opinion of our prospects.
Changes in accounting standards for stock-based compensation may adversely affect our operating results and our competitiveness in the employee marketplace.
The adoption of new guidance regarding stock-based compensation in 2006 required us to expense our calculated stock-based compensation provided to employees beginning in fiscal year 2006. The adoption of the new guidance reduced our reported earnings by the amount of stock-based compensation in all fiscal years since adoption. The market in which we compete for the skilled employees knowledgeable in our required disciplines is a competitive one. We believe that stock-based compensation is an important part of the overall compensation that we offer to attract and retain such employees. There is some risk that the design of our compensation plans is ineffective at balancing our profitability and employee retention objectives.
We are subject to the internal control evaluation and attestation requirements of Section 404 of the Sarbanes-Oxley Act of 2002.
Pursuant to Section 404 of the Sarbanes-Oxley Act of 2002, we are required to include in our annual report our assessment of the effectiveness of our internal control over financial reporting and our audited financial statements as of the end of each fiscal year reported. Furthermore, our independent registered public accounting firm, KPMG LLP, is required to report on whether it believes we maintained, in all material respects, effective internal control over financial reporting as of the end of each fiscal year. We have successfully completed our assessment and obtained KPMG LLP’s attestation as to the effectiveness of our internal control over financial reporting as of January 1, 2010. In future years, if we fail to complete this assessment on a timely basis, or if KPMG LLP cannot independently attest to the effectiveness of our internal control over financial reporting, we could be subject to regulatory sanctions and a loss of investor confidence in our internal controls. In addition, any failure to implement required new or improved controls, or difficulties encountered in their implementation or the operation of existing controls, could cause us to fail to meet our regulatory reporting obligations on a timely basis.
Our independent registered public accounting firm must confirm its independence in order for us to meet our regulatory reporting obligations on a timely basis.
Our independent registered public accounting firm, KPMG LLP, communicates with us at least annually regarding any relationships between KPMG LLP and us that, in their professional judgment, might have a bearing on their independence with respect to us. If, for whatever reason, KPMG LLP finds that it cannot confirm that it is independent of us based on existing securities laws and registered public accounting firm independence standards, we could experience delays or other failures to meet our regulatory reporting obligations.
17
Table of Contents
RISK FACTORS RELATING TO OUR BUSINESS STRATEGIES, PERSONNEL AND OTHER OPERATIONS
If we fail to attract and retain qualified personnel, our business may be harmed.
Our future success depends largely upon the continued service of our key management and technical personnel, and on our continued ability to hire, integrate and retain qualified management and technical personnel, particularly engineers. Competition for these employees in the analog and mixed-signal semiconductor industry is intense and we may not be successful in attracting or retaining these personnel. In addition, it is difficult to obtain work visas for foreign professionals trained in the United States. The loss of any key employee, the failure of any key employee to perform in his or her current position or our inability to attract and retain skilled employees as needed could impair our ability to meet customer and technological demands. The loss of the services of any executive officer or other key technical or management personnel could harm our business. To help retain the continued services of some of our key executives, we have entered into employment agreements with some of them. We do not have key person life insurance on any of our key personnel.
If we choose to acquire or dispose of product lines and technologies, we may encounter unforeseen costs and difficulties that could impair our financial performance.
An important element of our management strategy is to review acquisition prospects that would complement our existing products, augment our market coverage and distribution ability, or enhance our technological capabilities. As a result, we may make acquisitions of companies, products or technologies or we may reduce or dispose of certain product lines or technologies which no longer fit our long-term strategies. Managing an acquired business or disposing of product technologies entails numerous operational and financial risks, including difficulties in assimilating new personnel, coordinating new product and process development, conforming the acquired company’s standards, processes, procedures and controls with our operations, separating or reorganizing existing business or product groups, in addition to diversion of management’s attention away from other business concerns, amortization of acquired definite-lived intangible assets, immediate expensing of certain acquired R&D project values, goodwill impairment charges and potential loss of key employees or customers of acquired or disposed operations, among others. Further, acquisitions may require the potentially dilutive issuances of equity securities, the incurrence of debt, the assumption of contingent liabilities and the obligation to meet future cash flow requirements of acquired companies. There can be no assurance that we will be able to achieve and manage successfully any such integration of potential acquisitions, disposition of product lines or technologies, or reduction in personnel or that our management, personnel, or systems will be adequate to support continued operations. Any such inabilities, inadequacies, debt incurrence, common stock issuance or assumption of liabilities could have a material adverse effect on our business, operating results, financial condition and cash flows.
We may acquire other companies or purchase or license technology from third parties in order to attain growth or remain competitive and to introduce new products to expanded markets.
An element of our business strategy involves expansion through both organic growth and the acquisitions of businesses, assets, products, technologies and design personnel that allow us to complement our existing product offerings, expand our market coverage, increase our engineering workforce or enhance our technological capabilities. To the extent that we seek acquisitions, we may not be able to purchase or license resources on commercially favorable terms or at all. Acquisitions and technology licenses are difficult to identify and complete for a number of reasons, including the cost of potential transactions, competition among prospective buyers and licensees and the need for regulatory approvals. In order to finance a potential transaction, we may need to raise additional funds by issuing or selling our stock or borrowing money. We may not be able to find such financings on acceptable terms.
We rely upon certain critical information systems for the operation of our business.
We maintain and rely upon certain critical information systems for the effective operation of our business. These information systems include telecommunications, the Internet, our corporate intranet, various computer hardware and software applications, network communications, and e-mail. These information systems may be owned by us or by our outsource providers or even third parties such as vendors and contractors and may be maintained by us or by such providers or third parties. These information systems are subject to attacks, failures, and access denials from a number of potential sources including viruses, destructive or inadequate code, power failures, and physical damage to computers, hard drives, communication lines and networking equipment. To the extent that these information systems are under our control, we have implemented security procedures, such as virus protection software and emergency recovery processes, to address the outlined risks; however, security procedures for information systems cannot be guaranteed to be failsafe and our inability to use or access these information systems at critical points in time could unfavorably impact the timely and efficient operation of our business.
| Item 1B. | UNRESOLVED STAFF COMMENTS |
None.
18
Table of Contents
| Item 2. | Properties |
In the United States, we lease approximately 150,000 square feet for our corporate headquarters in Milpitas, California, which also includes facilities for sales and design functions. Additional manufacturing, warehouse and office facilities are housed in approximately 584,000 square feet of owned facilities on approximately 123 acres of land in Palm Bay, Florida. Additionally, we conduct engineering activity and maintain regional sales offices aggregating over 200,000 square feet in various locations throughout the world including the United States, Asia and Europe. Except for our Florida facilities, which we own, all of our offices are leased under generally short-term leases (lease periods vary but all expire by 2015.)
We believe that our current facilities are suitable and adequate for our present purposes, and that the productive capacity in our facilities is being substantially utilized.
In April 2008, we announced a plan to consolidate our two Florida fabrication facilities to reduce cost and increase utilization rates. The project was substantially completed during our second quarter of 2009.
| Item 3. | Legal Proceedings |
(a) We and certain of our former directors as well as the lead underwriter of our February 2000 initial public offering, Credit Suisse First Boston Corporation, were named as defendants in several law suits, the first of which is a class action filed on June 8, 2001 in the United States District Court for the Southern District of New York. The complaints allege violations of Rule 10b-5 based on, among other things, the dissemination of statements containing material misstatements and/or omissions concerning the commissions received by the underwriters of the initial public offering, as well as failure to disclose the existence of purported agreements by the underwriters with some of the purchasers in these offerings to thereafter buy additional shares of Intersil in the open market at pre-determined prices above the offering prices. These lawsuits against us, as well as those alleging similar claims against other issuers in initial public offerings, have been consolidated with a number of other related securities suits. On October 5, 2009, Judge Scheindlin entered an Opinion and Order granting final approval of the settlement, the plan of allocation, and class certification in the consolidated and coordinated IPO class action proceedings, and on December 14, 2009 an Order and Final Judgment was filed in the action against Intersil. There was no impact on our consolidated financial statements related to this settlement because Intersil was not required to fund any of the settlement.
(b) Texas Advanced Optoelectronic Solutions, Inc. (“TAOS”) named Intersil as a defendant in a lawsuit filed on November 25, 2008 in the United States District Court for the Eastern District of Texas. In this action, TAOS alleges patent infringement, breach of contract, trade secret misappropriation, and tortuous interference with a business relationship, seeking damages and injunctive relief. We dispute TAOS’ claims and are defending ourselves vigorously. Discovery is still ongoing, and a claim construction opinion will be forthcoming from the Court.
| Item 4. | Reserved |
PART II
| Item 5. | Market for Registrant’s Common Equity, Related Shareholder Matters and Issuer Purchases of Equity Securities |
(a) Market Information:
Our Class A Common Stock has been traded on the NASDAQ Stock Market since February 2000 under the symbol “ISIL.” We currently have the Global Select Market listing status on the NASDAQ Stock Market. Prior to 2000, there was no public market for our common stock. The following table sets forth, for the periods indicated, the high and low closing prices per share of our Class A Common Stock as reported in NASDAQ Stock Market trading.
| Fiscal Quarter: |
High | Low | ||||
| First quarter of 2008 (from December 29, 2007 to March 28, 2008) |
$ | 27.31 | $ | 21.76 | ||
| Second quarter of 2008 (from March 29, 2008 to July 4, 2008) |
$ | 29.23 | $ | 23.07 | ||
| Third quarter of 2008 (from July 5, 2008 to October 3, 2008) |
$ | 26.35 | $ | 15.12 | ||
| Fourth quarter of 2008 (from October 4, 2008 to January 2, 2009) |
$ | 14.55 | $ | 7.81 | ||
| First quarter of 2009 (from January 3, 2009 to April 3, 2009) |
$ | 13.03 | $ | 8.73 | ||
| Second quarter of 2009 (from April 4, 2009 to July 3, 2009) |
$ | 13.72 | $ | 11.16 | ||
| Third quarter of 2009 (from July 4, 2009 to October 2, 2009) |
$ | 16.73 | $ | 11.73 | ||
| Fourth quarter of 2009 (from October 3, 2009 to January 1, 2010) |
$ | 15.34 | $ | 12.45 | ||
19
Table of Contents
(b) Holders:
On February 19, 2010, the last reported sale price for our Class A Common Stock was $14.85 per share. As of the same date, there were 355 record holders of our Class A Common Stock.
(c) Dividends:
In fiscal year 2009 we declared and paid quarterly dividends totaling $0.48 per share. In fiscal year 2008 we declared and paid quarterly dividends totaling $0.48 per share. The first quarter dividend in 2010 has been declared by our Board of Directors at $0.12 per share, to be paid February 19, 2010, an indicated annual rate of $0.48 per share.
Our dividend policy is impacted by, among other items, our views on potential future capital requirements relating to research and development, creation and expansion of sales distribution channels, investments and acquisitions, share dilution management, our stock repurchase program, legal risks, liquidity and profitability. Determination to declare and pay a dividend will be made by our Board of Directors timely in light of these and other factors the Board of Directors deems relevant.
(d) Equity compensation plan information
The table and notes below summarize the status of our equity compensation plans (shares in thousands):
| Plan Category |
Number of securities to be issued upon exercise of outstanding options and awards |
Weighted-average exercise price of outstanding options |
Number of securities remaining available for future issuance under equity compensation plans | ||||
| Equity compensation plans approved by shareholders: |
|||||||
| Elantec 1995 and 2001 Equity Incentive Plans(1) |
781 | $ | 22.50 | None | |||
| Xicor 1990, 1998 and 2002 Equity Incentive Plans(1) |
462 | $ | 11.24 | None | |||
| Intersil 1999 Equity Compensation Plan(2) |
6,979 | $ | 24.60 | None | |||
| Intersil 2008 Equity Compensation Plan(3) |
6,573 | $ | 12.95 | 10,556 | |||
| Intersil Employee Stock Purchase Plan(4) |
4,584 | N/A | 1,821 | ||||
| Equity compensation plans not approved by shareholders(5) |
|||||||
| Total(6) |
19,379 | $ | 19.18 | 12,377 | |||
| (1) | Each of these plans in these totals has been acquired by a purchase method accounting acquisition made by Intersil. At the time of the respective acquisitions Intersil ceased making grants, and will not make any additional grants, under these plans. Future grants are expected to be made under the 2008 Equity Compensation Plan. |
| (2) | The number of securities for the Intersil 1999 Equity Compensation Plan includes 1,007 shares that are deferred or restricted stock units outstanding. The weighted average exercise price displayed is only for 5,972 stock options. |
| (3) | The number of securities for the Intersil 2008 Equity Compensation Plan includes 1,521 shares that are deferred or restricted stock units outstanding. The weighted average exercise price displayed is only for 5,052 stock options. Grants of deferred or restricted stock units reduce the shares available for future grants by 2.33 shares each or 3,698 shares in 2009. |
| (4) | The Employee Stock Purchase Plan does not employ a “look-back” option feature; therefore there are no options or right to purchase outstanding stock until the final day of the subscription period (which is then settled immediately). |
| (5) | There are no equity compensation plans that have not been approved by shareholders. |
| (6) | The number of securities for the total of the plans includes 2,528 shares that are deferred or restricted stock units outstanding. The weighted average exercise price displayed is only for 12,267 stock options. |
(e) Performance Graph:
The following graph presents a comparison of the cumulative total shareholder return, assuming dividend reinvestment, on our stock with the cumulative total return of the NASDAQ Market Index and the Philadelphia Semiconductor Index for the period of five years commencing December 30, 2004 and ending January 1, 2010. The graph assumes that $100 was invested on December 30, 2004 in each of Intersil common stock, the NASDAQ Market Index, and the Philadelphia Semiconductor Index, and that all dividends were reinvested.
20
Table of Contents
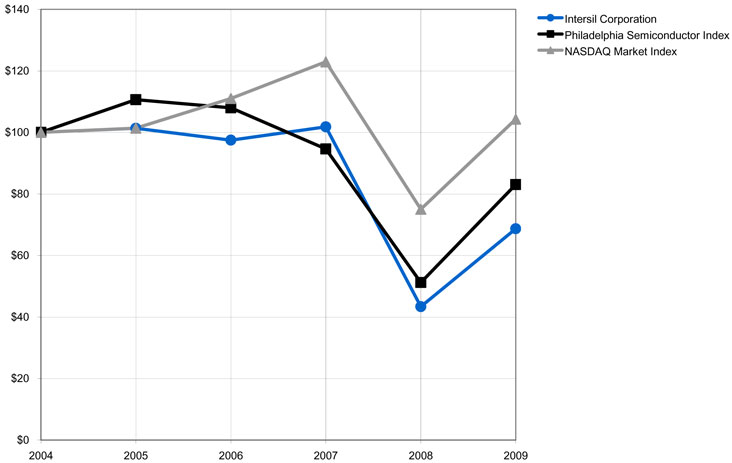
(f) Recent Sales of Unregistered Securities:
We did not sell unregistered securities during fiscal year 2009.
(g) Issuer Purchases of Equity Securities:
In 2005, our Board of Directors authorized the repurchase of up to $150.0 million of our Class A common stock during the twelve months following that announcement (the “2005 Authorization”). Prior to the full use of the 2005 Authorization, in May 2006, our Board of Directors authorized the repurchase of up to $150.0 million of our Class A common stock during the twelve months following the announcement (the “2006 First Authorization”). Upon the full use of the 2006 First Authorization, in December 2006, our Board of Directors authorized the repurchase of up to $400.0 million of our Class A common stock during the twelve months following that announcement (the “2006 Second Authorization”). Prior to the full use of the 2006 Second Authorization, in October 2007, our Board of Directors authorized the repurchase of up to $400.0 million of our Class A common stock during the twelve months following the announcement (the “2007 Authorization”). The 2007 Authorization expired on October 3, 2008. On October 31, 2008, our Board of Directors authorized the repurchase of up to $15.0 million of our Class A common stock before December 22, 2008 . Under these programs, during fiscal year 2008, we repurchased 7,105,915 shares of our Class A common stock at an approximate cost of $154.9 million. No shares were repurchased in fiscal year 2009.
21
Table of Contents
| Item 6. | Selected Financial Data |
The following table sets forth our selected financial data. The historical financial data for each of our fiscal years in the five year period ended January 1, 2010 are derived from our audited consolidated financial statements. All periods presented have been audited. Fiscal year 2008 is a 53 week fiscal year. All other periods presented herein as “fiscal years” include 52 weeks, including fiscal year 2009. This information should be read in conjunction with the consolidated financial statements included elsewhere in this report and “Management’s Discussion and Analysis of Financial Condition and Results of Operations.”
| Fiscal Year 2009 (b)(d) |
Fiscal Year 2008 (b)(c)(d) |
Fiscal Year 2007 |
Fiscal Year 2006 |
Fiscal Year 2005 (a)(b) | ||||||||||||
| ($ in millions, except per share amounts) | ||||||||||||||||
| Revenue |
$ | 611.4 | $ | 769.7 | $ | 757.0 | $ | 740.6 | $ | 600.3 | ||||||
| Income (loss) from continuing operations |
$ | 38.6 | $ | (1,062.5 | ) | $ | 142.7 | $ | 151.3 | $ | 86.8 | |||||
| Basic income (loss) per share from continuing operations |
$ | .32 | $ | (8.59 | ) | $ | 1.08 | $ | 1.08 | $ | 0.61 | |||||
| Diluted income (loss) per share |
$ | .32 | $ | (8.39 | ) | $ | 1.05 | $ | 1.07 | $ | 0.59 | |||||
| Total assets |
$ | 1,165.8 | $ | 1,133.6 | $ | 2,405.0 | $ | 2,559.1 | $ | 2,583.7 | ||||||
| Dividends per common share |
$ | 0.48 | $ | 0.48 | $ | 0.40 | $ | 0.21 | $ | 0.17 | ||||||
The following transactions affect the comparability of the results between the fiscal periods above:
a) During fiscal year 2005, we recorded an impairment credit on long-lived assets.
b) During fiscal years 2005, 2008 and 2009, we recorded various restructuring charges. See Note 11 to the consolidated financial statements for further discussion.
c) During fiscal year 2008, we recorded impairment charges to goodwill. See Note 8 to the consolidated financial statements for further discussion.
d) During fiscal years 2008 and 2009, we recorded impairment charges to investments in auction rate securities. See Note 3 to the consolidated financial statements for further discussion.
| Item 7. | Management’s Discussion and Analysis of Financial Condition and Results of Operations |
You should read the following discussion in conjunction with our consolidated financial statements, including the related notes. This discussion generally refers to elements within our consolidated financial statements on a pre-tax basis unless otherwise stated. Except for historical information, the discussions in this section contain forward-looking statements that involve risks and uncertainties. Actual results could differ materially from those discussed below. For further information regarding risks and uncertainties, see Item 1A. in this Annual Report on Form 10-K entitled “Risk Factors.”
Overview
We focus our design, manufacturing and marketing efforts on the High-Performance Analog (“HPA”) segment of the semiconductor market. Digital and analog semiconductor components are the basic ingredient in today’s electronic devices. In contrast to the binary nature of digital components, analog components monitor, evaluate and modify electrical signals and strengths allowing them to deal with basic and essential properties such as heat, touch, light and sound. The HPA segment is distinguished by its highly differentiated and technologically advanced products which can be building blocks for more complex circuits or highly integrated for specific applications. Historically, the HPA segment has yielded higher gross margins and suffers less competition than the digital and broader analog segments of the semiconductor market. The HPA segment requires uniquely talented and experienced designers, engineers and specialized selling and marketing efforts to address the myriad of challenges associated with today’s complex applications.
We began our transformation into an HPA company with the acquisition of Elantec in 2002 and the divestiture of our wireless networking business in 2003. We further strengthened the transformation with the 2004 acquisition of Xicor. Our transformation has required us to report our financial performance with restructurings, impairments, discontinued operations and write-offs attendant to our acquisitions. Our first full year as a pure HPA company was fiscal year 2004. Since then, our focus has resulted in revenue growth that has been very broad-based across our many analog and mixed-signal products. We have introduced hundreds of new products in each of the last few years including several new product families that have significantly expanded our served available market. Our investments to expand our product portfolio to over 50 product families appear to be successful, enabling us to reach our primary management goals of revenue growth with higher margins, growing operating income and increasing cash flow generation measured against the investment in the company.
22
Table of Contents
Fiscal year 2008 was a 53 week fiscal year. All other periods presented herein as “fiscal years” include 52 weeks, including fiscal year 2009.
Statement of Operations
($ millions and % of revenue*)
| 2009 | 2008 | 2007 | |||||||||||||||||||
| Revenue |
$ | 611.4 | 100.0 | % | $ | 769.7 | 100.0 | % | $ | 757.0 | 100.0 | % | |||||||||
| Costs, expenses and other income |
|||||||||||||||||||||
| Cost of revenue |
276.5 | 45.2 | % | 370.3 | 48.1 | % | 325.4 | 43.0 | % | ||||||||||||
| Gross profit |
334.9 | 54.8 | % | 399.4 | 51.9 | % | 431.6 | 57.0 | % | ||||||||||||
| Research and development |
145.1 | 23.7 | % | 143.6 | 18.7 | % | 134.4 | 17.8 | % | ||||||||||||
| Selling, general and administrative |
121.6 | 19.9 | % | 124.3 | 16.1 | % | 131.9 | 17.4 | % | ||||||||||||
| Impairment of goodwill |
— | — | 1,154.7 | 150.2 | % | — | — | ||||||||||||||
| Amortization of intangibles |
12.7 | 2.1 | % | 12.2 | 1.5 | % | 10.7 | 1.4 | % | ||||||||||||
| In-process research and development |
(0.2 | ) | (0.0 | )% | 3.0 | 0.4 | % | 2.7 | 0.4 | % | |||||||||||
| Restructurings |
2.1 | 0.3 | % | 8.7 | 1.1 | % | — | — | |||||||||||||
| Operating income (loss) |
53.6 | 8.8 | % | (1,047.0 | ) | (136.0 | )% | 151.9 | 20.1 | % | |||||||||||
| Interest income |
4.8 | 0.8 | % | 14.6 | 1.9 | % | 30.9 | 4.1 | % | ||||||||||||
| Gain (loss) on deferred compensation investments |
2.0 | 0.3 | % | (3.6 | ) | (0.5 | )% | 0.9 | 0.1 | % | |||||||||||
| Loss on investments, net |
(14.3 | ) | (2.3 | )% | (31.8 | ) | (4.1 | )% | — | — | |||||||||||
| Income (loss) from continuing operations before income taxes |
46.2 | 7.6 | % | (1067.8 | ) | (138.7 | )% | 183.7 | 24.3 | % | |||||||||||
| Income tax expense (benefit) |
7.6 | 1.2 | % | (5.3 | ) | (0.7 | )% | 41.0 | 5.4 | % | |||||||||||
| Income (loss) from continuing operations |
38.6 | 6.3 | % | (1,062.5 | ) | (138.0 | )% | 142.7 | 18.9 | % | |||||||||||
| Discontinued operations |
|||||||||||||||||||||
| Loss from discontinued operations |
— | — | — | — | (0.3 | ) | — | ||||||||||||||
| Income tax (benefit) expense from discontinued operations |
— | — | (24.9 | ) | (3.2 | )% | 2.0 | 0.3 | % | ||||||||||||
| Net income (loss) from discontinued operations |
— | — | 24.9 | 3.2 | % | (2.3 | ) | 0.3 | % | ||||||||||||
| Net income (loss) |
$ | 38.6 | 6.3 | % | $ | (1,037.6 | ) | (134.8 | )% | $ | 140.5 | 18.6 | % | ||||||||
| * | Totals and percentages may not add or calculate precisely due to rounding. |
Geographical revenue:
| 2009 | 2008 | 2007 | ||||||||||||||||
| ($ millions) |
Revenue | % of Total |
Revenue | % of Total |
Revenue | % of Total |
||||||||||||
| Asia/Pacific |
$ | 463.3 | 76 | % | $ | 555.2 | 72 | % | $ | 538.3 | 71 | % | ||||||
| North America |
102.3 | 17 | % | 146.3 | 19 | % | 140.9 | 19 | % | |||||||||
| Europe and other |
45.8 | 7 | % | 68.2 | 9 | % | 77.8 | 10 | % | |||||||||
| Total |
$ | 611.4 | 100 | % | $ | 769.7 | 100 | % | $ | 757.0 | 100 | % | ||||||
Revenue and Cost of Revenue
Revenue
Our revenue for fiscal year 2009 was $611.4 million, a decrease of $158.3 million or 21% from 2008. The 2009 revenue decline was broad based and driven by revenue declines from all end markets. Deteriorating global economic conditions that began in 2008 continued into 2009 and resulted in reduced demand for our customers’ end products, which caused a severe reduction in orders of our component products. Demand and orders were further reduced as our customers began to work down their inventories, resulting
23
Table of Contents
in fewer replacement orders throughout the supply chain. In fiscal year 2009, first quarter sales continued to decline in all markets except computing, which grew 26% from 2008 fourth quarter levels. In the second quarter, we began experiencing growth in all markets. Sales in the fourth quarter of 2009 were $177.7 million compared to $168.3 million in the third quarter and $131.1 million in the fourth quarter of 2008.
Our revenue for fiscal year 2008 was $769.7 million, an increase of $12.7 million or 2% over 2007. While fiscal year 2008 saw modest revenue growth, revenue during the fourth quarter fell by 40% to $131.1 million from the third quarter as demand for our products weakened significantly throughout our fourth quarter. Deteriorating global economic conditions resulted in reduced demand for our customers’ end products, which caused a severe reduction in orders of our component products. Demand and orders were further reduced during the fourth quarter as our customers began to work down their inventories, resulting in fewer replacement orders throughout the supply chain. The fourth quarter revenue decline was broad based and was driven by revenue declines from all end markets. Sales into the computing and consumer end markets declined 63% and 40%, respectively, from the third quarter of fiscal year 2008 and 54% and 47%, respectively, from the fourth quarter of fiscal year 2007. Sales into the industrial and communications end market were down 13% and 24% from the third quarter of fiscal year 2008 and 24% and 15% from the fourth quarter of fiscal year 2007.
Revenue by end market
| 2009 | 2008 | 2007 | |||||||||||||
| ($ millions) |
Revenue | % Change |
Revenue | % Change |
Revenue | ||||||||||
| Computing |
$ | 201.3 | (15 | )% | $ | 236.4 | 16 | % | $ | 204.6 | |||||
| Communications |
132.9 | (23 | )% | 173.4 | 7 | % | 161.4 | ||||||||
| Industrial |
123.5 | (25 | )% | 165.5 | (6 | )% | 175.7 | ||||||||
| High-end consumer |
153.7 | (21 | )% | 194.4 | (10 | )% | 215.3 | ||||||||
| Total |
$ | 611.4 | (21 | )% | $ | 769.7 | 2 | % | $ | 757.0 | |||||
In aggregate, lower unit demand in fiscal year 2009 decreased revenues by approximately $120 million from fiscal year 2008 levels and a decrease in average selling prices (“ASPs”) decreased revenues from fiscal year 2008 levels by approximately $38 million. Of this net revenue decline, approximately $92 million came from our sales to customers in the Asia/Pacific region and $44 million came from sales to customers in North America with Europe and other countries declining approximately $22 million.
In aggregate, higher unit demand in fiscal year 2008 increased revenues from fiscal year 2007 levels by approximately $8 million and an increase in average selling prices (“ASPs”) increased revenues from fiscal year 2007 levels by approximately $5 million. Of this net revenue growth, approximately $13 million came from our sales to customers in the Asia/Pacific region and $6 million came from sales to customers in North America with Europe and other countries declining approximately $6 million.
We anticipate that our revenue from Asia/Pacific region customers will continue to grow in percentage terms as that region leads in the manufacture of the finished goods (consumer electronics, computers, communications equipment) in which our products are used. End market demand for those products is global, and therefore, dependent on aggregate global economic metrics and conditions such as personal incomes and business activity and not necessarily on Asian and Pacific Rim regional economic factors.
See “Business Outlook” elsewhere in this Management’s Discussion and Analysis of Financial Condition and Results of Operations relating to expected revenues in the near term.
Cost of Revenue
Cost of revenues consists primarily of purchased materials and services, labor, overhead and depreciation associated with manufacturing pertaining to products sold.
Our gross margin increased by 290 basis points in fiscal year 2009 from fiscal year 2008 compared to a decrease of 510 basis points in fiscal year 2008 from fiscal year 2007. Both fluctuations were primarily driven by additional inventory charges taken in 2008 as a result of our fab consolidation efforts and reduced demand assumptions for our products. In fiscal year 2008, net inventory charges were $31.2 million compared to $5.7 million in 2009 and $7.8 million in 2007. Fiscal year 2008 also included a charge of $2.1 million for impairment on assets held for sale. Further fluctuations were largely a function of our sales mix. Generally, our computing and high-end consumer products have lower gross margins than our industrial and communications products.
24
Table of Contents
Operating Expenses
Research and Development (“R&D”)
R&D expenses consist primarily of salaries and expenses of employees engaged in product/process research, design and development activities, as well as related subcontracting activities, prototype development, cost of design tools and technology license agreement expenses.
Our R&D expenses increased by 1% to $145.1 million in fiscal year 2009 compared to $143.6 million for fiscal year 2008. While sales declined in 2009, we grew our R&D spending primarily through additional employees gained in acquisitions in order to invest in future efforts, focusing our spending on products essential for long-term growth. This growth was partially offset by cost saving initiatives implemented in the fourth quarter of 2008 and decreased incentive accruals resulting from lower sales.
Our R&D expenses increased by 7% to $143.6 million in fiscal year 2008 compared to $134.4 million for fiscal year 2007. The approximately $9 million increase in R&D expense was due primarily to additional employees and an additional week of labor incurred during fiscal year 2008 due to the 53 week year. This increase was partially offset by a reduction in incentive accruals, as we did not achieve our performance targets for the second half of fiscal year 2008.
Selling, General and Administrative (“SG&A”)
SG&A expenses consist primarily of salaries and expenses of employees engaged in selling and marketing our products as well as the salaries and expenses required to perform our Human Resources, Finance, Information Systems, Legal, Executive and other administrative functions.
Our SG&A expenses decreased by 2% to $121.6 million for fiscal year 2009 compared to $124.3 million for fiscal year 2008. The decrease in 2009 was primarily driven by reduced sales commissions, partially offset by the lower equity compensation expenses in 2008 as a result of the resignation of our CEO. Our SG&A expenses decreased by 6% to $124.3 million for fiscal year 2008 compared to $131.9 million for fiscal year 2007. The decrease in fiscal year 2008 compared to fiscal year 2007 was primarily driven by reduced compensation expenses and the reversal of accrued equity compensation taken as a result of the resignation of our former CEO. The lower compensation expense was driven by reduced incentive compensation as we did not achieve our performance targets for the second half of 2008.
Impairment of Goodwill
We perform an annual test of goodwill in the fourth quarter of each fiscal year. In 2009, we recorded no impairment of goodwill based on our analysis. In 2008, we recorded an impairment loss of $1,154.7 million against our goodwill in the fourth quarter, calculated as the excess of carrying amount of goodwill over the implied fair value of goodwill in our reporting units.
We perform a goodwill impairment analysis using the two-step method on an annual basis and whenever events or changes in circumstances indicate that the carrying value may not be recoverable. The recoverability of goodwill is measured at the reporting unit level by comparing the reporting unit’s carrying amount, including goodwill, to the fair market value of the reporting unit. During 2008, we had five reporting units for purposes of the analysis – analog and mixed signal, computing, consumer, industrial and communication, and specialty. The first step of the goodwill impairment test (“Step One”) is to identify potential impairment. If the fair value of a reporting unit exceeds its carrying amount, no impairment of the goodwill of the reporting unit is indicated and the second step of the impairment test is unnecessary. However, if the carrying amount of a reporting unit exceeds its fair value, the second step of the goodwill impairment test (“Step Two”) is performed to measure the amount of impairment loss, if any.
We performed our annual testing for impairment of goodwill as of the beginning of our fourth fiscal quarter of 2008. We performed Step One for each of our reporting units and determined that three reporting units indicated potential impairment. We then performed Step Two, which involves calculating the implied fair value of our goodwill by allocating the fair value of the reporting units to all of our assets and liabilities other than goodwill (including both recognized and unrecognized intangible assets) and comparing the residual amount to the carrying value of goodwill.
For the purposes of this analysis, our estimates of fair value were based on an equal weighting of the income approach, which estimates the fair value of our reporting units based on the future discounted cash flows, and the market approach, which estimates the fair value of our reporting units based on comparable market prices. The use of projected discounted future results (discounted cash flow approach) is based on assumptions that are consistent with our estimates of future growth and the strategic plan used to manage the underlying business, and also includes a probability-weighted expectation as to our future cash flows. Factors requiring significant judgment include assumptions related to future growth rates, discount factors, market multiples and tax rates, among other considerations. Changes in economic and operating conditions that occur after the annual impairment analysis or an interim impairment analysis, and that impact these assumptions, may result in a future goodwill impairment charge.
25
Table of Contents
Based on the comparison of the residual amount of goodwill, determined after the allocation of fair value to the reporting unit assets and liabilities, to the carrying value of our goodwill as of October 4, 2008, we recorded an initial goodwill impairment charge of $862.5 million in the fourth quarter of 2008.
Further, during the fourth quarter of 2008, we concluded that sufficient indicators existed to require us to perform another goodwill impairment analysis as of November 28, 2008. We made this determination based upon a combination of factors, including the significant and sustained decline in our market capitalization below our book value, the deteriorating macro-economic environment which resulted in a significant decline in customer demand during the fourth quarter of 2008 and illiquidity in the overall credit markets. Step One of the analysis as of November 28, 2008 also indicated potential impairment for three of our reporting units and we further performed the Step Two allocation of the fair value of the reporting units to the reporting units assets and liabilities (including both recognized and unrecognized intangible assets.)
Based on the comparison of the residual amount of goodwill, determined after the allocation of fair value to the reporting unit assets and liabilities, to the carrying value of our goodwill, we recorded an additional impairment charge of $292.2 million.
Goodwill as of January 1, 2010 was $314.7 million. If we experience further significant declines in our stock price, market capitalization or future expected cash flows, further significant adverse changes in the business climate or continuing slower growth rates, we may need to perform additional impairment analysis of our goodwill in future periods prior to our annual test in the fourth quarter. We can provide no assurance that the significant assumptions used in our analysis will not change substantially and any additional analysis could result in additional impairment charges.
Amortization of Purchased Intangibles
Amortization of purchased intangibles for 2009 was $12.7 million; in 2008 and 2007, the amortization amounts were approximately $12.2 million and $10.7 million. The increases in 2009 and 2008 resulted from additional amortization recorded for various acquisitions since the third quarter of 2007. Our purchased intangibles, which are definite-lived assets, are amortized over their useful lives ranging from three to 11 years.
In-Process Research and Development (“IPR&D”)
In fiscal year 2009, we recorded a credit of $0.2 million as a reduction of previously recorded IPR&D related to the Zilker Labs, Inc. (“Zilker”) and D2Audio Inc. (“D2Audio”) acquisitions, based on finalization of our purchase accounting. In fiscal year 2008, we recorded a charge to earnings for $3.0 million of purchased in-process research and development related to the acquisition of Zilker and D2Audio. In fiscal year 2007, we recorded a charge to earnings for $2.7 million of purchased in-process research and development related to the acquisition of Planet ATE. The acquisitions are described more fully in Note 7 to the accompanying consolidated financial statements. The amount of the purchase price allocated to IPR&D was the result of the purchase accounting appraisal, for which management is responsible. The IPR&D was determined using an income-based or cost-based approach to valuation, based on limitations in the market value and income-based valuation approaches. The cost-based approach related to approximately two years of historical Planet ATE research and development expenditures, net of associated tax effects, which relates to the lengthy and risky development life-cycle of the typical acquired “system” IC product for the automated test equipment market. We expect to continue to invest in these and other development efforts for this new market and believe there is a reasonable chance of successfully completing the work undertaken at the point of the acquisition. However, there is risk associated with the completion of the projects, and there is no assurance that any will meet either technological or commercial success.
Restructurings
In April 2008, we announced a plan to consolidate our internal foundries and reduce the related workforce. In November 2008, in response to the deteriorating global economic environment, we announced further restructuring efforts, that when combined with the foundry consolidation, would reduce our world-wide workforce by approximately 9% and result in an estimated combined annual cost savings between $12 million and $14 million. We continue to implement various restructuring projects but anticipate minimal remaining expenses in connection with our current projects.
We recorded charges of $2.1 million in 2009 and $8.7 in 2008 for employee severance, facility consolidation, and other costs, as a result of these actions. Other accrued liabilities as of January 1, 2010 on the accompanying consolidated balance sheets include approximately $0.2 million related to the restructuring.
Other Income and Expenses
Gain (loss) on Deferred Compensation Investments
We have a liability for a non-qualified deferred compensation plan. We maintain a portfolio of approximately $11.1 million of mutual fund investments and corporate owned life insurance under the plan. Changes in the fair value of the asset are recorded as a
26
Table of Contents
gain (loss) on deferred compensation investments and changes in the fair value of the liability are recorded as a component of compensation expense. In general, the compensation expense (benefit) is substantially offset by the gains and losses on the investment. During fiscal year 2009, we recorded a gain on deferred compensation investments of $2.0 million and an increase in compensation expense of $2.1 million. During fiscal year 2008, we recorded a loss on investments of $3.6 million and a reduction of compensation expense of $3.6 million.
Loss on Investments, net
During fiscal years 2009 and 2008, we recorded impairment charges of $14.3 million and $31.8 million, respectively, before taxes, on certain auction rate securities whose decline in fair value was determined to be other-than-temporary. The initial $6.4 million impairment was recorded in our first quarter of 2008 after significant declines in fair value for two consecutive quarters. In our fourth quarter of 2008, we further recorded impairment charges of $25.4 million after global economic conditions deteriorated rapidly and additional securities experienced substantial declines in fair value over two consecutive quarters. In 2009, we recorded an additional $14.3 million due to credit rating downgrades in certain of our securities. We continue to monitor our auction rate securities and intend to hold all of these investments until the anticipated recovery in market value occurs.
Interest Income
Our interest income decreased 67% to $4.8 million in 2009 compared to $14.7 million for 2008. Interest income decreased in 2009 and 2008 due to decreased average cash balances and continued low interest rates.
Income Tax Expense (Benefit)
Our income tax expense from continuing operations was $7.6 million or 16.5% of pretax income for 2009 compared to a tax benefit of $5.3 million or 0.5% of pretax income for 2008. Income tax expense for fiscal year 2009 included a $5.2 million benefit related to a reversal of the valuation allowance associated with previously recorded impairments on auction rate securities partially offset by a $3.4 million charge related to the move of our international headquarters. In fiscal year 2008, income tax benefit from continuing operations included a $25.3 million reversal of a previously established unrecognized tax benefit (“UTB”) due to the expiration of the statute of limitations on the tax years 2002 through 2004. Excluding these unusual items, the effective tax rates on income from continuing operations were further reduced by a greater portion of income in lower tax jurisdictions.
Our income tax benefit from continuing operations was $5.3 million or $0.5% of pretax income in 2008 compared to tax expense of $41.0 million or 22% of pretax income for 2007. In fiscal year 2008, income tax benefit from continuing operations included a $25.3 million reversal of a previously established UTB due to the expiration of the statute of limitations on the tax years 2002 through 2004. Excluding these items and the effect on income from the impairment charges for goodwill and auction rate securities, the effective tax rate on income from continuing operations for fiscal year 2008 was slightly lower than fiscal year 2007. The decrease in rate was primarily due to additional income in lower tax jurisdictions.
The statute of limitations for the 2002 and 2003 tax years each expired during the first quarter of our fiscal year 2008. Expiration for tax year 2002 was extended to December 31, 2007 by agreement with the Internal Revenue Service (“IRS”) and tax year 2003 was extended to December 31, 2007 by the IRS for relief from multiple hurricanes that affected our Florida operations in 2004. The statute of limitations for the 2004 tax year expired during the third quarter of our 2008 fiscal year.
In determining net income, we estimate and exercise judgment in the calculation of tax expense and tax liabilities and in assessing the recoverability of deferred tax assets that arise from temporary differences between the tax and financial statement recognition of assets and liabilities.
In the ordinary course of business, the ultimate tax outcome of many transactions and calculations is uncertain, as the calculation of tax liabilities involves the application of complex tax laws in the United States and other jurisdictions. We recognize liabilities for additional taxes that may be due on tax audit issues based on an estimate of the ultimate resolution of those issues. Although we believe the estimates are reasonable, the final outcome may be different than amounts we estimate. Such determinations could have a material impact on the income tax provision, effective tax rate and operating results in the period they occur. In addition, the effective tax rate reflected in our forward-looking statements is based on current enacted tax law. Significant changes in enacted tax law could materially impact our estimates.
Discontinued Operations and Related Taxes on Discontinued Operations
In fiscal year 2008, we recorded a tax benefit of $24.9 million for a reversal of a previously established UTB due to the expiration of the statute of limitations on the tax years 2002, 2003 and 2004. In fiscal 2007, we recorded an additional tax claim by a foreign jurisdiction. We incurred research and defense costs of $0.3 million and ultimately settled the claim for $5.5 million, net of a $3.5 million tax reserve. Therefore discontinued operations were a net loss of $2.3 million for 2007. We recognized no income or loss for discontinued operations in fiscal year 2009.
27
Table of Contents
Backlog
Our sales are made pursuant to purchase orders that are generally booked up to six months in advance of delivery. Our standard terms and conditions of sale provide that these orders may not be cancelled or rescheduled thirty days prior to the most current customer request date (“CRD”) for standard products and ninety days prior to CRD for semi-custom and custom products. Backlog is influenced by several factors, including market demand, pricing and customer order patterns in reaction to product lead times. Additionally, we believe backlog can fall faster than consumption rates in periods of weak end-market demand since production lead times can be shorter. Conversely, we believe backlog can grow faster than consumption in periods of strong end-market demand as production and delivery times increase and some customers may increase orders in excess of their current consumption to reduce their own risk of production disruptions.
Our six-month backlog as of January 1, 2010 was $157.4 million; as of January 2, 2009, it was $86.9 million; and as of December 28, 2007, it was $176.4 million. Although not always the case, we believe backlog can be an indicator of performance in the near future.
Business Outlook
As we announced via our Fourth Quarter 2009 Earnings press release (filed with our Current Report on Form 8-K on January 27, 2010), we anticipated revenues for the first quarter to be in the range of $180 to $187 million. Based on this outlook, we expected first quarter 2010 earnings per diluted share between $0.18 and $0.20.
Impact of Inflation and Changing Prices
The semiconductor industry has, for several decades, experienced a phenomenon of continual decline in sales prices per unit. This phenomenon brings unique challenges to managing our business. In order to increase revenues, we must increase units of product made and shipped at a much higher rate than that of the attendant revenue gain. This leads to capacity and production management issues and requires a large investment in research and development to regularly introduce new products that enable us to maintain our average unit selling prices. At the same time we are faced with many fixed costs in our business that increase at the same rate of general inflation in the economy and must be managed carefully and aggressively in order to maintain operating margins. These characteristics of revenue pressure from selling price, the need to invest heavily in research and development and inflation-prone fixed costs means that earning a reasonable return for our shareholders is challenging.
Contractual Obligations and Off-Balance Sheet Arrangements
Contractual Obligations
The following table sets forth our future contractual obligations as of January 1, 2010 ($ in millions):
| Payment due by period | |||||||||||||||
| Contractual Obligations |
Total | Less than 1 year |
1-3 years |
3-5 years |
More than 5 years | ||||||||||
| Future minimum operating lease commitments |
$ | 25.1 | $ | 9.4 | $ | 12.3 | $ | 3.3 | $ | 0.1 | |||||
| Open capital asset purchase commitments |
1.3 | 1.3 | — | — | — | ||||||||||
| Open raw material purchase commitments |
112.8 | 43.2 | 41.8 | 27.8 | — | ||||||||||
| Other purchase commitments |
6.3 | 2.4 | 2.9 | 1.0 | — | ||||||||||
| Standby letters of credit |
2.4 | 2.4 | — | — | — | ||||||||||
| Total |
$ | 147.9 | $ | 58.7 | $ | 57.0 | $ | 32.1 | $ | 0.1 | |||||
Our future minimum lease commitments consist primarily of leases for buildings and other real property. Open capital asset purchase commitments primarily include test, assembly and production equipment. Open raw material purchase commitments include purchase orders for $18.5 million for externally produced wafers and the remaining primarily represents minimum purchase requirements as part of a guaranteed capacity agreement with one of our wafer suppliers. We utilize standby letters of credit primarily to provide security for various contracts or services such as workers compensation ($0.9 million), environmental items ($1.3 million) and to provide security for certain vendor relationships. These standby letters of credit have annual renewals.
Off-Balance Sheet Arrangements
The Kenet, Zilker and Quellan purchase agreements contain provisions for payment of additional consideration to former shareholders if revenue in excess of a base amount is attained. The maximum payout under these provisions is $28.0 million, based on
28
Table of Contents
revenue earned through March 2011. Under the provisions of ASC 805, Business Combinations (SFAS 141R), which was effective for business acquisitions occurring after December 15, 2008, we have recorded an accrual of $3.0 million for contingent consideration related to the Quellan acquisition, which occurred in August 2009.
On January 8, 2010, we acquired the business of Rock Semiconductor (“Rock”) for $4.5 million cash. The purchase includes primarily intellectual property. Rock is a privately-held, fabless semiconductor company with technology leadership in highly integrated power management ICs. See Note 23 for further discussion.
We do not have any other off-balance sheet arrangements that have or are reasonably likely to have current or future material effect on our financial condition, revenues or expenses, results of operations, liquidity, capital expenditures or capital resources.
Liquidity and Capital Resources
Our capital requirements depend on a variety of factors, including but not limited to, the rate of increase or decrease in our existing business base; the success, timing and amount of investment required to bring new products to market; revenue growth or decline; and potential acquisitions. We believe that we have the financial resources necessary to meet business requirements for the next 12 months, including our dividend program, the requisite capital expenditures for the maintenance of worldwide manufacturing capacity, working capital requirements and potential future acquisitions or strategic investments. As of January 1, 2010, our total shareholders’ equity was $1,031.1 million and we had $361.2 million in cash and short-term securities (see Note 3). We have no debt outstanding.
We have $63.9 million in long-term investments, primarily auction rate securities. These securities are composed of approximately $34.6 million of insurance related securities, $8.9 million of corporate credit securities, $1.7 million of preferred stock and $18.7 million of securities collaterized by student loans. We continue to accrue and receive interest on the securities based on a contractual rate. The weighted rate is currently approximately 181 basis points above one month LIBOR.
On October 17, 2008, we established a $75.0 million revolving credit facility with Bank of America, N.A. as administrative agent and certain other banks. This credit line increases our available liquidity and enhances our ability to invest in our business. To date, we have not drawn on the line. We are currently in compliance with all covenants under the agreement.
Our primary sources and uses of cash during the three fiscal years ended January 1, 2010 are presented in this summarized table:
| Fiscal Years Ended | ||||||||||||
| Jan 1, 2010 | Jan 2, 2009 | Dec 28, 2007 | ||||||||||
| (millions) | ||||||||||||
| Sources of Cash |
||||||||||||
| Existing business performance and activities |
||||||||||||
| Operating activities, including working capital changes |
$ | 129 | $ | 204 | $ | 232 | ||||||
| Exercise of stock options and purchases under the employee stock purchase plan |
6 | 23 | 124 | |||||||||
| $ | 135 | $ | 227 | $ | 356 | |||||||
| Uses of Cash |
||||||||||||
| Business improvement investments |
||||||||||||
| Business acquisitions, net |
$ | (18 | ) | $ | (48 | ) | $ | (48 | ) | |||
| Capital expenditures, net of sale proceeds |
(11 | ) | (32 | ) | (18 | ) | ||||||
| $ | (29 | ) | $ | (80 | ) | $ | (66 | ) | ||||
| Returned to shareholders |
||||||||||||
| Stock repurchases |
— | $ | (155 | ) | $ | (435 | ) | |||||
| Dividends paid |
(59 | ) | (60 | ) | (53 | ) | ||||||
| $ | (59 | ) | $ | (215 | ) | $ | (488 | ) | ||||
| Cash/Investment Management Activities |
||||||||||||
| Decrease (increase) in investments and foreign exchange effects |
$ | 85 | $ | (40 | ) | $ | 364 | |||||
| Net increase (decrease) in cash and cash equivalents |
$ | 132 | $ | (108 | ) | $ | 164 | |||||
In the year ended January 1, 2010, our operational cash was $129 million compared to $204 million in the year ended January 2, 2009, a decrease of $75 million, due primarily to the decline in sales. We used approximately $11 million for capital expenditures and $18 million for acquisitions. We returned $59 million to shareholders in the form of dividends. Investment balances were decreased by $85 million compared to an increase of $40 million in the year ended January 2, 2009, resulting in net cash provided of $132 million overall. Investment balances decreased as certain short-term investments matured.
29
Table of Contents
Our aim is to continually improve the cash flows from our existing business activities and return a substantial portion of that cash flow to shareholders. We continue to maintain and improve our existing business performance with necessary capital expenditures and acquisitions that may further improve our business and return on investment. Cash, stock or a combination of both may be issued to fund additional acquisitions to improve our business.
Our cash, cash equivalents and investments, when combined with no outstanding long or short-term debt obligations, give us the flexibility to return free cash flow to our shareholders while also pursuing business improvement opportunities for our future.
Non-cash Working Capital
Trade accounts receivable, less valuation allowances, increased by $7.0 million, or 11%, to $73.6 million as of January 1, 2010 from $66.6 million as of January 2, 2009. This increase primarily reflects a return to more normal levels from the effects of decreased sales beginning in the fourth quarter of 2008. Sales decreased starting in 2008 as problems in the economy resulted in our customers utilizing inventory reserves and reducing orders.
Our net inventories decreased by $28.4 million, or 26%, to $81.2 million as of January 1, 2010 from $109.6 million as of January 2, 2009. Our days of inventory as of January 2, 2009 significantly exceeded our historical levels due to the extreme decline in revenue we experienced in our fourth quarter of 2008. We have reduced inventory days closer to historical levels over the past four quarters.
Capital Expenditures
Capital expenditures, net of sales proceeds, were $11.0 million for fiscal year 2009, $31.7 million for fiscal year 2008, and $18.2 million for fiscal year 2007. Capital expenditures have been focused primarily on the expansion of available capacity for both our wafer and assembly/test partners to support continuing unit volume growth. Currently, we expect 2010 capital expenditures to be marginally higher than 2009 as we resume investing in additional manufacturing capacity to support increasing sales levels.
Proceeds from exercises of Stock Options and our Stock Purchase Plan
Cash flow from stock plans (exercises of stock options and sales under our Employee Stock Purchase Plan, or “ESPP”) was $5.8 million in 2009, a significant decrease from the $23.1 million received in 2008 and $123.5 million received in fiscal year 2007. We have changed the mix of new share-based equity incentive grants to a larger proportion of restricted and deferred stock units than stock options. Restricted and deferred stock units do not yield cash proceeds from an exercise event as do stock options. Additionally, exercises are decisions of grantees and are influenced by the level of our stock price and by other considerations of grantees. The recent decline in stock price has resulted in many of our options being “underwater” with exercise prices in excess of the current stock price. While the level of cash inflow from exercises is difficult to forecast or control, we believe it will remain a secondary source of cash.
Stock Repurchases and Dividends
Historically, we have returned cash to shareholders through our stock repurchase and dividend programs. Our previous stock repurchase program expired on December 22, 2008.
In October 2009, our Board of Directors declared a quarterly dividend of $0.12 per share of common stock. The dividend was paid on November 20, 2009 to shareholders of record as of the close of business on November 10, 2009. In January 2010, our Board of Directors also declared a dividend of $0.12 per share, paid on February 19, 2010 to shareholders of record as of the close of business on February 9, 2010.
Transactions with Related and Certain Other Parties
None
Critical Accounting Policies and Estimates
We consider the following seven accounting estimation processes to be critical to the preparation of our financial statements:
| 1) | the allowance for collection losses on trade receivables; |
| 2) | distributor, OEM and warranty allowances; |
| 3) | allowances for excess or obsolete inventory; |
| 4) | the assessment of recoverability of goodwill; |
30
Table of Contents
| 5) | accounting for income taxes; |
| 6) | fair value of stock-based compensation; and |
| 7) | fair value of investments. |
These estimates involve estimates or judgments that are difficult or subjective and require certain assumptions that, if incorrect, could create changes, including adverse ones, to our statement of operations and financial position.
Allowance for collection losses on trade receivables, or “Receivables Allowance”
| January 1, 2010 ($ in millions) |
January 2, 2009 ($ in millions) |
|||||||
| Gross trade receivables |
$ | 82.1 | $ | 75.1 | ||||
| Receivables allowance |
(2.3 | ) | (1.6 | ) | ||||
| Other allowances |
(6.2 | ) | (6.9 | ) | ||||
| Net trade receivables |
$ | 73.6 | $ | 66.6 | ||||
Our receivables allowance is used to state trade receivables at a net realizable value or the amount that we estimate will be collected on our gross receivables. Since the amount that we will actually collect on the receivables outstanding cannot be known until the future, we rely primarily on prior experience. Our historical collection losses have been typically infrequent with write-offs of trade receivables being well below 1% of sales. In order to allow for future collection losses that arise from customer accounts that do not currently indicate the inability to pay but could have such an inability in the future, we maintain an allowance based on a 48-month rolling average of write-offs, which as of January 1, 2010 equaled 0.1% of our gross trade receivables balance. We also maintain specific allowances for customer accounts that we know may not be collectible for various reasons, such as bankruptcy and other customer liquidity issues. We analyze our trade receivable portfolio based on the age of each customer’s invoice. In this way, we can identify the accounts that are more likely to have collection problems. We then provide an allowance for a portion or all of the customer’s balance based on our evaluation of the ultimate collectability of the account. In the fourth quarter of 2008 and first quarter of 2009, we recorded additional specific allowances totaling $2.0 million for one customer that was more than 90 days past due.
Distributor, OEM and warranty allowances, or “Other Allowances”
Allowances for various customer credits are shown in the table above as “Other allowances.” This is a combination of distributor, original equipment manufacturer (“OEM”) and warranty allowances. Distributor allowances were $2.1 million as of January 1, 2010 and January 2, 2009. Revenue is recognized from sales to our customers, excluding North American distributors, when a product is shipped. Sales to international distributors are made under agreements which provide the distributors certain price protection on a percentage of unsold inventories they hold. Accordingly, distributor allowances are estimates of the amount of price adjustments that will be encountered in the future on inventory held by international distributors as of the balance sheet date. We rely primarily on historical international distributor transactions to estimate these adjustments. The international distributor allowances are comprised of two components that are reasonably estimable. The first component is the price protection allowance, which protects the distributors’ gross margins in the event of falling prices (which are common in semiconductors and other electronic components). This allowance is based on the relationship of historical credits issued to distributors in relation to historical inventory levels and the price paid by the distributor as applied to current inventory levels. The second component is a stock rotation allowance, which is based on the percentage of sales made to limited international distributors whereby the distributors can periodically receive a credit for unsold inventory they hold. Specific allowances for our OEM customers, of which various types of returns are the largest component, totaled $3.5 million as of January 1, 2010; warranty allowances, returns for which there are product performance claims, totaled $0.6 million as of January 1, 2010.
Allowances for excess or obsolete inventory, or “Inventory Allowances”
We record our inventories at the lower of cost or market as described in the notes to the financial statements. As the ultimate market value that we will realize through sales on our inventory cannot be known with exact certainty, we rely on past sales experience and future sales forecasts to project it. In analyzing our inventory levels, we classify certain inventory as either excess or obsolete. These classifications are maintained for all classes of inventory, although raw materials are seldom deemed excess or obsolete. We classify inventory as obsolete if we have withdrawn it from the marketplace or if we have had no sales of the product for the past 18 months and no sales forecasted for the next 24 months. We provide an allowance for 100% of the standard cost of obsolete inventory. It is our policy to scrap obsolete inventory. We conduct reviews of excess inventory on a quarterly basis and reserve a significant portion of the standard cost of excess inventory. We classify inventory as excess if we have quantities of product greater than the amounts we have sold in the past 18 months or have forecasted to sell in the next 24 months. We typically retain excess inventory until the inventory is sold or reclassified as obsolete.
31
Table of Contents
For all items identified as excess or obsolete, management reviews the individual facts and circumstances, i.e.: competitive landscape, industry economic conditions, product lifecycles and product cannibalization, specific to that inventory. Inventory allowances totaled approximately $42.4 million on gross inventory of $123.6 million as of January 1, 2010 and $38.3 million on gross inventory of $147.9 million as of January 2, 2009.
Product demand estimates are a key element in determining inventory allowances. Our estimate of product demand requires significant judgment and is based in part on historical revenue. Historical sales may not accurately predict future demand. If future demand is ultimately lower than our estimate, we could incur significant additional expenses to provide allowances for and scrap obsolete inventory.
Assessment of recoverability of goodwill
We perform an annual assessment of goodwill in the fourth quarter of our fiscal year. In 2009, we recorded no impairment of goodwill based on our analysis. In 2008, the annual review indicated a substantial decrease in the fair value of our goodwill based on declining stock prices and lower revenue expectations. We recorded an impairment charge of approximately $1,154.7 million against goodwill in the fourth quarter of 2008. We will continue to perform a similar review in the fourth quarter of each year or more frequently if indications of potential impairment exist. See Note 8 for further discussion.
Goodwill is tested under a two-step method for impairment at a level of reporting referred to as a reporting unit. As of and for the year ended January 1, 2010, we had two reporting units for purposes of this analysis. Step one is to identify potential impairment. We compare the calculated fair value of each reporting unit with its carrying amount, including goodwill. If the fair value of a reporting unit exceeds its carrying amount, no impairment of the goodwill of the reporting unit is indicated and step two is unnecessary. If the carrying amount of a reporting unit exceeds its fair value, the second step of the goodwill impairment test will be performed to measure the amount of impairment loss, if any. The amount of impairment loss is the excess of carrying amount of goodwill over the implied fair value of the reporting unit goodwill. After a goodwill impairment loss is recognized, the adjusted carrying amount of goodwill will be the new accounting basis.
Significant judgment is involved in the determination of fair value for the above analysis. Our estimates of fair value are based on a combination of the income approach, which estimates the fair value of our reporting units based on the future discounted cash flows, and the market approach, which estimates the fair value of our reporting units based on comparable market prices. The use of future discounted cash flows is based on assumptions that are consistent with our estimates of future growth and the strategic plan used to manage the underlying business. Factors requiring significant judgment include assumptions related to future growth rates, discount factors, market multiples and tax rates, amongst other considerations. Changes in economic and operating conditions that occur after the annual impairment analysis or an interim impairment analysis, and that impact these assumptions, may result in a future goodwill impairment charge.
Accounting for income taxes
As part of the process of preparing our consolidated financial statements, we are required to estimate our income taxes in each of the jurisdictions in which we operate. We are subject to income taxes in both the United States and various foreign jurisdictions. Significant judgment is required to determine worldwide income tax liabilities. This process involves estimating our actual current tax liability together with assessing temporary differences resulting from differing treatment of items for tax and accounting purposes. Our effective tax rate and the actual taxes ultimately payable could be adversely affected by changes in the mix of earnings between countries with differing statutory tax rates, in the valuation of deferred tax assets, in tax laws or by material audit assessments, which could affect our profitability.
Temporary differences result in deferred tax assets and liabilities, which are included within our consolidated balance sheet. We then assess the likelihood that our deferred tax assets will be recovered from future taxable income and, to the extent we believe that recovery is not likely, establish a valuation allowance. As of January 1, 2010, our net deferred tax asset amounted to $118.4 million compared to $82.5 million as of January 2, 2009. This increase is primarily due to net operating loss carryforwards (“NOLs”) arising out of recent acquisitions and R&D tax credits.
Fair value of stock-based compensation
We calculate the fair value of a stock based compensation grant (compensation cost) on the date of grant using a lattice method. The compensation cost is then amortized straight-line over the shorter of vesting life or requisite service period. Calculating fair value requires us to estimate certain key assumptions in the valuation model, including expected stock price volatility, the risk-free interest rate in the market, the expected life of the stock option granted and annualized dividend yield. Volatility is one of the most significant determinants of fair value. We estimate our volatility using a blend of estimated price movement activity implied by our traded options and the actual historic volatility of our stock price. We estimate our expected risk-free interest rate by using the zero-coupon U.S. Treasury rate at the time of the grant related to the expected life of the grant. Expected forfeitures must be estimated to offset the compensation cost expected to be
32
Table of Contents
recorded in the financial statements. We estimate forfeitures for the first year of vesting, based on historical information about turnover for each appropriate employee level. Thereafter, as vesting tiers within an option are more frequent until fully vested, forfeitures are no longer estimated but rather recorded as they actually occur. We estimate the annualized dividend yield by dividing the current annualized dividend by the closing stock price on the date of grant.
Calculating fair value for our options and deferred stock units that have a performance measurement element to them also requires us to estimate the likely actual performance before the performance is complete. We do this by adjusting the forfeiture rate to include the expectation of actual performance at the time the calculation is made for purposes of amortizing the compensation appropriately. Such performance-based instruments, depending upon the term of required performance, may need to be remeasured as frequently as quarterly. See Note 9 to our consolidated financial statements for more information with regard to our performance-based grants.
We base these estimates of key assumptions on historical information using judgment regarding future expectations. We re-examined our assumptions on a regular basis. When such examinations of the key assumptions lead to significant changes to the calculation inputs, it can have a material effect on the amount of stock-based compensation that will be recognized in aggregate or in any period. This may mean more volatility in our reported earnings due to changes in facts and circumstances surrounding our use of stock compensation.
Fair Value of Investments
Available-for-sale and traded securities are recorded at fair value on the balance sheet. For actively traded securities, we generally rely upon the valuations as provided by the custodian of these assets. For available-for-sale securities, such as illiquid auction rate securities and preferred stock, we use the present value of expected future cash flows to determine fair value. Significant judgments are required in the estimation of fair value, including assumptions about the expected holding period, yield, and appropriate discount rates. We then evaluate each security to determine whether any impairment is temporary or other-than-temporary. Temporary impairments are recorded as a component of other comprehensive income (loss), while other-than-temporary impairments are recorded as a component of non-operating income.
Recent Accounting Pronouncements
FASB ASC 805-10, “Business Combinations” (formerly SFAS 141R, “Business Combinations”)—Issued in December 2007, ASC 805-10 provides companies with principles and requirements on how an acquirer recognizes and measures in its financial statements the identifiable assets acquired, liabilities assumed and any non-controlling interest in the acquiree as well as the recognition and measurement of goodwill acquired in a business combination. ASC 805-10 also requires certain disclosures to enable users of the financial statements to evaluate the nature and financial effects of the business combination. Acquisition costs associated with the business combination will generally be expensed as incurred. ASC 805-10 is effective for business combinations occurring in fiscal years beginning after December 15, 2008, which required us to adopt these provisions for business combinations occurring in fiscal year 2009 and thereafter. We applied these new standards in recording the acquisition of Quellan Inc., which occurred in August 2009. See Note 7 to the accompanying consolidated financial statements.
FASB ASC 350-30-65, “Determination of the Useful Life of Intangible Assets” (formerly FSP FAS 142-3, “Determination of the Useful Life of Intangible Assets”)—In April 2008, the FASB issued ASC 350-30-65, “Determination of the Useful Life of Intangible Assets.” ASC 350-30-65 amends the factors that should be considered in developing renewal or extension assumptions used to determine the useful life of a recognized intangible asset under FASB ASC 350-10, Goodwill and Other Intangible Assets. ASC 350-30-65 is effective for financial statements issued for fiscal years beginning after December 15, 2008 and interim periods within those fiscal years. There was no material impact from this statement.
FASB ASC 815-10, “Derivatives and Hedging” (formerly SFAS 161, “Disclosures about Derivative Instruments and Hedging Activities”)—In March 2008, the FASB issued ASC 815-10, “Derivatives and Hedging”. This statement is intended to improve transparency in financial reporting by requiring enhanced disclosures of an entity’s derivative instruments and hedging activities and their effects on the entity’s financial position, financial performance and cash flows. ASC 815-10 applies to derivative instruments as well as related hedged items, bifurcated derivatives and nonderivative instruments that are designated and qualify as hedging instruments. Entities with instruments subject to ASC 815-10 must provide more robust qualitative disclosures and expanded quantitative disclosures. ASC 815-10 was effective prospectively for financial statements issued for fiscal years and interim periods beginning after November 15, 2008, with early application permitted. There was no material impact from this statement.
FASB ASC 820-10-65-2, “Determining Whether a Market Is Not Active and a Transaction is Not Distressed” (formerly FSP FAS 157-4, “Determining Whether a Market Is Not Active and a Transaction is Not Distressed”)—Issued in April 2009, ASC 820-10-65-2 provides guidance for making fair value measurements more consistent with the principles presented in ASC
33
Table of Contents
820-10. ASC 820-10-65-2 provides additional authoritative guidance in determining whether a market is active or inactive and whether a transaction is distressed. ASC 820-10-65-2 is applicable to all assets and liabilities (i.e. financial and nonfinancial) and will require enhanced disclosures. This standard is effective for periods ending after June 15, 2009 with early adoption permitted. There was no material impact from the adoption of this guidance.
FASB ASC 320-10-65, “Recognition and Presentation of Other-Than-Temporary Impairments” (formerly FSP FAS 115-2, FAS 124-2 and EITF 99-20-2, “Recognition and Presentation of Other-Than-Temporary Impairments”)—Issued in April 2009, ASC 320-10-65 provides additional guidance to improve clarity about the credit and noncredit component of an other-than-temporary impairment event and to more effectively communicate when an other-than-temporary impairment event has occurred. ASC 320-10-65 applies to debt securities and is effective for periods ending after June 15, 2009 with early adoption permitted. This statement resulted in additional disclosures related to other-than-temporary impairments.
FASB ASC 825-10-65, “Interim Disclosures about Fair Value of Financial Instruments” (formerly FSP FAS 107-1 and APB 28-1, “Interim Disclosures about Fair Value of Financial Instruments”)—Also issued in April 2009, ASC 825-10-65 amends ASC 825-10, Disclosures about Fair Value of Financial Instruments, to require disclosures about fair value of financial instruments in interim as well as in annual financial statements. ASC 825-10-65 also amends ASC 270-10, Interim Reporting, to require those fair value disclosures in all interim financial statements. This standard was effective for periods ending after June 15, 2009 with early adoption permitted. There was no material impact from this guidance.
FASB ASC 855-10, “Subsequent Events” (formerly SFAS 165, “Subsequent Events”)—In May 2009, the FASB issued ASC 855-10, which sets forth: (1) the period after the balance sheet date during which management of a reporting entity should evaluate events or transactions that may occur for potential recognition or disclosure in the financial statements; (2) the circumstances under which an entity should recognize events or transactions occurring after the balance sheet date in its financial statements; and 3) the disclosures that an entity should make about events or transactions that occurred after the balance sheet date. ASC 855-10 is currently effective and resulted in additional disclosure related to subsequent events.
FASB ASC 105-10, “Generally Accepted Accounting Principles” (formerly FASB Statement No. 168, “The FASB Accounting Standards Codification ™ and the Hierarchy of Generally Accepted Accounting Principles, a replacement of FASB Statement No. 162” (the Codification))—In June 2009, the FASB issued the Codification, which was launched on July 1, 2009. The Codification became the single source of authoritative nongovernmental U.S. GAAP, superseding existing FASB, American Institute of Certified Public Accountants (AICPA), Emerging Issues Task Force (EITF) and related literature. The Codification eliminates the GAAP hierarchy contained in SFAS No. 162 and establishes one level of authoritative GAAP. All other literature is considered non-authoritative. This Statement is effective for financial statements issued for interim and annual periods ending after September 15, 2009. The Codification is currently effective and did not impact our consolidated financial statements.
FASB ASU 2010-06, “Fair Value Measurements and Disclosures (Topic 820) – Improving Disclosures about Fair Value Measurements”—In January 2010, the FASB issued guidance to improve the disclosures for Level 1, Level 2 and Level 3 fair value measurements. ASU 2010-06 requires new disclosures for significant transfers in and out of Level 1 and Level 2 fair value measurements, and separately report information about purchases, sales, issuances and settlements of Level 3 fair value measurements. ASU 2010-06 also updates ASC 820-10, Fair Value Measurements and Disclosures, to require an entity to provide fair value measurement disclosures for each class of assets and liabilities. Entities should also provide disclosures about the valuation techniques and inputs used to measure fair value for both recurring and nonrecurring fair value measurements for Level 2 and Level 2 fair value measurements. ASU 2010-06 will be effective for interim and annual reporting periods beginning after December 15, 2009, except for the disclosures about purchases, sales, issuances and settlements in the roll forward of activity in Level 3 fair value measurements, which will be effective for interim and annual reporting periods beginning after December 15, 2010. We are currently evaluating the impact ASU 2010-06 will have on our financial statements.
| Item 7A. | Quantitative and Qualitative Disclosures About Market Risk |
Global economic conditions pose a risk to the overall economy as consumers and businesses may defer purchases in response to the uncertainty around tighter credit and negative financial news. These conditions could reduce product demand and affect other related matters. Demand could be different from our expectations due to many factors including changes in business and economic conditions, conditions in the credit market that could affect consumer confidence, customer acceptance of our products, changes in customer order patterns including order cancellations and changes in the level of inventory held by vendors.
Credit markets have tightened as a result of the recent financial crises, resulting in lower liquidity in many financial markets and excess volatility in fixed income, credit and equity markets. We could experience a number of resulting effects, including product delays due to effects experienced by key suppliers; reduced orders and payments as customers are affected by tighter credit markets and/or insolvency; decreased investing and financing options in a tighter market; increased expenses; increased impairments resulting from lower orders and sales as customers experience difficulties obtaining financing; and volatility and extreme changes in the earnings and fair value of our investments.
34
Table of Contents
Moreover, in the normal course of doing business, we are exposed to the risks associated with foreign currency exchange rates and changes in interest rates. We employ established policies and procedures governing the use of financial instruments, entered into for purposes other than trading purposes, to manage our exposure to these risks.
Our cash equivalents and investments are subject to three market risks: interest rate risk, credit risk and liquidity risk. Our investments are primarily held in money market funds, bank time deposits and auction rate securities (“ARS”). Some of these investments are insured for credit risk.
ARS are subject to substantial risk that the market will fail to provide the opportunity to liquidate on scheduled reset dates. This risk, which we have encountered with regard to our ARS, manifests itself in sponsoring broker-dealers withdrawing from the auction process that provides the rate reset and liquidity.
In the first quarter of 2008, we reclassed our short-term auction rate securities to long-term due to the sustained illiquidity of these securities. During 2009 and 2008, we recorded $14.3 million and $31.8 million impairments of ARS, respectively. We further recorded an additional $16.5 million unrealized loss against other comprehensive income and a related tax benefit of $5.6 million, for a net unrealized loss of $10.9 million in accumulated other comprehensive loss. See Notes 2 and 3 to our consolidated financial statements for additional quantitative and qualitative details.
As of January 1, 2010, we had open foreign exchange contracts with a notional amount of approximately $14.2 million to hedge forecasted foreign cash flow commitments up to five months. As our hedges on forecasted foreign cash flow commitments do not qualify for deferral, gains and losses on changes in the fair market value of the foreign exchange contracts are recognized in income. Total net losses on foreign exchange contracts were $1.3 million in 2009. Realized and unrealized gains and losses from hedges are classified in the statements of operations consistent with the accounting treatment of the items being hedged. During 2009, we purchased and sold $30.1 million of foreign exchange forward contracts. The derivatives were also recognized on the balance sheet at their fair value, which was $0.3 million, as of January 1, 2010. We believe our cash flow hedges have been economically effective. The table below summarizes our foreign exchange contract activity over the past two years ($ in millions):
| Fiscal Year Ended | ||||||||
| January 1, 2010 | January 2, 2009 | |||||||
| Realized (loss) gain on foreign exchange contracts |
$ | (1.2 | ) | $ | 1.2 | |||
| Unrealized loss on foreign exchange contracts |
$ | (0.1 | ) | $ | (0.1 | ) | ||
| Purchases and sales of foreign exchange contracts |
$ | 30.1 | $ | 43.0 | ||||
| Notional amount of open contracts as of year end |
$ | 14.2 | $ | 20.3 | ||||
| Fair value of open contracts as of year end |
$ | 0.3 | $ | 0.7 | ||||
Our hedging activities provide only limited protection against currency exchange risks. Factors that could impact the effectiveness of our hedging programs include accuracy of sales estimates, volatility of currency markets and the cost and availability of hedging instruments. A 10% adverse change in currency exchange rates for our foreign currency derivatives held as of January 1, 2010 will have a negligible impact on the fair values of these instruments. This qualification of exposure to the market risk associated with foreign exchange financial instruments does not take into account the offsetting impact of changes in the fair values of foreign denominated assets, liabilities and firm commitments. See Note 19 to our consolidated financial statements for further discussion.
A substantial majority of our revenues billed outside the U.S. are billed and collected in U.S. dollars. Therefore, we do not believe we have material risk to revenues due to currency rate fluctuations between billing and collection of funds for those amounts billed in other currencies.
35
Table of Contents
| Item 8. | Financial Statements and Supplementary Data |
The following consolidated financial statements and the related Notes thereto, and the financial statement schedules of Intersil Corporation and the Reports of the Independent Registered Public Accounting Firm are filed as a part of this report.
INTERSIL CORPORATION
| 37 | ||
| 39 | ||
| 40 | ||
| 41 | ||
| 42 | ||
| 43 | ||
| 44 | ||
| INDEX TO FINANCIAL STATEMENT SCHEDULES | ||
| 74 | ||
36
Table of Contents
REPORT OF INDEPENDENT REGISTERED PUBLIC ACCOUNTING FIRM
The Board of Directors and Shareholders
Intersil Corporation:
We have audited the accompanying consolidated balance sheets of Intersil Corporation and subsidiaries as of January 1, 2010 and January 2, 2009 and the related consolidated statements of operations, shareholders’ equity, comprehensive income (loss) and cash flows for each of the years in the three-year period ended January 1, 2010. In connection with our audits of the consolidated financial statements, we also have audited the financial statement schedule as listed in the accompanying index. These consolidated financial statements and financial statement schedule are the responsibility of the Company’s management. Our responsibility is to express an opinion on these consolidated financial statements and financial statement schedule based on our audits.
We conducted our audits in accordance with the standards of the Public Company Accounting Oversight Board (United States). Those standards require that we plan and perform the audit to obtain reasonable assurance about whether the financial statements are free of material misstatement. An audit includes examining, on a test basis, evidence supporting the amounts and disclosures in the financial statements. An audit also includes assessing the accounting principles used and significant estimates made by management, as well as evaluating the overall financial statement presentation. We believe that our audits provide a reasonable basis for our opinion.
In our opinion, the consolidated financial statements referred to above present fairly, in all material respects, the financial position of Intersil Corporation and subsidiaries as of January 1, 2010 and January 2, 2009, and the results of their operations and their cash flows for each of the years in the three-year period ended January 1, 2010, in conformity with U.S. generally accepted accounting principles. Also in our opinion, the related financial statement schedule, when considered in relation to the basic consolidated financial statements taken as a whole, presents fairly, in all material respects, the information set forth therein.
As discussed in Note 3 to the consolidated financial statements, the Company changed its method of accounting for other-than-temporary impairments of debt securities due to the adoption of FASB Staff Position No. FAS 115-2 and FAS 124-2, “Recognition and Presentation of Other-Than-Temporary Impairments,” (included in FASB ASC Topic 320, Investments-Debt and Equity Securities), as of April 4, 2009.
We also have audited, in accordance with the standards of the Public Company Accounting Oversight Board (United States), Intersil Corporation’s internal control over financial reporting as of January 1, 2010, based on criteria established in Internal Control – Integrated Framework issued by the Committee of Sponsoring Organizations of the Treadway Commission (COSO), and our report dated March 2, 2010, expressed an unqualified opinion on the effectiveness of the Company’s internal control over financial reporting.
KPMG LLP
March 2, 2010
Orlando, Florida
Certified Public Accountants
37
Table of Contents
REPORT OF INDEPENDENT REGISTERED PUBLIC ACCOUNTING FIRM
The Board of Directors and Shareholders
Intersil Corporation.:
We have audited Intersil Corporation’s internal control over financial reporting as of January 1, 2010, based on criteria established in Internal Control—Integrated Framework issued by the Committee of Sponsoring Organizations of the Treadway Commission (COSO). Intersil Corporation’s management is responsible for maintaining effective internal control over financial reporting and for its assessment of the effectiveness of internal control over financial reporting included in the accompanying Report on Internal Control over Financial Reporting. Our responsibility is to express an opinion on the Company’s internal control over financial reporting based on our audit.
We conducted our audit in accordance with the standards of the Public Company Accounting Oversight Board (United States). Those standards require that we plan and perform the audit to obtain reasonable assurance about whether effective internal control over financial reporting was maintained in all material respects. Our audit included obtaining an understanding of internal control over financial reporting, assessing the risk that a material weakness exists, and testing and evaluating the design and operating effectiveness of internal control based on the assessed risk. Our audit also includes performing such other procedures as we considered necessary in the circumstances. We believe that our audit provides a reasonable basis for our opinion.
A company’s internal control over financial reporting is a process designed to provide reasonable assurance regarding the reliability of financial reporting and the preparation of financial statements for external purposes in accordance with generally accepted accounting principles. A company’s internal control over financial reporting includes those policies and procedures that (1) pertain to the maintenance of records that, in reasonable detail, accurately and fairly reflect the transactions and dispositions of the assets of the company; (2) provide reasonable assurance that transactions are recorded as necessary to permit preparation of financial statements in accordance with generally accepted accounting principles, and that receipts and expenditures of the company are being made only in accordance with authorizations of management and directors of the company; and (3) provide reasonable assurance regarding prevention or timely detection of unauthorized acquisition, use, or disposition of the company’s assets that could have a material effect on the financial statements.
Because of its inherent limitations, internal control over financial reporting may not prevent or detect misstatements. Also, projections of any evaluation of effectiveness to future periods are subject to the risk that controls may become inadequate because of changes in conditions, or that the degree of compliance with the policies or procedures may deteriorate.
In our opinion, Intersil Corporation maintained, in all material respects, effective internal control over financial reporting as of January 1, 2010, based on criteria established in Internal Control—Integrated Framework issued by the Committee of Sponsoring Organizations of the Treadway Commission (COSO).
We also have audited, in accordance with the standards of the Public Company Accounting Oversight Board (United States), the consolidated balance sheets of Intersil Corporation and subsidiaries as of January 1, 2010 and January 2, 2009, and the related consolidated statements of operations, shareholders’ equity, comprehensive income (loss), and cash flows for each of the years in the three-year period ended January 1, 2010 and the related schedule, and our report dated March 2, 2010 expressed an unqualified opinion on those consolidated financial statements.
KPMG LLP
March 2, 2010
Orlando, Florida
Certified Public Accountants
38
Table of Contents
CONSOLIDATED BALANCE SHEETS
| January 1, 2010 |
January 2, 2009 |
|||||||
| ($ in thousands, except share amounts) |
||||||||
| ASSETS | ||||||||
| Current Assets |
||||||||
| Cash and cash equivalents |
$ | 347,667 | $ | 215,625 | ||||
| Short-term investments |
13,498 | 97,008 | ||||||
| Trade receivables, net of allowances ($8,463 as of January 1, 2010 and $8,532 as of January 2, 2009) |
73,633 | 66,607 | ||||||
| Inventories |
81,236 | 109,644 | ||||||
| Prepaid expenses and other current assets |
9,403 | 12,092 | ||||||
| Deferred income taxes |
27,379 | 35,489 | ||||||
| Total Current Assets |
552,816 | 536,465 | ||||||
| Non-current Assets |
||||||||
| Property, plant and equipment, net of accumulated depreciation ($193,348 as of January 1, 2010 and $173,886 as of January 2, 2009) |
102,251 | 112,825 | ||||||
| Purchased intangibles, net of accumulated amortization ($65,290 as of January 1, 2010 and $52,113 as of January 2, 2009) |
26,627 | 29,041 | ||||||
| Goodwill |
314,676 | 313,729 | ||||||
| Long-term investments |
63,937 | 81,301 | ||||||
| Deferred income taxes |
90,975 | 46,994 | ||||||
| Other |
14,499 | 13,235 | ||||||
| Total Non-current Assets |
612,965 | 597,125 | ||||||
| Total Assets |
$ | 1,165,781 | $ | 1,133,590 | ||||
| LIABILITIES AND SHAREHOLDERS’ EQUITY | ||||||||
| Current Liabilities |
||||||||
| Trade payables |
$ | 31,496 | $ | 22,264 | ||||
| Accrued current and retirement compensation |
34,433 | 30,461 | ||||||
| Deferred net revenue |
9,687 | 10,638 | ||||||
| Other accrued expenses |
24,273 | 37,256 | ||||||
| Non-income taxes payable |
4,104 | 3,319 | ||||||
| Income taxes payable |
30,702 | 4,012 | ||||||
| Total Current Liabilities |
134,695 | 107,950 | ||||||
| Shareholders’ Equity |
||||||||
| Preferred Stock, $0.01 par value, 2 million shares authorized; no shares issued or outstanding |
— | — | ||||||
| Class A Common Stock, $.01 par value, voting; 600 million shares authorized; 122,816,221 and 121,626,122 shares issued and outstanding as of January 1, 2010 and January 2, 2009, respectively |
1,228 | 1,216 | ||||||
| Additional paid-in capital |
1,764,046 | 1,797,072 | ||||||
| Accumulated deficit |
(725,697 | ) | (764,262 | ) | ||||
| Accumulated other comprehensive loss |
(8,491 | ) | (8,386 | ) | ||||
| Total Shareholders’ Equity |
1,031,086 | 1,025,640 | ||||||
| Total Liabilities and Shareholders’ Equity |
$ | 1,165,781 | $ | 1,133,590 | ||||
See accompanying Notes to Consolidated Financial Statements.
39
Table of Contents
CONSOLIDATED STATEMENTS OF OPERATIONS
| Year Ended | ||||||||||||
| January 1, 2010 |
January 2, 2009 |
December 28, 2007 |
||||||||||
| (in thousands, except share and per share amounts) |
||||||||||||
| Revenue |
$ | 611,398 | $ | 769,675 | $ | 756,966 | ||||||
| Cost of revenue |
276,519 | 370,274 | 325,372 | |||||||||
| Gross profit |
334,879 | 399,401 | 431,594 | |||||||||
| Operating costs, expenses and other income |
||||||||||||
| Research and development |
145,054 | 143,583 | 134,374 | |||||||||
| Selling, general and administrative |
121,608 | 124,281 | 131,914 | |||||||||
| Impairment of goodwill |
— | 1,154,676 | — | |||||||||
| Amortization of purchased intangibles |
12,684 | 12,176 | 10,723 | |||||||||
| In-process research and development |
(215 | ) | 3,037 | 2,660 | ||||||||
| Restructurings and other related activities |
2,118 | 8,685 | — | |||||||||
| Operating income (loss) |
53,630 | (1,047,037 | ) | 151,923 | ||||||||
| Interest income, net |
4,824 | 14,655 | 30,911 | |||||||||
| Gain (loss) on deferred compensation investments, net |
2,015 | (3,632 | ) | 870 | ||||||||
| Loss on certain investments, net |
(14,305 | ) | (31,797 | ) | — | |||||||
| Income (loss) from continuing operations before income taxes |
46,164 | (1,067,811 | ) | 183,704 | ||||||||
| Income tax expense (benefit) from continuing operations |
7,599 | (5,309 | ) | 40,965 | ||||||||
| Income (loss) from continuing operations |
38,565 | (1,062,502 | ) | 142,739 | ||||||||
| Discontinued operations |
||||||||||||
| Loss from discontinued operations before income taxes |
— | — | (288 | ) | ||||||||
| Income tax (benefit) expense from discontinued operations |
— | (24,942 | ) | 1,975 | ||||||||
| Income (loss) from discontinued operations |
— | 24,942 | (2,263 | ) | ||||||||
| Net income (loss) |
$ | 38,565 | $ | (1,037,560 | ) | $ | 140,476 | |||||
| Basic earnings (loss) per share: |
||||||||||||
| Income (loss) from continuing operations |
$ | 0.32 | $ | (8.59 | ) | $ | 1.08 | |||||
| Income (loss) from discontinued operations |
— | 0.20 | (0.02 | ) | ||||||||
| Net income (loss) |
$ | 0.32 | $ | (8.39 | ) | $ | 1.06 | |||||
| Diluted (loss) earnings per share: |
||||||||||||
| Income (loss) from continuing operations |
$ | 0.32 | $ | (8.59 | ) | $ | 1.07 | |||||
| Income (loss) from discontinued operations |
— | 0.20 | (0.02 | ) | ||||||||
| Net income (loss) |
$ | 0.32 | $ | (8.39 | ) | $ | 1.05 | |||||
| Weighted average common shares outstanding (in millions): |
||||||||||||
| Basic |
122.3 | 123.7 | 132.5 | |||||||||
| Diluted |
122.3 | 123.7 | 134.0 | |||||||||
See accompanying Notes to Consolidated Financial Statements.
40
Table of Contents
CONSOLIDATED STATEMENTS OF COMPREHENSIVE INCOME (LOSS)
| Year Ended | ||||||||||||
| January 1, 2010 |
January 2, 2009 |
December 28, 2007 |
||||||||||
| ($ in thousands and net of associated tax effects) | ||||||||||||
| Net income (loss) |
$ | 38,565 | $ | (1,037,560 | ) | $ | 140,476 | |||||
| Currency translation adjustments |
33 | 608 | 501 | |||||||||
| Unrealized losses on available-for-sale investments, net of tax benefit of $522, $3,684 and $1,388 |
(138 | ) | (6,896 | ) | (3,894 | ) | ||||||
| Comprehensive income (loss) |
$ | 38,460 | $ | (1,043,848 | ) | $ | 137,083 | |||||
See accompanying Notes to Consolidated Financial Statements.
41
Table of Contents
CONSOLIDATED STATEMENTS OF CASH FLOWS
| Year Ended | ||||||||||||
| January 1, 2010 |
January 2, 2009 |
December 28, 2007 |
||||||||||
| ($ in thousands) | ||||||||||||
| OPERATING ACTIVITIES: |
||||||||||||
| Net income (loss) from continuing operations |
$ | 38,565 | $ | (1,062,502 | ) | $ | 142,739 | |||||
| Adjustments to reconcile net income (loss) from continuing operations to net cash provided by operating activities: |
||||||||||||
| Depreciation and amortization |
33,963 | 34,761 | 31,172 | |||||||||
| Impairment of goodwill |
— | 1,154,676 | — | |||||||||
| Impairment of assets held for sale |
1,018 | 2,115 | — | |||||||||
| Stock-based compensation |
26,881 | 30,787 | 44,296 | |||||||||
| Tax benefit from stock options and awards exercised |
931 | 6,274 | 20,728 | |||||||||
| Excess tax benefit received on exercise of stock-based awards |
(378 | ) | (931 | ) | (7,840 | ) | ||||||
| Provisions for inventory obsolescence |
11,944 | 26,162 | 5,944 | |||||||||
| In-process research and development (credit) charge |
(215 | ) | 3,037 | 2,660 | ||||||||
| Loss on certain investments |
14,305 | 31,797 | — | |||||||||
| (Gain) loss on sale of property and equipment |
(40 | ) | 87 | (2,091 | ) | |||||||
| Deferred income taxes |
(33,381 | ) | (3,087 | ) | 3,380 | |||||||
| Net income (loss) from discontinued operations |
— | 24,942 | (2,263 | ) | ||||||||
| Changes in operating assets and liabilities: |
||||||||||||
| Trade receivables |
(6,938 | ) | 51,074 | (18,707 | ) | |||||||
| Inventories |
16,680 | (35,846 | ) | (9,620 | ) | |||||||
| Prepaid expenses and other current assets |
2,148 | (1,240 | ) | 3,250 | ||||||||
| Trade payables and accrued liabilities |
(2,013 | ) | (3,370 | ) | 4,043 | |||||||
| Income taxes |
26,523 | (55,925 | ) | 15,148 | ||||||||
| Other, net |
(750 | ) | 1,087 | (451 | ) | |||||||
| Net cash provided by operating activities |
129,243 | 203,898 | 232,388 | |||||||||
| INVESTING ACTIVITIES: |
||||||||||||
| Proceeds from sales of auction rate securities |
2,400 | 29,275 | 759,985 | |||||||||
| Purchases of auction rate securities |
— | (2,500 | ) | (535,250 | ) | |||||||
| Proceeds from sales or maturities of short-term investments |
97,589 | 9,911 | 88,136 | |||||||||
| Purchases of short-term investments |
(14,123 | ) | (80,000 | ) | — | |||||||
| Proceeds from sales or issuer calls of long-term investments |
— | 2,000 | 85,471 | |||||||||
| Purchases of long-term investments |
— | — | (36,171 | ) | ||||||||
| Cash paid for acquired businesses, net of acquired cash |
(18,192 | ) | (47,955 | ) | (47,995 | ) | ||||||
| Proceeds from sales of property, plant and equipment |
40 | 123 | 5,904 | |||||||||
| Purchases of property, plant and equipment |
(11,073 | ) | (31,873 | ) | (24,109 | ) | ||||||
| Net cash provided by (used in) investing activities |
56,641 | (121,019 | ) | 295,971 | ||||||||
| FINANCING ACTIVITIES: |
||||||||||||
| Proceeds from exercise of stock-based awards |
5,409 | 22,166 | 115,699 | |||||||||
| Excess tax benefit received on exercise of stock-based awards |
378 | 931 | 7,840 | |||||||||
| Dividends paid |
(59,112 | ) | (59,823 | ) | (53,440 | ) | ||||||
| Repurchase of outstanding common shares |
— | (154,998 | ) | (434,990 | ) | |||||||
| Net cash used in financing activities |
(53,325 | ) | (191,724 | ) | (364,891 | ) | ||||||
| Effect of exchange rates on cash and cash equivalents |
(517 | ) | 1,067 | 997 | ||||||||
| Net increase (decrease) in cash and cash equivalents |
132,042 | (107,778 | ) | 164,465 | ||||||||
| Cash and cash equivalents as of the beginning of the period |
215,625 | 323,403 | 158,938 | |||||||||
| Cash and cash equivalents as of the end of the period |
$ | 347,667 | $ | 215,625 | $ | 323,403 | ||||||
See accompanying Notes to Consolidated Financial Statements.
42
Table of Contents
CONSOLIDATED STATEMENTS OF SHAREHOLDERS’ EQUITY
| Common Stock Class A |
Additional Paid-In Capital |
Accumulated Deficit/ Retained Earnings |
Accumulated Other Comprehensive Income (Loss) |
Total | ||||||||||||||||
| Balance as of December 29, 2006 |
$ | 1,359 | $ | 2,171,642 | $ | 247,217 | $ | 1,295 | $ | 2,421,513 | ||||||||||
| Net income |
— | — | 140,476 | — | 140,476 | |||||||||||||||
| Dividends paid, $0.40 per common share |
— | — | (53,372 | ) | — | (53,372 | ) | |||||||||||||
| Dividends accrued to Award holders prior to vesting |
— | — | (793 | ) | — | (793 | ) | |||||||||||||
| Stock based compensation expense |
— | 44,305 | — | — | 44,305 | |||||||||||||||
| Shares issued under share based award plans, plus related tax benefit |
63 | 125,070 | — | — | 125,133 | |||||||||||||||
| Foreign currency translation |
— | — | — | 501 | 501 | |||||||||||||||
| Unrealized losses on available-for-sale securities, net of tax benefit |
— | — | — | (3,894 | ) | (3,894 | ) | |||||||||||||
| Shares repurchased and retired |
(152 | ) | (434,838 | ) | — | — | (434,990 | ) | ||||||||||||
| Balance as of December 28, 2007 |
$ | 1,270 | $ | 1,906,179 | $ | 333,528 | $ | (2,098 | ) | $ | 2,238,879 | |||||||||
| Net loss |
— | — | (1,037,560 | ) | — | (1,037,560 | ) | |||||||||||||
| Dividends paid, $0.48 per common share |
— | — | (59,587 | ) | — | (59,587 | ) | |||||||||||||
| Dividends accrued to Award holders prior to vesting |
— | — | (643 | ) | — | (643 | ) | |||||||||||||
| Stock based compensation expense |
— | 30,727 | — | — | 30,727 | |||||||||||||||
| Shares issued under share based award plans, plus related tax benefit |
17 | 15,093 | — | — | 15,110 | |||||||||||||||
| Foreign currency translation |
— | — | — | 608 | 608 | |||||||||||||||
| Unrealized losses on available-for-sale securities, net of tax benefit |
— | — | — | (6,896 | ) | (6,896 | ) | |||||||||||||
| Shares repurchased and retired |
(71 | ) | (154,927 | ) | — | — | (154,998 | ) | ||||||||||||
| Balance as of January 2, 2009 |
$ | 1,216 | $ | 1,797,072 | $ | (764,262 | ) | $ | (8,386 | ) | $ | 1,025,640 | ||||||||
| Net income |
— | — | 38,565 | — | 38,565 | |||||||||||||||
| Dividends paid, $0.48 per common share |
— | (58,672 | ) | — | — | (58,672 | ) | |||||||||||||
| Dividends accrued to Award holders prior to vesting |
— | (1,000 | ) | — | — | (1,000 | ) | |||||||||||||
| Stock based compensation expense |
— | 26,881 | — | — | 26,881 | |||||||||||||||
| Reversal of excess tax benefit |
— | (6,798 | ) | — | — | (6,798 | ) | |||||||||||||
| Shares issued under share based award plans, plus related tax benefit |
12 | 6,563 | — | — | 6,575 | |||||||||||||||
| Foreign currency translation |
— | — | — | 33 | 33 | |||||||||||||||
| Unrealized losses on available-for-sale securities, net of tax benefit |
— | — | — | (138 | ) | (138 | ) | |||||||||||||
| Balance as of January 1, 2010 |
$ | 1,228 | $ | 1,764,046 | $ | (725,697 | ) | $ | (8,491 | ) | $ | 1,031,086 | ||||||||
See accompanying Notes to Consolidated Financial Statements.
43
Table of Contents
NOTES TO CONSOLIDATED FINANCIAL STATEMENTS
NOTE 1—ORGANIZATION AND BASIS OF PRESENTATION
Organization: Markets and Products
Intersil Corporation is a global designer and manufacturer of high performance analog and mixed-signal integrated circuits for applications in the high-end consumer, industrial, communications and computing electronics markets.
High-end consumer products: gaming, light sensors, optical storage, displays and handheld products. High-end consumer products target high growth applications such as electronic game systems, DVD players and recorders, MP3 players, GPS systems, liquid crystal display (“LCD”) televisions, data converters and smart cell phones. High-end consumer products accounted for 25%, 25% and 29% of sales in fiscal years 2009, 2008, and 2007, respectively.
Industrial products: operational amplifiers, bridge driver power management products, switches and multiplexers, and other standard analog and power management products. Industrial products target end markets including medical imaging, energy management, automotive, solar generating devices, military and factory automation. Industrial products represented 20%, 22% and 23% of sales in fiscal years 2009, 2008, and 2007, respectively.
Communications products: line drivers, broadband and hot plug power management products and high speed converters targeted to applications in markets such as DSL (digital subscriber line), home gateway, satellite, networking, cellular base station and networking/switching equipment. Communications products accounted for 22%, 22% and 21% of sales in fiscal years 2009, 2008, and 2007, respectively.
Computing products: desktop, server and notebook power management, including core power devices and power management applications for peripheral devices. Computing products accounted for 33%, 31% and 27% of sales in fiscal years 2009, 2008, and 2007, respectively.
Basis of Presentation
We utilize a 52/53 week fiscal year, ending on the nearest Friday to December 31. Fiscal year 2008 includes an extra week in the second quarter and 53 weeks for the total fiscal year ending on January 2, 2009. All other fiscal years presented herein contain 52 weeks. Quarterly or annual periods vary from exact calendar quarters or years.
The consolidated financial statements include the accounts of Intersil Corporation and its subsidiaries. All significant intercompany accounts and transactions have been eliminated. Accounts denominated in non-U.S. currencies have been remeasured using the U.S. dollar as the functional currency.
Reclassifications
Certain prior year amounts have been reclassified to conform to current year presentation.
NOTE 2—SIGNIFICANT ACCOUNTING POLICIES
Cash Equivalents—Cash equivalents in the consolidated balance sheets and statements of cash flow consist of liquid debt securities with insignificant interest rate risk and with original maturities of three months or less at the time of purchase. Investments with original maturities over three months are classified as short-term investments.
Short and Long-term Investments—We continually monitor our positions with and the credit quality of the governmental and financial institutions that issue our investments. We enter into transactions only with issuers that have a long-term debt rating of no less than AA by Standard & Poor’s and Aa2 by Moody’s. For short-term debt (a maturity date less than 365 days), the issuer must have no less than an A1 Standard & Poor’s and a P1 Moody’s credit rating. In addition, we limit the amount of investment credit exposure with any one issuer. Investments are classified as short-term or long-term on the balance sheet based on whether they mature within one year (short-term) or more than one year (long-term). Realized gains and losses on the sale of investments are determined using the specific-identification method.
Available-for-Sale (“AFS”) Investments—Investments designated as available-for-sale (“AFS”) are reported at fair value. We record the unrealized gains and losses, net of tax, in stockholders’ equity as a component of other comprehensive income. We determine the cost of securities sold based on the specific identification method. Realized gains or losses and impairment losses that are determined to be other-than-temporary are recorded in loss (gain) on certain investments in our consolidated statement of operations. See Note 3.
Held-to-Maturity (“HTM”) Investments—Investments designated as held to maturity (“HTM”) are reported at amortized cost. Securities are classified as HTM when we have the positive intent and ability to hold the investment until maturity. Gains and losses are not reported in the financial statements until realized or until a decline in value is deemed to be other-than-temporary.
44
Table of Contents
Management deems unrealized losses to be temporary when there are short periods until the related investments mature, the issuers are deemed highly creditworthy and we have ability and intent to hold the investments until maturity at which time the investment will be redeemed at amortized cost. HTM investments with maturities one year or less are contained in the balance sheet line item “Short-term investments” and those beyond one year are contained in the balance sheet line item “Long-term investments.” See Note 3.
Trading Investments—Trading investments consists exclusively of a portfolio of marketable mutual funds under a non-qualified deferred employee compensation plan. We also have a liability recorded for the deferred compensation plan. The funds are recorded at fair value. We recognize changes in fair value currently in gain (loss) on certain investments and we record changes in the liability in selling, general and administrative expense. In general, the compensation expense (benefit) is substantially offset by the gains and losses on the investment. We classify these mutual fund assets as other non-current assets since we have no plan or intent of liquidating or otherwise using these securities in our business operations. See Note 3.
Financial Derivatives—We hold derivative financial instruments to manage currency risks. Our derivative instruments are recorded at fair value and are included in other current assets. We account for these instruments based on whether they meet the criteria for designation as hedging transactions, either as cash flow or fair value hedges. A hedge of the exposure to variability in the cash flows of an asset or a liability, or of a forecasted transaction, is referred to as a cash flow hedge. A hedge of the exposure to changes in fair value of an asset or a liability, or of an unrecognized firm commitment, is referred to as a fair value hedge. The criteria for designating a derivative as a hedge include the instrument’s effectiveness in risk reduction and, in most cases, a one-to-one matching of the derivative instrument to its underlying transaction. Gains and losses on derivatives not designated as hedges are recognized currently in earnings and generally offset changes in the values of related assets, liabilities or debt. Intersil uses foreign exchange contracts to hedge forecasted foreign cash flow commitments up to six months. Hedges on forecasted foreign cash flow commitments do not qualify for deferral, as the hedges are not related to a specific, identifiable transaction. Therefore, gains and losses on changes in the fair market value of the foreign exchange contracts are recognized in cost of revenue. Premiums paid for option contracts that are not exercised are written off at the time of expiration. See Note 19.
Trade Receivables—Trade receivables are recorded at net realizable value or the amount that we expect to collect on our gross customer trade receivables. As of January 1, 2010, we maintained an allowance of approximately 0.1% of gross trade receivables (also approximately 0.1% as of January 2, 2009) in addition to specific allowances for receivables with known collection problems due to circumstances such as bankruptcy or customer disputes. Collection problems are identified using an aging of receivables analysis based on invoice due dates and other information. When items are deemed uncollectible, we charge them against the allowance for collection losses. We provide for estimated losses from collection problems in the current period, as a component of sales. We utilize credit limits, ongoing evaluation and trade receivable monitoring procedures to reduce the risk of credit loss. Credit is extended based on an evaluation of the customer’s financial condition and collateral is generally not required.
Inventories—Inventories are carried at the lower of standard cost (which approximates actual cost, determined by the First-In-First-Out (FIFO) method) or market. Inventory adjustments establish a new cost basis and are considered permanent even in instances where the costs are recoverable. Standard cost is used to relieve inventory and charge cost of revenues upon the related sale. Cost elements include purchased and manufactured materials, direct and indirect labor, plant overheads, contracted services such as test, assembly and packaging and shipping costs. Also included in inventory are immaterial amounts of allocated administrative costs. See Note 5.
Property, Plant and Equipment—Buildings, machinery and equipment are carried at cost, less depreciation and impairment charges, if any. We expense repairs and maintenance costs that do not extend an asset’s useful life or increase an asset’s capacity. Depreciation is computed using the straight-line method over the estimated useful life of the asset. We lease certain facilities under operating leases and record the effective rental expense in the appropriate period on the straight-line method. See Note 6.
Revenue Recognition—Except for North American (“domestic”) distributors and certain royalty arrangements, revenue is generally recognized when a product is shipped, provided that persuasive evidence of a sales arrangement exists, the price is fixed or determinable, title and risk has transferred, collection of resulting receivables is reasonably assured, there are no customer acceptance requirements and there are no remaining significant obligations. Customers typically provide a customer request date (CRD) which indicates the preferred date for receipt of the ordered products. Based on estimated transit time and other logistics, we may deliver products to the carrier in advance of the CRD and recognize revenue from the sale of such products at the time of shipment. Our intent is that such deliveries are made not more than ten days in advance of CRD. Shipments to domestic distributors are made under agreements which provide for certain pricing credits and limited product return privileges.
Given the uncertainties associated with the levels of returns and credits that may be issued to domestic distributors, we defer recognition of those sales until the domestic distributors sell the merchandise. We relieve inventory and record a receivable on the initial sale to the distributor as title has passed to the distributor and payment is collected on the receivable within normal trade terms.
45
Table of Contents
The gross profit to be derived from these sales is shown under current liabilities on the balance sheet as “Deferred net revenue” until such time as the distributor confirms a final sale to its end customer.
The following table summarizes the deferred net revenue balance:
| Deferred net revenue: North American distributor and certain royalties |
January 1, 2010 ($ in millions) |
January 2, 2009 ($ in millions) | ||||
| Deferred revenues |
$ | 12.8 | $ | 14.0 | ||
| Deferred cost of revenues |
3.1 | 3.4 | ||||
| Deferred net revenue |
$ | 9.7 | $ | 10.6 | ||
Sales to international distributors are made under agreements which permit limited stock return privileges and pricing credits. Revenue on these sales is recognized upon shipment, at which time title passes. We estimate international distributor returns and pricing credits based on historical data and current business expectations and provide an allowance based on these estimated returns. The international distributor allowances are made up of two components that are reasonably estimable:
International price protection allowance—protects the distributors’ gross margins in the event of falling prices. This allowance is based on the relationship of historical credits issued to distributors in relation to historical inventory levels and price paid by the distributor as applied to current inventory levels.
International stock rotation allowance—protects distributors for certain unsold inventories of our products which they hold. This allowance is based on the percentage of sales made to certain international distributors.
Revenues are also reduced based on an analysis of historical returns related to accommodation and warranty related returns. Such amounts are classified in “Allowances to trade receivables” on the face of the accompanying balance sheets. Accommodation returns are those we are not contractually obligated to accept for credit. We believe we can make reasonable and reliable estimates of future returns and price protections, other than those aforementioned for the domestic distributors, because these sales reductions are relatively small and predictable.
For fiscal year 2009, gross revenues were approximately $644.1 million and various returns, allowances and deferrals as noted above were approximately $32.7 million. For fiscal year 2008, gross revenues were approximately $815.6 million and various returns, allowances and deferrals as noted above were approximately $45.9 million. For fiscal year 2007, gross revenues were approximately $796.8 million and various returns, allowances and deferrals as noted above were approximately $39.8 million.
Research and Development—Research and development costs, consisting of the cost of designing, developing and testing new or significantly enhanced products are expensed as incurred.
Loss Contingencies—Intersil estimates and accrues loss contingencies at the point that the losses become probable. For litigation, our practice is to include an estimate of legal costs to defend.
Retirement Benefits—We provide retirement benefits to substantially all employees primarily through a defined contribution plan to which both Intersil and its employees contribute (a 401(k) Plan under Internal Revenue Code Section 401(k)). Contributions by Intersil are based on a dollar-for-dollar match of employees’ contributions up to a certain predetermined percentage. Employees fully vest in the matching contributions after five years of service.
We provide retirement benefits under statutorily required plans for employees in certain countries outside the U.S. Accrued liabilities relating to these unfunded plans were $3.5 million and $3.6 million as of January 1, 2010 and January 2, 2009, respectively.
Retirement plans expense from continuing operations was $5.5 million, $5.7 million and $4.9 million for 2009, 2008 and 2007, respectively, which is primarily the matching contributions to employees’ 401(k) accounts.
Income Taxes—We follow the liability method of accounting for income taxes. Current income taxes payable and deferred income taxes resulting from temporary differences between the financial statements and the tax basis of assets and liabilities are separately classified on the Consolidated Balance Sheets. See Note 15 for disclosures and information regarding our income tax accounting and recorded balances.
Asset Impairment—We account for long-lived asset impairments using a three-step approach for recognizing and measuring the impairment of assets to be held and used. We recognize impairment losses on long-lived assets when indicators of impairment exist and our estimate of undiscounted cash flows generated by those assets is less than the assets’ carrying amounts. The impairment loss is measured by comparing the fair value of the asset to its carrying amount. Fair value is estimated based on discounted future cash flows or market value, if available. Assets to be sold are stated at the lower of the assets’ carrying amount or fair value and depreciation is no longer recognized.
46
Table of Contents
Goodwill —We perform an annual impairment review of goodwill during the fourth quarter of each year (or more frequently if indicators of impairment exist). In 2008, our impairment review indicated an impairment of goodwill and consequently we recorded an impairment charge of $1,154.7 million in our consolidate statement of operations. No impairment charges were recorded in 2009 or 2007. See Note 8 for further discussion.
Goodwill is tested under the two-step approach for impairment at a level of reporting referred to as a reporting unit. We have one operating segment (reportable segment) with two reporting units for 2009 and five reporting units for 2008 and 2007.
Step one is identification of potential impairment. This involves comparing the fair value of each reporting unit with its carrying amount, including goodwill. If the fair value of a reporting unit exceeds the carrying amount, the goodwill of the reporting unit is considered not impaired and the second step of the impairment test is unnecessary. If the carrying amount of a reporting unit exceeds its fair value, the second step of the impairment test is performed to measure the amount of impairment loss, if any.
Step two is measurement of the amount of impairment loss. This involves comparison of the implied fair value of the reporting unit goodwill with the carrying amount of that goodwill. If the carrying amount of the reporting unit goodwill exceeds the implied fair value of that goodwill, an impairment loss would be recognized in an amount equal to that excess. The loss recognized cannot exceed the carrying amount of the goodwill. Once a goodwill impairment loss is recognized, the adjusted carrying amount becomes the accounting basis.
Other Comprehensive income (loss)—Comprehensive income (loss) is the change in shareholders’ equity that is not the result of investments by or distributions to shareholders. Our other comprehensive income (loss) elements are as follows.
Currency translation adjustments—Our international subsidiaries predominately use the appropriate local currency in their businesses. Assets and liabilities are translated at current rates of exchange, and income and expense items are translated at the weighted average exchange rate for the year. The resulting translation adjustments are recorded as a separate component of shareholders’ equity, Accumulated other comprehensive income (loss) (AOCI). Cumulative translation adjustments in AOCI were $2.4 million, $2.4 million and $1.8 million as of January 1, 2010, January 2, 2009 and December 28, 2007, respectively.
Unrealized losses on AFS investments—Unrealized losses from investment securities classified as AFS that are deemed to be temporary in nature are recognized by a charge to AOCI. As more fully described in Note 3, we recorded charges in 2009, 2008 and 2007 relating to unrealized losses on our auction rate securities.
Segment Information—We operate and account for results in one reportable segment. We design, develop, manufacture and market high performance analog and mixed signal integrated circuits. The Chief Operating Officer has been identified as the Chief Operating Decision Maker as defined by guidance regarding segment disclosures.
Use of Estimates—The financial statements have been prepared in conformity with accounting principles generally accepted in the United States and require management to make estimates and assumptions that affect the reported amounts of assets and liabilities and disclosure of contingent assets and liabilities as of the date of the financial statements and the reported amounts of revenue and expenses during the reporting period. Actual results could differ from those estimates.
Restructuring—A liability for a cost associated with an exit or disposal activity is recognized when a liability is incurred rather than when an exit or disposal plan is approved. We record restructuring charges when severance obligation is probable and reasonably estimable and is a vested right attributable to the employees’ service already rendered. See Note 11.
Advertising Expense—Advertising costs are expensed in the period incurred. Advertising expense was $4.7 million, $5.8 million and $5.9 million for 2009, 2008 and 2007, respectively. There are no prepaid advertising costs in any period presented.
Credit line—On October 17, 2008, we established a $75.0 million revolving credit facility with Bank of America, N.A. as administrative agent and certain other banks. This credit line increases our available liquidity and enhances our ability to invest in our business. To date, we have not drawn on the line. We are currently in compliance with all covenants under the agreement.
Stock-based Compensation—See Note 9.
47
Table of Contents
NOTE 3—INVESTMENTS
On April 3, 2009, we adopted Financial Accounting Standards Board (FASB) guidance that requires an entity to recognize the credit component of an other-than-temporary impairment of a debt security in earnings and the non-credit component in other comprehensive income (OCI) when the entity does not intend to sell the security and it is more likely than not that the entity will not be required to sell the security prior to recovery. This guidance also requires expanded disclosures about other-than-temporary impairments of debt and equity securities. These standards were effective for periods ending after June 15, 2009 and do not change the recognition of other-than-temporary impairment for equity securities.
In determining whether an other-than-temporary loss is due to credit loss, we consider many factors including, but not limited to, the adverse conditions related to a security, industry or geographic region, the failure of an issuer to make interest or principal payments, and rating changes of the security or issuer made by rating agencies.
We classify all investments maturing in one year or less as short-term and all investments maturing in more than one year as long-term.
| As of January 1, 2010 | ||||||||||||||
| Amortized cost | Gross unrealized gains |
Gross unrealized losses |
Fair value | Maturity range (in years) | ||||||||||
| (in millions) | ||||||||||||||
| Short-term Investments |
||||||||||||||
| U. S. Treasuries (HTM) |
$ | 0.5 | $ | — | $ | — | $ | 0.5 | < 1 | |||||
| Bank time deposits (AFS) |
13.0 | — | — | 13.0 | < 1 | |||||||||
| Total |
$ | 13.5 | $ | — | $ | — | $ | 13.5 | ||||||
| Long-term Investments |
||||||||||||||
| Equity securities |
||||||||||||||
| Preferred shares (AFS) |
$ | 1.1 | $ | 0.6 | $ | — | $ | 1.7 | N/A | |||||
| Debt securities |
||||||||||||||
| Auction rate securities (AFS) |
79.4 | 0.6 | 17.8 | 62.2 | 12-41 | |||||||||
| Total |
$ | 80.5 | $ | 1.2 | $ | 17.8 | $ | 63.9 | ||||||
48
Table of Contents
| As of January 2, 2009 | ||||||||||||||
| Amortized cost | Gross unrealized gains |
Gross unrealized losses |
Fair value | Maturity range (in years) | ||||||||||
| (in millions) | ||||||||||||||
| Short-term Investments |
||||||||||||||
| State and municipality issued debt (HTM) |
$ | 17.0 | $ | 0.1 | $ | — | $ | 17.1 | < 1 | |||||
| Bank time deposits (AFS) |
80.0 | — | — | 80.0 | < 1 | |||||||||
| Total |
$ | 97.0 | $ | 0.1 | $ | — | $ | 97.1 | ||||||
| Long-term Investments |
||||||||||||||
| Equity securities |
||||||||||||||
| Preferred shares (AFS) |
$ | 1.1 | $ | — | $ | — | $ | 1.1 | N/A | |||||
| Debt securities |
||||||||||||||
| Auction rate securities (AFS) |
96.1 | — | 15.9 | 80.2 | 13-42 | |||||||||
| Total |
$ | 97.2 | $ | — | $ | 15.9 | $ | 81.3 | ||||||
We classify auction rate securities (“ARS”) as available-for-sale and record them at fair value. During 2009 and 2008, certain of these securities experienced substantial declines in value. For this reason, we recorded an other-than-temporary impairment charge on these securities of $14.3 million in 2009 and $31.8 million in 2008, included in (loss) gain on certain investments. The amortized cost of these securities is reduced by the recognized losses.
The preferred shares listed in the tables above represent former ARS that were converted to preferred shares at the option of the issuer during the year ended January 2, 2009.
During 2009, we experienced a single default on an interest payment by one ARS issuer of a security with an amortized cost of $0.8 million and a fair value of $0.8 million. The security is insured and we received the scheduled interest payment from the insurer.
The following table presents a rollforward of the amount related to credit losses recognized in earnings during the year ended January 1, 2010 (in millions).
| AFS Debt Securities | |||
| Beginning balance |
$ | 21.0 | |
| Credit losses recognized in earnings |
14.3 | ||
| Ending balance |
$ | 35.3 | |
We did not recognize a non-credit component of an other-than-temporary impairment of a debt security in other comprehensive income in the year ended January 1, 2010.
The following table summarizes our securities with unrealized losses and the length of time these securities have been in a loss position as of January 1, 2010 and January 2, 2009 (in millions).
| Less than 12 months | Greater than 12 months | Total | ||||||||||||||||||
| Fair value | Gross unrealized losses |
Fair value | Gross unrealized losses |
Fair value | Gross unrealized losses |
|||||||||||||||
| Auction rate securities as of January 1, 2010 |
$ | 4.0 | $ | (0.1 | ) | $ | 51.0 | (17.7 | ) | $ | 55.0 | $ | (17.8 | ) | ||||||
| Auction rate securities as of January 2, 2009 |
$ | 20.7 | $ | (4.7 | ) | $ | 59.5 | (11.2 | ) | $ | 80.2 | $ | (15.9 | ) | ||||||
There were no gross realized gains or losses included in income during fiscal years 2009, 2008, or 2007.
49
Table of Contents
As of January 1, 2010, we have recorded a total unrealized loss of $16.6 million and a related deferred tax benefit of $5.7 million, for a net unrealized loss of $10.9 million in accumulated other comprehensive loss. We have concluded this decline is temporary for the following reasons:
| • | we do not intend to sell the securities; |
| • | we believe it is more likely than not that we will not be required to sell the securities prior to the recovery of amortized cost; and |
| • | the unrealized losses are due to conditions other than a credit loss. |
We reclassified our ARS securities to long-term from short-term in fiscal year 2008 due to the sustained illiquidity of the securities.
We may be required to record additional impairment charges if additional declines in value are determined to be other-than-temporary. The fair value of these securities has been estimated based on our fair value calculations, which could change significantly based on market conditions.
Trading investments—consisted of the following as of the dates set forth below:
Trading investments consist exclusively of a portfolio of marketable mutual funds and corporate owned life insurance in a non-qualified deferred employee compensation plan. We have an offsetting liability recorded for the investments. The funds are recorded at fair value. We recognize changes in fair value currently in gain (loss) on deferred compensation investments and we record changes in the liability in selling, general and administrative expense. We classify these investments as other non-current assets since we have no plan or intent of liquidating or otherwise using these securities in our business operations.
| January 1, 2010 |
January 2, 2009 |
December 28, 2007 | ||||||||
| (in millions) | ||||||||||
| By consolidated statement of operations line item |
||||||||||
| Gain (loss) on certain investments, net |
$ | 2.0 | $ | (3.6 | ) | $ | 0.9 | |||
| Selling, general and administrative expense (benefit) |
$ | 2.1 | $ | (3.6 | ) | $ | 0.9 | |||
| January 1, 2010 |
January 2, 2009 | |||||
| (in millions) | ||||||
| Balance sheet impact |
||||||
| Deferred compensation assets (trading) |
$ | 11.1 | $ | 8.9 | ||
| Deferred compensation liability |
$ | 11.2 | $ | 8.9 | ||
Note 4—Fair Value Measurements
In order to determine the fair value of our assets and liabilities, we utilize three levels of inputs, focusing on the most observable inputs when available. Observable inputs are generally developed based on market data obtained from independent sources, whereas unobservable inputs reflect our assumptions about what market participants would use to value the asset or liability, based on the best information available in the circumstances. The three levels of inputs are as follows:
Level 1—Quoted prices in active markets which are unadjusted and accessible as of the measurement date for identical, unrestricted assets or liabilities;
Level 2—Quoted prices in markets that are not active or for which all significant inputs are observable, either directly or indirectly;
Level 3—Prices or valuations that require inputs that are unobservable and significant to the overall fair value measurement.
We determine fair value on the following assets using these input levels.
50
Table of Contents
| Fair value as of January 1, 2010 using (in millions): | ||||||||||||
| Total | Quoted prices in active markets for identical assets (Level 1) |
Significant other observable inputs (Level 2) |
Significant unobservable inputs (Level 3) | |||||||||
| Trading investments |
$ | 11.1 | $ | 3.2 | $ | 7.9 | $ | — | ||||
| Available-for-sale securities |
76.9 | 13.0 | — | 63.9 | ||||||||
| Held to maturity securities |
0.5 | 0.5 | — | — | ||||||||
| Foreign exchange contracts |
0.3 | — | 0.3 | — | ||||||||
| $ | 88.8 | $ | 16.7 | $ | 8.2 | $ | 63.9 | |||||
For actively traded securities, we generally rely upon the valuations as provided by the custodian of these assets. For available-for-sale securities, such as illiquid auction rate securities and preferred stock, we use the present value of future expected cash flows to determine fair value. Significant judgments are required in the estimation of fair value, including assumptions about the expected holding period, yield and appropriate discount rates.
If we use more than one level of input that significantly affects fair value, we include the fair value under the lowest input level used.
The following is a reconciliation of changes in the fair market values determined using Level 3 significant unobservable inputs (in millions).
| AFS Securities |
||||
| Beginning balance as of January 2, 2009 |
$ | 81.3 | ||
| Sales |
(2.1 | ) | ||
| Recognized losses |
(14.3 | ) | ||
| Unrealized losses |
(1.0 | ) | ||
| Ending balance as of January 1, 2010 |
$ | 63.9 | ||
Recognized losses are included in (loss) gain on certain investments in the consolidated statement of operations.
NOTE 5—INVENTORIES
Inventories are summarized below (in millions):
| January 1, 2010 |
January 2, 2009 | |||||
| Finished products |
$ | 23.0 | $ | 34.9 | ||
| Work in process |
54.1 | 70.7 | ||||
| Raw materials and supplies |
4.1 | 4.0 | ||||
| Total inventories |
$ | 81.2 | $ | 109.6 | ||
As of January 1, 2010 and January 2, 2009, Intersil was committed to purchase $19.2 million and $11.5 million, respectively, of raw material inventory from suppliers.
NOTE 6—PROPERTY, PLANT AND EQUIPMENT
Property, plant and equipment are summarized below (in millions):
| January 1, 2010 |
January 2, 2009 |
|||||||
| Land |
$ | 1.8 | $ | 1.8 | ||||
| Buildings and leasehold improvements |
56.4 | 51.1 | ||||||
| Machinery and equipment |
237.4 | 233.8 | ||||||
| Total property, plant and equipment |
295.6 | 286.7 | ||||||
| Accumulated depreciation and leasehold amortization |
(193.3 | ) | (173.9 | ) | ||||
| Total property, plant and equipment, net |
$ | 102.3 | $ | 112.8 | ||||
51
Table of Contents
The estimated useful lives of buildings, which include leasehold improvements, range between 10 and 30 years. The estimated useful lives of machinery and equipment range between three and eight years. Depreciation and amortization expense was $20.8 million, $22.5 million and $20.5 million for fiscal years 2009, 2008 and 2007, respectively.
In 2008, we reclassified $2.6 million of certain equipment as held for sale and recorded losses of $1.0 million in fiscal year 2009 and $2.1 million in fiscal year 2008 to record these assets at their estimated fair value less cost to sell. This loss was recorded in the cost of revenue line item in our consolidated statement of operations. We do not record depreciation on assets held for sale.
NOTE 7—ACQUISITIONS
On August 6, 2009, we acquired 100% of Quellan, Inc. (“Quellan”), a privately held leader in the design of high performance analog signal processing integrated circuits, for approximately $13.8 million in cash and contingent consideration of $3.3 million.
Based in Santa Clara, California, Quellan utilizes a proprietary Collaborative Signal Processing (CSP) architecture to apply adaptive noise cancellation and equalization within the analog domain. This unique approach enables Quellan’s ICs to address signal loss, dispersion, skew and noise in high-speed signal processing applications. Quellan’s Q:ACTIVE technology will provide improved performance, smaller footprint and lower power solutions for communications and networking infrastructure, high-performance computing, storage and consumer electronics applications. We believe Quellen’s technology will enable us to further penetrate new and existing high-margin markets.
Acquisition related costs were approximately $0.9 million in 2009 and include acquisition costs for Rock Semiconductor (see Note 23). Under the provisions of ASC 805, Business Combinations (SFAS 141R), which was effective for business acquisitions occurring after December 15, 2008, we have recorded fiscal year 2009 acquisition costs in selling, general and administrative expense in the accompanying consolidated financial statements .
During the third quarter of 2008, we purchased D2Audio Corporation (“D2Audio”) and Kenet, Incorporated (“Kenet”). D2Audio was a privately-held fabless semiconductor company with leading technology in the design of digital audio power amplifiers. Kenet was a privately-held, fabless semiconductor company with leading technology in the design of high-speed, extremely low power data converters. During the fourth quarter of 2008, we purchased Zilker Labs (“Zilker”), a privately-held, fabless semiconductor company with technology leadership in high efficiency digital power integrated circuits.
The purchase consideration for the 2008 acquisitions was $44.7 million in cash paid to complete the mergers, net of cash and cash equivalents received for the three companies, and for professional fees and the assumption of certain liabilities. Based on our evaluations, which are complete, the acquisitions included approximately $13.2 million of definite-lived intangible assets, which are amortized over six months to seven years, and goodwill of approximately $19.2 million. In addition, approximately $2.8 million of in-process research and development (“IPR&D”) was expensed as a result of the acquisitions. The value of purchased IPR&D was determined using an income approach. Purchased research and development was written off as of the time of acquisition and is shown as a separate line item in the accompanying consolidated statements of operations.
Included in the 2008 purchases is a $3.2 million remaining liability as of January 1, 2010 recorded as holdback from the consideration at the initial closing of the purchases in 2008 representing an amount that may be used to cover costs that arise in connection with the representations and warranties made by the management of each company. This holdback, or some portion thereof, may be payable within one year to 18 months of the acquisition dates based on such costs.
All three 2008 purchase agreements contain provisions for additional consideration to the former stockholders of the businesses if revenues during a defined period exceed a base amount. The maximum remaining payout under all provisions is $14.0 million, based on excess revenue through July 2010. No amount for additional consideration was recorded at the time of the acquisition. The amount of the additional consideration, if any, that is earned based on the excess revenue provisions of the agreements will be recorded as an increase in goodwill at the time the contingency is resolved.
The results of operations of all acquirees, which are immaterial individually and in the aggregate, are included in our consolidated statements of operations from the respective dates of the acquisitions.
52
Table of Contents
The preliminary allocation of the aggregate purchase price is summarized as follows:
| Purchases in 2009 | Purchases in 2008 | |||||||
| (in millions) | ||||||||
| Intangible assets: |
||||||||
| Definite-lived: developed technologies |
$ | 6.2 | $ | 10.1 | ||||
| Definite-lived: other |
2.7 | 3.1 | ||||||
| Indefinite-lived: goodwill |
1.2 | 19.2 | ||||||
| Deferred tax assets |
9.1 | 10.7 | ||||||
| Other tangible net assets, excluding cash and cash equivalents |
(2.1 | ) | (1.2 | ) | ||||
| In-process research and development |
— | 2.8 | ||||||
| Total purchase price, net of cash and cash equivalents acquired |
$ | 17.1 | $ | 44.7 | ||||
The definite-lived developed technology purchased will be amortized over a five-year or five and one-half-year life.
Other definite-lived intangible assets include backlog, customer relationships, and intellectual property. These assets have amortization lives ranging from six months to seven years with a weighted average of 3.8 years.
We are responsible for the preliminary and final valuation estimates. The value of purchased in-process research and development was determined using an income approach. Purchased in-process research and development prior to January 2, 2009 was written off as of the time of acquisition and is shown as a separate line item in the accompanying consolidated statements of operations.
Additional consideration of $4.6 million for a holdback provision was paid in the third quarter of 2008 for the purchase of Planet ATE in 2007. This amount was recorded as an increase in goodwill.
Pro-forma financial information of the combined entities is not presented due to immateriality of the financial results of the acquired entities, individually and in the aggregate.
NOTE 8—INTANGIBLE ASSETS
Purchased intangibles—Purchased intangibles are definite-lived intangible assets which are amortized on a straight-line basis over their estimated useful lives. Substantially all of our purchased intangibles consist of multiple elements of developed technology which has estimated useful lives of three to 11 years. Other purchased intangibles consist of other identifiable assets, primarily customer relationships with an estimated useful life of five years.
| As of January 1, 2010 | As of January 2, 2009 | |||||||||||
| Gross carrying amount |
Accumulated amortization |
Gross carrying amount |
Accumulated amortization | |||||||||
| (in millions) | ||||||||||||
| Definite-lived: developed technologies |
$ | 80.8 | $ | 60.7 | $ | 73.2 | $ | 49.9 | ||||
| Definite-lived: other |
11.1 | 4.6 | 8.0 | 2.2 | ||||||||
| Total |
$ | 91.9 | $ | 65.3 | $ | 81.2 | $ | 52.1 | ||||
We recorded amortization expense as follows:
| January 1, 2010 |
January 2, 2009 |
December 28, 2007 | |||||||
| (in millions) | |||||||||
| By income statement line item |
|||||||||
| Amortization of purchased intangibles |
$ | 12.7 | $ | 12.2 | $ | 10.7 | |||
| Cost of revenues |
$ | 0.5 | $ | 0.1 | $ | — | |||
53
Table of Contents
Expected amortization expense by year to the end of the current amortization schedule is the following:
| (in millions) | |||
| To be recognized in: |
|||
| Fiscal year 2010 |
$ | 9.9 | |
| Fiscal year 2011 |
6.8 | ||
| Fiscal year 2012 |
5.6 | ||
| Fiscal year 2013 |
2.9 | ||
| Fiscal year 2014 |
1.2 | ||
| Thereafter |
0.2 | ||
| Total expected amortization expense |
$ | 26.6 | |
Goodwill—is an indefinite-lived intangible asset that is not amortized, but instead is tested for impairment annually or more frequently if indicators of impairment exist. The following table summarizes changes in net goodwill balances for our one reportable segment:
| Year Ended | ||||||||
| January 1, 2010 | January 2, 2009 | |||||||
| (in millions) | ||||||||
| Gross goodwill balance as of beginning of period |
$ | 1,468.4 | $ | 1,445.8 | ||||
| Accumulated impairment charge |
(1,154.7 | ) | (1,154.7 | ) | ||||
| Purchase of Planet ATE |
— | 3.8 | ||||||
| Purchase of Kenet |
0.2 | 19.0 | ||||||
| Purchase of Quellan |
1.2 | — | ||||||
| Goodwill adjustment resulting from purchase of Elantec Inc. |
(0.2 | ) | (0.1 | ) | ||||
| Goodwill adjustment resulting from purchase of Xicor |
(0.2 | ) | (0.1 | ) | ||||
| Goodwill balance as of end of period |
$ | 314.7 | $ | 313.7 | ||||
The decrease to the Elantec and Xicor-related goodwill in both years resulted from the tax benefit received due to the exercise of vested stock options issued as part of the respective acquisitions. The increase to Planet ATE goodwill in 2008 related to the $4.6 million holdback provision offset by adjustments to the deferred tax assets recorded in the purchase. See Note 7 relating to acquisitions for further discussion.
We perform an annual test of goodwill in the fourth quarter of the fiscal year. In 2009, we recorded no impairment of goodwill based on our analysis. The fair value of the reporting units was significantly in excess of the carrying value as of October 3, 2009, the date in which we performed our test.
In 2008, we recorded an impairment loss of $1,154.7 million against our goodwill in the fourth quarter, calculated as the excess of carrying amount of goodwill over the implied fair value of goodwill in our reporting units.
We perform a goodwill impairment analysis using the two-step method on an annual basis and whenever events or changes in circumstances indicate that the carrying value may not be recoverable. The recoverability of goodwill is measured at the reporting unit level by comparing the reporting unit’s carrying amount, including goodwill, to the fair market value of the reporting unit. During 2009, we had two reporting units for the purpose of the analysis – analog and mixed signal and power management. During 2008, we had five reporting units for purposes of the analysis—analog and mixed signal, computing, consumer, industrial and communication, and specialty. The first step of the goodwill impairment test (“Step One”) is to identify potential impairment. If the fair value of a reporting unit exceeds its carrying amount, no impairment of the goodwill of the reporting unit is indicated and the second step of the impairment test is unnecessary. However, if the carrying amount of a reporting unit exceeds its fair value, the second step of the goodwill impairment test (“Step Two”) is performed to measure the amount of impairment loss, if any.
In 2008, we performed our annual testing for impairment of goodwill as of the beginning of our fourth fiscal quarter and based on Step One, we determined that three reporting units indicated potential impairment. We then performed Step Two, which involves calculating the implied fair value of our goodwill by allocating the fair value of the reporting units to all of our assets and liabilities other than goodwill (including both recognized and unrecognized intangible assets) and comparing the residual amount to the carrying value of goodwill.
For the purposes of this analysis, our estimates of fair value were based on an equal weighting of the income approach, which estimates the fair value of our reporting units based on the future discounted cash flows, and the market approach, which estimates the fair value of our reporting units based on comparable market prices. The use of projected discounted future results (discounted cash flow approach) is based on assumptions that are consistent with our estimates of future growth and the strategic plan used to manage the underlying business, and also includes a probability-weighted expectation as to our future cash flows. Factors requiring significant judgment include assumptions related to future growth rates, discount factors, market multiples and tax rates, amongst other considerations. Changes in economic and operating conditions that occur after the annual impairment analysis or an interim impairment analysis, and that impact these assumptions, may result in a future goodwill impairment charge.
54
Table of Contents
Based on the comparison of the residual amount of goodwill, determined after the allocation of fair value to the reporting unit assets and liabilities, to the carrying value of our goodwill as of October 4, 2008, we recorded an initial goodwill impairment charge of $862.5 million in the fourth quarter of 2008.
Further, during the fourth quarter of 2008, we concluded that sufficient indicators existed to require us to perform another goodwill impairment analysis as of November 28, 2008. We made this determination based upon a combination of factors, including the significant and sustained decline in our market capitalization below our book value, the deteriorating macro-economic environment which resulted in a significant decline in customer demand during the fourth quarter of 2008 and illiquidity in the overall credit markets. Step One of the analysis as of November 28, 2008 also indicated potential impairment for three of our reporting units and we further performed the Step Two allocation of the fair value of the reporting units to the reporting units assets and liabilities (including both recognized and unrecognized intangible assets.)
Based on the comparison of the residual amount of goodwill, determined after the allocation of fair value to the reporting unit assets and liabilities, to the carrying value of our goodwill, we recorded an additional impairment charge of $292.2 million.
Goodwill as of January 1, 2010 was $314.7 million. If we experience further significant declines in our stock price, market capitalization or future expected cash flows, further significant adverse changes in the business climate or continuing slower growth rates, we may need to perform additional impairment analysis of our goodwill in future periods prior to our annual test in the fourth quarter. We can provide no assurance that the significant assumptions used in our analysis will not change substantially and any additional analysis could result in additional impairment charges.
The adjusted carrying amount of goodwill will be the new accounting basis.
We review long-lived assets, including intangible assets subject to amortization, which are our developed technology, backlog, customer relationships and intellectual property, for impairment whenever events or changes in circumstances indicate that the carrying amount of such assets may not be recoverable. We measure recoverability of long-lived assets by comparing the carrying amount of the asset group to the future undiscounted net cash flows expected to be generated by those assets. If such assets are considered to be impaired, we recognize an impairment charge for the amount by which the carrying amounts of the assets exceeds the fair value of the assets. As a result of the impairment indicators described above, during the fourth fiscal quarter of 2008, we tested our long-lived assets for impairment and determined that there was no impairment.
NOTE 9—STOCK-BASED COMPENSATION
Share-based Payment Arrangements—As of January 1, 2010, our 2008 Equity Compensation Plan (2008 Plan) included several available forms of stock compensation of which only stock options (Options) and stock awards (Awards) have been granted to date. Awards issued consist of deferred stock units and restricted stock units, which may differ in regard to the timing of the related prospective taxable event to the recipient. Additionally, we have issued Options in exchange for outstanding stock options under various plans of acquired companies (Acquired Plans). We also have the 2000 Employee Stock Purchase Plan (ESPP) whereby eligible employees can purchase shares of Intersil common stock.
These plans are summarized below:
| Equity Compensation Arrangement |
Total Number of Shares in Arrangement |
Shares Outstanding as of January 1, 2010 |
Shares Available for Issuance at January 1, 2010 | |||
| (shares in thousands) | ||||||
| 1999 Plan |
36,250 | 6,979 | — | |||
| 2008 Plan |
19,312 | 6,573 | 10,556 | |||
| Acquired Plans |
— | 1,243 | — | |||
| ESPP |
4,584 | — | 1,821 | |||
| 60,146 | 14,795 | 12,377 | ||||
The ESPP permits employees to purchase common stock through payroll deductions, which may not exceed 10% of an employee’s compensation, at a price not less than 85% of the market value of the stock on specified dates. Those dates are the last trading day in March and September, with settlement in the following respective month. In no event may any participant purchase more than $25,000 worth of shares in any calendar year and an employee may purchase no more than 16,667 shares on any purchase date.
Grant Date Fair Values and Underlying Assumptions; Contractual Terms—We estimate the fair value of each Option as of the date of grant using a lattice model. The fair value of Awards as of the date of grant is the market value of our common stock on that date. The ESPP fair value is the amount of the discount the employee obtains as of the date of the purchase transaction.
55
Table of Contents
The fair value of an Option grant (compensation cost) is calculated by us on the date of grant using a lattice model. This compensation cost is then amortized straight-line over the period relating to service conditions (vesting period). Calculating fair value requires us to estimate key assumptions, especially volatility, which determine the fair value of the stock option. See the table below for a presentation of the values for certain of these key assumptions. Volatility is one of the most significant determinants of fair value in both models. We estimate our volatility using a blend of estimated price movement activity implied by our traded options and the actual historic volatility of our stock price. Our risk-free interest rate is estimated by using the zero-coupon U.S. Treasury rate at the time of the grant related to the expected term of the grant. We estimate the annualized dividend yield by dividing the current annualized dividend by the closing stock price on the date of grant. Additionally, we estimate the expected life of the option at the time of grant, based on historical information. The estimate of these key assumptions is based on historical information and judgment regarding future expectations and are re-examined on a regular basis. When such re-examinations of the key assumptions lead to significant changes to the calculation inputs, it can have a material affect on the amount of stock-based compensation that will be recognized in aggregate or in any period. This may mean more volatility in reported operating results due to changes in facts and circumstances surrounding our use of stock compensation.
For Options granted in fiscal year 2009 and 2008, we estimated the fair value of each Option as of the date of grant using a lattice model with the following assumptions:
| Year ended January 1, 2010 | Year ended January 2, 2009 | |||
| Range of expected volatilities |
37.3 – 51.1% | 35.2 – 51.5% | ||
| Weighted average volatility |
42.5% | 38.2% | ||
| Range of dividend yields |
3.20 – 5.04% | 1.69 – 5.63% | ||
| Weighted average dividend yield |
3.82% | 2.25% | ||
| Range of risk-free interest rates |
2.0 – 5.3% | 2.1 – 3.2% | ||
| Weighted average risk-free interest rate |
3.28% | 2.44% | ||
| Range of expected lives, in years |
4.9 – 5.7 | 3.3 – 5.7 | ||
| Weighted average expected life, in years |
5.5 | 4.3 |
Most Options granted under the 1999 and 2008 Plans since April 2004 vest ratably over three or four years and generally have seven year contract lives (generally 10 year contract lives prior to April 2004). For Awards, the expected life for amortization of the grant date fair value is the vesting term, generally three years in the case of deferred stock units and four years in the case of restricted stock units.
On October 6, 2009, our shareholders approved a proposal to allow for a one-time stock option exchange program to provide eligible employees an opportunity to exchange certain outstanding underwater stock options for a lesser amount of new options. The exchange program was designed to increase the retentive and incentive value of our equity compensation program without incurring significant additional stock-based expense. Stock options with an exercise price between $22.00 and $35.99 were eligible for exchange for new options with an option price of $13.08, the closing stock price on November 6, 2009, the date of the exchange. In the exchange, 5,682,114 old option shares were exchanged for 2,011,627 shares of new options, granted out of the 2008 Equity Compensation Plan. The tendered old option shares were cancelled in the exchange. The exchange resulted in $1.1 million of incremental future compensation. The incremental future compensation and the unrecognized compensation on the old options will be recognized over the lesser of the requisite service period or the vesting term of the new options.
56
Table of Contents
Information Regarding Options and Awards—Information about Options and Awards as of January 1, 2010 and activity for Options and Awards for the three fiscal years then ended is presented below:
| Options | Awards | Aggregate Information | |||||||||||||||
| Shares | Weighted Average Exercise Price (per share) |
Weighted Average Remaining Contract Lives (Yrs.) |
Shares | Aggregate Intrinsic Value |
Aggregate Unrecognized Compensation Cost | ||||||||||||
| (in thousands) | (in thousands) | (in millions) | (in millions) | ||||||||||||||
| Outstanding as of December 29, 2006 |
22,079 | $ | 23.06 | 5.3 | 749 | ||||||||||||
| Granted |
2,520 | 27.09 | 867 | ||||||||||||||
| Exercised(1) |
(5,923 | ) | 18.72 | (145 | ) | ||||||||||||
| Canceled |
(1,308 | ) | 23.13 | (60 | ) | ||||||||||||
| Outstanding as of December 28, 2007 |
17,368 | $ | 24.91 | 4.7 | 1,411 | ||||||||||||
| Granted |
2,385 | 23.21 | 1,080 | ||||||||||||||
| Exercised(1) |
(1,178 | ) | 15.78 | (343 | ) | ||||||||||||
| Canceled |
(2,843 | ) | 31.15 | (240 | ) | ||||||||||||
| Outstanding as of January 2, 2009 |
15,732 | $ | 24.21 | 3.7 | 1,908 | ||||||||||||
| Granted |
4,591 | 12.62 | 1,294 | ||||||||||||||
| Performance adjustment |
— | — | 45 | ||||||||||||||
| Exercised(1) |
(348 | ) | 6.08 | (511 | ) | ||||||||||||
| Canceled(2) |
(7,706 | ) | 26.15 | (209 | ) | ||||||||||||
| Outstanding as of January 1, 2010 |
12,269 | $ | 19.18 | 4.2 | 2,527 | $ | 55.5 | $ | 42.6 | ||||||||
| As of January 1, 2010 |
|||||||||||||||||
| Exercisable/vested(1) |
6,769 | $ | 23.10 | 2.6 | 92 | $ | 5.1 | — | |||||||||
| Unexercisable/unvested |
5,500 | $ | 14.35 | 6.3 | 2,435 | $ | 50.4 | $ | 42.6 | ||||||||
| Number vested and expected to ultimately vest |
12,095 | $ | 19.27 | 4.2 | 2,057 | $ | 47.9 | ||||||||||
| (1) | Awards exercised are those that have reached full vested status and been delivered to the recipients as a taxable event due to elective deferral available in the case of deferred stock units. Deferred stock units for which the deferral is elected timely are vested but still outstanding as Awards. Total un-issued shares related to deferred stock units as of January 1, 2010 were 92,000 shares as shown in the Awards column as Exercisable/vested. |
| (2) | Includes 5,682,114 shares cancelled in our option exchange program. |
| Options | Awards | Aggregate | |||||||
| Weighted average fair value per share |
$ | 4.02 | $ | 12.23 | $ | 5.82 | |||
The weighted average recognition period for this compensation cost is 2.9 years. As of January 1, 2010, the unrecognized compensation cost expected to be recognized over a period of 4.0 actual years is as follows:
| (in millions) | |||
| To be recognized in: |
|||
| Fiscal year 2010 |
$ | 19.5 | |
| Fiscal year 2011 |
13.5 | ||
| Fiscal year 2012 |
7.4 | ||
| Fiscal year 2013 |
2.2 | ||
| Total unrecognized compensation cost |
$ | 42.6 | |
57
Table of Contents
This table contains information with respect to stock options outstanding and stock options exercisable, presented in exercise price ranges:
| Exercise Price Ranges |
Options Outstanding |
Options Outstanding —Weighted Average Remaining Contract Lives (Yrs.) |
Options Outstanding —Weighted Average Exercise Price (per share) |
Options Vested |
Options Vested— Weighted Average Exercise Price (per share) | |||||||
| (in thousands) | (in thousands) | |||||||||||
| $ 2.74 – $11.75 |
750 | 3.6 | $ | 8.59 | 397 | $ | 6.89 | |||||
| $12.02 – $12.02 |
1,929 | 6.2 | $ | 12.02 | — | — | ||||||
| $12.35 – $13.00 |
142 | 4.6 | $ | 12.82 | 74 | $ | 12.85 | |||||
| $13.08 – $13.08 |
2,008 | 6.8 | $ | 13.08 | — | — | ||||||
| $13.35 – $17.08 |
1,622 | 3.8 | $ | 15.92 | 1,142 | $ | 16.23 | |||||
| $17.16 – $19.96 |
1,358 | 2.7 | $ | 18.42 | 1,358 | $ | 18.43 | |||||
| $20.12 – $26.29 |
1,441 | 2.4 | $ | 23.92 | 1,360 | $ | 23.94 | |||||
| $26.41 – $26.77 |
1,331 | 4.4 | $ | 26.63 | 831 | $ | 26.66 | |||||
| $26.85 – $34.50 |
1,368 | 2.5 | $ | 30.34 | 1,287 | $ | 30.39 | |||||
| $37.07 – $79.01 |
320 | 0.7 | $ | 47.77 | 320 | $ | 47.77 | |||||
| As of January 1, 2010 |
12,269 | $ | 19.18 | 6,769 | $ | 23.10 | ||||||
Our ESPP has purchase settlement dates in the second and fourth quarters. The ESPP does not have a lookback option provision.
| Additional Disclosures |
Year ended January 1, 2010 |
Year ended January 2, 2009 |
Year ended December 28, 2007 | ||||||
| (in millions, except share data) | |||||||||
| Shares issued under the employee stock purchase plan |
475,496 | 328,122 | 202,500 | ||||||
| Aggregate intrinsic value of stocks options exercised |
$ | 2.7 | $ | 11.5 | $ | 65.7 | |||
We issue new shares of common stock upon the exercise of Options.
The following table is a summary of the number and weighted average grant date fair values regarding our unexercisable/unvested Options and Awards as of January 1, 2010 and changes during the fiscal year then ended:
| Options Unvested |
Options—Weighted Average Grant Date Fair Values |
Awards Unvested |
Awards—Weighted Average Grant Date Fair Values | |||||||||
| (in thousands) | ||||||||||||
| Unvested as of January 2, 2009 |
4,837 | $ | 7.25 | 1,853 | $ | 24.99 | ||||||
| Granted |
4,591 | $ | 4.02 | 1,294 | $ | 12.23 | ||||||
| Vested |
(2,043 | ) | $ | 7.67 | (503 | ) | $ | 26.32 | ||||
| Forfeited |
(1,885 | ) | $ | 7.28 | (209 | ) | $ | 21.91 | ||||
| Unvested as of January 1, 2010 |
5,500 | $ | 4.39 | 2,435 | $ | 18.20 | ||||||
58
Table of Contents
Financial Statement Effects and Presentation—the following table shows total stock-based compensation expense for the periods indicated that are included in the Consolidated Statement of Operations:
| Year ended January 1, 2010 |
Year ended January 2, 2009 |
Year ended December 28, 2007 | |||||||
| (in millions) | |||||||||
| By statement of operations line item |
|||||||||
| Cost of revenue |
$ | 2.4 | $ | 3.5 | $ | 4.1 | |||
| Research and development |
11.6 | 13.2 | 15.3 | ||||||
| Selling, general and administrative |
12.9 | 14.1 | 24.8 | ||||||
| By stock type |
|||||||||
| Stock options |
$ | 15.2 | $ | 19.0 | $ | 31.8 | |||
| Restricted and deferred stock awards |
10.7 | 10.8 | 11.6 | ||||||
| Employee stock purchase plan |
0.9 | 1.0 | 0.9 | ||||||
| January 1, 2010 | January 2, 2009 | |||||
| (in millions) | ||||||
| Stock-based compensation capitalized in inventory |
$ | 0.9 | $ | 0.7 | ||
Performance-based Grants—As of January 1, 2010, we had stock awards outstanding that include the usual service conditions as well as performance conditions relating to revenue and operating income relative to internal goals and performance by other companies in our industry. Under the terms of the agreements, participants may receive from 0% – 150% of the original grant.
As a result of the performance condition requirement, these grants are evaluated periodically for the estimated number of shares that might be issued when fully vested. The fair value measurement and its effect on income is appropriately adjusted as a result of these periodic evaluations. The total fair value measurement with regard to the performance-based grants which are outstanding as of year-end, which is to be recognized as compensation cost over the performance period, was $10.6 million. If our estimate of the number of shares expected to be earned (vested) changes, we will be required to adjust the amount of stock-based compensation recognized for the service provided to the date of the change in estimate, on a cumulative basis, to reflect the higher or lower number of shares expected to vest. Such adjustments could materially increase or decrease the amounts of stock-based compensation recognized in any period, particularly the period of the change in the estimate, and in aggregate as compared to the initial fair value measurement. Therefore, the use of performance-based forms of stock-based compensation can cause more volatility in our net income in various periods and in aggregate.
| January 1, 2010 | ||
| (in thousands) | ||
| Performance-based deferred stock units (PDSU) outstanding |
755.4 | |
| Maximum PDSU shares that could be issued assuming the highest level of performance |
1,134.2 | |
| PDSU shares expected to vest |
674.6 |
59
Table of Contents
NOTE 10—EARNINGS (LOSS) PER SHARE
The following table sets forth the computation of basic and diluted earnings (loss) per share ($ in thousands, except per share amounts):
| Year ended | |||||||||||
| January 1, 2010 |
January 2, 2009 |
December 28, 2007 |
|||||||||
| Numerator |
|||||||||||
| Net income (loss) from continuing operations |
$ | 38,565 | $ | (1,062,502 | ) | $ | 142,739 | ||||
| Net income (loss) from discontinued operations |
— | 24,942 | (2,263 | ) | |||||||
| Net income (loss) to common shareholders (numerator for basic and diluted earnings per share) |
$ | 38,565 | $ | (1,037,560 | ) | $ | 140,476 | ||||
| Denominator |
|||||||||||
| Denominator for basic earnings (loss) per share weighted average common shares |
122,250 | 123,724 | 132,508 | ||||||||
| Effect of dilutive securities: |
|||||||||||
| Stock options, awards and warrants |
55 | — | 1,500 | ||||||||
| Denominator for diluted earnings (loss) per share adjusted—weighted average common shares |
122,305 | 123,724 | 134,008 | ||||||||
| Basic earnings (loss) per share |
|||||||||||
| Continuing operations |
$ | 0.32 | $ | (8.59 | ) | $ | 1.08 | ||||
| Discontinued operations |
— | 0.20 | (0.02 | ) | |||||||
| Net income (loss) per share |
$ | 0.32 | $ | (8.39 | ) | $ | 1.06 | ||||
| Diluted earnings (loss) per share |
|||||||||||
| Continuing operations |
$ | 0.32 | $ | (8.59 | ) | $ | 1.07 | ||||
| Discontinued operations |
— | 0.20 | (0.02 | ) | |||||||
| Net income (loss) per share |
$ | 0.32 | $ | (8.39 | ) | $ | 1.05 | ||||
| Anti-dilutive shares not included in the above calculations |
|||||||||||
| Awards |
2,137 | 1,908 | 394 | ||||||||
| Options |
15,402 | 15,732 | 4,270 | ||||||||
NOTE 11—RESTRUCTURING
During the quarter ended March 28, 2008, we initiated a restructuring plan to reorganize certain operations, consolidate internal manufacturing facilities and reduce workforce. We announced an additional plan to reduce our global workforce and other operating costs in November 2008. During the year ended January 1, 2010, we recorded expenses for severance costs and legal and professional costs of approximately $2.1 million related to these activities. During the year ended January 2, 2009, we recorded expenses for severance costs, fixed assets, legal and professional costs and lease exit costs of approximately $8.7 million. We recorded no restructuring costs during the year ended December 28, 2007.
60
Table of Contents
Other accrued liabilities relating to the restructuring are summarized below (in millions).
| Liability balance as of December 28, 2007 |
$ | — | ||
| Costs incurred |
||||
| Severance costs |
5.3 | |||
| Lease exit costs |
0.8 | |||
| Severance payments |
(1.3 | ) | ||
| Lease payments |
(0.7 | ) | ||
| Liability balance as of January 2, 2009 |
$ | 4.1 | ||
| Costs incurred |
||||
| Severance costs |
1.3 | |||
| Severance payments |
(5.1 | ) | ||
| Liability balance as of January 1, 2010 |
$ | 0.3 | ||
NOTE 12—LEASES AND COMMITMENTS
Total rental expense from continuing operations amounted to $9.0 million, $8.9 million and $6.9 million for fiscal years 2009, 2008 and 2007, respectively. Future minimum lease commitments under non-cancelable operating leases primarily related to land and office buildings amounted to approximately $25.1 million as of January 1, 2010.
The following table sets forth future contractual obligations and off balance sheet arrangements, which are generally non-cancellable, as of January 1, 2010 (in millions):
| 2010 | 2011 | 2012 | 2013 | 2014 | Thereafter | |||||||||||||
| Future minimum lease commitments |
$ | 9.4 | $ | 8.2 | $ | 4.1 | $ | 2.6 | $ | 0.7 | $ | 0.1 | ||||||
| Open capital asset purchase commitments |
1.3 | — | — | — | — | — | ||||||||||||
| Open raw material purchase commitments |
43.2 | 20.9 | 20.9 | 16.3 | 11.5 | — | ||||||||||||
| Other purchase commitments |
2.4 | 1.5 | 1.4 | 1.0 | — | — | ||||||||||||
| Standby letters of credit |
2.4 | — | — | — | — | — | ||||||||||||
| $ | 58.7 | $ | 30.6 | $ | 26.4 | $ | 19.9 | $ | 12.2 | $ | 0.1 | |||||||
Future minimum lease commitments consist primarily of leases for buildings and other real property. Open capital asset purchase commitments primarily include test, assembly and production equipment. Open raw material purchase commitments are comprised of minimum purchase contracts and purchase orders for foundry wafers, silicon wafers, as well as other miscellaneous items. We utilize standby letters of credit primarily for security for workers compensation, environmental items, and as security for our vendors.
NOTE 13—COMMON STOCK AND DIVIDENDS
Common Stock—Intersil shareholders approved an Amended and Restated Certificate of Incorporation in 2005 that restated authorized capital stock to consist of 600 million shares of Intersil Class A common stock, par value $0.01 per share, and 2 million shares of preferred stock. Holders of Class A common stock are entitled to one vote for each share held. The Board of Directors has broad discretionary authority to designate the terms of the preferred stock should it be issued.
We immediately retire shares of Class A common stock repurchased under plans approved by our Board of Directors (see Note 14).
61
Table of Contents
The table below summarizes the Class A common stock issuance, repurchase and retirement activity for all periods presented:
| Year Ended | |||||||||||
| January 1, 2010 |
January 2, 2009 |
December 28, 2007 |
|||||||||
| ($ in millions, except per share amounts; shares in thousands) | |||||||||||
| Beginning Balance | 121,626 | 126,990 | 135,921 | ||||||||
| Shares issued under stock plans, net of shares withheld for taxes |
1,190 | 1,741 | 6,255 | ||||||||
| Repurchase/retirement of shares |
— | (7,105 | ) | (15,186 | ) | ||||||
| Ending Balance | 122,816 | 121,626 | 126,990 | ||||||||
| Dividends Paid | $ | 58.7 | $ | 59.8 | $ | 53.4 | |||||
| Dividends paid per share | $ | 0.48 | $ | 0.48 | $ | 0.40 | |||||
Dividends—we have paid a quarterly dividend since September 2003. In January 2010, the Board declared a dividend of $0.12 per share for the first quarter of 2010, an indicated annual rate of $0.48 per share. Dividends in the future will be declared at the discretion of the Board of Directors upon consideration of business conditions, liquidity and outlook.
NOTE 14—SHARE REPURCHASES; TREASURY SHARES
Since 2001, we have periodically repurchased our Class A common shares on the open market acting under plans authorized by the Board of Directors. The primary purpose of the share repurchases has been to return cash generated by the business to shareholders. A secondary objective has been to offset the dilution from employee stock option exercises.
The following table presents a summary of the stock repurchase programs that have been authorized by the Board of Directors since this strategy has been adopted:
| Plan Approval |
Plan Term | Approved Amount |
Repurchased Amount | |||||
| Prior to fiscal year 2005 |
— | $ | 300 million | $ | 300 million | |||
| November 2005 |
1 year | $ | 150 million | $ | 150 million | |||
| May 2006 |
1 year | $ | 150 million | $ | 150 million | |||
| December 2006 |
1 year | $ | 400 million | $ | 400 million | |||
| October 2007 |
1 year | $ | 400 million | $ | 207 million | |||
| October 2008 |
2 months | $ | 15 million | $ | 15 million | |||
|
|
Total: $1,222 million through January 1, 2010 | |||||||
The number of shares to be repurchased and the timing of purchases will be based on a variety of factors, including general market conditions and the market price and trading volume of its shares. Shares are immediately retired upon repurchase.
NOTE 15—INCOME TAXES
Income tax expense (benefit)—the provision (benefit) for income taxes from continuing operations is summarized below (in millions):
| Year Ended | ||||||||||||
| January 1, 2010 |
January 2, 2009 |
December 28, 2007 |
||||||||||
| Current taxes: |
||||||||||||
| Federal |
$ | 33.9 | $ | (14.3 | ) | $ | 35.6 | |||||
| State |
0.3 | 0.1 | 3.0 | |||||||||
| Foreign |
3.9 | 8.0 | 10.9 | |||||||||
| 38.1 | (6.2 | ) | 49.5 | |||||||||
| Deferred taxes: |
||||||||||||
| Federal |
(30.7 | ) | (0.6 | ) | (9.4 | ) | ||||||
| State |
0.2 | 1.5 | 0.9 | |||||||||
| (30.5 | ) | 0.9 | (8.5 | ) | ||||||||
| Income tax expense (benefit) from continuing operations | $ | 7.6 | $ | (5.3 | ) | $ | 41.0 | |||||
62
Table of Contents
The benefit related to tax deductions from the exercise of non-qualified stock options is recorded as an increase to additional paid-in capital when realized. As a result of the exercise of non-qualified stock options, the disqualifying disposition of incentive stock options, the release of stock awards and the disqualifying disposition of shares acquired under the ESPP, we realized tax benefits of approximately $3.4 million, $6.3 million and $20.7 million during fiscal years 2009, 2008 and 2007, respectively.
The (benefit) provision for income taxes is included in the consolidated statements of operations as follows (in millions):
| Year Ended | ||||||||||
| January 1, 2010 |
January 2, 2009 |
December 28, 2007 | ||||||||
| Income tax expense (benefit) from continuing operations |
$ | 7.6 | $ | (5.3 | ) | $ | 41.0 | |||
| Income tax (benefit) expense from discontinued operations |
— | (25.0 | ) | 1.9 | ||||||
| Total income tax expense (benefit) |
$ | 7.6 | $ | (30.3 | ) | $ | 42.9 | |||
Deferred income taxes—the components of deferred income tax assets and liabilities are as follows (in millions):
| January 1, 2010 | January 2, 2009 | |||||||||||||||
| Current | Non- Current |
Current | Non- Current |
|||||||||||||
| Inventory |
$ | 16.2 | $ | — | $ | 13.6 | $ | — | ||||||||
| Property, plant and equipment |
— | 1.4 | — | 2.0 | ||||||||||||
| Accrued expenses |
10.0 | — | 15.9 | — | ||||||||||||
| Stock-based compensation |
— | 16.8 | — | 18.4 | ||||||||||||
| Net operating loss carryforward |
2.0 | 26.0 | 4.9 | 12.8 | ||||||||||||
| Capitalized research and development |
— | 9.7 | — | 11.9 | ||||||||||||
| Unrealized losses on AFS securities |
— | 2.4 | — | 5.2 | ||||||||||||
| Impairment on ARS |
— | 1.1 | — | 6.3 | ||||||||||||
| Deferred compensation |
— | 5.0 | — | 4.9 | ||||||||||||
| Tax credits |
— | 34.4 | 2.0 | — | ||||||||||||
| All other, net |
0.1 | 2.9 | 0.1 | 3.2 | ||||||||||||
| Deferred tax assets |
28.3 | 99.7 | 36.5 | 64.7 | ||||||||||||
| Deferred tax liabilities: Intangibles |
— | (7.6 | ) | — | (11.4 | ) | ||||||||||
| Deferred tax liabilities: Other |
(0.9 | ) | — | (1.0 | ) | — | ||||||||||
| Valuation allowance |
— | (1.1 | ) | — | (6.3 | ) | ||||||||||
| Net deferred tax assets |
$ | 27.4 | $ | 91.0 | $ | 35.5 | $ | 47.0 | ||||||||
None of our deferred income tax assets or liabilities related to discontinued operations.
The table below summarizes the activity in valuation allowances:
| As of January 1, 2010 |
As of January 2, 2009 | ||||||
| (in millions) | |||||||
| Beginning balance |
$ | 6.3 | $ | — | |||
| Increases related to impairment of ARS |
— | 6.3 | |||||
| Decreases related to impairment of ARS |
(5.2 | ) | — | ||||
| Ending balance |
$ | 1.1 | $ | 6.3 | |||
We completed an analysis of projected future taxable income and determined that all remaining deferred tax assets, including net operating loss carryforwards (“NOLs”) and tax-credit carryforwards, are more than likely to be utilized in the foreseeable future. Therefore, no additional valuation allowances have been provided on deferred tax assets as of January 1, 2010 and January 2, 2009. We have gross NOLs of approximately $80.0 million from acquisitions that expire in years 2022 through 2028. The annual utilization of these NOLs is limited pursuant to Internal Revenue Code Section 382.
We expect to ultimately make use of deductions for all purchased intangibles on our income tax returns.
63
Table of Contents
Income tax rate reconciliation—A reconciliation of the statutory United States income tax rate to our effective income tax rate from continuing operations follows:
| Year Ended | |||||||||
| January 1, 2010 |
January 2, 2009 |
December 28, 2007 |
|||||||
| Statutory U.S. income tax rate |
35.0 | % | 35.0 | % | 35.0 | % | |||
| State taxes |
0.7 | (0.1 | ) | 1.4 | |||||
| International income |
(21.0 | ) | 2.0 | (15.5 | ) | ||||
| International stock-based compensation |
12.6 | (0.6 | ) | 3.1 | |||||
| Research credits |
(12.0 | ) | 0.5 | (3.7 | ) | ||||
| In-process research and development |
(0.2 | ) | (0.1 | ) | 0.5 | ||||
| Release of valuation allowance |
(12.6 | ) | — | — | |||||
| Change in reserve for UTP |
11.2 | 2.1 | — | ||||||
| Subpart F—interest & stock gain |
3.7 | (0.2 | ) | 2.7 | |||||
| Tax-exempt interest |
(0.1 | ) | 0.1 | (0.8 | ) | ||||
| Securities impairment |
— | (1.0 | ) | — | |||||
| Goodwill impairment |
— | (37.9 | ) | — | |||||
| Other items |
(0.8 | ) | 0.7 | (0.4 | ) | ||||
| Effective income tax rate |
16.5 | % | 0.5 | % | 22.3 | % | |||
Uncertain tax positions and unrecognized tax benefits
Effective December 30, 2006, we adopted Financial Accounting Standards Board guidance that clarifies the accounting for uncertainty in income taxes recognized in an enterprise’s financial statements and prescribes a recognition threshold and measurement attribute for the financial statement recognition and measurement of a tax position taken or expected to be taken in a tax return. Further, it provides guidance on derecognition, classification, interest and penalties, accounting in interim periods, disclosure and transition matters.
Upon adoption and the conclusion of the initial evaluation of our uncertain tax positions (“UTPs”), no adjustments were recorded. Consistent with past practice, we classify accrued interest and penalties on income tax matters in the current liabilities section of the balance sheet as “Income Taxes Payable.” When the interest and penalty portions of such UTPs are adjusted, it is classified as “Income Tax Expense.” All of the UTPs as of January 1, 2010 would affect our effective tax rate should they be recognized.
During fiscal year 2009, we recognized $2.7 million of potential interest and penalties on UTPs in the consolidated statement of operations.
During fiscal year 2008, the statute of limitations expired for the tax years 2002 through 2004 and we reversed to income approximately $50.2 million of previously established unrecognized tax benefits related to these tax years. Of this amount, $25.3 million related to international income tax matters and is included in income tax expense from continuing operations. The remaining $24.9 million related to the sale of our wireless division and is included in income tax benefit from discontinued operations. Included in these amounts was approximately $5.4 million reduction in the accrual for interest.
During fiscal year 2007, we recognized $0.9 million of potential interest and penalties on UTPs in the consolidated statement of operations.
We are subject to filing requirements in the United States Federal jurisdiction and in many state and foreign jurisdictions for numerous consolidated and separate entity income tax returns.
64
Table of Contents
The table below summarizes activity in unrecognized tax benefits (UTBs) resulting from uncertain tax positions:
| As of January 1, 2010 |
As of January 2, 2009 |
||||||
| (in millions) | |||||||
| Beginning balance (includes $0.5 million of interest and penalties as of January 2, 2009) |
$ | 8.6 | $ | 56.6 | |||
| Increases related to current year tax positions |
15.8 | 2.2 | |||||
| Increases related to prior years tax positions |
8.0 | — | |||||
| Decreases related to lapses of statutes of limitations |
— | (50.2 | ) | ||||
| Ending balance (includes $3.2 million of interest and penalties as of January 1, 2010) |
$ | 32.4 | $ | 8.6 | |||
Our remaining significant UTB primarily relates to domestic income tax matters. We anticipate releasing $1.2 million in the next fiscal year due to statute expiration.
In the major jurisdictions in which we operate, which includes the United States, various individual States therein and several foreign nations, returns for various tax years from 2005 forward are currently under taxing authority examination or remain subject to audit.
Other income tax information
Pretax income of international subsidiaries was $38.8 million, $83.5 million and $109.6 million during fiscal years 2009, 2008 and 2007, respectively.
Income taxes paid were $15.4 million, $23.8 million and $9.0 million during fiscal years 2009, 2008 and 2007, respectively.
We have not provided U.S. income taxes on undistributed earnings of international subsidiaries because of our demonstrated intention to reinvest these earnings. Determination of the remaining foreign earnings deemed to be permanently reinvested is not practicable.
NOTE 16—GEOGRAPHIC INFORMATION AND CONCENTRATIONS OF RISK
Geographic Information—Intersil operates exclusively in the semiconductor industry and primarily the analog and mixed-signal sector therein. Substantially all revenues result from the sale of semiconductor products. We eliminate all intercompany revenues and balances.
The table below summarizes operations by geographic area (in millions):
| Year Ended | |||||||||
| January 1, 2010 |
January 2, 2009 |
December 28, 2007 | |||||||
| United States Operations |
|||||||||
| Net revenues |
$ | 98.1 | $ | 136.5 | $ | 129.3 | |||
| Tangible long-lived assets |
64.6 | 70.0 | 77.0 | ||||||
| International Operations |
|||||||||
| Net revenues |
513.3 | 633.2 | 627.7 | ||||||
| Tangible long-lived assets |
37.7 | 42.8 | 32.6 | ||||||
65
Table of Contents
Concentrations of Operational Risk—We market our products for sale to customers, including distributors, primarily in Asia and the United States. We extend credit based on an evaluation of the customer’s financial condition and we generally do not require collateral. The table below shows sales by country where such value exceeded 10% in any one year:
| Year Ended | |||||||||
| January 1, 2010 |
January 2, 2009 |
December 28, 2007 |
|||||||
| Sales by country for continuing operations |
|||||||||
| China (includes Hong Kong) |
49 | % | 42 | % | 41 | % | |||
| United States |
16 | 18 | 17 | ||||||
| South Korea |
11 | 12 | 13 | ||||||
In addition to those in the table above, our customers in each of Taiwan, Japan, Germany, Singapore, Thailand and Netherlands accounted for at least 1% of our total revenues in fiscal year 2009.
Three distributor customers, one original equipment manufacturer (“OEM”) customer and two contract manufacturers, each accounting for at least 5% of our revenues, totaled 54% of revenues in fiscal year 2009. One distributor, Aeco Technology Co., LTD, represented 14% of revenues during fiscal year 2009 and 16% of aggregate net accounts receivable as of January 1, 2010.
We rely on external vendors for approximately 84% of our wafer supply as measured in units. Additionally, we rely significantly on external vendors for test, assembly and packaging services. The test, assembly and packaging vendors we utilize are primarily located in Asia, where a significant volume of our final product sales are made.
NOTE 17—DISCONTINUED OPERATIONS
We sold our Wireless product group in fiscal year 2003 (the “Transaction”) and certain operations were thereafter presented as discontinued operations in our consolidated financial statements. In 2008 and 2007, certain matters relating to the Transaction have occurred and have been classified and presented as discontinued operations in the accompanying Consolidated Statements of Operations and Cash Flows.
2007 Transaction activity—In fiscal year 2007, we were presented with an additional tax claim on the transaction by a foreign jurisdiction. We incurred research and defense costs for the claim of $0.3 million and ultimately settled the claim for $5.5 million, resulting in a net charge to discontinued operations tax expense of $2.0 million, net of a previously established reserve for this claim of $3.5 million which was reversed. Therefore discontinued operations were a net loss of $2.3 million for 2007.
2008 Transaction activity—In fiscal year 2008, we reversed $24.9 million for a previously established UTB due to the expiration of the statute of limitations on the tax years 2002 and 2003.
NOTE 18—GUARANTEES AND INDEMNIFICATIONS
Warranty—Intersil provides for the estimated cost of product warranties at the time revenue is recognized. While we engage in extensive product quality programs and processes, including actively monitoring and evaluating the quality of our suppliers, the estimated warranty obligation is affected by ongoing product failure rates and material usage costs incurred in correcting a product failure. Actual product failure rates or material usage costs that differ from estimates result in revisions to the estimated warranty liability. We warrant that our products will be free from defects in material workmanship and possess the electrical characteristics to which we have committed. The warranty period is for one year following shipment. We estimate warranty allowances based on historical warranty experience. We track returns by type and specifically identify those returns that were based on product failures and similar occurrences.
The table below summarizes changes in product warranty allowances in other accrued expenses for fiscal years 2009 and 2008 (in millions):
| Balance, December 28, 2007 |
$ | 0.8 | ||
| Accruals for warranties issued during the period |
2.2 | |||
| Settlements made (in cash or in kind) during the period |
(2.1 | ) | ||
| Balance, January 2, 2009 |
$ | 0.9 | ||
| Accruals for warranties issued during the period |
0.9 | |||
| Settlements made (in cash or in kind) during the period |
(1.2 | ) | ||
| Balance, January 1, 2010 |
$ | 0.6 | ||
Indemnifications—we sold our facility in Pennsylvania to Fairchild Semiconductor (Fairchild) in 2001. Fairchild subsequently alleged that trichloroethylene was discovered in the groundwater under that site, and has indicated that they will be seeking indemnification from Intersil. To the extent any contamination was caused prior to August 1999, Harris Corporation has indemnified Intersil against any associated environmental liabilities. Harris’ indemnification of us and our indemnification of Fairchild have no expiration date, nor do they have a maximum amount.
66
Table of Contents
The Harris facilities in Palm Bay, Florida, are listed on the National Priorities List (NPL) for groundwater clean up under the Comprehensive Environmental Response, Compensation and Liabilities Act, or Superfund. Intersil’s adjacent facility is included in the listing since it was owned by Harris at the time of the listing. Remediation activities associated with the NPL site have ceased. However, Harris is still obligated to conduct groundwater monitoring on Intersil’s property for an unspecified period of time. Harris has indemnified Intersil against any environmental liabilities associated with this contamination. This indemnification does not expire, nor does it have a maximum amount.
Our former facility in Kuala Lumpur, Malaysia, which we sold in June 2000, has known groundwater contamination from past operations. The contamination was discovered in May 2000, during the closure activities associated with a former waste storage pad. This contamination has been attributed to activities conducted prior to Intersil’s acquisition of the facility from Harris. Harris is conducting additional investigations and some remediation may be required. Harris has indemnified Intersil against any environmental liabilities associated with this contamination, and Intersil likewise is indemnifying the purchaser against those liabilities. Harris’ indemnification of us and our indemnification of purchaser have no expiration date, nor do they have a maximum amount.
A former semiconductor manufacturing site in Taoyuan, Taiwan operated by RCA and/or General Electric allegedly has groundwater contamination and is subject to cleanup and monitoring efforts as well as claims of environmental pollution that allegedly caused adverse health effects. To the extent our Taiwan subsidiary is the successor in interest to any of RCA or General Electric’s activities at that site, Harris has indemnified Intersil against any environmental liabilities associated with the alleged contamination. This indemnification does not expire, nor does it have a maximum amount.
We generally provide customers with a limited indemnification against intellectual property infringement claims related to our products. We accrue for known indemnification issues if a loss is probable and can be reasonably estimated, and accrue for estimated incurred but unidentified issues based on historical activity.
In certain instances when we sell product groups, we may retain certain liabilities for known exposures and provide indemnification to the buyer with respect to future claims arising from events occurring prior to the sale date, including liabilities for taxes, legal matters, intellectual property infringement, environmental exposures and other obligations. The terms of the indemnifications vary in duration, from one to two years for certain types of indemnities, to terms for tax indemnifications that are generally aligned to the applicable statute of limitations for the jurisdiction in which the divestiture occurred, and terms for environmental indemnities that typically do not expire. The maximum potential future payments that we could be required to make under these indemnifications are either contractually limited to a specified amount or unlimited. We believe that the maximum potential future payments that we could be required to make under these indemnifications are not determinable at this time, as any future payments would be dependent on the type and extent of the related claims, and all available defenses, which are not estimable.
NOTE 19—FINANCIAL INSTRUMENTS AND DERIVATIVES
Letters of Credit: We issue letters of credit during the ordinary course of business through major financial institutions as required by certain vendor contracts. We had outstanding letters of credit totaling $2.4 million as of January 1, 2010 and January 2, 2009. Certain short-term investments with a total carrying value of $2.4 million are pledged to secure such letters of credit.
Derivatives: We use foreign exchange contracts to hedge anticipated foreign cash flow commitments up to six months. Total net (losses) gains on foreign exchange contracts were $(1.3) million, $1.1 million and ($0.3) for fiscal years 2009, 2008 and 2007, respectively. Realized and unrealized gains and losses from hedges are classified in the statements of operations consistent with the accounting treatment of the items being hedged. Open foreign exchange contracts had fair values of $0.3 million and $0.7 million as of January 1, 2010 and January 2, 2009, respectively. We believe our cash flow hedges have been economically effective.
67
Table of Contents
The tables below describe total open foreign exchange contracts as of January 1, 2010, January 2, 2009 and December 28, 2007 (all are options to sell foreign currencies):
| Fiscal year ended | ||||||||||||
| January 1, 2010 |
January 2, 2009 |
December 28, 2007 |
||||||||||
| (in millions) | ||||||||||||
| Realized (loss) gain on foreign exchange contracts |
$ | (1.2 | ) | $ | 1.2 | $ | (0.3 | ) | ||||
| Unrealized loss on foreign exchange contracts |
$ | (0.1 | ) | $ | (0.1 | ) | — | |||||
| Purchases and sales of foreign exchange contracts |
$ | 30.1 | $ | 43.0 | $ | 38.1 | ||||||
| Notional amount of open contracts as of year end |
$ | 14.2 | $ | 20.3 | $ | 20.8 | ||||||
| Fair value of open contracts as of year end |
$ | 0.3 | $ | 0.7 | $ | 0.3 | ||||||
| Euros | Range of Maturities | |||||
| Open Foreign Currency Contracts at: |
Foreign Currency |
U.S. $ | ||||
| (millions) | (millions) | (in months) | ||||
| January 1, 2010 |
10.0 | 14.3 | 1 – 5 | |||
| January 2, 2009 |
15.0 | 20.3 | 1 – 6 | |||
NOTE 20—LITIGATION MATTERS
We are currently party to various claims and legal proceedings, including those discussed below. When we believe that a loss is probable and the amount of the loss can be reasonably estimated, we recognize the estimated amount of the loss. We include legal costs in the estimate of losses. As additional information becomes available, we reassess any potential liability related to these matters and, if necessary, revise the estimates.
We believe that the ultimate outcome of these matters, individually and in the aggregate will not have a material adverse effect on its financial position or overall trends in results of its operations. However, litigation is subject to inherent uncertainties and unfavorable rulings could occur, including an award of monetary damages or issuance of an injunction prohibiting us from selling one or more products. It is possible that an unfavorable ruling could have a material adverse impact on the results of our operations for the period in which the ruling occurs, or in future periods. Because we believe the defense of these matters to be probable, we record accruals for estimated costs to defend these positions, exclusive of settlement or judgment costs. As of January 1, 2010, we have recorded approximately $3.5 million related to defense costs.
We and certain of our former directors as well as the lead underwriter of our February 2000 initial public offering, Credit Suisse First Boston Corporation, were named as defendants in several law suits, the first of which is a class action filed on June 8, 2001 in the United States District Court for the Southern District of New York. The complaints allege violations of Rule 10b-5 based on, among other things, the dissemination of statements containing material misstatements and/or omissions concerning the commissions received by the underwriters of the initial public offering, as well as failure to disclose the existence of purported agreements by the underwriters with some of the purchasers in these offerings to thereafter buy additional shares of Intersil in the open market at pre-determined prices above the offering prices. These lawsuits against us, as well as those alleging similar claims against other issuers in initial public offerings, have been consolidated with a number of other related securities suits. On October 5, 2009, Judge Scheindlin entered an Opinion and Order granting final approval of the settlement, the plan of allocation, and class certification in the consolidated and coordinated IPO class action proceedings, and on December 14, 2009 an Order and Final Judgment was filed in the action against Intersil. There was no impact on our consolidated financial statements related to this settlement because Intersil was not required to fund any of the settlement.
Texas Advanced Optoelectronic Solutions, Inc. (“TAOS”) named Intersil as a defendant in a lawsuit filed on November 25, 2008 in the United States District Court for the Eastern District of Texas. In this action, TAOS alleges patent infringement, breach of contract, trade secret misappropriation, and tortuous interference with a business relationship, seeking damages and injunctive relief. We dispute TAOS’ claims and are defending ourselves vigorously. Discovery is still on-going, and a claim construction opinion will be forthcoming from the Court.
NOTE 21—RECENT ACCOUNTING PRONOUNCEMENTS
FASB ASC 805-10, “Business Combinations” (formerly SFAS 141R, “Business Combinations”)—Issued in December 2007, ASC 805-10 provides companies with principles and requirements on how an acquirer recognizes and measures in its financial statements the identifiable assets acquired, liabilities assumed and any non-controlling interest in the acquiree as well as the recognition and measurement of goodwill acquired in a business combination. ASC 805-10 also requires certain disclosures to enable users of the financial statements to evaluate the nature and financial effects of the business combination. Acquisition costs associated
68
Table of Contents
with the business combination will generally be expensed as incurred. ASC 805-10 is effective for business combinations occurring in fiscal years beginning after December 15, 2008, which required us to adopt these provisions for business combinations occurring in fiscal year 2009 and thereafter. We applied these new standards in recording the acquisition of Quellan Inc., which occurred in August 2009. See Note 7 to the accompanying consolidated financial statements.
FASB ASC 350-30-65, “Determination of the Useful Life of Intangible Assets” (formerly FSP FAS 142-3, “Determination of the Useful Life of Intangible Assets”)—In April 2008, the FASB issued ASC 350-30-65, “Determination of the Useful Life of Intangible Assets.” ASC 350-30-65 amends the factors that should be considered in developing renewal or extension assumptions used to determine the useful life of a recognized intangible asset under FASB ASC 350-10, Goodwill and Other Intangible Assets. ASC 350-30-65 is effective for financial statements issued for fiscal years beginning after December 15, 2008 and interim periods within those fiscal years. There was no material impact from this statement.
FASB ASC 815-10, “Derivatives and Hedging” (formerly SFAS 161, “Disclosures about Derivative Instruments and Hedging Activities”)—In March 2008, the FASB issued ASC 815-10, “Derivatives and Hedging”. This statement is intended to improve transparency in financial reporting by requiring enhanced disclosures of an entity’s derivative instruments and hedging activities and their effects on the entity’s financial position, financial performance and cash flows. ASC 815-10 applies to derivative instruments as well as related hedged items, bifurcated derivatives and nonderivative instruments that are designated and qualify as hedging instruments. Entities with instruments subject to ASC 815-10 must provide more robust qualitative disclosures and expanded quantitative disclosures. ASC 815-10 was effective prospectively for financial statements issued for fiscal years and interim periods beginning after November 15, 2008, with early application permitted. There was no material impact from this statement.
FASB ASC 820-10-65-2, “Determining Whether a Market Is Not Active and a Transaction is Not Distressed” (formerly FSP FAS 157-4, “Determining Whether a Market Is Not Active and a Transaction is Not Distressed”)—Issued in April 2009, ASC 820-10-65-2 provides guidance for making fair value measurements more consistent with the principles presented in ASC 820-10. ASC 820-10-65-2 provides additional authoritative guidance in determining whether a market is active or inactive and whether a transaction is distressed. ASC 820-10-65-2 is applicable to all assets and liabilities (i.e. financial and nonfinancial) and will require enhanced disclosures. This standard is effective for periods ending after June 15, 2009 with early adoption permitted. There was no material impact from the adoption of this guidance.
FASB ASC 320-10-65, “Recognition and Presentation of Other-Than-Temporary Impairments” (formerly FSP FAS 115-2, FAS 124-2 and EITF 99-20-2, “Recognition and Presentation of Other-Than-Temporary Impairments”)—Issued in April 2009, ASC 320-10-65 provides additional guidance to improve clarity about the credit and noncredit component of an other-than-temporary impairment event and to more effectively communicate when an other-than-temporary impairment event has occurred. ASC 320-10-65 applies to debt securities and is effective for periods ending after June 15, 2009 with early adoption permitted. This statement resulted in additional disclosures related to other-than-temporary impairments.
FASB ASC 825-10-65, “Interim Disclosures about Fair Value of Financial Instruments” (formerly FSP FAS 107-1 and APB 28-1, “Interim Disclosures about Fair Value of Financial Instruments”)—Also issued in April 2009, ASC 825-10-65 amends ASC 825-10, Disclosures about Fair Value of Financial Instruments, to require disclosures about fair value of financial instruments in interim as well as in annual financial statements. ASC 825-10-65 also amends ASC 270-10, Interim Reporting, to require those fair value disclosures in all interim financial statements. This standard was effective for periods ending after June 15, 2009 with early adoption permitted. There was no material impact from this guidance.
FASB ASC 855-10, “Subsequent Events” (formerly SFAS 165, “Subsequent Events”)—In May 2009, the FASB issued ASC 855-10, which sets forth: (1) the period after the balance sheet date during which management of a reporting entity should evaluate events or transactions that may occur for potential recognition or disclosure in the financial statements; (2) the circumstances under which an entity should recognize events or transactions occurring after the balance sheet date in its financial statements; and 3) the disclosures that an entity should make about events or transactions that occurred after the balance sheet date. ASC 855-10 is currently effective and resulted in additional disclosure related to subsequent events.
FASB ASC 105-10, “Generally Accepted Accounting Principles” (formerly FASB Statement No. 168, “The FASB Accounting Standards Codification ™ and the Hierarchy of Generally Accepted Accounting Principles, a replacement of FASB Statement No. 162” (the Codification))—In June 2009, the FASB issued the Codification, which was launched on July 1, 2009. The Codification became the single source of authoritative nongovernmental U.S. GAAP, superseding existing FASB, American Institute of Certified Public Accountants (AICPA), Emerging Issues Task Force (EITF) and related literature. The Codification eliminates the GAAP hierarchy contained in SFAS No. 162 and establishes one level of authoritative GAAP. All other literature is considered non-authoritative. This Statement is effective for financial statements issued for interim and annual periods ending after September 15, 2009. The Codification is currently effective and did not impact our consolidated financial statements.
69
Table of Contents
FASB ASU 2010-06, “Fair Value Measurements and Disclosures (Topic 820) – Improving Disclosures about Fair Value Measurements”—In January 2010, the FASB issued guidance to improve the disclosures for Level 1, Level 2 and Level 3 fair value measurements. ASU 2010-06 requires new disclosures for significant transfers in and out of Level 1 and Level 2 fair value measurements, and separately report information about purchases, sales, issuances and settlements of Level 3 fair value measurements. ASU 2010-06 also updates ASC 820-10, Fair Value Measurements and Disclosures, to require an entity to provide fair value measurement disclosures for each class of assets and liabilities. Entities should also provide disclosures about the valuation techniques and inputs used to measure fair value for both recurring and nonrecurring fair value measurements for Level 2 and Level 2 fair value measurements. ASU 2010-06 will be effective for interim and annual reporting periods beginning after December 15, 2009, except for the disclosures about purchases, sales, issuances and settlements in the roll forward of activity in Level 3 fair value measurements, which will be effective for interim and annual reporting periods beginning after December 15, 2010. We are currently evaluating the impact ASU 2010-06 will have on our financial statements.
NOTE 22—QUARTERLY FINANCIAL DATA (UNAUDITED)
The following is a summary of unaudited quarterly financial information for the periods indicated:
| Quarters Ended | |||||||||||||||||||||||||
| Jan 1, 2010 |
Oct 2, 2009 |
Jul 3, 2009 |
Apr 3, 2009 |
Jan 2, 2009 |
Oct 3, 2008 |
Jul 4, 2008 |
Mar 28, 2008 | ||||||||||||||||||
| (in millions, except per share data) | |||||||||||||||||||||||||
| Net revenue |
$ | 177.6 | $ | 168.3 | $ | 147.3 | $ | 118.2 | $ | 131.1 | $ | 218.7 | $ | 216.2 | $ | 203.7 | |||||||||
| Gross profit |
98.2 | 91.8 | 79.8 | 65.1 | 44.2 | 123.1 | 122.6 | 109.6 | |||||||||||||||||
| Net income (loss) |
$ | 17.7 | $ | 12.3 | $ | 6.2 | $ | 2.4 | $ | (1,189.9 | ) | $ | 47.3 | $ | 38.0 | $ | 67.1 | ||||||||
| Income (loss) per share (basic): |
$ | 0.15 | $ | 0.10 | $ | 0.05 | $ | 0.02 | $ | (9.74 | ) | $ | 0.38 | $ | 0.31 | $ | 0.53 | ||||||||
| Income (loss) per share (diluted): |
$ | 0.15 | $ | 0.10 | $ | 0.05 | $ | 0.02 | $ | (9.74 | ) | $ | 0.38 | $ | 0.30 | $ | 0.53 | ||||||||
In the quarter ended January 1, 2010, we corrected the following errors in accounting for income taxes, related primarily to equity compensation.
| • | increased tax expense by $1.8 million (approximately $1.2 million related to prior fiscal years) |
| • | decreased additional paid in capital by $6.8 million (approximately $6.8 million related to prior fiscal years) |
| • | increased income taxes payable by a net $8.6 million (approximately $8.0 million related to prior fiscal years) |
We have analyzed the effect of the misstatement on prior periods in accordance with the appropriate authoritative literature and concluded that the misstatement was not material to the year ended January 1, 2010 or to the trends on earnings among fiscal years or the quarters within all affected years.
Note 23—Subsequent Events
On January 8, 2010, we acquired the business of Rock Semiconductor (“Rock”) for $4.5 million cash. The purchase includes primarily intellectual property. Rock was a privately-held, fabless semiconductor company with technology leadership in highly integrated power management ICs. Based on our preliminary evaluations, the acquisition includes approximately $2.3 million of definite-lived intangible assets, which will be amortized over five years, and goodwill of approximately $2.2 million. We have recognized acquisition related expenses of $0.4 million, included in selling, general and administrative expense in the consolidated financial statements.
We have evaluated subsequent events through the date these consolidated financial statements were issued.
—End of Consolidated Financial Statements—
70
Table of Contents
| Item 9. | Changes in and Disagreements with Accountants on Accounting and Financial Disclosure |
None.
| Item 9A. | Controls and Procedures |
Evaluation of Disclosure Controls and Procedures
We conducted an evaluation of the effectiveness of the design and operation of our “disclosure controls and procedures” (Disclosure Controls) as of the end of the period covered by this Form 10-K. The controls evaluation was conducted under the supervision and with the participation of management, including our CEO and CFO. Disclosure Controls are controls and procedures designed to reasonably assure that information required to be disclosed in our reports filed under the Exchange Act, such as this Form 10-K, is recorded, processed, summarized and reported within the time periods specified in the SEC’s rules and forms. Disclosure Controls are also designed to reasonably assure that such information is accumulated and communicated to our management, including the CEO and CFO, as appropriate to allow timely decisions regarding required disclosure. Our quarterly evaluation of Disclosure Controls includes an evaluation of some components of our internal control over financial reporting, and internal control over financial reporting is also separately evaluated on an annual basis for purposes of providing the management report, which is set forth below.
The evaluation of our Disclosure Controls included a review of the controls’ objectives and design, our implementation of the controls and the effect of the controls on the information generated for use in this Annual Report on Form 10-K. In the course of the controls evaluation, we reviewed any identified data errors, control problems or acts of fraud and sought to confirm that appropriate corrective actions, including process improvements, were being undertaken. This type of evaluation is performed on a quarterly basis so that the conclusions of management, including our CEO and CFO, concerning the effectiveness of the Disclosure Controls can be reported in our periodic reports on Form 10-Q and Form 10-K. Many of the components of our Disclosure Controls are also evaluated on an ongoing basis by our Internal Audit, Finance and other personnel. The overall goals of these various evaluation activities are to monitor our Disclosure Controls, and to modify them as necessary. Our intent is to maintain the Disclosure Controls as dynamic systems that change as conditions warrant.
Based upon the controls evaluation, our CEO and CFO have concluded that as of the end of the period covered by this Form 10-K, our Disclosure Controls were effective to provide reasonable assurance that information required to be disclosed in our Exchange Act reports is recorded, processed, summarized and reported within the time periods specified by the SEC, and that material information relating to Intersil and its consolidated subsidiaries is made known to management, including the CEO and CFO, particularly during the period when our periodic reports are being prepared.
Management Report on Internal Control over Financial Reporting
Our management is responsible for establishing and maintaining adequate internal control over financial reporting to provide reasonable assurance regarding the reliability of our financial reporting and the preparation of financial statements for external purposes in accordance with generally accepted accounting principles. Internal control over financial reporting includes those policies and procedures that (i) pertain to the maintenance of records that in reasonable detail accurately and fairly reflect the transactions and dispositions of the assets of the company; (ii) provide reasonable assurance that transactions are recorded as necessary to permit preparation of financial statements in accordance with generally accepted accounting principles, and that receipts and expenditures of the company are being made only in accordance with authorizations of management and directors of the company; and (iii) provide reasonable assurance regarding prevention or timely detection of unauthorized acquisition, use or disposition of the company’s assets that could have a material effect on the financial statements.
Management assessed our internal control over financial reporting as of January 1, 2010, the end of our fiscal year. Management based its assessment on criteria established in Internal Control—Integrated Framework issued by the Committee of Sponsoring Organizations of the Treadway Commission. Management’s assessment included evaluation of such elements as the design and operating effectiveness of key financial reporting controls, process documentation, accounting policies, and our overall control environment. This assessment is supported by testing and monitoring by our management and Internal Audit organizations.
71
Table of Contents
Based on our assessment, management has concluded that our internal control over financial reporting was effective as of the end of the fiscal year to provide reasonable assurance regarding the reliability of financial reporting and the preparation of financial statements for external reporting purposes in accordance with generally accepted accounting principles. Furthermore, management has concluded that no change in internal control over financial reporting occurred during the Company’s fiscal fourth quarter ended January 1, 2010 that has materially affected, or is reasonably likely to materially affect, such internal control over financial reporting. We reviewed the results of management’s assessment with the Audit Committee of our Board of Directors.
Inherent Limitations on Effectiveness of Controls
The company’s management, including the CEO and CFO, does not expect that our Disclosure Controls or our internal control over financial reporting will prevent or detect all error and all fraud. A control system, no matter how well designed and operated, can provide only reasonable, not absolute, assurance that the control system’s objectives will be met. The design of a control system must reflect the fact that the benefits of controls must be considered relative to their costs. Further, because of the inherent limitations in all control systems, no evaluation of controls can provide absolute assurance that misstatements due to error or fraud will not occur or that all control issues and instances of fraud, if any, within the company have been detected. These inherent limitations include the realities that judgments in decision-making can be faulty and that breakdowns can occur because of simple error or mistake. Controls can also be circumvented by the individual acts of some persons, by collusion of two or more people, or by management override of the controls. The design of any system of controls is based in part on certain assumptions about the likelihood of future events, and there can be no assurance that any design will succeed in achieving its stated goals under all potential future conditions. Projections of any evaluation of controls effectiveness to future periods are subject to risks. Over time, controls may become inadequate because of changes in conditions or deterioration in the degree of compliance with policies or procedures.
| Item 9B. | Other Information |
Subsequent to the filing of our Form 8K on January 27, 2010, which included our press release containing our January 1, 2010 unaudited financial statements, we have made adjustments to our fiscal 2009 financial statements which had the effect of decreasing net income by approximately $4.6 million and increasing income taxes payable by $13.8 million. These adjustments relate to international tax matters and tax benefits on stock compensation arrangements.
PART III
| Item 10. | Directors and Executive Officers of the Registrant |
Members of the Board of Directors
The following individuals served on our Board of Directors as of January 1, 2010:
David B. Bell; Robert W. Conn; James V. Diller; Gary E. Gist; Mercedes Johnson; Gregory Lang; Jan Peeters; Robert N. Pokelwaldt; and, James A. Urry. The information required to be reported with respect to the directors listed in this paragraph pursuant to Item 401 of Regulation S-K will appear under the caption, “Election of Directors (Item 1 on Proxy Ballot)” in the definitive Proxy Statement relating to our 2010 Annual Meeting of Shareholders, to be filed by us with the SEC pursuant to Section 14(a) of the Securities Exchange Act of 1934 (the “Exchange Act”) and is hereby specifically incorporated herein by reference thereto.
Executive Officers and Key Employees
The executive officers and key employees of Intersil as of January 1, 2010 were as follows:
David B. Bell, Jonathan A. Kennedy, Thomas C. Tokos, Peter Oaklander, Susan Hardman, Vern Kelley, David Loftus and Sagar Pushpala. The information required to be reported with respect to the executive officers and key employees listed in this paragraph pursuant to Item 401 of Regulation S-K will appear under the caption “Executive Officers and Key Employees” in the definitive Proxy Statement relating to our 2010 Annual Meeting of Shareholders, to be filed by us with the SEC pursuant to Section 14(a) of the Exchange Act, and is hereby specifically incorporated herein by reference thereto.
The information required under this item with respect to the compliance with Section 16(a) of the Exchange Act will appear under the caption “Section 16(a) Beneficial Ownership Reporting Compliance” in the definitive Proxy Statement relating to our 2010 Annual Meeting of Shareholders, to be filed by us with the SEC pursuant to Section 14(a) of the Exchange Act, and is hereby specifically incorporated herein by reference thereto.
The information required under this item with respect to our Audit, Compensation and Nominating and Governance Committees will appear under the captions “Corporate Governance—Committees of the Board—Audit Committee,” “Corporate Governance—Committees of the Board—Compensation Committee,” and “Corporate Governance—Committees of the Board—Nominating and
72
Table of Contents
Governance Committee” in the definitive Proxy Statement relating to our 2010 Annual Meeting of Shareholders, to be filed by us with the SEC pursuant to Section 14(a) of the Exchange Act, and is hereby specifically incorporated herein by reference thereto.
We have adopted a Code of Ethics applicable to our Senior Financial Officers, including our Chief Executive Officer, Chief Financial Officer, Treasurer and other persons performing similar functions. A copy of the Code of Ethics is available at http://www.intersil.com/Corporate_Governance/intersil_code_of_ethics.pdf. Any amendment to, or waiver of, any provision of the Code of Ethics will be disclosed on our website within five business days following such amendment or waiver.
| Item 11. | Executive Compensation |
The information required under this item will appear under the captions “Executive Compensation” and “Director Compensation” in the definitive Proxy Statement relating to our 2010 Annual Meeting of Shareholders, to be filed by us with the SEC pursuant to Section 14(a) of the Exchange Act, and is hereby specifically incorporated herein by reference thereto.
| Item 12. | Security Ownership of Certain Beneficial Owners and Management and Related Shareholder Matters |
The information required under this item will appear under the captions “Equity Compensation Plan Information,” “Security Ownership of Certain Beneficial Owners and Directors and Officers” and “Severance and Change-in-Control Benefits—Change-in-Control Severance Agreements” in the definitive Proxy Statement relating to our 2010 Annual Meeting of Shareholders, to be filed by us with the SEC pursuant to Section 14(a) of the Exchange Act, and is hereby specifically incorporated herein by reference thereto.
| Item 13. | Certain Relationships and Related Transactions |
The information required under this item will appear under the captions “Corporate Governance—Director Compensation and Related Party Transactions,” “Corporate Governance—Director Independence” and “Corporate Governance—Committees of the Board” in the definitive Proxy Statement relating to our 2010 Annual Meeting of Shareholders, to be filed by us with the SEC pursuant to Section 14(a) of the Exchange Act, and is hereby specifically incorporated herein by reference thereto.
| Item 14. | Principal Accounting Fees and Services |
The information required under this item will appear under the captions “Corporate Governance—Committees of the Board—Audit Committee,” “Ratification of Appointment of Independent Registered Public Accounting Firm” (Item 2 on Proxy Card), “Audit Fees,” “Audit-Related Fees,” “Tax Fees,” “All Other Fees” and “Audit Committee Pre-Approval Policy” in the definitive Proxy Statement relating to our 2010 Annual Meeting of Shareholders, to be filed by us with the SEC pursuant to Section 14(a) of the Exchange Act, and is hereby specifically incorporated herein by reference thereto.
73
Table of Contents
PART IV
| Item 15. | Exhibits and Financial Statement Schedules |
| (a) | 1. The consolidated financial statements and related Notes thereto as set forth under Item 8 of this Report on Form 10-K are incorporated herein by reference. |
| (a) | 2. Financial Statement Schedules. |
VALUATION AND QUALIFYING ACCOUNTS
(in millions)
| Valuation and qualifying accounts deducted from the assets to |
Balance at Beginning of Period |
Additions Charged to Costs and Expenses |
Additions Charged (Credited) to Other Accounts |
Deduction From Allowances |
Balance at End of Period | ||||||||||
| Allowance for Uncollectible Accounts |
|||||||||||||||
| 2009 |
$ | 1.6 | $ | 1.0 | $ | 0.3 | $ | — | $ | 2.3 | |||||
| 2008 |
$ | 0.6 | $ | 0.8 | $ | 0.2 | $ | — | $ | 1.6 | |||||
| 2007 |
$ | 0.4 | $ | 3.1 | $ | — | $ | 2.9 | $ | 0.6 | |||||
| Inventory Allowances |
|||||||||||||||
| 2009 |
$ | 38.3 | $ | 5.7 | $ | 0.4 | $ | 2.0 | $ | 42.4 | |||||
| 2008 |
$ | 21.0 | $ | 31.8 | $ | 0.4 | $ | 14.9 | $ | 38.3 | |||||
| 2007 |
$ | 22.7 | $ | 7.8 | $ | 0.5 | $ | 10.0 | $ | 21.0 | |||||
| Sales Returns and Allowances |
|||||||||||||||
| 2009 |
$ | 6.9 | $ | 34.0 | $ | — | $ | 34.7 | $ | 6.2 | |||||
| 2008 |
$ | 6.7 | $ | 37.0 | $ | — | $ | 36.8 | $ | 6.9 | |||||
| 2007 |
$ | 5.6 | $ | 21.6 | $ | — | $ | 20.5 | $ | 6.7 | |||||
The additions charged to costs and expenses are classified as reduction of revenue for the allowance for uncollectible accounts and sales returns and allowances. Inventory allowance additions are classified as cost of revenues.
All other schedules for which provision is made in the applicable accounting regulation of the SEC are not required under the related instructions or are inapplicable and therefore have been omitted.
74
Table of Contents
| (a) | 3. Index to Exhibits. |
INDEX TO EXHIBITS
| Exhibit No. |
Description | |
| 3.1 |
Amended and Restated Certificate of Incorporation of Intersil Corporation (incorporated by reference to Exhibit C to the definitive proxy statement on Form DEF 14A, March 25, 2005). | |
| 3.2 |
Restated Bylaws of Intersil (incorporated by reference to Exhibit 3.02 to the Quarterly Report on Form 10-Q, filed August 7, 2009) | |
| 4 |
Specimen Certificate of Intersil Corporation’s Class A Common Stock. (incorporated by reference to Exhibit 4.1 to the Annual Report on Form 10-K, filed February 27, 2007) | |
| 10 |
Credit Agreement, dated as of October 17, 2008, among the Company, certain subsidiaries of the Company, Bank of America N.A. as Administrative Agent, Swing Line Lender and L/C Issuer, and the other Lender parties thereto (incorporated by reference to Exhibit 10.1 to the Current Report on Form 8-K, October 23, 2008). | |
| 14 |
Intersil Code of Ethics (incorporated by reference to Exhibit 14.01 to the Annual Report on Form 10-K, filed March 9, 2004). | |
| 21 |
Subsidiaries of Intersil Corporation.* | |
| 23 |
Consent of KPMG LLP, Independent Registered Public Accounting Firm.* | |
| 31.1 |
Certification of Chief Executive Officer Pursuant to Rule 13a-14(a) of the Exchange Act, as adopted by Section 302 of the Sarbanes-Oxley Act of 2002.* | |
| 31.2 |
Certification of Chief Financial Officer Pursuant to Rule 13a-14(a) of the Exchange Act, as adopted by Section 302 of the Sarbanes-Oxley Act of 2002.* | |
| 32 |
Certification of the Chief Executive Officer and Chief Financial Officer Pursuant to Rule 13a-14(b) of the Exchange Act and 18 U.S.C. Section 1350, as Adopted Pursuant to Section 906 of the Sarbanes-Oxley Act of 2002.* | |
| * | Filed herewith. |
75
Table of Contents
SIGNATURES
Pursuant to the requirements of Section 13 or 15(d) of the Securities Exchange Act of 1934, the registrant has duly caused this report to be signed on its behalf by the undersigned, thereunto duly authorized.
| INTERSIL CORPORATION | ||
| By: | /S/ DAVID B. BELL | |
| David B. Bell | ||
| Chief Executive Officer | ||
| March 2, 2010 | ||
Pursuant to the requirements of the Securities Exchange Act of 1934, this report has been signed below by the following persons on behalf of the registrant and in the capacities and on the dates indicated.
| Name |
Title |
Date | ||||
| By: | /S/ DAVID B. BELL David B. Bell |
President, Chief Executive Officer and Director (principal executive officer) |
March 2, 2010 | |||
| By: | /S/ JONATHAN A. KENNEDY Jonathan A. Kennedy |
Chief Financial Officer (principal financial and accounting officer) |
March 2, 2010 | |||
| By: | /S/ GARY E. GIST Gary E. Gist |
Chairman of the Board of Directors | March 2, 2010 | |||
| By: | /S/ ROBERT W. CONN Robert W. Conn |
Director | March 2, 2010 | |||
| By: | /S/ JAMES V. DILLER James V. Diller |
Director | March 2, 2010 | |||
| By: | /S/ MERCEDES JOHNSON Mercedes Johnson |
Director | March 2, 2010 | |||
| By: | /S/ GREGORY LANG Gregory Lang |
Director | March 2, 2010 | |||
| By: | /S/ JAN PEETERS Jan Peeters |
Director | March 2, 2010 | |||
| By: | /S/ ROBERT N. POKELWALDT Robert N. Pokelwaldt |
Director | March 2, 2010 | |||
| By: | /S/ JAMES A. URRY James A. Urry |
Director | March 2, 2010 | |||
76