Attached files
| file | filename |
|---|---|
| EX-21 - EX-21 - INTERSIL CORP/DE | isil-20160101ex2178f2680.htm |
| EX-10.8 - EX-10.8 - INTERSIL CORP/DE | isil-20160101ex108b12d35.htm |
| EX-10.18 - EX-10.18 - INTERSIL CORP/DE | isil-20160101ex10182861a.htm |
| EX-32 - EX-32 - INTERSIL CORP/DE | isil-20160101xex32.htm |
| EX-31.1 - EX-31.1 - INTERSIL CORP/DE | isil-20160101xex311.htm |
| EX-31.2 - EX-31.2 - INTERSIL CORP/DE | isil-20160101xex312.htm |
| EX-23 - EX-23 - INTERSIL CORP/DE | isil-20160101xex23.htm |
SECURITIES AND EXCHANGE COMMISSION
Washington, D.C. 20549
FORM 10-K
(Mark One)
[x]ANNUAL REPORT PURSUANT TO SECTION 13 OR 15(d) OF THE SECURITIES EXCHANGE ACT OF 1934
For the fiscal year ended January 1, 2016
OR
[ ]TRANSITION REPORT PURSUANT TO SECTION 13 OR 15(d) OF THE SECURITIES EXCHANGE ACT OF 1934
For the transition period from ___ to ___
Commission file number 000-29617
INTERSIL CORPORATION
(Exact name of Registrant as specified in its charter)
|
Delaware |
59-3590018 |
|
State or other jurisdiction of incorporation or organization |
(I.R.S. Employer Identification No.) |
|
1001 Murphy Ranch Road, Milpitas, California |
95035 |
|
(Address of principal executive offices) |
(Zip Code) |
|
Registrant’s telephone number, including area code |
408-432-8888 |
|
|
|
|
Securities registered pursuant to Section 12(b) of the Act: |
|
|
Title of each class |
Name of each exchange on which registered |
|
Class A Common Stock, par value $0.01 per share |
The NASDAQ Stock Market LLC (NASDAQ Global Select Market) |
|
|
|
|
Securities registered pursuant to Section 12(g) of the Act: |
|
|
None |
|
Indicate by check mark if the registrant is a well-known seasoned issuer, as defined in Rule 405 of the Securities Act. [x] Yes [ ] No
Indicate by check mark if the registrant is not required to file reports pursuant to Section 13 or Section 15(d) of the Act. [ ] Yes [x] No
Indicate by check mark whether the registrant (1) has filed all reports required to be filed by Section 13 or 15(d) of the Securities Exchange Act of 1934 during the preceding 12 months (or for such shorter period that the registrant was required to file such reports), and (2) has been subject to such filing requirements for the past 90 days. [x] Yes [ ] No
Indicate by check mark whether the registrant has submitted electronically and posted on its corporate Web site, if any, every Interactive Data File required to be submitted and posted pursuant to Rule 405 of Regulation S-T (§ 232.405 of this chapter) during the preceding 12 months (or for such shorter period that the registrant was required to submit and post such files). [x] Yes [ ] No
Indicate by check mark if disclosure of delinquent filers pursuant to Item 405 of Regulation S-K (§ 229.405 of this chapter) is not contained herein, and will not be contained, to the best of registrant’s knowledge, in definitive proxy or information statements incorporated by reference in Part III of this Annual Report on Form 10-K or any amendment to this Annual Report on Form 10-K. [x]
Indicate by check mark whether the registrant is a large accelerated filer, an accelerated filer, a non-accelerated filer, or a smaller reporting company. See the definitions of “large accelerated filer,” “accelerated filer” and “smaller reporting company” in Rule 12b-2 of the Exchange Act.
|
Large accelerated filer [x] |
Accelerated filer [ ] |
|
Non-accelerated filer [ ] (Do not check if a smaller reporting company) |
Smaller reporting company [ ] |
Indicate by check mark whether the registrant is a shell company (as defined in Rule 12b-2 of the Act).[ ]Yes[x]No
The aggregate market value of our Class A Common Stock, par value $0.01 per share, held by non-affiliates (based upon the closing sale price of $12.22 on the NASDAQ Global Select Market) on July 3, 2015 was approximately $1.6 billion.
As of February 5, 2016, there were 132,766,569 shares of our Class A Common Stock, par value $0.01 per share, outstanding.
The information required by Part III of this Annual Report on Form 10-K, to the extent not set forth herein, is incorporated by reference from the Registrant’s definitive Proxy Statement for the Annual Meeting of Stockholders to be held April 21, 2016.
INTERSIL CORPORATION
FORM 10-K
For the Fiscal Year Ended January 1, 2016
|
Item 1. |
3 | |
|
Item 1A. |
8 | |
|
Item 1B. |
19 | |
|
Item 2. |
19 | |
|
Item 3. |
19 | |
|
Item 4. |
20 | |
|
|
|
|
|
Item 5. |
20 | |
|
Item 6. |
23 | |
|
Item 7. |
Management’s Discussion and Analysis of Financial Condition and Results of Operations |
23 |
|
Item 7A. |
32 | |
|
Item 8. |
33 | |
|
Item 9. |
Changes in and Disagreements with Accountants on Accounting and Financial Disclosure |
64 |
|
Item 9A. |
64 | |
|
Item 9B. |
65 | |
|
|
|
|
|
Item 10. |
65 | |
|
Item 11. |
66 | |
|
Item 12. |
Security Ownership of Certain Beneficial Owners and Management and Related Stockholder Matters |
66 |
|
Item 13. |
Certain Relationships and Related Transactions, and Director Independence |
66 |
|
Item 14. |
66 | |
|
|
|
|
|
Item 15. |
67 | |
2
Forward Looking Statements
This Annual Report on Form 10-K contains statements relating to expected future results and business trends of Intersil Corporation (“Intersil,” which may also be referred to as “we,” “us” or “our”) that are based upon our current estimates, expectations, assumptions and projections about our industry, as well as upon certain views and beliefs held by management, that are “forward-looking statements” as defined in the Private Securities Litigation Reform Act of 1995, as amended, and other safe harbors under the Securities Act of 1933, as amended, and the Securities Exchange Act of 1934, as amended, or the Exchange Act. Forward-looking statements are not statements of historical fact and generally can be identified by words such as “anticipates,” “believes,” “estimates,” “expects,” “goals,” “intends,” “may,” “plans,” “predicts,” “projects,” “targets,” “will be,” “will continue,” “will likely result,” and similar expressions. In addition, any statements that refer to expectations, projections, or other characterizations of future events or circumstances, including any underlying assumptions, are “forward-looking statements.” Forward-looking statements include, but are not limited to, statements that relate to our business, future revenues, future expenses, future profits or losses, growth plans and other strategies, product and customer initiatives, market growth projections and our industry in general. Readers are cautioned that these forward-looking statements are based on current predictions, expectations and assumptions that are subject to risks, uncertainties and other factors that could cause our actual results to differ materially from those reflected in the forward-looking statements. Factors that might cause or contribute to such differences include, but are not limited to, those discussed in the section entitled “Risk Factors” in Part I, Item 1A of this Annual Report. Any forward-looking statements are made only as of the date hereof and we undertake no obligation to update or revise any forward-looking statements or reflect events or circumstances after the date of this Annual Report except to the extent required by law or otherwise.
Our web address is www.intersil.com. We post all Securities and Exchange Commission, or SEC, filings on our website, including our Annual Reports on Form 10-K, our Quarterly Reports on Form 10-Q, our Current Reports on Form 8-K, the filings made by our officers and directors pursuant to Section 16(a) of the Exchange Act, our proxy statements on Schedule 14A related to our annual meeting of stockholders and any amendments to these reports or statements filed or furnished pursuant to Section 13(a) or 15(d) of the Exchange Act.
We have adopted a Corporate Code of Ethics, which is available on our website. The content on any website (including any attachments or links contained in such website) referred to in this filing is not incorporated by reference into this filing unless expressly noted otherwise.
The SEC maintains an internet site that contains reports, proxy and information statements, and other information regarding issuers that file electronically with the SEC at www.sec.gov. You may also read and copy any materials filed by us with the SEC at the SEC’s Public Reference Room at 100 F Street, NE, Washington, DC 20549 and may obtain information on the operation of the Public Reference Room by calling the SEC at (202) 551-8090.
Company Overview
We design and develop innovative power management and precision analog integrated circuits, or ICs. We were formed in August 1999 when we acquired the semiconductor business of Harris Corporation and began operating as Intersil Corporation. The acquired semiconductor business included multiple product portfolios and intellectual property dating back to 1967 when semiconductor companies were just emerging in Silicon Valley. We are now an established supplier of power management and precision analog technology for many of the most rigorous applications in the infrastructure, industrial, automotive, military, aerospace, computing, and consumer markets. We supply a full range of power IC solutions for battery management, processor power management, and display power management, including power regulators, converters and controllers, as well as fully integrated power modules. We also provide precision analog components such as amplifiers and buffers, proximity and light sensors, data converters, optoelectronics, video decoders and interface products. As a major supplier of radiation-hardened devices to the military and aerospace industries, our product development methodologies reflect the long-term experience we have in designing products to meet the highest standards for reliability and performance in harsh environmental conditions, such as outer space.
3
Business Strategy
In 2013, we refocused our strategy to target the power management IC market, focusing our diverse product portfolio where our unique capabilities and the size of the market opportunity could enable sustained growth. We concentrate our research and development, or R&D, resources in next-generation solutions that are designed to expand our offerings in this target market, leverage our differentiated technology and offer significant competitive advantages to our customers. We are focused on three main strategies:
•Expand our presence in power management for industrial & infrastructure applications. Our advanced analog and digital power management products position us to benefit from growth in data centers, communications infrastructure build-outs and a continued trend towards improved energy efficiency across industrial applications.
•Establish leadership in power management for mobile applications. Our heritage in computing, our unique modulation capability and established relationships with the leading suppliers of mobile devices are driving a comprehensive strategy to target the explosive growth in the mobile computing market.
•Extending our leadership in targeted applications in the automotive and aerospace markets. We have a long history and are recognized as a market leader in radiation-hardened commercial satellite applications. We also have a growing presence in both video and power applications targeted at the automotive market.
Products and Technology
We have a number of core technologies that allow us to deliver differentiated products to the marketplace. These products address opportunities which we divide into two market categories: (1) industrial & infrastructure and (2) computing & consumer.
Industrial & Infrastructure
Industrial & infrastructure products represented 65.6% of our revenue during 2015, 63.7% of our revenue in 2014 and 59.0% of our revenue in 2013. The largest component of this market category includes products for power, automotive, aerospace, and broad-line industrial applications. Power products include many of our most promising industrial & infrastructure products – digital power controllers, modules and switching regulators, as well as other general purpose power devices. In automotive, we are targeting both infotainment and power applications. Our video decoders form a primary building block for console displays and rear view camera displays that are becoming a common safety feature in mid- to high-end vehicles and are required in all passenger cars in the U.S. beginning in 2018. We are applying our power management technology to expand our presence in infotainment and other opportunities within the automobile passenger cabin, and addressing the growing market for battery management within hybrid and fully electric vehicles. Our radiation-hardened products offer advantages for the most rigorous applications, including commercial aerospace, and make up another large component of our industrial & infrastructure revenue. Our computing heritage has resulted in a leading suite of products for analog and digital power management addressing the rapid expansion of cloud computing and communications infrastructure. Our products in this category also enable multiple functions in hundreds of other industrial systems from factory automation to test and measurement equipment.
Computing & consumer
Computing & consumer products represented 34.4% of our revenue during 2015, 36.3% of our revenue in 2014 and 41.0% of our revenue in 2013. This is the most competitive of our end-markets and is characterized by high volumes and short life cycles. We have proven over the years that our technology leadership, particularly in power management, can enable us to win designs in the industry’s highest profile computing and consumer devices. As we continue to develop higher value and more integrated solutions for the consumer market, we believe we can maintain a strong presence among the most innovative providers of consumer electronics.
Geographic Financial Summary
We operate exclusively in the semiconductor industry and primarily within the power management and high-performance analog sector of the industry. Substantially all of our revenue resulted from the sale of semiconductor products. For the sale of products to distributors, original equipment manufacturers and contract manufacturers, the assignment of a geographical location for such revenue
4
is based on the location of the distributions, original equipment manufacturers, or contract manufacturers who purchased our product, which may differ from the geographic location of the end customer.
A summary of our operations by geographic area is below (in thousands):
|
|
Year Ended |
||||||||||
|
|
January 1, 2016 |
|
January 2, 2015 |
|
January 3, 2014 |
||||||
|
North America operations |
|
|
|
|
|
|
|
|
|
|
|
|
Revenue |
$ |
91,932 |
|
|
$ |
101,268 |
|
|
$ |
90,348 |
|
|
Tangible long-lived assets |
$ |
52,991 |
|
|
$ |
55,681 |
|
|
$ |
59,469 |
|
|
International operations |
|
|
|
|
|
|
|
|
|
|
|
|
Revenue |
$ |
429,684 |
|
|
$ |
461,287 |
|
|
$ |
484,847 |
|
|
Tangible long-lived assets |
$ |
18,053 |
|
|
$ |
16,591 |
|
|
$ |
22,398 |
|
We market products for sale to our customers, including distributors and other resellers, primarily in China, the U.S., South Korea, Japan, Germany, Singapore and Taiwan. A summary of percentage of revenue by country is shown below for countries where revenue exceeded 10% in any one year presented:
|
|
Year Ended |
||||||||||
|
|
January 1, 2016 |
|
January 2, 2015 |
|
January 3, 2014 |
||||||
|
Revenue by country |
|
|
|
|
|
|
|
|
|
|
|
|
China |
|
47.1 |
% |
|
|
50.9 |
% |
|
|
52.9 |
% |
|
United States |
|
17.4 |
% |
|
|
18.1 |
% |
|
|
15.7 |
% |
One distributor, Avnet, Inc., represented 20.7%, 18.4% and 17.0% of revenue during 2015, 2014 and 2013, respectively, and 17.8% and 24.4% of trade receivables as of January 1, 2016 and January 2, 2015, respectively.
Sales, Marketing and Distribution
We sell our products through our direct geographical salesforce and a network of distributors. Our sales team focuses on major accounts that are strategic to our marketing and product strategies. The direct geographical salesforce works closely with a network of distributors, value-added resellers and manufacturers’ representatives, creating a worldwide selling network. Our dedicated direct geographical salesforce operates in the North American, European, Japanese and Asia/Pacific markets. We strategically locate our sales offices near major original equipment manufacturers, or OEMs, original design manufacturers, or ODMs, and contract manufacturers throughout the world. Our technical applications organization is deployed alongside our direct geographical salesforce, which helps ensure our focus on applications as well as products and customers. Our dedicated marketing organization supports field sales and is aligned by specific product group. Our salesforce is supported by our worldwide customer service and logistics organizations.
Distributors and value-added resellers handle a wide variety of products, including products sold by other companies that compete with our products. Most of our distributor agreements provide the distributors with protection from market price fluctuations and/or the right to return some unsold products. Some of our distribution agreements contain an industry-standard stock rotation provision allowing for minimum levels of inventory returns or scrap. Our distributors accounted for 56.8% and 58.3% of our revenue in 2015 and 2014, respectively.
Research and Development
We believe that the continued introduction of new products in our target markets is essential to our growth. R&D expenses were $126.4 million, $125.9 million and $130.5 million in 2015, 2014 and 2013, respectively, and 24.2%, 22.4% and 22.7% of revenue in 2015, 2014 and 2013, respectively. We believe that we must continue to innovate, enhance and expand our products and services to maintain our leadership position and we intend to achieve this through our own R&D efforts, the licensing of technology and selective acquisitions. As of January 1, 2016, we had 445 employees engaged in R&D.
5
Manufacturing
Our products are manufactured using silicon wafers. Our business is dependent upon the reliable fabrication, packaging and testing of these silicon wafers. Our ICs are manufactured by leading foundry suppliers such as GlobalFoundries, Taiwan Semiconductor Manufacturing Company, and United Microelectronics Corporation. We also fabricate silicon wafers into ICs in our Florida manufacturing facility. During 2015, we internally produced 14% of our wafers and outsourced the manufacture of the remaining 86% to our foundry partners.
Following fabrication, the ICs are subject to packaging and testing processes. The majority of these processes are performed by independent subcontractors located in Malaysia, Taiwan, China and the Philippines. We also maintain internal assembly and test capabilities for certain products in our Florida facility.
While we have not experienced any significant delay in obtaining raw materials, we rely exclusively on our foundry partners for sourcing silicon wafers, which are the critical building block of our products, for the ICs they manufacture on our behalf. As our dependency on outsourced foundry partners continues to increase, so does our risk of incurring a production-limiting shortfall. As is typical in the semiconductor industry, we must allow for significant lead times for the delivery of certain raw materials. The production of ICs, from wafer fabrication through packaging and final testing, is generally expected to take eight to sixteen weeks to complete. We manufacture thousands of different products and our customers often require delivery within a short period of time following their order. To consistently meet these requirements, we maintain a substantial work-in-process and finished goods inventory. Manufacturing, assembly and testing of ICs is a complex process. Normal risks include errors and interruptions in the production process, defects and shortages in raw materials, disruptions at supplier locations, unexpected demand, as well as other risks, all of which can have an unfavorable impact to production costs, gross margins and our ability to meet customer demand.
Backlog
Our product sales are made pursuant to purchase orders that are generally booked up to six months in advance of delivery. Our standard terms and conditions of sale provide that these orders may not be cancelled or rescheduled after the date that is thirty days prior to the most current customer request date, or CRD, for standard products and after the date that is ninety days prior to the CRD for semi-custom and custom products. Backlog is influenced by several factors, including end-market demand, pricing and customer order patterns. Additionally, backlog can fall faster than consumption rates in periods of weak end-market demand since production lead times can be shorter. Conversely, backlog can grow faster than consumption rates in periods of strong end-market demand as production and delivery times increase and some customers may increase orders in excess of their current consumption to reduce their own risk of production disruptions. The majority of our backlog for sales to distributors is valued at list price, which can be substantially higher than the prices ultimately recognized as revenue. Considering these practices and our experience, backlog alone cannot be consistently relied on to predict actual revenue for future periods.
Seasonality
The computing & consumer markets have historically experienced weaker demand in the first half of the year as compared to the second half of the year.
Competition
The power management and high-performance analog market is extremely competitive. We compete in our target markets with many companies that may have significantly greater resources than us, including, but not limited to, Analog Devices, Infineon, Linear Technology, Maxim Integrated Products, ON Semiconductor and Texas Instruments. We compete on the basis of key intellectual property that enables advantages in technical performance, product features, customized design, price, availability, quality, reliability, sales and/or technical support. In addition, there has recently been a high level of consolidation in the semiconductor industry. If these or future acquisitions are successful, competition may intensify, and our competitors may have additional resources to compete against us.
6
Acquisitions
An element of our business strategy involves expansion through the acquisition of businesses, assets, products or technologies that allow us to complement our existing product offerings, expand our market coverage, increase our engineering workforce or enhance our technological capabilities. From time-to-time, we consider acquisitions that may strengthen our business.
On September 8, 2015, we acquired Great Wall Semiconductor Corporation, or GWS, a privately held manufacturer of metal oxide semiconductor field-effect transistors. We acquired GWS to broaden our product portfolio to better serve our customers who purchase certain commercial and radiation-hardened power management products.
The purchase consideration consisted of $18.9 million in cash, of which $2.8 million is held in escrow for a period of 16 months and is subject to claims for contingent liabilities and working capital adjustments. In addition, the acquisition agreement provides for a cash earn-out payment of up to an additional $4.0 million if either specified revenue targets are achieved or a disposition event occurs on or before December 30, 2016. A disposition event would include transfer of GWS or its assets, or a transfer of a majority of the assets or acquisition of Intersil by a third party.
Trademarks, Trade Secrets and Patents
We own rights in trademarks, trade secrets, and patents that are important to our business. We acquire trademark rights through registration applications or trademark usage. We use trademarks to identify Intersil products and build brand awareness, including through periodic advertising. We seek to maintain our trade secrets through security measures, policies and the use of confidentiality agreements. We also file patent applications to secure exclusive patent rights to potentially valuable inventions in the U.S. and in select foreign countries where we believe filing for such protection is beneficial. We may, however, elect, in certain cases, not to seek patent protection for potentially valuable inventions, if we determine other forms of protection, such as maintaining the invention as a trade secret, to be more advantageous. The expiration dates of our patents range from 2016 to 2034. While our patents, trademarks and trade secrets benefit us, we believe that our competitive position and future success is also determined by other factors, including our ability to innovate, our technical expertise, and our management ability.
Employees
Our worldwide workforce consisted of 1,027 employees as of January 1, 2016. None of our employees are subject to a collective bargaining agreement.
Environmental Matters
We believe that our operations are substantially in compliance with all applicable environmental requirements. Our costs and capital expenditures to comply with environmental regulations have been immaterial during the last three years. However, we are subject to numerous federal, state and international environmental laws and regulatory requirements. From time-to-time, we have become involved in investigations, litigation matters or other claims regarding potential environmental issues at our facilities or former facilities (including those of companies we have acquired). Further, we may receive notices from the U.S. Environmental Protection Agency or equivalent state or international environmental agencies that allege that we are a potentially responsible party under various environmental protection laws, including the Comprehensive Environmental Response, Compensation and Liability Act, commonly referred to as the Superfund Act, and/or equivalent laws. Such notices can assert potential liability for cleanup costs at various sites, which may include sites owned by us, sites we previously owned and treatment or disposal sites not owned by us, allegedly containing hazardous substances attributable to us. In September of 2015, we received notification from Thomson Consumer Electronics Television Taiwan, Ltd., or TCETVT, that it intends to seek indemnification from us for expenses incurred as a result of a toxic tort claim filed against TCETVT arising from injuries allegedly sustained from groundwater contamination at a manufacturing facility previously owned and operated by the predecessors of our Taiwan subsidiary. The amount of the claim, as of September 2015, is $45.6 million, however, TCETVT believes the claim could grow to $200 million if the court allows additional claimants to join the pending lawsuit. We have notified our predecessors of their indemnification obligations to us for all liability under this claim; our predecessors have not yet agreed to indemnify us for this matter. While it is not feasible to predict the outcome of these proceedings, in the opinion of our management, any payments we may be required to make as a result of such claims currently in existence will not have a material adverse effect on our financial condition, results of operations or cash flows. To the extent any known contamination occurred prior to August 1999, we believe we can successfully make a claim for indemnity against our predecessors for any such environmental liabilities. These indemnification obligations by our predecessors do not expire, nor do they have a maximum amount.
7
However, while we believe that our predecessors currently maintain sufficient assets to cover any indemnification obligation that they may owe to us, we cannot be assured that our predecessors will have such assets at a time we make a claim.
You should carefully consider and evaluate all of the information in this Annual Report on Form 10-K, including the risk factors listed below. In addition to these risks, other risks not now known to us or that we currently deem immaterial may also impair our business operations. If any of these risks occur, our business could be materially harmed and it could impact our results of operations, financial condition, liquidity and cash flows. If our business is harmed, the trading price of our Class A common stock could decline.
As discussed in “Forward Looking Statements” in Item 1 above, this Annual Report on Form 10-K contains forward-looking statements that involve risks and uncertainties. Our actual results could differ materially from those anticipated in the forward looking statements, including as a result of the risks described in this “Risk Factors” section and elsewhere in this Annual Report on Form 10-K, in our other filings with the SEC and in material incorporated by reference. We undertake no duty to update or revise any forward-looking statement, whether as a result of new information, future events or otherwise.
Global economic conditions and uncertainty, as well as the highly cyclical nature of the semiconductor industry, could adversely affect our revenue, operating results, cash flows, collectability of accounts receivable and supplier relationships, and our ability to access capital markets.
Adverse global economic conditions have, from time–to-time, caused or exacerbated significant slowdowns in the semiconductor industry generally, as well as in our specific end-markets, which has adversely affected our business and results of operations. In recent periods, market and business conditions in general have been adversely affected by investor and customer concerns about the global economic outlook, including concerns about the rate of a global economic recovery. In addition, our operations and performance depend significantly on worldwide economic conditions, in which significant uncertainty currently exists. These uncertainties pose risks to us because end-market customers and others may postpone spending in response to negative financial news, declines in overall consumer sentiment or spending, increased unemployment in the U.S. or abroad or declines in income or asset values, which could have a material negative effect on the demand for our products and services.
The semiconductor industry is highly cyclical. The semiconductor industry has experienced significant downturns, often in connection with product cycles of both semiconductor companies and their customers, but also related to declines in general economic conditions. These downturns have been characterized by significantly reduced customer demand, high inventory levels and accelerated erosion of average selling prices. Any future general economic or semiconductor industry downturn could materially and adversely affect our business from one period to the next relative to demand, product pricing, revenue and financial results. In addition, the semiconductor industry has experienced periods of increased demand, during which we may experience internal and external manufacturing constraints, which could cause us to lose revenue opportunities and market share. We may experience substantial volatility in future operating results due to the cyclical nature of the semiconductor industry.
We may not be able to compete successfully in the highly competitive semiconductor industry.
The semiconductor industry is intensely competitive and many of our direct and indirect competitors have substantially greater financial, technological, manufacturing, marketing and sales resources. Our competitors may also have longer-standing and more comprehensive relationships with suppliers and customers that gives them a marketplace advantage over us. The current level of competition in the semiconductor market is high and may increase in the future. We currently compete directly with companies that have developed similar products, including Analog Devices, Linear Technology, Maxim Integrated Products, ON Semiconductor, and Texas Instruments. We also compete indirectly with numerous semiconductor companies that offer products based on alternative solutions. These direct and indirect competitors are established, multinational semiconductor companies as well as emerging companies. In addition, there has recently been a high level of consolidation in the semiconductor industry. If these or future acquisitions are successful, competition may intensify, and our competitors may have additional resources to compete against us. Our ability to compete successfully in the rapidly evolving and increasingly more complex area of IC technology depends on several factors, including:
•success in designing and manufacturing new products that implement new technologies;
•ability to hire, retain and motivate adequate numbers of engineers and other qualified employees;
8
•protection of our proprietary products, processes, trade secrets and know-how;
•maintaining high product quality and reliability;
•pricing policies of our competitors;
•the relative performance of competitors’ products;
•ability to deliver in large volumes on a timely basis;
•marketing, manufacturing and distribution capability; and
•financial strength.
To the extent that our products achieve market success, competitors typically seek to offer competitive products and/or lower prices. Our failure to compete successfully, or our competitors’ success in offering competitive products or lower prices, could harm our business and adversely impact our results of operations.
Our ability to maintain or expand our business depends on the successful development and market acceptance of our new products.
We operate in a dynamic environment characterized by intense competition, rapid technological change, evolving standards, short product life cycles and continuous erosion of average selling prices. Consequently, our future success will be highly dependent upon our ability to continually develop new products using the latest and most cost-effective technologies, the general commercial availability of our products ahead of the competition and having our products selected for inclusion in the products of leading system manufacturers. The development of new products will continue to require significant R&D expenditures.
The introduction of new products presents significant business challenges as product development commitments and expenditures must be made well in advance of related revenues. The success of a new product depends on accurate forecasts of long-term market demand, future technological developments and a variety of specific implementation factors, including:
•timely and efficient completion of process design and development;
•timely and efficient implementation of manufacturing and assembly processes;
•our relative product performance;
•the quality and reliability of our product;
•effective marketing, sales and service; and
•customer acceptance of our products over those of our competitors.
If we are unable to successfully execute any of these elements of new product development, our market share could decline, we would not achieve the expected return on investment for our R&D expenditures and our results of operations could be adversely affected.
Our competitiveness and future success depend on our ability to achieve design wins for our products with current and future customers and introduce new or improved products that meet customer needs while achieving favorable margins. A failure to develop, produce and market products in a timely manner, or to achieve market acceptance for these products, could have a variety of negative effects on our competitive position and our financial results, such as reducing our revenue, decreasing our market share, increasing our costs, lowering our gross margin percentage, and possibly leading to impairment of assets.
9
A downturn in the end-markets we serve could cause a reduction in demand for our products and limit our ability to maintain revenue levels and operating results.
Any deterioration in the end-markets we serve or our inability to compete for new solutions within the end-markets we serve could lead to a reduction in demand for our products which could adversely affect our revenue and results of operations.
The end-markets we serve are characterized by rapid product obsolescence and require that our products be made commercially available within a specific market window. If we are unable to accurately forecast demand for our products, or we are unable to deliver products in a timely manner, our financial condition and results may be adversely affected.
The end-markets we serve are generally characterized by high volumes, short life cycles and rapidly changing market requirements, products and customer demand. Our success in these end-markets will depend principally on our ability to:
•predict technology and market trends;
•develop products on a timely basis; and
•meet the market windows.
If we are unable to consistently perform the foregoing activities, we may not be able to sustain or grow our revenues.
In addition, sudden changes in customer demand, order cancellations or delay in product shipments to end-market customers could materially and adversely affect our revenues and results of operations.
We depend on third-party suppliers, located around the world, for raw materials and services to manufacture our products, which can result in supply disruptions, sudden cost increases and delays beyond our control in delivering our products to customers.
Production time and the cost of our products could increase and our results of operations could be adversely effected if we were to lose one or more of our suppliers or if one or more of those suppliers increased the prices of raw materials or if we were unable to obtain adequate raw materials in a timely manner. Our manufacturing operations depend upon obtaining adequate raw materials on a timely basis. We generally purchase raw materials, such as silicon wafers, from a limited number of suppliers on a just-in-time basis. From time-to-time, suppliers may extend lead times, limit supplies or increase prices due to capacity constraints or other factors.
We use both internal and third-party wafer fabrication facilities in manufacturing our products. We intend to continue to rely heavily on third-party suppliers for most of our manufacturing requirements. Most of these third-party suppliers are not obligated to supply products to us for any specific period, in any specific quantity or at any specific price. As a result, we cannot directly control delivery schedules, which could lead to product shortages, quality assurance issues and increases in the cost of our products. We may experience delays and cannot be sure that we will be able to obtain products within the timeframes or in the volumes required by us at an affordable cost, or at all. Any disruption in the availability of silicon wafers or other raw materials or any problems associated with the delivery, quality or cost of the fabrication, assembly and testing of our products could significantly hinder our ability to deliver our products to our customers and may result in a decrease in the sales of our products. If our third-party suppliers are unable to provide our products, we may be required to seek new suppliers and we cannot be certain that we will be able to locate and qualify new suppliers on favorable terms or that sufficient capacity will be available within a reasonable period of time.
In addition, the process to manufacture our products is highly complex and precise, requiring production in a highly controlled environment. Changes in manufacturing processes or the inadvertent use of defective or contaminated materials by a third-party supplier could adversely affect their ability to achieve acceptable manufacturing yields and product reliability. If our suppliers do not achieve adequate yields or product reliability, our customer relationships could suffer. This could ultimately lead to a loss of sales of our products and have a negative effect on our reputation, business, financial condition and/or results of operations. Additionally, our contract manufacturers may decide to discontinue operations at a particular location or altogether, which would cause us to transfer those manufacturing operations elsewhere, which would increase our costs, disrupt the supply of products and harm our financial results.
10
Delays in production at a new facility, in implementing new production techniques or in resolving issues associated with technical equipment malfunctions, may lower yields and reduce our revenues and profitability.
Our manufacturing processes are very complex, require advanced and costly equipment and are continuously modified to improve yields and product performance. Impurities or other issues in the manufacturing process can lower yields. Our manufacturing efficiency is an important factor in our profitability and we may not be able to maintain or increase our manufacturing efficiency to the same extent as our competitors, which would place us at a competitive and cost disadvantage relative to our competitors.
We may experience difficulty in beginning production at new facilities or in effecting transitions to new manufacturing processes. Resultant delays can be unpredictable and can result in late product deliveries and reduced yields. We may experience manufacturing issues in achieving acceptable yields or experience product delivery delays in the future as a result of, among other things, capacity constraints, construction delays, upgrading or expanding existing facilities or changing our process technologies, any of which could result in a loss of future revenues. Increases in fixed costs and operating expenses related to increases in production capacity may adversely affect our operating results if revenues do not increase proportionately.
If our products contain defects or fail to achieve acceptable reliability standards, our reputation may be harmed, and we may incur significant unexpected expenses and lose sales opportunities. Our insurance coverage for such events may be insufficient.
Semiconductor products are highly complex and may contain defects that are not detected until after the product is introduced into the market. We generally warrant our products for one year from the date of shipment. If any of our products contain defects, we may be required to incur additional development and remediation costs, pursuant to warranty and indemnification obligations in our terms and conditions of sale. Our products may contain undetected errors or defects that may:
•cause delays in our product introductions and shipments;
•result in increased costs and diversion of development resources;
•cause us to incur increased charges due to obsolete or unusable inventory;
•require design modifications; or
•decrease market acceptance or customer satisfaction with these products, resulting in product returns, recalls, harm to our reputation and lost sales.
In addition, we may not identify defects or failures in a timely manner, which may result in loss of or delay in market acceptance and could significantly harm our operating results. Our current and potential customers might also seek to recover from us any losses resulting from defects or failures in our products. Further, such claims might be significantly higher than the revenues and profits we receive from the products involved, as we are typically a component supplier with limited value content relative to the value of a complete system or sub-system. Liability claims could require us to spend significant time and money in litigation or to pay significant damages for which we may have insufficient insurance coverage. Any of these claims, whether or not successful, could seriously damage our reputation and business.
Products we manufacture and sell, or products formerly produced and sold by us and now manufactured and sold by purchasers of businesses that we have divested, may infringe other parties’ intellectual property, or IP, rights. We may have to pay third parties damages for infringement and misappropriation of their IP rights, suspend the manufacture, use or sale of some the affected products, or incur the cost of defending litigation, resulting in significant expense to us.
The semiconductor industry is characterized by vigorous protection and pursuit of IP rights. We have received, and expect to receive in the future, notices of claims of infringement and misappropriation of other parties’ proprietary rights. In the event of an adverse decision in a patent, trademark, copyright, mask work or trade secret litigation matter, we could be required to withdraw the product or products found to be infringing from the market or be required to redesign such products. We have, at times, assumed indemnification obligations in favor of our customers that could be triggered upon an allegation or finding of our infringement of other parties’ proprietary rights. We have also, at times, assumed indemnification obligations in favor of the purchasers of businesses that we have
11
divested that could be triggered upon an allegation or finding of infringement of other parties’ proprietary rights by us or those purchasers.
Whether or not these infringement claims are ultimately successful, we would likely incur significant costs and diversion of management’s attention in the defense of these claims. To address any potential claims asserted against us or those we have indemnified, we may seek to obtain a license under a third-party’s IP rights. However, in such an instance, a license may not be available on commercially reasonable terms, if at all, and payments under such a license could increase our costs and reduce our margins. Litigation could result in significant expense to us, adversely affecting sales of the challenged product or technology and diverting the efforts of our technical and management personnel, whether or not the litigation is determined in our favor. In the event of an adverse outcome in any litigation, we may be required to:
•pay significant attorneys’ fees in the defense of any such claim;
•pay substantial damages, which may include enhanced damages for willful infringement and the other party’s attorneys’ fees, which could be significant;
•indemnify our customers for damages they might suffer if the products they purchase from us infringe the IP rights of others;
•indemnify purchasers of businesses that we have divested for damages they might suffer if certain of the products they sell infringe the IP rights of others;
•stop our manufacture, use, sale or importation of infringing products;
•expend significant resources to develop or acquire non-infringing technology;
•discontinue the use of some processes; and/or
•obtain licenses to IP rights covering products and technology that may, or may have been found to, infringe or misappropriate such IP rights.
The occurrence of any of the foregoing may adversely affect our revenues and results of operations or damage our reputation.
If we, or our suppliers, suffer loss or significant damage to our factories, facilities or distribution systems due to catastrophe, our operations could be seriously harmed.
Our factories, facilities and distribution systems, and those of our suppliers, are subject to risk of catastrophic loss due to fire, flood, earthquake or other natural or man-made disasters. For example, our internal wafer fabrication facility is located on the east coast of Florida. Operations at this facility may experience disruptions and damage during tropical storms and hurricanes. Further, our corporate headquarters is located near major earthquake fault lines in California and we have been unable to obtain earthquake insurance at reasonable costs and limits. Some of our facilities and those of most of our suppliers are located in the Pacific Rim region known to have above average seismic and severe weather activity. Any catastrophic natural disaster in those regions or catastrophic loss or significant damage to any of our facilities or those of our suppliers would likely disrupt our operations, delay production, shipments and revenue, and could materially and adversely affect our business. Such events could also result in significant expenses to repair or replace our affected facilities, and in some instances could significantly curtail our research and development efforts.
12
We use a significant amount of IP in our business. If we are unable to protect this IP, we could lose our right to prevent others from using our key technologies, resulting in decreased revenues.
We rely on IP rights to protect our technology. Our rights include, but not are limited to, rights existing under patent, trade secret, trademark, mask work and copyright law. Some of our technology is not covered by any patent or patent application, and there are risks that our patents may be invalidated, circumvented or challenged.
Competitors may develop technologies that are similar or superior to our technology, duplicate our technology or design around our patents. In addition, effective patent, trademark, copyright, mask work and trade secret protection may be unavailable, limited or not applied for in certain foreign countries.
We also seek to protect our proprietary technology, including technology that may not be patented or patentable, in part by confidentiality agreements and, if applicable, inventors’ rights agreements with our collaborators, advisors, employees and consultants. We cannot assure that these agreements will always be undertaken or will not be breached or that we will have adequate remedies for any breach.
Some of the licenses we have to use third-party IP are time bound, and will expire, unless extended. Prior to expiration, we will be required to negotiate renewals of these agreements or obtain the IP from alternative sources. We may not be able to obtain alternative IP, or renewals on substantially similar terms as those that currently exist, or at all. Any failure to renew or obtain alternative licenses could cause us to cease offering certain products or features or expend resources to develop alternative technology, expose us to litigation and other IP claims and increase our costs, any of which could harm our business and results of operations.
The failure to protect our IP, to extend our existing license agreements or the inability to utilize alternative technology, could adversely affect our revenues.
We are subject to a variety of domestic and international laws and regulations related to the import and export of our products, including those issued by the U.S. Department of Commerce, the U.S. Department of Homeland Security and the Foreign Corrupt Practices Act.
As an exporter, we must comply with various laws and regulations relating to the export of our products, services and technologies from the U.S. and other countries having jurisdiction over our operations. In the U.S., these laws and regulations include, among others, the Export Administration Regulations, or EAR, administered by the U.S. Department of Commerce, Bureau of Industry and Security, the International Traffic in Arms Regulations, or ITAR, administered by the U.S. Department of State, Office of Defense Trade Controls Compliance, or DTCC, and trade sanctions, regulations and embargoes administered by the U.S. Department of Treasury, Office of Foreign Assets Control. Certain of our products have military or strategic applications and are on the munitions list of the ITAR, or represent so-called “dual use” items governed by the EAR. As a result, these products require individual validated licenses in order to be exported to certain jurisdictions. Any failures to properly classify products or otherwise comply with these laws and regulations could result in civil or criminal penalties, fines, investigations, adverse publicity and restrictions on our ability to export our products, and repeat failures could carry more significant penalties. Any changes in export regulations may further restrict the export of our products. The length of time required by the licensing processes can vary, potentially delaying the shipment of products and the recognition of the corresponding revenue. Any restrictions on the export of our products or product lines could have a material adverse effect on our competitive position, results of operations, cash flows or financial condition.
In September 2010, in response to a request for information, we disclosed to the DTCC information concerning export activities for the years 2005 through 2010 pursuant to the DTCC’s authority under ITAR. In June of 2013, the DTCC notified us of potential violations of ITAR and that it was considering pursuing administrative proceedings against us. On June 16, 2014, we entered into a Consent Agreement with the DTCC for the purpose of resolving the potential violations of ITAR. Our agreement with the DTCC has a two-year term and provides for: (i) payment of an aggregate civil penalty of $10 million, $4 million of which is suspended and eligible for offset credit based on verified expenditures for certain past and future remedial compliance measures; (ii) the appointment of an internal Special Compliance Official to oversee compliance with the Agreement and U.S. export control regulations; (iii) two external audits of the Company’s ITAR compliance program; and (iv) continued implementation of ongoing remedial compliance measures and additional remedial compliance measures related to automated systems and ITAR compliance policies, procedures, and training.
We are also subject to customs regulations, administered by the Department of Homeland Security, U.S. Customs and Border Patrol and similar laws, which control the import of technologies into the U.S. and various other aspects of the operation of our business. We
13
are also subject to the Foreign Corrupt Practices Act and similar anti-bribery laws, which prohibit companies from making improper payments to government officials for the purposes of obtaining or retaining business. While our policies and procedures mandate compliance with such laws and regulations, we can provide no assurance that our employees and agents will always act in strict compliance. Failure to comply with such laws and regulations may result in civil and criminal enforcement, including monetary fines and possible injunctions against shipment of our products or other activities, which could have a material adverse impact on our results of operations and financial condition.
We may not be able to recruit and retain highly skilled personnel.
Our success depends upon our ability to recruit and retain highly skilled technical, managerial, marketing and financial personnel. Highly skilled employees are difficult to attract and retain in the highly competitive semiconductor industry, and the failure to attract and retain such personnel could negatively impact our ability to keep pace with our competitors. Further, we have in the past several years announced certain cost reductions that included reductions in our work force. These reductions in personnel, as well as any future cost reduction measures, could negatively impact morale, leading to unintended employee attrition and difficulty in recruiting personnel.
Most of our distributors and value-added resellers can terminate their contract with us with little or no notice. The termination by a distributor or value-added reseller could result in a materially negative impact on our business, including a negative impact to our revenue and accounts receivable.
In 2015, our distributors accounted for 56.8% of our revenue. Our distributors can generally terminate their agreement with us with only minimal notice. One of our distributors accounted for more than 10% of our revenue in 2015. The termination of a significant distributor or value-added reseller could impact our revenue and limit our access to certain end-customers. It could also result in the return of excess inventory. Since many distributors simply resell our products, they generally operate on low profit margins. If a distributor or value-added reseller were to terminate their agreement with us or go out of business, our accounts receivable originating through that distributor or value-added reseller would be subject to significant collection risk.
All of our distributors and value-added resellers carry competing product lines. Our sales would be adversely affected if our distributors or value-added resellers promoted competing products over our products for any reason, including the ability of the distributor or value-added reseller to earn a higher margin or other monetary incentive for doing so.
Our distribution channel partners have recently experienced consolidation due to merger and acquisition activity in that business sector. This consolidation may result in our distributors or resellers allocating fewer resources to the distribution and resale of our products, which could adversely affect our financial results. At times, our sales are concentrated in a small number of distributors or resellers, which are in various international locations and of various financial strengths. Financial difficulties, the inability to access capital markets, or other reasons may affect our distributors' or resellers’ performance, which could materially harm our business and our operating results.
Our financial results may be adversely impacted by higher than expected tax rates, exposure to additional income tax liabilities or adverse outcomes resulting from the examination of our income or other tax returns.
As a global company, our effective income tax rate is highly dependent upon the geographic composition of worldwide earnings and tax regulations. We are subject to income taxes in the U.S. and many foreign jurisdictions and significant judgment is required to determine worldwide tax liabilities. Our effective tax rate, as well as our actual taxes payable, could be adversely affected by changes in the mix of earnings between countries with differing tax rates. Our primary foreign operations are in Malaysia where we currently have a tax holiday resulting in a tax rate of 0%. This 10-year tax holiday began on July 1, 2009 and terminates on July 1, 2019. In order to maintain this tax holiday in Malaysia, we must meet certain operating conditions, including compliance with warehouse and shipping quotas and specified manufacturing activities in Malaysia. Absent such tax holiday, the corporate income tax rate in Malaysia that would otherwise apply to us would be 25%. If we cannot or elect not to comply with these conditions, we could lose the related tax benefits. In such event, we may be required to modify our operational structure and tax strategy. Any such modified structure or strategy may not be as beneficial as the benefits provided under the present tax concession arrangement. In addition, we are subject to the continuous examination of our income tax returns by the Internal Revenue Service, or IRS, and other state and non-U.S. tax authorities. We regularly assess the likelihood of adverse outcomes resulting from these examinations to determine the adequacy of our provision for income taxes. There can be no assurance that the outcomes from these continuous examinations will not have an adverse effect on our business, financial condition, and results of operations.
14
Our business, financial condition and results of operations could be adversely affected by the political and economic conditions of the countries in which we conduct business and other factors related to our international operations.
Non-U.S. sales accounted for 82.4% of our revenue in 2015. We expect that international sales will continue to account for a significant majority of our total revenue in future years. Our international operations and sales are subject to various risks including, but not limited to:
•increases in taxes, tariffs and governmental royalties;
•changes in laws and policies governing operations of foreign-based companies;
•loss of revenue, equipment and property as a result of expropriation, acts of terrorism, war, civil unrest, boycotts, trade restrictions and other political risks;
•unilateral or forced renegotiation, modification or nullification of existing contracts with governmental entities;
•difficulties enforcing our rights against a governmental agency because of the doctrine of sovereign immunity and foreign sovereignty over international operations;
•currency restrictions and exchange rate fluctuations;
•trade balance issues;
•differences in our ability to acquire and enforce our IP and contract rights in varying jurisdictions; and
•the need for technical support resources in different locations.
Many of the challenges noted above are applicable in China, which is a large and fast growing market for semiconductors and an area of additional and continued growth for our business. As the business volume between China and the rest of the world grows, there is inherent risk, based on the complex relationships between China, Taiwan, Japan, and the U.S., that political and diplomatic influences might lead to trade disruptions which would adversely affect our business with China and/or Taiwan and perhaps the entire Asia/Pacific region. A significant trade disruption in these areas could have a material, adverse impact on our future revenue and profits.
Our international operations may also be adversely affected by U.S. laws and policies affecting foreign trade and taxation. The realization of any of these factors could materially and adversely affect our business, financial condition and results of operations.
We are subject to on-going litigation risks and have recently been found liable for trade secret misappropriation and patent infringement.
From time-to-time, we are subject to legal claims, such as the litigation filed against us by Texas Advanced Optoelectronic Solutions, Inc., or TAOS, in 2008. In that litigation matter, at the conclusion of the trial in early 2015, the jury found in favor of TAOS and recommended to the court that we pay over $59 million in damages for trade secret misappropriation and patent infringement; we estimate that with prejudgment interest and the legal fees we anticipate we will incur in the post-trial proceedings and during the appeal, this amount will total $81.1 million. We are also involved in a variety of routine legal matters that arise in the normal course of our business. The outcome of any litigation matter would be inherently uncertain, unpredictable and expensive. An unfavorable resolution of any particular legal claim or proceeding could have a material adverse effect on our consolidated financial position, results of operations, or cash flows.
Environmental liabilities and other governmental regulatory matters could force us to expend significant capital and incur substantial costs.
15
We are subject to various environmental laws relating to the management, disposal and remediation of hazardous materials and the discharge of pollutants into the environment. We are also subject to laws relating to workplace safety and worker health which, among other things, regulate employee exposure to hazardous substances. The future cost of compliance with existing environmental and health and safety laws (and liability for known environmental conditions ) could have a material adverse effect on our business, financial condition or results of operations. In addition, we cannot predict:
•what environmental or health and safety legislation or regulations will be enacted in the future;
•how existing or future laws or regulations will be enforced, administered or interpreted;
•the amount of future expenditures which may be required to comply with these environmental or health and safety laws or to respond to future cleanup matters or other environmental claims; or
•the extent of our obligations to the purchasers of our environmentally challenged sites.
Thomson Consumer Electronics Television Taiwan, Ltd., or TCETVT, notified us in September of 2015, that it reserved its right to seek indemnification from us for any and all costs, fees and expenses it incurs as a result of a toxic tort class action lawsuit filed in Taiwan against TCETVT and others, plus the cost of site remediation. The lawsuit pertains to alleged injuries resulting from groundwater contamination at a manufacturing facility in Taiwan currently owned by TCETVT, which was previously owned and operated by predecessors (including General Electric and Harris Corporation) of our Taiwan subsidiary, Intersil Ltd. TCETVT has informed us that a judgment of $18.5 million has been entered against TCETVT and that it has incurred costs of $11.2 million in defending the lawsuit and $15.9 million in site remediation costs. We were advised by TCETVT that additional claimants made be added to the lawsuit and TCETVT believes that if such additional claimants were successfully added, the resulting liability could be as high as $200 million. If we were ultimately found to be liable for a liability of this magnitude, it would have a material adverse effect on our consolidated financial position and results of operations. Although Harris Corporation has agreed to indemnify us for all environmental liabilities related to events or activities occurring before our acquisition of their semiconductor business, Harris has not yet agreed to indemnify us for the liability asserted by TCETVT. In addition, while we believe that Harris currently maintains sufficient assets to cover any indemnification obligation they may have, there can be no assurance that Harris will have such assets at the time a claim may be made by us.
16
We may acquire other companies or technologies, which could divert our management’s attention, result in additional dilution to our stockholders and otherwise disrupt our operations and harm our operating results.
We may acquire or invest in businesses, applications or technologies that we believe could complement or expand our products, enhance our technical capabilities or otherwise offer growth opportunities. The pursuit of potential acquisitions may divert the attention of management, and cause us to incur various costs and expenses in identifying, investigating and pursuing suitable acquisitions, whether or not they are consummated. We may not be able to identify desirable acquisition targets or be successful in entering into an agreement with any particular target.
In any future acquisition, we may not be able to successfully integrate acquired personnel, operations and technologies, or effectively manage the combined business following the acquisition. We also may not achieve the anticipated benefits from our future acquired businesses due to a number of factors, including:
•inability to integrate or benefit from acquisitions in a profitable manner;
•unanticipated costs or liabilities associated with the acquisition;
•incurrence of acquisition-related costs;
•difficulty converting the clients of the acquired business to our solution and contract terms, including disparities in the revenues, licensing, support or professional services model of the acquired company;
•difficulty integrating the accounting systems, operations and personnel of the acquired business;
•difficulties and additional costs and expenses associated with supporting legacy products;
•diversion of management’s attention from other business concerns;
•harm to our existing relationships with our partners and customers as a result of an acquisition;
•the loss of our or the acquired business’s key employees;
•diversion of resources that could have been more effectively deployed in other parts of our business; and
•use of substantial portions of our available cash to consummate the acquisition.
In addition, a significant portion of the purchase price of companies we acquire may be allocated to acquired goodwill and other intangible assets, which must be assessed for impairment at least annually. In the future, if our acquisitions do not yield expected returns, we may be required to take charges to our operating results based on this impairment assessment process, which could harm our results of operations.
Acquisitions could also result in dilutive issuances of equity securities, the use of our available cash, or the incurrence of debt, which could harm our operating results. In addition, if an acquired business fails to meet our expectations, our operating results, business and financial condition may suffer.
Regulations related to “conflict minerals” have resulted in additional expenses to us, may make our supply chain more complex and may result in damage to our reputation with customers.
17
Pursuant to the Dodd-Frank Wall Street Reform and Consumer Protection Act of 2010, or the Dodd-Frank Act, the SEC adopted requirements for companies that use certain minerals and metals, known as conflict minerals, in their products, whether or not these products are manufactured by third parties. These requirements require companies to diligence, disclose and report whether or not such minerals originate from the Democratic Republic of Congo, or DRC, or adjoining countries. There were and continue to be costs associated with complying with these rules, includes costs related to determining the source of any of the relevant minerals and metals used in our products. In addition, the implementation of these new requirements could adversely affect the sourcing, availability, and pricing of such minerals. For example, there may only be a limited number of suppliers offering “conflict-free” materials, we cannot be sure that we will be able to obtain necessary “conflict-free” materials from such suppliers in sufficient quantities or at reasonable prices. Since our supply chain is complex, we may not be able to sufficiently verify the origins for these minerals and metals used in our products through the due diligence procedures that we implement, which may harm our reputation, could increase our costs, and could adversely affect our manufacturing operations. In such event, we may also face difficulties in satisfying customers who require that all of the components of our products be certified as free of conflict minerals.
A significant disruption in, or breach in security of, our information technology systems could materially and adversely affect our business or reputation.
We rely on information technology systems to keep financial records, process orders, manage inventory, coordinate shipments to customers, and operate other critical functions. Our information technology systems may be susceptible to damage, disruptions or shutdowns due to power outages, hardware failures, telecommunication failures, user errors, catastrophes or other unforeseen events. We may also be subject to security breaches caused by computer viruses, illegal break-ins or hacking, sabotage, or acts of vandalism by third parties or our own employees. Our security measures or those of our third party service providers may not detect or prevent security breaches. If we were to experience a prolonged disruption in the information technology systems that involve our interactions with customers or suppliers, it could result in the loss of supplies, sales or customers and cause us to incur significant incremental costs, which could adversely affect our business. In addition, security breaches of our information technology systems, or the information technology systems of our suppliers or customers over which we have little or no control over, could result in the misappropriation or unauthorized disclosure of confidential information belonging to us or to our employees, partners, customers or suppliers, which could result in our suffering significant financial or reputational damage.
Restrictions in our revolving credit facility may limit our activities.
Our current revolving credit facility imposes restrictions that limit our ability to engage in certain activities including our ability to enter into certain transactions, make investments or other specified restricted payments, pay certain dividends or repurchase our capital stock, create certain liens on our assets and incur certain subsidiary indebtedness. Our credit facility requires us to maintain compliance with specified financial ratios. These covenants could restrict our ability to finance future operations or capital needs, respond to changing business and economic conditions or engage in other transactions or business activities that may be important to our growth strategy or otherwise important to us. Our ability to comply with these financial restrictions and covenants is dependent on our future performance, which is subject to prevailing economic conditions and other factors, including factors that are beyond our control, such as foreign exchange rates, interest rates, changes in technology and changes in the level of competition. If we breach any of the covenants under our credit facility and do not obtain appropriate waivers, then, subject to applicable cure periods, our outstanding indebtedness, if any, could be declared immediately due and payable. In addition, the lenders under our credit facility could institute foreclosure proceedings against the U.S. assets used to secure the borrowing under such facility.
18
Item 1B.Unresolved Staff Comments.
None.
In the U.S., we lease 126,000 square feet for our corporate headquarters in Milpitas, California, which also includes facilities for sales, design and testing functions. Additional manufacturing, warehouse and office facilities are housed in 529,000 square feet of owned facilities on 118 acres of land in Palm Bay, Florida. Additionally, we conduct engineering activity and maintain regional sales offices in various locations throughout the world including the U.S., Asia and Europe. Except for our Florida facilities, which we own, all of our offices are leased. Lease periods vary but all expire by 2023.
We believe that our current facilities are suitable and adequate for our present purposes.
A portion of our activities are subject to export control regulations administered by the U.S. Department of State, or DOS, under the U.S. Arms Export Control Act, or AECA, and the International Traffic in Arms Regulations, or ITAR. In September 2010, in response to a request for information, we disclosed to the Directorate of Defense Trade Controls, or DTCC, information concerning export activities for the years of 2005 through 2010. ITAR gives the DOS authority to impose civil penalties and other administrative sanctions for violations, including debarment from engaging in the exporting of defense articles. In June of 2013, the DTCC notified us of potential ITAR violations and that it was considering pursuing administrative proceedings against us. On June 16, 2014, we entered into a Consent Agreement with the DTCC for the purpose of resolving the potential ITAR violations. Our agreement with the DTCC has a two-year term and provides for: (i) payment of an aggregate civil penalty of $10 million, $4 million of which is suspended and eligible for an offset credit based on verified expenditures for certain past and future remedial compliance measures; (ii) the appointment of an internal Special Compliance Official to oversee compliance with the Consent Agreement and U.S. export control regulations, in general; (iii) two external audits of the Company’s ITAR compliance program; and (iv) continued implementation of ongoing remedial compliance measures and additional remedial compliance measures related to automated systems and ITAR compliance policies, procedures, and training. In connection with the settlement, we estimated and recorded a $6 million charge in the quarter ended October 4, 2013 and an additional $4 million charge in the quarter ended April 4, 2014, when the amount of the penalty was determined. The $6 million portion of the settlement that is not subject to suspension was paid in two installments of $3 million each, paid in June 2014 and June 2015. We expect that investments made in our export control compliance program, which include additional staffing, ongoing implementation of a new software system, employee training, and establishment of a regular compliance audit program and corrective action process, will be eligible for credit against the suspended portion of the settlement amount. We also expect that these investments in remedial compliance measures will be sufficient to cover almost all of the $4 million suspended payment.
Texas Advanced Optoelectronic Solutions, Inc., or TAOS, named us as a defendant in a lawsuit filed on November 25, 2008 in the United States District Court for the Eastern District of Texas. In this action, TAOS alleged four claims consisting of patent infringement, breach of contract, trade secret misappropriation, and tortious interference with a business relationship. On March 6, 2015, the jury found in favor of TAOS on each of the four claims and recommended to the court that we pay $48.7 million in actual damages and $10.0 million in exemplary damages on the trade secret misappropriation claim along with $74,000 in damages for patent infringement. The jury’s verdict also included other duplicate damages of $30.0 million. After the trial, TAOS filed post-trial motions seeking unspecified attorneys’ fees, enhanced patent infringement damages, $18.1 million in pre-judgment interest, which will continue to accrue until the judgment is entered, and a permanent injunction enjoining us from making or selling certain ambient light sensor products. We have vigorously opposed each of these motions. We filed post-trial motions for a new trial and renewed a motion for judgment as a matter of law. In January 2016, the court heard oral arguments on TAOS’ motions for a permanent injunction and unspecified attorneys’ fees and declined to hear oral argument on the other motions before it. The court has not provided a timeframe in which it will provide its ruling on the motions filed by the parties. We are prepared to file an appeal with the U.S. Court of Appeals for the Federal Circuit.
As a consequence of the verdict, during 2015, we recorded a provision of $81.1 million related to this matter, including pre-judgment interest and estimated legal costs, but excluding the damages we believe to be duplicative. During 2015, we incurred $3.1 million of legal costs, and, as such, the accrual outstanding as of January 1, 2016 was $78.0 million. Given the unpredictable nature of this type of litigation and because the outcome remains subject to post-trial motions and appeal, the ultimate impact of this lawsuit may be materially different from our estimate.
19
In a correspondence dated September 28, 2015, Thomson Consumer Electronics Television Taiwan, Ltd., or TCETVT, notified us that it reserved its right to seek indemnification from us for any and all costs, fees and expenses incurred as a result of a toxic tort class action lawsuit filed in Taiwan against TCETVT and others. The lawsuit pertains to alleged injuries resulting from groundwater contamination at a manufacturing facility in Taiwan currently owned by TCETVT, which was previously owned and operated by predecessors, including General Electric and Harris Corporation (or “Harris”), of our Taiwan subsidiary, Intersil Ltd. In the September 28 correspondence, TCETVT also informed us that the Taipei District Court entered a judgment of $18.5 million in the lawsuit against TCETVT, which judgment has been appealed. In addition, TCETVT informed us that they have incurred costs of $11.2 million in defending against the lawsuit through September 1, 2015. We were also advised by TCETVT that additional claimants made be added to the lawsuit and TCETVT believes that if such additional claimants were successfully added, the resulting liability could be as high as $200 million.
TCETVT also informed us that it reserved its right to seek indemnification from us for any and all costs associated with the remediation of the contamination on that site and nearby areas. TCETVT claims they have incurred $15.9 million in remediation-related costs through September 1, 2015.
Under the terms of the 1999 Master Transaction Agreement between Harris Corporation and Intersil, whereby Harris transferred its semiconductor business assets to us, environmental liabilities (including those associated with Harris’ Taiwan semiconductor operations) were expressly retained by Harris. The Master Transaction Agreement also requires Harris to indemnify us for any and all costs relating to those retained environmental liabilities. We have denied liability to TCETVT for the costs associated with the lawsuit as well as the costs associated with the remediation of the contamination on the site. We have also submitted a claim notice to Harris seeking defense and indemnification from Harris under the Master Transaction Agreement for any and all claims made by TCETVT in connection with this matter. Harris has not yet agreed to indemnify us for the liability asserted by TCETVT.
We are currently party to various claims and legal proceedings, including those discussed above. When we believe that a loss is probable and the amount of the loss can be reasonably estimated, we recognize the estimated amount of the loss. We include legal costs in the estimate of losses. As additional information becomes available, we reassess any potential liability related to these matters and, if necessary, revise the estimates.
We do not believe, based on currently available facts and circumstances that the ultimate outcome of these matters, individually and in the aggregate, will have a material adverse effect on our financial position or overall trends in results of our operations in excess of amounts already accrued. However, litigation is subject to inherent uncertainties and unfavorable rulings could occur, including an award of substantial monetary damages or issuance of an injunction prohibiting us from selling one or more products. From time-to-time, we may enter into confidential discussions regarding the potential settlement of such lawsuits. Any settlement of pending litigation could require us to incur substantial costs and other ongoing expenses, such as future royalty payments in the case of an intellectual property dispute. There can be no assurances that the actual amounts required to satisfy any liabilities arising from the matters described above will not have a material adverse effect on our results of operations, financial position or cash flows.
Item 4.Mine Safety Disclosures.
Not applicable.
Item 5.Market for Registrant’s Common Equity, Related Stockholder Matters and Issuer Purchases of Equity Securities.
(a) Market Information
Our Class A Common Stock has been traded on the NASDAQ Stock Market since February 2000 under the symbol ISIL. We currently have the Global Select Market listing status on NASDAQ. Prior to February 2000, there was no public market for our common stock. The following table sets forth, for the periods indicated, the high and low sales prices per share of our Class A Common Stock as reported on the NASDAQ Global Select Market for the periods indicated.
20
|
Quarter: |
|
High |
|
Low |
|
First quarter of 2014 (from January 4, 2014 to April 4, 2014) |
$ |
13.58 |
$ |
10.66 |
|
Second quarter of 2014 (from April 5, 2014 to July 4, 2014) |
|
15.93 |
|
11.86 |
|
Third quarter of 2014 (from July 5, 2014 to October 3, 2014) |
|
15.95 |
|
12.63 |
|
Fourth quarter of 2014 (from October 4, 2014 to January 2, 2015) |
|
14.85 |
|
11.09 |
|
First quarter of 2015 (from January 3, 2015 to April 3, 2015) |
|
16.39 |
|
13.65 |
|
Second quarter of 2015 (from April 4, 2015 to July 3, 2015) |
|
15.04 |
|
12.19 |
|
Third quarter of 2015 (from July 4, 2015 to October 2, 2015) |
|
12.31 |
|
9.20 |
|
Fourth quarter of 2015 (from October 3, 2015 to January 1, 2016) |
|
14.55 |
|
11.90 |
(b) Holders
On February 5, 2016, the last reported sale price for our Class A Common Stock was $12.09 per share. As of the same date, there were 272 record holders of our Class A Common Stock.
(c) Dividends
In 2015 and 2014, we declared and paid quarterly dividends totaling $0.48 per share annually. The first quarter dividend in 2016 has been declared by our Board of Directors at $0.12 per share, to be paid on or about February 26, 2016, to stockholders of record as of February 16, 2016, which if annualized equates to $0.48 per share.
Our dividend policy is impacted by, among other items, our views on potential future capital requirements relating to R&D, creation and expansion of sales distribution channels, investments and acquisitions, share dilution, our stock repurchase program, legal risks, liquidity and profitability. The terms of our revolving credit facility also restrict us from paying dividends and making investments in capital expenditures to the extent that doing so would cause us to fail to meet the covenants contained in the facility. The determination to declare and pay a dividend will be made in a timely manner in the discretion of our Board of Directors in light of these and other relevant factors.
(d) Equity compensation plan information
For important information regarding our equity compensation plans, please see Note 14, "Equity-Based Compensation," in the Notes to the Consolidated Financial Statements included in this Annual Report on Form 10-K.
(e) Performance Graph
The following graph presents a comparison of the cumulative total stockholder return, assuming dividend reinvestment, on our stock with the cumulative total return of the NASDAQ Market Index and the Philadelphia Semiconductor Index for the period of five years commencing January 1, 2011 and ending January 1, 2016. The graph assumes that $100 was invested on January 1, 2011 in each of
21
Intersil common stock, the NASDAQ Market Index, and the Philadelphia Semiconductor Index, and that all dividends were reinvested.
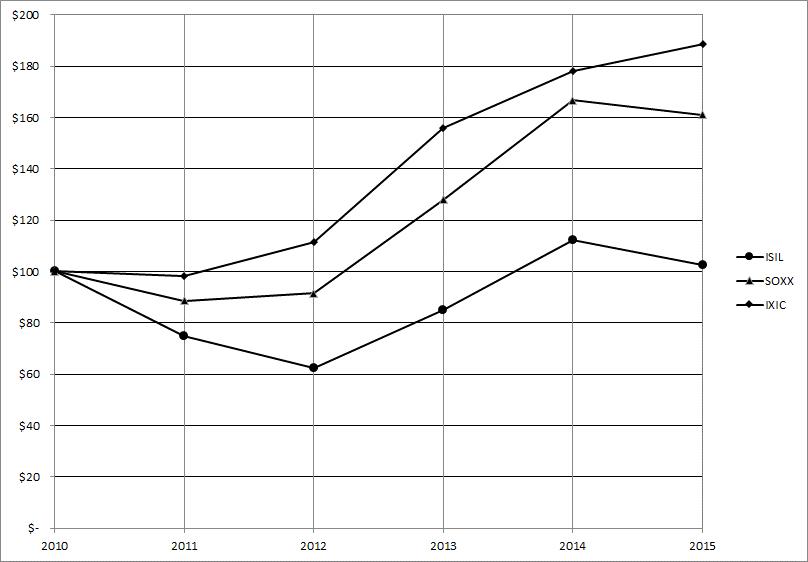
(f) Recent Sales of Unregistered Securities
None.
(g) Issuer Purchases of Equity Securities
None.
22
Item 6.Selected Financial Data.
The following table sets forth our selected financial data. The historical financial data for each year in the five-year period ended January 1, 2016 is derived from our audited consolidated financial statements. 2013 was a 53-week year. All other periods presented were 52 week years. Additional information regarding 2011 and 2012 can be found in our 2011 and 2012 Annual Reports on Form 10-K filed with the SEC for the relevant period. This information should be read in conjunction with the consolidated financial statements included elsewhere in this Annual Report (including the related notes) and “Management’s Discussion and Analysis of Financial Condition and Results of Operations.”
|
|
2015 |
|
2014 |
|
2013 |
|
2012 |
|
2011 |
|
|
(a)(b)(g) |
|
(a)(f) |
|
(a)(d)(f) |
|
(b)(d)(e) |
|
(a)(b)(c)(d) |
|
|
(in thousands, except per share amounts) |
||||||||
|
Revenue |
$ 521,616 |
|
$ 562,555 |
|
$ 575,195 |
|
$ 607,864 |
|
$ 760,490 |
|
Net income (loss) |
7,186 |
|
54,812 |
|
2,855 |
|
(37,649) |
|
67,164 |
|
Basic earnings (loss) per share |
0.05 |
|
0.42 |
|
0.02 |
|
(0.30) |
|
0.53 |
|
Diluted earnings (loss) per share |
0.05 |
|
0.41 |
|
0.02 |
|
(0.30) |
|
0.53 |
|
Total assets |
1,138,618 |
|
1,154,260 |
|
1,191,396 |
|
1,227,786 |
|
1,569,223 |
|
Cash dividends per common share |
0.48 |
|
0.48 |
|
0.48 |
|
0.48 |
|
0.48 |
The following transactions affect the comparability of the results between the periods above:
|
a) |
During 2011, we recorded other than temporary impairment charges and losses on investments in auction rate securities of $6.5 million. During years 2015, 2014 and 2013, we recorded gains related to the recovery of previously recognized losses on auction rate securities of $1.2 million, $1.1 million, and $0.9 million, respectively. |
|
b) |
During 2015 we recorded a net tax benefit of $27.4 million related to the release of a reserve for an uncertain tax position related to intercompany transfers of assets in 2010. During 2012 and 2011, we recorded discrete income tax charges (credits) of $16.8 million and $(20.6) million, respectively, which are due primarily to a provision established upon the completion of field work of multi-year IRS examinations. |
|
c) |
During 2011, we recorded a loss on debt extinguishment of $8.4 million. |
|
d) |
During 2013, 2012, and 2011, we recorded restructuring and related costs of $28.7 million, $10.5 million, and $4.1 million, respectively. |
|
e) |
During 2012, we recorded income net of expenses from IP agreements of $14.4 million and losses related to settlement of our interest rate swaps of $5.8 million. |
|
f) |
During 2014 and 2013, we recorded provisions of $4.0 million and $6.0 million, respectively, related to a provision for export compliance settlement. |
|
g) |
During 2015, we recorded a provision of $81.1 million related to the TAOS litigation. |
Item 7.Management’s Discussion and Analysis of Financial Condition and Results of Operations.
You should read the following discussion in conjunction with our accompanying consolidated financial statements, including the related notes. This discussion generally refers to elements within our accompanying consolidated financial statements on a pre-tax basis unless otherwise stated. Except for historical information, the discussions in this section contain forward-looking statements that involve risks and uncertainties. Actual results could differ materially from those discussed below. For further information regarding risks and uncertainties, see Item 1A. “Risk Factors” and elsewhere in this Annual Report on Form 10-K.
Overview
We design and develop innovative power management and precision analog integrated circuits, or ICs. We were formed in August 1999 when we acquired the semiconductor business of Harris Corporation and began operating as Intersil Corporation. That semiconductor business included product portfolios and intellectual property dating back to 1967 when semiconductor companies were just emerging in Silicon Valley. We are now an established supplier of power management and precision analog technology for many of the most rigorous applications in the computing, consumer and industrial markets. We supply a full range of power IC solutions for battery management, processor power management, and display power management, including power regulators,
23
converters and controllers as well as fully integrated power modules. We also provide precision analog components such as amplifiers and buffers, proximity and light sensors, data converters, optoelectronics, video decoders and interface products. As a major supplier of radiation hardened devices to the military and aerospace industries, our product development methodologies reflect experience designing products to meet the highest standards for reliability and performance in challenging environments.
We utilize a 52/53-week fiscal year, ending on the nearest Friday to December 31, 2013 was a 53-week period with an extra week included in our second quarter. All other years presented contain 52 weeks. Quarterly or annual periods vary from exact calendar quarters or years.
Consolidated Statement of Income (thousands and % of revenue):
|
|
2015 |
|
2014 |
|
2013 |
||||||||||||
|
Revenue |
$ |
521,616 |
|
100.0 |
% |
|
$ |
562,555 |
|
100.0 |
% |
|
$ |
575,195 |
|
100.0 |
% |
|
Cost of revenue |
|
213,820 |
|
41.0 |
|
|
|
235,800 |
|
41.9 |
|
|
|
258,588 |
|
45.0 |
|
|
Gross profit |
|
307,796 |
|
59.0 |
|
|
|
326,755 |
|
58.1 |
|
|
|
316,607 |
|
55.0 |
|
|
Operating costs and expenses: |
|
|
|
|
|
|
|
|
|
|
|
|
|
|
|
|
|
|
Research and development |
|
126,350 |
|
24.2 |
|
|
|
125,851 |
|
22.4 |
|
|
|
130,541 |
|
22.7 |
|
|
Selling, general and administrative |
|
96,963 |
|
18.6 |
|
|
|
99,926 |
|
17.8 |
|
|
|
113,333 |
|
19.7 |
|
|
Amortization of purchased intangibles |
|
17,625 |
|
3.4 |
|
|
|
22,241 |
|
4.0 |
|
|
|
24,579 |
|
4.3 |
|
|
Restructuring and related costs |
|
- |
|
- |
|
|
|
- |
|
- |
|
|
|
28,694 |
|
5.0 |
|
|
Provision for export compliance settlement |
|
- |
|
- |
|
|
|
4,000 |
|
0.7 |
|
|
|
6,000 |
|
1.0 |
|
|
Provision for TAOS litigation |
|
81,100 |
|
15.5 |
|
|
|
- |
|
- |
|
|
|
- |
|
- |
|
|
Operating (loss) income |
|
(14,242) |
|
(2.7) |
|
|
|
74,737 |
|
13.2 |
|
|
|
13,460 |
|
2.3 |
|
|
Interest expense and other |
|
(1,415) |
|
(0.3) |
|
|
|
(1,742) |
|
(0.3) |
|
|
|
(1,901) |
|
(0.3) |
|
|
Gain on investments, net |
|
885 |
|
0.2 |
|
|
|
1,538 |
|
0.3 |
|
|
|
2,318 |
|
0.4 |
|
|
(Loss) income before taxes |
|
(14,772) |
|
(2.8) |
|
|
|
74,533 |
|
13.2 |
|
|
|
13,877 |
|
2.4 |
|
|
Income tax (benefit) expense |
|
(21,958) |
|
(4.2) |
|
|
|
19,721 |
|
3.5 |
|
|
|
11,022 |
|
1.9 |
|
|
Net income |
$ |
7,186 |
|
1.4 |
% |
|
$ |
54,812 |
|
9.7 |
% |
|
$ |
2,855 |
|
0.5 |
% |
Revenue, Cost of Revenue and Gross Margin
Revenue
Our two end-markets are industrial & infrastructure and computing & consumer. Our revenue by end-market was as follows (in thousands and % of revenue):
|
|
2015 |
|
2014 |
|
2013 |
||||||||||||
|
|
|
|
|
|
|
|
|
|
|
|
|
|
|
|
|
|
|
|
Industrial & infrastructure |
$ |
341,923 |
|
65.6 |
% |
|
$ |
358,265 |
|
63.7 |
% |
|
$ |
339,418 |
|
59.0 |
% |
|
Computing & consumer |
|
179,693 |
|
34.4 |
|
|
|
204,290 |
|
36.3 |
|
|
|
235,777 |
|
41.0 |
|
|
Total |
$ |
521,616 |
|
100.0 |
% |
|
$ |
562,555 |
|
100.0 |
% |
|
$ |
575,195 |
|
100.0 |
% |
Our revenue for 2015 was $521.6 million, a decrease of $40.9 million or 7.3% from 2014. In aggregate, lower overall unit sales in 2015 and a decrease in average selling prices, or ASPs, for the related product mix decreased revenue by $16.3 million and $24.6 million, respectively, as compared to 2014. Revenue during the year was impacted by overall weakness in the demand environment arising from sluggish global economic growth. Industrial & infrastructure revenue decreased by 4.6% due to slower end-market demand. Computing & consumer sales declined by 12% due to lower sales of certain low-margin consumer products which were deemphasized, lower unit production of personal computers, and delays in new product roll-outs by certain original equipment manufacturers.
Our revenue for 2014 was $562.6 million, a decrease of $12.6 million or 2.2% from 2013. In aggregate, lower overall unit sales in 2014 decreased revenue by $19.6 million as compared to 2013, partially offset by an increase in ASPs for the related product mix which increased revenue from 2013 by $7.0 million. Revenue in the industrial & infrastructure market increased from 2013 by 5.6% while revenue in the computing & consumer market decreased by 26.8%, respectively. Strong growth in power management and
24
automotive products contributed to the increase in revenues from the industrial & infrastructure end-market. Revenue from the computing & consumer end-markets decreased for the year primarily due to weakness in gaming and the deliberate de-emphasis of low margin products.
Geographical revenue (thousands and % of revenue)
|
|
2015 |
|
2014 |
|
2013 |
||||||||||||
|
Asia |
$ |
374,371 |
|
71.8 |
% |
|
$ |
411,069 |
|
73.1 |
% |
|
$ |
435,383 |
|
75.7 |
% |
|
North America |
|
91,932 |
|
17.6 |
|
|
|
104,306 |
|
18.5 |
|
|
|
95,703 |
|
16.6 |
|
|
Europe and other |
|
55,313 |
|
10.6 |
|
|
|
47,180 |
|
8.4 |
|
|
|
44,109 |
|
7.7 |
|
|
Total |
$ |
521,616 |
|
100.0 |
% |
|
$ |
562,555 |
|
100.0 |
% |
|
$ |
575,195 |
|
100.0 |
% |
Cost of Revenue and Gross Margin
Our gross margin increased by 90 basis points in 2015 from 2014. The increase was primarily due to a higher mix of revenue from the industrial & infrastructure end-market.
Our gross margin increased by 310 basis points in 2014 from 2013. The increase was primarily due to product sales mix changes as well as manufacturing efficiencies.
Generally, our computing & consumer products have lower gross margins than our Industrial & infrastructure products. We strive to improve gross margins from their present levels by introducing new high-margin products and effecting cost saving opportunities in our manufacturing chain.
Operating Costs and Expenses
Research and Development
Our R&D expenses increased by 0.4% or $0.5 million to $126.4 million in 2015 compared to $125.9 million for 2014 primarily as a result of higher equity-based compensation offset by lower variable compensation in 2015.
Our R&D expenses decreased by 3.6% or $4.6 million to $125.9 million in 2014 compared to $130.5 million for 2013 primarily as a result of lower headcount and other cost reductions from our restructuring actions undertaken in 2013.
We believe that a continued commitment to R&D is essential to maintain product leadership and provide innovative new product offerings, and therefore we expect to continue to make significant future investments in R&D. As we continue to move to more advanced process technologies, our mask and engineering wafer costs are becoming more complex and expensive, and will therefore increasingly represent a greater proportion of total R&D expenses.
Selling, General and Administrative, or SG&A
Our SG&A expenses decreased by 3.0% or $3.0 million to $96.9 million in 2015 compared to $99.9 million for 2014 primarily as a result of lower variable compensation and outside legal expenses. During 2014, the outside legal expenses had been higher due to activity related to the TAOS litigation.
Our SG&A expenses decreased by 11.8% or $13.4 million to $99.9 million in 2014 compared to $113.3 million for 2013 primarily as a result of lower headcount and other cost reductions from our restructuring actions undertaken in 2013.
25
Amortization of Purchased Intangibles
Amortization of purchased intangibles was $17.6 million in 2015, $22.2 million in 2014 and $24.6 million in 2013. The decrease in 2015 from 2014 was primarily the result of certain intangible assets becoming fully amortized during the year ended January 1, 2016, offset by amortization of intangibles related to the GWS acquisition. The decrease in 2014 from 2013 was primarily due to certain intangible assets that became fully amortized during 2013 and 2014 and the write-off of certain intangible assets to restructuring and related costs during 2013.
Restructuring and related costs
We recorded $28.7 million of restructuring and related costs in 2013. The 2013 restructuring charges consisted primarily of severance costs and lease exit costs and were part of efforts to better align our operating expenses with strategic growth areas for the purpose of improving competitiveness and execution across our business, realign our internal fabrication operations with existing requirements, prioritize our sales and development efforts, strengthen financial performance and improve cash flow.
Provision for Export Compliance Settlement
We recorded a provision of $ 4.0 million and $6.0 million during 2014 and 2013, respectively, related to amounts due under the Consent Agreement we entered into with the DTCC to settle claims of alleged violations of ITAR.
TAOS litigation
Texas Advanced Optoelectronic Solutions, Inc., or TAOS, named us as a defendant in a lawsuit filed on November 25, 2008 in the United States District Court for the Eastern District of Texas. In this action, TAOS alleged four claims consisting of patent infringement, breach of contract, trade secret misappropriation, and tortious interference with a business relationship. On March 6, 2015, the jury found in favor of TAOS on each of the four claims and recommended to the court that we pay $48.7 million in actual damages and $10.0 million in exemplary damages on the trade secret misappropriation claim along with $74,000 in damages for patent infringement. The jury’s verdict also included other duplicate damages of $30.0 million. After the trial, TAOS filed post-trial motions seeking unspecified attorneys’ fees, enhanced patent infringement damages, $18.1 million in pre-judgment interest, which will continue to accrue until the judgment is entered, and a permanent injunction enjoining us from making or selling certain ambient light sensor products. We have vigorously opposed each of these motions. We filed post-trial motions for a new trial and renewed a motion for judgment as a matter of law. In January 2016, the court heard oral arguments on TAOS’ motions for a permanent injunction and unspecified attorneys’ fees and declined to hear oral argument on the other motions before it. The court has not provided a timeframe in which it will provide its ruling on the motions filed by the parties. We are prepared to file an appeal with the U.S. Court of Appeals for the Federal Circuit.
As a consequence of the verdict, during 2015, we recorded a provision of $81.1 million related to this matter, including pre-judgment interest and estimated legal costs, but excluding the damages we believe to be duplicative. During 2015, we incurred $3.1 million of legal costs, and, as such, the accrual outstanding as of January 1, 2016 was $78.0 million. Given the unpredictable nature of this type of litigation and because the outcome remains subject to post-trial motions and appeal, the ultimate impact of this lawsuit may be materially different from our estimate.
26
Other Income and Expenses
Interest expense and other
During 2015, upon liquidation of a foreign subsidiary, we wrote off $0.6 million, the amount attributable to that entity that had previously been accumulated as a translation adjustment in Accumulated Comprehensive Income.
Gain on Investments, net
We recognized a gain of $1.2 million, $1.1 million and $0.9 million in 2015, 2014 and 2013, respectively, related to the recovery of previously recognized losses on Auction Rate Securities, or ARS.
Income Tax Expense (Benefit)
Our income tax benefit was $22.0 million for 2015 compared to an income tax expense of $19.7 million in 2014. Income tax for 2015, included a $28.0 million benefit relating to release of certain United States federal and state unrecognized tax benefits, or UTBs, due to the expiration of the relevant statutes of limitation. The effective tax rate differs from the 35% statutory corporate tax rate primary due to this UTB reserve release and due to losses sustained in foreign jurisdictions with lower statutory tax rates.
As a global company, our effective tax rate is highly dependent upon the geographic composition of worldwide earnings and tax regulations. We are subject to income taxes in the United States and many foreign jurisdictions and significant judgment is required to determine worldwide tax liabilities. Our effective tax rate, as well as our actual taxes payable, could be adversely affected by changes in the mix of earnings between countries with differing tax rates. Our primary foreign operations are in Malaysia where we currently have a tax holiday resulting in a tax rate of 0%. This tax holiday began on July 1, 2009 and terminates on July 1, 2019. In order to retain this holiday in Malaysia, we must meet certain operating conditions, including compliance with warehouse and shipping quotas and specified manufacturing activities in Malaysia. Absent such tax incentives, the corporate income tax rate in Malaysia that would otherwise apply to us would be 25%. If we cannot or elect not to comply with these conditions, we could lose the related tax benefits. In such event, we may be required to modify our operational structure and tax strategy. Any such modified structure or strategy may not be as beneficial as the benefits provided under the present tax concession arrangement.
The impact of income earned in foreign jurisdictions being taxed at rates different than the United States federal statutory rate was an expense of $15.8 million and a decrease on the effective tax rate of 107% for 2015, compared to a benefit of $7.9 million and a decrease on the effective tax rate of 10.6% for 2014, and an expense of $3.5 million and an increase on the effective tax rate of 25.3% 2013. In determining net (loss) income, we estimate and exercise judgment in the calculation of tax expense and tax liabilities and in assessing the recoverability of deferred tax assets that arise from temporary differences between the tax and financial statement recognition of assets and liabilities. Temporary differences result in deferred tax assets and liabilities, which are included within our consolidated balance sheets. We then assess the likelihood that our deferred tax assets will be recovered from future taxable income, and to the extent we do not believe that the recovery is likely, we establish a valuation allowance. As of January 1, 2016, our net deferred tax asset amounted to $63.1 million compared to $59.8 million as of January 2, 2015. Applicable guidance requires us to record our tax expense based on various estimates of probabilities of sustaining certain tax positions. As a result of this and other factors, our income tax expense could be volatile, which contributes to volatility in reported financial results. As of January 1, 2016 and January 2, 2015, our gross UTBs related to uncertain tax positions were $8.7 million and $78.2 million, respectively.
As of January 1, 2016, $195.2 million of our cash and cash equivalents was held by our foreign subsidiaries. Due to an IRS audit for the tax years 2008-2009 and the deemed sale of intangible property to the foreign subsidiaries in 2010, a substantial portion of this cash can be distributed to our US parent without being subject to US federal or state income taxes. As of January 1, 2016, a total of $70.5 million can be distributed to our US parent without being subject to US federal or state income taxes.
Newly Issued Accounting Standards -Effective
Please see Note 2 to the Consolidated Financial Statements included in this Annual Report on Form 10-K for further information.
27
Contractual Obligations and Off-Balance Sheet Arrangements
Contractual Obligations and Commitments
The following table sets forth our future contractual obligations as of January 1, 2016 (in thousands):
|
|
2016 |
|
2017 |
|
2018 |
|
2019 |
|
Thereafter |
|
Total |
|
Future minimum lease commitments |
$ 5,540 |
|
$ 4,958 |
|
$ 4,309 |
|
$ 3,128 |
|
$ 10,140 |
|
$ 28,075 |
|
Open capital asset purchase commitments |
3,138 |
|
- |
|
- |
|
- |
|
- |
|
3,138 |
|
Open raw material purchase commitments |
18,650 |
|
- |
|
- |
|
- |
|
- |
|
18,650 |
|
Other purchase commitments |
985 |
|
- |
|
- |
|
- |
|
- |
|
985 |
|
Total |
$ 28,313 |
|
$ 4,958 |
|
$ 4,309 |
|
$ 3,128 |
|
$ 10,140 |
|
$ 50,848 |
Our future minimum lease commitments consist primarily of leases for buildings and other real property.
As of January 1, 2016, our net unrecognized tax benefits and related interest and penalties were $8.7 million, of which $1.8 million are classified as long-term liabilities and $6.9 million are netted against deferred tax assets. At this time, we are unable to make a reasonably reliable estimate of the timing of the payments, if any, in individual years due to uncertainties in the timing or outcomes of either actual or anticipated tax audits. As a result, these amounts are not included in the table above.
Off-Balance Sheet Arrangements
As of January 1, 2016, we did not have any off-balance sheet arrangements, as defined under SEC Regulation S-K Item 303(a)(4)(ii).
Liquidity and Capital Resources
Our capital requirements depend on a variety of factors, including the rate of increase or decrease in our existing business base; the success, timing and amount of investment required to bring new products to market; revenue growth or decline; our level of expenses and net income; and potential acquisitions. We believe cash flows from operations together with our cash and investment balances and available credit facility will provide the financial resources necessary to meet our business requirements for the next 12 months for both our domestic and foreign operations. These requirements include our dividend program, the requisite capital expenditures for the maintenance of worldwide manufacturing capacity, working capital requirements and potential acquisitions or strategic investments.
As of January 1, 2016, $195.2 million of our cash and cash equivalents was held by our foreign subsidiaries. We have provided for federal and state taxation at a cumulative rate of 37.5% in connection with the Revenue Procedure 99-32 election related to the 2008-2009 IRS examination periods that allows for the repatriation of $125.0 million. We repatriated $42 million of this amount in 2015, did not repatriate any amount in 2014 and repatriated $12.5 million of this amount in 2013. Therefore, $70.5 million of our cash and cash equivalents held by our foreign subsidiaries as of January 1, 2016 would not be subject to further taxation upon repatriation.
As of January 1, 2016, we have $325 million of borrowing capacity under our five-year $325 million revolving credit facility. The credit facility matures on September 1, 2016 and is payable in full upon maturity. Under the credit facility, $25.0 million is available for the issuance of standby letters of credit, $10.0 million is available as swing line loans and $50.0 million is available for multicurrency borrowings. Amounts repaid under the credit facility may be re-borrowed. The credit facility currently bears interest at the rate of 1.75% over one-month LIBOR, but is variable based on our leverage ratio as described in the credit facility. As of January 1, 2016, we had no principal amount outstanding under the credit facility and were in compliance with all applicable covenants.
Operating Activities
Cash provided by operating activities consists of net income adjusted for certain non-cash items and changes in certain assets and liabilities.
28
Net cash flows from operations in 2015 were $117.0 million, compared to $73.4 million in 2014, an increase of $43.6 million. The cash flow from operations increased primarily due to the following:
|
- |
A provision for the TAOS litigation of $81.1 million was recorded during 2015. During the year, we paid $3.1 million in legal fees related to the TAOS litigation. Please see Note 15 in the Notes to the Consolidated Financial Statements included in this Annual Report on Form 10-K for further information. |
|
- |
Accounts receivables decreased by $13.2 million during 2015 mainly due to improved linearity of shipments during the fourth quarter of 2015 compared to the fourth quarter of 2014. |
|
- |
Inventories decreased by $8.4 million in 2015 consequent to our initiatives during the year to manage inventory levels. |
|
- |
Income taxes payable decreased by $64.1 million. Other long-term assets / liabilities, net decreased by $35.7 million, primarily due to a decrease in deferred taxes. The decreases in income taxes payable and deferred taxes were due to settlement of uncertain tax positions. Please see Note 9 in the Notes to the Consolidated Financial Statements included in this Annual Report on Form 10-K for further information. |
Net cash flows from operations in 2014 were $73.4 million compared to $106.7 million in 2013, a decrease of $33.3 million. This decrease was due mainly to a net outflow from changes in operating assets and liabilities of $75.2 million in 2014 as compared to a net inflow of $25.1 million in 2013. Additionally, the net cash flows from operating activities in 2013 included non-cash portion of restructuring charges of $7.2 million. The impact of these items was offset by an increase in net income in 2014 as compared to 2013 by $51.9 million and impact of changes in deferred income taxes of $25.4 million. Trade receivables, net, increased by $6.1 million primarily due to a less linear shipment pattern in the fourth quarter of 2014 compared to the fourth quarter of 2013. Inventories increased by $11.4 million as a result of increased fab and assembly activity combined with a decline in customer demand in the fourth quarter which resulted in higher inventory levels at the end of the year. The net decrease in trade payables and accrued liabilities of $13.0 million during 2014 was driven by the timing of payments, including payments of accruals related to restructuring activities. In addition, income taxes payable decreased by $42.2 million due to the passage of the 2014 R&D credit, settlement of our 2010-2012 IRS audit which resulted in a reversal of UTBs and cash payment related to the IRS audit.
Investing activities
Investing cash flows consist primarily of capital expenditures and net investment purchases and maturities.
Net cash used in investing activities was $27.7 million in 2015, compared to $8.8 million used in 2014 and $ 13.0 million in 2013. During 2015 we paid cash of $15.9 million for the acquisition of Great Wall Semiconductor. Capital expenditures were $13.0 million in 2015 compared to $9.9 million in 2014.
Financing activities
Financing cash flows consist primarily of payment of dividends to stockholders, proceeds from issuance of stock under our employee stock purchase plan, and issuance and repayment of long-term debt.
Net cash used in financing activities was $51.5 million in 2015, compared to $46.0 million in 2014 and $57.6 million in 2013. We paid dividends of $64.9 million, $62.9 million and $61.9 million during 2015, 2014 and 2013 respectively. We also received $10.4 million in net proceeds from the exercise of equity-based awards in 2015 compared to $15.6 million and $4.3 million in net proceeds during 2014 and 2013 respectively. We did not have any long-term debt outstanding during any of the years presented.
Transactions with Related and Certain Other Parties
None.
29
Critical Accounting Policies and Estimates
Our consolidated financial statements have been prepared in accordance with accounting principles generally accepted in the U.S. The preparation of such statements requires us to make estimates and assumptions that affect the reported amounts of revenues and expenses during the reporting period and the reported amounts of assets and liabilities as of the date of the financial statements. Our estimates and assumptions are based on historical experience and other factors that we consider to be appropriate under the circumstances. However, actual future results may vary from our estimates and assumptions. Based on this definition, our most critical accounting policies include revenue recognition, which impacts the recording of revenues; valuation of inventories, which impacts cost of goods sold and gross margins; assessment of recoverability of intangible assets and goodwill, which impacts write-offs of goodwill and intangible assets; accounting for equity-based compensation, which impacts cost of goods sold and operating expenses; accounting for income taxes, which impacts the income tax provision; and assessment of litigation and contingencies, which impacts charges recorded in cost of goods sold, operating expenses and income taxes. These policies and the estimates and judgments involved are discussed further below. We have other significant accounting policies that either do not generally require estimates and judgments that are as difficult or subjective, or are less likely to have a material impact on our reported results of operations for a given period. Our significant accounting policies are described in Note 2 to the Consolidated Financial Statements included in this Annual Report on Form 10-K.
Revenue
We recognize revenue related to sales of our products, net of sales returns and allowances, provided that (i) persuasive evidence of an arrangement exists, (ii) delivery has occurred and title and risk of loss have transferred, (iii) the price is fixed or determinable and (iv) collectability is reasonably assured. Delivery is considered to have occurred when title and risk of loss have transferred to the customer. We consider the price to be fixed or determinable when the price is not subject to refund or adjustments or when such adjustments can be estimated. We evaluate the creditworthiness of our customers to determine that appropriate credit limits are established prior to the acceptance of an order.
During 2015 and 2014, we recognized 56.8% and 58.3%, respectively, of revenues from sale to distributors. We initially invoice certain distributors at list price upon shipment and issue a credit for pricing adjustments (referred to as “ship and debit claims”), once the product has been sold to the end customer and the distributor has met certain reporting requirements. We estimate and record a reserve for the ship and debit claims based on our assessment of contractual terms with the respective distributors, historical information and prevailing economic situation at the time of recognition of revenue.
For certain distributors, we defer recognition until the distributors resell the products to their end customer (“sell-through distributor”). Revenue at published list price and cost of revenue to sell-through distributors are deferred until either the product is resold by the distributor or, in certain cases, return privileges terminate, at which time revenue and cost of revenue are recorded in the consolidated statement of income. The final price is also subject to ship and debit credits, reducing the final amount recorded in revenue at resale.
Revenue from sales of our products that are subject to inventory consignment agreements, including consignment arrangements with distributors, is recognized in accordance with the principles discussed above, but delivery occurs when the customer or distributor pulls product from consignment inventory that we store at designated locations.
Inventory Allowances
We record our inventories at standard costs, which approximates the lower of actual cost or market value. As the market value that we will realize on sales of our inventory cannot be known with exact certainty at the balance sheet date, we rely on past sales experience and future sales forecasts to project it. In analyzing our inventory levels, we classify certain inventory as either excess or obsolete, and adjust the carrying amount of such inventory accordingly. Inventory adjustments establish a new cost basis and are considered permanent even if circumstances later suggest that increased carrying amounts are recoverable. These classifications are maintained for all classes of inventory, although raw materials are seldom deemed excess or obsolete. We classify inventory as obsolete if we have withdrawn the relevant product from the marketplace or if we have had no sales of the product for the past 18 months and no sales are forecasted for the next 24 months. We write down cost of obsolete inventory. We conduct reviews of excess inventory on a quarterly basis and reserve for a significant portion of the excess inventory. We classify inventory as excess if we have quantities of product greater than the amounts we have sold in the past 18 months or have forecasted to sell in the next 24 months. We typically retain excess inventory until the inventory is sold or reclassified as obsolete, at which time we may scrap such inventory.
30
For all products identified as excess or obsolete, management reviews the relevant facts and circumstances, such as competitive landscape, industry economic conditions, product lifecycles and product cannibalization, specific to that product.
Product demand estimates are a key element in determining inventory allowances. Our estimate of product demand requires significant judgment and is based in part on historical sales. However, historical sales may not accurately predict future demand. If future demand is ultimately lower than our estimate, we could incur significant additional expenses to provide allowances for and scrap excess or obsolete inventory. If demand is higher than expected, we may sell inventory that had previously been written down. Our gross margins were positively impacted by the sale of previously written-down inventory of $2.6 million, $2.1 million, and $2.4 million in 2015, 2014 and 2013, respectively.
Assessment of recoverability of goodwill
We perform an annual assessment of goodwill in the fourth quarter of each year, or more frequently if indications of potential impairment exist. We consider various qualitative factors, including macroeconomic and industry conditions, our financial performance, and changes in our stock price to determine whether it is necessary to perform a quantitative test for goodwill impairment. If we believe, as a result of our qualitative assessment, that it is more-likely-than-not that the fair value of a reporting unit is less than its carrying amount, the quantitative impairment test is required. Under the quantitative test, goodwill is tested under a two-step method for impairment at a level of reporting referred to as a reporting unit. Step one of the quantitative analysis involves identifying potential impairment by comparing the fair value of each reporting unit with its carrying amount and, if applicable, step two involves estimation of the impairment loss, which is the amount of excess of carrying amount of goodwill over the implied fair value of the reporting unit goodwill. In 2015 and 2013, we performed a quantitative two-step assessment and concluded that the carrying value of goodwill had not been impaired as of the date of the assessment. In 2014, based on a qualitative assessment, we concluded that a quantitative two-step assessment was not required to be performed.
During our quarter ended April 3, 2015, we made certain organizational changes which resulted in a reorganization from four reporting units – specialty, mobile, precision, and industrial & infrastructure – into three reporting units – mobile, precision, and industrial & infrastructure. As a result of this reorganization, we performed a fair value analysis immediately prior to the reallocation. In addition, we reallocated our existing goodwill balances to the new reporting units utilizing a relative fair value allocation approach in accordance with FASB ASC Topic 350. Based on our analyses, no impairment was indicated, and consequently, there was no change in the consolidated carrying value of goodwill during the fiscal quarter ended April 3, 2015.
Significant judgment is involved in the determination of fair value for this analysis. Our estimates of fair value are based on a combination of the income approach, which estimates the fair value of our reporting units based on future discounted cash flows, and the market approach, which estimates the fair value of our reporting units based on comparable market prices. The use of future discounted cash flows is based on assumptions that are consistent with our estimates of future growth and the strategic plan used to manage the underlying business. Factors requiring significant judgment include marketplace assumptions related to future growth rates, discount factors, market multiples and tax rates, among other considerations. Changes in economic and operating conditions that occur after the annual impairment analysis or an interim impairment analysis, and that impact these assumptions, may result in a future goodwill impairment charge. The quantitative analysis performed in the fourth quarter of 2015 indicated that the fair value of each of the reporting units significantly exceeded its carrying value. Any such impairment charge could be significant and could have a material adverse effect on our financial position and results of operations.
Accounting for income taxes
As part of the process of preparing our consolidated financial statements, we are required to estimate our income taxes in each of the jurisdictions in which we operate. We are subject to income taxes in the U.S. and various foreign jurisdictions. Significant judgment is required to determine worldwide income tax liabilities. This process involves estimating our actual current tax liability together with assessing temporary differences resulting from differing treatment of items for tax and accounting purposes. Our effective tax rate and the actual taxes ultimately payable could be adversely affected by changes in the mix of earnings between countries with differing statutory tax rates, in the valuation of deferred tax assets, in tax laws or by material audit assessments, which could affect our financial position and results of operations.
Temporary differences result in deferred tax assets and liabilities, which are included within our consolidated balance sheet. We then assess the likelihood that our deferred tax assets will be recovered from future taxable income and, to the extent we believe that recovery is not likely, establish a valuation allowance. As of January 1, 2016, our net deferred tax asset amounted to $63.1 million compared to $59.8 million as of January 2, 2015. Applicable guidance requires us to record our tax expense based on various
31
estimates of probabilities of sustaining certain tax positions. As a result of this and other factors, our tax expense could be volatile, which contributes to volatility in reported financial results. As of January 1, 2016 and January 2, 2015, our gross UTBs including interest and penalties related to uncertain tax positions were $8.7 million and $78.2 million, respectively.
Fair value of equity-based compensation
We generally calculate the fair value of an equity-based compensation grant, or the compensation cost, on the date of grant. We use a lattice method of valuation for estimating the grant date fair value of awards that include market-based vesting conditions. The compensation cost is amortized on a straight-line basis over the requisite service period. Calculating fair value requires us to estimate certain key assumptions in the valuation model, including expected stock price volatility, the risk-free interest rate in the market, the expected life of the award, and the annualized dividend yield. Volatility is one of the most significant determinants of fair value. We estimate our volatility using the actual historical volatility of our stock price. In case of awards that include market-based vesting conditions, our estimate for volatility includes actual historical volatility of stock prices of certain peer companies. We estimate our expected risk-free interest rate by using the zero-coupon U.S. Treasury rate at the time of the grant related to the expected life of the grant. Expected forfeitures must be estimated to offset the compensation cost expected to be recorded in the financial statements. We estimate forfeitures based on historical information about turnover for each appropriate employee level. We estimate the annualized dividend yield by dividing the current annualized dividend by the closing stock price on the date of grant.
Loss Contingencies
We use significant judgment and assumptions to estimate the likelihood of loss or impairment of an asset, or the incurrence of a liability, in determining loss contingencies. An estimated loss contingency is accrued when it is probable that an asset has been impaired or a liability has been incurred and the amount of loss can be reasonably estimated. We record a charge equal to the minimum estimated liability for litigation costs or a loss contingency only when both of the following conditions are met: (i) information available prior to the issuance of our consolidated financial statements indicates that it is probable that an asset had been impaired or a liability had been incurred at the date of the financial statements and (ii) the range of loss can be reasonably estimated.
We regularly evaluate current information available to us to determine whether such accruals should be adjusted and whether new accruals are required.
Recent Accounting Pronouncements
For a description of accounting changes and recent accounting guidance, including estimated effects, if any, on our consolidated financial statements, see Note 2. “Summary of Significant Accounting Policies” to Consolidated Financial Statements of this Annual Report on Form 10-K.
Recent Accounting Guidance Not Yet Adopted
For a description of accounting changes and recent accounting guidance not yet adopted on our consolidated financial statements, see Note 2. “Summary of Significant Accounting Policies” to Consolidated Financial Statements of this Annual Report on Form 10-K.
Item 7A.Quantitative and Qualitative Disclosures about Market Risk.
Global economic conditions pose a risk to the overall economy as consumers and businesses may defer purchases in response to the uncertainty around tighter credit and negative financial news. These conditions could reduce product demand and affect other related matters. Demand could be different from our expectations due to many factors including changes in business and economic conditions, conditions in the credit market that could affect consumer confidence, customer acceptance of our products, changes in customer order patterns, including order cancellations, and changes in the level of inventory held by vendors.
Moreover, in the normal course of doing business, we are exposed to the risks associated with foreign currency exchange rates and changes in interest rates. We employ established policies and procedures governing the use of financial instruments, entered into for purposes other than trading purposes, to manage our exposure to these risks.
32
Our cash equivalents and investments are subject to three market risks: interest rate risk, credit risk and liquidity risk. We did not hold any short-term investments as of January 1, 2016. Due to the short term nature of our portfolio, we do not enter into forward contracts to hedge these risks.
A hypothetical 100 basis point increase or decrease in interest rates would not have a material impact on the value of our cash equivalents and investments.
A substantial majority of our revenues and liabilities outside the U.S. are billed, collected, and paid in U.S. dollars. Therefore, we do not believe we have material risk to currency rates. A hypothetical 10% fluctuation in non-U.S. currency exchange rates would not have a material impact on our revenues or liabilities. As of January 1, 2016, we did not have any open derivative financial instruments to manage our foreign currency risk.
Item 8.Financial Statements and Supplementary Data.
The following consolidated financial statements and the related Notes thereto, the financial statement schedules of Intersil Corporation and the Reports of the Independent Registered Public Accounting Firm are filed as a part of this report.
33
INTERSIL CORPORATION
INDEX TO FINANCIAL STATEMENTS
| 35 | |
| 37 | |
| 38 | |
| 39 | |
| 40 | |
| 41 | |
| 42 | |
|
INDEX TO FINANCIAL STATEMENT SCHEDULES |
|
| 67 |
34
Report of Independent Registered Public Accounting Firm
The Board of Directors and Stockholders
Intersil Corporation:
We have audited the accompanying consolidated balance sheets of Intersil Corporation and subsidiaries (the Company) as of January 1, 2016 and January 2, 2015, and the related consolidated statements of income, comprehensive income, stockholders’ equity, and cash flows for each of the years in the three‑year period ended January 1, 2016. In connection with our audits of the consolidated financial statements, we also have audited the financial statement schedule. These consolidated financial statements and the financial statement schedule are the responsibility of the Company’s management. Our responsibility is to express an opinion on these consolidated financial statements and the financial statement schedule based on our audits.
We conducted our audits in accordance with the standards of the Public Company Accounting Oversight Board (United States). Those standards require that we plan and perform the audit to obtain reasonable assurance about whether the financial statements are free of material misstatement. An audit includes examining, on a test basis, evidence supporting the amounts and disclosures in the financial statements. An audit also includes assessing the accounting principles used and significant estimates made by management, as well as evaluating the overall financial statement presentation. We believe that our audits provide a reasonable basis for our opinion.
In our opinion, the consolidated financial statements referred to above present fairly, in all material respects, the financial position of Intersil Corporation and subsidiaries as of January 1, 2016 and January 2, 2015, and the results of their operations and their cash flows for each of the years in the three‑year period ended January 1, 2016, in conformity with U.S. generally accepted accounting principles. Also in our opinion, the related financial statement schedule, when considered in relation to the basic consolidated financial statements taken as a whole, present fairly, in all material respects, the information set forth therein.
We also have audited, in accordance with the standards of the Public Company Accounting Oversight Board (United States), Intersil Corporation’s internal control over financial reporting as of January 1, 2016, based on criteria established in Internal Control – Integrated Framework (2013) issued by the Committee of Sponsoring Organizations of the Treadway Commission (COSO), and our report dated February 12, 2016 expressed an unqualified opinion on the effectiveness of the Company’s internal control over financial reporting.
/s/ KPMG LLP
Orlando, Florida
February 12, 2016
Certified Public Accountants
35
Report of Independent Registered Public Accounting Firm
The Board of Directors and Stockholders
Intersil Corporation:
We have audited Intersil Corporation and subsidiaries’ (the Company) internal control over financial reporting as of January 1, 2016, based on criteria established in Internal Control – Integrated Framework (2013) issued by the Committee of Sponsoring Organizations of the Treadway Commission (COSO). Intersil Corporation’s management is responsible for maintaining effective internal control over financial reporting and for its assessment of the effectiveness of internal control over financial reporting, included in the accompanying Management’s Report on Internal Control over Financial Reporting. Our responsibility is to express an opinion on the Company’s internal control over financial reporting based on our audit.
We conducted our audit in accordance with the standards of the Public Company Accounting Oversight Board (United States). Those standards require that we plan and perform the audit to obtain reasonable assurance about whether effective internal control over financial reporting was maintained in all material respects. Our audit included obtaining an understanding of internal control over financial reporting, assessing the risk that a material weakness exists, and testing and evaluating the design and operating effectiveness of internal control based on the assessed risk. Our audit also included performing such other procedures as we considered necessary in the circumstances. We believe that our audit provides a reasonable basis for our opinion.
A company’s internal control over financial reporting is a process designed to provide reasonable assurance regarding the reliability of financial reporting and the preparation of financial statements for external purposes in accordance with generally accepted accounting principles. A company’s internal control over financial reporting includes those policies and procedures that (1) pertain to the maintenance of records that, in reasonable detail, accurately and fairly reflect the transactions and dispositions of the assets of the company; (2) provide reasonable assurance that transactions are recorded as necessary to permit preparation of financial statements in accordance with generally accepted accounting principles, and that receipts and expenditures of the company are being made only in accordance with authorizations of management and directors of the company; and (3) provide reasonable assurance regarding prevention or timely detection of unauthorized acquisition, use, or disposition of the company’s assets that could have a material effect on the financial statements.
Because of its inherent limitations, internal control over financial reporting may not prevent or detect misstatements. Also, projections of any evaluation of effectiveness to future periods are subject to the risk that controls may become inadequate because of changes in conditions, or that the degree of compliance with the policies or procedures may deteriorate.
In our opinion, Intersil Corporation maintained, in all material respects, effective internal control over financial reporting as of January 1, 2016, based on criteria established in Internal Control – Integrated Framework (2013) issued by the Committee of Sponsoring Organizations of the Treadway Commission (COSO).
We also have audited, in accordance with the standards of the Public Company Accounting Oversight Board (United States), the consolidated balance sheets of Intersil Corporation and subsidiaries as of January 1, 2016 and January 2, 2015, and the related consolidated statements of operations, comprehensive income, stockholders’ equity, and cash flows for each of the years in the three-year period ended January 1, 2016, and our report dated February 12, 2016 expressed an unqualified opinion on those consolidated financial statements.
/s/ KPMG LLP
Orlando, Florida
February 12, 2016
Certified Public Accountants
36
INTERSIL CORPORATION
CONSOLIDATED STATEMENT OF INCOME
|
|
Year Ended |
|||||||
|
|
January 1, 2016 |
|
January 2, 2015 |
|
January 3, 2014 |
|||
|
|
(in thousands, except share and per share data) |
|||||||
|
Revenue |
$ |
521,616 |
|
$ |
562,555 |
|
$ |
575,195 |
|
Cost of revenue |
|
213,820 |
|
|
235,800 |
|
|
258,588 |
|
Gross profit |
|
307,796 |
|
|
326,755 |
|
|
316,607 |
|
|
|
|
|
|
|
|
|
|
|
Operating costs and expenses: |
|
|
|
|
|
|
|
|
|
Research and development |
|
126,350 |
|
|
125,851 |
|
|
130,541 |
|
Selling, general and administrative |
|
96,963 |
|
|
99,926 |
|
|
113,333 |
|
Amortization of purchased intangibles |
|
17,625 |
|
|
22,241 |
|
|
24,579 |
|
Restructuring and related costs |
|
- |
|
|
- |
|
|
28,694 |
|
Provision for export compliance settlement |
|
- |
|
|
4,000 |
|
|
6,000 |
|
Provision for TAOS litigation |
|
81,100 |
|
|
- |
|
|
- |
|
Operating (loss) income |
|
(14,242) |
|
|
74,737 |
|
|
13,460 |
|
Interest expense and other |
|
(1,415) |
|
|
(1,742) |
|
|
(1,901) |
|
Gain on investments, net |
|
885 |
|
|
1,538 |
|
|
2,318 |
|
(Loss) income before taxes |
|
(14,772) |
|
|
74,533 |
|
|
13,877 |
|
Income tax (benefit) expense |
|
(21,958) |
|
|
19,721 |
|
|
11,022 |
|
Net income |
$ |
7,186 |
|
$ |
54,812 |
|
$ |
2,855 |
|
|
|
|
|
|
|
|
|
|
|
Earnings per share |
|
|
|
|
|
|
|
|
|
Basic |
$ |
0.05 |
|
$ |
0.42 |
|
$ |
0.02 |
|
Diluted |
$ |
0.05 |
|
$ |
0.41 |
|
$ |
0.02 |
|
|
|
|
|
|
|
|
|
|
|
Cash dividends declared per common share |
|
0.48 |
|
|
0.48 |
|
|
0.48 |
|
|
|
|
|
|
|
|
|
|
|
Weighted average common shares outstanding: |
|
|
|
|
|
|
|
|
|
Basic |
|
131,793 |
|
|
129,149 |
|
|
127,151 |
|
Diluted |
|
133,273 |
|
|
132,657 |
|
|
127,998 |
|
See accompanying Notes to Consolidated Financial Statements |
||||||||
37
INTERSIL CORPORATION
CONSOLIDATED STATEMENTS OF COMPREHENSIVE INCOME
|
|
Year Ended |
|||||||
|
|
January 1, 2016 |
|
January 2, 2015 |
|
January 3, 2014 |
|||
|
|
|
|
|
|
|
|
|
|
|
|
|
(in thousands) |
||||||
|
Net income |
$ |
7,186 |
|
$ |
54,812 |
|
$ |
2,855 |
|
Currency translation adjustments, net |
|
(641) |
|
|
(1,791) |
|
|
(512) |
|
Actuarial changes in pension obligation |
|
(1,271) |
|
|
- |
|
|
- |
|
Comprehensive income |
$ |
5,274 |
|
$ |
53,021 |
|
$ |
2,343 |
|
See accompanying Notes Consolidated Financial Statements |
||||||||
38
INTERSIL CORPORATION
|
|
|
|
|
|
|
|
|
January 1, 2016 |
|
January 2, 2015 |
||
|
Assets |
(in thousands, except share data) |
||||
|
Current Assets: |
|
|
|
|
|
|
Cash and cash equivalents |
$ |
247,403 |
|
$ |
211,216 |
|
Trade receivables, net of reserves ($14,541 as of January 1, 2016 and $13,218 as of January 2, 2015) |
|
42,684 |
|
|
55,585 |
|
Inventories |
|
65,334 |
|
|
73,770 |
|
Prepaid expenses and other current assets |
|
7,176 |
|
|
9,779 |
|
Income taxes receivable |
|
7,584 |
|
|
1,162 |
|
Deferred income tax assets |
|
- |
|
|
20,433 |
|
Total Current Assets |
|
370,181 |
|
|
371,945 |
|
Non-current Assets: |
|
|
|
|
|
|
Property, plant & equipment, net of accumulated depreciation ($273,352 as of January 1, 2016 and $260,403 as of January 2, 2015) |
|
71,044 |
|
|
72,272 |
|
Purchased intangibles, net of accumulated amortization ($77,225 as of January 1, 2016 and $99,500 as of January 2, 2015) |
|
32,507 |
|
|
34,400 |
|
Goodwill |
|
571,770 |
|
|
565,424 |
|
Deferred income tax assets |
|
63,139 |
|
|
39,334 |
|
Other non-current assets |
|
29,977 |
|
|
70,885 |
|
Total Non-current Assets |
|
768,437 |
|
|
782,315 |
|
Total Assets |
$ |
1,138,618 |
|
$ |
1,154,260 |
|
Liabilities and Stockholders' Equity |
|
|
|
|
|
|
Current Liabilities: |
|
|
|
|
|
|
Trade payables |
$ |
23,382 |
|
$ |
26,246 |
|
Accrued compensation |
|
31,662 |
|
|
34,083 |
|
Other accrued expenses and liabilities |
|
17,251 |
|
|
23,993 |
|
Deferred income |
|
14,482 |
|
|
11,631 |
|
Income taxes payable |
|
3,270 |
|
|
2,790 |
|
Provision for TAOS litigation |
|
77,988 |
|
|
- |
|
Total Current Liabilities |
|
168,035 |
|
|
98,743 |
|
Non-current liabilities: |
|
|
|
|
|
|
Income taxes payable |
|
1,609 |
|
|
59,745 |
|
Other non-current liabilities |
|
14,225 |
|
|
14,224 |
|
Total Non-current Liabilities |
|
15,834 |
|
|
73,969 |
|
Stockholders' Equity: |
|
|
|
|
|
|
Preferred stock, $0.01 par value, 2 million shares authorized; no shares issued or outstanding |
|
- |
|
|
- |
|
Class A common stock, $0.01 par value, voting; 600 million shares authorized; 132,728,391 shares issued and outstanding as of January 1, 2016 and 130,216,901 shares issued and outstanding as of January 2, 2015 |
|
1,327 |
|
|
1,302 |
|
Additional paid-in capital |
|
1,559,334 |
|
|
1,591,432 |
|
Accumulated deficit |
|
(604,937) |
|
|
(612,123) |
|
Accumulated other comprehensive (loss) income |
|
(975) |
|
|
937 |
|
Total Stockholders' Equity |
|
954,749 |
|
|
981,548 |
|
Total Liabilities and Stockholders' Equity |
$ |
1,138,618 |
|
$ |
1,154,260 |
|
See accompanying Notes to Consolidated Financial Statements |
|||||
39
INTERSIL CORPORATION
CONSOLIDATED STATEMENTS OF STOCKHOLDERS’ EQUITY
|
|
Common Stock Class A |
|
Additional Paid-In Capital |
|
Accumulated Deficit |
|
Accumulated Other Comprehensive Income (Loss) |
|
Total |
|||||
|
|
|
(in thousands except per share amounts) |
||||||||||||
|
Balance as of December 28, 2012 |
$ |
1,263 |
|
$ |
1,659,895 |
|
$ |
(669,790) |
|
$ |
3,240 |
|
$ |
994,608 |
|
Net income |
|
- |
|
|
- |
|
|
2,855 |
|
|
- |
|
|
2,855 |
|
Dividends paid, $0.48 per common share |
|
- |
|
|
(61,025) |
|
|
- |
|
|
- |
|
|
(61,025) |
|
Dividends accrued to Award holders prior to vesting |
|
- |
|
|
(1,094) |
|
|
- |
|
|
- |
|
|
(1,094) |
|
Equity-based compensation expense |
|
- |
|
|
19,091 |
|
|
- |
|
|
- |
|
|
19,091 |
|
Shares issued under equity-based award plans |
|
14 |
|
|
4,316 |
|
|
- |
|
|
- |
|
|
4,330 |
|
Tax impact of shares issued under equity-based award plans |
|
- |
|
|
(451) |
|
|
- |
|
|
- |
|
|
(451) |
|
Foreign currency translation |
|
- |
|
|
- |
|
|
- |
|
|
(512) |
|
|
(512) |
|
Balance as of January 3, 2014 |
$ |
1,277 |
|
$ |
1,620,732 |
|
$ |
(666,935) |
|
$ |
2,728 |
|
$ |
957,802 |
|
Net income |
|
- |
|
|
- |
|
|
54,812 |
|
|
- |
|
|
54,812 |
|
Dividends paid, $0.48 per common share |
|
- |
|
|
(61,960) |
|
|
- |
|
|
- |
|
|
(61,960) |
|
Dividends accrued to Award holders prior to vesting |
|
- |
|
|
(1,798) |
|
|
- |
|
|
- |
|
|
(1,798) |
|
Equity-based compensation expense |
|
- |
|
|
18,688 |
|
|
- |
|
|
- |
|
|
18,688 |
|
Shares issued under equity-based award plans |
|
25 |
|
|
15,533 |
|
|
- |
|
|
- |
|
|
15,558 |
|
Tax impact of shares issued under equity-based award plans |
|
- |
|
|
237 |
|
|
- |
|
|
- |
|
|
237 |
|
Foreign currency translation |
|
- |
|
|
- |
|
|
- |
|
|
(1,791) |
|
|
(1,791) |
|
Balance as of January 2, 2015 |
$ |
1,302 |
|
$ |
1,591,432 |
|
$ |
(612,123) |
|
$ |
937 |
|
$ |
981,548 |
|
Net income |
|
- |
|
|
- |
|
|
7,186 |
|
|
- |
|
|
7,186 |
|
Dividends paid, $0.48 per common share |
|
- |
|
|
(63,255) |
|
|
- |
|
|
- |
|
|
(63,255) |
|
Dividends accrued to Award holders prior to vesting |
|
- |
|
|
(2,365) |
|
|
- |
|
|
- |
|
|
(2,365) |
|
Equity-based compensation expense |
|
- |
|
|
23,158 |
|
|
- |
|
|
- |
|
|
23,158 |
|
Shares issued under equity-based award plans |
|
25 |
|
|
10,364 |
|
|
- |
|
|
- |
|
|
10,389 |
|
Currency translation adjustments, net |
|
- |
|
|
- |
|
|
- |
|
|
(641) |
|
|
(641) |
|
Unrealized losses on defined benefit pension plan |
|
- |
|
|
- |
|
|
- |
|
|
(1,271) |
|
|
(1,271) |
|
Balance as of January 1, 2016 |
$ |
1,327 |
|
$ |
1,559,334 |
|
$ |
(604,937) |
|
$ |
(975) |
|
$ |
954,749 |
|
See accompanying Notes to Consolidated Financial Statements. |
||||||||||||||
40
INTERSIL CORPORATION
CONSOLIDATED STATEMENTS OF CASH FLOWS
|
|
Year Ended |
|||||||
|
|
January 1, 2016 |
|
January 2, 2015 |
|
January 3, 2014 |
|||
|
|
|
|
|
|
|
|
|
|
|
|
|
(in thousands) |
||||||
|
Operating Activities |
|
|
|
|
|
|
|
|
|
Net income |
$ |
7,186 |
|
$ |
54,812 |
|
$ |
2,855 |
|
Adjustments to reconcile net income to net cash flows from operating activities: |
|
|
|
|
|
|
|
|
|
Depreciation |
|
15,285 |
|
|
19,423 |
|
|
18,950 |
|
Amortization of intangibles |
|
17,625 |
|
|
22,241 |
|
|
24,579 |
|
Equity-based compensation |
|
23,158 |
|
|
18,688 |
|
|
19,091 |
|
Deferred income taxes |
|
(6,285) |
|
|
35,569 |
|
|
10,196 |
|
Excess tax benefit received on exercise of stock options |
|
(3,013) |
|
|
(1,158) |
|
|
(474) |
|
Gain on disposal of property and equipment, net |
|
16 |
|
|
71 |
|
|
102 |
|
Non-cash portion of restructuring charges |
|
- |
|
|
- |
|
|
7,184 |
|
Gain on investments |
|
(1,198) |
|
|
(1,075) |
|
|
(866) |
|
Changes in operating assets and liabilities: |
|
|
|
|
|
|
|
|
|
Trade receivables |
|
13,247 |
|
|
(6,118) |
|
|
5,218 |
|
Inventories |
|
8,437 |
|
|
(11,363) |
|
|
12,461 |
|
Prepaid expenses and other current assets |
|
2,616 |
|
|
(28) |
|
|
625 |
|
Trade payables and accrued liabilities |
|
(9,695) |
|
|
(13,032) |
|
|
17,355 |
|
Provision for TAOS litigation |
|
77,988 |
|
|
- |
|
|
- |
|
Income taxes |
|
(64,079) |
|
|
(42,226) |
|
|
(9,417) |
|
Other long-term assets / liabilities, net |
|
35,716 |
|
|
(2,415) |
|
|
(1,145) |
|
Net cash flows provided by operating activities |
|
117,004 |
|
|
73,389 |
|
|
106,714 |
|
|
|
|
|
|
|
|
|
|
|
Investing Activities |
|
|
|
|
|
|
|
|
|
Cash paid for acquisition, net of cash acquired |
|
(15,948) |
|
|
- |
|
|
- |
|
Proceeds from short-term investments |
|
- |
|
|
- |
|
|
4,750 |
|
Proceeds from long-term investments |
|
1,198 |
|
|
1,075 |
|
|
866 |
|
Purchase of property, plant and equipment |
|
(12,965) |
|
|
(9,857) |
|
|
(18,581) |
|
Net cash flows used in investing activities |
|
(27,715) |
|
|
(8,782) |
|
|
(12,965) |
|
|
|
|
|
|
|
|
|
|
|
Financing Activities |
|
|
|
|
|
|
|
|
|
Proceeds, net of taxes withheld, from equity-based awards |
|
10,389 |
|
|
15,558 |
|
|
4,330 |
|
Excess tax benefit received from exercise of equity-based awards |
|
3,013 |
|
|
1,381 |
|
|
23 |
|
Dividends paid |
|
(64,859) |
|
|
(62,910) |
|
|
(61,920) |
|
Net cash flows used in financing activities |
|
(51,457) |
|
|
(45,971) |
|
|
(57,567) |
|
|
|
|
|
|
|
|
|
|
|
Effect of exchange rates on cash and cash equivalents |
|
(1,645) |
|
|
(2,207) |
|
|
(205) |
|
|
|
|
|
|
|
|
|
|
|
Net change in cash and cash equivalents |
|
36,187 |
|
|
16,429 |
|
|
35,977 |
|
Cash and cash equivalents at the beginning of the period |
|
211,216 |
|
|
194,787 |
|
|
158,810 |
|
Cash and cash equivalents at the end of the period |
$ |
247,403 |
|
$ |
211,216 |
|
$ |
194,787 |
|
|
|
|
|
|
|
|
|
|
|
See accompanying Notes to Consolidated Financial Statements |
||||||||
41
INTERSIL CORPORATION
NOTES TO CONSOLIDATED FINANCIAL STATEMENTS
NOTE 1—ORGANIZATION AND BASIS OF PRESENTATION
Intersil Corporation (“Intersil,” which may also be referred to as “we,” “us” or “our”) is a leading provider of innovative power management and precision analog solutions. Our products address some of the largest markets within the industrial & infrastructure and computing & consumer end-markets.
Basis of Presentation
We utilize a 52/53-week fiscal year, ending on the nearest Friday to December 31. 2013 was a 53-week period with an extra week included in our second quarter. Quarterly or annual periods vary from exact calendar quarters or years.
The consolidated financial statements include the accounts of Intersil and its subsidiaries. All intercompany accounts and transactions have been eliminated.
Reclassifications
Certain prior year amounts have been reclassified to conform to current year presentation.
NOTE 2—SIGNIFICANT ACCOUNTING POLICIES
Cash and Cash Equivalents—Cash equivalents consist of highly liquid investments with original maturities of three months or less at the time of purchase. Investments with original maturities over three months are classified as short-term investments. We determine the appropriate classification of our cash and cash equivalents at the time of purchase.
Non-Marketable Equity Securities—Non-marketable equity securities are accounted for at historical cost or, if we have significant influence over the investee, using the equity method of accounting. These investments are evaluated for impairment quarterly. Such analysis requires significant judgment to identify events or circumstances that would likely have a significant, other than temporary, adverse effect on the carrying value of the investment.
Deferred Compensation Plan Assets—We have made available a non-qualified deferred compensation plan for certain eligible employees. Participants can direct the investment of their deferred compensation plan accounts from a portfolio of funds from which earnings are measured. Although participants direct the investment of these funds, they are classified as trading securities and are included in other non-current assets because they remain our assets until they are actually paid out to the participants. We maintain a portfolio of $9.9 million in mutual fund investments and corporate-owned life insurance under the plan. Changes in the fair value of the asset are recorded as a gain (loss) on investments and changes in the fair value of the liability are recorded as a component of compensation expense. In general, the compensation expense (benefit) is substantially offset by the gains and losses on the investment. During 2015, 2014, and 2013, we recorded gains on deferred compensation investments of $0.3 million, $0.5 million, and $1.5 million, respectively and compensation expense of $0.1 million, $0.7 million, and $1.7 million, respectively.
Fair Value Measurements—In order to determine the fair value of our assets and liabilities, we utilize three levels of inputs, focusing on the most observable inputs when available. Observable inputs are generally developed based on market data obtained from independent sources, whereas unobservable inputs reflect our assumptions about what market participants would use to value the asset or liability, based on the best information available in the circumstances. The three levels of inputs are as follows:
42
Level 1—Quoted prices in active markets which are unadjusted and accessible as of the measurement date for identical, unrestricted assets or liabilities;
Level 2—Quoted prices in markets that are not active or for which all significant inputs are observable, either directly or indirectly;
Level 3—Prices or valuations that require inputs that are unobservable and significant to the overall fair value measurement.
If we use more than one level of input that significantly affects fair value, we include the fair value under the lowest input level used.
Trade Receivables, net—Trade accounts receivable are recorded at the invoiced amount and do not bear interest. Accounts receivable are reduced by an allowance for doubtful accounts, which reflects our best estimate of probable losses inherent in the accounts receivable balance. We determine the allowance based on the aging of our accounts receivable, historical experience, known troubled accounts, management judgment and other currently available evidence. When items are deemed uncollectible, we charge them against the allowance for collection losses. We provide for estimated collection losses in the current period, as a component of revenue. We utilize credit limits, ongoing evaluation and trade receivable monitoring procedures to reduce the risk of credit loss. Credit is extended based on an evaluation of our customer’s financial condition and collateral is generally not required. Accounts receivable are also recorded net of sales returns and distributor allowances. These amounts are recorded when it is both probable and estimable that discounts will be granted or products will be returned. Please see “Revenue Recognition” for further details.
Inventories—Inventories are carried at the lower of standard cost (which approximates actual cost, determined by the first-in-first-out method) or market value. The carrying value of our inventories is reduced for any difference between cost and estimated market value of inventory that is determined to be obsolete or unmarketable, based upon assumptions about future demand and market conditions. Inventory adjustments establish a new cost basis and are considered permanent even if circumstances later suggest that increased carrying amounts are recoverable. If demand is higher than expected, we may sell inventory that had previously been written down.
Property, Plant and Equipment—Buildings, machinery and equipment are carried at cost, less accumulated depreciation and impairment charges, if any. We expense repairs and maintenance costs that do not extend an asset’s useful life or increase an asset’s capacity. Depreciation is computed using the straight-line method over the estimated useful life of the asset. The estimated useful lives of buildings, which include leasehold improvements, range between 10 and 30 years, or over the lease period, whichever is shorter. The estimated useful lives of machinery and equipment range between three and eight years. We lease certain facilities under operating leases and record the effective rental expense in the appropriate period on the straight-line method.
Accounting for Business Combinations—We use the acquisition method of accounting for business combinations and recognize assets acquired and liabilities assumed at their fair values on the date of the acquisition. While we use our best estimates and assumptions to value assets acquired and liabilities assumed, including contingent considerations, where applicable, our estimates are inherently uncertain and subject to refinement. As a result, during the measurement period, which may be up to one year from the acquisition date, we may adjust the values of assets acquired and liabilities assumed with a corresponding offset to goodwill. Upon the conclusion of the measurement period, or final determination of the values of the assets acquired and liabilities assumed, any subsequent adjustments to values of such assets and liabilities are recognized in our consolidated statements of operations.
Asset Impairment—We recognize impairment losses on long-lived assets when indications of impairment exist and our estimate of undiscounted cash flows generated by those assets is less than the assets’ carrying amounts. The impairment loss is measured by comparing the fair value of the asset to its carrying amount. Fair value is estimated based on discounted future cash flows or market value, if available. Assets that qualify as held for sale are stated at the lower of the assets’ carrying amount or fair value and depreciation is no longer recognized.
43
Goodwill— Goodwill is an indefinite-lived intangible asset that is not amortized, but instead is tested for impairment annually or more frequently if indications of impairment exist. We perform an annual assessment of goodwill in the fourth quarter of each year, or more frequently if indications of potential impairment exist. We consider various qualitative factors, including macroeconomic and industry conditions, financial performance of the company and changes in the stock price of the company to determine whether it is necessary to perform a quantitative test for goodwill impairment. If we believe, as a result of our qualitative assessment, that it is more likely than not that the fair value of a reporting unit is less than its carrying amount, the quantitative impairment test is required. Under the quantitative test, goodwill is tested under a two-step method for impairment at a level of reporting referred to as a reporting unit. Step one of the quantitative analysis involves identifying potential impairment by comparing the fair value of each reporting unit with its carrying amount and, if applicable, step two involves estimation of the impairment loss, which is the amount of excess of carrying amount of goodwill over the implied fair value of the reporting unit goodwill. In 2015 and 2013, we performed a quantitative two-step assessment and concluded that the carrying value of goodwill had not been impaired as of the date of the assessment. In 2014, based on a qualitative assessment, we concluded that a quantitative two-step assessment was not required to be performed.
Purchased Intangibles—Purchased intangible assets with finite lives are carried at cost less accumulated amortization. Amortization is computed on a straight-line basis over the asset’s estimated useful life. Purchased intangibles include intangible assets subject to amortization, which are our developed technologies, backlog, customer relationships and intellectual property. We review long-lived assets for impairment whenever events or changes in circumstances indicate that the carrying amount of such assets may not be recoverable. We measure recoverability of long-lived assets by comparing the carrying amount of the asset group to the future undiscounted net cash flows expected to be generated by those assets. If such assets are considered to be impaired, we recognize an impairment charge for the amount by which the carrying amounts of the assets exceeds the fair value of the assets.
Income Taxes—We follow the liability method of accounting for income taxes. Current income taxes payable and receivable and deferred income taxes resulting from temporary differences between the financial statements and the tax basis of assets and liabilities are separately classified on the consolidated balance sheets.
Uncertain tax positions and unrecognized tax benefits, or UTBs—We record our tax expense based on various probabilities of sustaining certain tax positions, using a recognition threshold and measurement attribute for the financial statement recognition and measurement of a tax position taken or expected to be taken in a tax return. We record UTBs as a component of non-current income taxes payable, unless payment is expected within one year.
Applicable guidance requires us to record tax expense based on various estimates of probabilities of sustaining certain tax positions. As a result of this and other factors, our estimate of tax expense could change.
We classify accrued interest and penalties on income tax matters in the liabilities section of the balance sheet as non-current income taxes payable. When the interest and penalty portions of such uncertain tax positions are adjusted, it is classified as income tax expense. All of the uncertain tax positions and UTBs as of January 1, 2016 would impact our effective tax rate should they be recognized.
In the ordinary course of business, the ultimate tax outcome of many transactions and calculations is uncertain, as the calculation of tax liabilities involves the application of complex tax laws in the U.S., Malaysia and other jurisdictions. We recognize liabilities for additional taxes that may be due on tax audit issues based on an estimate of the ultimate resolution of those issues. Although we believe the estimates are reasonable, the final outcome may be different than amounts we estimate. Such determinations could have a material impact on the income tax expense (benefit), effective tax rate and operating results in the period they occur. Significant changes in enacted tax law could materially impact our estimates.
Restructuring— We record restructuring charges when severance obligations are probable and reasonably estimable and the vested right attributable to the employees’ service is already rendered. We recognize a liability for costs associated with exit or disposal activities including costs associated with leases, when a liability is incurred rather than when an exit or disposal plan is approved. We continually evaluate the adequacy of the remaining liabilities under our restructuring initiatives. Although we believe that these estimates accurately reflect the costs of our restructuring plans, actual results may differ, thereby requiring us to record additional provisions or reverse a portion of such provisions.
44
Revenue Recognition— We recognize revenue related to sales of our products, net of sales returns and allowances, provided that (i) persuasive evidence of an arrangement exists, (ii) delivery has occurred and title and risk of loss have transferred, (iii) the price is fixed or determinable and (iv) collectability is reasonably assured. Delivery is considered to have occurred when title and risk of loss have transferred to the customer. We consider the price to be fixed or determinable when the price is not subject to refund or adjustments or when such adjustments can be estimated. We evaluate the creditworthiness of our customers to determine that appropriate credit limits are established prior to the acceptance of an order.
We initially invoice certain distributors at list price upon shipment and issue a credit for pricing adjustments (referred to as “ship and debit claims”), once product has been sold to the end customer and the distributor has met certain reporting requirements. We estimate and record a reserve for the ship and debit claims based on our assessment of contractual terms with the respective distributors, historical information and prevailing economic situation at the time recognition of revenue.
For certain distributors, we defer recognition until the distributors resell the products to their end customer (“sell-through distributor”). Revenue at published list price and cost of revenue to sell-through distributors are deferred until either the product is resold by the distributor or, in certain cases, return privileges terminate, at which time revenue and cost of revenue are recorded in the consolidated statement of income. The final price is also subject to ship and debit credits, reducing the final amount recorded in revenue at resale.
Revenue from sales of our products that are subject to inventory consignment agreements, including consignment arrangements with distributors, is recognized in accordance with the principles discussed above, but delivery occurs when the customer or distributor pulls product from consignment inventory that we store at designated locations.
The following table summarizes the deferred income balance, primarily consisting of sell-through distributors (in thousands):
|
|
As of January 1, 2016 |
|
As of January 2, 2015 |
||
|
Deferred revenue |
$ |
17,626 |
|
$ |
14,546 |
|
Deferred cost of revenue |
|
(3,144) |
|
|
(2,915) |
|
Deferred income |
$ |
14,482 |
|
$ |
11,631 |
Warranty—We provide for the estimated cost of product warranties at the time revenue is recognized. While we engage in extensive product quality programs and processes, including actively monitoring and evaluating the quality of our suppliers, the estimated warranty obligation is affected by ongoing product failure rates and material usage costs incurred in correcting a product failure. Actual product failure rates or material usage costs that differ from estimates result in revisions to the estimated warranty liability. We warrant for a limited period of time that our products will be free from defects in material workmanship and possess the electrical characteristics to which we have committed. We estimate warranty allowances based on historical warranty experience. Historically, warranty expenses were not material to our consolidated financial statements.
Research and Development—Research and development costs consist of the cost of designing, developing and testing new or significantly enhanced products and are expensed as incurred.
Advertising Expense—Advertising costs are expensed in the period incurred. Advertising expense was $4.5 million, $4.2 million, and $3.4 million in 2015, 2014, and 2013, respectively.
Equity-based Compensation—Our equity-based compensation plans allow several forms of equity compensation including stock options, or Options, restricted and deferred stock awards, or Awards, and employee stock purchase plans, or ESPPs. The 2008 Equity Compensation Plan, or the 2008 Plan, includes several available forms of stock compensation of which only Options and Awards have been granted to date. Awards issued consist of deferred stock units and restricted stock units, which may differ in regard to the timing of the related prospective taxable event to the recipient.
Additionally, we have an ESPP Plan, whereby eligible employees can purchase shares of Intersil’s common stock through payroll deductions at a price not less than 85% of the market value of the stock on specified dates, with no look-back provision.
45
Our plans allow employees an option to have Awards withheld as a means of meeting minimum statutory tax withholding requirements. For the majority of Awards granted, the number of shares issued on the date the Awards vest is net of the minimum statutory withholding requirements that we pay in cash to the appropriate taxing authorities on behalf of our employees. In our consolidated financial statements, we treat shares withheld for tax purposes on behalf of our employees in connection with the vesting of Awards as common stock repurchases because they reduce the number of shares that would have been issued upon vesting. Withheld shares are cancelled immediately and are not considered outstanding.
Equity-based compensation cost is measured at the grant date, based on the fair value of the options and awards ultimately expected to vest, and is recognized as an expense, on a straight-line basis, over the requisite service period. We use a lattice method of valuation for estimating the grant date fair value of options and awards that include market-based vesting conditions. Calculating fair value requires us to estimate certain key assumptions in the valuation model, including expected stock price volatility, the risk-free interest rate in the market, the expected life of the award and the annualized dividend yield. Volatility is one of the most significant determinants of fair value. We estimate our volatility using the actual historical volatility of our stock price. In case of options and awards that include market-based vesting conditions, our estimate for volatility includes actual historical volatility of stock prices of certain peer companies. We estimate our expected risk-free interest rate by using the zero-coupon U.S. Treasury rate at the time of the grant related to the expected life of the grant. We estimate forfeitures based on historical information about turnover for each appropriate employee level. We estimate the annualized dividend yield by dividing the current annualized dividend by the closing stock price on the date of grant. Expected forfeitures are estimated and offset the compensation costs recorded in the financial statements.
Most options vest 25% in the first year and quarterly thereafter for three or four years and generally have seven year contract lives. For Awards, the expected life for amortization of the grant date fair value is the vesting term, generally three years in the case of deferred stock units and four years in the case of restricted stock units. We issue new shares of common stock upon the exercise of Options.
Loss Contingencies—We estimate and accrue loss contingencies at the point that the losses become probable. For litigation, we include an estimate of legal costs for defense as part of the reserve for loss contingencies.
Retirement Benefits—We sponsor a 401(k) savings and investment plan that allows eligible U.S. employees to participate in making pre-tax contributions to the 401(k) plan. We match the employee contributions on a dollar-for-dollar basis up to a certain predetermined percentage. Employees fully vest in the matching contributions after five years of service. We made matching contributions of $4.8 million, $4.5 million, and $5.4 million during 2015, 2014, and 2013, respectively.
We have voluntary defined contribution plans in various non-U.S. locations. Further, we maintain a limited number of defined benefit plans for certain non-U.S. locations. Total costs under these plans were $0.9 million, $0.8 million, and $3.6 million during 2015, 2014, and 2013, respectively. Accrued liabilities relating to these unfunded plans were $7.8 million and $6.8 million as of January 1, 2016 and January 2, 2015, respectively.
Foreign Currency Translation—For subsidiaries in which the functional currency is the local currency, gains and losses resulting from translation of foreign currency financial statements into U.S. dollars are recorded as a component of accumulated other comprehensive income, or OCI. Cumulative translation adjustments in accumulated OCI were $0.3 million, $0.9 million, and $2.7 million as of January 1, 2016, January 2, 2015, and January 3, 2014, respectively.
Segment Information—We report our results in one reportable segment. We design and develop innovative power management and precision analog integrated circuits, or ICs. Our chief executive officer is our chief operating decision maker.
Use of Estimates—The financial statements have been prepared in conformity with accounting principles generally accepted in the U.S. and require management to make estimates and assumptions that affect the reported amounts of assets and liabilities and disclosure of contingent assets and liabilities as of the date of the financial statements and the reported amounts of revenue and expenses during the reporting period. Actual results could differ from those estimates.
Recently Adopted Accounting Guidance
In November 2015, FASB issued guidance intended to simplify accounting for deferred taxes. Existing GAAP guidance requires us to record deferred tax balances as either current or non-current in accordance with the classification of the underlying attributes. We elected
46
to early adopt this guidance using the prospective method. Please see discussion under Note 9 for the discussion related to impact of the early adoption of this guidance.
In January 2015, FASB issued guidance on simplifying income statement presentation by eliminating the concept of extraordinary items from U.S. GAAP. The amendments in this update are effective for us from November 1, 2016, and in interim periods during that year. A reporting entity may apply the amendments prospectively and retrospectively to all periods presented in the financial statements. Early adoption is permitted provided that the guidance is applied from the beginning of the year of adoption. We have evaluated the accounting guidance and determined that there is no impact of this update to our consolidated financial statements.
In March 2013, FASB issued an accounting standard update requiring an entity to release into net income the entire amount of a cumulative translation adjustment related to its investment in a foreign entity when, as a parent, it sells either a part or all of its investment in the foreign entity or no longer holds a controlling financial interest in a subsidiary or group of assets within the foreign entity. This accounting standard update was effective for us beginning in the first quarter of 2015. Upon adoption, the application of this accounting standard update did not have a material impact to our consolidated financial statements.
Recent Accounting Guidance Not Yet Adopted
In September 2015, FASB issued guidance intended to simplify accounting for adjustments to provisional amounts recorded in connection with business combinations. The guidance will be effective for us beginning in 2016. Early adoption is permitted. We do not expect this guidance to have a material impact to our consolidated financial statements.
In July 2015, FASB issued guidance to simplify the accounting for inventory and to more closely align their guidance with international accounting standards. The amendments in this update apply to companies which use inventory valuation methods other than last-in, first-out and the retail inventory method to change the way that they subsequently measure the value of inventory on their balance sheet. Under the new guidance, inventory should be valued at the lower of cost and net realizable value rather than the lower of cost and market. The guidance is effective for us beginning in 2016. We do not expect this amended guidance to have an impact to our consolidated financial statements, as the new guidance aligns with our current practice of using net realizable value as our estimate of market value.
In February 2015, FASB issued an amendment to the analysis that a reporting entity must perform to determine whether it should consolidate certain types of legal entities. All legal entities are subject to reevaluation under the revised consolidation model. The guidance is effective for us beginning in 2016. We do not expect that the adoption of this guidance will have an impact to our consolidated financial statements.
In June 2014, FASB issued authoritative guidance that resolves the diverse accounting treatment for equity-based payment awards that require a specific performance target to be achieved in order for employees to become eligible to vest in the awards. The guidance applies to entities that grant their employees equity-based awards that include a performance target that could be achieved after the requisite service period. The guidance explicitly requires that a performance target of this nature be treated as a performance condition and should not be reflected in estimating the grant date fair value of the award. The guidance is effective for us beginning in 2016. We are currently evaluating the impact that this guidance will have on our financial condition and results of operations.
In May 2014, FASB issued authoritative guidance, which requires an entity to recognize the amount of revenue to which it expects to be entitled for the transfer of promised goods or services to customers. In July 2015, FASB announced that implementation of this guidance will be delayed by one year. When issued, this guidance is expected to replace most existing revenue recognition guidance in U.S. GAAP. The new standard will be effective for us on December 31, 2018. Early application is not permitted. The standard permits the use of either the retrospective or cumulative effect transition method. We are evaluating the effect that this guidance will have on our consolidated financial statements and related disclosures. We have not yet selected a transition method nor have we determined the effect of the standard on our ongoing financial reporting.
In April 2014, FASB issued authoritative guidance that raises the threshold for a disposal transaction to qualify as a discontinued operation and requires additional disclosures about discontinued operations and disposals of individually significant components that do not qualify as discontinued operations. This guidance will be effective prospectively for the first quarter of 2016, which will only affect any dispositions we may make after the effective date.
47
NOTE 3—BUSINESS COMBINATIONS
On September 8, 2015, we acquired Great Wall Semiconductor Corporation, or GWS, a privately held manufacturer of metal oxide semiconductor field-effect transistors. We acquired GWS to broaden our product portfolio to better serve our customers who purchase certain commercial and radiation-hardened power management products.
The purchase consideration consisted of $18.9 million in cash, of which $2.8 million is held in escrow for a period of 16 months and is subject to claims for contingent liabilities and working capital adjustments. In addition, the acquisition agreement provides for a cash earn-out payment of up to an additional $4.0 million if either specified revenue targets are achieved or a disposition event occurs on or before December 30, 2016. A disposition event would include transfer of GWS or its assets, or a transfer of a majority of the assets or acquisition of Intersil by a third party. We estimated that the fair value of the earn-out as of the acquisition date based on the probability of achievement was not material.
The purchase price was allocated to the identifiable assets and liabilities of GWS based on their estimated fair value at the acquisition date. We engaged an independent third party to assist with the determination of the fair value of certain identifiable intangible assets and the earn-out. In determining the fair value of the purchased intangible assets and earn-out, management made various estimates and assumptions from significant unobservable inputs (Level 3). The fair value of purchased identifiable intangible assets was determined using discounted cash flow models from projections prepared by management. The fair value of the earn-out was derived using a Monte Carlo simulation model that includes significant unobservable inputs.
The purchase price was preliminarily allocated as of the date of the acquisition as follows (in thousands):
|
Assets acquired |
|
|
|
Current assets: |
|
|
|
Cash |
$ |
201 |
|
Account receivable |
|
346 |
|
Prepaid expenses & other assets |
|
319 |
|
Non-current assets: |
|
|
|
Developed technology |
|
13,232 |
|
Customer relationships |
|
2,500 |
|
Goodwill |
|
6,346 |
|
Total assets acquired |
|
22,944 |
|
|
|
|
|
Liabilities acquired |
|
|
|
Current liabilities: |
|
|
|
Accounts payable |
|
703 |
|
Accrued expenses |
|
97 |
|
Deferred revenue |
|
266 |
|
Non-current liabilities: |
|
|
|
Deferred taxes |
|
2,969 |
|
Total liabilities acquired |
|
4,035 |
|
Net assets acquired |
|
18,909 |
We prepared an initial determination of the fair value of the assets acquired and liabilities assumed as of the acquisition date using preliminary information. Developed Technology and Customer Relationships have estimated useful lives of seven and three years, respectively. The excess of the fair value of consideration paid over the fair value of the net assets and the identifiable intangible assets acquired and the liabilities assumed resulted in recognition of goodwill of $6.3 million, including the value of workforce. The
48
recognition of goodwill primarily related to expected future products and technologies. All of the goodwill recorded was assigned to our Industrial & Infrastructure reporting unit.
NOTE 4—FAIR VALUE MEASUREMENTS
We determine fair value on the following assets using these input levels (in thousands):
|
|
|
Fair value as of January 1, 2016 using: |
|||||||
|
|
|
Total |
|
Quoted prices in active markets for identical assets |
|
Significant other observable inputs (Level 2) |
|||
|
Assets |
|
|
|
|
|
|
|
|
|
|
Other non-current assets: |
|
|
|
|
|
|
|
|
|
|
Deferred compensation investments |
|
$ |
9,855 |
|
$ |
400 |
|
$ |
9,455 |
|
Total assets measured at fair value |
|
$ |
9,855 |
|
$ |
400 |
|
$ |
9,455 |
|
|
|
Fair value as of January 2, 2015 using: |
|||||||
|
|
|
|
Total |
|
Quoted prices in active markets for identical assets |
|
Significant other observable inputs (Level 2) |
||
|
Assets |
|
|
|
|
|
|
|
|
|
|
Other non-current assets: |
|
|
|
|
|
|
|
|
|
|
Deferred compensation investments |
|
$ |
11,144 |
|
$ |
353 |
|
$ |
10,791 |
|
Total assets measured at fair value |
|
$ |
11,144 |
|
$ |
353 |
|
$ |
10,791 |
We did not have any Level 3 assets as at the end of 2015 or 2014. There were no transfers into or out of Level 1 or Level 2 financial assets and liabilities during 2015 or 2014.
For actively traded securities and bank time deposits, we generally rely upon the valuations provided by the third-party custodian of these assets or liabilities.
NOTE 5—INVENTORIES
Inventories are summarized below (in thousands):
|
|
As of |
|
As of |
||
|
|
January 1, 2016 |
|
January 2, 2015 |
||
|
Finished products |
$ |
22,522 |
|
$ |
22,758 |
|
Work in process |
|
38,238 |
|
|
47,083 |
|
Raw materials |
|
4,574 |
|
|
3,929 |
|
Total inventories |
$ |
65,334 |
|
$ |
73,770 |
As of January 1, 2016, we were committed to purchase $18.7 million of inventory from our suppliers.
49
NOTE 6—PROPERTY, PLANT AND EQUIPMENT
Property, plant and equipment are summarized below (in thousands):
|
|
As of |
|
As of |
||
|
|
January 1, 2016 |
|
January 2, 2015 |
||
|
Land |
$ |
1,708 |
|
$ |
1,708 |
|
Buildings and leasehold improvements |
|
60,939 |
|
|
60,728 |
|
Machinery and equipment |
|
267,832 |
|
|
264,325 |
|
Construction in progress |
|
13,917 |
|
|
5,914 |
|
Total property, plant and equipment |
|
344,396 |
|
|
332,675 |
|
Accumulated depreciation and leasehold amortization |
|
(273,352) |
|
|
(260,403) |
|
Total property, plant and equipment, net |
$ |
71,044 |
|
$ |
72,272 |
Depreciation expense was $15.3 million, $19.4 million, and $19.0 million for 2015, 2014, and 2013, respectively. Non-cash accruals for purchases of property, plant and equipment were immaterial for 2015, 2014, and 2013, respectively. As of January 1, 2016, we had open capital asset purchase commitments of $3.1 million.
NOTE 7—GOODWILL AND PURCHASED INTANGIBLES
Goodwill—The following table summarizes changes in net goodwill balances for our one reportable segment (in thousands):
|
Gross goodwill balance as of January 2, 2015 |
$ |
1,720,100 |
|
Accumulated impairment charge |
|
(1,154,676) |
|
Goodwill from GWS acquisition |
|
6,346 |
|
Net goodwill balance as of January 1, 2016 |
$ |
571,770 |
During the first quarter of 2015, we reorganized from four reporting units to three reporting units. As a result of this reorganization, we performed a fair value analysis immediately prior to the reallocation which did not indicate any impairment in the carrying value of goodwill. In addition, we reallocated our existing goodwill balances to the new reporting units utilizing a relative fair value allocation approach in accordance with FASB ASC Topic 350.
We perform an annual test of goodwill in the fourth quarter of each year. In 2015, 2014, and 2013, we recorded no impairment of goodwill based on our analysis. The fair value of the reporting units was significantly in excess of the carrying value as of October 3, 2015, the first day of our fourth quarter of 2015 and the date at which we performed our quantitative assessment. During year 2014, we had performed a qualitative assessment.
If we experience significant declines in our stock price, market capitalization, future expected cash flows, significant adverse changes in the business climate or slower growth rates, we may need to perform additional impairment analysis of our goodwill in future periods prior to our annual test in the fourth quarter. We can provide no assurance that the significant assumptions used in our analysis will not change substantially and any additional analysis could result in additional impairment charges.
Purchased intangibles—Substantially all of our purchased intangibles consist of multiple elements of developed technology which had estimated useful lives of five years at the time of purchase. Other purchased intangibles consist of other identifiable assets, primarily customer relationships, with estimated useful lives of three to seven years. Purchased intangibles are summarized as follows (in thousands):
50
|
|
As of January 1, 2016 |
|||||||
|
|
|
Definite-lived: developed technologies |
|
|
Definite-lived: other |
|
|
Total purchased intangibles |
|
|
|
|
|
|
|
|
|
|
|
Gross carrying amount |
$ |
63,032 |
|
$ |
46,700 |
|
$ |
109,732 |
|
Accumulated amortization |
|
36,065 |
|
|
41,160 |
|
|
77,225 |
|
Purchased intangibles, net |
$ |
26,967 |
|
$ |
5,540 |
|
$ |
32,507 |
|
|
|
|
|
|
|
|
|
|
|
|
|
As of January 2, 2015 |
||||||
|
|
|
Definite-lived: developed technologies |
|
|
Definite-lived: other |
|
|
Total purchased intangibles |
|
|
|
|
|
|
|
|
|
|
|
Gross carrying amount |
$ |
89,700 |
|
$ |
44,200 |
|
$ |
133,900 |
|
Accumulated amortization |
|
66,654 |
|
|
32,846 |
|
|
99,500 |
|
Purchased intangibles, net |
$ |
23,046 |
|
$ |
11,354 |
|
$ |
34,400 |
We write-off those intangible assets that have become fully amortized during the year. Expected amortization expense by year to the end of the current amortization schedule is as follow(in thousands):
|
To be recognized in: |
|
|
|
2016 |
$ |
11,734 |
|
2017 |
|
9,480 |
|
2018 |
|
4,362 |
|
2019 |
|
1,890 |
|
2020 and thereafter |
|
5,041 |
|
Total expected amortization expense |
$ |
32,507 |
NOTE 8—RESTRUCTURING AND RELATED COSTS
As part of an effort to streamline operations with changing market conditions and to create a more efficient organization, we had, in prior years, undertaken restructuring actions to reduce our workforce and consolidate facilities. Our restructuring costs consisted primarily of: (i) severance and termination benefit costs related to the reduction of our workforce; and (ii) lease termination costs and costs associated with permanently vacating certain facilities.
In 2013, we adopted a rebalancing plan, we refer to as the July 2013 Plan, to better align our operating expenses with strategic growth areas for the purpose of improving competitiveness and execution across the business. The July 2013 Plan included a reduction in our worldwide workforce of 12%, which has been gradually offset by the addition of new hires in design and development during 2014 and 2015. During the fourth quarter of 2015, we negotiated a termination of the lease arrangement of the real property we exited as a part of the July 2013 Plan. Amounts related to the July 2013 plan as on January 1, 2016 and January 2, 2015 was $0.5 million and $0.7 million respectively, and are included in other accrued expenses and liabilities on the balance sheet. The July 2013 Plan will be completed in the first quarter of 2016 upon payment of the associated lease termination fee.
The July 2013 Plan will be completed in the first quarter of 2016 upon payment of the associated lease termination fee.
51
NOTE 9—INCOME TAXES
Income (loss) before income taxes is allocated between domestic and foreign jurisdictions as follows (in thousands):
|
|
Year Ended |
|||||||
|
|
January 1, 2016 |
|
January 2, 2015 |
|
January 3, 2014 |
|||
|
|
|
|
|
|
|
|
|
|
|
Domestic |
$ |
32,729 |
|
$ |
51,959 |
|
$ |
22,140 |
|
Foreign |
|
(47,501) |
|
|
22,574 |
|
|
(8,263) |
|
(Loss) income before income taxes |
$ |
(14,772) |
|
$ |
74,533 |
|
$ |
13,877 |
Income tax expense—The provision for income taxes is summarized below (in thousands):
|
|
Year Ended |
|||||||
|
|
January 1, 2016 |
|
January 2, 2015 |
|
January 3, 2014 |
|||
|
Current taxes: |
|
|
|
|
|
|
|
|
|
Federal |
$ |
(18,221) |
|
$ |
(14,366) |
|
$ |
(2,090) |
|
State |
|
113 |
|
|
(865) |
|
|
34 |
|
Foreign |
|
2,422 |
|
|
(617) |
|
|
2,879 |
|
|
|
(15,686) |
|
|
(15,848) |
|
|
823 |
|
Deferred taxes: |
|
|
|
|
|
|
|
|
|
Federal |
|
(6,391) |
|
|
23,337 |
|
|
11,911 |
|
State |
|
(24) |
|
|
2,536 |
|
|
545 |
|
Foreign |
|
143 |
|
|
9,696 |
|
|
(2,257) |
|
|
|
(6,272) |
|
|
35,569 |
|
|
10,199 |
|
Income tax (benefit) expense |
$ |
(21,958) |
|
$ |
19,721 |
|
$ |
11,022 |
As a result of the exercise of non-qualified Options, the disqualifying disposition of incentive Options, the release of Awards and the disqualifying disposition of shares acquired under the ESPP, we realized tax benefits of $3.2 million, $2.4 million and $1.3 million during 2015, 2014 and 2013, respectively.
We currently have a tax holiday in Malaysia resulting in a tax rate of 0%. This tax holiday began on July 1, 2009, and terminates on July 1, 2019. The table below summarizes the effects of operating in Malaysia under our tax holiday based on the Malaysian statutory tax rate (in thousands, except per share data).
|
|
Year Ended |
|||||||
|
|
January 1, 2016 |
|
January 2, 2015 |
|
January 3, 2014 |
|||
|
|
|
|
|
|
|
|
|
|
|
Tax effects from earnings / (losses) attributable to Malaysia |
$ |
(11,628) |
$ |
5,611 |
$ |
(2,483) | ||
|
|
|
|
|
|
|
|
|
|
|
Effect on earnings (loss) per share: |
|
|
|
|
|
|
|
|
|
Basic |
$ |
(0.09) |
|
$ |
0.04 |
|
$ |
(0.02) |
|
Diluted |
$ |
(0.09) |
|
$ |
0.04 |
|
$ |
(0.02) |
52
Deferred income taxes—The components of net deferred income tax assets and liabilities are as follows (in thousands):
|
As of January 1, 2016 |
As of January 2, 2015 |
||||||||
|
Non-Current |
Current |
Non-Current |
|||||||
|
Inventories |
$ |
13,049 |
$ |
14,170 |
$ |
- |
|||
|
Property, plant and equipment |
1,681 |
- |
4,158 | ||||||
|
Accrued expenses |
4,658 | 4,869 |
- |
||||||
|
Equity-based compensation |
6,480 |
- |
6,561 | ||||||
|
Net operating loss carryforward |
25,584 | 1,025 | 19,766 | ||||||
|
Capitalized research and development |
108 |
- |
797 | ||||||
|
Deferred compensation |
4,350 |
- |
3,187 | ||||||
|
Deferred revenue |
5,526 | 4,179 |
- |
||||||
|
Tax credits |
43,010 |
- |
24,877 | ||||||
|
Capital loss carryforward |
6,592 |
- |
6,628 | ||||||
|
Other, net |
298 | 458 | 3,826 | ||||||
|
Deferred tax assets |
111,336 | 24,701 | 69,800 | ||||||
|
Intangibles |
(4,642) |
- |
- |
||||||
|
Deferred tax liabilities |
(4,642) |
- |
- |
||||||
|
Valuation allowance |
(43,555) | (4,268) | (30,466) | ||||||
|
Net deferred tax assets |
$ |
63,139 |
$ |
20,433 |
$ |
39,334 | |||
During November 2015, the FASB issued ASU 2015-17, “Balance Sheet Classification of Deferred Taxes”, which simplifies the presentation of deferred income taxes. This ASU requires that deferred tax assets and liabilities be classified as non-current in a statement of financial position. We early adopted ASU 2015-17 effective January 1, 2016 on a prospective basis. Adoption of this ASU resulted in a reclassification of our net current deferred tax asset to the net non-current deferred tax asset in our Consolidated Balance Sheet. No prior periods were retrospectively adjusted.
The table below summarizes the activity in valuation allowances (in thousands):
|
|
January 1, 2016 |
|
January 2, 2015 |
||
|
Beginning balance |
$ |
34,733 |
|
$ |
28,256 |
|
Increases related to state attributes |
|
5,745 |
|
|
(48) |
|
Increases related to foreign net operating losses |
|
3,113 |
|
|
7,160 |
|
Decreases related to capital losses |
|
(36) |
|
|
(635) |
|
Ending balance |
$ |
43,555 |
|
$ |
34,733 |
During 2015, we adjusted the valuation allowance for the deferred tax assets attributable to the net operating losses (“NOLs”) for a foreign subsidiary. As of January 1, 2016 the said foreign subsidiary had net deferred tax assets of $10.3 million attributable to NOLs. Based upon an analysis of projected future taxable income, we have determined that we would not be able to generate income in the said foreign subsidiary to utilize the NOLs and as such determined that a full valuation allowance was required for the NOL.
We also increased the valuation allowance for state tax credits generated during the year that we believe are not likely to be utilized in the future due to a lack of projected taxable income in the state with the tax credits.
We completed an analysis of projected future taxable income and determined that all remaining deferred tax assets, including NOLs and tax-credit carryforwards, are more likely than not to be realized in the foreseeable future. Therefore, we have not provided any additional valuation allowances on deferred tax assets as of January 1, 2016.
We have gross NOLs of $43.4 million from acquisitions that expire in tax years 2027 through 2028. The annual utilization of these NOLs is limited pursuant to Internal Revenue Code Section 382. We have gross federal R&D credit carryforwards of $17.4 million that will expire in tax years 2032 through 2034.
53
Income Tax Rate Reconciliation—A reconciliation of the statutory United States income tax to our effective income tax is as follows (in thousands, except percentages):
|
|
Year Ended |
|
|||||||||
|
|
January 1, 2016 |
|
|
January 2, 2015 |
|
|
January 3, 2014 |
|
|||
|
Statutory U.S. income tax rate |
|
35 |
% |
|
|
35.0 |
% |
|
|
35.0 |
% |
|
Income tax provision reconciliation: |
|
|
|
|
|
|
|
|
|
|
|
|
Tax at federal statutory income tax rate |
$ |
(5,169) |
|
|
$ |
26,087 |
|
|
$ |
4,857 |
|
|
State taxes |
|
1,775 |
|
|
|
1,356 |
|
|
|
1,198 |
|
|
Effect of Foreign Operations |
|
15,853 |
|
|
|
(7,918) |
|
|
|
3,505 |
|
|
International equity-based compensation |
|
349 |
|
|
|
748 |
|
|
|
2,422 |
|
|
Research credits |
|
(5,741) |
|
|
|
(4,608) |
|
|
|
(10,313) |
|
|
Change in unrecognized tax benefits |
|
(28,002) |
|
|
|
2,765 |
|
|
|
116 |
|
|
Subpart F—interest & stock gain |
|
155 |
|
|
|
437 |
|
|
|
326 |
|
|
Manufacturing deduction |
|
(529) |
|
|
|
(675) |
|
|
|
(370) |
|
|
Amortization of deferred tax charge |
|
(3,999) |
|
|
|
(2,964) |
|
|
|
(2,964) |
|
|
Tax shortfalls on equity-based compensation |
|
92 |
|
|
|
1,381 |
|
|
|
3,277 |
|
|
Export compliance settlement |
|
- |
|
|
|
1,400 |
|
|
|
2,100 |
|
|
Interest |
|
- |
|
|
|
- |
|
|
|
779 |
|
|
Royalty income |
|
4,717 |
|
|
|
5,215 |
|
|
|
5,557 |
|
|
Deferred tax true-ups |
|
(1,205) |
|
|
|
(2,299) |
|
|
|
- |
|
|
Other items |
|
(254) |
|
|
|
(1,204) |
|
|
|
532 |
|
|
Total income tax (benefit) provision |
$ |
(21,958) |
|
|
$ |
19,721 |
|
|
$ |
11,022 |
|
Uncertain Tax Positions and Uncertain Tax Benefits (“UTBs”)
During 2015, 2014 and 2013, we recorded an increase (decrease) of $(7.4) million, $0.4 million, and $1.8 million of potential interest and penalties on UTBs. We recognize potential accrued interest and penalties related to unrecognized tax benefits in income tax expense.
The table below summarizes activity in gross UTBs (in thousands):
|
|
January 1, 2016 |
January 2, 2015 |
January 3, 2014 |
|
|
Beginning balance (includes $7,538 thousand of interest and penalties as of January 2, 2015) |
$ |
78,206 | 99,343 | 112,867 |
|
Increases related to current year tax positions |
|
3,004 | 1,152 | 1,157 |
|
Increases related to prior year tax positions |
|
- |
2,515 | 10,874 |
|
Settlements with tax authorities |
|
(548) | (24,804) | (25,555) |
|
Increases related to acquisitions |
|
1,464 |
- |
- |
|
Decreases related to lapses of statutes of limitations |
|
(73,395) |
- |
- |
|
Ending balance (includes $124 thousand of interest and penalties as of January 1, 2016) |
$ |
8,731 | 78,206 | 99,343 |
The decreases related to prior year tax positions in 2015 were primarily due to statute expirations on the UTBs. The increases related to current year tax positions do not have a material impact on the effective tax rate.
During 2015, we made cash payments for accrued interest on the 2010 – 2012 final settlement with the IRS in the amount of $0.6 million, and paid $0.6 million to the states related to the final settlement. The $73.4 million decrease in the UTB balance due to the lapse of the statute of limitations primarily relates to various transfer pricing issues in the United States in the 2010 tax year.
54
During 2014, we reached final settlement with the IRS in connection with the 2010 – 2012 examination periods. As a result of the settlement, we reduced the UTB balance by $16.4 million. This reduction included a $5.6 million cash payment to the IRS for additional tax, a $4.2 million decrease in deferred tax assets related to federal R&D tax credits, and a $6.6 million reduction to tax expense. Also during 2014, we reached final settlement with Swiss tax authorities in connection with the 2009 – 2012 examination periods. We decreased our UTBs in the amount of $7.5 million. This reduction included a $2.7 million cash payment consisting of $2.4 million of additional tax and $0.3 million of interest and a $4.8 million decrease in deferred tax assets related to utilization of a net operating loss attribute. During 2014, we made cash payments of $0.3 million to various states related to the 2008 – 2009 IRS settlement. During 2014, we made cash payments of $0.6 million to various states related to the 2005-2007 IRS settlement.
We do not expect our UTBs to change significantly within the next 12 months.
We are subject to filing requirements in the United States Federal jurisdiction and in many state and foreign jurisdictions for numerous consolidated and separate entity income tax returns. We are no longer subject to examination in the U.S. for years prior to 2013.
Other Income Tax Information
Income taxes paid were $8.0 million, $29.0 million and $16.6 million 2015, 2014 and 2013, respectively. Interest and penalties paid were $0.6 million during 2015, $0.5 million during 2014, and $0.9 million during 2013.
We have not provided U.S. income taxes on $ 276.3 million of accumulated undistributed earnings of our international subsidiaries because of our demonstrated intention to permanently reinvest these earnings. Should these earnings be remitted to the U.S. we would be subject to additional U.S. taxes and foreign withholding taxes. Determining the unrecognized deferred tax liability related to investments in these international subsidiaries that are permanently reinvested is not practicable and not expected in the foreseeable future.
NOTE 10—LONG-TERM DEBT
On September 1, 2011, we established a new five-year, $325.0 million revolving credit facility. This credit facility replaced our previous $300.0 million six-year term-loan facility and $75.0 million revolving credit facility. The credit facility matures on September 1, 2016 and is payable in full upon maturity. We may request to increase the credit facility by up to $75.0 million. Under the credit facility, $25.0 million is available for the issuance of standby letters of credit, $10.0 million is available as swing line loans and $50.0 million is available for multicurrency borrowings. Amounts repaid under the credit facility may be re-borrowed.
The credit facility is secured by a first priority lien and security interest in (a) all of the equity interests and intercompany debt of our direct and indirect subsidiaries, except, in the case of foreign subsidiaries, to the extent that such pledge would be prohibited by applicable law or would result in adverse tax consequences, (b) all of our present and future tangible and intangible assets and our direct and indirect subsidiaries (other than immaterial subsidiaries and foreign subsidiaries) and (c) all proceeds and products of the property and assets described in clauses (a) and (b) above. Our obligations under the credit facility are guaranteed by our direct and indirect wholly-owned subsidiaries (other than immaterial subsidiaries and foreign subsidiaries).
At our option, loans under the credit facility will bear interest based on the Base Rate or Eurocurrency Rate, in each case plus the Applicable Rate (each term, respectively, as defined in the credit agreement (the “Credit Agreement”), as amended governing the credit facility). The Base Rate will be, for any day, a fluctuating rate per annum equal to the highest of (a) 0.50% per annum above the Federal Funds Rate (as defined in the Credit Agreement), (b) Bank of America’s prime rate and (c) the Eurodollar Rate for a term of one month plus 1.00%. Eurodollar borrowings may be for one, two, three or six months (or such period that is 12 months or less, requested by Intersil and consented to by all the Lenders, as defined in the Credit Agreement) and will be at an annual rate equal to the period-applicable Eurodollar Rate plus the Applicable Rate. The Applicable Rate for all revolving loans is based on a pricing grid ranging from 0.75% to 1.75% per annum for Base Rate loans and 1.75% to 2.75% for Eurocurrency Rate loans based on our Consolidated Leverage Ratio (as defined in the Credit Agreement).
We did not have any outstanding borrowings against the credit facility as of January 1, 2016 or January 2, 2015.
Letters of Credit: We issue letters of credit in the ordinary course of business through major financial institutions as required by certain vendor contracts. We had outstanding letters of credit totaling $1.3 million as of January 1, 2016 and January 2, 2015. The standby letters of credit are secured by pledged deposits.
55
NOTE 11—COMMON STOCK AND DIVIDENDS
Common Stock—Our stockholders approved an Amended and Restated Certificate of Incorporation in 2005 that restated authorized capital stock to consist of 600 million shares of Intersil Class A common stock, par value $0.01 per share, and two million shares of preferred stock, par value $0.01 per share. Holders of Class A common stock are entitled to one vote for each share held. The Board of Directors has broad discretionary authority to designate the terms of the preferred stock should it be issued. As of January 1, 2016 and January 2, 2015, no shares of preferred stock were outstanding.
The table below summarizes the Class A common stock activity (in thousands):
|
Beginning balance as of January 2, 2015 |
|
130,217 |
|
Shares issued under stock plans, net of shares withheld for taxes |
|
2,511 |
|
Ending balance as of January 1, 2016 |
|
132,728 |
Dividends—We have paid a quarterly dividend since September 2003. In January 2016, the Board of Directors declared a dividend of $0.12 per share to stockholders of record as of February 16, 2016 to be paid on or about February 26, 2016. Dividends in the future will be declared at the discretion of the Board of Directors upon consideration of business conditions, liquidity and outlook.
NOTE 12—RISKS AND UNCERTAINTIES
Financial instruments - Financial instruments that potentially subject us to significant concentrations of credit risk consist primarily of cash equivalents, investments, accounts receivable and derivatives. We continually monitor our positions with and the credit quality of the governmental and financial institutions that issue our cash equivalents and investments. By policy, we limit our exposure to long-term investments and mitigate the credit risk through diversification and adherence to a policy requiring the purchase of highly rated securities. In addition, we limit the amount of investment credit exposure with any one issuer. For foreign exchange contracts, we manage potential credit exposure primarily by restricting transactions with only high-credit quality counterparties.
We market our products for sale to customers, including distributors, primarily in Asia and the U.S. We extend credit based on an evaluation of the customer’s financial condition and we generally do not require collateral.
Concentration of Operational Risk—We market our products for sale to customers, including distributors, primarily in Asia, Europe and the U.S. We extend credit based on an evaluation of the customer’s financial condition and we generally do not require collateral. The table below shows revenue by country where such value exceeded 10% in any one year:
|
|
Year Ended |
||||||||||
|
|
January 1, 2016 |
|
January 2, 2015 |
|
January 3, 2014 |
||||||
|
Revenue by country |
|
|
|
|
|
|
|
|
|
|
|
|
China |
|
47.1 |
% |
|
|
50.9 |
% |
|
|
52.9 |
% |
|
United States |
|
17.4 |
% |
|
|
18.1 |
% |
|
|
15.7 |
% |
In addition to those in the table above, our customers in each of South Korea, Japan, Germany, Singapore, Taiwan, and Thailand accounted for at least 1% of our total revenue in 2015 and 2014.
One distributor represented 20.7%, 18.4% and 17.0% of revenue during 2015, 2014 and 2013, respectively, and 17.8% and 24.4% of trade receivables as of January 1, 2016 and January 2, 2015, respectively.
We relied on external vendors for 86.0% and 86.9% of our wafer supply as measured in units during 2015 and 2014, respectively. Additionally, we rely primarily on external vendors for test, assembly and packaging services. The test, assembly and packaging vendors we utilize are located mainly in Asia, where a significant volume of our final product sales are made.
Geographic Information—The following table presents revenue and long-lived asset information based on geographic region. Net revenue is based on the geographic location of the distributors, original equipment manufacturers or contract manufacturers who purchased our products, which may differ from the geographic location of the end customers. Long-lived assets include property, plant and equipment and are based on the physical location of the assets (in thousands):
56
|
|
Year Ended |
||||||||||
|
|
January 1, 2016 |
|
January 2, 2015 |
|
January 3, 2014 |
||||||
|
North America operations |
|
|
|
|
|
|
|
|
|
|
|
|
Revenue |
$ |
91,932 |
|
|
$ |
101,268 |
|
|
$ |
90,348 |
|
|
Tangible long-lived assets |
$ |
52,991 |
|
|
$ |
55,681 |
|
|
$ |
59,469 |
|
|
International operations |
|
|
|
|
|
|
|
|
|
|
|
|
Revenue |
$ |
429,684 |
|
|
$ |
461,287 |
|
|
$ |
484,847 |
|
|
Tangible long-lived assets |
$ |
18,053 |
|
|
$ |
16,591 |
|
|
$ |
22,398 |
|
Concentration of other risks - The semiconductor industry is characterized by rapid technological change, competitive pricing pressures, and cyclical market patterns. Our results of operations are affected by a wide variety of factors, including general economic conditions; economic conditions specific to the semiconductor industry; demand for our products; the timely introduction of new products; implementation of new manufacturing technologies; manufacturing capacity; the availability and cost of materials and supplies; competition; the ability to safeguard patents and intellectual property in a rapidly evolving market; and reliance on assembly and manufacturing foundries, independent distributors and sales representatives. As a result, we may experience substantial period-to-period fluctuations in future operating results due to the factors mentioned above or other factors.
The following table sets forth the computation of basic and diluted earnings per share (in thousands, except per share amounts):
|
|
Year Ended |
|||||||
|
|
January 1, 2016 |
|
January 2, 2015 |
|
January 3, 2014 |
|||
|
Numerator: |
|
|
|
|
|
|
|
|
|
Net income to common stockholders |
$ |
7,186 |
|
$ |
54,812 |
|
$ |
2,855 |
|
Denominator: |
|
|
|
|
|
|
|
|
|
Denominator for basic earnings per share—weighted average common shares |
|
131,793 |
|
|
129,149 |
|
|
127,151 |
|
Effect of stock options and awards |
|
1,480 |
|
|
3,508 |
|
|
847 |
|
Denominator for diluted earnings per share—adjusted weighted average common shares |
|
133,273 |
|
|
132,657 |
|
|
127,998 |
|
Earnings per share: |
|
|
|
|
|
|
|
|
|
Basic |
$ |
0.05 |
|
$ |
0.42 |
|
$ |
0.02 |
|
Diluted |
$ |
0.05 |
|
$ |
0.41 |
|
$ |
0.02 |
|
Anti-dilutive shares not included in the above calculations: |
|
|
|
|
|
|
|
|
|
Awards |
|
- |
|
|
242 |
|
|
1,181 |
|
Options |
|
1,194 |
|
|
1,128 |
|
|
6,774 |
NOTE 14—EQUITY-BASED COMPENSATION
Our equity compensation plans are summarized below (in thousands):
|
Equity Compensation Arrangement |
Total Number of Shares in Arrangement |
Shares Outstanding as of January 1, 2016 |
Shares Available for Issuance at January 1, 2016 |
||
|
1999 Plan |
36,250 | 24 |
- |
||
|
2008 Plan |
46,352 | 8,563 | 14,262 | ||
|
2009 Option Exchange Plan |
2,914 | 719 |
- |
||
|
Inducement Plan |
433 | 216 |
- |
||
|
ESPP |
9,033 |
- |
2,451 | ||
| 94,982 | 9,522 | 16,713 |
57
Grant Date Fair Values and Underlying Assumptions; Contractual Terms
For Options granted in 2015 and 2014, we estimated the fair value of each Option as of the date of grant with the following assumptions:
|
|
Year Ended |
||
|
|
January 1, 2016 |
|
January 2, 2015 |
|
Expected volatilities |
32.1% |
|
32.2% |
|
Dividend yields |
4.0% |
|
3.6% |
|
Risk-free interest rate |
1.0% |
|
0.8% |
|
Expected lives, in years |
2.6 |
|
2.6 |
The following table represents the weighted-average fair value compensation cost per share of Options and Awards granted:
|
Year Ended |
||||||||
|
January 1, 2016 |
January 2, 2015 |
January 3, 2014 |
||||||
|
Options |
$ |
1.88 |
$ |
2.18 |
$ |
1.67 | ||
|
Awards |
$ |
14.20 |
$ |
13.12 |
$ |
8.58 | ||
Information Regarding Options and Awards—Information about Options and Awards as of January 1, 2016 and activity for Options and Awards for the three years then ended is presented below:
|
|
Options |
|
|
Awards |
|
Aggregate information |
|||||||||
|
|
Shares |
|
Weighted-average price |
|
Weighted-average remaining contract lives |
|
|
Shares |
|
Aggregate intrinsic value |
|
|
Aggregate unrecognized compensation cost |
||
|
|
(in thousands) |
|
|
(per share) |
|
(in years) |
|
|
(in thousands) |
|
|
(in thousands) |
|
|
(in thousands) |
|
Outstanding as of December 28, 2012 |
11,946 |
|
$ |
14.90 |
|
3.7 |
|
|
3,367 |
|
|
|
|
|
|
|
Granted(1) |
340 |
|
|
8.38 |
|
|
|
|
3,334 |
|
|
|
|
|
|
|
Exercised (2) |
(106) |
|
|
8.34 |
|
|
|
|
(931) |
|
|
|
|
|
|
|
Canceled |
(4,684) |
|
|
16.89 |
|
|
|
|
(1,166) |
|
|
|
|
|
|
|
Outstanding as of January 3, 2014 |
7,496 |
|
$ |
13.46 |
|
3.3 |
|
|
4,604 |
|
|
|
|
|
|
|
Granted (1) |
70 |
|
|
13.45 |
|
|
|
|
2,109 |
|
|
|
|
|
|
|
Exercised (2) |
(1,205) |
|
|
12.36 |
|
|
|
|
(1,153) |
|
|
|
|
|
|
|
Canceled |
(978) |
|
|
19.28 |
|
|
|
|
(309) |
|
|
|
|
|
|
|
Outstanding as of January 2, 2015 |
5,383 |
|
$ |
12.65 |
|
2.9 |
|
|
5,251 |
|
|
|
|
|
|
|
Granted (1) |
40 |
|
|
12.01 |
|
6.3 |
|
|
2,321 |
|
|
|
|
|
|
|
Exercised (2) |
(908) |
|
|
12.01 |
|
1.8 |
|
|
(1,527) |
|
|
|
|
|
|
|
Canceled |
(502) |
|
|
18.02 |
|
1.2 |
|
|
(536) |
|
|
|
|
|
|
|
Outstanding as of January 1, 2016 |
4,013 |
|
$ |
12.02 |
|
2.2 |
|
|
5,509 |
|
$ |
75,432 |
|
$ |
29,042 |
|
|
|
|
|
|
|
|
|
|
|
|
|
|
|
|
|
|
As of January 1, 2016: |
|
|
|
|
|
|
|
|
|
|
|
|
|
|
|
|
Exercisable/vested (2) |
3,881 |
|
$ |
12.01 |
|
2.1 |
|
|
67 |
|
$ |
5,974 |
|
|
|
|
Vested and expected to vest |
4,013 |
|
$ |
12.02 |
|
2.2 |
|
|
4,078 |
|
$ |
57,278 |
|
|
|
58
|
(1) |
Grants include 360,153, 433,564, and 784,000 MSU Awards issued in 2015, 2014, and 2013, respectively. |
|
(2) |
Awards exercised are those that have reached full vested status and have been delivered to the recipients as a taxable event due to elective deferral, available in the case of deferred stock units. Deferred stock units for which the deferral is elected timely are vested but still outstanding as Awards. Total un-issued shares related to deferred stock units as of January 1, 2016 were 67 thousand shares as shown in the Awards column as Exercisable/vested. |
The unrecognized compensation cost is expected to be recognized over a period of 1.79 years.
|
Additional Disclosures |
Year Ended |
|||||||
|
|
January 1, 2016 |
|
January 2, 2015 |
|
January 3, 2014 |
|||
|
|
|
|
|
|
|
|
|
|
|
|
|
(in thousands) |
||||||
|
Shares issued under the employee stock purchase plan |
|
537 |
|
|
495 |
|
|
712 |
|
Aggregate intrinsic value of stock options exercised |
$ |
2,243 |
|
$ |
2,445 |
|
$ |
175 |
The following table is a summary of the number and weighted-average grant date fair values regarding our unexercisable/unvested Options and Awards as of January 1, 2016 and activity during the year then ended (in thousands, except per share data):
|
|
Options Unvested |
|
Options-Weighted Average Grant Date Fair Values |
|
Awards Unvested |
|
Awards-Weighted Average Grant Date Fair Values |
||
|
Unvested as of January 2, 2015 |
717 |
|
$ |
2.86 |
|
5,184 |
|
$ |
10.51 |
|
Granted |
40 |
|
|
1.88 |
|
2,321 |
|
|
14.20 |
|
Vested |
(573) |
|
|
2.23 |
|
(1,527) |
|
|
10.37 |
|
Forfeited |
(52) |
|
|
2.79 |
|
(536) |
|
|
11.18 |
|
Unvested as of January 1, 2016 |
132 |
|
$ |
5.29 |
|
5,442 |
|
$ |
12.28 |
Financial Statement Effects and Presentation—The following table shows total equity-based compensation expense for the periods indicated (in thousands):
|
|
Year Ended |
|||||||
|
|
January 1, 2016 |
|
January 2, 2015 |
|
January 3, 2014 |
|||
|
By statement of income line item |
|
|
|
|
|
|
|
|
|
Cost of revenue |
$ |
1,400 |
|
$ |
1,326 |
|
$ |
1,387 |
|
Research and development |
$ |
10,167 |
|
$ |
8,468 |
|
$ |
7,777 |
|
Selling, general and administrative |
$ |
11,591 |
|
$ |
8,894 |
|
$ |
9,927 |
|
By stock type |
|
|
|
|
|
|
|
|
|
Stock options |
$ |
617 |
|
$ |
1,189 |
|
$ |
4,690 |
|
Restricted and deferred stock awards |
$ |
21,464 |
|
$ |
16,493 |
|
$ |
13,378 |
|
Employee stock purchase plan |
$ |
1,077 |
|
$ |
1,006 |
|
$ |
1,023 |
Market and Performance-based Grants — As of January 1, 2016, we had Options and Awards outstanding that include the usual service conditions as well as (1) market conditions related to total stockholder return and (2) performance conditions relating to revenue and operating income relative to peer companies. Under the terms of the agreements, participants may receive from 0 - 300% of the original grant. Equity-based compensation cost is measured at the grant date, based on the fair value of the number of shares ultimately expected to vest, and is recognized as an expense, on a straight line basis, over the requisite service period (shares in thousands):
59
|
|
January 1, 2016 |
||
|
|
Options |
|
Awards |
|
|
(in thousands) |
||
|
Performance and market-based units outstanding |
368 |
|
1,393 |
|
Maximum shares that could be issued assuming the highest level of performance |
341 |
|
2,948 |
|
Performance and market-based shares vested / expected to vest |
341 |
|
1,552 |
|
Amount to be recognized as compensation cost over the performance period |
$ - |
|
$ 1,778 |
60
NOTE 15—COMMITMENTS AND CONTINGENCIES
TAOS litigation
Texas Advanced Optoelectronic Solutions, Inc., or TAOS, named us as a defendant in a lawsuit filed on November 25, 2008 in the United States District Court for the Eastern District of Texas. In this action, TAOS alleged four claims consisting of patent infringement, breach of contract, trade secret misappropriation, and tortious interference with a business relationship. On March 6, 2015, the jury found in favor of TAOS on each of the four claims and recommended to the court that we pay $48.7 million in actual damages and $10.0 million in exemplary damages on the trade secret misappropriation claim along with $74,000 in damages for patent infringement. The jury’s verdict also included other duplicate damages of $30.0 million. After the trial, TAOS filed post-trial motions seeking unspecified attorneys’ fees, enhanced patent infringement damages, $18.1 million in pre-judgment interest, which will continue to accrue until the judgment is entered, and a permanent injunction enjoining us from making or selling certain ambient light sensor products. We have vigorously opposed each of these motions. We filed post-trial motions for a new trial and renewed a motion for judgment as a matter of law. In January 2016, the court heard oral arguments on TAOS’ motions for a permanent injunction and unspecified attorneys’ fees and declined to hear oral argument on the other motions before it. The court has not provided a timeframe in which it will provide its ruling on the motions filed by the parties. We are prepared to file an appeal with the U.S. Court of Appeals for the Federal Circuit.
As a consequence of the verdict, during 2015, we recorded a provision of $81.1 million related to this matter, including pre-judgment interest and estimated legal costs, but excluding the damages we believe to be duplicative. During 2015, we incurred $3.1 million of legal costs, and, as such, the accrual outstanding as of January 1, 2016 was $78.0 million. Given the unpredictable nature of this type of litigation and because the outcome remains subject to post-trial motions and appeal, the ultimate impact of this lawsuit may be materially different from our estimate.
Environmental matter
In a correspondence dated September 28, 2015, Thomson Consumer Electronics Television Taiwan, Ltd., or TCETVT, notified us that it reserved its right to seek indemnification from us for any and all costs, fees and expenses incurred as a result of a toxic tort class action lawsuit filed in Taiwan against TCETVT and others. The lawsuit pertains to alleged injuries resulting from groundwater contamination at a manufacturing facility in Taiwan currently owned by TCETVT, which was previously owned and operated by predecessors (including General Electric and Harris Corporation) of our Taiwan subsidiary, Intersil Ltd. In the September 28 correspondence, TCETVT also informed us that the Taipei District Court entered a judgment of $18.5 million in the lawsuit against TCETVT, which judgment has been appealed. In addition, TCETVT informed us that they have incurred costs of $11.2 million in defending against the lawsuit through September 1, 2015. We were also advised by TCETVT that additional claimants made be added to the lawsuit and TCETVT believes that if such additional claimants were successfully added, the resulting liability could be as high as $200 million.
TCETVT also informed us that it reserved its right to seek indemnification from us for any and all costs associated with the remediation of the contamination on that site and nearby areas. TCETVT claims they have incurred $15.9 million in remediation-related costs through September 1, 2015.
Under the terms of the 1999 Master Transaction Agreement between Harris Corporation and Intersil, whereby Harris transferred its semiconductor business assets to us, environmental liabilities (including those associated with Harris’ Taiwan semiconductor operations) were expressly retained by Harris. The Master Transaction Agreement also requires Harris to indemnify us for any and all costs relating to those retained environmental liabilities. We have denied liability to TCETVT for the costs associated with the lawsuit as well as the costs associated with the remediation of the contamination on the site. We have also submitted a claim notice to Harris seeking defense and indemnification from Harris under the Master Transaction Agreement for any and all claims made by TCETVT in connection with this matter. Harris has not yet agreed to indemnify us for the liability asserted by TCETVT.
Export compliance settlement
A portion of our activities are subject to export control regulations administered by the U.S. Department of State, or DOS, under the U.S. Arms Export Control Act, or AECA, and the International Traffic in Arms Regulations, or ITAR. In September 2010, in response to a request for information, we disclosed to the Directorate of Defense Trade Controls, or DTCC, information concerning export activities for the years of 2005 through 2010. ITAR gives the DOS authority to impose civil penalties and other administrative
61
sanctions for violations, including debarment from engaging in the exporting of defense articles. In June of 2013, the DTCC notified us of potential ITAR violations and that it was considering pursuing administrative proceedings against us. On June 16, 2014, we entered into a Consent Agreement with the DTCC for the purpose of resolving the potential ITAR violations. Our agreement with the DTCC has a two-year term and provides for: (i) payment of an aggregate civil penalty of $10 million, $4 million of which is suspended and eligible for an offset credit based on verified expenditures for certain past and future remedial compliance measures; (ii) the appointment of an internal Special Compliance Official to oversee compliance with the Consent Agreement and U.S. export control regulations, in general; (iii) two external audits of the Company’s ITAR compliance program; and (iv) continued implementation of ongoing remedial compliance measures and additional remedial compliance measures related to automated systems and ITAR compliance policies, procedures, and training. In connection with the settlement, we estimated and recorded a $6 million charge in the quarter ended October 4, 2013 and an additional $4 million charge in the quarter ended April 4, 2014 when the amount of the penalty was determined. The $6 million portion of the settlement that was not subject to suspension was paid in two installments of $3 million each, paid in June 2014 and June 2015. We expect that investments made in our export control compliance program, which include additional staffing, ongoing implementation of a new software system, employee training, and establishment of a regular compliance audit program and corrective action process, will be eligible for credit against the suspended portion of the settlement amount. We expect that these investments in remedial compliance measures will be sufficient to cover the $4 million suspended payment. At the end of 2015, we had spent $3.0 million on improvements to our export compliance program.
We are currently party to various claims and legal proceedings, including the ones discussed above. When we believe that a loss is probable and the amount of the loss can be reasonably estimated, we recognize the estimated amount of the loss. We include legal costs in the estimate of losses. As additional information becomes available, we reassess any potential liability related to these matters and, if necessary, revise the estimates. We incur indemnification obligations for intellectual property infringement claims related to our products. We accrue for known indemnification issues and estimate unidentified issues based on historical activity.
We do not believe, based on currently available facts and circumstances, that the ultimate outcome of these matters, individually and in the aggregate will have a material adverse effect on our financial position or overall trends in results of our operations in excess of amounts already accrued. However, litigation is subject to inherent uncertainties and unfavorable rulings could occur, including an award of substantial monetary damages or issuance of an injunction prohibiting us from selling one or more products. From time-to-time, we may enter into confidential discussions regarding the potential settlement of such lawsuits. Any settlement of pending litigation could require us to incur substantial costs and other ongoing expenses, such as future royalty payments in the case of an intellectual property dispute. There can be no assurances that the actual amounts required to satisfy any liabilities arising from the matters described above will not have a material adverse effect on our results of operations, financial position or cash flows.
Total rental expense amounted to $7.8 million, $7.7 million, and $8.8 million for 2015, 2014, and 2013, respectively. Future minimum lease commitments under non-cancelable operating leases primarily related to land and office buildings amounted to $28.1 million as of January 1, 2016.
The following table sets forth future minimum lease commitments and non-cancelable purchase commitments as of January 1, 2016 (in thousands):
|
|
Future minimum lease commitments |
|
Non-cancelable purchase commitments |
||
|
2016 |
$ |
5,540 |
|
$ |
22,773 |
|
2017 |
|
4,958 |
|
|
- |
|
2018 |
|
4,309 |
|
|
- |
|
2019 |
|
3,128 |
|
|
- |
|
Thereafter |
|
10,140 |
|
|
- |
|
Total future minimum commitments |
$ |
28,075 |
|
$ |
22,773 |
62
NOTE 16—QUARTERLY FINANCIAL DATA (UNAUDITED)
The following is a summary of unaudited quarterly financial information for the periods indicated (in thousands, except per share data):
|
|
Quarters Ended |
||||||||||||||
|
|
Jan 1, 2016 |
|
Oct 2, 2015 |
|
Jul 3, 2015 |
|
Apr 3, 2015 |
|
Jan 2, 2015 |
|
Oct 3, 2014 |
|
Jul 4, 2014 |
|
Apr 4, 2014 |
|
Revenue |
$ 126,626 |
|
$ 128,396 |
|
$ 132,441 |
|
$ 134,153 |
|
$ 131,126 |
|
$ 143,612 |
|
$ 147,761 |
|
$ 140,056 |
|
Gross profit |
72,919 |
|
76,058 |
|
78,493 |
|
80,326 |
|
78,193 |
|
83,849 |
|
85,808 |
|
78,905 |
|
Net income (loss) |
21,302 |
|
16,984 |
|
37,724 |
|
(68,824) |
|
17,274 |
|
13,887 |
|
13,646 |
|
10,005 |
|
Income (loss) per share (basic): |
0.16 |
|
0.13 |
|
0.29 |
|
(0.53) |
|
0.13 |
|
0.11 |
|
0.11 |
|
0.08 |
|
Income (loss) per share (diluted): |
0.16 |
|
0.13 |
|
0.28 |
|
(0.53) |
|
0.13 |
|
0.10 |
|
0.10 |
|
0.08 |
—End of Consolidated Financial Statements—
63
Item 9.Changes in and Disagreements With Accountants on Accounting and Financial Disclosure.
None.
Item 9A.Controls and Procedures.
Evaluation of Disclosure Controls and Procedures
Our management, with the participation of our Chief Executive Officer, or CEO, and Chief Financial Officer, or CFO, evaluated the effectiveness of our disclosure controls and procedures (as defined in Rules 13a-15(e) and 15d-15(c) of the Securities Exchange Act of 1934, as amended, or the Exchange Act) as of January 1, 2016, the end of our year.
Based on this evaluation, our CEO and CFO concluded that, our disclosure controls and procedures were (1) designed to ensure that material information relating to us, including our consolidated subsidiaries, is made known to our CEO and CFO by others within those entities, and (2) effective as of January 1, 2016 in providing reasonable assurance that all material information required to be disclosed by Intersil in the reports that it files or furnishes is recorded, processed, summarized and reported within the time periods specified in the rules and forms of the Securities and Exchange Commission, or SEC, and that all such material information is accumulated and communicated to our management, including our CEO and CFO, to allow timely decisions regarding required disclosures, and (3) no change in internal control over financial reporting occurred during the quarter ended January 1, 2016, that has materially affected, or is reasonably likely to materially affect, our internal control over financial reporting.
Management Report on Internal Control over Financial Reporting
Management is responsible for establishing and maintaining adequate internal control over financial reporting, as defined in Exchange Act Rule 13a-15(f), to provide reasonable assurance regarding the reliability of our financial reporting and the preparation of financial statements for external purposes in accordance with generally accepted accounting principles. Internal control over financial reporting includes those policies and procedures that (i) pertain to the maintenance of records that in reasonable detail accurately and fairly reflect the transactions and dispositions of company assets; (ii) provide reasonable assurance that transactions are recorded as necessary to permit preparation of financial statements in accordance with generally accepted accounting principles, and that receipts and expenditures are being made only in accordance with authorizations of our management and directors; and (iii) provide reasonable assurance regarding prevention or timely detection of unauthorized acquisition, use or disposition of company assets that could have a material effect on the financial statements.
Management evaluated the effectiveness of our internal control over financial reporting as of January 1, 2016, the end of our year, based on the framework and criteria established in Internal Control – Integrated Framework (2013) issued by the Committee of Sponsoring Organizations of the Treadway Commission. Based on this evaluation, management concluded that our internal control over financial reporting was effective as of January 1, 2016.
Management reviewed the results of its assessment with the Audit Committee of our Board of Directors. The effectiveness of our internal control over financial reporting as of January 1, 2016 has been audited by KPMG LLP, an independent registered public accounting firm, as stated in its report which is included in Item 8 of this Annual Report on Form 10-K.
64
Inherent Limitations on Effectiveness of Controls
Our management, including our CEO and CFO, does not expect that our disclosure controls and procedures or our internal control over financial reporting will prevent or detect all error and all fraud. A control system, no matter how well designed and operated, can provide only reasonable, not absolute, assurance of achieving the desired control objectives. The design of a control system must reflect the fact that the benefits of controls must be considered relative to their costs. Further, because of the inherent limitations in all control systems, no evaluation of controls can provide absolute assurance that misstatements due to error or fraud will not occur or that all control issues and instances of fraud, if any, within Intersil have been detected. These inherent limitations include the realities that judgments in decision-making can be faulty and that breakdowns can occur because of simple error or mistake. Controls can also be circumvented by the individual acts of some persons, by collusion of two or more people, or by management override of the controls. The design of any system of controls is based in part on certain assumptions about the likelihood of future events, and there can be no assurance that any design will succeed in achieving its stated goals under all potential future conditions. Projections of any evaluation of controls effectiveness to future periods are subject to risks. Over time, controls may become inadequate because of changes in conditions or deterioration in the degree of compliance with policies or procedures.
None.
Item 10.Directors, Executive Officers and Corporate Governance.
Members of the Board of Directors
The following individuals served on our Board of Directors as of January 1, 2016:
Mercedes Johnson; Sohail Khan; Gregory Lang; Donald Macleod; Ernie Maddock; Forrest Norrod; Jan Peeters; Necip Sayiner; and James A. Urry. The information required to be reported with respect to the directors listed in this paragraph pursuant to Item 401 of Regulation S-K will appear in the definitive Proxy Statement relating to our 2016 Annual Meeting of Stockholders, to be filed by us with the SEC pursuant to Section 14(a) of the Exchange Act and is hereby specifically incorporated herein by reference thereto.
Executive Officers and Key Employees
The executive officers and key employees of Intersil as of January 1, 2016 were as follows:
Necip Sayiner; Richard Crowley; Andrew Micallef; Thomas Tokos (through December 31, 2015); and Roger Wendelken. The information required to be reported with respect to the executive officers and key employees listed in this paragraph pursuant to Item 401 of Regulation S-K will appear in the definitive Proxy Statement relating to our 2016 Annual Meeting of Stockholders, to be filed by us with the SEC pursuant to Section 14(a) of the Exchange Act, and is hereby specifically incorporated herein by reference thereto.
65
The information required under this item with respect to the compliance with Section 16(a) of the Exchange Act will appear under the caption “Section 16(a) Beneficial Ownership Reporting Compliance” in the definitive Proxy Statement relating to our 2014 Annual Meeting of Stockholders, to be filed by us with the SEC pursuant to Section 14(a) of the Exchange Act, and is hereby specifically incorporated herein by reference thereto.
The information required under this item with respect to our Audit, Compensation and Nominating and Governance Committees will appear under the captions “Corporate Governance—Committees of the Board—Audit Committee,” “Corporate Governance—Committees of the Board—Compensation Committee,” and “Corporate Governance—Committees of the Board—Nominating and Governance Committee” in the definitive Proxy Statement relating to our 2015 Annual Meeting of Stockholders, to be filed by us with the SEC pursuant to Section 14(a) of the Exchange Act, and is hereby specifically incorporated herein by reference thereto.
We have adopted a Code of Ethics applicable to our Senior Financial Officers, including our CEO, CFO and other persons performing similar functions. A copy of the Code of Ethics is available on the Investor Relations section of our website at, www.intersil.com/investor. Any amendment to, or waiver of, any provision of the Code of Ethics will be disclosed on our website within five business days following such amendment or waiver.
Item 11.Executive Compensation.
The information required under this item will appear in the definitive Proxy Statement relating to our 2016 Annual Meeting of Stockholders, to be filed by us with the SEC pursuant to Section 14(a) of the Exchange Act, and is hereby specifically incorporated herein by reference thereto.
Item 12.Security Ownership of Certain Beneficial Owners and Management and Related Stockholder Matters.
The information required under this item will appear in the definitive Proxy Statement relating to our 2016 Annual Meeting of Stockholders, to be filed by us with the SEC pursuant to Section 14(a) of the Exchange Act, and is hereby specifically incorporated herein by reference thereto.
Item 13.Certain Relationships and Related Transactions, and Director Independence.
The information required under this item will appear under in the definitive Proxy Statement relating to our 2016 Annual Meeting of Stockholders, to be filed by us with the SEC pursuant to Section 14(a) of the Exchange Act, and is hereby specifically incorporated herein by reference thereto.
Item 14.Principal Accounting Fees and Services.
The information required under this item will appear in the definitive Proxy Statement relating to our 2016 Annual Meeting of Stockholders, to be filed by us with the SEC pursuant to Section 14(a) of the Exchange Act, and is hereby specifically incorporated herein by reference thereto.
66
Item 15.Exhibits, Financial Statement Schedules.
|
(a) |
The consolidated financial statements and related Notes thereto as set forth under Item 8 of this Annual Report on Form 10-K are incorporated herein by reference. |
|
(b) |
Financial Statement Schedules. |
|
Valuation and Qualifying Accounts |
||||||||||
|
(in thousands) |
||||||||||
|
Valuation and qualifying accounts deducted from the assets to which they apply |
|
Balance as of Beginning of Period |
|
Additions Charged to Revenue, Costs and Expenses |
|
Additions Charged (Credited) to Other Accounts |
|
Deduction from Allowances |
|
Balance as of End of Period |
|
Allowance for uncollectible accounts |
|
|
|
|
|
|
|
|
|
|
| 2015 |
|
$ 3 |
|
$ - |
|
$ - |
|
$ - |
|
$ 3 |
| 2014 |
|
$ 526 |
|
$ 210 |
|
$ (733) |
|
$ - |
|
$ 3 |
| 2013 |
|
$ 26 |
|
$ 1,319 |
|
$ (819) |
|
$ - |
|
$ 526 |
|
|
|
|
|
|
|
|
|
|
|
|
|
Sales returns and allowances |
|
|
|
|
|
|
|
|
|
|
| 2015 |
|
$ 13,287 |
|
$ 88,582 |
|
$ - |
|
$ (87,238) |
|
$ 14,631 |
| 2014 |
|
$ 13,754 |
|
$ 101,321 |
|
$ - |
|
$ (101,788) |
|
$ 13,287 |
| 2013 |
|
$ 14,865 |
|
$ 86,520 |
|
$ (599) |
|
$ (87,032) |
|
$ 13,754 |
The additions charged to costs and expenses are classified as reduction of revenue for the allowance for uncollectible accounts and sales returns and allowances.
All other schedules for which provision is made in the applicable accounting regulation of the SEC are not required under the related instructions or are inapplicable and therefore have been omitted.
67
|
(c) |
Index to Exhibits. |
|
Exhibit No. |
Description |
|
3.1 |
Amended and Restated Certificate of Incorporation of Intersil Corporation (incorporated by reference to Exhibit 3.01 to the Quarterly Report on Form 10-Q filed on August 9, 2005). |
|
3.2 |
Third Amended and Restated Bylaws of Intersil Corporation (incorporated by reference to Exhibit 3.2 to the Current Report on Form 8-K filed on March 31, 2015). |
|
4 |
Specimen Certificate of Intersil Corporation’s Class A Common Stock (incorporated by reference to Exhibit 4.1 to the Annual Report on Form 10-K filed on February 27, 2007). |
|
10.1 |
Credit Agreement dated September 1, 2011, by and among Intersil Corporation, the Lenders (as defined therein), Bank of America, N.A. as administrative agent, swing line lender, and letter of credit issuer (incorporated by reference to Exhibit 10.1 to the Current Report on Form 8-K filed on September 8, 2011). |
|
10.2 |
First Amendment to Credit Agreement dated June 20, 2012, by and among Intersil Corporation, the Lenders (as defined therein), and Bank of America, N.A. as administrative agent, swing line lender, and letter of credit issuer (incorporated by reference to Exhibit 10 to the Quarterly Report on Form 10-Q filed on August 3, 2012). |
|
10.3 |
Second Amendment to Credit Agreement dated September 20, 2012, by and among Intersil Corporation, the Lenders (as defined therein), and Bank of America, N.A. as administrative agent, swing line lender, and letter of credit issuer (incorporated by reference to Exhibit 10 to the Quarterly Report on Form 10-Q filed on November 2, 2012). |
|
10.4 |
Office Lease between MRTP, LLC and Intersil Corporation, dated March 1, 2010 (incorporated by reference to Exhibit 10 to the Quarterly Report on Form 10-Q filed on May 7, 2010). |
|
10.5 |
First Amendment to Office Lease by and between Intersil Corporation and SPUS6 Murphy Crossing, LP (as successor-in-interest to MRTP, LLC), dated as of December 22, 2015 (incorporated by reference to Exhibit 10.1 to the Current Report on Form 8-K filed on December 24, 2015). |
|
10.6 |
Consent Agreement between Intersil Corporation and the Office of Defense Trade Controls Compliance (“DTCC”), Bureau of Political-Military Affairs, U.S. Department of State, dated June 16, 2014 (incorporated by reference to Exhibit 10.1 to the Current Report on Form 8-K filed on June 18, 2014). |
|
10.7 + |
Intersil Corporation Amended and Restated 2008 Equity Compensation Plan (incorporated by reference to Exhibit A to the Definitive Proxy Statement on Form DEF 14A filed on March 14, 2014). |
|
10.8 + |
Intersil Corporation Amended and Restated 2008 Equity Compensation Plan Terms and Conditions RSU Award (effective August 1, 2015).* |
|
10.9 + |
Intersil Corporation Employee Stock Purchase Plan, as amended (incorporated by reference to Exhibit B to the Definitive Proxy Statement on Form DEF 14A filed on March 14, 2014). |
|
10.10 + |
Intersil Corporation Executive Incentive Plan (incorporated by reference to Exhibit C to the Definitive Proxy Statement on Form DEF 14A filed on March 14, 2014). |
|
10.11 + |
Intersil Corporation 2008 Equity Compensation Plan Terms and Conditions One-Year Cliff, effective December 9, 2012, in favor of James Diller (incorporated by reference to Exhibit 10.1 to the Current Report on Form 8-K filed on December 13. 2012). |
|
10.12 + |
Employment Agreement between Intersil Corporation and Necip Sayiner, dated March 11, 2013 (incorporated by reference to Exhibit 10.1 to the Current Report on Form 8-K filed on March 12, 2013). |
|
10.13 + |
Executive Change in Control Severance Benefits Agreement between Intersil Corporation and Necip Sayiner, dated March 14, 2013 (incorporated by reference to Exhibit 10.2 to the Current Report on Form 8-K filed on March 12, 2013). |
|
10.14 + |
Intersil Corporation 2008 Equity Compensation Plan Terms and Conditions One-Year Cliff, effective April 1, 2013, in favor of Necip Sayiner (incorporated by reference to Exhibit 10.3 to the Current Report on Form 8-K filed on March 12, 2013). |
|
10.15 + |
Separation Agreement and General Release between Intersil Corporation and Gerry Edwards, dated January 26, 2015 (incorporated by reference to Exhibit 10.1 to the Current Report on Form 8-K filed on January 27, 2015). |
|
10.16 + |
Agreement and General Release between Thomas Tokos and Intersil Corporation, dated as of November 9, 2015 (incorporated by reference to Exhibit 10.1 to the Current Report on Form 8-K filed on November 9, 2015). |
|
10.17 + |
Form of Intersil Corporation Indemnity Agreement (incorporated by reference to Exhibit 99.2 to the Current Report on Form 8-K filed on October 28, 2014). |
|
10.18+ |
Form of Amended and Restated Executive Change in Control Severance Benefits Agreement.* |
|
14 |
Intersil Code of Ethics for the Chief Executive Officer, Chief Financial Officer, and Treasurer of Intersil Corporation (incorporated by reference to Exhibit 14.01 to the Annual Report on Form 10-K filed on March 9, 2004). |
68
|
21 |
Subsidiaries of Intersil Corporation.* |
|
23 |
Consent of KPMG LLP, Independent Registered Public Accounting Firm.* |
|
24 |
Power of Attorney (see signature page).* |
|
31.1 |
Certification of Chief Executive Officer Pursuant to Rule 13a-14(a) of the Exchange Act, as adopted by Section 302 of the Sarbanes-Oxley Act of 2002.* |
|
31.2 |
Certification of Chief Financial Officer Pursuant to Rule 13a-14(a) of the Exchange Act, as adopted by Section 302 of the Sarbanes-Oxley Act of 2002.* |
|
32 |
Certification of the Chief Executive Officer and Chief Financial Officer Pursuant to Rule 13a-14(b) of the Exchange Act and 18 U.S.C. Section 1350, as Adopted Pursuant to Section 906 of the Sarbanes-Oxley Act of 2002.* |
|
101.INS |
XBRL Instance document |
|
101.SCH |
XBRL Taxonomy Extension Schema |
|
101.CAL |
XBRL Taxonomy Extension Calculation Linkbase |
|
101.DEF |
XBRL Taxonomy Extension Definition Linkbase |
|
101.LAB |
XBRL Taxonomy Extension Label Linkbase |
|
101.PRE |
XBRL Taxonomy Extension Presentation Linkbase |
*Filed herewith.
+ Indicates management contract or compensatory plan or arrangement in which executive officers of the Company are eligible to participate.
Attached as Exhibit 101 to this report are the following, formatted in XBRL (Extensible Business Reporting Language): (i) Consolidated Statements of Income, (ii) Consolidated Statements of Comprehensive Income, (iii) Consolidated Statements of Cash Flows, (iv) Consolidated Balance Sheets, (v) Consolidated Statements of Stockholders’ Equity and (vi) Notes to Consolidated Financial Statements.
69
Pursuant to the requirements of Section 13 or 15(d) of the Securities Exchange Act of 1934, the registrant has duly caused this report to be signed on its behalf by the undersigned, thereunto duly authorized.
|
INTERSIL CORPORATION |
|
|
By: |
/s/ Necip Sayiner |
|
|
Necip Sayiner President & Chief Executive Officer February 12, 2016 |
Power of Attorney
KNOW ALL PERSONS BY THESE PRESENTS, that each person whose signature appears below constitutes and appoints Richard Crowley and Andrew S. Hughes, and each of them, his or her true and lawful attorneys-in-fact and agents, with full power of substitution and resubstitution, to sign any and all amendments (including post-effective amendments) to this Annual Report on Form 10-K and to file the same, with all exhibits thereto and other documents in connection therewith, with the Securities and Exchange Commission, granting unto each of said attorneys-in-fact and agents, full power and authority to do and perform each and every act and thing requisite and necessary to be done in connection therewith, as fully to all intents and purposes as he or she might or could do in person, hereby ratifying and confirming all that each of said attorneys-in-facts and agents, or his substitute or substitutes, or any of them, shall do or cause to be done by virtue hereof.
Pursuant to the requirements of the Securities Exchange Act of 1934, this report has been signed below by the following persons on behalf of the registrant and in the capacities and on the dates indicated.
|
Name |
Title |
Date |
|||
|
By: |
/s/ Necip Sayiner |
President, Chief Executive Officer and |
February 12, 2016 |
||
|
Necip Sayiner |
Director (principal executive officer) |
||||
|
By: |
/s/ Richard Crowley |
Chief Financial Officer (principal financial |
February 12, 2016 |
||
|
Richard Crowley |
and accounting officer) |
||||
|
By: |
/s/ Donald Macleod |
Chairman of the Board of Directors |
February 12, 2016 |
||
|
Donald Macleod |
|||||
|
By: |
/s/ Mercedes Johnson |
Director |
February 12, 2016 |
||
|
Mercedes Johnson |
|||||
|
By: |
/s/ Sohail Khan |
Director |
February 12, 2016 |
||
|
Sohail Khan |
|||||
|
By: |
/s/ Gregory Lang |
Director |
February 12, 2016 |
||
|
Gregory Lang |
|||||
|
By: |
/s/ Ernie Maddock |
Director |
February 12, 2016 |
||
|
Ernie Maddock |
70
|
By: |
/s/ Forrest Norrod |
Director |
February 12, 2016 |
||
|
Forrest Norrod |
|||||
|
By: |
/s/ Jan Peeters |
Director |
February 12, 2016 |
||
|
Jan Peeters |
|||||
|
By: |
/s/ James A. Urry |
Director |
February 12, 2016 |
||
|
James A. Urry |
71