Attached files
| file | filename |
|---|---|
| EX-32 - EX-32 - INTERSIL CORP/DE | isil-20121228xex32.htm |
| EX-23 - EX-23 - INTERSIL CORP/DE | isil-20121228xex23.htm |
| EX-3.2 - EX-3.2 - INTERSIL CORP/DE | isil-20121228ex326f47eed.htm |
| EX-31.2 - EX-31.2 - INTERSIL CORP/DE | isil-20121228ex312bd1ca5.htm |
| EX-21 - EX-21 - INTERSIL CORP/DE | isil-20121228ex21bb70abc.htm |
| EX-31.1 - EX-31.1 - INTERSIL CORP/DE | isil-20121228ex311b8ed0d.htm |
UNITED STATES
SECURITIES AND EXCHANGE COMMISSION
Washington, D.C. 20549
FORM 10-K
(Mark One)
[x] ANNUAL REPORT PURSUANT TO SECTION 13 OR 15(d) OF THE SECURITIES EXCHANGE ACT OF 1934
For the fiscal year ended December 28, 2012
OR
[ ] TRANSITION REPORT PURSUANT TO SECTION 13 OR 15(d) OF THE SECURITIES EXCHANGE ACT OF 1934
For the transition period from ___ to ___
Commission file number 000-29617
INTERSIL CORPORATION
(Exact name of Registrant as specified in its charter)
|
Delaware |
59-3590018 |
|
State or other jurisdiction of incorporation or organization |
(I.R.S. Employer Identification No.) |
|
|
|
|
1001 Murphy Ranch Road Milpitas, California |
95035 |
|
(Address of principal executive offices) |
(Zip Code) |
|
|
|
|
Registrant’s telephone number, including area code |
408-432-8888 |
|
|
|
|
Securities registered pursuant to Section 12(b) of the Act: |
|
|
Title of each class |
Name of each exchange on which registered |
|
Class A Common Stock, par value $0.01 per share |
The NASDAQ Stock Market LLC |
|
|
|
|
Securities registered pursuant to Section 12(g) of the Act: |
|
|
None |
|
Indicate by check mark if the registrant is a well-known seasoned issuer, as defined in Rule 405 of the Securities Act. [x] Yes [ ] No
Indicate by check mark if the registrant is not required to file reports pursuant to Section 13 or Section 15(d) of the Act. [ ] Yes [ x] No
Indicate by check mark whether the registrant (1) has filed all reports required to be filed by Section 13 or 15(d) of the Securities Exchange Act of 1934 during the preceding 12 months (or for such shorter period that the registrant was required to file such reports), and (2) has been subject to such filing requirements for the past 90 days. [x] Yes [ ] No
Indicate by check mark whether the registrant has submitted electronically and posted on its corporate Web site, if any, every Interactive Data File required to be submitted and posted pursuant to Rule 405 of Regulation S-T (§ 232.405 of this chapter) during the preceding 12 months (or for such shorter period that the registrant was required to submit and post such files). [x] Yes [ ] No
Indicate by check mark if disclosure of delinquent filers pursuant to Item 405 of Regulation S-K (§ 229.405 of this chapter) is not contained herein, and will not be contained, to the best of registrant’s knowledge, in definitive proxy or information statements incorporated by reference in Part III of this Form 10-K or any amendment to this Form 10-K. [ ]
Indicate by check mark whether the registrant is a large accelerated filer, an accelerated filer, a non-accelerated filer, or a smaller reporting company. See the definitions of “large accelerated filer,” “accelerated filer” and “smaller reporting company” in Rule 12b-2 of the Exchange Act.
|
Large accelerated filer [x] |
Accelerated filer [ ] |
|
Non-accelerated filer [ ] (Do not check if a smaller reporting company) |
Smaller reporting company [ ] |
Indicate by check mark whether the registrant is a shell company (as defined in Rule 12b-2 of the Act).[ ]Yes[x]No
The aggregate market value of our Class A Common Stock, par value $0.01 per share, held by non-affiliates (based upon the closing sale price of $10.65 on the Nasdaq Global Select Market) on June 29, 2012 was approximately $1,358.5 million.
As of February 15, 2013, there were 126,318,002 shares of our Class A Common Stock, par value $0.01 per share, outstanding.
The information required by Part III of this Annual Report on Form 10-K, to the extent not set forth herein, is incorporated by reference from the Registrant’s definitive Proxy Statement for the Annual Meeting of Shareholders to be held May 8, 2013.
INTERSIL CORPORATION
FORM 10-K
December 28, 2012
|
Item 1. |
3 | |
|
Item 1A. |
8 | |
|
Item 1B. |
14 | |
|
Item 2. |
15 | |
|
Item 3. |
15 | |
|
Item 4. |
15 | |
|
|
|
|
|
|
|
|
|
Item 5. |
15 | |
|
Item 6. |
18 | |
|
Item 7. |
Management’s Discussion and Analysis of Financial Condition and Results of Operations |
19 |
|
Item 7A. |
31 | |
|
Item 8. |
32 | |
|
Item 9. |
Changes in and Disagreements with Accountants on Accounting and Financial Disclosure |
65 |
|
Item 9A. |
65 | |
|
Item 9B. |
66 | |
|
|
|
|
|
|
|
|
|
Item 10. |
66 | |
|
Item 11. |
67 | |
|
Item 12. |
Security Ownership of Certain Beneficial Owners and Management and Related Stockholder Matters |
67 |
|
Item 13. |
Certain Relationships and Related Transactions, and Director Independence |
67 |
|
Item 14. |
67 | |
|
|
|
|
|
|
|
|
|
Item 15. |
68 | |
2
Forward Looking Statements
This Annual Report on Form 10-K contains statements relating to expected future results and business trends of Intersil Corporation (“Intersil,” which may also be referred to as “we,” “us” or “our”) that are based upon our current estimates, expectations, assumptions and projections about our industry, as well as upon certain views and beliefs held by management, that are “forward-looking statements” as defined in the Private Securities Litigation Reform Act of 1995, as amended. Forward-looking statements generally can be identified by words such as “anticipates,” “believes,” “estimates,” “expects,” “intends,” “plans,” “predicts,” “projects,” “will be,” “will continue,” “will likely result,” and similar expressions. In addition, any statements that refer to expectations, projections, or other characterizations of future events or circumstances, including any underlying assumptions, are “forward-looking statements.” These forward-looking statements are based on current expectations and assumptions that are subject to risks and uncertainties, which could cause our actual results to differ materially from those reflected in the forward-looking statements. Factors that might cause or contribute to such differences include, but are not limited to, those discussed in the section entitled “Risk Factors” in Part I, Item 1A of this report. We undertake no obligation to publicly release any revisions to the forward-looking statements or reflect events or circumstances after the date of this document.
Company Overview
We develop, manufacture and market high-performance analog, mixed-signal, and power management integrated circuits (“IC(s)”). We believe our product portfolio addresses some of the largest opportunities within the industrial & infrastructure, consumer and personal computing electronics markets.
Our mission is to provide differentiated, high-performance analog, mixed-signal, and power management ICs that meet our customers’ needs and exceed their expectations. We were formed in August 1999 when we acquired the semiconductor business of Harris Corporation (“Harris”) and began operating as Intersil. Since then, we have expanded our product portfolio through internal product development and through various acquisitions.
Our internet address is www.intersil.com. We post all Securities and Exchange Commission (“SEC”) filings free of charge on our website, including our annual reports on Form 10-K, our quarterly reports on Form 10-Q, our current reports on Form 8-K, the filings of our officers and directors pursuant to Section 16(a) of the Securities Exchange Act of 1934, as amended (the “Exchange Act”), our proxy statements on Schedule 14A related to our annual shareholders’ meeting and any amendments to these reports or statements filed or furnished pursuant to Section 13(a) or 15(d) of the Exchange Act.
We have adopted a Corporate Code of Ethics, which is applicable to our Senior Financial Officers, including our Chief Executive Officer (“CEO”), Chief Financial Officer (“CFO”) and other professionals. A complimentary copy of the Code of Ethics is available on our website. The content on any website referred to in this filing is not incorporated by reference into this filing unless expressly noted otherwise.
The SEC maintains an internet site that contains reports, proxy and information statements, and other information regarding issuers that file electronically with the SEC at www.sec.gov. You may also read and copy any materials filed by us with the SEC at the SEC’s Public Reference Room at 100 F Street, NE, Washington, DC 20549 and may obtain information on the operation of the Public Reference Room by calling the SEC at (202) 551-8090.
3
Business Strategy
Our business strategy emphasizes the following key elements:
|
· |
Focus on our areas of technical strength in markets where we believe we can develop or sustain market leadership. |
|
· |
Participate in Large Vertical Markets. We develop products for the consumer electronics market with the potential for high growth. |
|
· |
Maintain Technology Leadership. We have more than 650 employees engaged in research and development working on innovative products for high-performance analog, mixed-signal, and power management solutions. We continue to expand our strong intellectual property position by seeking to increase our existing portfolio of approximately 1,400 patents. |
|
· |
Maintain Quality Customer Service. Quality customer service is critical to our customer’s satisfaction and retention. |
|
· |
Partner with Leaders in Semiconductor Markets, Products and Services. |
|
o |
Partner with Leaders in our Target Markets. We partner with industry leaders to deliver advanced technology for rapidly emerging applications. Our customer base illustrates the acceptance of our products to date. We continue to partner with these customers and others to develop and market our next generation products. |
|
o |
Utilize Specialty Expertise in Manufacturing Services. We employ high-volume and specialty suppliers of products and services in our industry. We outsource most of our manufacturing requirements. We utilize merchants who specialize in those products and services and deliver them at reasonable cost. This reduces our capital requirements and enhances our flexibility to manage our ever-changing business. |
Products and Technology
Our strategy is to utilize our technical expertise and customer relationships to provide differentiated IC products.
Industrial & Infrastructure
Our products enable multiple functions in thousands of industrial and infrastructure systems. From the most advanced aviation and satellite systems to factory automation equipment and automotive systems, Intersil’s power management, analog and mixed signal ICs provide the electronic building blocks of these systems. Industrial & infrastructure products represented 57.1% of revenue during 2012.
Personal Computing
Our products provide the power management functions for all types of personal computers, including Ultrabooks®, Notebooks and desktops. These functions include power management for the central processing unit (“CPU”), battery charging, display power and other types of power related functions within a personal computer. Personal computing power management products represented 23.2% of revenue during 2012.
Consumer
Our products enable multiple functions for today’s high end consumer electronics, including smart phones, tablets, displays and many other consumer electronic devices. These functions include power management, battery charging, light and proximity sensing and display image quality enhancement functions. Consumer products represented 19.7% of revenue during 2012.
Glossary
Analog integrated circuits—circuits that operate with voltage and current varying in a continuous fashion; in contrast, digital chips only use and create voltages or currents at discrete levels, with no intermediate values. Some examples of analog ICs are operational amplifiers, voltage references, and comparators.
4
Mixed-signal integrated circuits—any IC that has both analog circuits and digital circuits. Examples of mixed-signal ICs include analog-to-digital/digital-to-analog converters, digitally controlled potentiometers, and real time clocks.
Power management circuits—high performance power IC solutions for an electronic device such as a personal computer, satellite, or automotive system.
Vertical markets—focus on specific end-use applications such as smartphones, personal computers and flat-panel televisions. Vertical markets are distinct from horizontal markets in that horizontal markets focus on general purpose IC products that can be used in thousands of applications such as data converters, voltage regulators and many other IC component products.
Geographic Financial Summary
We operate exclusively in the semiconductor industry and primarily the high-performance analog, mixed-signal, and power management sector of that industry. Substantially all revenue results from the sale of semiconductor products. All intercompany revenue and balances have been eliminated. The revenue noted in this section is based on shipping destination.
A summary of the operations by geographic area is below (in millions):
|
|
|
|
|
|
|
|
|
|
|
Year Ended |
||||
|
|
|
December 28, 2012 |
|
December 30, 2011 |
|
December 31, 2010 |
|
United States operations |
|
|
|
|
|
|
|
Revenue |
|
$ 85.4 |
|
$ 102.9 |
|
$ 138.0 |
|
Tangible long-lived assets |
|
54.1 |
|
52.5 |
|
58.2 |
|
International operations |
|
|
|
|
|
|
|
Revenue |
|
$ 522.5 |
|
$ 657.6 |
|
$ 684.4 |
|
Tangible long-lived assets |
|
31.3 |
|
38.5 |
|
45.3 |
We market our products for sale to customers, including distributors, primarily in China, the U.S., South Korea, Taiwan and Japan. A summary of percentage of revenue by country is below and shows countries where values exceeded 10% in any one year presented:
|
|
|
|
|
|
|
|
|
|
|
Year Ended |
||||
|
|
|
December 28, 2012 |
|
December 30, 2011 |
|
December 31, 2010 |
|
Revenue by country |
|
|
|
|
|
|
|
China (includes Hong Kong) |
|
55.4% |
|
54.9% |
|
48.8% |
|
United States |
|
14.0% |
|
13.5% |
|
16.8% |
Revenue from two distributor customers and two contract manufacturers totaled 43.5% of revenue in 2012. Aeco Technology Co., Ltd (“Aeco”), a distributor, represented 12.8% of revenue and 18.3% of accounts receivable for the period ending December 28, 2012. Avnet, Inc (“Avnet”), a distributor, represented 14.9% of revenue and 19.2% of accounts receivable for the period ending December 28, 2012. The loss of any one or more of these customers could result in a materially negative impact on our business.
Revenue from two distributor customers and two contract manufacturers totaled 40.8% of revenue in 2011. Aeco represented 11.4% of revenue and 14.8% of accounts receivable for the period ending December 30, 2011. Avnet represented 11.4% of revenue and 19.1% of accounts receivable for the period ending December 30, 2011. In January 2011, we announced the termination of our distribution relationship with Arrow Electronics, effective April 2011, in order to increase focus within our distribution channel and allow more streamlined customer support. We simultaneously strengthened our relationship with Avnet, which enabled Avnet to integrate our unique product portfolio into its existing design chain services and expand our product offering to their global network of customers.
5
Revenue from three distributor customers and two contract manufacturers totaled 45.2% of revenue in 2010. Aeco represented 11.0% of revenue and 11.9% of accounts receivable for the period ending December 31, 2010.
Sales, Marketing and Distribution
In 2012, we derived approximately 43.7% of our revenue from original equipment manufacturer (“OEM”) customers, original design manufacturer (“ODM”) customers, and contract manufacturers. We derived approximately 56.3% of our revenue through distributors and value-added resellers.
Our sales organization is supported by customer service and logistics organizations throughout the world. Product orders flow to our fabrication facility or to foundries where the semiconductor wafers are made. Most of our semiconductors are assembled and tested at the facilities of independent subcontractors. Finished products are then shipped to customers either indirectly via third-parties or directly via company-managed warehouses.
To serve our customer base, we maintain a highly focused sales team, which focuses on those major accounts that are strategic to our marketing and product strategies. Our direct geographical sales organizations sell products in regions throughout the world. The geographical sales force works closely with a network of distributors and manufacturers’ representatives, creating a worldwide selling network. Dedicated direct sales organizations operate in North American, European, Japanese and Asia/Pacific markets. We strategically locate sales offices near major OEM and ODM customers throughout the world. The technical applications organization is deployed alongside the direct sales force, ensuring both applications and product/customer focus. Our dedicated marketing organization supports field sales and is aligned by specific product group.
Distributors and value-added resellers handle a wide variety of products, including products sold by other companies that compete with our products. Most of our sales to distributors include agreements allowing for market price fluctuations and/or the right to return some unsold products. Some of our distribution agreements contain an industry standard stock rotation provision allowing for minimum levels of inventory returns or scrap. In our experience, these inventory returns can usually be resold.
Research and Development (“R&D”)
We believe that the continued introduction of new products in our target markets is essential to our growth. We incurred costs of $166.9 million, $185.5 million and $183.3 million on R&D projects in 2012, 2011 and 2010, respectively, including equity-based employee compensation. We believe that we must continue to innovate, enhance and expand our products and services to maintain our leadership position, and we intend to achieve this through in-house R&D, licensed technology and selective acquisitions. As of December 28, 2012, we had more than 650 employees engaged in R&D. We introduce hundreds of new products each year over many different product families that serve many different markets.
Manufacturing
Our products utilize silicon wafers containing ICs. Our business is dependent upon reliable fabrication, packaging and testing of these wafers. We fabricate wafers of ICs in our Florida manufacturing facility. We also have wafers of ICs manufactured by leading foundry suppliers such as IBM Microelectronics, Taiwan Semiconductor Manufacturing Company and United Microelectronics Corporation. We believe that our strategy of employing internal and foundry suppliers provides an increased level of flexibility and capacity to meet production demand. During 2012, we internally produced approximately 12% of our wafers and outsourced the remaining 88% to our foundry partners.
Following fabrication, wafers are subject to packaging and testing processes. The majority of these processes are performed by independent subcontractors located in Malaysia, Taiwan, China and Singapore. However, we maintain internal assembly and test capabilities for certain products in Florida and California.
6
In 2012, we did not experience delays in obtaining raw materials. However, our reliance on foundry suppliers for silicon wafers, the building block of our products, is critical and the relative importance of this part of the supply chain continues to increase, increasing our risk of incurring a production-limiting shortfall. As is typical in the industry, we must allow for significant lead times in delivery of certain materials. The production of ICs, from wafer fabrication through packaging and final testing, may take from eight to sixteen weeks. We manufacture thousands of product types and our customers often require delivery within a short period of time following their order. To consistently meet these requirements, we maintain a substantial work-in-process and finished goods inventory. Manufacture, assembly and testing of ICs is a complex process. Normal risks include errors and interruptions in the production process, defects and shortages in raw materials, disruptions at supplier locations, unexpected demand, as well as other risks, all of which can have an unfavorable impact to production costs, gross margins and our ability to meet customer demand.
Backlog
Our product sales are made pursuant to purchase orders that are generally booked up to six months in advance of delivery. Our standard terms and conditions of sale provide that these orders may not be cancelled or rescheduled thirty days prior to the most current customer request date (“CRD”) for standard products and ninety days prior to CRD for semi-custom and custom products. Backlog is influenced by several factors, including end market demand, pricing and customer order patterns in reaction to product lead times. Additionally, we believe backlog can fall faster than consumption rates in periods of weak end market demand since production lead times can be shorter. Conversely, we believe backlog can grow faster than consumption in periods of strong end market demand as production and delivery times increase and some customers may increase orders in excess of their current consumption to reduce their own risk of production disruptions. Our backlog for sales to distributors is valued at list price, which can be substantially higher than the prices ultimately recognized as revenue. Considering these practices and our experience, backlog alone cannot be consistently relied on to predict actual revenue for future periods.
Our six month backlog as of December 28, 2012, was $114.6 million compared to the six-month backlog as of December 30, 2011, of $134.8 million.
Seasonality
The consumer and personal computing markets have historically experienced weaker demand in the first half of the year than in the second half of the year in the semiconductor industry. However, macroeconomic conditions, acquisitions and the cyclical nature of the industry have had a greater impact on quarterly fluctuations in recent years.
Competition
The high-performance analog, mixed-signal, and power management market is extremely competitive. We compete in our target markets with many companies that may have significantly greater financial, technical, manufacturing and marketing resources than us, including but not limited to Texas Instruments, Analog Devices, Linear Technology, ON Semiconductor and Maxim Integrated Products. We compete on the basis of technical performance, product features, customized design, price, availability, quality, reliability, sales and technical support. Our ability to compete successfully depends on elements both within and outside of our control, including successful and timely development of new products and manufacturing processes, product performance and quality, manufacturing yields, product availability, intellectual property protection obtained by us and our competitors, customer service, pricing, industry trends and general economic trends.
Trademarks and Patents
We own rights in trademarks, trade secrets, and patents that are important to our business. Intersil procures trademark rights through registration applications or trademark usage. We use trademarks to identify Intersil products and build brand awareness, including through periodic advertising. We seek to maintain our trade secrets through security measures, policies and the use of confidentiality agreements. We also file patent applications to secure exclusive patent rights to potentially valuable inventions in the United States and in select foreign countries where we believe filing for such protection is appropriate. We may, however, elect, in certain cases, not to seek patent protection for potentially valuable inventions, if we determine other protection, such as maintaining the invention as a trade secret, to be more advantageous. The expiration dates of our patents range from 2013 to 2030. While our patents, trademarks and trade secrets benefit us, we believe that our competitive position and future success is largely determined by other factors including our innovative skills, technical expertise, and management ability; the success of new products being developed by us; and customer support.
7
Employees
Our worldwide workforce consisted of 1,488 employees (full and part-time) as of December 28, 2012. None of our employees are subject to a collective bargaining agreement.
Environmental Matters
We believe that our operations are substantially in compliance with applicable environmental requirements. Our costs and capital expenditures to comply with environmental regulations have been immaterial during the last three years. However, we are subject to numerous federal, state and international environmental laws and regulatory requirements. From time to time, we become involved in investigations or litigations of various potential environmental issues concerning activities at our facilities or former facilities or remediation as a result of past activities (including past activities of companies we have acquired). Further, we may receive notices from the U.S. Environmental Protection Agency or equivalent state or international environmental agencies that we are a potentially responsible party under the Comprehensive Environmental Response, Compensation and Liability Act (commonly known as the “Superfund Act”) and/or equivalent laws. Such notices assert potential liability for cleanup costs at various sites, which may include sites owned by us, sites we previously owned and treatment or disposal sites not owned by us, allegedly containing hazardous substances attributable to us from past operations. While it is not feasible to predict the outcome of many of these proceedings, in the opinion of our management, any payments we may be required to make as a result of such claims in existence will not have a material adverse effect on our financial condition, results of operations or cash flows. To the extent any known contamination was caused prior to August 1999, Intersil is indemnified against any associated environmental liabilities. This indemnification does not expire, nor does it have a maximum amount.
You should carefully consider and evaluate all of the information in this Annual Report on Form 10-K, including the risk factors listed below. The risks described below are not the only ones facing us. Additional risks not now known to us or that we currently deem immaterial may also impair our business operations. If any of these risks occur, our business could be materially harmed. If our business is harmed, the trading price of our Class A common stock could decline.
As discussed in “Forward Looking Statements” in Item 1 above, this Annual Report on Form 10-K contains forward-looking statements that involve risks and uncertainties. Our actual results could differ materially from those anticipated in the forward looking statements, including as a result of the risks described in the cautionary statements in this “Risk Factors” section and elsewhere in this Annual Report on Form 10-K, in our other filings with the SEC, and in material incorporated by reference. We undertake no duty to update or revise any forward-looking statements, whether as a result of new information, future events or otherwise.
Global economic conditions and uncertainty, as well as the highly cyclical nature of the semiconductor industry, could adversely affect our revenue, gross margin and expenses, collectability of accounts receivable and supplier relationships, and our ability to access capital markets.
Our operations and performance depend significantly on worldwide economic conditions, in which significant uncertainty currently exists. This uncertainty poses a risk as consumers and businesses may postpone spending in response to tighter credit, negative financial news and/or declines in income or asset values, which could have a material negative effect on the demand for our products and services.
Political and/or economic conditions outside the United States could change in manners that negatively affect our operations and prospects in those countries.
Our operations in jurisdictions outside the United States are subject to various risks inherent in foreign operations. These risks include, among other risks: i) increases in taxes, tariffs and governmental royalties, ii) changes in laws and policies governing operations of foreign-based companies, iii) loss of revenue, equipment and property as a result of expropriation, acts of terrorism, war, civil unrest, boycotts, trade restrictions and other political risks, iv) unilateral or forced renegotiation, modification or nullification of existing contracts with governmental entities, v) difficulties enforcing our rights against a governmental agency because of the doctrine of sovereign immunity and foreign sovereignty over international operations and vi) currency restrictions and exchange rate fluctuations. Our international operations may also be adversely affected by United States laws and policies affecting foreign trade and taxation. The realization of any of these factors could materially and adversely affect our business, financial condition and results of operations.
8
We may be unsuccessful in developing and selling new products required to maintain or expand our business.
We operate in a dynamic environment characterized by price erosion, rapid technological change, ever increasing complexity, cost and time to develop new products, and design and other technological obsolescence. Our competitiveness and future success depend on our ability to achieve design wins for our products with current and future customers and introduce new or improved products that meet customer needs while achieving favorable margins. A failure to achieve design wins, to introduce these new products in a timely manner or to achieve market acceptance for these products, could harm our business.
The introduction of new products presents significant business challenges because product development commitments and expenditures must be made well in advance of the related revenues. The success of a new product depends on accurate forecasts of long-term market demand, future technological developments and a variety of specific implementation factors, including:
|
· |
timely and efficient completion of process design and development; |
|
· |
timely and efficient implementation of manufacturing and assembly processes; |
|
· |
product performance; |
|
· |
the quality and reliability of the product; and |
|
· |
effective marketing, sales and service. |
The failure of our products to achieve market acceptance due to these or other factors could harm our business.
A downturn in the personal computing end market could cause a reduction in demand for our products and limit our ability to maintain revenue levels and operating results.
A significant portion of our revenue (approximately 23% of fiscal 2012 revenue) is derived from customers participating in the personal computing end market. Any deterioration in this end market or our inability to compete for new solutions within the personal computing end market could lead to a reduction in demand for our products which could adversely affect our revenue and results of operations.
The consumer end market is characterized by rapid product obsolescence and requires that we have the right products at the right time for our customers to fulfill demand for products in the consumer end market. If we are unable to forecast demand for our products, or we don't have products to ship at the right time, our financial condition and results may be adversely affected.
Our revenue from the consumer end market consists primarily of revenue from our products designed and used in a broad range of products including smart phones, flat panel displays, gaming consoles, and other hand held devices and is characterized by rapidly changing market requirements and products. Our success in this market will depend principally on our ability to:
|
· |
meet the market windows for consumer products; |
|
· |
predict technology and market trends; |
|
· |
develop products on a timely basis; and |
|
· |
avoid cancellations or delay of products. |
Any of the foregoing problems could materially and adversely affect our business, financial condition, and results of operations.
We may experience a disruption of our business activities due to the transition to a new Chief Executive Officer.
On December 10, 2012, our Board of Directors announced the appointment of Board of Directors member James Diller as interim President and CEO following the resignation of Dave Bell as President and CEO and a Director of Intersil. We may experience disruption in our business activities as we transition to a new CEO, and our relationships with employees, customers and suppliers could be adversely affected by this transition. Our future success is dependent on our success in selecting and recruiting a new chief executive officer who can make a successful transition into his or her new role and ultimately develop and implement a strategic plan. If our new chief executive officer fails to effectively manage our business, our financial condition, results of operations and reputation could be harmed. Until a new chief executive officer is identified, it may be more difficult for us to hire and retain senior management and other key personnel.
9
We may experience a disruption of our business activities related to the successful execution of our restructuring plans.
We have implemented restructuring plans and may implement future plans as well. In connection with these plans, we have and may further reduce headcount and eliminate certain sites, which will require restructuring charges in the period(s) implemented. The implementation of restructuring plans may be disruptive to our business, which may adversely affect operations and be harmful to our business.
Our business has been and is expected to continue to be characterized by average selling prices (“ASPs”) that decline over relatively short time periods, which can negatively affect our results of operations unless we are able to sell more units, reduce our costs, and introduce new products with higher ASPs or some combination thereof.
ASPs for our products have historically declined over relatively short time periods. For example, in 2012 our ASPs decreased 2% compared with 2011. ASP's in 2011 decreased approximately 5% compared with 2010. Declining sales prices at the product level have been a phenomenon of the semiconductor industry for much of its existence. Fluctuations in ASPs are expected to continue into the future. Although individual products generally experience ASP declines over time, we endeavor to continually introduce new products which typically enter the market at prices higher than existing products. We are unable to predict pricing conditions for any future periods. When our ASPs decline, our revenue and net income decline unless we are able to compensate by selling more units, reduce our costs or introduce new, higher margin products that offer advanced features.
We may not be able to compete successfully in the highly competitive semiconductor industry.
The semiconductor industry is intensely competitive and many of our direct and indirect competitors have substantially greater financial, technological, manufacturing, marketing and sales resources. The current level of competition in the semiconductor market is high and may increase in the future. We currently compete directly with companies that have developed similar products, including Texas Instruments, Inc.; Analog Devices, Inc.; Maxim Integrated Products, Inc.; Linear Technology Corp. and others. We also compete indirectly with numerous semiconductor companies that offer products based on alternative solutions. These direct and indirect competitors are established, multinational semiconductor companies as well as emerging companies. Our ability to compete successfully in the rapidly evolving and increasingly more complex area of IC technology depends on several factors, including:
|
· |
success in designing and manufacturing new products that implement new technologies; |
|
· |
protection of our proprietary products, processes, trade secrets and know-how; |
|
· |
maintaining high product quality and reliability; |
|
· |
pricing policies of our competitors; |
|
· |
performance of competitors’ products; |
|
· |
ability to deliver in large volume on a timely basis; |
|
· |
marketing, manufacturing and distribution capability; and |
|
· |
financial strength. |
To the extent that our products achieve market success, competitors typically seek to offer competitive products or lower prices, which, if successful, could harm our business.
Production time and the cost of our products could increase if we were to lose one of our suppliers or if one of those suppliers increased the prices of raw materials.
Our operating results could be adversely affected if we were unable to obtain adequate supplies of raw materials in a timely manner or if the costs of raw materials increased significantly. Our manufacturing operations depend upon obtaining adequate supplies of raw materials on a timely basis. We purchase raw materials, such as silicon wafers, from a limited number of suppliers on a just-in-time basis. From time to time, suppliers may extend lead times, limit supplies or increase prices due to capacity constraints or other factors.
10
Because we depend on third-party manufacturing suppliers, we may experience delays beyond our control in delivering those products to our customers.
We use both internal wafer fabrication facilities and third-party wafer fabrication suppliers in manufacturing our products. We intend to continue to rely on third-party suppliers and other specialist suppliers for most of our manufacturing requirements. Many of these third-party suppliers are not obligated to supply products to us for any specific period, in any specific quantity or at any specific price. As a result, we cannot directly control semiconductor delivery schedules, which could lead to product shortages, quality assurance problems and increases in the cost of our products. We may experience delays and we cannot be sure that we will be able to obtain semiconductors within the time frames and in the volumes required by us at an affordable cost or at all. Some of our suppliers are located in geographically unstable locations around the world and we may be subject to delays due to earthquakes, tsunamis, tropical storms, floods or other natural disasters. Any disruption in the availability of wafers and other semiconductor materials or any problems associated with the delivery, quality or cost of the fabrication, assembly and testing of our products could significantly hinder our ability to deliver our products to our customers and may result in a decrease in sales of our products. If the third-party suppliers we use are unable to provide our products, we may be required to seek new suppliers and we cannot be certain that their services will be available at favorable terms or that sufficient capacity will be available within a reasonable time period.
In addition, the manufacture of our products is a highly complex and precise process, requiring production in a highly controlled environment. Changes in manufacturing processes or the inadvertent use of defective or contaminated materials by a third-party supplier could adversely affect their ability to achieve acceptable manufacturing yields and product reliability. If our suppliers do not achieve adequate yields or product reliability, our customer relationships could suffer. This could ultimately lead to a loss of sales of our products and have a negative effect on our reputation, business, financial condition and/or results of operations.
Delays in production at new facilities, in implementing new production techniques or in curing problems associated with technical equipment malfunctions may lower yields and reduce our revenues and profitability.
Our manufacturing processes are very complex, require advanced and costly equipment and are continuously modified to improve yields and product performance. Impurities or other difficulties in the manufacturing process can lower yields. Our manufacturing efficiency is an important factor in our future profitability and we may not be able to maintain our manufacturing efficiency or increase manufacturing efficiency to the same extent as our competitors.
We may experience difficulty in beginning production at new facilities or in effecting transitions to new manufacturing processes. Resultant delays can be unpredictable and can result in late product deliveries and reduced yields. We may experience manufacturing problems in achieving acceptable yields or experience product delivery delays in the future as a result of, among other things, capacity constraints, construction delays, upgrading or expanding existing facilities or changing our process technologies, any of which could result in a loss of future revenues. Increases in fixed costs and operating expenses related to increases in production capacity may adversely affect our operating results if revenues do not increase proportionately.
We use a significant amount of intellectual property (“IP”) in our business. If we are unable to protect this IP, we could lose our right to prevent others from using our key technologies, resulting in decreased revenues.
We rely on IP rights to protect our technology. Our rights include, but not are limited to, rights existing under patent, trade secret, trademark, mask work and copyright law. Some of our technology is not covered by any patent or patent application, and there are risks that our patents may be invalidated, circumvented or challenged.
Competitors may develop technologies that are similar or superior to our technology, duplicate our technology or design around our patents. In addition, effective patent, trademark, copyright, mask work and trade secret protection may be unavailable, limited or not applied for in certain foreign countries.
We also seek to protect our proprietary technology, including technology that may not be patented or patentable, in part by confidentiality agreements and, if applicable, inventors’ rights agreements with our collaborators, advisors, employees and consultants. We cannot assure that these agreements will always be undertaken or will not be breached or that we will have adequate remedies for any breach.
Some of our current licenses to use others’ technology and IP are scheduled to expire periodically over the next several years, unless extended. We will need to negotiate renewals of these agreements or obtain the technology and IP from alternative sources. We may not be able to obtain alternative technology and IP, or renewals on substantially similar terms as those that currently exist or at all.
The failure to protect our IP, to extend its existing license agreements or utilize alternative technology could adversely affect our revenues.
11
Products we manufacture and sell, or products formerly produced and sold by us and now manufactured and sold by purchasers of business that we have divested, may infringe other parties’ IP rights. We may have to pay others for infringement and misappropriation of their IP rights, suspend the manufacture, use or sale of some affected products, or incur the cost of defending in litigation, resulting in significant expense to us.
The semiconductor industry is characterized by vigorous protection and pursuit of IP rights. We have received, and may receive in the future, notices of claims of infringement and misappropriation of other parties’ proprietary rights. In the event of an adverse decision in a patent, trademark, copyright, mask work or trade secret action, we could be required to withdraw the product or products found to be infringing from the market or redesign products offered for sale or under development. We have, at times, assumed indemnification obligations in favor of our customers that could be triggered upon an allegation or finding of our infringement of other parties’ proprietary rights. We have also, at times, assumed indemnification obligations in favor of the purchasers of businesses that we have divested that could be triggered upon an allegation or finding of infringement of other parties’ proprietary rights by those purchasers.
These indemnification obligations would be triggered for reasons including the sale or supply of a product that was later discovered to infringe another party’s proprietary rights. Whether or not these infringement claims are successfully asserted, we would likely incur significant costs and diversion of our resources with respect to the defense of these claims. To address any potential claims or actions asserted against us or those we have indemnified, we may seek to obtain a license under a third-party’s IP rights. However, in such an instance, a license may not be available on commercially reasonable terms, if at all. Litigation could result in significant expense to us, adversely affecting sales of the challenged product or technology and diverting the efforts of our technical and management personnel, whether or not the litigation is determined in our favor. In the event of an adverse outcome in any litigation, we may be required to:
|
· |
pay substantial damages, which may include enhanced damages for willful infringement, and incur significant attorneys’ fees; |
|
· |
indemnify customers for damages they might suffer if the products they purchase from us infringe IP rights of others; |
|
· |
indemnify purchasers of businesses that we have divested for damages they might suffer if certain of the products they sell infringe IP rights of others; |
|
· |
stop our manufacture, use, sale or importation of infringing products; |
|
· |
expend significant resources to develop or acquire non-infringing technology; |
|
· |
discontinue the use of some processes; or |
|
· |
obtain licenses to IP rights covering products and technology that may, or may have been found to, infringe or misappropriate such IP rights. |
If our products contain defects or fail to achieve industry reliability standards, our reputation may be harmed, and we may incur significant unexpected expenses and lose sales opportunities. Our insurance coverage for such events may be insufficient.
Our products may contain undetected errors or defects that may:
|
· |
cause delays in product introductions and shipments; |
|
· |
result in increased costs and diversion of development resources; |
|
· |
cause us to incur increased charges due to obsolete or unusable inventory; |
|
· |
require design modifications; or |
|
· |
decrease market acceptance or customer satisfaction with these products, resulting in product returns, recalls and lost sales. |
In addition, we may not find defects or failures timely, which may result in loss or delay in market acceptance and could significantly harm our operating results. Our current or potential customers also might seek to recover from us any losses resulting from defects or failures in our products. Further, such claims might be significantly higher than the revenues and profits we receive from the products involved, as we are usually a component supplier with limited value content relative to the value of a complete system or sub-system. Liability claims could require us to spend significant time and money in litigation or to pay significant damages for which we may have insufficient insurance coverage. Any of these claims, whether or not successful, could seriously damage our reputation and business.
12
Our financial results may be adversely impacted by higher than expected tax rates, exposure to additional income tax liabilities and the adoption of new accounting pronouncements regarding income tax accounting.
As a global company, our effective tax rate is highly dependent upon the geographic composition of worldwide earnings and tax regulations. We are subject to income taxes in the United States and many foreign jurisdictions and significant judgment is required to determine worldwide tax liabilities. Our effective tax rate, as well as our actual taxes payable, could be adversely affected by changes in the mix of earnings between countries with differing tax rates, the valuation of tax assets, tax credits, unrecognized tax benefits, the lack of sufficient excess tax benefits (credits) in our hypothetical pool of additional paid in capital in situations where our realized tax deductions for certain stock-based compensation awards are less than those originally anticipated, applicable tax laws or material audit assessments, which could affect our profitability. In particular, the carrying value of deferred tax assets, which are predominantly in the United States, is dependent on our ability to generate future taxable income in the United States. In addition, the amount of income taxes we pay is subject to ongoing audits in various jurisdictions and a material assessment by a governing tax authority could affect our profitability. We currently have a tax holiday in Malaysia resulting in a tax rate of 0%. This tax holiday began on July 1, 2009 and terminates on July 1, 2019. Our Malaysian tax holiday is subject to our compliance with certain conditions. Applicable guidance requires us to record our tax expense based on various estimates of probabilities of sustaining certain tax positions. As a result of this and other factors, our tax expense could be volatile, which could have a material adverse effect on our future results.
Our future success depends on international sales and the management of global operations.
Non-U.S. sales accounted for approximately 85% of our revenue in 2012. We expect that international sales will continue to account for a significant majority of our total revenue in future years. We are subject to various challenges related to the management of global operations, and international sales are subject to risks including, but not limited to:
|
· |
trade balance issues; |
|
· |
economic and political conditions; |
|
· |
changes in currency controls; |
|
· |
differences in our ability to acquire and enforce our IP and contract rights in varying jurisdictions; and |
|
· |
the need for technical support resources in different locations. |
Many of the challenges noted above are applicable in China, which is a large and fast growing market for semiconductors and therefore an area of additional and continued growth for our business. As the business volume between China and the rest of the world grows, there is inherent risk, based on the complex relationships between China, Taiwan, Japan, and the United States, that political and diplomatic influences might lead to trade disruptions which would adversely affect our business with China and/or Taiwan and perhaps the entire Asia/Pacific region. A significant trade disruption in these areas could have a material, adverse impact on our future revenue and profits.
We are subject to export restrictions and laws affecting trade and investments.
We are subject to U.S. laws and regulations that limit and restrict the export of some of our products. Compliance with these laws has limited our sales of restricted products in the recent past and could limit them in the future. We maintain an export compliance program but there are risks that the compliance controls could be circumvented, exposing us to legal liabilities. We must also comply with export restrictions and laws imposed by other countries affecting trade and investments.
Most of our distributors and resellers, can terminate their contract with us with little or no notice. The termination by a distributor could result in a materially negative impact on our business, including revenue and accounts receivable.
In 2012, our distributors accounted for approximately 56% of our revenue. Our distributors can terminate their agreement with us with minimal notice. Two distributors each accounted for greater than 10% of our revenue in 2012. The termination of a significant distributor or reseller could impact our revenue and limit our access to certain end-customers. It could also result in the return of excess inventory. Since many distributors simply resell our products, they generally operate on low profit margins. If a distributor or reseller were to terminate their agreement or go out of business, our accounts receivable from them could be subject to collection risk. We consolidated our primary broad line distributors in April 2011 resulting in the termination of Arrow Electronics and increasing our reliance on Avnet, Inc. in order to increase focus within our distribution channel and allow more streamlined customer support.
13
Our distribution channels recently have experienced consolidation due to merger and acquisition activity in that business sector. Consolidation may result in our distributors allocating fewer resources to the distribution and sale of our products, which could adversely affect our financial results. At times, our sales are concentrated in a small number of distributors, which are in various international locations and of various financial strengths. Financial difficulties, inability to access capital markets, or other reasons may affect our distributors' performance, which could materially harm our business and our operating results.
Restrictions in our revolving credit facility may limit our activities.
Our current credit facility may impose restrictions that limit our ability to engage in certain activities including our ability to enter into certain transactions, make investments or other specified restricted payments, pay certain dividends or repurchase our capital stock, create certain liens on our assets and incur certain subsidiary indebtedness. Our credit facility requires us to maintain compliance with specified financial ratios. These covenants could restrict our ability to finance future operations or capital needs, respond to changing business and economic conditions or engage in other transactions or business activities that may be important to our growth strategy or otherwise important to us. Our ability to comply with these financial restrictions and covenants is dependent on our future performance, which is subject to prevailing economic conditions and other factors, including factors that are beyond our control such as foreign exchange rates, interest rates, changes in technology and changes in the level of competition. If we breach any of the covenants under our credit facility or the indenture governing our outstanding notes and do not obtain appropriate waivers, then, subject to applicable cure periods, our outstanding indebtedness could be declared immediately due and payable. In addition, the lenders under our credit facility could institute foreclosure proceedings against the U.S. assets used to secure the borrowing under such facility.
We are subject to litigation risks.
From time to time, we are subject to legal claims and are involved in a variety of routine legal matters that arise in the normal course of business. We believe it is unlikely that the final outcome of these legal claims will have a material adverse effect on our consolidated financial position or results of operation. However, claims, the claims process, and litigation are inherently uncertain and unpredictable. An unfavorable resolution of any particular legal claim or proceeding could have a material adverse effect on our consolidated financial position or results of operations.
Environmental liabilities and other governmental regulatory matters could force us to expend significant capital and incur substantial costs.
We are subject to various environmental laws relating to the management, disposal and remediation of hazardous materials and the discharge of pollutants into the environment. We are also subject to laws relating to workplace safety and worker health which, among other things, regulate employee exposure to hazardous substances. Harris has agreed to indemnify us for all environmental liabilities related to events or activities occurring before our acquisition of their semiconductor business. This indemnification does not expire, nor is it subject to a dollar limitation.
Based on our experience, we believe that the future cost of compliance with existing environmental and health and safety laws (and liability for known environmental conditions) even without the indemnification from Harris will not have a material adverse effect on our business, financial condition or results of operations. However, we cannot predict:
|
· |
what environmental or health and safety legislation or regulations will be enacted in the future; |
|
· |
how existing or future laws or regulations will be enforced, administered or interpreted; |
|
· |
the amount of future expenditures which may be required to comply with these environmental or health and safety laws or to respond to future cleanup matters or other environmental claims; or |
|
· |
the extent of our obligations to the purchasers of our environmentally challenged sites. |
Item 1B. Unresolved Staff Comments.
None.
14
Item 2. Properties.
In the United States, we lease approximately 166,000 square feet for our corporate headquarters in Milpitas, California, which also includes facilities for sales, design and testing functions. Additional manufacturing, warehouse and office facilities are housed in approximately 529,000 square feet of owned facilities on approximately 118 acres of land in Palm Bay, Florida. Additionally, we conduct engineering activity and maintain regional sales offices aggregating approximately 285,000 square feet in various locations throughout the world including the United States, Asia and Europe. Except for our Florida facilities, which we own, all of our offices are leased and lease periods vary but all expire by 2021.
We believe that our current facilities are suitable and adequate for our present purposes, and that the productive capacity in our facilities is being substantially utilized.
Texas Advanced Optoelectronic Solutions, Inc. (“TAOS”) named Intersil as a defendant in a lawsuit filed on November 25, 2008 in the United States District Court for the Eastern District of Texas. In this action, TAOS alleges patent infringement, breach of contract, trade secret misappropriation, and tortuous interference with a business relationship pertaining to optical sensors, seeking damages and injunctive relief. We dispute TAOS’ claims and are defending ourselves vigorously. The parties are waiting for the court to evaluate the claims in TAOS’ patent(s), after which a claim construction opinion will be issued by the court.
Item 4. Mine Safety Disclosures.
Not applicable.
Item 5. Market for Registrant’s Common Equity, Related Stockholder Matters and Issuer Purchases of Equity Securities.
(a) Market Information
Our Class A Common Stock has been traded on the NASDAQ Stock Market since February 2000 under the symbol ISIL. We currently have the Global Select Market listing status on the NASDAQ Stock Market. Prior to February 2000, there was no public market for our common stock. The following table sets forth, for the periods indicated, the high and low closing prices per share of our Class A Common Stock as reported in NASDAQ Stock Market trading.
|
Quarter: |
|
High |
|
Low |
|
First quarter of 2011 (from January 1, 2011 to April 1, 2011) |
|
$ 15.40 |
|
$ 11.35 |
|
Second quarter of 2011 (from April 2, 2011 to July 1, 2011) |
|
15.34 |
|
12.12 |
|
Third quarter of 2011 (from July 2, 2011 to September 30, 2011) |
|
13.03 |
|
10.09 |
|
Fourth quarter of 2011 (from October 1, 2011 to December 30, 2011) |
|
12.73 |
|
9.82 |
|
First quarter of 2012 (from December 31, 2011 to March 30, 2012) |
|
11.78 |
|
10.04 |
|
Second quarter of 2012 (from March 31, 2012 to June 29, 2012) |
|
11.22 |
|
10.10 |
|
Third quarter of 2012 (from June 30, 2012 to September 28, 2012) |
|
10.74 |
|
8.74 |
|
Fourth quarter of 2012 (from September 29, 2012 to December 28, 2012) |
|
8.55 |
|
6.53 |
(b) Holders
On February 15, 2013, the last reported sale price for our Class A Common Stock was $8.74 per share. As of the same date, there were 311 record holders of our Class A Common Stock.
15
(c) Dividends
In 2012 and 2011, we declared and paid quarterly dividends totaling $0.48 per share annually. The first quarter dividend in 2013 has been declared by our Board of Directors at $0.12 per share, to be paid February 22, 2013 which if annualized equates to $0.48 per share.
Our dividend policy is impacted by, among other items, our views on potential future capital requirements relating to R&D, creation and expansion of sales distribution channels, investments and acquisitions, share dilution, our stock repurchase program, legal risks, liquidity and profitability. The terms of our revolving credit facility also restrict us from paying excessive dividends and making excessive investments in capital expenditures during the term of the revolving credit facility. Determination to declare and pay a dividend will be made in a timely manner by our Board of Directors in light of these and other factors the Board of Directors deems relevant.
(d) Equity compensation plan information
The table and notes below summarize the status of our equity compensation plans under which we issue stock options (“Options”) and restricted and deferred stock awards (“Awards”) (shares in thousands):
|
Plan Category |
|
Number of securities to be issued upon exercise of outstanding Options and Awards |
|
Weighted-average exercise price of outstanding Options |
|
Number of securities remaining available for future issuance under equity compensation plans |
|
Equity compensation plans approved by shareholders: |
|
|
|
|
|
|
|
Xicor 1998 and 2002 Equity Incentive Plans(1) |
|
131 |
|
$ 14.91 |
|
None |
|
Techwell 2006 Stock Incentive Plan (1)(2) |
|
55 |
|
12.56 |
|
None |
|
Intersil 1999 Equity Compensation Plan(3) |
|
2,200 |
|
25.48 |
|
None |
|
Intersil 2009 Option Exchange Plan |
|
1,400 |
|
13.08 |
|
None |
|
Intersil 2008 Equity Compensation Plan(4) |
|
11,527 |
|
12.45 |
|
11,497 |
|
Intersil Employee Stock Purchase Plan(5) |
|
6,533 |
|
N/A |
|
1,696 |
|
Equity compensation plans not approved by shareholders(6) |
|
- |
|
N/A |
|
None |
|
Total(7) |
|
21,846 |
|
$ 14.90 |
|
13,193 |
16
|
1) |
Each of these plans in these totals has been acquired by a purchase method accounting acquisition made by Intersil. At the time of the respective acquisitions Intersil ceased making grants, and will not make any additional grants, under these plans. Future grants are expected to be made under the 2008 Equity Compensation Plan. |
|
2) |
The number of securities for the Techwell 2006 Stock Incentive Plan includes 50 shares that are deferred or restricted stock units outstanding. The weighted-average exercise price displayed is only for 5 stock options. |
|
3) |
The number of securities for the Intersil 1999 Equity Compensation Plan includes 44 shares that are deferred or restricted stock units outstanding. The weighted-average exercise price displayed is only for 2,156 stock options. |
|
4) |
The number of securities for the Intersil 2008 Equity Compensation Plan includes 3,273 shares that are deferred or restricted stock units outstanding. The weighted-average exercise price displayed is only for 8,254 stock options. Grants of deferred or restricted stock units reduce the shares available for future grants by 2.33 shares each or 12,246 shares in 2011. |
|
5) |
The Employee Stock Purchase Plan (“ESPP”) does not employ a “look-back” option feature; therefore there are no options or right to purchase outstanding stock until the final day of the subscription period (which is then settled immediately). |
|
6) |
There are no equity compensation plans that have not been approved by shareholders. |
|
7) |
The number of securities for the total of the plans includes 3,367 shares that are deferred or restricted stock units outstanding. The weighted-average exercise price displayed is only for 11,946 stock options. |
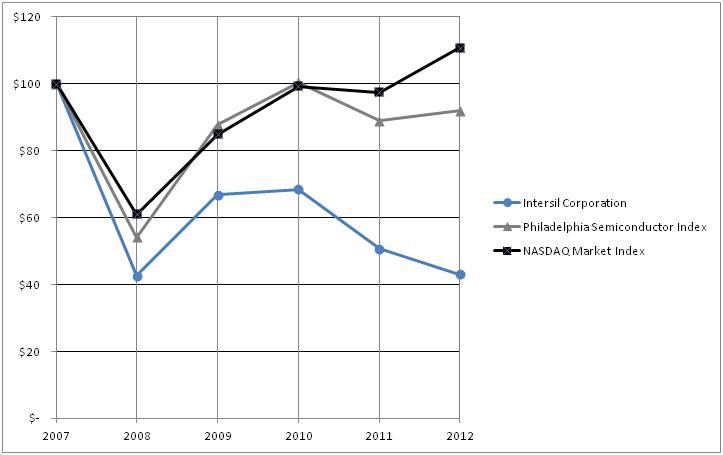
(e) Performance Graph
The following graph presents a comparison of the cumulative total shareholder return, assuming dividend reinvestment, on our stock with the cumulative total return of the NASDAQ Market Index and the Philadelphia Semiconductor Index for the period of five years commencing December 28, 2007 and ending December 28, 2012. The graph assumes that $100 was invested on December 28, 2007 in each of Intersil common stock, the NASDAQ Market Index, and the Philadelphia Semiconductor Index, and that all dividends were reinvested.
17
(f) Recent Sales of Unregistered Securities
We did not sell unregistered securities during 2012.
(g) Issuer Purchases of Equity Securities
We repurchased the following shares in our fourth quarter ended December 28, 2012.
|
Period |
|
Total number of shares purchased |
|
Average price paid per share |
|
Total number of shares purchased as part of publicly announced plan |
|
Maximum dollar value that may yet be purchased under the plan (in millions)(1) |
|
|
|
|
|
|
|
|
|
|
|
September 29 to October 26, 2012 |
|
1,020,677 |
|
$ 7.27 |
|
1,020,677 |
|
$ 36.18 |
|
October 27 to November 23, 2012 |
|
189,614 |
|
7.60 |
|
189,614 |
|
34.74 |
|
November 24 to December 28, 2012 |
|
- |
|
- |
|
- |
|
- |
|
|
|
|
|
|
|
|
|
|
|
Total |
|
1,210,291 |
|
$ 7.32 |
|
1,210,291 |
|
$ 34.74 |
|
(1) |
A description of the maximum number of shares of common stock that may be purchased under the stock repurchase program is set forth in the Notes to our consolidated financial statements contained in this Annual Report on Form 10-K. |
Item 6. Selected Financial Data.
The following table sets forth our selected financial data. The historical financial data for each year in the five year period ended December 28, 2012 is derived from our audited consolidated financial statements. 2008 is a 53 week year.All other periods presented are fiscal years and include 52 weeks, including 2012. Additional information regarding 2008 and 2009 can be found in our 2008 and 2009 annual reports on form 10-K filed with the SEC. This information should be read in conjunction with the consolidated financial statements included elsewhere in this report and “Management’s Discussion and Analysis of Financial Condition and Results of Operations.”
|
|
|
2012 |
|
2011 |
|
2010 |
|
2009 |
|
2008 |
|
|
|
(c)(e)(f) |
|
(b)(c)(d)(e) |
|
(b)(c) |
|
(b)(e) |
|
(a)(b)(e) |
|
|
|
|
|
|
|
|
|
|
|
|
|
|
|
($ in millions, except per share amounts) |
||||||||
|
Revenue |
|
$ 607.9 |
|
$ 760.5 |
|
$ 822.4 |
|
$ 611.4 |
|
$ 769.7 |
|
Net (loss) income |
|
(37.6) |
|
67.2 |
|
26.4 |
|
38.6 |
|
(1,062.5) |
|
Basic (loss) earnings per share |
|
(0.30) |
|
0.53 |
|
0.21 |
|
0.32 |
|
(8.59) |
|
Diluted (loss) earnings per share |
|
(0.30) |
|
0.53 |
|
0.21 |
|
0.32 |
|
(8.39) |
|
Total assets |
|
1,227.8 |
|
1,569.2 |
|
1,672.5 |
|
1,165.8 |
|
1,133.6 |
|
Dividends per common share |
|
0.48 |
|
0.48 |
|
0.48 |
|
0.48 |
|
0.48 |
18
The following transactions affect the comparability of the results between the periods above:
|
a) |
During 2008, we recorded a charge related to the impairment of goodwill of $1,154.7 million. |
|
b) |
During 2008, 2009, 2010 and 2011, we recorded impairment charges and losses on investments in auction rate securities of $31.8 million, $14.3 million, $1.2 million and $6.5 million, respectively. |
|
c) |
During 2010, 2011 and 2012, we recorded discrete income tax charges (credits) of $68.8 million, $(20.6) million and $16.8 million, respectively, which are due primarily to a provision established upon the completion of field work of multi-year Internal Revenue Service (“IRS”) examinations. |
|
d) |
During 2011, we recorded costs related to loss on debt extinguishment charge of $8.4 million. |
|
e) |
During 2008, 2009, 2011 and 2012 we recorded restructuring charges of $8.7 million, $2.1 million, $4.1 million, and $10.5 million, respectively. |
|
f) |
During 2012, we recorded income net of expenses from IP agreements of $14.4 million and losses related to settlement of our interest rate swaps of $5.8 million. |
Item 7. Management’s Discussion and Analysis of Financial Condition and Results of Operations.
You should read the following discussion in conjunction with our accompanying consolidated financial statements, including the related notes. This discussion generally refers to elements within our accompanying consolidated financial statements on a pre-tax basis unless otherwise stated. Except for historical information, the discussions in this section contain forward-looking statements that involve risks and uncertainties. Actual results could differ materially from those discussed below. For further information regarding risks and uncertainties, see Item 1A. “Risk Factors” in this Annual Report on Form 10-K.
Overview
We focus our efforts on the high-performance analog, mixed-signal and power management markets of the semiconductor industry. Digital and analog semiconductor components are the basic ingredient in today’s electronic devices. In contrast to the binary nature of digital components, analog components monitor, evaluate and modify electrical signals and strengths allowing them to deal with basic and essential properties such as heat, touch, light and sound. The high-performance analog, mixed-signal, and power management markets are distinguished by its highly differentiated and technologically advanced products which can be building blocks for more complex circuits or highly integrated for specific applications.
We utilize a 52/53 week fiscal year, ending on the nearest Friday to December 31. The next 53 week fiscal year will occur in 2013 with an extra week to be reported in our second quarter. All years presented are fiscal years and contain 52 weeks. Quarterly or annual periods vary from exact calendar quarters or years.
19
Statement of Operations ($ in millions and % of revenue):
|
|
|
|
|
|
|
|
|
|
|
|
|
|
|
|
|
|
2012 |
|
|
2011 |
|
|
2010 |
|
||||||
|
Revenue |
$ 607.9 |
|
100.0 |
% |
|
$ 760.5 |
|
100.0 |
% |
|
$ 822.4 |
|
100.0 |
% |
|
Cost of revenue |
277.7 |
|
45.7 |
|
|
323.2 |
|
42.5 |
|
|
344.1 |
|
41.8 |
|
|
Gross profit |
330.2 |
|
54.3 |
|
|
437.3 |
|
57.5 |
|
|
478.3 |
|
58.2 |
|
|
Operating costs and expenses: |
|
|
|
|
|
|
|
|
|
|
|
|
|
|
|
Research and development |
166.9 |
|
27.5 |
|
|
185.5 |
|
24.4 |
|
|
183.3 |
|
22.3 |
|
|
Selling, general and administrative |
134.3 |
|
22.1 |
|
|
140.0 |
|
18.4 |
|
|
137.5 |
|
16.7 |
|
|
Amortization of purchased intangibles |
29.2 |
|
4.8 |
|
|
26.8 |
|
3.5 |
|
|
27.7 |
|
3.4 |
|
|
Income from IP agreements |
(14.4) |
|
(2.4) |
|
|
- |
|
- |
|
|
- |
|
- |
|
|
Restructuring and related costs |
10.5 |
|
1.7 |
|
|
4.1 |
|
0.5 |
|
|
- |
|
- |
|
|
Acquisition-related costs |
- |
|
- |
|
|
0.3 |
|
0.1 |
|
|
8.0 |
|
1.0 |
|
|
Operating income |
3.7 |
|
0.6 |
|
|
80.7 |
|
10.6 |
|
|
121.8 |
|
14.8 |
|
|
Interest income |
0.5 |
|
0.1 |
|
|
2.7 |
|
0.4 |
|
|
3.1 |
|
0.4 |
|
|
Interest expense and fees |
(12.8) |
|
(2.1) |
|
|
(14.5) |
|
(1.9) |
|
|
(12.9) |
|
(1.6) |
|
|
Loss on extinguishment of debt |
- |
|
- |
|
|
(8.4) |
|
(1.1) |
|
|
- |
|
- |
|
|
Gain (loss) on deferred compensation investments, net |
0.9 |
|
0.1 |
|
|
(0.5) |
|
(0.1) |
|
|
0.9 |
|
0.1 |
|
|
Loss on sale of investments |
- |
|
- |
|
|
(6.5) |
|
(0.9) |
|
|
(0.1) |
|
(0.0) |
|
|
Other-than-temporary impairment losses |
- |
|
- |
|
|
- |
|
- |
|
|
(1.1) |
|
(0.1) |
|
|
(Loss) income before income taxes |
(7.7) |
|
(1.3) |
|
|
53.4 |
|
7.0 |
|
|
111.8 |
|
13.6 |
|
|
Income tax expense (benefit) |
30.0 |
|
4.9 |
|
|
(13.7) |
|
(1.8) |
|
|
85.4 |
|
10.4 |
|
|
Net (loss) income |
$ (37.6) |
|
(6.2) |
% |
|
$ 67.2 |
|
8.8 |
% |
|
$ 26.4 |
|
3.2 |
% |
Note: Totals and percentages may not add or calculate precisely due to rounding.
We have modified end market data below in the years ended December 30, 2011 and December 31, 2010 to conform to the presentation in the year ended December 28, 2012, which we believe better reflects the different characteristics of our end markets.
Geographical revenue ($ in millions and % of revenue):
|
|
|
|
|
|
|
|
|
|
|
|
|
|
|
|
|
|
2012 |
|
|
2011 |
|
|
2010 |
|
||||||
|
Asia/Pacific |
$ 474.4 |
|
78.0 |
% |
|
$ 591.4 |
|
77.8 |
% |
|
$ 607.2 |
|
73.8 |
% |
|
North America |
90.4 |
|
14.9 |
|
|
111.0 |
|
14.6 |
|
|
143.5 |
|
17.5 |
|
|
Europe and other |
43.1 |
|
7.1 |
|
|
58.1 |
|
7.6 |
|
|
71.7 |
|
8.7 |
|
|
Total |
$ 607.9 |
|
100.0 |
% |
|
$ 760.5 |
|
100.0 |
% |
|
$ 822.4 |
|
100.0 |
% |
Revenue, Cost of Revenue and Gross Margin
Revenue
Our revenue for 2012 was $607.9 million, a decrease of $152.6 million or 20.1% from 2011. The 2012 revenue decrease was due to broad-based declines across all end markets. Revenue in the industrial & infrastructure market decreased 14% from 2011 levels, revenue in the personal computing market decreased 26% and revenue in the consumer market decreased 28% from 2011 levels.
Our revenue for 2011 was $760.5 million, a decrease of $61.9 million or 7.5% from 2010. The 2011 revenue decrease was primarily due to a decrease in revenue to the industrial & infrastructure end market and the consumer end markets, partially offset by increased revenue to the personal computing end market. Revenue to industrial and infrastructure decreased 13% from 2010 levels, while revenue to the consumer markets decreased 8% from 2010 levels. Revenue to the personal computing end market increased 6%, primarily due to strength in the notebook market.
20
Revenue by end market ($ in millions and % of revenue):
|
|
|
|
|
|
|
|
|
|
|
|
|
|
|
|
|
|
2012 |
|
|
2011 |
|
|
2010 |
|
||||||
|
Industrial & infrastructure |
$ 346.8 |
|
57.1 |
% |
|
$ 402.4 |
|
52.9 |
% |
|
$ 460.2 |
|
56.0 |
% |
|
Personal computing |
141.4 |
|
23.2 |
|
|
191.5 |
|
25.2 |
|
|
180.2 |
|
21.9 |
|
|
Consumer |
119.7 |
|
19.7 |
|
|
166.6 |
|
21.9 |
|
|
182.0 |
|
22.1 |
|
|
Total |
$ 607.9 |
|
100.0 |
% |
|
$ 760.5 |
|
100.0 |
% |
|
$ 822.4 |
|
100.0 |
% |
In aggregate, lower overall unit demand in 2012 decreased revenue by approximately $138.3 million from 2011 levels and a decrease in ASPs for the related product mix decreased revenue from 2011 levels by approximately $14.3 million. Of this revenue decrease approximately $117.0 million came from our sales to customers in the Asia/Pacific region, $20.6 million came from sales to customers in North America and $15.0 million came from sales to customers in Europe and other countries.
In aggregate, lower overall unit demand in 2011 decreased revenue by approximately $18.4 million from 2010 levels and a decrease in ASPs decreased revenue from 2010 levels by approximately $43.5 million. Of this revenue decline approximately $15.9 million came from our sales to customers in the Asia/Pacific region, $32.5 million came from sales to customers in North America and $13.5 million came from sales to customers in Europe and other countries.
We anticipate that our revenue from Asia/Pacific region customers will continue to grow in percentage terms as that region leads in the manufacture of the finished goods in which our products are used. End market demand for those products is global, and therefore dependent on aggregate global macroeconomic conditions such as government budget and debt crises, personal incomes and business activity and not necessarily on Asian and Pacific Rim regional economic factors.
Cost of Revenue and Gross Margin
Cost of revenue consists primarily of purchased materials and services, labor, overhead and depreciation associated with manufacturing pertaining to products sold.
Our gross margin decreased by 320 basis points in 2012 from 2011. The decrease was primarily due to product sales mix changes at the product family level along with lower production volume when compared to fixed overhead costs charged to cost of revenue.
Our gross margin decreased by 70 basis points in 2011 from 2010. The decrease was primarily due to product sales mix changes at the product family level.
Generally, our personal computing and consumer products have lower gross margins than our industrial and infrastructure products. We strive to improve gross margins from their present levels by introducing new high-margin products and cost saving opportunities in our manufacturing chain; however, recent declines in production volume has affected per unit cost, exerting downward pressure on margins.
Operating Costs and Expenses
Research and Development
R&D expenses consist primarily of salaries and expenses of employees engaged in product/process research, design and development activities, as well as related subcontracting activities, masks, design automation software, engineering wafers, and technology license agreement expenses.
Our R&D expenses decreased by 10.0% or $18.6 million to $166.9 million in 2012 compared to $185.5 million for 2011. During the last two quarters of 2011 and throughout 2012, we implemented substantial cost saving initiatives to optimize and integrate acquired companies and to reduce R&D spending. We realigned our resources to focus on our primary future growth drivers while continuing to invest in products aimed at the broad industrial market.
21
Our R&D expenses increased by 1.2% or $2.1 million to $185.5 million in 2011 compared to $183.3 million for 2010. While we continue to invest in R&D to pursue future growth, we implemented cost saving initiatives in the third and fourth quarters of 2011 to optimize and integrate acquired companies and to maintain R&D spending at approximately 2010 levels.
We believe that a continued commitment to R&D is essential to maintain product leadership and provide innovative new product offerings, and therefore we expect to continue to make significant future investments in R&D. As we continue to move to more advanced process technologies, our mask and engineering wafer costs are becoming more complex and expensive, and will therefore increasingly represent a greater proportion of total R&D expenses.
Selling, General and Administrative (“SG&A”)
SG&A expenses consist primarily of salaries and expenses of employees engaged in selling and marketing our products as well as the salaries and expenses required to perform our human resources, finance, legal, executive and other administrative functions.
Our SG&A expenses decreased by 4.1% or $5.7 million to $134.3 million in 2012 compared to $140.0 million for 2011. The decrease in 2012 was primarily due to lower labor costs.
Our SG&A expenses increased by 1.9% or $2.6 million to $140.0 million in 2011 compared to $137.5 million for 2010. The increase in 2011 was primarily driven by higher labor costs and supplies from additional employees gained in acquisitions during 2010 and increased sales related incentives during the first quarter of 2011.
Amortization of Purchased Intangibles
Our amortization of purchased intangibles was $29.2 million in 2012, $26.8 million in 2011 and $27.7 million in 2010. The increase in 2012 was primarily due to additional amortization on in-process R&D projects acquired from Techwell, Inc. (“Techwell”) and completed during the first quarter of 2012. The decrease in 2011 from 2010 levels was due to intangibles that became fully amortized during 2011. Our purchased intangibles, which are definite-lived assets, are amortized over their useful lives ranging from 3 to 11 years.
Income from IP Agreements
Income from IP agreements was $14.4 million, net of costs, and relate to a $13.4 million settlement of a trade secret misappropriation and patent infringement dispute with another semiconductor company and a $1.0 million sale of several patents.
Restructuring and Related Costs
Our restructuring and related costs were $10.5 million in 2012 and $4.1 million in 2011. The 2012 and 2011 restructuring charges consisted primarily of severance costs and were part of our ongoing efforts to optimize operations and conclude the integrations of acquired companies.
Acquisition-related Costs
Our acquisition-related costs were $0.3 million in 2011 and $8.0 million in 2010. Acquisition-related costs relate to the acquisition of Techwell in the second quarter of 2010.
Other Income and Expenses
Interest Income
Our interest income decreased to $0.5 million in 2012 compared to $2.7 million in 2011 and $3.1 million in 2010. Interest income decreased in 2012 and 2011 due to decreased average cash and investment balances and continued low interest rates. During the fourth quarter of 2011, we sold our remaining auction rate securities.
22
Interest Expense and Fees
Our interest expense and fees decreased to $12.8 million in 2012 compared to $14.5 million in 2011 and $12.9 million in 2010. Included in 2012 interest expense is approximately $5.8 million reclassification of losses on settlement of our interest rate swaps, previously recorded as unrealized loss in other comprehensive income. Excluding these losses, interest expense and fees in 2012 decreased from 2011 levels due to lower long-term debt balances. The increase from 2010 levels was due to interest and fees on the long-term debt agreement entered into during 2010 to facilitate the acquisition of Techwell.
Loss on Extinguishment of Debt
During the year ended December 30, 2011, we extinguished the remaining portion of our $300.0 million six-year term loan facility and wrote-off $8.4 million in unamortized loan fees.
Gain (Loss) on Deferred Compensation Investments
We have a liability for a non-qualified deferred compensation plan. We maintain a portfolio of approximately $11.1 million in mutual fund investments and corporate owned life insurance under the plan. Changes in the fair value of the asset are recorded as a gain (loss) on deferred compensation investments and changes in the fair value of the liability are recorded as a component of compensation expense. In general, the compensation (benefit) expense is substantially offset by the gains and losses on the investment. During 2012, we recorded a gain on deferred compensation investments of $0.9 million and compensation expense of $1.1 million. During 2011, we recorded a loss on deferred compensation investments of $0.5 million and a decrease in compensation expense of $0.1 million. During 2010, we recorded a gain on deferred compensation investments of $0.9 million and compensation expense of $1.1 million.
Loss on Sale of Investments
During 2011, we sold our remaining portfolio of auction rate securities (“ARS”) for a net loss of $6.5 million, before taxes. During 2010, we recorded a $0.1 million loss on the sale of certain investments, before taxes.
Other-Than-Temporary Impairment Losses
During 2010, we recorded impairment charges of $1.1 million, before taxes, on certain ARS whose decline in fair value was determined to be other-than-temporary. The impairments related to credit rating downgrades on specific investments in the ARS portfolio.
Income Tax Expense (Benefit)
Our income tax expense was $30.0 million for 2012 compared to an income tax benefit of $13.7 million in 2011. Income tax for 2012 included a $16.8 million charge related to a transfer pricing tax election to repatriate cash in connection with the Internal Revenue Service (“IRS”) audit of tax years 2005-2007 and 2008-2009. Excluding these unusual items, the effective tax rate was further increased due to the expiration of the federal R&D tax credit and a greater portion of income in higher tax jurisdictions. Income tax expense for 2011 included a benefit of $10.9 million primarily related to the re-measurement of our unrecognized tax benefits and a tax benefit of $9.7 million related to incremental prior year federal and state R&D credits net of a valuation allowance on the state portion of these credits.
Our income tax benefit was $13.7 million for 2011 compared to an income tax expense of $85.4 million in 2010. Income tax expense for 2011 included a benefit of $10.9 million primarily related to the re-measurement of our unrecognized tax benefits and a tax benefit of $9.7 million related to incremental prior year federal and state R&D credits net of a valuation allowance on the state portion of these credits. Income tax expense for 2010 included a $68.8 million charge due primarily to a provision established upon the completion of fieldwork on a multi-year IRS examination, offset by a tax benefit of $4.5 million resulting from the donation of a portion of our facilities in Palm Bay.
In determining net (loss) income, we estimate and exercise judgment in the calculation of tax expense and tax liabilities, and in assessing the recoverability of deferred tax assets that arise from temporary differences between the tax and financial statement recognition of assets and liabilities.
23
In the ordinary course of business, the ultimate tax outcome of many transactions and calculations is uncertain, as the calculation of tax liabilities involves the application of complex tax laws in the United States, Malaysia and other jurisdictions. We recognize liabilities for additional taxes that may be due on tax audit issues based on an estimate of the ultimate resolution of those issues. Although we believe the estimates are reasonable, the final outcome may be different than amounts we estimate. Such determinations could have a material impact on the income tax expense (benefit), effective tax rate and operating results in the period they occur. In addition, the effective tax rate reflected in our forward-looking statements is based on current enacted tax laws in the jurisdictions in which we do business. Significant changes in enacted tax law could materially impact our estimates.
On January 2, 2013, President Obama signed into law the American Taxpayer Relief Act of 2012 which included an extension of the federal R&D credit retroactively to 2012 and prospectively through 2013. We expect to recognize approximately $6.0 million of tax benefit related to the reinstatement of the 2012 R&D credit in the first quarter of 2013.
Backlog
Our product sales are made pursuant to purchase orders that are generally booked up to six months in advance of delivery. Our standard terms and conditions of sale provide that these orders may not be cancelled or rescheduled thirty days prior to the most current CRD for standard products and ninety days prior to CRD for semi-custom and custom products. Backlog is influenced by several factors, including end market demand, pricing and customer order patterns in reaction to product lead times. Additionally, we believe backlog can fall faster than consumption rates in periods of weak end market demand since production lead times can be shorter. Conversely, we believe backlog can grow faster than consumption in periods of strong end market demand as production and delivery times increase and some customers may increase orders in excess of their current consumption to reduce their own risk of production disruptions. Our backlog for sales to distributors is valued at list price, which can be substantially higher than the prices ultimately recognized as revenue. Considering these practices and our experience, backlog alone cannot be consistently relied on to predict actual revenue for future periods.
Our six month backlog as of December 28, 2012 was $114.6 million compared to $134.8 million as of December 30, 2011 and $166.3 as of December 31, 2010.
24
Restructuring Plan
On February 19, 2013, we announced a restructuring initiative designed to prioritize sales and development efforts, strengthen financial performance and improve cash flow. The restructuring plans will be substantially completed during the first quarter of 2013 and are expected to reduce annual operating expenses by approximately $30.0 million. The refocusing effort will reduce the company’s global work force by approximately 18%. Costs savings are expected to be achieved through reductions in work force and increased focus on new product development efforts. We expect to recognize restructuring-related charges of approximately $15.0 million, consisting primarily of employee severance benefits, during the first quarter of 2013. The amount of the restructuring charges is an estimate, and the actual charges may vary materially based on various factors including, but not limited to, the extent of a reduction in force and changes in management's assumptions.
Impact of Inflation and Changing Prices
The semiconductor industry has, for several decades, experienced a phenomenon of continual decline in sales prices per unit. This phenomenon brings unique challenges to managing our business. In order to increase revenues, we must continually introduce new products that support higher sales prices or increase the units of products sold. This leads to capacity and production management issues and requires a large investment in R&D to regularly introduce new products that are differentiated based on qualities other than price and enable us to increase our average unit selling prices. At the same time we are faced with a continued increase in the complexity and cost of R&D and many fixed costs in our business that increase at the same rate of general inflation in the economy and must be managed carefully and aggressively in order to maintain operating margins. These characteristics of revenue pressure from selling price, the need to invest heavily in R&D and inflation-prone fixed costs are expected to continue.
Contractual Obligations and Off-Balance Sheet Arrangements
Contractual Obligations and Commitments
The following table sets forth our future contractual obligations as of December 28, 2012 (in millions):
|
|
|
2013 |
|
2014 |
|
2015 |
|
2016 |
|
2017 |
|
Thereafter |
|
Total |
|
Future minimum lease commitments |
|
$ 10.4 |
|
$ 7.6 |
|
$ 10.4 |
|
$ 5.1 |
|
$ 4.8 |
|
$ 10.2 |
|
$ 48.5 |
|
Open capital asset purchase commitments |
|
17.8 |
|
- |
|
- |
|
- |
|
- |
|
- |
|
17.8 |
|
Open raw material purchase commitments |
|
14.6 |
|
0.8 |
|
- |
|
- |
|
- |
|
- |
|
15.4 |
|
Tax liability arising from UTBs |
|
1.2 |
|
30.2 |
|
- |
|
- |
|
- |
|
81.5 |
|
112.9 |
|
Other purchase commitments |
|
3.5 |
|
0.6 |
|
- |
|
- |
|
- |
|
- |
|
4.1 |
|
Total |
|
$ 47.5 |
|
$ 39.2 |
|
$ 10.4 |
|
$ 5.1 |
|
$ 4.8 |
|
$ 91.7 |
|
$ 198.8 |
Our future minimum lease commitments consist primarily of leases for buildings and other real property. Open capital asset purchase commitments primarily include leasehold improvements, production equipment for the expansion of our Palm Bay facility, and other equipment. Open raw material purchase commitments are for externally produced wafers and includes minimum purchase requirements as part of a guaranteed capacity agreement with one of our wafer suppliers. The unrecognized tax benefits (“UTBs”) relate primarily to the intercompany pricing of goods and services between different tax jurisdictions and are recorded within income taxes payable on our consolidated financial statements.
Off-Balance Sheet Arrangements
We do not have any off-balance sheet arrangements that have or are reasonably likely to have a current or future material effect on our financial condition, revenues or expenses, results of operations, liquidity, capital expenditures or capital resources.
25
Liquidity and Capital Resources
Our capital requirements depend on a variety of factors, including but not limited to, the rate of increase or decrease in our existing business base; the success, timing and amount of investment required to bring new products to market; revenue growth or decline; and potential acquisitions. We believe that we have the financial resources necessary to meet business requirements for the next 12 months domestically and in our foreign operations, including our dividend program, the requisite capital expenditures for the maintenance of worldwide manufacturing capacity, working capital requirements and potential acquisitions, strategic investments or a stock buyback program. As of December 28, 2012, approximately $152.1 million of our cash and cash equivalents and short-term investments was held by our foreign subsidiaries. Due to our transfer pricing tax election in connection with our IRS audit, we have provided for federal and state taxation at approximately 37.5% and will not be subject to further taxation upon repatriation. We do not expect to repatriate foreign accumulated earnings in the foreseeable future; however, should that occur, we would be required to pay U.S. taxes and foreign withholding taxes, not currently provided for.
As of December 28, 2012, we have $325.0 million of borrowing capacity under our five-year revolving credit facility (the “Facility”). The Facility matures on September 1, 2016 and is payable in full upon maturity. Under the Facility, $25.0 million is available for the issuance of standby letters of credit, $10.0 million is available as swing line loans and $50.0 million is available for multicurrency borrowings. Amounts repaid under the Facility may be re-borrowed. The Facility currently bears interest at 2.5% over one-month LIBOR but is variable based on our leverage ratio as described in the credit agreement in Exhibit 10.1. As of December 28, 2012, we were in compliance with all applicable covenants of the above mentioned credit agreement.
Our primary sources and uses of cash during the three years ended December 28, 2012 are presented in this summarized table (in millions):
|
|
|
|
|
|
|
|
|
|
|
Year Ended |
||||
|
|
|
December 28, 2012 |
|
December 30, 2011 |
|
December 31, 2010 |
|
Sources (Uses) of Cash |
|
|
|
|
|
|
|
Existing business performance and activities |
|
|
|
|
|
|
|
Operating activities, including working capital changes |
|
$ 35.6 |
|
$ 138.3 |
|
$ 143.0 |
|
Cash flows from stock plans |
|
3.8 |
|
4.4 |
|
6.6 |
|
|
|
39.4 |
|
142.7 |
|
149.6 |
|
Issuance of long-term debt |
|
|
|
|
|
|
|
Issuance of long-term debt, net of fees |
|
(0.9) |
|
275.0 |
|
288.1 |
|
|
|
(0.9) |
|
275.0 |
|
288.1 |
|
Other Uses of Cash |
|
|
|
|
|
|
|
Business acquisitions, net |
|
- |
|
- |
|
(405.4) |
|
Capital expenditures, net of sale proceeds |
|
(12.2) |
|
(9.8) |
|
(20.5) |
|
Repayments of debt |
|
(200.0) |
|
(376.7) |
|
(1.5) |
|
Repurchase of common stock |
|
(15.3) |
|
- |
|
- |
|
Dividends paid |
|
(62.1) |
|
(61.5) |
|
(60.1) |
|
Cash/Investment Management Activities |
|
|
|
|
|
|
|
Net proceeds from investments and foreign exchange effect |
|
26.2 |
|
31.0 |
|
85.1 |
|
Net (decrease) increase in cash and cash equivalents |
|
$ (224.9) |
|
$ 0.7 |
|
$ 35.3 |
In 2012, our operational cash flows were $35.6 million compared to $138.3 million in 2011, a decrease of $102.7 million, due primarily to the decline in operating income and $46.6 million paid to the IRS to settle the 2005-2007 tax year audits. We used approximately $12.2 million for capital expenditures. We repaid $200.0 million of debt, repurchased $15.3 million of common stock, and returned $62.1 million to shareholders in the form of dividends. Net proceeds from investment balances were $26.2 million in 2012, resulting in net cash used of $224.9 million overall. Investment balances declined due to the maturity of bank time deposits.
We strive to continually improve the cash flows from our existing business activities and return a substantial portion of that cash flow to shareholders. We continue to maintain and improve our existing business performance with necessary capital expenditures and acquisitions that may further improve our business and return on investment. Cash, stock, debt or a combination thereof may be issued to fund additional acquisitions to grow our business.
26
Non-cash Working Capital
Trade accounts receivable, less valuation allowances, decreased by $10.2 million, or 15.7%, to $54.7 million as of December 28, 2012 from $64.9 million as of December 30, 2011. This decrease primarily reflects the decrease in revenue.
Inventories decreased by $23.0 million, or 23.5%, to $74.9 million as of December 28, 2012 from $97.9 million as of December 30, 2011. Inventories decreased from 2011 as a result of utilization of inventory on hand. We maintain stock of certain high volume products to ensure our lead times remain within customer expectations.
Capital Expenditures
Capital expenditures, net of sales proceeds, were $12.2 million for 2012, $9.8 million for 2011, and $20.5 million for 2010. Capital expenditures have been focused primarily on planned expansion of our Palm Bay facility and increases to test capacity for new product lines.
Cash Flow from Stock Plans
Cash flow from stock plans (including exercises of Options, tax payments on Awards and sales under our ESPP) was $3.8 million in 2012, compared to $4.4 million received in 2011 and $6.6 million received in 2010. We have changed the mix of new share-based incentive grants to a larger proportion of Awards than Options. Awards do not yield cash proceeds from an exercise event as do Options, but may result in tax payments on shares withheld. Additionally, exercises are decisions of grantees and are influenced by the level of our stock price and by other considerations of grantees. The recent decline in stock price has resulted in many of our options being “underwater” with exercise prices in excess of the current stock price. While the level of cash inflow from exercises is difficult to forecast, we believe it will remain a source of cash.
Dividends on Common Stock
In October 2012, our Board of Directors declared a dividend of $0.12 per share of common stock. We paid dividends of $15.1 million on November 23, 2012 to shareholders of record as of the close of business on November 13, 2012. In January 2013, our Board of Directors declared a dividend of $0.12 per share of common stock. The dividend will be paid on February 22, 2013 to shareholders of record as of the close of business on February 12, 2013.
Transactions with Related and Certain Other Parties
None.
Critical Accounting Policies and Estimates
We consider the following five accounting estimation processes to be critical to the preparation of our consolidated financial statements:
|
1) |
The allowances for collection of trade receivables (“receivable allowance”) and distributor, OEM and warranty allowances (“other allowances”); |
|
2) |
allowances for excess or obsolete inventory (“inventory allowances”); |
|
3) |
the assessment of recoverability of goodwill; |
|
4) |
accounting for income taxes; and |
|
5) |
fair value of equity-based compensation. |
These estimates involve estimates or judgments that are difficult or subjective and require certain assumptions that, if incorrect, could create changes, including adverse ones, to our consolidated statement of operations and financial position.
27
Receivables allowance and other allowances
Our receivables allowance is used to state trade receivables at a net realizable value or the amount that we estimate will be collected on our gross receivables. Since the amount that we will actually collect on the receivables outstanding cannot be known until the future, we rely primarily on prior experience. Our historical collection losses have been typically infrequent with write-offs of trade receivables being well below 1% of sales. In order to allow for future collection losses that arise from customer accounts that do not currently indicate the inability to pay but could have such an inability in the future, we maintain an allowance based on a 48-month rolling average of write-offs, which as of December 28, 2012 was less than 0.1% of our gross trade receivables balance. We also maintain specific allowances for customer accounts that we know may not be collectible for various reasons, such as bankruptcy and other customer liquidity issues. We analyze our trade receivable portfolio based on the age of each customer’s invoice. In this way, we can identify the accounts that are more likely to have collection problems. We then provide an allowance for a portion or all of the customer’s balance based on our evaluation of the ultimate collectability of the account.
Shipments to distributors are made under agreements which provide for certain pricing adjustments (referred to as “ship and debit”) and limited product return privileges, under a stock rotation provision. Many of our sales to distributors are invoiced at list price and the final price is set via ship and debit credits at the time of resale. The distributor may also receive certain price protection on a percentage of unsold inventories they hold. Accordingly, we make estimates of price adjustments based upon inventory held by distributors as of the balance sheet date and record this as a distributor allowance. We rely on historical distributor allowances to estimate these adjustments. Distributors may also receive allowances for certain parts returned under a stock rotation provision of the distributor agreement. We estimate the stock rotation provision based on the percentage of sales made to distributors and historical returns.
Distributor allowances were $12.2 million as of December 28, 2012 and $12.4 as of December 30, 2011.
Allowances for our OEM customers totaled $2.2 million as of December 28, 2012 and $1.8 million as of December 30, 2011. Warranty allowances, returns for which there are product performance claims, totaled $0.4 million as of December 28, 2012 and $0.3 million as of December 30, 2011.
In summary, our allowances for trade receivables and other allowances are as follows (in millions):
|
|
|
December 28, 2012 |
|
December 30, 2011 |
|
Trade receivables billed at list price |
|
$ 69.6 |
|
$ 79.5 |
|
Receivables allowance |
|
(0.1) |
|
(0.1) |
|
Other allowances (ship and debit, stock rotation and warranty) |
|
(14.8) |
|
(14.5) |
|
Trade receivables, net of allowances |
|
$ 54.7 |
|
$ 64.9 |
Inventory Allowances
We record our inventories at standard costs, which approximates the lower of actual cost or market. As the ultimate market value that we will realize through sales on our inventory cannot be known with exact certainty, we rely on past sales experience and future sales forecasts to project it. In analyzing our inventory levels, we classify certain inventory as either excess or obsolete. These classifications are maintained for all classes of inventory, although raw materials are seldom deemed excess or obsolete. We classify inventory as obsolete if we have withdrawn it from the marketplace or if we have had no sales of the product for the past 18 months and no sales forecasted for the next 24 months. We provide an allowance for 100% of the standard cost of obsolete inventory. We conduct reviews of excess inventory on a quarterly basis and reserve a significant portion of the excess inventory. We classify inventory as excess if we have quantities of product greater than the amounts we have sold in the past 18 months or have forecasted to sell in the next 24 months. We typically retain excess inventory until the inventory is sold or reclassified as obsolete, at which time we may scrap.
For all items identified as excess or obsolete, management reviews the individual facts and circumstances, i.e.: competitive landscape, industry economic conditions, product lifecycles and product cannibalization, specific to that inventory. Inventory allowances totaled approximately $45.9 million on gross inventory of $120.8 million as of December 28, 2012 and $37.4 million on gross inventory of $135.3 million as of December 30, 2011.
28
Product demand estimates are a key element in determining inventory allowances. Our estimate of product demand requires significant judgment and is based in part on historical revenue. Historical sales may not accurately predict future demand. If future demand is ultimately lower than our estimate, we could incur significant additional expenses to provide allowances for and scrap obsolete inventory.
Assessment of recoverability of goodwill
We perform an annual assessment of goodwill in the fourth quarter of each year, or more frequently if indications of potential impairment exist. Goodwill is tested under a two-step method for impairment at a level of reporting referred to as a reporting unit. Step one is to identify potential impairment. We compare the calculated fair value of each reporting unit with its carrying amount, including goodwill. If the fair value of a reporting unit exceeds its carrying amount, no impairment of the goodwill of the reporting unit is indicated and step two is unnecessary. If the carrying amount of a reporting unit exceeds its fair value, the second step of the goodwill impairment test will be performed to measure the amount of impairment loss, if any. The amount of impairment loss is the excess of carrying amount of goodwill over the implied fair value of the reporting unit goodwill. After a goodwill impairment loss is recognized, the adjusted carrying amount of goodwill will be the new accounting basis.
Significant judgment is involved in the determination of fair value for the above analysis. Our estimates of fair value are based on a combination of the income approach, which estimates the fair value of our reporting units based on the future discounted cash flows, and the market approach, which estimates the fair value of our reporting units based on comparable market prices. The use of future discounted cash flows is based on assumptions that are consistent with our estimates of future growth and the strategic plan used to manage the underlying business. Factors requiring significant judgment include assumptions related to future growth rates, discount factors, market multiples and tax rates, amongst other considerations. Changes in economic and operating conditions that occur after the annual impairment analysis or an interim impairment analysis, and that impact these assumptions, may result in a future goodwill impairment charge.
For the purposes of the impairment test performed on September 29, 2012, we had three reporting units – analog and mixed signal (“AMS”), power management, and consumer. The fair value of the power management and consumer reporting units was substantially in excess of the carrying value of those reporting units. The fair value of the AMS reporting unit exceeded its carrying value by 11%. Goodwill allocated to the AMS reporting unit as of December 31, 2012 was $229.8 million.
We performed sensitivity analysis on our estimated fair value for the AMS reporting unit using the income and market approaches. A key assumption in our fair value estimate using the income approach is the weighted average cost of capital (“WACC”). We selected a WACC of 16% for the AMS reporting unit. An increase in the WACC of 150 basis points would have resulted in a fair value that was less than the carrying value. A key assumption in our market approach was an enterprise value to revenue multiple. A 10% decrease in the selected revenue multiples would have resulted in a fair value that was less than the carrying value, all other variables remaining constant.
Accounting for income taxes
As part of the process of preparing our consolidated financial statements, we are required to estimate our income taxes in each of the jurisdictions in which we operate. We are subject to income taxes in the United States and various foreign jurisdictions. Significant judgment is required to determine worldwide income tax liabilities. This process involves estimating our actual current tax liability together with assessing temporary differences resulting from differing treatment of items for tax and accounting purposes. Our effective tax rate and the actual taxes ultimately payable could be adversely affected by changes in the mix of earnings between countries with differing statutory tax rates, in the valuation of deferred tax assets, in tax laws or by material audit assessments, which could affect our profitability.
Temporary differences result in deferred tax assets and liabilities, which are included within our consolidated balance sheet. We then assess the likelihood that our deferred tax assets will be recovered from future taxable income and, to the extent we believe that recovery is not likely, establish a valuation allowance. As of December 28, 2012, our net deferred tax asset amounted to $105.5 million compared to $120.8 million as of December 30, 2011.
29
Applicable guidance requires us to record our tax expense based on various estimates of probabilities of sustaining certain tax positions. As a result of this and other factors, our tax expense could be volatile, which contributes to volatility in reported financial results. As of December 28, 2012 and December 30, 2011, our UTBs related to uncertain tax positions were $112.9 million and $154.4 million, respectively.
Fair value of equity-based compensation
We generally calculate the fair value of an equity-based compensation grant (compensation cost) on the date of grant using a lattice method or, for market-based grants, a Monte-Carlo simulation. The compensation cost is then amortized straight-line over the shorter of vesting life or requisite service period. Calculating fair value requires us to estimate certain key assumptions in the valuation model, including expected stock price volatility, the risk-free interest rate in the market, the expected life of the Option granted and annualized dividend yield. Volatility is one of the most significant determinants of fair value. We estimate our volatility using the actual historic volatility of our stock price. We estimate our expected risk-free interest rate by using the zero-coupon U.S. Treasury rate at the time of the grant related to the expected life of the grant. Expected forfeitures must be estimated to offset the compensation cost expected to be recorded in the financial statements. We estimate forfeitures for the first year of vesting, based on historical information about turnover for each appropriate employee level. Thereafter, as vesting tiers within an Option are more frequent until fully vested, forfeitures are no longer estimated but rather recorded as they actually occur. We estimate the annualized dividend yield by dividing the current annualized dividend by the closing stock price on the date of grant.
Calculating fair value for our Options and Awards that have a performance measurement element to them also requires us to estimate the likely actual performance before the performance is complete. We do this by adjusting the forfeiture rate to include the expectation of actual performance at the time the calculation is made for purposes of amortizing the compensation appropriately. Such performance-based instruments, depending upon the term of required performance, may need to be re-measured as frequently as quarterly.
We base these estimates of key assumptions on historical information using judgment regarding future expectations. We re-examine our assumptions on a regular basis. When such examinations of the key assumptions lead to significant changes to the calculation inputs, it can have a material effect on the amount of equity-based compensation that will be recognized in aggregate or in any period. This may mean more volatility in our reported earnings due to changes in facts and circumstances surrounding our use of equity compensation.
Recent Accounting Pronouncements
In December 2011, the Financial Accounting Standards Board (“FASB”) issued Accounting Standards Update ("ASU") No. 2011-11 “Disclosures about Offsetting Assets and Liabilities.” The standard requires additional disclosure to enhance the comparability of U.S. GAAP and International Financial Reporting Standards financial statements. In January 2013, the FASB issued Accounting Standards Update 2013-01 "Clarifying the Scope of Disclosures about Offsetting Assets and Liabilities." This standard provided additional guidance on the scope of ASU 2011-11. Retrospective application is required and the guidance concerns disclosure only. It will be effective for our first quarter of fiscal year 2013 and will not have a material impact on our financial statements.
In February 2013, the FASB issued ASU No. 2013-02, "Reporting of Amounts Reclassified Out of Accumulated Other Comprehensive Income." Under ASU 2013-02, an entity is required to provide information about the amounts reclassified out of Accumulated Other Comprehensive Income ("AOCI") by component. In addition, an entity is required to present, either on the face of the financial statements or in the notes, significant amounts reclassified out of AOCI by the respective line items of net income, but only if the amount reclassified is required to be reclassified in its entirety in the same reporting period. For amounts that are not required to be reclassified in their entirety to net income, an entity is required to cross-reference to other disclosures that provide additional details about those amounts. ASU 2013-02 does not change the current requirements for reporting net income or other comprehensive income in the financial statements. ASU 2013-02 will be effective for our first quarter of fiscal year 2013 and will not have a material impact on our financial statements.
30
Item 7A. Quantitative and Qualitative Disclosures about Market Risk.
Credit markets have tightened as a result of the financial crises in recent years, resulting in lower liquidity in many financial markets and excess volatility in fixed income, credit and equity markets. We could experience a number of resulting effects, including product delays due to effects experienced by key suppliers; reduced orders and payments as customers are affected by tighter credit markets and/or insolvency; decreased investing and financing options in a tighter market; increased expenses; increased impairments resulting from lower orders and sales as customers experience difficulties obtaining financing; and volatility and extreme changes in the earnings and fair value of our investments.
Moreover, in the normal course of doing business, we are exposed to the risks associated with foreign currency exchange rates and changes in interest rates. We employ established policies and procedures governing the use of financial instruments, entered into for purposes other than trading purposes, to manage our exposure to these risks.
Our cash equivalents and investments are subject to three market risks: interest rate risk, credit risk and liquidity risk. Our investments as of December 28, 2012, are primarily held in bank time deposits.
As of December 28, 2012, we had open foreign exchange contracts to economically hedge forecasted foreign cash flow commitments up to six months. As our hedges on forecasted foreign cash flow commitments do not qualify for hedge accounting, gains and losses on changes in the fair market value of the foreign exchange contracts are recognized in income. Realized and unrealized gains and losses from economic hedges are classified in the statements of operations consistent with the accounting classification of the items being economically hedged. The derivatives are recognized on the balance sheet at their fair value. We believe our cash flow hedges have been economically effective.
The table below summarizes our foreign exchange contract activity over the past two years (in millions):
|
|
|
|
|
|
|
|
|
Year Ended |
||
|
|
|
December 28, 2012 |
|
December 30, 2011 |
|
Realized loss on foreign exchange contracts |
|
$ - |
|
$ (1.4) |
|
Unrealized (loss) gain on foreign exchange contracts |
|
(0.7) |
|
0.6 |
|
Purchases and sales of foreign exchange contracts |
|
31.4 |
|
41.0 |
|
Notional amount of open contracts as of year end |
|
12.4 |
|
20.2 |
|
Fair value of open contracts as of year end |
|
- |
|
1.1 |
A substantial majority of our revenues and liabilities outside the U.S. are billed, collected, and paid in U.S. dollars. Therefore, we do not believe we have material risk to currency rates.
31
Item 8. Financial Statements and Supplementary Data.
The following consolidated financial statements and the related Notes thereto, and the financial statement schedules of Intersil Corporation and the Reports of the Independent Registered Public Accounting Firm are filed as a part of this report.
INTERSIL CORPORATION
INDEX TO FINANCIAL STATEMENTS
|
|
|
| 33 | |
| 35 | |
| 36 | |
| 37 | |
| 38 | |
| 39 | |
| 40 | |
|
|
|
|
INDEX TO FINANCIAL STATEMENT SCHEDULES |
|
|
|
|
| 68 |
32
Report of Independent Registered Public Accounting Firm
The Board of Directors and Stockholders
Intersil Corporation:
We have audited the accompanying consolidated balance sheets of Intersil Corporation and subsidiaries (the “Company”) as of December 28, 2012 and December 30, 2011 and the related consolidated statements of operations, comprehensive (loss) income, shareholders’ equity and cash flows for each of the years in the three‑year period ended December 28, 2012. In connection with our audits of the consolidated financial statements, we also have audited the financial statement schedule as listed in the accompanying index. These consolidated financial statements and the financial statement schedule are the responsibility of the Company’s management. Our responsibility is to express an opinion on these consolidated financial statements and the financial statement schedule based on our audits.
We conducted our audits in accordance with the standards of the Public Company Accounting Oversight Board (United States). Those standards require that we plan and perform the audit to obtain reasonable assurance about whether the financial statements are free of material misstatement. An audit includes examining, on a test basis, evidence supporting the amounts and disclosures in the financial statements. An audit also includes assessing the accounting principles used and significant estimates made by management, as well as evaluating the overall financial statement presentation. We believe that our audits provide a reasonable basis for our opinion.
In our opinion, the consolidated financial statements referred to above present fairly, in all material respects, the financial position of Intersil Corporation and subsidiaries as of December 28, 2012 and December 30, 2011, and the results of their operations and their cash flows for each of the years in the three‑year period ended December 28, 2012, in conformity with U.S. generally accepted accounting principles. Also in our opinion, the related financial statement schedule, when considered in relation to the basic consolidated financial statements taken as a whole, present fairly, in all material respects, the information set forth therein.
We also have audited, in accordance with the standards of the Public Company Accounting Oversight Board (United States), Intersil Corporation’s internal control over financial reporting as of December 28, 2012, based on criteria established in Internal Control – Integrated Framework issued by the Committee of Sponsoring Organizations of the Treadway Commission, and our report dated February 22, 2013 expressed an unqualified opinion on the effectiveness of the Company’s internal control over financial reporting.
/s/ KPMG LLP
February 22, 2013
Orlando, Florida
Certified Public Accountants
33
Report of Independent Registered Public Accounting Firm
The Board of Directors and Stockholders
Intersil Corporation:
We have audited Intersil Corporation’s internal control over financial reporting as of December 28, 2012, based on criteria established in Internal Control – Integrated Framework issued by the Committee of Sponsoring Organizations of the Treadway Commission (“COSO”). Intersil Corporation’s management is responsible for maintaining effective internal control over financial reporting and for its assessment of the effectiveness of internal control over financial reporting included in the accompanying Report on Internal Control over Financial Reporting. Our responsibility is to express an opinion on the Company’s internal control over financial reporting based on our audit.
We conducted our audit in accordance with the standards of the Public Company Accounting Oversight Board (United States). Those standards require that we plan and perform the audit to obtain reasonable assurance about whether effective internal control over financial reporting was maintained in all material respects. Our audit included obtaining an understanding of internal control over financial reporting, assessing the risk that a material weakness exists, and testing and evaluating the design and operating effectiveness of internal control based on the assessed risk. Our audit also included performing such other procedures as we considered necessary in the circumstances. We believe that our audit provides a reasonable basis for our opinion.
A company’s internal control over financial reporting is a process designed to provide reasonable assurance regarding the reliability of financial reporting and the preparation of financial statements for external purposes in accordance with generally accepted accounting principles. A company’s internal control over financial reporting includes those policies and procedures that (1) pertain to the maintenance of records that, in reasonable detail, accurately and fairly reflect the transactions and dispositions of the assets of the company; (2) provide reasonable assurance that transactions are recorded as necessary to permit preparation of financial statements in accordance with generally accepted accounting principles, and that receipts and expenditures of the company are being made only in accordance with authorizations of management and directors of the company; and (3) provide reasonable assurance regarding prevention or timely detection of unauthorized acquisition, use, or disposition of the company’s assets that could have a material effect on the financial statements.
Because of its inherent limitations, internal control over financial reporting may not prevent or detect misstatements. Also, projections of any evaluation of effectiveness to future periods are subject to the risk that controls may become inadequate because of changes in conditions, or that the degree of compliance with the policies or procedures may deteriorate.
In our opinion, Intersil Corporation maintained, in all material respects, effective internal control over financial reporting as of December 28, 2012, based on criteria established in Internal Control – Integrated Framework issued by COSO.
We also have audited, in accordance with the standards of the Public Company Accounting Oversight Board (United States), the consolidated balance sheets of Intersil Corporation and subsidiaries as of December 28, 2012 and December 30, 2011, and the related consolidated statements of operations, comprehensive (loss) income, shareholders’ equity and cash flows for each of the years in the three-year period ended December 28, 2012 and the related financial statement schedule, and our report dated February 22, 2013 expressed an unqualified opinion on those consolidated financial statements.
/s/ KPMG LLP
February 22, 2013
Orlando, Florida
Certified Public Accountants
34
|
|
|
|
|
|
|
|
|
INTERSIL CORPORATION |
||||||
|
|
|
|
|
|
|
|
|
|
|
Year Ended |
||||
|
|
|
December 28, 2012 |
|
December 30, 2011 |
|
December 31, 2010 |
|
|
|
|
|
|
|
|
|
|
|
(in thousands, except share and per share data) |
||||
|
Revenue |
|
$ 607,864 |
|
$ 760,490 |
|
$ 822,400 |
|
Cost of revenue |
|
277,698 |
|
323,165 |
|
344,070 |
|
Gross profit |
|
330,166 |
|
437,325 |
|
478,330 |
|
|
|
|
|
|
|
|
|
Operating costs and expenses: |
|
|
|
|
|
|
|
Research and development |
|
166,884 |
|
185,458 |
|
183,313 |
|
Selling, general and administrative |
|
134,314 |
|
140,041 |
|
137,484 |
|
Amortization of purchased intangibles |
|
29,185 |
|
26,830 |
|
27,665 |
|
Income from IP agreements |
|
(14,412) |
|
- |
|
- |
|
Restructuring and related costs |
|
10,490 |
|
4,059 |
|
- |
|
Acquisition-related costs |
|
- |
|
273 |
|
8,028 |
|
Operating income |
|
3,705 |
|
80,664 |
|
121,840 |
|
Interest income |
|
538 |
|
2,667 |
|
3,090 |
|
Interest expense and fees |
|
(12,829) |
|
(14,499) |
|
(12,864) |
|
Loss on extinguishment of debt |
|
- |
|
(8,399) |
|
- |
|
Gain (loss) on deferred compensation investments, net |
|
920 |
|
(457) |
|
877 |
|
Loss on sale of investments |
|
- |
|
(6,547) |
|
(99) |
|
Other-than-temporary impairment losses |
|
- |
|
- |
|
(1,082) |
|
(Loss) income before income taxes |
|
(7,666) |
|
53,429 |
|
111,762 |
|
Income tax expense (benefit) |
|
29,983 |
|
(13,735) |
|
85,370 |
|
Net (loss) income |
|
$ (37,649) |
|
$ 67,164 |
|
$ 26,392 |
|
|
|
|
|
|
|
|
|
(Loss) earnings per share: |
|
|
|
|
|
|
|
Basic |
|
$ (0.30) |
|
$ 0.53 |
|
$ 0.21 |
|
Diluted |
|
$ (0.30) |
|
$ 0.53 |
|
$ 0.21 |
|
|
|
|
|
|
|
|
|
Cash dividends declared per common share |
|
$ 0.48 |
|
$ 0.48 |
|
$ 0.48 |
|
|
|
|
|
|
|
|
|
Weighted average common shares outstanding (in millions): |
|
|
|
|
|
|
|
Basic |
|
127.0 |
|
125.7 |
|
123.8 |
|
Diluted |
|
127.0 |
|
126.0 |
|
124.6 |
|
|
|
|
|
|
|
|
|
See accompanying Notes to Consolidated Financial Statements. |
||||||
35
|
|
|
|
|
|
|
|
|
INTERSIL CORPORATION |
||||||
|
|
|
|
|
|
|
|
|
|
|
Year Ended |
||||
|
|
|
December 28, 2012 |
|
December 30, 2011 |
|
December 31, 2010 |
|
|
|
|
|
|
|
|
|
|
|
(in thousands) |
||||
|
|
|
|
|
|
|
|
|
Net (loss) income |
|
$ (37,649) |
|
$ 67,164 |
|
$ 26,392 |
|
Unrealized gain (loss) on available-for-sale investments |
|
- |
|
(159) |
|
12,243 |
|
Tax effect |
|
- |
|
37 |
|
(2,826) |
|
Unrealized loss on interest rate swaps |
|
- |
|
(1,899) |
|
(1,633) |
|
Tax effect |
|
- |
|
712 |
|
613 |
|
Realized losses on interest rate swaps and available-for-sale investments, reclassified to net (loss) income |
|
3,450 |
|
4,520 |
|
- |
|
Tax effect |
|
(1,294) |
|
(2,836) |
|
- |
|
Currency translation adjustments |
|
225 |
|
30 |
|
548 |
|
Comprehensive (loss) income |
|
$ (35,268) |
|
$ 67,569 |
|
$ 35,337 |
|
|
|
|
|
|
|
|
|
See accompanying Notes to Consolidated Financial Statements. |
||||||
36
|
|
|
|
|
|
|
|
INTERSIL CORPORATION |
|||||
|
|
|
|
|
|
|
|
|
|
December 28, 2012 |
|
|
December 30, 2011 |
|
|
|
|
|
|
|
|
Assets |
|
(in thousands, except share data) |
|||
|
Current Assets: |
|
|
|
|
|
|
Cash and cash equivalents |
|
$ 158,810 |
|
|
$ 383,693 |
|
Short-term investments |
|
4,751 |
|
|
26,501 |
|
Trade receivables, net of allowances ($14,891 as of December 28, 2012 and $14,640 as of December 30, 2011) |
|
54,684 |
|
|
64,874 |
|
Inventories |
|
74,868 |
|
|
97,889 |
|
Prepaid expenses and other current assets |
|
14,504 |
|
|
16,140 |
|
Deferred income tax assets |
|
20,006 |
|
|
40,786 |
|
Total Current Assets |
|
327,623 |
|
|
629,883 |
|
Non-current Assets: |
|
|
|
|
|
|
Property, plant & equipment, net of accumulated depreciation ($228,079 as of December 28, 2012 and $221,984 as of December 30, 2011) |
|
85,374 |
|
|
91,038 |
|
Purchased intangibles, net of accumulated amortization ($83,555 as of December 28, 2012 and $67,260 as of December 30, 2011) |
|
82,998 |
|
|
112,183 |
|
Goodwill |
|
565,424 |
|
|
565,424 |
|
Long-term investments |
|
- |
|
|
4,752 |
|
Deferred income tax assets |
|
85,526 |
|
|
80,043 |
|
Other |
|
80,841 |
|
|
85,900 |
|
Total Non-current Assets |
|
900,163 |
|
|
939,340 |
|
Total Assets |
|
$ 1,227,786 |
|
|
$ 1,569,223 |
|
Liabilities and Shareholders' Equity |
|
|
|
|
|
|
Current Liabilities: |
|
|
|
|
|
|
Trade payables |
|
$ 22,220 |
|
|
$ 27,883 |
|
Accrued compensation |
|
41,593 |
|
|
41,420 |
|
Deferred income |
|
9,572 |
|
|
8,585 |
|
Other accrued expenses |
|
23,360 |
|
|
25,444 |
|
Non-income taxes payable |
|
2,274 |
|
|
2,178 |
|
Income taxes payable |
|
1,293 |
|
|
60,575 |
|
Total Current Liabilities |
|
100,312 |
|
|
166,085 |
|
Non-current liabilities: |
|
|
|
|
|
|
Long-term debt |
|
- |
|
|
200,000 |
|
Income taxes payable |
|
111,724 |
|
|
93,769 |
|
Other non-current liabilities |
|
21,142 |
|
|
28,681 |
|
Total Non-current Liabilities |
|
132,866 |
|
|
322,450 |
|
Shareholders' Equity: |
|
|
|
|
|
|
Preferred stock, $0.01 par value, 2 million shares authorized; no shares issued or outstanding |
|
- |
|
|
- |
|
Class A common stock, $0.01 par value, voting; 600 million shares authorized; 126,249,768 shares issued and outstanding as of December 28, 2012 and 126,483,088 shares issued and outstanding as of December 30, 2011 |
|
1,263 |
|
|
1,265 |
|
Additional paid-in capital |
|
1,659,895 |
|
|
1,710,705 |
|
Accumulated deficit |
|
(669,790) |
|
|
(632,141) |
|
Accumulated other comprehensive income |
|
3,240 |
|
|
859 |
|
Total Shareholders' Equity |
|
994,608 |
|
|
1,080,688 |
|
Total Liabilities and Shareholders' Equity |
|
$ 1,227,786 |
|
|
$ 1,569,223 |
|
|
|
|
|
|
|
|
See accompanying Notes to Consolidated Financial Statements. |
|||||
37
|
|
|
|
|
|
|
|
|
|
|
|
|
INTERSIL CORPORATION |
||||||||||
|
|
|
|
|
|
|
|
|
|
|
|
|
|
|
Common Stock Class A |
|
Additional Paid-In Capital |
|
Accumulated Deficit |
|
Accumulated Other Comprehensive Income (Loss) |
|
Total |
|
|
|
(in thousands except per share amounts) |
||||||||
|
Balance as of January 1, 2010 |
|
$ 1,228 |
|
$ 1,764,046 |
|
$ (725,697) |
|
$ (8,491) |
|
$ 1,031,086 |
|
Net income |
|
- |
|
- |
|
26,392 |
|
- |
|
26,392 |
|
Dividends paid, $0.48 per common share |
|
- |
|
(59,400) |
|
- |
|
- |
|
(59,400) |
|
Dividends accrued to Award holders prior to vesting |
|
- |
|
(1,757) |
|
- |
|
- |
|
(1,757) |
|
Equity-based compensation expense |
|
- |
|
32,719 |
|
- |
|
- |
|
32,719 |
|
Shares issued under share-based award plans, plus related tax benefit |
|
18 |
|
6,194 |
|
- |
|
- |
|
6,212 |
|
Foreign currency translation |
|
- |
|
- |
|
- |
|
548 |
|
548 |
|
Unrealized gains on available-for-sale securities, net of tax benefit |
|
- |
|
- |
|
- |
|
9,417 |
|
9,417 |
|
Unrealized losses on interest rate swap, net of tax benefit |
|
- |
|
- |
|
- |
|
(1,020) |
|
(1,020) |
|
Balance as of December 31, 2010 |
|
$ 1,246 |
|
$ 1,741,802 |
|
$ (699,305) |
|
$ 454 |
|
$ 1,044,197 |
|
Net income |
|
- |
|
- |
|
67,164 |
|
- |
|
67,164 |
|
Dividends paid, $0.48 per common share |
|
- |
|
(60,348) |
|
- |
|
- |
|
(60,348) |
|
Dividends accrued to Award holders prior to vesting |
|
- |
|
(1,333) |
|
- |
|
- |
|
(1,333) |
|
Equity-based compensation expense |
|
- |
|
30,262 |
|
- |
|
- |
|
30,262 |
|
Shares issued under share-based award plans |
|
19 |
|
4,006 |
|
- |
|
- |
|
4,025 |
|
Tax impact of shares issued under share-based award plans |
|
- |
|
(3,684) |
|
- |
|
- |
|
(3,684) |
|
Foreign currency translation |
|
- |
|
- |
|
- |
|
30 |
|
30 |
|
Unrealized loss on available-for-sale securities, net of tax |
|
- |
|
- |
|
- |
|
(122) |
|
(122) |
|
Unrealized losses on interest rate swaps, net of tax |
|
- |
|
- |
|
- |
|
(1,187) |
|
(1,187) |
|
Realized losses on available for sale securities and interest rate swap, net of tax, reclassified |
|
- |
|
- |
|
- |
|
1,684 |
|
1,684 |
|
Balance as of December 30, 2011 |
|
$ 1,265 |
|
$ 1,710,705 |
|
$ (632,141) |
|
$ 859 |
|
$ 1,080,688 |
|
Net loss |
|
- |
|
- |
|
(37,649) |
|
- |
|
(37,649) |
|
Dividends paid, $0.48 per common share |
|
- |
|
(60,955) |
|
- |
|
- |
|
(60,955) |
|
Dividends accrued to Award holders prior to vesting |
|
- |
|
(501) |
|
- |
|
- |
|
(501) |
|
Equity-based compensation expense |
|
- |
|
24,607 |
|
- |
|
- |
|
24,607 |
|
Shares issued under share-based award plans |
|
17 |
|
3,734 |
|
- |
|
- |
|
3,751 |
|
Tax impact of shares issued under share-based award plans |
|
- |
|
(2,452) |
|
- |
|
- |
|
(2,452) |
|
Foreign currency translation |
|
- |
|
- |
|
- |
|
225 |
|
225 |
|
Realized losses on interest rate swaps, net of tax, reclassified |
|
- |
|
- |
|
- |
|
2,156 |
|
2,156 |
|
Shares repurchased and retired |
|
(19) |
|
(15,243) |
|
- |
|
- |
|
(15,262) |
|
Balance as of December 28, 2012 |
|
$ 1,263 |
|
$ 1,659,895 |
|
$ (669,790) |
|
$ 3,240 |
|
$ 994,608 |
|
|
|
|
|
|
|
|
|
|
|
|
|
See accompanying Notes to Consolidated Financial Statements. |
||||||||||
38
|
|
|
|
|
|
|
|
|
INTERSIL CORPORATION |
||||||
|
|
|
|
|
|
|
|
|
|
|
Year Ended |
||||
|
|
|
December 28, 2012 |
|
December 30, 2011 |
|
December 31, 2010 |
|
|
|
|
|
|
|
|
|
|
|
(in thousands) |
||||
|
Operating Activities |
|
|
|
|
|
|
|
Net (loss) income |
|
$ (37,649) |
|
$ 67,164 |
|
$ 26,392 |
|
Adjustments to reconcile net loss (income) to net cash flows from operating activities: |
|
|
|
|
|
|
|
Depreciation and amortization |
|
48,652 |
|
48,955 |
|
48,744 |
|
Gain on assets reclassified from held for sale status |
|
- |
|
- |
|
(1,078) |
|
Provisions for inventory obsolescence |
|
9,738 |
|
7,798 |
|
3,520 |
|
Equity-based compensation |
|
24,607 |
|
30,262 |
|
32,719 |
|
Tax effect of equity-based awards |
|
(2,452) |
|
(3,684) |
|
(1,871) |
|
Excess tax benefit received on exercise of equity-based awards |
|
(3) |
|
(346) |
|
(138) |
|
(Gain) loss on disposal of property and equipment |
|
(67) |
|
(368) |
|
292 |
|
Settlement of interest rate swap |
|
- |
|
(2,965) |
|
- |
|
Loss on extinguishment of debt |
|
- |
|
8,399 |
|
- |
|
Loss on sale of investments |
|
- |
|
6,547 |
|
99 |
|
Other-than-temporary impairment losses |
|
- |
|
- |
|
1,082 |
|
Deferred income taxes |
|
14,003 |
|
(10,063) |
|
(45,717) |
|
Changes in operating assets and liabilities: |
|
|
|
|
|
|
|
Trade receivables |
|
10,190 |
|
23,849 |
|
(14,154) |
|
Inventories |
|
13,283 |
|
(3,720) |
|
(10,052) |
|
Prepaid expenses and other current assets |
|
2,491 |
|
4,180 |
|
(5,961) |
|
Trade payables and accrued liabilities |
|
(6,752) |
|
(19,618) |
|
2,932 |
|
Income taxes |
|
(41,327) |
|
(8,913) |
|
131,850 |
|
Other, net |
|
857 |
|
(9,136) |
|
(25,688) |
|
Net cash flows from operating activities |
|
35,571 |
|
138,341 |
|
142,971 |
|
|
|
|
|
|
|
|
|
Investing Activities |
|
|
|
|
|
|
|
Proceeds from short-term investments |
|
26,500 |
|
- |
|
43,033 |
|
Purchases of short-term investments |
|
- |
|
(26,529) |
|
(2,106) |
|
Proceeds from long-term investments |
|
- |
|
67,027 |
|
52,436 |
|
Purchases of long-term investments |
|
- |
|
(9,753) |
|
(8,737) |
|
Cash paid for acquired businesses, net of acquired cash |
|
- |
|
- |
|
(405,362) |
|
Proceeds from sales of property, plant and equipment |
|
320 |
|
791 |
|
290 |
|
Purchase of property, plant and equipment |
|
(12,540) |
|
(10,547) |
|
(20,771) |
|
Net cash flows from investing activities |
|
14,280 |
|
20,989 |
|
(341,217) |
|
|
|
|
|
|
|
|
|
Financing Activities |
|
|
|
|
|
|
|
Proceeds from exercise of equity-based awards |
|
3,751 |
|
4,025 |
|
6,454 |
|
Excess tax benefit received from exercise of equity-based awards |
|
3 |
|
346 |
|
138 |
|
Proceeds from long-term debt |
|
- |
|
278,195 |
|
300,000 |
|
Repayments of long-term debt |
|
(200,000) |
|
(376,695) |
|
(1,500) |
|
Debt issuance costs |
|
- |
|
- |
|
(10,751) |
|
Payment of credit facility fees |
|
(855) |
|
(3,240) |
|
(1,125) |
|
Dividends paid |
|
(62,057) |
|
(61,459) |
|
(60,120) |
|
Repurchase of common stock |
|
(15,262) |
|
- |
|
- |
|
Net cash flows from financing activities |
|
(274,420) |
|
(158,828) |
|
233,096 |
|
Effect of exchange rates on cash and cash equivalents |
|
(314) |
|
175 |
|
499 |
|
Net change in cash and cash equivalents |
|
(224,883) |
|
677 |
|
35,349 |
|
Cash and cash equivalents at the beginning of the period |
|
383,693 |
|
383,016 |
|
347,667 |
|
Cash and cash equivalents at the end of the period |
|
$ 158,810 |
|
$ 383,693 |
|
$ 383,016 |
|
|
|
|
|
|
|
|
|
See accompanying Notes to Consolidated Financial Statements. |
|
|||||
39
INTERSIL CORPORATION
NOTES TO CONSOLIDATED FINANCIAL STATEMENTS
NOTE 1—ORGANIZATION AND BASIS OF PRESENTATION
Intersil Corporation (“Intersil,” which may also be referred to as “we,” “us” or “our”) designs, develops, manufactures and markets high-performance analog, mixed-signal, and power management integrated circuits (“ICs”) for applications in the global industrial & infrastructure, personal computing and consumer electronics markets.
Industrial and Infrastructure products: Our products enable multiple functions in thousands of industrial and infrastructure systems. From the most advanced aviation and satellite systems to factory automation equipment and automotive systems, Intersil’s power management, analog and mixed signal ICs provide the electronic building blocks of these systems.
Personal Computing products: Our products provide the power management functions for all types of personal computers, including ultrabooks®, notebooks and desktops. These functions include power management for the central processing unit (“CPU”), battery charging, display power and other types of power related functions within a personal computer.
Consumer products: Our products enable multiple functions for today’s high end consumer electronics, including smart phones, tablets, displays and many other consumer electronic devices. These functions include power management, battery charging, light and proximity sensing and display image quality enhancement functions.
The table below summarizes our percent of revenue by end market:
|
|
|
|
|
|
|
|
|
|
|
Year Ended |
||||
|
|
|
December 28, 2012 |
|
December 30, 2011 |
|
December 31, 2010 |
|
Industrial & Infrastructure |
|
57.1% |
|
52.9% |
|
56.0% |
|
Personal Computing |
|
23.2% |
|
25.2% |
|
21.9% |
|
Consumer |
|
19.7% |
|
21.9% |
|
22.1% |
|
Total |
|
100.0% |
|
100.0% |
|
100.0% |
Basis of Presentation
We utilize a 52/53 week fiscal year, ending on the nearest Friday to December 31. The next 53 week fiscal year will be in 2013 with an extra week to be reported in our second quarter. All years presented are fiscal years and contain 52 weeks. Quarterly or annual periods vary from exact calendar quarters or years.
The consolidated financial statements include the accounts of Intersil and its subsidiaries. All significant intercompany accounts and transactions have been eliminated. Accounts denominated in non-U.S. currencies have been re-measured using the U.S. dollar as the functional currency.
Reclassifications
Certain prior year amounts have been reclassified to conform to current year presentation.
NOTE 2—SIGNIFICANT ACCOUNTING POLICIES
Cash Equivalents—Cash equivalents in the consolidated balance sheets and statements of cash flows consist of liquid debt securities with insignificant interest rate risk and with original maturities of three months or less at the time of purchase. Investments with original maturities over three months are classified as short-term investments.
40
Short and Long-term Investments—We continually monitor our positions with and the credit quality of the governmental and financial institutions that issue our investments. We enter into transactions only with issuers that have a long-term debt rating of no less than AA by Standard & Poor’s and Aa2 by Moody’s. For short-term debt (a maturity date less than 365 days), the issuer must have no less than an A1 Standard & Poor’s and a P1 Moody’s credit rating. In addition, we limit the amount of investment credit exposure with any one issuer.
Investments with maturities of one year or less are contained in the balance sheet line item “Short-term investments” and those beyond one year are contained in the balance sheet line item “Long-term investments.”
Available-for-Sale Investments—Investments designated as available-for-sale (“AFS”) are reported at fair value. We record the unrealized gains and losses, net of tax, in shareholders’ equity as a component of accumulated other comprehensive income (“OCI”). We determine the cost of securities sold based on the specific identification method. Realized gains or losses are recorded in loss on sale of investments and impairment losses that are determined to be other-than-temporary are recorded in other-than-temporary impairment losses in our consolidated statement of operations.
Held-to-Maturity Investments—Investments designated as held-to-maturity (“HTM”) are reported at amortized cost. Securities are classified as HTM when we have the positive intent and ability to hold the investment until maturity. Gains and losses are not reported in the financial statements until realized or until a decline in value is deemed to be other-than-temporary.
Trading Investments—Trading investments consist exclusively of a portfolio of marketable mutual funds and corporate-owned life insurance under an employee non-qualified deferred compensation plan. We have an offsetting liability recorded for the investments. The funds are recorded at fair value. We recognize changes in fair value currently in gain (loss) on deferred compensation investments, net and we record changes in the liability in selling, general and administrative expense. In general, the compensation expense (benefit) is substantially offset by the gains and losses on the investment. We classify these deferred compensation investments as other non-current assets since we have no plan or intent of liquidating or otherwise using these securities in our business operations. We classify these deferred compensation liabilities as a component of accrued compensation.
Fair Value Measurements—In order to determine the fair value of our assets and liabilities, we utilize three levels of inputs, focusing on the most observable inputs when available. Observable inputs are generally developed based on market data obtained from independent sources, whereas unobservable inputs reflect our assumptions about what market participants would use to value the asset or liability, based on the best information available in the circumstances. The three levels of inputs are as follows:
Level 1—Quoted prices in active markets which are unadjusted and accessible as of the measurement date for identical, unrestricted assets or liabilities;
Level 2—Quoted prices in markets that are not active or for which all significant inputs are observable, either directly or indirectly;
Level 3—Prices or valuations that require inputs that are unobservable and significant to the overall fair value measurement.
If we use more than one level of input that significantly affects fair value, we include the fair value under the lowest input level used.
Financial Instruments and Derivatives—We enter into derivative instruments to manage currency and interest rate risks. These instruments include derivatives designated as hedging instruments as required by the Financial Accounting Standards Board (“FASB”) Accounting Standards Codification (“ASC”) Topic 815, Derivatives and Hedging, and those utilized as economic hedges. We use interest rate-related derivative instruments to manage our exposure to fluctuations of interest rates, as well as foreign currency derivatives to manage exposure to foreign currency fluctuations. By entering into these instruments, we are exposed from time to time to market risk and credit risk.
41
Market risk is the adverse effect on the value of a financial instrument that results from a change in interest rates or fluctuations in foreign currency rates. We minimize this market risk by establishing and monitoring parameters that limit the types and degree of market risk that may be undertaken. Credit risk is the failure of the counterparty to perform under the terms of the derivative contract. The counterparties to the agreements relating to our derivative instruments consist of three major international financial institutions with high credit ratings. We do not believe that there is significant risk of nonperformance by these counterparties because we continually monitor the credit ratings of such counterparties. Furthermore, none of our derivative transactions are subject to collateral or other security arrangements and none contain provisions that are dependent on our credit ratings from any credit rating agency. While the contract or notional amounts of derivative financial instruments provide one measure of the volume of these transactions, they do not represent the amount of our exposure to credit risk. The amounts potentially subject to credit risk (arising from the possible inability of counterparties to meet the terms of their contracts) are generally limited to the amounts, if any, by which the counterparties’ obligations under the contracts exceed our obligations to the counterparties. As a result of the above considerations, we do not consider the risk of counterparty default to be significant.
We record the fair value of our derivative financial instruments in the consolidated financial statements in other current assets or other accrued expenses, regardless of the purpose or intent for holding the derivative contract. We account for these instruments based on whether they meet the criteria for designation as hedging transactions, either as cash flow or fair value hedges. A hedge of the exposure to variability in the cash flows of an asset or a liability, or of a forecasted transaction, is referred to as a cash flow hedge. A hedge of the exposure to changes in fair value of an asset or a liability, or of an unrecognized firm commitment, is referred to as a fair value hedge. The criteria for designating a derivative as a hedge include the instrument’s effectiveness in risk reduction and, in most cases, a one-to-one matching of the derivative instrument to its underlying transaction.
Changes in the fair value of derivative instruments designated as a cash flow hedge are recorded in OCI to the extent the derivative instrument is effective. Changes in the fair values of derivatives not designated for hedge accounting and any ineffectiveness measured in designated hedge transactions are reported in earnings as they occur. Gains and losses on derivatives not designated as hedges are recognized currently in earnings and generally offset changes in the values of related assets, liabilities or debt. Intersil uses foreign exchange contracts to economically hedge forecasted foreign cash flow commitments up to six months. Hedges on forecasted foreign cash flow commitments do not qualify for deferral, as the hedges are not related to a specific, identifiable transaction. Therefore, gains and losses on changes in the fair market value of the foreign exchange contracts are recognized currently in cost of revenue.
Foreign Exchange Exposure Management—We purchase U.S. dollar call options to offset the impact of changes in foreign currency exchange rates on our operations, assets and liabilities that are denominated in currencies other than the U.S. dollar, primarily the Euro. We enter into these foreign currency exchange contracts to support transactions made in the normal course of business and accordingly, the contracts are not speculative in nature. We use foreign exchange contracts to economically hedge anticipated foreign cash flow commitments up to six months. We recognize changes in the fair value of these undesignated hedges in earnings immediately, which generally offset the changes in the value of the foreign currency denominated assets or liabilities being economically hedged.
Interest Rate Exposure Management—We periodically use interest rate swaps to effectively convert our variable interest rate to a fixed rate. The changes in the fair value of the swaps are recorded in OCI to the extent that the swap is effective. Any ineffectiveness will be recorded in income. We currently have no outstanding swap contracts in place.
Trade Receivables—Trade receivables are recorded at net realizable value or the amount that we expect to collect on our gross customer trade receivables. As of December 28, 2012, we maintained an allowance of approximately 0.1% of gross trade receivables (also approximately 0.1% as of December 30, 2011) in addition to specific allowances for receivables with known collection problems due to circumstances such as bankruptcy or customer disputes. Collection problems are identified using an aging of receivables analysis based on invoice due dates and other information. When items are deemed uncollectible, we charge them against the allowance for collection losses. We provide for estimated losses from collection problems in the current period, as a component of sales. We utilize credit limits, ongoing evaluation and trade receivable monitoring procedures to reduce the risk of credit loss. Credit is extended based on an evaluation of the customer’s financial condition and collateral is generally not required.
Inventories—Inventories are carried at the lower of standard cost (which approximates actual cost, determined by the first-in-first-out method) or market. Inventory adjustments establish a new cost basis and are considered permanent even in instances where the costs are recoverable. Standard cost is used to relieve inventory and charge cost of revenues upon the related sale. Cost elements include purchased and manufactured materials, direct and indirect labor, plant overheads, contracted services such as test, assembly and packaging and shipping costs. Also included in inventory are amounts of allocated administrative costs.
42
Property, Plant and Equipment—Buildings, machinery and equipment are carried at cost, less accumulated depreciation and impairment charges, if any. We expense repairs and maintenance costs that do not extend an asset’s useful life or increase an asset’s capacity. Depreciation is computed using the straight-line method over the estimated useful life of the asset. We lease certain facilities under operating leases and record the effective rental expense in the appropriate period on the straight-line method.
Asset Impairment—We recognize impairment losses on long-lived assets when indicators of impairment exist and our estimate of undiscounted cash flows generated by those assets is less than the assets’ carrying amounts. The impairment loss is measured by comparing the fair value of the asset to its carrying amount. Fair value is estimated based on discounted future cash flows or market value, if available. Assets that qualify as held for sale are stated at the lower of the assets’ carrying amount or fair value and depreciation is no longer recognized.
Goodwill— Goodwill is an indefinite-lived intangible asset that is not amortized, but instead is tested for impairment annually or more frequently if indicators of impairment exist. We perform a goodwill impairment analysis using the two-step method on an annual basis and whenever events or changes in circumstances indicate that the carrying value may not be recoverable. The recoverability of goodwill is measured at the reporting unit level by comparing the reporting unit’s carrying amount, including goodwill, to the fair market value of the reporting unit. We have one operating segment (reportable segment) with three reporting units for purposes of the analysis – analog & mixed-signal, consumer and power management.
The first step of the goodwill impairment test (“Step One”) is to identify potential impairment. This involves comparing the fair value of each reporting unit with its carrying amount, including goodwill. If the fair value of a reporting unit exceeds the carrying amount, the goodwill of the reporting unit is considered not impaired and the second step of the impairment test is unnecessary. If the carrying amount of a reporting unit exceeds its fair value, the second step of the impairment test (“Step Two”) is performed to measure the amount of impairment loss, if any.
Step Two involves comparison of the implied fair value of the reporting unit goodwill with the carrying amount of that goodwill. If the carrying amount of the reporting unit goodwill exceeds the implied fair value of that goodwill, an impairment loss would be recognized in an amount equal to that excess. The loss recognized cannot exceed the carrying amount of the goodwill. Once a goodwill impairment loss is recognized, the adjusted carrying amount becomes the new accounting basis.
Purchased Intangibles—Purchased intangibles are definite-lived intangible assets which are amortized on a straight-line basis over their estimated useful lives. Purchased intangibles include intangible assets subject to amortization, which are our developed technologies, backlog, customer relationships and intellectual property. We review long-lived assets for impairment whenever events or changes in circumstances indicate that the carrying amount of such assets may not be recoverable. We measure recoverability of long-lived assets by comparing the carrying amount of the asset group to the future undiscounted net cash flows expected to be generated by those assets. If such assets are considered to be impaired, we recognize an impairment charge for the amount by which the carrying amounts of the assets exceeds the fair value of the assets.
Income Taxes—We follow the liability method of accounting for income taxes. Current income taxes payable and receivable and deferred income taxes resulting from temporary differences between the financial statements and the tax basis of assets and liabilities are separately classified on the consolidated balance sheets.
Uncertain tax positions and unrecognized tax benefits (“UTBs”)—We record our tax expense based on various probabilities of sustaining certain tax positions, using a recognition threshold and measurement attribute for the financial statement recognition and measurement of a tax position taken or expected to be taken in a tax return. We record our UTBs as a component of non-current income taxes payable, unless resolution is expected within one year.
Applicable guidance requires us to record our tax expense based on various estimates of probabilities of sustaining certain tax positions. As a result of this and other factors, our estimate of tax expense could change.
We classify accrued interest and penalties on income tax matters in the liabilities section of the balance sheet as income taxes payable. When the interest and penalty portions of such uncertain tax positions are adjusted, it is classified as income tax expense. All of the uncertain tax positions and UTBs as of December 28, 2012 would impact our effective tax rate should they be recognized.
43
Restructuring—Historically, most of our restructuring costs are employee related costs. We record restructuring charges when severance obligations are probable, reasonably estimable and the vested right attributable to the employees’ service is already rendered. We recognize a liability for costs associated with exit or disposal activities when a liability is incurred rather than when an exit or disposal plan is approved.
Revenue Recognition—Revenue is generally recognized when a product is shipped, provided that persuasive evidence of a sales arrangement exists, the price is fixed or determinable, title and risk has transferred, collection of resulting receivables is reasonably assured, there are no customer acceptance requirements and there are no remaining significant obligations. Customers typically provide a customer request date (“CRD”) which indicates the preferred date for receipt of the ordered products. Based on estimated transit time and other logistics, we may deliver products to the carrier in advance of the CRD and recognize revenue from the sale of such products at the time of shipment. Generally, we defer revenue recognition when the shipment occurs more than 10 days in advance of the CRD.
Shipments to distributors are made under agreements which provide for certain pricing adjustments (referred to as “ship and debit”) and limited product return privileges, under a stock rotation provision. Many of our sales to distributors are invoiced at list price and the final price is set via ship and debit credits at the time of resale. The distributor may also receive additional price protection on a percentage of unsold inventories they hold. Accordingly, we make estimates of price adjustments based upon inventory reported by distributors as of the balance sheet date and record this as a distributor allowance. We rely on historical distributor allowances to estimate these adjustments. Distributors may also receive allowances for certain parts returned under a stock rotation provision of the distributor agreement. We estimate the stock rotation provision based on the percentage of sales made to distributors and historical returns.
For certain distributors, we defer recognition until the distributors resell the products to their end customer (“sell-through distributor”). Revenue at published list price and cost of revenue to sell-through distributors are deferred until either the product is resold by the distributor or, in certain cases, return privileges terminate, at which time revenue and cost of revenue are recorded in the statement of operations. The final price is also subject to ship and debit credits, reducing the final amount recorded in revenue at resale.
The following table summarizes the deferred income balance, primarily consisting of sell-through distributors (in millions):
|
|
|
As of December 28, 2012 |
|
As of December 30, 2011 |
|
Deferred revenue at published list price |
|
$ 12.3 |
|
$ 11.4 |
|
Deferred cost of revenue |
|
(2.7) |
|
(2.8) |
|
Deferred income |
|
$ 9.6 |
|
$ 8.6 |
We also reduce revenue based on an analysis of historical returns related to accommodation and warranty related returns. Accommodation returns are those we are not contractually obligated to accept for credit. We believe we can make reasonable and reliable estimates of future returns and distributor price adjustments. Ship and debit, stock rotation, accommodation and warranty returns are included in the allowances to trade receivables on the accompanying consolidated balance sheets.
The following table summarizes the relationship between shipments, allowances and reported revenue (in millions):
|
|
|
|
|
|
|
|
|
|
|
Year ended |
||||
|
|
|
December 28, 2012 |
|
December 30, 2011 |
|
December 31, 2010 |
|
Gross revenue |
|
$ 701.9 |
|
$ 829.8 |
|
$ 865.1 |
|
Allowances and deferrals |
|
(94.0) |
|
(69.3) |
|
(42.7) |
|
Revenue |
|
$ 607.9 |
|
$ 760.5 |
|
$ 822.4 |
44
In 2012 and 2011, we entered into price protection agreements with additional international distributors to solidify our relationships and stabilize prices across geographic regions.
Distributors provide us periodic data regarding the product, price, quantity, and end customer when products are resold as well as the quantities of our products they still have in stock. We must use estimates and apply judgment to reconcile distributors' reported inventories to their activities. Any error in our judgment could lead to inaccurate reporting of our revenue, cost of revenue, trade receivable, deferred income, and net income (loss).
Warranty—Intersil provides for the estimated cost of product warranties at the time revenue is recognized. While we engage in extensive product quality programs and processes, including actively monitoring and evaluating the quality of our suppliers, the estimated warranty obligation is affected by ongoing product failure rates and material usage costs incurred in correcting a product failure. Actual product failure rates or material usage costs that differ from estimates result in revisions to the estimated warranty liability. We warrant for a limited period of time that our products will be free from defects in material workmanship and possess the electrical characteristics to which we have committed. We estimate warranty allowances based on historical warranty experience. We track returns by type and specifically identify those returns that were based on product failures and similar occurrences.
Research and Development—Research and development costs consist of the cost of designing, developing and testing new or significantly enhanced products and are expensed as incurred.
Advertising Expense—Advertising costs are expensed in the period incurred. Advertising expense was $6.3 million, $6.7 million and $6.0 million in 2012, 2011 and 2010, respectively.
Equity-based Compensation—Our equity based compensation plans allow several forms of equity compensation including stock options (“Options”), restricted and deferred stock awards (“Awards”) and employee stock purchase plans (“ESPPs”). The 2008 Equity Compensation Plan (“2008 Plan”) includes several available forms of stock compensation of which only Options and Awards have been granted to date. Awards issued consist of deferred stock units and restricted stock units, which may differ in regard to the timing of the related prospective taxable event to the recipient.
We also have the 2000 ESPP whereby eligible employees can purchase shares of Intersil common stock through payroll deductions at a price not less than 85% of the market value of the stock on specified dates, with no lookback provision.
Stock-based compensation cost is measured at the grant date, based on the fair value of the awards ultimately expected to vest, and is recognized as an expense, on a straight-line basis, over the requisite service period. We use a binomial lattice model to measure the fair value of Options and a Monte-Carlo simulation to estimate the fair value of Options and Awards that include market conditions. Both models utilize various inputs with respect to expected lives, risk-free interest rates, historical volatility and dividend yield.
ASC 718 also requires forfeitures to be estimated at the time of grant and revised if necessary in subsequent periods if actual forfeitures or vesting differ from those estimates. Such revisions could have a material effect on our operating results. The assumptions we use in the valuation model are based on subjective future expectations combined with management judgment. If any of the assumptions used in the model changes, stock-based compensation for future awards may differ materially compared to the awards granted previously.
Most Options granted vest 25% in the first year and quarterly thereafter for three or four years and generally have seven year contract lives. For Awards, the expected life for amortization of the grant date fair value is the vesting term, generally three years in the case of deferred stock units and four years in the case of restricted stock units. We issue new shares of common stock upon the exercise of Options.
Grants with a performance condition requirement are evaluated periodically for the estimated number of shares that might be issued when fully vested. The fair value measurement and its effect on income is then adjusted as a result of these periodic evaluations. If our estimate of the number of shares expected to be earned (vested) changes, we will be required to adjust the amount of equity-based compensation recognized for the service provided to the date of the change in estimate, on a cumulative basis, to reflect the higher or lower number of shares expected to vest. Such adjustments could materially increase or decrease the amount of equity-based compensation recognized in any period, particularly the period of the change in the estimate, and in aggregate as compared to the initial fair value measurement. Therefore, the use of performance-based forms of equity-based compensation can cause more volatility in our net income in various periods and in aggregate.
45
Loss Contingencies—We estimate and accrue loss contingencies at the point that the losses become probable. For litigation, our practice is to include an estimate of legal costs for defense.
Retirement Benefits—We provide retirement benefits to substantially all employees primarily through a defined contribution plan to which both Intersil and its employees contribute (a qualified retirement plan under Internal Revenue Code Section 401(k)). Contributions by Intersil are based on a dollar-for-dollar match of employees’ contributions up to a certain predetermined percentage. Employees fully vest in the matching contributions after five years of service.
We provide retirement benefits under statutorily required plans for employees in certain countries outside the U.S. Accrued liabilities related to these unfunded plans were $5.1 million as of December 28, 2012 and $4.3 million as of December 30, 2011.
Retirement plans expense was $7.5 million, $8.1 million and $7.1 million for 2012, 2011 and 2010, respectively, which is primarily the matching contributions to employees’ 401(k) accounts.
Other Comprehensive (Loss) Income—Comprehensive (loss) income is the change in shareholders’ equity that is not the result of investments by or distributions to shareholders. Our OCI elements are as follows:
Currency Translation Adjustments—Our international subsidiaries predominately use the appropriate local currency in their businesses as their functional currency. Assets and liabilities are translated at current rates of exchange, and income and expense items are translated at the weighted-average exchange rate for the year. The resulting translation adjustments are recorded as a separate component of shareholders’ equity in OCI. A weakening U.S. dollar will produce a translation gain. Conversely, a strengthening U.S. dollar will produce a translation loss. Cumulative translation adjustments in accumulated OCI were $3.2 million, $3.0 million and $3.0 million as of December 28, 2012, December 30, 2011 and December 31, 2010, respectively.
Unrealized Gains and Losses on AFS Investments—Changes to investment securities classified as AFS that are deemed to be temporary in nature are recognized by a charge to OCI.
Unrealized Gains and Losses on Interest Rate Swaps—We designated our interest rate swaps as cash flow hedges to hedge the risk of changes in the benchmark interest. The fair values of the swaps at inception were zero and subsequent changes in the fair values of the swaps are recorded in OCI, net of tax benefit, to the extent they are effective in offsetting the variability of the hedged cash flows.
Segment Information—We report our results in one reportable segment. We design, develop, manufacture and market high-performance analog, mixed-signal, and power management ICs. Our chief executive officer is our chief operating decision maker.
Use of Estimates—The financial statements have been prepared in conformity with accounting principles generally accepted in the United States and require management to make estimates and assumptions that affect the reported amounts of assets and liabilities and disclosure of contingent assets and liabilities as of the date of the financial statements and the reported amounts of revenue and expenses during the reporting period. Actual results could differ from those estimates.
NOTE 3—INVESTMENTS
Our investments are classified as follows (in millions):
|
|
|
|
|
|
|
|
|
|
|
|
|
|
|
As of December 28, 2012 |
||||||||
|
|
|
Amortized cost |
|
Gross unrealized gains |
|
Gross unrealized losses |
|
Fair value |
|
Maturity range (in years) |
|
|
|
|
|
|
|
|
|
|
|
|
|
|
|
|
||||||||
|
Short-term Investments |
|
|
|
|
|
|
|
|
|
|
|
Bank time deposits (AFS) |
|
$ 4.8 |
|
$ - |
|
$ - |
|
$ 4.8 |
|
<1 |
|
|
|
|
|
|
|
|
|
|
|
|
|
|
|
|
|
|
|
|
|
|
|
|
|
|
|
|
|
|
|
|
|
|
|
|
|
|
|
As of December 30, 2011 |
||||||||
|
|
|
Amortized cost |
|
Gross unrealized gains |
|
Gross unrealized losses |
|
Fair value |
|
Maturity range (in years) |
|
|
|
|
|
|
|
|
|
|
|
|
|
|
|
|
||||||||
|
Short-term Investments |
|
|
|
|
|
|
|
|
|
|
|
Bank time deposits (AFS) |
|
$ 26.5 |
|
$ - |
|
$ - |
|
$ 26.5 |
|
<1 |
|
Long-term Investments |
|
|
|
|
|
|
|
|
|
|
|
Bank time deposits (AFS) |
|
$ 4.8 |
|
$ - |
|
$ - |
|
$ 4.8 |
|
1-2 |
46
We classify bank time deposits as AFS and record them at fair value.
NOTE 4—FAIR VALUE MEASUREMENTS
We determine fair value on the following assets and liabilities using these input levels (in millions):
|
|
|
|
|
|
|
|
|
|
|
Fair value as of December 28, 2012 using: |
||||
|
|
|
Total |
|
Quoted prices in active markets for identical assets (Level 1) |
|
Significant other observable inputs (Level 2) |
|
Assets |
|
|
|
|
|
|
|
Short-term investments: |
|
|
|
|
|
|
|
Bank time deposits |
|
$ 4.8 |
|
$ - |
|
$ 4.8 |
|
Other non-current assets: |
|
|
|
|
|
|
|
Deferred compensation investments |
|
11.1 |
|
0.4 |
|
10.7 |
|
Total assets measured at fair value |
|
$ 15.9 |
|
$ 0.4 |
|
$ 15.5 |
|
|
|
|
|
|
|
|
|
|
|
Fair value as of December 30, 2011 using: |
||||
|
|
|
Total |
|
Quoted prices in active markets for identical assets (Level 1) |
|
Significant other observable inputs (Level 2) |
|
Assets |
|
|
|
|
|
|
|
Short-term investments: |
|
|
|
|
|
|
|
Bank time deposits |
|
$ 26.5 |
|
$ - |
|
$ 26.5 |
|
Prepaid expenses and other current assets: |
|
|
|
|
|
|
|
Foreign exchange options |
|
1.1 |
|
- |
|
1.1 |
|
Long-term investments: |
|
|
|
|
|
|
|
Bank time deposits |
|
4.8 |
|
- |
|
4.8 |
|
Other non-current assets: |
|
|
|
|
|
|
|
Deferred compensation investments |
|
11.2 |
|
1.4 |
|
9.8 |
|
Total assets measured at fair value |
|
$ 43.6 |
|
$ 1.4 |
|
$ 42.2 |
|
|
|
|
|
|
|
|
|
Liabilities |
|
|
|
|
|
|
|
Other accrued expenses: |
|
|
|
|
|
|
|
Interest rate swap |
|
$ 0.6 |
|
$ - |
|
$ 0.6 |
There were no transfers into or out of Level 1 and Level 2 financial assets and liabilities during 2012 or 2011.
47
For actively traded securities, bank time deposits, foreign exchange contracts and interest rate swaps, we generally rely upon the valuations as provided by the third-party custodian of these assets or liabilities.
NOTE 5—FINANCIAL INSTRUMENTS AND DERIVATIVES
The fair value of our hedging instruments in the consolidated balance sheet was as follows (in millions):
|
|
|
|
|
|
|
|
|
|
|
|
|
Fair value as of |
||
|
|
|
Balance sheet location |
|
December 28, 2012 |
|
December 30, 2011 |
|
Derivatives Not Designated as Hedging Instruments |
|
|
|
|
|
|
|
Asset Derivatives |
|
|
|
|
|
|
|
Foreign exchange options |
|
Prepaid expenses and other current assets |
|
$ - |
|
$ 1.1 |
|
|
|
|
|
|
|
|
|
Derivatives Designated as Hedging Instruments |
|
|
|
|
|
|
|
Liability Derivatives |
|
|
|
|
|
|
|
Interest rate swap agreements |
|
Other accrued expenses |
|
$ - |
|
$ 0.6 |
The effects of derivatives not designated as hedging instruments on the consolidated statements of operations are as follows (in millions):
|
|
|
|
|
|
|
|
|
|
|
|
|
|
|
Year ended |
||||
|
|
|
Income statement location |
|
December 28, 2012 |
|
December 30, 2011 |
|
December 31, 2010 |
|
Loss on foreign exchange options |
|
Cost of revenue |
|
$ (0.7) |
|
$ (0.8) |
|
$ (1.1) |
The effects of derivative instruments in cash flow hedging relationships on the consolidated statements of operations are as follows (in millions):
|
|
|
|
|
|
|
|
|
|
|
|
|
|
|
Year ended |
||||
|
|
|
Income statement location |
|
December 28, 2012 |
|
December 30, 2011 |
|
December 31, 2010 |
|
Interest rate swap agreements |
|
|
|
|
|
|
|
|
|
Loss recognized in accumulated OCI (effective portion), net of tax |
|
|
|
$ - |
|
$ (1.2) |
|
$ (1.0) |
|
Loss reclassified from accumulated OCI to earnings (effective portion) |
|
Interest expense and fees |
|
$ (6.5) |
|
$ (0.1) |
|
$ - |
|
Loss recognized in earnings (ineffective portion) |
|
Interest expense and fees |
|
$ (0.1) |
|
$ (0.2) |
|
$ - |
In 2011, we terminated our prior interest rate hedge transaction (the “Old Swap”), and settled the interest rate swap agreement for $3.2 million. As of December 30, 2011, we had approximately $1.8 million, net of tax, remaining in accumulated OCI, to be reclassified into earnings as a component of interest expense commensurate with the forecasted interest payments.
During the third quarter of 2011, we entered into additional interest rate swap transactions (the “New Swaps”) with a notional value of $150.0 million to hedge a portion of the risk of changes in the benchmark interest rate of the one-month London Interbank Offered Rate (“LIBOR”) related to our new outstanding revolving credit facility. Under the terms of the New Swaps, we effectively converted $150.0 million of our variable-rate revolving credit facility to fixed interest rates through August 8, 2016.
48
During the fourth quarter ended December 28, 2012, we repaid the outstanding balance of our revolving credit facility. As a result, we determined that the forecasted interest payments associated with the original hedge transactions would no longer occur. The remaining balance in OCI, before tax, of $5.8 million, related to the effective portion of the loss on the Old Swap and New Swaps, was reclassified to interest expense and fees. We further settled the New Swaps for $3.7 million.
The tables below describe total open foreign exchange contracts (all are options to sell foreign currencies) (in millions):
|
|
|
|
|
|
|
|
|
|
|
Year ended |
||||
|
|
|
December 28, 2012 |
|
December 30, 2011 |
|
December 31, 2010 |
|
Unrealized (loss) gain on foreign exchange contracts |
|
$ (0.7) |
|
$ 0.6 |
|
$ (0.9) |
|
Purchases and sales of foreign exchange contracts |
|
31.4 |
|
41.0 |
|
42.3 |
|
Notional amount of open contracts as of year end |
|
12.4 |
|
20.2 |
|
19.5 |
|
Notional Amount of Open Foreign Currency Contracts |
|
Euros |
|
U.S. Dollars |
|
Range of Maturities |
|
|
(€ and $ in millions) |
|||||
|
December 28, 2012 |
|
€ 10.0 |
|
$ 12.4 |
|
1 – 5 months |
|
December 30, 2011 |
|
€ 15.0 |
|
$ 20.2 |
|
1 – 6 months |
NOTE 6—INVENTORIES
Inventories are summarized below (in millions):
|
|
|
As of |
|
As of |
|
|
|
December 28, 2012 |
|
December 30, 2011 |
|
Finished products |
|
$ 25.2 |
|
$ 34.6 |
|
Work in process |
|
46.8 |
|
58.6 |
|
Raw materials |
|
2.9 |
|
4.7 |
|
Total inventories |
|
$ 74.9 |
|
$ 97.9 |
As of December 28, 2012, Intersil was committed to purchase $15.4 million of raw material inventory from suppliers.
NOTE 7—PROPERTY, PLANT AND EQUIPMENT
Property, plant and equipment are summarized below (in millions):
|
|
As of |
|
As of |
|
|
December 28, 2012 |
|
December 30, 2011 |
|
Land |
$ 1.7 |
|
$ 1.7 |
|
Buildings and leasehold improvements |
61.8 |
|
59.2 |
|
Machinery and equipment |
250.0 |
|
252.1 |
|
Total property, plant and equipment |
313.5 |
|
313.0 |
|
Accumulated depreciation and leasehold amortization |
(228.1) |
|
(222.0) |
|
Total property, plant and equipment, net |
$ 85.4 |
|
$ 91.0 |
49
The estimated useful lives of buildings, which include leasehold improvements, range between 10 and 30 years. The estimated useful lives of machinery and equipment range between three and eight years. Depreciation expense was $19.5 million, $22.1 million and $21.0 million for 2012, 2011 and 2010, respectively. Non-cash accruals for purchases of property, plant and equipment were $1.5 million, $0.4 million and $0.1 million for 2012, 2011 and 2010, respectively. As of December 28, 2012 we had open capital asset purchase commitments of $17.8 million.
NOTE 8—GOODWILL AND PURCHASED INTANGIBLES
Goodwill—The following table summarizes changes in net goodwill balances for our one reportable segment (in millions):
|
|
|
As of |
|
As of |
|
|
|
December 28, 2012 |
|
December 30, 2011 |
|
Gross goodwill balance as of beginning of period |
|
$ 1,720.1 |
|
$ 1,719.8 |
|
Accumulated impairment charge (recorded in 2008) |
|
(1,154.7) |
|
(1,154.7) |
|
Net goodwill balance as of beginning of period |
|
565.4 |
|
565.1 |
|
Purchase of Techwell |
|
- |
|
1.4 |
|
Other adjustments to goodwill for acquisitions |
|
- |
|
(1.1) |
|
Goodwill balance as of end of period |
|
$ 565.4 |
|
$ 565.4 |
We recorded adjustments related primarily to deferred tax accruals for Techwell and other acquisitions during 2011.
On July 2, 2011, we reorganized our reporting units, increasing from two reporting units to three reporting units – analog & mixed-signal, power management, and consumer. We performed a fair value analysis to allocate our goodwill at the time of the reorganization and performed an impairment test of goodwill as of the date of reorganization. Based on our analysis, no impairment was indicated.
We perform an annual test of goodwill in the fourth quarter of each year. In 2012, 2011 and 2010, we recorded no impairment of goodwill based on our analysis. The fair value of the reporting units was in excess of the carrying value as of September 29, 2012, the first day of our fourth quarter and the date at which we performed our test.
If we experience significant declines in our stock price, market capitalization, future expected cash flows, significant adverse changes in the business climate or continuing slower growth rates, we may need to perform additional impairment analysis of our goodwill in future periods prior to our annual test in the fourth quarter. We can provide no assurance that the significant assumptions used in our analysis will not change substantially and any additional analysis could result in additional impairment charges.
Purchased intangibles—Substantially all of our purchased intangibles consist of multiple elements of developed technology which had estimated useful lives of five to nine years at the time of purchase. Other purchased intangibles consist of other identifiable assets, primarily customer relationships, with estimated useful lives of five to six years.
|
|
|
|
|
|
|
|
|
|
|
|
|
As of December 28, 2012 |
|
As of December 30, 2011 |
||||
|
|
|
Gross carrying amount |
|
Accumulated amortization |
|
Gross carrying amount |
|
Accumulated amortization |
|
|
|
|
|
|
|
|
|
|
|
|
|
(in millions) |
||||||
|
Definite-lived: developed technologies |
|
$ 113.6 |
|
$ 58.3 |
|
$ 125.9 |
|
$ 51.3 |
|
Definite-lived: other |
|
53.0 |
|
25.3 |
|
53.6 |
|
16.0 |
|
Total |
|
$ 166.6 |
|
$ 83.6 |
|
$ 179.5 |
|
$ 67.3 |
We recorded amortization expense as follows (in millions):
|
|
|
|
|
|
|
|
|
|
|
Year Ended |
||||
|
By statement of operations line item |
|
December 28, 2012 |
|
December 30, 2011 |
|
December 31, 2010 |
|
Amortization of purchased intangibles |
|
$ 29.2 |
|
$ 26.8 |
|
$ 27.7 |
|
Cost of revenue |
|
$ - |
|
$ - |
|
$ 0.1 |
50
Expected amortization expense by year to the end of the current amortization schedule is as follows (in millions):
|
To be recognized in: |
|
|
|
|
Fiscal year 2013 |
|
|
$ 25.1 |
|
Fiscal year 2014 |
|
|
23.4 |
|
Fiscal year 2015 |
|
|
16.8 |
|
Fiscal year 2016 |
|
|
9.0 |
|
Fiscal year 2017 |
|
|
6.8 |
|
Thereafter |
|
|
1.9 |
|
Total expected amortization expense |
|
|
$ 83.0 |
During 2011 and 2012, we implemented and substantially completed restructuring plans to reorganize certain operations and reduce our global workforce and other operating costs. We recorded restructuring related costs of $10.5 million in 2012 and $4.1 million in 2011 primarily related to severance, lease exit, legal and professional costs.
The amounts below relating to the restructuring are included in other accrued expenses (in millions):
|
|
|
As of |
|
As of |
|
|
|
December 28, 2012 |
|
December 30, 2011 |
|
Beginning balance |
|
$ 1.3 |
|
$ - |
|
Costs incurred |
|
|
|
|
|
Severance costs |
|
7.1 |
|
4.1 |
|
Lease exit costs |
|
0.8 |
|
- |
|
Other costs |
|
0.3 |
|
- |
|
Cash payments |
|
|
|
|
|
Severance payments |
|
(8.2) |
|
(2.8) |
|
Lease exit payments |
|
(0.2) |
|
- |
|
Ending balance |
|
$ 1.1 |
|
$ 1.3 |
NOTE 10—INCOME TAXES
We are subject to filing requirements in the United States Federal jurisdiction and in many state and foreign jurisdictions for numerous consolidated and separate entity income tax returns. We are no longer subject to examination in the U.S. for years prior to 2008.
(Loss) income before income taxes is allocated between domestic and foreign jurisdictions as follows (in millions):
|
|
|
|
|
|
|
|
|
|
|
Year Ended |
||||
|
|
|
December 28, 2012 |
|
December 30, 2011 |
|
December 31, 2010 |
|
(Loss) income before income taxes: |
|
|
|
|
|
|
|
Domestic |
|
$ 12.4 |
|
$ 19.3 |
|
$ 32.7 |
|
Foreign |
|
(20.1) |
|
34.1 |
|
79.1 |
|
(Loss) income before income taxes |
|
$ (7.7) |
|
$ 53.4 |
|
$ 111.8 |
Income tax expense (benefit)—The provision for income taxes is summarized below (in millions):
51
|
|
|
|
|
|
|
|
|
|
|
Year Ended |
||||
|
|
|
December 28, 2012 |
|
December 30, 2011 |
|
December 31, 2010 |
|
Current taxes: |
|
|
|
|
|
|
|
Federal |
|
$ 10.4 |
|
$ (11.2) |
|
$ 69.6 |
|
State |
|
3.6 |
|
(0.1) |
|
9.1 |
|
Foreign |
|
2.0 |
|
5.5 |
|
4.0 |
|
|
|
16.0 |
|
(5.8) |
|
82.7 |
|
Deferred taxes: |
|
|
|
|
|
|
|
Federal |
|
20.3 |
|
(0.8) |
|
2.7 |
|
State |
|
(4.9) |
|
(1.7) |
|
- |
|
Foreign |
|
(1.4) |
|
(5.4) |
|
- |
|
|
|
14.0 |
|
(7.9) |
|
2.7 |
|
Income tax expense (benefit) |
|
$ 30.0 |
|
$ (13.7) |
|
$ 85.4 |
As a result of the exercise of non-qualified Options, the disqualifying disposition of incentive Options, the release of Awards and the disqualifying disposition of shares acquired under the ESPP, we realized tax benefits of approximately $1.6 million, $2.5 million and $3.0 million during 2012, 2011 and 2010, respectively.
We currently have a tax holiday in Malaysia resulting in a tax rate of 0%. This tax holiday began on July 1, 2009, and terminates on July 1, 2019. The table below summarizes the effects of operating in Malaysia under our tax holiday (in millions, except per share data).
|
|
|
|
|
|
|
|
|
|
|
Year Ended |
||||
|
|
|
December 28, 2012 |
|
December 30, 2011 |
|
December 31, 2010 |
|
|
|
|
|
|
|
|
|
Tax effects from earnings attributable to Malaysia |
|
$ (5.1) |
|
$ 8.9 |
|
$ 16.8 |
|
|
|
|
|
|
|
|
|
Effect on (loss) earnings per share: |
|
|
|
|
|
|
|
Basic |
|
$ (0.04) |
|
$ 0.07 |
|
$ 0.14 |
|
Diluted |
|
$ (0.04) |
|
$ 0.07 |
|
$ 0.13 |
52
Deferred income taxes—The components of deferred income tax assets and liabilities are as follows (in millions):
|
|
|
|
|
|
|
|
|
|
|
As of December 28, 2012 |
|
As of December 30, 2011 |
||||
|
|
Current |
|
Non-Current |
|
Current |
|
Non-Current |
|
Inventory |
$ 14.6 |
|
$ - |
|
$ 12.9 |
|
$ - |
|
Property, plant and equipment |
- |
|
1.2 |
|
- |
|
1.4 |
|
Accrued expenses |
4.6 |
|
- |
|
5.1 |
|
- |
|
Equity-based compensation |
- |
|
11.3 |
|
- |
|
13.6 |
|
Net operating loss carryforward |
2.2 |
|
24.1 |
|
3.2 |
|
26.4 |
|
Capitalized research and development |
- |
|
4.0 |
|
- |
|
5.9 |
|
Deferred compensation |
- |
|
4.2 |
|
- |
|
4.2 |
|
Deferred revenue |
3.3 |
|
- |
|
3.2 |
|
- |
|
Tax credits |
4.1 |
|
67.1 |
|
22.4 |
|
32.7 |
|
Capital loss carryforward |
- |
|
7.4 |
|
- |
|
7.4 |
|
All other, net |
0.2 |
|
2.1 |
|
0.2 |
|
3.7 |
|
Deferred tax assets |
29.0 |
|
121.4 |
|
47.0 |
|
95.3 |
|
Deferred tax liabilities: intangibles |
- |
|
(0.7) |
|
- |
|
(2.3) |
|
Valuation allowance |
(9.0) |
|
(35.2) |
|
(6.2) |
|
(13.0) |
|
Net deferred tax assets |
$ 20.0 |
|
$ 85.5 |
|
$ 40.8 |
|
$ 80.0 |
The table below summarizes the activity in valuation allowances (in millions):
|
|
|
As of |
|
As of |
|
|
|
December 28, 2012 |
|
December 30, 2011 |
|
Beginning balance |
|
$ 19.2 |
|
$ 1.9 |
|
Increases related to state attributes |
|
26.3 |
|
10.6 |
|
(Decreases) increases related to foreign net operating losses |
|
(1.3) |
|
0.1 |
|
Increases related to capital losses |
|
- |
|
6.6 |
|
Ending balance |
|
$ 44.2 |
|
$ 19.2 |
During the year ended December 28, 2012, we recorded an additional $30.1 million to our deferred tax assets related to the state R&D tax credits and established an additional $26.3 million valuation allowance after determining that we would not utilize the benefit based on all available evidence.
We completed an analysis of projected future taxable income and determined that all remaining deferred tax assets, including net operating loss carryforwards (“NOLs”) and tax-credit carryforwards, are more likely than not to be realized in the foreseeable future. Therefore, we have not provided any additional valuation allowances on deferred tax assets as of December 28, 2012 and December 30, 2011, other than those described above.
We have gross NOLs of approximately $53.7 million from acquisitions that expire in tax years 2027 through 2028. The annual utilization of these NOLs is limited pursuant to Internal Revenue Code Section 382. We have gross federal R&D credit carryforwards of $25.6 million that will expire in tax years 2028 through 2031.
53
Income tax provision (benefit) reconciliation—A reconciliation of the statutory United States income tax to our effective income tax is as follows ($ in millions):
|
|
|
|
|
|
|
|
|
|
|
|
|
|
Year Ended |
|
||||||
|
|
|
December 28, 2012 |
|
|
December 30, 2011 |
|
|
December 31, 2010 |
|
|
Statutory U.S. income tax rate |
|
35.0 |
% |
|
35.0 |
% |
|
35.0 |
% |
|
Income tax provision reconciliation: |
|
|
|
|
|
|
|
|
|
|
Tax at federal statutory income tax rate |
|
$ (2.7) |
|
|
$ 18.7 |
|
|
$ 39.1 |
|
|
State taxes |
|
1.0 |
|
|
1.0 |
|
|
1.3 |
|
|
Cost (benefit) of earnings subject to tax rates other than U.S. |
|
14.2 |
|
|
(9.5) |
|
|
(20.8) |
|
|
International equity-based compensation |
|
3.0 |
|
|
3.8 |
|
|
4.1 |
|
|
Research credits |
|
(3.9) |
|
|
(27.3) |
|
|
(6.5) |
|
|
Change in valuation allowance |
|
- |
|
|
17.2 |
|
|
0.8 |
|
|
Change in unrecognized tax benefits |
|
20.7 |
|
|
(10.9) |
|
|
68.0 |
|
|
Subpart F—interest & stock gain |
|
0.6 |
|
|
(0.2) |
|
|
1.2 |
|
|
Manufacturing deduction |
|
(0.1) |
|
|
(1.1) |
|
|
(0.8) |
|
|
Amortization of deferred tax charge |
|
(3.0) |
|
|
(3.0) |
|
|
(3.5) |
|
|
Other items |
|
0.2 |
|
|
(2.4) |
|
|
2.5 |
|
|
Total income tax provision (benefit) |
|
$ 30.0 |
|
|
$ (13.7) |
|
|
$ 85.4 |
|
Uncertain tax positions and UTBs
During 2012, we recorded a reduction $6.1 million of potential interest and a reduction of $0.6 million of potential penalties on UTBs in the consolidated statement of operations. During 2011, we recognized $1.3 million of potential interest and a reduction of $3.3 million of potential penalties on UTBs in the consolidated statement of operations. During 2010, we recognized $6.9 million of potential interest and $3.9 million of potential penalties on UTBs in the consolidated statement of operations.
The table below summarizes activity in UTBs (in millions):
|
|
|
As of |
|
As of |
|
|
|
December 28, 2012 |
|
December 30, 2011 |
|
Beginning balance (includes interest and penalties of $12.0 million as of December 30, 2011) |
|
$ 154.4 |
|
$ 166.8 |
|
Increases related to current year tax positions |
|
- |
|
1.8 |
|
Increases related to prior year tax positions |
|
22.1 |
|
8.6 |
|
Decreases related to prior year tax positions |
|
- |
|
(22.8) |
|
Settlements with tax authorities |
|
(63.6) |
|
- |
|
Ending balance (includes interest and penalties of $5.3 million as of December 28, 2012) |
|
$ 112.9 |
|
$ 154.4 |
We are currently under an IRS tax audit for tax years 2008 and 2009. While the audit covers a number of different issues, the focus is largely due to the intercompany pricing of goods and services between different tax jurisdictions. We are required to re-measure our UTBs at each reporting date, and thus, based on the facts and circumstances and progress made with the IRS, we have increased our UTBs by $5.1 million for an election to repatriate cash upon IRS settlement. As the final resolution of the examination process remains uncertain for those years, we continue to provide for the uncertain tax positions based on our best estimate of the ultimate outcome.
During the second quarter of 2012, we reached a settlement with the Internal Revenue Service (“IRS”) Appeals Office on all items under protest for the 2005-2007 tax years. The IRS settlement consisted of a cash payment in the amount of $46.6 million and tax asset utilization of $11.0 million. Under the terms of the settlement, we made an election which allowed for cash repatriation of $162.3 million based on transfer pricing and other adjustments agreed upon with the IRS.
54
During 2012, we reached settlement with state authorities for $6.0 million related to the 2005-2007 appeals settlement.
Within the next 12 months, we estimate that our UTB balance will be reduced by approximately $1.1 million related to the state tax impact of the settlement with the IRS for tax years 2005 through 2007.
Other Income Tax Information
Income taxes paid were $49.4 million, $11.1 million and $21.7 million during 2012, 2011 and 2010, respectively. Interest and penalties paid were $13.5 million during 2012 and minimal in 2011 and 2010.
We have not provided U.S. income taxes on $365.7 million of accumulated undistributed earnings of our international subsidiaries because of our demonstrated intention to permanently reinvest these earnings. Should these earnings be remitted to the U.S. we would be subject to additional U.S. taxes and foreign withholding taxes. Determining the unrecognized deferred tax liability related to investments in these international subsidiaries that are permanently reinvested is not practicable and not expected in the foreseeable future.
On September 1, 2011, we established a new five-year, $325.0 million revolving credit facility (the “Facility”). This Facility replaced our previous $300.0 million six-year term-loan facility and $75.0 million revolving credit facility. The Facility matures on September 1, 2016 and is payable in full upon maturity. We may request to increase the Facility by up to $75.0 million. Under the Facility, $25.0 million is available for the issuance of standby letters of credit, $10.0 million is available as swing line loans and $50.0 million is available for multicurrency borrowings. Amounts repaid under the Facility may be re-borrowed.
The Facility is secured by a first priority lien and security interest in (a) all of the equity interests and intercompany debt of our direct and indirect subsidiaries, except, in the case of foreign subsidiaries, to the extent that such pledge would be prohibited by applicable law or would result in adverse tax consequences, (b) all of our present and future tangible and intangible assets and our direct and indirect subsidiaries (other than immaterial subsidiaries and foreign subsidiaries) and (c) all proceeds and products of the property and assets described in clauses (a) and (b) above. Our obligations under the Facility are guaranteed by our direct and indirect wholly-owned subsidiaries (other than immaterial subsidiaries and foreign subsidiaries).
At our option, loans under the Facility will bear stated interest based on the Base Rate or Eurocurrency Rate, in each case plus the Applicable Rate (respectively, as defined in the credit agreement (the “Credit Agreement”), as amended governing the facility in Exhibit 10.1). The Base Rate will be, for any day, a fluctuating rate per annum equal to the highest of (a) 1/2 of 1.00% per annum above the Federal Funds Rate (as defined in the Credit Agreement), (b) Bank of America’s prime rate and (c) the Eurodollar Rate for a term of one month plus 1.00%. Eurodollar borrowings may be for one, two, three or six months (or such period that is 12 months or less, requested by Intersil and consented to by all the Lenders) and will be at an annual rate equal to the period-applicable Eurodollar Rate plus the Applicable Rate. The Applicable Rate for all revolving loans is based on a pricing grid ranging from 0.75% to 1.75% per annum for Base Rate loans and 1.75% to 2.75% for Eurocurrency Rate loans based on Intersil’s Consolidated Leverage Ratio (as defined in the Credit Agreement).
The fair value of our debt approximates the carrying value as of December 28, 2012 and December 30, 2011.
|
|
|
As of December 28, 2012 |
|
|
As of December 30, 2011 |
|
|
|
|
|
|
|
|
|
|
|
|
(in millions) |
|
|||
|
Outstanding balance |
|
|
|
|
|
|
|
Revolving credit facility |
|
$ - |
|
|
$ 200.0 |
|
|
Actual interest rate in effect |
|
2.71 |
% |
|
2.52 |
% |
55
|
|
|
|
|
|
|
|
|
|
|
|
|
|
Year Ended |
|
||||||
|
|
|
December 28, 2012 |
|
|
December 30, 2011 |
|
|
December 31, 2010 |
|
|
|
|
|
|
|
|
|
|
|
|
|
|
|
(in millions) |
|
||||||
|
Cash paid for interest |
|
$ 3.9 |
|
|
$ 13.0 |
|
|
$ 7.5 |
|
|
Weighted-average interest rate (pre-tax) |
|
2.48 |
% |
|
4.47 |
% |
|
4.80 |
% |
During the year ended December 28, 2012, we obtained two amendments to the Facility which further revised the requirements of certain debt covenants. We incurred fees related to the amendments of approximately $0.9 million, which have also been capitalized as part of the debt issuance costs. During the year ended December 30, 2011, we settled our previous term-loan facility for $278.2 million and recorded a loss on extinguishment of debt for the write-off of unamortized loan fees of $8.4 million.
Letters of Credit: We issue letters of credit during the ordinary course of business through major financial institutions as required by certain vendor contracts. We had outstanding letters of credit totaling $2.2 million as of December 28, 2012, and $2.6 million as of December 30, 2011. The standby letters of credit are secured by short-term bank time deposits.
NOTE 12—INCOME FROM INTELLECTUAL PROPERTY (“IP”) AGREEMENTS
During the fourth quarter ended December 28, 2012, we recorded income of $1.0 million related to the sale of several patents. During the third quarter ended September 28, 2012, we recorded proceeds of $20.0 million, net of $6.6 million of legal costs, related to an IP agreement settling a trade secret misappropriation and patent infringement dispute with another semiconductor company.
NOTE 13—COMMON STOCK AND DIVIDENDS
Common Stock—Intersil shareholders approved an Amended and Restated Certificate of Incorporation in 2005 that restated authorized capital stock to consist of 600 million shares of Intersil Class A common stock, par value $0.01 per share, and two million shares of preferred stock. Holders of Class A common stock are entitled to one vote for each share held. The Board of Directors has broad discretionary authority to designate the terms of the preferred stock should it be issued.
The table below summarizes the Class A common stock activity for all periods presented ($ in millions, except per share amounts; shares in thousands):
|
|
|
|
|
|
|
|
|
|
|
Year Ended |
||||
|
|
|
December 28, 2012 |
|
December 30, 2011 |
|
December 31, 2010 |
|
Beginning balance |
|
126,483 |
|
124,552 |
|
122,816 |
|
Shares issued under stock plans, net of shares withheld for taxes |
|
1,667 |
|
1,931 |
|
1,736 |
|
Repurchase and retirement of common stock |
|
(1,901) |
|
- |
|
- |
|
Ending balance |
|
126,249 |
|
126,483 |
|
124,552 |
|
Dividends paid to shareholders |
|
$ 61.0 |
|
$ 60.3 |
|
$ 59.4 |
|
Dividends paid per share |
|
$ 0.48 |
|
$ 0.48 |
|
$ 0.48 |
Dividends—we have paid a quarterly dividend since September 2003. In January 2013, the Board of Directors declared a dividend of $0.12 per share to be paid in the first quarter of 2013, which if annualized equates to $0.48 per share. Dividends in the future will be declared at the discretion of the Board of Directors upon consideration of business conditions, liquidity and outlook.
56
Share Repurchases—On August 6, 2012, our Board of Directors authorized the repurchase of up to $50.0 million of Intersil’s common stock. The stock repurchase program expires in 12 months and may be limited or terminated at any time before the end of the period without notice. During the year ended December 28, 2012, we repurchased and retired 1.9 million shares under the program at an average price per share of $8.03.
NOTE 14—CONCENTRATION OF RISK AND GEOGRAPHIC INFORMATION
Geographic Information—We operate primarily within the high-performance analog, mixed-signal, and power management markets of the semiconductor industry. Substantially all revenue results from the sale of semiconductor products. We eliminate all intercompany revenue and balances.
The table below summarizes operations by geographic area (in millions):
|
|
|
|
|
|
|
|
|
|
|
Year Ended |
||||
|
|
|
December 28, 2012 |
|
December 30, 2011 |
|
December 31, 2010 |
|
United States operations |
|
|
|
|
|
|
|
Revenue |
|
$ 85.4 |
|
$ 102.9 |
|
$ 138.0 |
|
Tangible long-lived assets |
|
54.1 |
|
52.5 |
|
58.2 |
|
International operations |
|
|
|
|
|
|
|
Revenue |
|
$ 522.5 |
|
$ 657.6 |
|
$ 684.4 |
|
Tangible long-lived assets |
|
31.3 |
|
38.5 |
|
45.3 |
Concentration of Operational Risk—We market our products for sale to customers, including distributors, primarily in Asia and the United States. We extend credit based on an evaluation of the customer’s financial condition and we generally do not require collateral. The table below shows revenue by country where such value exceeded 10% in any one year:
|
|
|
|
|
|
|
|
|
|
|
Year Ended |
||||
|
|
|
December 28, 2012 |
|
December 30, 2011 |
|
December 31, 2010 |
|
Revenue by country |
|
|
|
|
|
|
|
China (includes Hong Kong) |
|
55.4% |
|
54.9% |
|
48.8% |
|
United States |
|
14.0% |
|
13.5% |
|
16.8% |
In addition to those in the table above, our customers in each of Korea, Japan, Germany, Taiwan, Singapore, and Thailand, accounted for at least 1% of our total revenue in 2012.
Revenue from two distributor customers and two contract manufacturers totaled 43.5% of revenue in 2012. Aeco Technology Co., Ltd (“Aeco”), a distributor, represented 12.8% of revenue and 18.3% of accounts receivable for the period ending December 28, 2012. Avnet, Inc (“Avnet”), a distributor, represented 14.9% of revenue and 19.2% of accounts receivable for the period ending December 28, 2012.
57
Revenue from two distributor customers and two contract manufacturers totaled 40.8% of revenue in 2011. Aeco represented 11.4% of revenue and 14.8% of accounts receivable for the period ending December 30, 2011. Avnet represented 11.4% of revenue and 19.1% of accounts receivable for the period ending December 30, 2011. In January 2011, we announced the termination of our distribution relationship with Arrow Electronics, effective April 2011, in order to increase focus within our distribution channel and allow more streamlined customer support. We simultaneously strengthened our relationship with Avnet, which enabled Avnet to integrate our unique product portfolio into its existing design chain services and expand our product offering to their global network of customers.
Revenue from three distributor customers and two contract manufacturer totaled 45.2% of revenue in 2010. Aeco represented 11.0% of revenue and 11.9% of accounts receivable for the period ending December 31, 2010.
We rely on external vendors for approximately 88.0% of our wafer supply as measured in units. Additionally, we rely primarily on external vendors for test, assembly and packaging services. The test, assembly and packaging vendors we utilize are mostly located in Asia, where a significant volume of our final product sales are made.
The following table sets forth the computation of basic and diluted earnings per share (in thousands, except per share amounts):
|
|
|
|
|
|
|
|
|
|
|
Year Ended |
||||
|
|
|
December 28, 2012 |
|
December 30, 2011 |
|
December 31, 2010 |
|
Numerator: |
|
|
|
|
|
|
|
Net (loss) income to common shareholders |
|
$ (37,649) |
|
$ 67,164 |
|
$ 26,392 |
|
Denominator: |
|
|
|
|
|
|
|
Denominator for basic (loss) earnings per share—weighted average common shares |
|
127,032 |
|
125,715 |
|
123,765 |
|
Effect of stock options and awards |
|
- |
|
323 |
|
832 |
|
Denominator for diluted (loss) earnings per share—adjusted weighted average common shares |
|
127,032 |
|
126,038 |
|
124,597 |
|
(Loss) earnings per share: |
|
|
|
|
|
|
|
Basic |
|
$ (0.30) |
|
$ 0.53 |
|
$ 0.21 |
|
Diluted |
|
$ (0.30) |
|
$ 0.53 |
|
$ 0.21 |
|
Anti-dilutive shares not included in the above calculations: |
|
|
|
|
|
|
|
Awards |
|
3,367 |
|
598 |
|
1,010 |
|
Options |
|
11,946 |
|
13,948 |
|
13,227 |
NOTE 16—EQUITY-BASED COMPENSATION
Our equity compensation plans are summarized below (in thousands):
|
Equity Compensation Arrangement |
|
Total Number of Shares in Arrangement |
|
Shares Outstanding as of December 28, 2012 |
|
Shares Available for Issuance at December 28, 2012 |
|
1999 Plan |
|
36,250 |
|
2,200 |
|
- |
|
2008 Plan |
|
34,352 |
|
11,527 |
|
11,497 |
|
2009 Option Exchange Plan |
|
2,914 |
|
1,400 |
|
- |
|
Acquired Plans |
|
- |
|
186 |
|
- |
|
ESPP |
|
6,533 |
|
- |
|
1,696 |
|
|
|
80,049 |
|
15,313 |
|
13,193 |
58
Grant Date Fair Values and Underlying Assumptions; Contractual Terms
For Options granted in 2012 and 2011, we estimated the fair value of each Option as of the date of grant with the following assumptions:
|
|
|
|
|
|
|
|
|
Year Ended |
||
|
|
|
December 28, 2012 |
|
December 30, 2011 |
|
Range of expected volatilities |
|
36.9 – 41.5% |
|
34.4 – 46.7% |
|
Weighted-average volatility |
|
39.3% |
|
37.5% |
|
Range of dividend yields |
|
4.1 – 6.8% |
|
3.1 – 4.8% |
|
Weighted-average dividend yield |
|
4.7% |
|
3.9% |
|
Range of risk-free interest rates |
|
0.5 – 1.0% |
|
1.2 – 2.3% |
|
Weighted-average risk-free interest rate |
|
0.8% |
|
2.1% |
|
Range of expected lives, in years |
|
2.6 – 5.1 |
|
5.0 – 5.6 |
|
Weighted-average expected life, in years |
|
4.6 |
|
5.3 |
The following table represents the weighted-average fair value compensation cost per share of awards granted:
|
|
|
|
|
|
|
|
|
|
|
Year Ended |
||||
|
|
|
December 28, 2012 |
|
December 30, 2011 |
|
December 31, 2010 |
|
Options |
|
$ 2.55 |
|
$ 2.81 |
|
$ 4.32 |
|
Awards |
|
$ 9.14 |
|
$ 10.97 |
|
$ 15.16 |
|
Aggregate |
|
$ 5.62 |
|
$ 5.17 |
|
$ 10.32 |
59
Information Regarding Options and Awards—Information about Options and Awards as of December 28, 2012 and activity for Options and Awards for the three years then ended is presented below:
|
|
|
|
|
|
|
|
|
|
|
|
|
|
|
Options |
|
Awards |
|
Aggregate information |
||||||
|
|
Shares |
|
Weighted-average exercise price |
|
Weighted-average remaining contract lives |
|
Shares |
|
Aggregate intrinsic value |
|
Aggregate unrecognized compensation cost |
|
|
(in thousands) |
|
(per share) |
|
(in years) |
|
(in thousands) |
|
(in millions) |
|
(in millions) |
|
Outstanding as of January 1, 2010 |
12,269 |
|
$ 19.18 |
|
4.2 |
|
2,527 |
|
|
|
|
|
Granted (1)(2) |
2,467 |
|
14.49 |
|
|
|
3,056 |
|
|
|
|
|
Exercised (5) |
(408) |
|
11.36 |
|
|
|
(1,109) |
|
|
|
|
|
Canceled |
(1,112) |
|
28.57 |
|
|
|
(266) |
|
|
|
|
|
Outstanding as of December 31, 2010 |
13,216 |
|
$ 17.75 |
|
4.0 |
|
4,208 |
|
|
|
|
|
Granted (3) |
3,657 |
|
12.42 |
|
|
|
1,482 |
|
|
|
|
|
Exercised (5) |
(250) |
|
8.38 |
|
|
|
(1,320) |
|
|
|
|
|
Canceled |
(2,675) |
|
19.37 |
|
|
|
(692) |
|
|
|
|
|
Outstanding as of December 30, 2011 |
13,948 |
|
$ 16.21 |
|
4.1 |
|
3,678 |
|
|
|
|
|
Granted (4) |
2,420 |
|
10.47 |
|
|
|
2,117 |
|
|
|
|
|
Exercised (5) |
(85) |
|
6.48 |
|
|
|
(1,164) |
|
|
|
|
|
Canceled |
(4,337) |
|
16.79 |
|
|
|
(1,264) |
|
|
|
|
|
Outstanding as of December 28, 2012 |
11,946 |
|
$ 14.90 |
|
3.7 |
|
3,367 |
|
$ 27.6 |
|
$ 26.0 |
|
|
|
|
|
|
|
|
|
|
|
|
|
|
As of December 28, 2012: |
|
|
|
|
|
|
|
|
|
|
|
|
Exercisable/vested (5) |
7,390 |
|
$ 16.84 |
|
2.6 |
|
63 |
|
$ 0.6 |
|
|
|
Number vested and expected to ultimately vest |
11,713 |
|
$ 14.98 |
|
3.6 |
|
3,020 |
|
$ 24.8 |
|
|
|
(1) |
Includes 1,708,956 Awards and 22,898 Options that were issued in order to convert unvested Techwell equity shares as a result of the acquisition. Of those, 1,508,004 were issued from the 2008 Plan. The remaining shares were issued from Techwell’s 2006 Stock Compensation Plan. |
|
(2) |
Awards granted include 232,000 performance-based deferred stock units (“PDSU”) shares issued in 2010 that have not yet been earned. |
|
(3) |
Grants include 952,172 market stock units (“MSU”) Options and 300,891 MSU Awards issued in 2011 that have not yet been earned. |
|
(4) |
Grants include 833,204 MSU Options and 380,821 MSU Awards issued in 2012 that have not yet been earned. |
|
(5) |
Awards exercised are those that have reached full vested status and been delivered to the recipients as a taxable event due to elective deferral available in the case of deferred stock units. Deferred stock units for which the deferral is elected timely are vested but still outstanding as Awards. Total un-issued shares related to deferred stock units as of December 28, 2012 were 63,000 shares as shown in the Awards column as Exercisable/vested. |
The weighted-average recognition period for this compensation cost is 2.1 years. The unrecognized compensation cost is expected to be recognized over a period of 4.0 years.
|
|
|
|
|
|
|
|
|
Additional Disclosures |
|
Year Ended |
||||
|
|
|
December 28, 2012 |
|
December 30, 2011 |
|
December 31, 2010 |
|
|
|
|
|
|
|
|
|
|
|
($ in millions, share data in thousands) |
||||
|
Shares issued under the employee stock purchase plan |
|
813 |
|
749 |
|
564 |
|
Aggregate intrinsic value of stock options exercised |
|
$ 0.3 |
|
$ 1.5 |
|
$ 1.4 |
The following table is a summary of the number and weighted-average grant date fair values regarding our unexercisable/unvested Options and Awards as of December 28, 2012 and changes during the year then ended (in thousands):
60
|
|
Options Unvested |
|
Options-Weighted Average Grant Date Fair Values |
|
Awards Unvested |
|
Awards-Weighted Average Grant Date Fair Values |
|
Unvested as of December 30, 2011 |
6,270 |
|
$ 3.45 |
|
3,601 |
|
$ 13.22 |
|
Granted |
2,420 |
|
2.55 |
|
2,117 |
|
9.14 |
|
Vested |
(2,750) |
|
3.72 |
|
(1,150) |
|
13.21 |
|
Forfeited |
(1,385) |
|
3.09 |
|
(1,264) |
|
11.65 |
|
Unvested as of December 28, 2012 |
4,555 |
|
$ 2.92 |
|
3,304 |
|
$ 11.20 |
Financial Statement Effects and Presentation—The following table shows total equity-based compensation expense for the periods indicated that are included in the accompanying Consolidated Statement of Operations (in millions):
|
|
|
|
|
|
|
|
|
|
|
Year Ended |
||||
|
|
|
December 28, 2012 |
|
December 30, 2011 |
|
December 31, 2010 |
|
By statement of operations line item |
|
|
|
|
|
|
|
Cost of revenue |
|
$ 1.6 |
|
$ 1.9 |
|
$ 2.1 |
|
Research and development |
|
11.3 |
|
16.2 |
|
16.0 |
|
Selling, general and administrative |
|
11.7 |
|
12.2 |
|
14.6 |
|
By stock type |
|
|
|
|
|
|
|
Stock options |
|
$ 9.4 |
|
$ 11.2 |
|
$ 10.7 |
|
Restricted and deferred stock awards |
|
14.1 |
|
17.8 |
|
20.9 |
|
Employee stock purchase plan |
|
1.1 |
|
1.3 |
|
1.1 |
|
|
|
|
|
|
|
|
|
|
|
|
|
As of December 28, 2012 |
|
As of December 30, 2011 |
|
|
|
|
|
|
|
|
|
|
|
|
|
(in millions) |
||
|
Equity-based compensation capitalized in inventory |
|
|
|
$ 0.3 |
|
$ 0.8 |
Performance-based Grants
|
|
|
|
|
|
|
|
|
As of December 28, 2012 |
||
|
|
|
Options |
|
Awards |
|
|
|
|
|
|
|
|
|
(in thousands) |
||
|
Performance-based units outstanding |
|
1,042.0 |
|
568.6 |
|
Maximum shares that could be issued assuming the highest level of performance |
|
1,563.0 |
|
836.0 |
|
Performance-based shares expected to vest |
|
796.4 |
|
302.7 |
|
Amount to be recognized as compensation cost over the performance period |
|
$ 1,951.3 |
|
$ 2,221.9 |
61
NOTE 17—COMMITMENTS AND CONTINGENCIES
Indemnifications—The Harris Corporation (“Harris”) facilities in Palm Bay, Florida, are listed on the National Priorities List (“NPL”) for groundwater clean-up under the Comprehensive Environmental Response, Compensation and Liabilities Act, or Superfund. Intersil’s adjacent facility is included in the listing since it was owned by Harris at the time of the listing. Remediation activities associated with the NPL site have ceased. However, Harris is still obligated to conduct groundwater monitoring on the affected property for an unspecified period of time. Harris has indemnified Intersil against any environmental liabilities associated with this contamination. This indemnification does not expire, nor does it have a maximum amount.
Our former facility in Kuala Lumpur, Malaysia, which we sold in June 2000, has known groundwater contamination from past operations. The contamination was discovered in May 2000 during the closure activities associated with a former waste storage pad. This contamination has been attributed to activities conducted prior to Intersil’s acquisition of the facility from Harris. Harris is conducting additional investigations and some remediation may be required. Harris has indemnified Intersil against any environmental liabilities associated with this contamination, and Intersil likewise is indemnifying the purchaser against those liabilities. Harris’ indemnification of us and our indemnification of purchaser have no expiration date, nor do they have a maximum amount.
A former semiconductor manufacturing site in Taoyuan, Taiwan operated by RCA and/or General Electric allegedly has groundwater contamination and is subject to cleanup and monitoring efforts as well as claims of environmental pollution that allegedly caused adverse health effects. To the extent our Taiwan subsidiary is the successor in interest to any of RCA or General Electric’s activities at that site, Harris has indemnified Intersil against any environmental liabilities associated with the alleged contamination. This indemnification does not expire, nor does it have a maximum amount.
We generally provide customers with a limited indemnification against intellectual property infringement claims related to our products. We accrue for known indemnification issues if a loss is probable and can be reasonably estimated, and accrue for estimated incurred but unidentified issues based on historical activity.
In certain instances when we sell product groups, we may retain certain liabilities for known exposures and provide indemnification to the buyer with respect to future claims arising from events occurring prior to the sale date, including liabilities for taxes, legal matters, intellectual property infringement, environmental exposures and other obligations. The terms of the indemnifications vary in duration, from one to two years for certain types of indemnities, to terms for tax indemnifications that are generally aligned to the applicable statute of limitations for the jurisdiction in which the divestiture occurred, and terms for environmental indemnities that typically do not expire. The maximum potential future payments that we could be required to make under these indemnifications are either contractually limited to a specified amount or unlimited. We believe that the maximum potential future payments that we could be required to make under these indemnifications are not determinable at this time, as any future payments would be dependent on the type and extent of the related claims, and all available defenses, which are not estimable.
Leases and Commitments—Total rental expense amounted to $11.0 million, $11.1 million and $9.7 million for 2012, 2011 and 2010 respectively. Future minimum lease commitments under non-cancelable operating leases primarily related to land and office buildings amounted to approximately $48.5 million as of December 28, 2012.
The following table sets forth future minimum lease commitments and non-cancelable purchase commitments as of December 28, 2012 (in millions):
|
|
|
Future minimum lease commitments |
|
Non-cancelable purchase commitments |
|
2013 |
|
$ 10.4 |
|
$ 35.9 |
|
2014 |
|
7.6 |
|
1.4 |
|
2015 |
|
10.4 |
|
- |
|
2016 |
|
5.1 |
|
- |
|
2017 |
|
4.8 |
|
- |
|
Thereafter |
|
10.2 |
|
- |
|
Total future minimum commitments |
|
$ 48.5 |
|
$ 37.3 |
62
We are currently party to various claims and legal proceedings, including the one discussed below. When we believe that a loss is probable and the amount of the loss can be reasonably estimated, we recognize the estimated amount of the loss. We include legal costs in the estimate of losses. As additional information becomes available, we reassess any potential liability related to these matters and, if necessary, revise the estimates.
We believe that the ultimate outcome of these matters, individually and in the aggregate will not have a material adverse effect on our financial position or overall trends in results of our operations. However, litigation is subject to inherent uncertainties and unfavorable rulings could occur, including an award of monetary damages or issuance of an injunction prohibiting us from selling one or more products. It is possible that an unfavorable ruling could have a material adverse impact on the results of our operations for the period in which the ruling occurs, or in future periods. Texas Advanced Optoelectronic Solutions, Inc. (“TAOS”) named Intersil as a defendant in a lawsuit filed on November 25, 2008, in the United States District Court for the Eastern District of Texas. In this action, TAOS alleges patent infringement, breach of contract, trade secret misappropriation, and tortuous interference with a business relationship, seeking damages and injunctive relief. We dispute TAOS’ claims and are defending ourselves vigorously. The parties are waiting for the Court to evaluate the claims in TAOS’ patent(s), after which time a claim construction opinion will be issued by the Court.
We estimate the possible, but not necessarily probable, range of loss in the TAOS matter to be from $0.0 to $17.0 million. However, because we believe the defense of these matters to be probable, we record accruals for estimated costs to defend these positions, exclusive of settlement or judgment costs. As of December 28, 2012, we have recorded approximately $0.1 million related to defense costs.
NOTE 19—QUARTERLY FINANCIAL DATA (UNAUDITED)
The following is a summary of unaudited quarterly financial information for the periods indicated (in millions, except per share data):
|
|
|
|
|
|
|
|
|
|
|
|
|
|
|
|
|
|
|
Quarters Ended |
||||||||||||||
|
|
Dec 28, 2012 |
|
Sep 28, 2012 |
|
Jun 29, 2012 |
|
Mar 30, 2012 |
|
Dec 30, 2011 |
|
Sep 30, 2011 |
|
Jul 1, 2011 |
|
Apr 1, 2011 |
|
Revenue |
$ 137.5 |
|
$ 151.4 |
|
$ 163.0 |
|
$ 156.0 |
|
$ 165.8 |
|
$ 186.8 |
|
$ 209.1 |
|
$ 198.9 |
|
Gross profit |
74.3 |
|
81.9 |
|
88.8 |
|
85.2 |
|
94.0 |
|
106.5 |
|
121.8 |
|
115.0 |
|
Net (loss) income |
(21.8) |
|
2.0 |
|
(14.5) |
|
(3.3) |
|
24.1 |
|
7.2 |
|
21.8 |
|
14.1 |
|
(Loss) Income per share (basic): |
(0.17) |
|
0.02 |
|
(0.11) |
|
(0.03) |
|
0.19 |
|
0.06 |
|
0.17 |
|
0.11 |
|
(Loss) Income per share (diluted): |
(0.17) |
|
0.02 |
|
(0.11) |
|
(0.03) |
|
0.19 |
|
0.06 |
|
0.17 |
|
0.11 |
NOTE 20—RECENT ACCOUNTING PRONOUNCEMENTS
In December 2011, the Financial Accounting Standards Board (“FASB”) issued Accounting Standards Update ("ASU") No. 2011-11 “Disclosures about Offsetting Assets and Liabilities.” The standard requires additional disclosure to enhance the comparability of U.S. GAAP and International Financial Reporting Standards financial statements. In January 2013, the FASB issued Accounting Standards Update 2013-01 "Clarifying the Scope of Disclosures about Offsetting Assets and Liabilities." This standard provided additional guidance on the scope of ASU 2011-11. Retrospective application is required and the guidance concerns disclosure only. It will be effective for our first quarter of fiscal year 2013 and will not have a material impact on our financial statements.
63
In February 2013, the FASB issued ASU No. 2013-02, "Reporting of Amounts Reclassified Out of Accumulated Other Comprehensive Income." Under ASU 2013-02, an entity is required to provide information about the amounts reclassified out of Accumulated Other Comprehensive Income ("AOCI") by component. In addition, an entity is required to present, either on the face of the financial statements or in the notes, significant amounts reclassified out of AOCI by the respective line items of net income, but only if the amount reclassified is required to be reclassified in its entirety in the same reporting period. For amounts that are not required to be reclassified in their entirety to net income, an entity is required to cross-reference to other disclosures that provide additional details about those amounts. ASU 2013-02 does not change the current requirements for reporting net income or other comprehensive income in the financial statements. ASU 2013-02 will be effective for our first quarter of fiscal year 2013 and will not have a material impact on our financial statements.
NOTE 21—SUBSEQUENT EVENTS
On February 19, 2013, our Board of Director’s approved of a restructuring plan to prioritize sales and development efforts, strengthen financial performance and improve cash flows. The restructuring plan will reduce our worldwide workforce and will be substantially completed during our first quarter of 2013.
—End of Consolidated Financial Statements—
64
Item 9. Changes in and Disagreements With Accountants on Accounting and Financial Disclosure.
None.
Item 9A. Controls and Procedures.
Evaluation of Disclosure Controls and Procedures
Our management, with the participation of our Chief Executive Officer, or CEO, and Chief Financial Officer, or CFO, evaluated the effectiveness of our disclosure controls and procedures (as defined in Rules 13a-15(e) and 15d-15(c) of the Exchange Act) as of the end of the period covered by this Annual Report on Form 10-K.
Based on this evaluation, our CEO and CFO concluded that, as of the end of the period covered by this Annual Report on Form 10-K, our disclosure controls and procedures were (1) designed to ensure that material information relating to us, including our consolidated subsidiaries, is made known to our CEO and CFO by others within those entities, particularly during the period in which this report was being prepared and (2) effective in providing reasonable assurance that all material information required to be disclosed by Intersil in the reports that it files or furnishes under the Securities Exchange Act of 1934, as amended (the”Exchange Act”) is recorded, processed, summarized and reported within the time periods specified in the rules and forms of the Securities and Exchange Commission (“SEC”), and that all such material information is accumulated and communicated to our management, including our CEO and CFO, to allow timely decisions regarding required disclosures.
Management Report on Internal Control over Financial Reporting
Our management is responsible for establishing and maintaining adequate internal control over financial reporting to provide reasonable assurance regarding the reliability of our financial reporting and the preparation of financial statements for external purposes in accordance with generally accepted accounting principles. Internal control over financial reporting includes those policies and procedures that (i) pertain to the maintenance of records that in reasonable detail accurately and fairly reflect the transactions and dispositions of company assets; (ii) provide reasonable assurance that transactions are recorded as necessary to permit preparation of financial statements in accordance with generally accepted accounting principles, and that receipts and expenditures are being made only in accordance with authorizations of our management and directors; and (iii) provide reasonable assurance regarding prevention or timely detection of unauthorized acquisition, use or disposition of company assets that could have a material effect on the financial statements.
Management assessed our internal control over financial reporting as of December 28, 2012, the end of our fiscal year. Management based its assessment on criteria established in Internal Control—Integrated Framework issued by the Committee of Sponsoring Organizations of the Treadway Commission. Management’s assessment included evaluation of such elements as the design and operating effectiveness of key financial reporting controls, process documentation, accounting policies, and our overall control environment. This assessment is supported by testing and monitoring by our management and Internal Audit organizations.
Based on this assessment, management has concluded that our internal control over financial reporting was effective as of the end of the fiscal year to provide reasonable assurance regarding the reliability of financial reporting and the preparation of financial statements for external reporting purposes in accordance with generally accepted accounting principles. Furthermore, management has concluded that no change in internal control over financial reporting occurred during Intersil’s fourth quarter ended December 28, 2012 that has materially affected, or is reasonably likely to materially affect, such internal control over financial reporting. Management reviewed the results of its assessment with the Audit Committee of our Board of Directors. The effectiveness of our internal control over financial reporting as of December 28, 2012 has been audited by KPMG LLP, an independent registered public accounting firm, as stated in its report which is included in Item 8 of this Annual Report on Form 10-K.
65
Inherent Limitations on Effectiveness of Controls
Our management, including our CEO and CFO, does not expect that our disclosure controls and procedures or our internal control over financial reporting will prevent or detect all error and all fraud. A control system, no matter how well designed and operated, can provide only reasonable, not absolute, assurance of achieving the desired control objectives. The design of a control system must reflect the fact that the benefits of controls must be considered relative to their costs. Further, because of the inherent limitations in all control systems, no evaluation of controls can provide absolute assurance that misstatements due to error or fraud will not occur or that all control issues and instances of fraud, if any, within Intersil have been detected. These inherent limitations include the realities that judgments in decision-making can be faulty and that breakdowns can occur because of simple error or mistake. Controls can also be circumvented by the individual acts of some persons, by collusion of two or more people, or by management override of the controls. The design of any system of controls is based in part on certain assumptions about the likelihood of future events, and there can be no assurance that any design will succeed in achieving its stated goals under all potential future conditions. Projections of any evaluation of controls effectiveness to future periods are subject to risks. Over time, controls may become inadequate because of changes in conditions or deterioration in the degree of compliance with policies or procedures.
None.
Item 10. Directors, Executive Officers and Corporate Governance.
Members of the Board of Directors
The following individuals served on our Board of Directors as of December 28, 2012:
James V. Diller; Robert W. Conn; Gary E. Gist; Mercedes Johnson; Gregory Lang; Jan Peeters; Robert N. Pokelwaldt; James A. Urry; and Donald Macleod. The information required to be reported with respect to the directors listed in this paragraph pursuant to Item 401 of Regulation S-K will appear under the caption, “Election of Directors (Item 1 on Proxy Ballot)” in the definitive Proxy Statement relating to our 2013 Annual Meeting of Shareholders, to be filed by us with the SEC pursuant to Section 14(a) of the Exchange Act and is hereby specifically incorporated herein by reference thereto.
On August 31, 2012, our Board of Directors increased its size from nine to ten members and elected Donald Macleod as a Director to fill the vacancy. Mr. Macleod was Chairman of the Board and CEO of National Semiconductor Corporation prior to its acquisition by Texas Instruments Corporation in September 2011. He is also a member of the board of directors of Avago Technologies Limited.
On December 9, 2012, Dave Bell resigned as President and CEO and as a Director, effective immediately, decreasing the size of the board from ten to nine. Gary Gist, former Chairman of the Board, stepped down from that position and remains a member of the Board. Donald Macleod was named Chairman of the Board.
Executive Officers and Key Employees
The executive officers and key employees of Intersil as of December 28, 2012 were as follows:
James V. Diller; Jonathan A. Kennedy; Susan J. Hardman; Andrew M. Cowell; Gerald J. Edwards; Vern Kelley; David M. Loftus; and Thomas C. Tokos. The information required to be reported with respect to the executive officers and key employees listed in this paragraph pursuant to Item 401 of Regulation S-K will appear under the caption “Executive Officers and Key Employees” in the definitive Proxy Statement relating to our 2013 Annual Meeting of Shareholders, to be filed by us with the SEC pursuant to Section 14(a) of the Exchange Act, and is hereby specifically incorporated herein by reference thereto.
On December 9, 2012, Dave Bell resigned as President and CEO and as a Director, effective immediately. James Diller was appointed as interim President and CEO.
66
The information required under this item with respect to the compliance with Section 16(a) of the Exchange Act will appear under the caption “Section 16(a) Beneficial Ownership Reporting Compliance” in the definitive Proxy Statement relating to our 2013 Annual Meeting of Shareholders, to be filed by us with the SEC pursuant to Section 14(a) of the Exchange Act, and is hereby specifically incorporated herein by reference thereto.
The information required under this item with respect to our Audit, Compensation and Nominating and Governance Committees will appear under the captions “Corporate Governance—Committees of the Board—Audit Committee,” “Corporate Governance—Committees of the Board—Compensation Committee,” and “Corporate Governance—Committees of the Board—Nominating and Governance Committee” in the definitive Proxy Statement relating to our 2013 Annual Meeting of Shareholders, to be filed by us with the SEC pursuant to Section 14(a) of the Exchange Act, and is hereby specifically incorporated herein by reference thereto.
We have adopted a Code of Ethics applicable to our Senior Financial Officers, including our CEO, CFO and other persons performing similar functions. A copy of the Code of Ethics is available on the Investor Relations section of our website at, www.intersil.com/investor. Any amendment to, or waiver of, any provision of the Code of Ethics will be disclosed on our website within five business days following such amendment or waiver.
Item 11. Executive Compensation.
The information required under this item will appear under the captions “Executive Compensation” and “Director Compensation” in the definitive Proxy Statement relating to our 2013 Annual Meeting of Shareholders, to be filed by us with the SEC pursuant to Section 14(a) of the Exchange Act, and is hereby specifically incorporated herein by reference thereto.
Item 12. Security Ownership of Certain Beneficial Owners and Management and Related Stockholder Matters.
The information required under this item will appear under the captions “Equity Compensation Plan Information,” “Security Ownership of Certain Beneficial Owners and Directors and Officers” and “Potential Payments Upon Termination or Change-in-Control Benefits” in the definitive Proxy Statement relating to our 2013 Annual Meeting of Shareholders, to be filed by us with the SEC pursuant to Section 14(a) of the Exchange Act, and is hereby specifically incorporated herein by reference thereto.
Item 13. Certain Relationships and Related Transactions, and Director Independence.
The information required under this item will appear under the caption “Corporate Governance” in the definitive Proxy Statement relating to our 2013 Annual Meeting of Shareholders, to be filed by us with the SEC pursuant to Section 14(a) of the Exchange Act, and is hereby specifically incorporated herein by reference thereto.
Item 14. Principal Accounting Fees and Services.
The information required under this item will appear under the captions “Corporate Governance—Committees of the Board—Audit Committee,” “Ratification of Appointment of Independent Registered Public Accounting Firm” (Item 2 on Proxy Ballot), “Audit and Other Fees Paid to KPMG LLP” ” in the definitive Proxy Statement relating to our 2013 Annual Meeting of Shareholders, to be filed by us with the SEC pursuant to Section 14(a) of the Exchange Act, and is hereby specifically incorporated herein by reference thereto.
67
Item 15. Exhibits, Financial Statement Schedules.
|
(a) |
The consolidated financial statements and related Notes thereto as set forth under Item 8 of this Annual Report on Form 10-K are incorporated herein by reference. |
|
(b) |
Financial Statement Schedules. |
VALUATION AND QUALIFYING ACCOUNTS
(in millions)
|
Valuation and qualifying accounts deducted from the assets to which they apply |
|
Balance as of Beginning of Period |
|
Additions Charged to Costs and Expenses |
|
Additions Charged (Credited) to Other Accounts |
|
Deduction from Allowances |
|
Balance as of End of Period |
|
Allowance for uncollectible accounts |
|
|
|
|
|
|
|
|
|
|
|
2012 |
|
$ 0.2 |
|
$ (0.1) |
|
$ - |
|
$ - |
|
$ 0.1 |
|
2011 |
|
$ 0.4 |
|
$ - |
|
$ (0.2) |
|
$ - |
|
$ 0.2 |
|
2010 |
|
$ 2.3 |
|
$ 0.4 |
|
$ (0.2) |
|
$ 2.1 |
|
$ 0.4 |
|
|
|
|
|
|
|
|
|
|
|
|
|
Inventory allowances |
|
|
|
|
|
|
|
|
|
|
|
2012 |
|
$ 37.4 |
|
$ 10.2 |
|
$ - |
|
$ 1.7 |
|
$ 45.9 |
|
2011 |
|
$ 45.6 |
|
$ 5.3 |
|
$ - |
|
$ 13.5 |
|
$ 37.4 |
|
2010 |
|
$ 42.4 |
|
$ 10.2 |
|
$ 1.6 |
|
$ 8.6 |
|
$ 45.6 |
|
|
|
|
|
|
|
|
|
|
|
|
|
Sales returns and allowances |
|
|
|
|
|
|
|
|
|
|
|
2012 |
|
$ 14.5 |
|
$ 96.4 |
|
$ 0.3 |
|
$ 96.4 |
|
$ 14.8 |
|
2011 |
|
$ 6.6 |
|
$ 66.5 |
|
$ 8.7 |
|
$ 67.3 |
|
$ 14.5 |
|
2010 |
|
$ 6.2 |
|
$ 46.7 |
|
$ - |
|
$ 46.3 |
|
$ 6.6 |
The additions charged to costs and expenses are classified as reduction of revenue for the allowance for uncollectible accounts and sales returns and allowances. Inventory allowance additions are classified as cost of revenues.
All other schedules for which provision is made in the applicable accounting regulation of the SEC are not required under the related instructions or are inapplicable and therefore have been omitted.
68
|
(c) |
Index to Exhibits. |
|
Exhibit No. |
Description |
|
3.1 |
Amended and Restated Certificate of Incorporation of Intersil Corporation (incorporated by reference to Exhibit 3.01 to the Quarterly Report on Form 10-Q, filed August 9, 2005). |
|
|
|
|
3.2 |
Amended and Restated Bylaws of Intersil Corporation. (incorporated by reference to Exhibit 3.2 to the Annual Report on Form 10-K, filed February 24, 2012)* |
|
|
|
|
4 |
Specimen Certificate of Intersil Corporation’s Class A Common Stock (incorporated by reference to Exhibit 4.1 to the Annual Report on Form 10-K, filed February 27, 2007). |
|
|
|
|
10.1 |
Credit Agreement dated September 1, 2011, by and among Intersil, the Lenders (as defined therein), Bank of America, N.A. as administrative agent, swing line lender and letter of credit issuer (incorporated by reference to Exhibit 10.1 to the Current Report on Form 8-K, filed September 8, 2011). |
|
|
|
|
10.2 |
Separation Agreement between Intersil Corporation and David B. Bell dated December 19, 2012 (incorporated herein by reference to Exhibit 10.1 to the Current Report on Form 8-K, filed December 20, 2012). |
|
|
|
|
10.3 |
Separation Agreement and General Release dated March 1, 2012 between Intersil Corporation and Peter Oaklander (incorporated herein by reference to Exhibit 10.1 to the Current Report on Form 8-K, filed March 5, 2012). |
|
|
|
|
10.4 |
First Amendment to Credit Agreement dated June 20 2012, by and among Intersil, the Lenders (as defined therein), and Bank of America, N.A. as administrative agent, swing line lender and letter of credit issuer (incorporated by reference to Exhibit 10 to the Quarterly Report on Form 10-Q, filed August 3, 2012). |
|
|
|
|
10.5 |
Second Amendment to Credit Agreement dated September 20 2012, by and among Intersil, the Lenders (as defined therein), and Bank of America, N.A. as administrative agent, swing line lender, and letter of credit issuer (incorporated by reference to Exhibit 10 to the Quarterly Report on Form 10-Q, filed November 2, 2012). |
|
|
|
|
10.6 |
Intersil Corporation 2008 Equity Compensation Plan Terms and Conditions One-Year Cliff, effective December 9, 2012 (incorporated herein by reference to Exhibit 10.1 to the Current Report on Form 8-K, filed March 5, 2012). |
|
|
|
|
14 |
Intersil Code of Ethics (incorporated by reference to Exhibit 14.01 to the Annual Report on Form 10-K, filed March 9, 2004). |
|
|
|
|
21 |
Subsidiaries of Intersil Corporation.* |
|
|
|
|
23 |
Consent of KPMG LLP, Independent Registered Public Accounting Firm.* |
|
|
|
|
31.1 |
Certification of Chief Executive Officer Pursuant to Rule 13a-14(a) of the Exchange Act, as adopted by Section 302 of the Sarbanes-Oxley Act of 2002.* |
|
|
|
|
31.2 |
Certification of Chief Financial Officer Pursuant to Rule 13a-14(a) of the Exchange Act, as adopted by Section 302 of the Sarbanes-Oxley Act of 2002.* |
|
|
|
|
32 |
Certification of the Chief Executive Officer and Chief Financial Officer Pursuant to Rule 13a-14(b) of the Exchange Act and 18 U.S.C. Section 1350, as Adopted Pursuant to Section 906 of the Sarbanes-Oxley Act of 2002.* |
|
|
|
|
101.INS |
XBRL Instance document |
|
|
|
|
101.SCH |
XBRL Taxonomy Extension Schema |
|
|
|
|
101.CAL |
XBRL Taxonomy Extension Calculation Linkbase |
|
|
|
|
101.DEF |
XBRL Taxonomy Extension Definition Linkbase |
|
|
|
|
101.LAB |
XBRL Taxonomy Extension Label Linkbase |
|
|
|
|
101.PRE |
XBRL Taxonomy Extension Presentation Linkbase |
69
* Filed herewith.
Attached as Exhibit 101 to this report are the following, formatted in XBRL (Extensible Business Reporting Language): (i) Consolidated Statements of Operations, (ii) Consolidated Statements of Comprehensive (loss) Income, (iii) Consolidated Statements of Cash Flows, (iv) Consolidated Balance Sheets, (v) Consolidated Statements of Shareholders’ Equity and (vi) Notes to Consolidated Financial Statements.
70
Pursuant to the requirements of Section 13 or 15(d) of the Securities Exchange Act of 1934, the registrant has duly caused this report to be signed on its behalf by the undersigned, thereunto duly authorized.
|
INTERSIL CORPORATION |
|
|
|
|
|
By: |
/s/ James V. Diller |
|
|
James V. Diller Interim Chief Executive Officer February 22, 2013 |
Pursuant to the requirements of the Securities Exchange Act of 1934, this report has been signed below by the following persons on behalf of the registrant and in the capacities and on the dates indicated.
|
|
Name |
|
Title |
|
Date |
|
|
|
|
|
|
|
|
By: |
/s/ James V. Diller |
|
Interim President, Chief Executive Officer and |
|
February 22, 2013 |
|
|
James V. Diller |
|
Director (principal executive officer) |
|
|
|
|
|
|
|
|
|
|
By: |
/s/ Jonathan A. Kennedy |
|
Chief Financial Officer (principal financial |
|
February 22, 2013 |
|
|
Jonathan A. Kennedy |
|
and accounting officer) |
|
|
|
|
|
|
|
|
|
|
By: |
/s/ Donald Macleod |
|
Chairman of the Board of Directors |
|
February 22, 2013 |
|
|
Donald Macleod |
|
|
|
|
|
|
|
|
|
|
|
|
By: |
/s/ Gary E. Gist |
|
Director |
|
February 22, 2013 |
|
|
Gary E. Gist |
|
|
|
|
|
|
|
|
|
|
|
|
By: |
/s/ Robert W. Conn |
|
Director |
|
February 22, 2013 |
|
|
Robert W. Conn |
|
|
|
|
|
|
|
|
|
|
|
|
By: |
/s/ Mercedes Johnson |
|
Director |
|
February 22, 2013 |
|
|
Mercedes Johnson |
|
|
|
|
|
|
|
|
|
|
|
|
By: |
/s/ Gregory Lang |
|
Director |
|
February 22, 2013 |
|
|
Gregory Lang |
|
|
|
|
|
|
|
|
|
|
|
|
By: |
/s/ Jan Peeters |
|
Director |
|
February 22, 2013 |
|
|
Jan Peeters |
|
|
|
|
|
|
|
|
|
|
|
|
By: |
/s/ Robert N. Pokelwaldt |
|
Director |
|
February 22, 2013 |
|
|
Robert N. Pokelwaldt |
|
|
|
|
|
|
|
|
|
|
|
|
By: |
/s/ James A. Urry |
|
Director |
|
February 22, 2013 |
|
|
James A. Urry |
|
|
|
|
71