Attached files
Table of Contents
UNITED STATES
SECURITIES AND EXCHANGE COMMISSION
Washington, DC 20549
FORM 10-K
| x | ANNUAL REPORT PURSUANT TO SECTION 13 OR 15(D) OF THE SECURITIES EXCHANGE ACT OF 1934 |
For the fiscal year ended December 31, 2009
or
| ¨ | TRANSITION REPORT PURSUANT TO SECTION 13 OR 15(D) OF THE SECURITIES EXCHANGE ACT OF 1934 |
For the transition period from to .
Commission file number: 0-31271
RTI BIOLOGICS, INC.
(Exact Name of Registrant as Specified in Its Charter)
| Delaware | 59-3466543 | |
| (State or Other Jurisdiction of Incorporation or Organization) |
(I.R.S. Employer Identification No.) |
11621 Research Circle, Alachua, Florida 32615
(Address of Principal Executive Offices) (Zip Code)
(386) 418-8888
(Registrant’s telephone number, including area code)
Securities registered pursuant to Section 12(b) of the Act: Common Stock, par value $0.001
Indicate by check mark if the registrant is a well-known seasoned issuer, as defined in Rule 405 of the Securities Act. Yes ¨ No x
Indicate by check mark if the registrant is not required to file reports pursuant to Section 13 or Section 15(d) of the Act. Yes ¨ No x
Indicate by check mark whether the registrant: (1) has filed all reports required to be filed by Section 13 or 15(d) of the Securities Exchange Act of 1934 during the preceding 12 months (or for such shorter period that the registrant was required to file such reports), and (2) has been subject to such filing requirements for the past 90 days. Yes x No ¨
Indicate by check mark if disclosure of delinquent filers pursuant to Item 405 of Regulation S-K is not contained herein, and will not be contained, to the best of registrant’s knowledge, in definitive proxy or information statements incorporated by reference in Part III of this Form 10-K or any amendment to this Form 10-K. ¨
Indicate by check mark whether the registrant is a large accelerated filer, an accelerated filer, a non-accelerated filer or a smaller reporting company. See definition of “accelerated filer”, “large accelerated filer” and “smaller reporting company” in Rule 12b-2 of the Exchange Act. (Check one):
Large Accelerated Filer ¨ Accelerated Filer x Non-Accelerated Filer ¨ Smaller Reporting Company ¨
Indicate by check mark whether the registrant is a shell company (as defined in Rule 12b-2 of the Exchange Act.): Yes ¨ No x
The aggregate market value of the Common Stock held by non-affiliates of the registrant, based upon the last sale price of the Common Stock reported on the Nasdaq Stock Market as of the last business day of the registrant’s most recently completed second fiscal quarter (June 30, 2009), was approximately $232.8 million.
The number of shares of Common Stock outstanding as of February 16, 2010 was 54,553,062.
DOCUMENTS INCORPORATED BY REFERENCE
As stated in Part III of this Annual Report on Form 10-K, portions of the registrant’s definitive proxy statement for the registrant’s 2010 Annual Meeting of Stockholders are incorporated by reference in Part III of this Annual Report on Form 10-K.
Table of Contents
RTI BIOLOGICS, INC.
FORM 10-K Annual Report
| Page | ||||
| Item 1 |
Business | 1 | ||
| 1 | ||||
| 2 | ||||
| 3 | ||||
| 4 | ||||
| 8 | ||||
| 8 | ||||
| 8 | ||||
| 9 | ||||
| 10 | ||||
| 10 | ||||
| 10 | ||||
| 12 | ||||
| 12 | ||||
| 12 | ||||
| 13 | ||||
| Item 1A |
14 | |||
| Item 1B |
20 | |||
| Item 2 |
20 | |||
| Item 3 |
20 | |||
| Item 5 |
22 | |||
| Item 6 |
24 | |||
| Item 7 |
Management’s Discussion and Analysis of Financial Condition and Results of Operations |
26 | ||
| Item 7A |
38 | |||
| Item 8 |
39 | |||
| Item 9 |
Changes in and Disagreements with Accountants on Accounting and Financial Disclosure |
39 | ||
| Item 9A |
39 | |||
| Item 9B |
40 | |||
| Item 10 |
41 | |||
| Item 11 |
41 | |||
| Item 12 |
Security Ownership of Certain Beneficial Owners and Management and Related Stockholder Matters |
41 | ||
| Item 13 |
Certain Relationships and Related Transactions, and Director Independence |
41 | ||
| Item 14 |
41 | |||
| Item 15 |
42 | |||
| 43 | ||||
Table of Contents
This Annual Report on Form 10-K and the documents incorporated by reference contain forward-looking statements that have been made pursuant to the provisions of the Private Securities Litigation Reform Act of 1995. These forward-looking statements are based on current expectations, estimates and projections about our industry, our management’s beliefs and certain assumptions made by our management. Words such as “anticipates,” “expects,” “intends,” “plans,” “believes,” “seeks,” “estimates,” “requires” “hopes,” “may,” “assumes,” variations of such words and similar expressions are intended to identify such forward-looking statements. Do not unduly rely on forward-looking statements. These statements give our expectations about future performance, but are not guarantees of future performance and are subject to certain risks, uncertainties and assumptions that are difficult to predict; therefore, actual results may differ materially from those expressed or forecasted in any such forward-looking statements. Some of the matters described below in the “Risk Factors” section constitute cautionary statements which identify factors regarding these forward-looking statements, including certain risks and uncertainties, that could cause actual results to vary materially from the future results indicated in these forward-looking statements. Other factors could also cause actual results to vary materially from the future results indicated in such forward-looking statements. Forward-looking statements speak only as of the date they are made, and unless required by law, we undertake no obligation to update publicly any forward-looking statements, whether as a result of new information, future events or otherwise.
We are a leader in the use of natural tissues and innovative technologies to produce orthopedic and other surgical implants that repair and promote the natural healing of human bone and other human tissues and improve surgical outcomes. We process human musculoskeletal and other tissue, including bone, cartilage, tendon, ligament, fascia lata, pericardium, sclera and dermal tissue into allografts, and bovine animal tissue into xenografts, utilizing proprietary BIOCLEANSE® and TUTOPLAST® sterilization processes, for distribution to hospitals and surgeons. We process at two facilities in Alachua, Florida and one facility in Germany and distribute our products and services in all 50 states and in over 31 countries worldwide.
We process human and bovine animal tissue and distribute the tissue through various distribution channels. Our lines of business are comprised primarily of six product categories: spine, sports medicine, dental, surgical specialties, bone graft substitutes, and general orthopedic. The following table presents revenues from tissue distribution and other revenues and their respective percentages of our revenues for the years ended December 31, 2009, 2008 and 2007:
| Year Ended December 31, | ||||||||||||||||||
| 2009 | 2008(1) | 2007(2) | ||||||||||||||||
| (In thousands) | ||||||||||||||||||
| Fees from tissue distribution: |
||||||||||||||||||
| Spine |
$ | 41,087 | 25.0 | % | $ | 41,817 | 28.5 | % | $ | 41,067 | 43.6 | % | ||||||
| Sports medicine |
39,533 | 24.0 | % | 36,330 | 24.8 | % | 27,685 | 29.4 | % | |||||||||
| Dental |
29,985 | 18.2 | % | 27,365 | 18.7 | % | — | 0.0 | % | |||||||||
| Surgical specialties |
26,278 | 16.0 | % | 15,350 | 10.5 | % | — | 0.0 | % | |||||||||
| Bone graft substitutes |
15,662 | 9.6 | % | 14,393 | 9.8 | % | 17,011 | 18.1 | % | |||||||||
| General orthopedic |
7,499 | 4.6 | % | 5,631 | 3.8 | % | 993 | 1.1 | % | |||||||||
| Cardiovascular(3) |
— | 0.0 | % | — | 0.0 | % | 1,952 | 2.1 | % | |||||||||
| Other revenues |
4,483 | 2.7 | % | 5,749 | 3.9 | % | 5,499 | 5.8 | % | |||||||||
| Total revenues |
$ | 164,527 | 100.0 | % | $ | 146,635 | 100.0 | % | $ | 94,207 | 100.0 | % | ||||||
| Domestic revenues |
$ | 141,275 | 85.9 | % | $ | 126,957 | 86.6 | % | $ | 88,121 | 93.5 | % | ||||||
| International revenues |
23,252 | 14.1 | % | 19,678 | 13.4 | % | 6,086 | 6.5 | % | |||||||||
| Total revenues |
$ | 164,527 | 100.0 | % | $ | 146,635 | 100.0 | % | $ | 94,207 | 100.0 | % | ||||||
1
Table of Contents
| (1) | Includes results of Tutogen Medical, Inc. beginning on February 28, 2008. |
| (2) | Regeneration Technologies, Inc. only. |
| (3) | We exited the cardiovascular business as of December 31, 2007. |
For additional financial information concerning our operating performance, please refer to Management’s Discussion and Analysis of Financial Condition and Results of Operations in Part II, Item 7 of this report and our Consolidated Financial Statements in Part II, Item 8 of this report.
We pursue a market-by-market approach to the distribution of our implants, and establish strategic distribution arrangements in order to increase our penetration in selected markets. We have distribution arrangements with Medtronic (“MDT”), Zimmer, Inc. (“Zimmer”), Blackstone Medical, Inc., a subsidiary of Orthofix International NV (“Blackstone”), Stryker Spine, a division of Stryker (“Stryker”), and Aesculap Implant Systems, Inc. (“Aesculap”) for spine implants, and with Zimmer for our dental implants. For our surgical specialties markets, we distribute through Davol, Inc., a subsidiary of C. R. Bard, Inc. (“Davol”), for hernia repair, and breast reconstruction, through Coloplast A/S of Denmark (“Coloplast”) for urology, through IOP, Inc. (“IOP”) for ophthalmology and through ENTrigue Surgical, Inc. (“ENTrigue”) for ENT applications. Zimmer, Stryker, Exactech, Inc., (“Exactech”) and Pioneer Surgical Technology, Inc. (“Pioneer”) are our current distributors for our allograft paste implants, and Wright Medical Technology, Inc. (“Wright”) distributes certain of our sports medicine implants. In the domestic sports medicine and general orthopedic applications we have developed a direct distribution force and a network of independent distributors. In the international market we use Zimmer for our dental implants, a direct distribution force in Germany, and a network of independent distributors outside Germany for other implants.
As part of the tissue procurement process we rely on tissue recovery agencies to perform a risk assessment on every potential donor, interview family members and evaluate the donor’s medical records. Blood collected from each donor by the recovery agency is tested for the presence of viral or bacterial diseases. Bone tissue, soft tissue and tendon and ligament grafts are sterilized through our BioCleanse® process and TUTOPLAST® process only after they have passed this screening by the recovery agency and testing of the blood samples. Our BioCleanse® process is a patented tissue sterilization process that is designed to add a measure of safety to our tissue implants and provide surgeons and patients with tissue implants that are free of spores, fungi, bacteria and viruses and is the only tissue sterilization process that has been reviewed by the FDA. The BioCleanse® process is an automated, multi-step cleansing process which first removes blood and fats, then chemically sterilizes the tissue, while maintaining the structural integrity and biocompatibility of the tissue, and is applied to bone tissue and tendon and ligament tissue. The TUTOPLAST® process utilizes solvent dehydration and chemical inactivation, and is applied to two types of preserved allografts: soft tissue, consisting of fascia lata, fascia temporalis, pericardium, dermis and sclera; and bone tissue; consisting of various configurations of cancellous and cortical bone material. We believe that the BioCleanse® and TUTOPLAST® processes are the industry leading sterilization processes.
We are an accredited member of the American Association of Tissue Banks, or AATB, a nationally recognized association of the tissue banking industry. The accreditation covers the processing, storage and distribution of tissues for transplantation and research and informs users of our human tissue implants that we are in compliance with the minimum safety guidelines of the association.
We were incorporated in 1997 in Florida as a wholly-owned subsidiary of the University of Florida Tissue Bank, “UFTB”. We began operations on February 12, 1998 when UFTB contributed to us its allograft processing operations, related equipment and technologies, distribution arrangements, research and development activities and certain other assets. At the time of our initial public offering in August 2000, we reincorporated in the State of Delaware. On February 27, 2008, we completed our merger with Tutogen Medical, Inc., (“TMI”), a Delaware
2
Table of Contents
corporation, in a tax-free stock-for-stock exchange pursuant to which TMI shareholders received 1.22 shares of our common stock for each share of TMI’s common stock. In connection with the merger, we changed our name from Regeneration Technologies, Inc. to RTI Biologics, Inc. The results of TMI’s operations have been included in our consolidated financial statements since the merger. Our principal offices are located at 11621 Research Circle, Alachua, Florida, and our phone number is (386) 418-8888.
Defects in bone and other human tissue can be caused by a variety of sources including trauma, congenital defect, aging, revision of joint replacements, infectious disease, cancer and other similar conditions. The prevalent method used to repair and promote the healing of defective tissue is surgical intervention, principally through the use of surgical implants. When considering a surgical procedure for tissue repair, surgeons and patients face a number of treatment options including:
| • | metals and synthetics; |
| • | “xenograft” tissue from an animal source; |
| • | “autograft” tissue from the patient; and |
| • | “allograft” tissue from another human donor. |
Metals and Synthetics
Historically, the medical community has used metal and synthetic materials for implant procedures. Metal and synthetic technologies, however, have several shortcomings. One of the principal drawbacks to the use of these materials is that, despite best efforts, they do not facilitate the body’s natural tissue healing process known as “remodeling.” Metal exhibits different properties than bone, and one concern with its use in orthopedics is “stress shielding,” where the bone adjoining the metal can become weak and fragile over time. This problem can be of particular concern to elderly patients who are more likely to suffer from osteoporosis. Additionally, a number of synthetics can wear away in the body, causing a negative immune system response. Other synthetics can chemically break down over time with negative biological and clinical consequences. Using metal and synthetic products may also make it difficult to do a second surgery or revision. Finally, some metal and synthetic products may need to be removed and/or replaced, requiring the risk, expense and inconvenience of a second surgery.
Xenograft Tissue
Surgical procedures using xenograft tissue-based implants are common in many areas of medicine including cardiac and vascular procedures, soft tissue repair and wound care. Xenograft based products are also used in the repair of bone defects in orthopedic surgery as carriers for demineralized bone matrix and bone morphogenic protein products. The production of xenograft products involves recovering animal tissue, typically from cattle (bovine) or pigs (porcine), processing and sterilization, and then transplanting that recovered tissue into a human patient.
Autograft and Allograft Tissue
Surgeons are increasingly utilizing autograft and allograft tissue in their surgical procedures to take advantage of their natural healing characteristics. Autograft procedures involve a surgeon harvesting tissue from one part of a patient’s body for transplant to another part of the body. In contrast to autograft, allograft tissues are recovered from cadaveric donors, processed for certain intended uses and then transplanted by a surgeon into the patient’s body to make the needed repair.
Autografts and allografts are not only “osteoconductive,” meaning they provide a scaffold for new bone to attach itself to, but, in contrast to metals and some synthetics, can be “osteoinductive” as well, meaning they stimulate the growth of new tissue.
3
Table of Contents
A significant drawback to autograft procedures is that they require an additional surgery to harvest the tissue from a second site in the patient’s body. Often in autograft procedures, the site where the patient’s tissue is harvested becomes painful and uncomfortable, and can take longer to heal than the primary surgical site. Additional complications can involve infection, nerve and arterial injury and joint instability. Moreover, a patient may not have sufficient quantities of quality autograft tissue for transplant procedures. We believe allograft is a superior surgical solution compared to autograft because the procedure involves only the primary surgical site.
Our lines of business are comprised primarily of the following markets: spine, sports medicine, dental, surgical specialties, bone graft substitutes, and general orthopedic. Our current implants range from allografts and xenografts that are precision machined for specific surgical applications to grafts conventionally processed for general surgical uses. The following summarizes the marketing and distribution in each of our markets:
| Market | Estimated US Market Size | Distributor | Products | |||
| Spine | $1.159 Million | MDT | Cornerstone® SR Series Grafts | |||
| Cornerstone® Reserve Series Grafts | ||||||
| Cornerstone® Select Series Grafts | ||||||
| Cornerstone™ Conventional Allografts | ||||||
| Tangent™ Impacted Cortical Wedge | ||||||
| Precision™ ALIF | ||||||
| MD™ Series Threaded Cortical Bone Dowel | ||||||
| Zimmer | Puros® A | |||||
| Puros® S | ||||||
| Puros® S2 | ||||||
| Puros® P | ||||||
| Puros® Conventional Allografts | ||||||
| Blackstone (Orthofix) | AlloQuent™ S | |||||
| AlloQuent™ ALIF | ||||||
| Stryker | AlloCraft™ C | |||||
| AlloCraft™ L | ||||||
| Aesculap | Cervical /Lumbar Grafts | |||||
| Sports Medicine | $1,499 Million | Wright | Cancello-Puro® Wedge | |||
| RTI (Direct) | Matrix® HD | |||||
| Sterling® Interference Screws | ||||||
| Sterling® Wedge | ||||||
| Fresh-stored OC—Fem Condyles & Taul | ||||||
| Menisci | ||||||
| Patellar Tendon (BTB) Series | ||||||
| Tibialis Tendons | ||||||
| Achilles Tendons | ||||||
| Assembled BTB and BTB Select | ||||||
| Peroneus Longus | ||||||
| Semi-T - Gracilis | ||||||
| HTO Wedge | ||||||
| Dental | $210 Million | Zimmer | Puros® Blocks | |||
| Puros® Cancellous Chips | ||||||
| Puros® Cortical Chips | ||||||
| Puros® Membranes | ||||||
| CopiOs® Pericardium |
4
Table of Contents
| Market | Estimated US Market Size | Distributor | Products | |||
| Surgical Specialties | ||||||
| Hernia |
$324.4 Million | Davol (Bard) | Allomax® Dermis | |||
| Breast Reconstruction |
$120 Million | Davol (Bard) | Allomax® Dermis | |||
| Urology |
$273 Million | Coloplast | Suspend® Fascia Lata | |||
| Axis® Dermis | ||||||
| Tutoplast® Pericardium | ||||||
| Ophthalmology |
$12.5 Million | IOP | IO Patch® | |||
| BioDome® | ||||||
| BioElevation® | ||||||
| ENT |
$143 Million | ENTrigue | Allograft Dermis | |||
| Allograft Fascia Lata | ||||||
| Allograft Pericardium | ||||||
| Bone Graft Substitute | $334 Million | Zimmer | Puros® RTU Paste | |||
| Exactech | Altiva DBM | |||||
| Regenafil® | ||||||
| Regenaform® | ||||||
| Osteofil® | ||||||
| Opteform® | ||||||
| OsteoBridge™ | ||||||
| Pioneer | BioSet™ | |||||
| Stryker | AlloCraft™ DBM Boat | |||||
| RTI Direct | BioSet® | |||||
| MDT | Osteofil® | |||||
| General Orthopedic/Other | $62 Million | Independent and direct distribution | Conventional Fashioned | |||
| Conventional Intercalary | ||||||
| Conventional Other Faslata | ||||||
| Xeno Wedge (Sterling) |
Spine
The spine market for allografts includes precision machined implants and bone paste utilized in spinal procedures. Our spine allografts are marketed domestically through our non-exclusive relationships with MDT, Blackstone, Zimmer, Stryker and Aesculap.
MDT is our principal distributor in the spine market. We originally entered into an Exclusive Distribution and License Agreement with MDT, dated June 1, 2002, pursuant to which MDT distributed specialty allograft and bone paste for use in spinal surgery. We have amended our agreement with MDT several times. Our current agreement with MDT expires June 1, 2014.
During September 2000, Zimmer began distributing TMI bone products under a ten-year agreement for applications in the spine market. In April 2003, TMI entered into an exclusive license and distribution agreement with Zimmer. Effective with that agreement, Zimmer became a “stocking distributor”. Currently, Zimmer distributes both traditional bone and specialty allografts, and bone paste for use in spinal surgery.
On November 21, 2006, we entered into an Allograft Distribution and Supply Agreement with Blackstone for an initial term of 3 years with additional one year renewals unless terminated in writing by either party. Under this agreement, we process and package implants designed by Blackstone for distribution by Blackstone. On November 17, 2007, this agreement was expanded to include four additional implant designs.
On June 6, 2007, we entered into an Allograft Distribution and Supply Agreement with an initial term of 3 years with Stryker, under which we process and package implants designed by Stryker for distribution by Stryker.
5
Table of Contents
On December 15, 2008, we entered into an Implant Development and Supply Agreement with an initial term of 10 years with Aesculap, under which we will process and package implants designed by Aesculap for distribution by Aesculap.
Sports Medicine
Many repetitive use and sports-related injuries can be addressed with allograft implants. The most prevalent surgeries include repairs to the anterior cruciate ligament, or ACL in the knee, and rotator cuff, in the shoulder. Our principal sports medicine allografts are tendons for ligament reconstruction and our meniscal allografts for transplantation. Many of our sports medicine allografts utilize our patented pre-shape technology and are shaped to fit surgeon’s requirements making them easier and/or faster to implant. Our sports medicine products are marketed domestically through our direct biologics representatives and through our network of independent distributors and internationally through a network of independent distributors. At the end of 2009, our domestic distribution organization consisted of approximately 36 direct biologics representatives.
On February 9, 2007, we entered into a Xenograft Distribution and Supply Agreement with Wright. Under this contract, Wright distributes certain Sterling xenografts as well as xenografts designed by Wright which we process and package. This agreement was expanded to include additional designs effective March 9, 2007.
During 2007 we enhanced the sports medicine product category by introducing the following new products: BioCleanse Meniscus, Bone-Tendon-Bone Select, BioCleanse Peroneus Longus and Sterling Xenograft Wedge. In May 2008, our first fresh-stored osteochondral (OC) allograft for cartilage repair was successfully implanted. In 2009, we introduced our Matrix HD dermis products for wound repair in addition to our Fresh OC Talus products, an extension of the fresh osteochondral line.
Dental
We currently provide various products including cancellous and cortical bone and human and bovine membranes primarily for dental procedures related to augmenting ridge restoration.
During September 2000, Zimmer entered into a ten-year agreement to represent TUTOPLAST® processed bone, under the brand name Puros®, for dental applications. Zimmer markets the implants to the end user and in the United States we ship and bill the customer directly. Distribution fees earned pursuant to the agreements are recognized ratably over the terms of these respective agreements. During 2006, TMI expanded its relationship with Zimmer by adding pericardium and dermis soft tissue implants for dental applications. The additions of these implants provide Zimmer with a full line of biologic implants for the dental surgeons. In August 2007, TMI entered into an agreement to extend Zimmer’s exclusivity internationally into Europe, the Middle East and Asia. The international agreement includes both human and bovine bone and soft tissue implants and allows Zimmer to provide the dentist with a complete product offering for the regenerative procedure.
Surgical Specialties
We distribute implants for surgical specialties which include hernia, breast reconstruction, urology, ophthalmology, and ENT.
In January 2006, TMI entered into a four-year exclusive worldwide distribution agreement with Davol Inc., a subsidiary of C.R. Bard, Inc. (“Davol”), to promote, market and distribute TMI’s line of allograft biologic tissues for hernia repair and the reconstruction of the chest and abdominal walls. Under the agreement, Davol paid TMI $3.3 million in fees for the exclusive distribution rights. On July 13, 2009, the Company and Davol amended their January 2006 distribution agreement with TMI. Under the amended agreement, 1) Davol paid us $8,000 in non-refundable fees for exclusive distribution rights for the distribution to the breast reconstruction market until July 13, 2019, 2) the exclusive worldwide distribution agreement related to the hernia market was
6
Table of Contents
extended to July 13, 2019, and 3) Davol agreed to pay us certain additional exclusive distribution rights fees contingent upon the achievement of certain revenue milestones by Davol during the duration of the contract. The $8,000 exclusivity payment has been deferred and is being recognized as other revenue on a straight-line basis, which coincides with the approximate anticipated distribution over the succeeding ten years, the initial term of the contract. Davol initially entered the human dermis hernia market during the third quarter of 2006.
In June 2006, TMI signed a distribution agreement with Mentor for the exclusive North American rights for the use of TUTOPLAST® dermis for breast reconstruction. Under the agreement, Mentor paid TMI $500,000 in fees for the exclusive distribution rights. Mentor initiated distribution during the third quarter of 2007. The agreement with Mentor expired June 30, 2009.
For urological indications, TMI partnered with Mentor since 1998. During 2006, Mentor sold their urology business to Coloplast and assigned the TMI agreement to Coloplast. In May 2007, TMI signed an agreement with Coloplast extending the current distribution agreement and expanding its scope both internationally, and to include TMI’s Tutoplast® processed bovine pericardium. As a stocking distributor, Coloplast markets TUTOPLAST® fascia lata, dermis, and pericardium tissue grafts.
IOP has been a distributor of TMI’s since 1998, and is the exclusive distributor for TUTOPLAST® processed tissue for ophthalmic applications.
In December 2008, we entered into a biologics development, distribution and supply agreement with ENTrigue to develop, promote, distribute and supply our line of allograft biologic tissues for the ear, nose and throat market. Initial shipments of implants to ENTrigue began in 2009.
Bone Graft Substitutes
Allograft Paste. Surgeons principally use our allograft paste implants, which are composed of demineralized bone matrix (“DBM”) and in some cases a biologic gel carrier, in fracture treatment, bone and joint reconstruction and periodontal applications, such as ridge augmentation for dental implants. Our allograft paste implants are marketed under Osteofil by MDT, Puros® RTU Paste by Zimmer and the Optefil™, Opteform®, Regenafil® and Regenaform® brands with Exactech and we distribute directly the BioSet™ family of paste products through our direct distributor force, Pioneer, and our international distribution network. Our DBM Boat products are marketed under AlloCraft™ by Stryker.
We also distribute these products through MDT, Exactech, Zimmer, Stryker, Pioneer, our own direct distribution force and an international distribution network. We pay Exactech a 3% royalty fee with respect to our moldable allograft pastes distributed by others which is the same formulation as the Exactech product. The agreement is for an initial term expiring June 30, 2014, subject to earlier termination under certain limited circumstances.
In 2007, we entered into an exclusive distribution agreement with Zimmer with an initial term of 10 years, relating to a new bone paste products. The field of use for these products includes all orthopedic, trauma, reconstruction, spine, sports medicine, dental and oral maxillofacial applications. As part of the agreement, Zimmer has made payments to us totaling $5.0 million for the aforementioned exclusive distribution rights, and has to maintain certain minimum order volumes beginning in 2010. The $5.0 million exclusivity payment is being recognized as other revenue on a straight-line basis over the initial term of the contract. The contract provides for repayment, on a pro rata basis, of the exclusivity payments during the initial contract term for specific events of non-performance, as defined in the agreement. The agreement also includes automatic two-year renewal terms, as well as buy-out provisions by both parties upon proper notice of cancellation.
Milled Allograft and Xenograft. Our bone graft substitutes business also includes certain types of blended and milled bone allografts and xenografts, such as our demineralized bone matrix, cortical cancellous chips and ground cancellous chips, used in total hip and knee replacements and for various injuries.
7
Table of Contents
General Orthopedic
Conventional Allografts. Our conventional allograft business includes a wide variety of allograft categories including our intercalary grafts, such as our frozen femoral heads which are used for cancer treatment procedures and hip and knee reconstruction. We also produce various types of fashioned bone, such as strips and shafts used for various orthopedic procedures.
The BioCleanse® Tissue Sterilization Solution
We have developed and utilized in the United States the patented BioCleanse® tissue sterilization process, which is an automated, pharmaceutical grade chemical sterilization process for musculoskeletal bone and certain soft tissue. This process is fully validated to kill or inactivate all classes of conventional pathogens, viruses, microbes, bacteria and fungi. Our BioCleanse® process is able to remove greater than 99% of the blood, fats, lipids and other unwanted materials from the tissue we process. We believe the removal of blood, fat, lipids and other unwanted materials results in faster patient healing because it eliminates the need for the patient’s body to remove these substances using natural processes following surgery. An important element of the BioCleanse® process is that while it removes unwanted materials embedded within the tissue, it maintains the tissue’s structural integrity and compression strength. Studies have shown that tissue sterilized with BioCleanse® maintains the same compression strength as untreated tissue and has significantly greater compression strength than tissue treated with other sterilization processes.
The BioCleanse® process has been reviewed by the FDA which concluded that BioCleanse® was a validated tissue sterilization process demonstrated to prevent contamination and cross contamination of tissue grafts. The significance of the review is that we are not aware of any other tissue sterilization process related to human tissue in our industry that has been reviewed or approved by the FDA. The FDA does not have a formal approval process in place for tissue related processing techniques.
Our BioCleanse® process is currently used on most of our bone allografts and xenografts and most of our musculoskeletal soft tissue products. In addition to the safety advantage of BioCleanse®, it provides us with a number of significant research and development opportunities, including the ability to introduce bone-growth factors and anti-bacterial, anti-viral and cancer fighting agents into our implants.
The TUTOPLAST® Tissue Sterilization Solution
The TUTOPLAST® tissue sterilization process utilizes solvent dehydration and chemical inactivation to remove blood, lipids and extraneous materials, inactivate viruses and prions, and break down RNA and DNA into fragments not capable of replication and disease transmission while preserving the biological and mechanical properties.
We apply the TUTOPLAST® process to two types of preserved allografts: soft tissue, consisting of fascia lata, fascia temporalis, pericardium, dermis and sclera; and bone tissue; consisting of various configurations of cancellous and cortical bone material. Processed pericardium, fascia lata and dermis are collagenous tissue used to repair, replace or line native connective tissue primarily in dental, ophthalmology, urology, plastic and reconstructive surgeries. Dermis is also used in hernia repair and pelvic floor reconstruction. Sclera is used in ophthalmology procedures such as, anterior and posterior segment patch grafting applications for glaucoma, retina and trauma surgery and oculoplastics, as well as contour wrapping of an orbital implant. Processed cortical and cancellous bone material is used in a wide variety of applications in spine, orthopaedic and dental surgeries.
Tissue recovery is the actual removal of tissue from a donor after receiving appropriate consent. Consent is obtained by the tissue recovery group. We operate certain tissue recovery groups directly, and contract with other
8
Table of Contents
independent FDA registered tissue recovery groups which specialize in this activity. Tissue recovery personnel aseptically recover musculoskeletal tissue within 24 hours following a donor’s death, using surgical instruments and sterile techniques similar to those used in hospitals for routine surgery. Recovered tissue is placed on wet or dry ice and then transported by the donor recovery agency to the tissue processor or possibly a research institution.
Under U.S. law, human tissue cannot be sold. However, the law permits the recovery of some costs, such as those involved in recovering, processing and storing tissue and costs related to the advancement of tissue processing technologies, all types of activities in which we are involved.
Our network of donor recovery groups recovers a variety of tissue types from donors including the fibula, femur, tibia, humerus, ilium, pericardium, fascia lata, dermis, sclera, tendons and ligaments. Once we receive tissue that has been screened at our tissue recovery centers, we re-screen this recovered material to guard against transmittable diseases. This screening process includes evaluation of risk on the basis of donor medical history, lifestyle, interviews with the donor’s family and physical examination of the donor. We also perform biomedical testing and culturing at various stages during the processing of tissue, using FDA licensed tests and other tests for known viruses and pathogens.
We have relationships with over thirty tissue donor recovery agencies across the country. We also have relationships outside the United States. Our largest single donor recovery group represented 10% of our total donor tissue for the year ended December 31, 2009. We believe additional recovery group relationships would be available if needed and consequently that the loss of any one of our sources of donor tissue would not have a material impact on our operating results.
We continue to develop new xenograft tissue implants. Implants processed from xenograft tissue are regulated by the FDA as devices and require approval or licenses from the FDA prior to marketing in the United States. The source of our animal tissue are regulated closed herds. The herds are located in the United States and New Zealand. Our clinical studies indicate that our xenograft implants, after processing through BioCleanse® and TUTOPLAST® are equivalent to our allograft implants with respect to functionality, safety and incorporation. We believe the continued development of our xenograft implants will help us meet unmet demand for certain allografts and also allow us to develop new biological implants that cannot currently be made due to structural limitations of human tissue.
Our research and development costs for the years ended December 31, 2009, 2008 and 2007 were $8,899, $8,143 and $5,190, respectively. In 2009, we continued to increase our investment in our R&D efforts by funding new projects including research and development projects at our facility in Neunkirchen, Germany. Our scientists are focusing their studies on delivering optimal regenerative medicine solutions by achieving higher levels of osteoinductivity and osteoconductivity through allograft and xenograft, as well as expanding the uses of the BioCleanse® process technology to infuse healing pharmaceutical components into allograft implants. We are focused on developing new processing technology to accelerate the introduction of new tissue implants in all product categories and to continuously raise the bar for tissue safety.
We plan to continue to develop new implants and technologies within our current market, and to develop additional tissue-related technologies for other markets. We plan to do this by building on our core technology platforms: BioCleanse®, TUTOPLAST®, precision machining, assembled grafts, and tissue and mediated osteoinduction, We operate a dedicated research team working on advanced technologies, and have embedded development/technical teams who work directly in the business/marketing teams focused on expanding the scope and scale of existing competencies such as tissue sterilization and tissue machining to meet specific surgical needs. This approach has resulted in the development of core science platforms, a pipeline of concepts for development and marketing and focused development to meet immediate needs.
9
Table of Contents
In 2009 we launched twenty new implants in spine, orthopedics, sports medicine, dental and bone graft substitutes developed by our research and development teams.
Our business depends upon the significant know-how and proprietary technology we have developed. To protect this know-how and proprietary technology, we rely on a combination of trade secret laws, patents, trademarks and confidentiality agreements. The effect of these intellectual property rights is to define zones of exclusive use of the covered intellectual property.
Our United States patent holdings include patents relating to or covering: BioCleanse®, our proprietary method of cleaning, sterilizing and virally inactivating donor tissue; our MD-Series™ cortical bone dowel; soft and calcified tissue implants; intervertebral spacers and other spinal implants; matrix compositions comprised of muscle or pulverized dermis; the use of the interference screw technology; our segmentally demineralized graft; our demineralized stent or conduit technology; methods and instruments for improved meniscus transplantation; and materials and methods for improved bone- tendon-bone transplantation. Our foreign patent holdings include: our MD-Series™ cortical bone dowel technology, our precision machined spinal implants, our demineralized stent technology, and our BioCleanse® process. The duration of patent rights generally is 20 years from the date of filing of priority application, while trademarks, once registered, essentially is perpetual. We also have patent applications pending in the U.S. (including continuation and divisional applications), and corresponding foreign patent applications pending in various countries including, but not limited to, Canada, Japan, Australia and the European Union. In addition, we rely on our substantial body of know-how, including proprietary tissue recovery techniques and processes, research and development, tissue processing and quality assurance.
The TUTOPLAST® process utilizes proprietary trade secrets.
No significant patents are expected to expire in the next five years.
Competition in the tissue reconstruction and healing industry is intense and subject to rapid technological change and evolving industry requirements and standards. Companies within the industry compete on the basis of design of related instrumentation, efficacy of products, relationships with the surgical community, depth of range of implants, scientific and clinical results, and pricing. Allograft and our xenograft implants compete with autograft, metals and synthetic tissues.
Our principal competitors in the conventional allograft market include the Musculoskeletal Transplant Foundation, or MTF, AlloSource, LifeCell, Inc., a subsidiary of Kinetic Concepts Inc. and LifeNet. Among our competitors in precision machined allograft are Osteotech, MTF, LifeNet and AlloSource. Other companies who process and distribute allograft pastes include Osteotech, AlloSource, Integra, Wright, and MTF. Companies who process and distribute xenograft tissue include Synovis, LifeCell, Cook Surgical and Osteotech.
Government regulation plays a significant role in the processing and distribution of allografts. We procure, process and market our tissue products worldwide. Although some standards of harmonization exist, each country in which we do business has its own specific regulatory requirements. These requirements are dynamic in nature and, as such, are continually changing. New regulations may be promulgated at any time and with limited notice. While we believe that we are in compliance with all existing pertinent international and domestic laws and regulations, there can be no assurance that changes in governmental administrations and regulations will not adversely affect our operations. Failure to comply with applicable requirements could result in fines, injunctions, civil penalties, recall or seizure of products, suspension of production, inability to market current products, criminal prosecution, and/or refusal of the government to authorize the marketing of new products.
10
Table of Contents
In the United States, our allograft products are regulated by the FDA under Title 21 of the Code of Federal Regulations, Parts 1270 and 1271, “Current Good Tissue Practice for Human Cell, Tissue, and Cellular and Tissue-Based Products”. Xenograft tissues and allograft bone paste are regulated as medical devices and subject to FDA 21 CFR, Part 820 (Current Good Manufacturing Practices for Medical Devices) and related statutes from the FDA. In addition, our U.S. operation is subject to certain state and local regulations, as well as compliance to the standards of the tissue bank industry’s accrediting organization, the AATB.
In Germany, allografts are classified as drugs and the German government regulates such products in accordance with German Drug Law. On April 7, 2004, the European Commission issued a human tissue directive to regulate allografts within the European Union (“EU”). Our Neunkirchen facility is presently licensed by the German Health Authorities and in compliance with applicable international laws and regulations, allowing us to market our human and animal implant products globally.
The FDA and international regulatory bodies conduct periodic compliance inspections of both our U.S. and our German processing facilities. Both operations are registered with the U.S. FDA Center for Biologics Evaluation and Research (“CBER”) and are certified to ISO 9001:2000 and ISO 13485:2003. The Alachua facility is also accredited by the AATB and is licensed in the states of Florida, New York, California, Maryland, Delaware and Illinois. The Neunkirchen facility is registered with the German Health Authority (“BfArM”) as a pharmaceutical and medical device manufacturer and is subject to German drug law. We believe that worldwide regulation of allografts and xenografts is likely to intensify as the international regulatory community focuses on the growing demand for these implant products and the attendant safety and efficacy issues of citizen recipients.
We currently market and distribute allografts that are subject to the FDA’s “Human Tissue Intended for Transplantation” and Subparts A and B of “Human Cells, Tissues, and Cellular and Tissue-Based Products” regulations. Under these regulations, we are required to perform donor screening and infectious disease testing and to document this screening and testing for each donor from whom we process tissue. The FDA has authority under the rules to inspect human tissue processing facilities, and to detain, recall, or destroy tissues for which appropriate documentation is not available. We are not required to obtain pre-market approval or clearance from the FDA for allografts that meet the regulation’s definition of “human tissue.”
The FDA may regulate certain allografts as medical devices, drugs, or biologics, which would require that we obtain approval or product licensure from the FDA. This would occur in those cases where the allograft is deemed to have been “more than minimally manipulated or indicated for non-homologous use.” In general, “homologous use” occurs when tissue is used for the same basic function that it fulfilled in the donor. The definitional criteria for making these determinations appear in the FDA’s rules. If the FDA decides that certain of our current or future allografts are more than minimally manipulated or indicated for non-homologous use, it would require licensure, approval or clearances of those allografts. Allografts requiring such approval are subject to pervasive and continuing regulation by the FDA. We would be required to list these allografts as a drug, as a medical device, or as a biologic, and to manufacture them in specifically registered or licensed facilities in accordance with FDA regulation “Current Good Manufacturing Practices.” We would also be subject to post-marketing surveillance and reporting requirements. In addition, our manufacturing facilities and processes would be subject to periodic inspection to assess compliance with Current Good Manufacturing Practices. Our labeling and promotional activities would be subject to scrutiny by the FDA and, in certain instances, by the Federal Trade Commission. The export of drugs, devices and biologics is also subject to more intensive regulation than is the case for human tissue products.
Certain of our allograft pastes are subject to regulation as medical devices under the 510(k) pre-market notification process because they incorporate a non-human gelatin constituent as a carrier. We have received FDA clearance for our flowable and moldable allograft paste implants for orthopedic and spinal applications and for our allograft bone paste for dental applications.
Our xenograft implants are regulated by the FDA as medical devices and are subject to pre-market approval or clearance by the FDA.
11
Table of Contents
RTI xenograft implants are CE-marked and are therefore subject to a design examination review by a Notified Body. In 2006, the RTI US facility received initial CE mark approval for ten different product models, followed by additional product approvals in subsequent years. In addition, the US facility received A “Certificate of Suitability” from the European Directorate for the Quality of Medicines & HealthCare (EDQM) for bovine bone in 2008. This certifies that the bovine bone material complies with the European Pharmacopoeia monograph for products at risk for transmission of animal spongiform disease.
The FDA requires tissue processors to register with the agency and list their tissue products. We are currently an FDA registered tissue processor.
Our tissue processing generates by-products classified as medical hazardous waste by the U.S. Environmental Protection Agency and the Florida Department of Environmental Protection. All such by-products must be segregated and properly disposed of in compliance with applicable environmental regulations. We believe that we are in compliance with the applicable regulations.
Our allografts and xenografts, as well as the chemicals used in processing, are handled and disposed of in accordance with country-specific, federal, state and local regulations. We contract with independent, third parties to perform all gamma-terminal sterilization of our allografts. In view of the engagement of a third party to perform irradiation services, the requirements for compliance with radiation hazardous waste does not apply, and therefore we do not anticipate that having any material adverse effect upon our capital expenditures, results of operations or financial condition. However, we are responsible for assuring that the service is being performed in accordance with applicable regulations.
As of December 31, 2009, we had a total of 784 employees of whom 157 were employed in Germany and of whom 6 were employed in France. Management believes its relations with its employees are good.
Executive Officers of the Registrant
Our executive officers and their respective ages and positions as of the date of this report and their previous business experience are as follows:
| NAME |
AGE |
POSITION WITH THE COMPANY | ||
| Brian K. Hutchison | 50 | Chairman, and Chief Executive Officer | ||
| Thomas F. Rose | 59 | Executive Vice President, Chief Financial Officer and Secretary | ||
| Roger W. Rose |
50 | President, RTI Donor Services and Executive Vice President, Sports Medicine | ||
| Caroline Hartill |
53 | Chief Scientific Officer and Vice President, Quality Assurance & Regulatory Affairs | ||
| Karl H. Koschatzky |
62 | President of International Operations |
Brian K. Hutchison joined RTI in December 2001 as President and Chief Executive Officer and was elected Chairman of the Board of Directors in December 2002. Since February 2008 his title has been Chairman and Chief Executive Officer. Prior to joining RTI, Mr. Hutchison served 12 years in various positions for Stryker, a leading worldwide medical services company. In 1999, Mr. Hutchison was named Senior Vice President and Chief Operating Officer of Stryker Howmedica Osteonics division and was instrumental in implementing the merger between Pfizer’s Howmedica Division and Stryker’s Osteonics Division. Mr. Hutchison subsequently served as Vice President, Worldwide Product Development and Distribution. Mr. Hutchison earned a bachelor’s degree in business administration from Grand Valley State University in 1981. Mr. Hutchison also completed the Program for Management Development from Harvard Business School in 1995.
12
Table of Contents
Thomas F. Rose was named Executive Vice President and Chief Financial Officer in February 2008, with the merger of TMI. Mr. Rose also serves as Corporate Secretary to the Board of Directors. Mr. Rose joined RTI as Vice President and Chief Financial Officer in May 2002. Mr. Rose served the previous ten years as Vice President and Chief Financial Officer at A. M. Todd Group, an international flavor and fragrance company. From 1988 to 1991, Mr. Rose was Vice President and Corporate Controller for Sotheby’s Holdings Inc. in New York. Prior to this, Mr. Rose was an audit partner with Ernst & Young in New York, providing audit, tax and consulting services for clients in a variety of industries for 15 years. Mr. Rose earned a bachelor’s degree in business administration from Western Michigan University in Kalamazoo. Mr. Rose has also completed numerous executive education courses at University of Michigan and Northwestern University focusing on strategy and organizational issues. Mr. Rose is not related to Roger W. Rose.
Roger W. Rose has served as our President of RTI Donor Services and Executive Vice President of Sports Medicine since February 2008, with the merger of TMI. Mr. Rose joined RTI in October 2002 as Vice President of Donor Services and assumed additional responsibility for distribution and marketing in October 2003. Mr. Rose was named Executive Vice President with a focus on sports medicine in August 2004. Mr. Rose served seven years in various positions with Stryker, including Vice President of Sales and Vice President of Marketing for Stryker’s medical division. Mr. Rose also has extensive experience in healthcare sales and marketing with 20 years of service with healthcare companies such as Stryker, Johnson & Johnson, Herman Miller and Nellcor. Mr. Rose holds a bachelor’s degree in business administration from Western Michigan University and has completed continuing education courses in finance, medical marketing and leadership.
Caroline A. Hartill was named Chief Scientific Officer in March 2007. Ms. Hartill joined RTI in November 2001 and was named Vice President of Quality Assurance and Regulatory Affairs in January 2003. Prior to that, Ms. Hartill was an independent consultant working with biotechnology and medical device companies worldwide. Earlier, Ms. Hartill worked for the British Standards Institute (UK) and the Ministry of Defence (UK). Ms. Hartill earned a bachelor’s degree in health sciences from Birmingham University in England, as well as a master’s degree in management from the University of Wolverhampton in England (UK). Ms. Hartill has also earned master’s level credits in sterilization science from Manchester University.
Dr. Karl Koschatzky is the president of international operations for RTI Biologics’ German subsidiary, Tutogen Medical GmbH. He joined Tutogen in 1993 as the technical director of international operations. Subsequently, Dr. Koschatzky served in many capacities with the company, including the planning and implementation of U.S. operations, leading research and development, and since 2006, serving as general manager of German operations. Prior to joining Tutogen, Dr. Koschatzky served as manager of operations, wound care unit, Pfrimmer-Viggo GmbH and scientific manager, wound care business, Lyofil Pfrimmer GmbH. In his role at RTI Biologics, Dr. Koschatzky oversees all aspects of the company’s international operations based in Neunkirchen, Germany. Dr. Koschatzky received his Ph.D. from the University of Erlangen-Nurnberg and Diplom-Chemist.
Our Internet address is www.rtix.com. Information included on our website is not incorporated by reference in our Form 10-K. We make available, free of charge, on or through the investor relations portion of our website, our annual reports on Form 10-K, quarterly reports on Form 10-Q and current reports on Form 8-K and amendments to such reports filed or furnished pursuant to Section 13(a) or 15(d) of the Securities Exchange Act of 1934, as amended (the “Exchange Act”), as soon as reasonably practicable after we file such material with, or furnish it to the Securities and Exchange Commission (“SEC”). These filings are also available on the SEC’s website at www.sec.gov. Also available on our website is our Code of Conduct, our Code of Ethics for Senior Financial Professionals, and the charters for our Audit Committee, Compensation Committee and Nominating and Governance Committee. Within the time period required by the SEC and Nasdaq, we will post any amendment to our Code of Ethics for our Senior Financial Professionals and any waiver of our Code of Conduct applicable to our senior financial professionals, executive officers and directors.
13
Table of Contents
An investment in our common stock involves a high degree of risk. You should consider each of the risks and uncertainties described in this section and all of the other information in this document before deciding to invest in our common stock. Any of the risk factors we describe below could severely harm our business, financial condition and results of operations. The market price of our common stock could decline if any of these risks or uncertainties develop into actual events. You may lose all or part of the money you pay to buy our common stock.
We depend heavily upon sources of human tissue, and any failure to obtain tissue from these sources in a timely manner will interfere with our ability to process and distribute allografts.
The supply of human tissue has at times limited our growth, and may not be sufficient to meet our future needs. In addition, due to seasonal changes in mortality rates, some scarce tissues that we currently use for allografts are at times in particularly short supply. Other factors, some of which are unpredictable, such as negative publicity and regulatory actions in the industry in which we operate also could unexpectedly reduce the available supply of tissue.
We rely on donor recovery groups for their human tissue supplies and we have relationships with over thirty tissue donor recovery agencies across the country. We also have relationships outside the United States. Donor recovery groups are part of relatively complex relationships. They provide support to donor families, are regulated by the FDA, and are often affiliated with hospitals, universities or organ procurement organizations. Our relationships with donor recovery groups, which are critical to our supply of tissue, could be affected by relationships recovery groups have with other organizations. Any negative impact of the regulatory and disease transmission issues facing the industry, as well as the negative publicity that these issues create, could adversely affect our ability to negotiate contracts with recovery groups.
We cannot be sure that the supply of human tissue will continue to be available at current levels or will be sufficient to meet our needs. If we are not able to obtain tissue from current sources sufficient to meet our needs, we may not be able to locate additional replacement sources of tissue on commercially reasonable terms, if at all. Any interruption of our business caused by the need to locate additional sources of tissue would significantly impact our revenues. We expect that our revenues would decline in proportion to any decline in tissue supply.
If we fail to maintain existing strategic relationships or are unable to identify distributors of our implants, revenues may decrease.
We currently derive the majority of our revenues through our relationships with MDT, Zimmer, Davol and Exactech. In addition, MDT and Zimmer provide nearly all of the instrumentation, surgeon training, distribution assistance and marketing materials for the lines of spinal allografts they distribute.
Variations in the timing and volume of orders by MDT and Zimmer may have a material effect upon our revenues. If our relationships with MDT or Zimmer are terminated or reduced for any reason and we are unable to replace these relationships with other means of distribution, we would suffer a material decrease in revenues.
We may need to obtain the assistance of additional distributors to market and distribute our new allografts and technologies, as well as to market and distribute our existing allografts and technologies to new markets or geographical areas. We may not be able to find additional distributors who will agree to and successfully market and distribute our allografts and technologies on commercially reasonable terms, if at all. If we are unable to establish additional distribution relationships on favorable terms, our revenues may decline.
If adverse macro-economic conditions persist, our business and revenues could be adversely affected.
We have been adversely affected by the current macro-economic conditions. If this slowdown continues or worsens, it could have a material adverse effect upon our business and revenues.
14
Table of Contents
If third-party payors fail to provide appropriate levels of reimbursement for the use of our implants, revenues could be adversely affected.
Political, economic and regulatory influences are subjecting the healthcare industry in the United States to fundamental change. In January 2009, the new presidential administration took office. The new administration and U.S. Congress have expressed support for measures intended to expand the number of citizens covered by health insurance and other changes within the health care system, the costs of implementing any of these proposals could be financed, in part, by reductions in the payments made to under Medicare and other government programs or taxes on medical device revenues or both. New federal or state legislation could result in significant changes in the availability, delivery, pricing or payment for healthcare services and products and could reduce the amounts paid for our services, which could have a material adverse effect upon our revenues.
Our revenues will largely depend on the reimbursement of patients’ medical expenses by government health care programs and private health insurers. Governments and private insurers closely examine medical procedures incorporating new technologies to determine whether the procedures will be covered by payment, and if so, the level of payment which may apply. We cannot be sure that third-party payors will continue to reimburse for our implants at the current levels.
If we fail to maintain the high processing standards that implants require or if we are unable to develop processing capacity as required, our commercial opportunity will be reduced or eliminated.
Implants require careful calibration and precise, high-quality processing. Achieving precision and quality control will require skill and diligence by our personnel. If we fail to achieve and maintain these high processing standards, including avoiding processing errors, design defects or component failures; we would be forced to recall, withdraw or suspend distribution of its implants; our implants and technologies could fail quality assurance and performance tests; production and deliveries of our implants could be delayed or cancelled; and our processing costs could increase.
Further, to be successful, we will need to manage our human tissue processing capacity related to tissue recovery and demand for our allografts. It may be difficult for us to match our processing capacity to demand due to problems related to yields, quality control and assurance, tissue availability, adequacy of control policies and procedures, and lack of skilled personnel. If we are unable to process and produce our implants on a timely basis, at acceptable quality and costs, and in sufficient quantities, or if we experience unanticipated technological problems or delays in processing, it will reduce revenues and increase our cost per allograft processed.
Our allograft and xenograft implants and technologies could become subject to significantly greater regulation which could disrupt our business.
The FDA and several states have statutory authority to regulate allograft processing, including our BioCleanse® and TUTOPLAST® processes, and allograft-based materials. The FDA could identify deficiencies in future inspections of our facilities or our suppliers or promulgate future regulatory rulings that could disrupt our business, reducing profitability.
If any of our allografts fall under the FDA’s definitions of “more than minimally manipulated or indicated for non-homologous use,” we would be required to obtain medical device approval or clearance or biologics licenses, which could require clinical testing and could result in disapproval of our license applications and restricted distribution of any of our allografts which may become subject to pre-market approval. The FDA could require post-market testing and surveillance to monitor the effects of such allografts, could restrict the commercial applications of these allografts, and could conduct periodic inspections of our facilities and our suppliers. Delays encountered during the FDA approval process could shorten the patent protection period during which we have the exclusive right to commercialize such technologies or could allow others to come to market before us with similar technologies.
15
Table of Contents
FDA regulations of human cellular and tissue-based products, titled “Good Tissue Practices,” cover all stages of allograft processing, from procurement of tissue to distribution of final allografts. These regulations increased regulatory scrutiny within the industry in which we operate and have lead to increased enforcement action which affects the conduct of our business. In addition, these regulations have a significant effect upon recovery agencies which supply us with tissue and increase the cost of recovery activities. Any such increase would translate into increased costs, as we would expect to reimburse the recovery agencies based on their cost of recovery.
Other regulatory entities include state agencies with statutes covering tissue banking. Regulations issued by Florida, New York, California and Maryland will be particularly relevant to our business. Most states do not currently have tissue banking regulations. However, recent incidents of allograft related infections in the industry may stimulate the development of regulation in other states. It is possible that others may make allegations against us or against donor recovery groups or tissue banks, including those with which we have relationships, about non-compliance with applicable FDA regulations or other relevant statutes and regulations. Allegations like these could cause regulators or other authorities to take investigative or other action, or could cause negative publicity for our business and the industry in which we operate.
Some of our implants contain tissue derived from animals, commonly referred to as xenografts. Xenograft implants are medical devices that are subject to pre-market approval or clearance by the FDA. We have received FDA clearance on several xenograft implants. However, we may not receive FDA approval or clearance to market new implants as we attempt to expand the quantity of xenograft implants available for distribution.
The allograft industry is subject to additional local, state, federal and international government regulations and any increased regulations of our activities could significantly increase the cost of doing business, thereby reducing profitability.
Some aspects of our business are subject to additional local, state, federal or international regulation. Changes in the laws or new interpretations of existing laws could negatively affect our business, revenues or prospects, and increase the costs associated with conducting our business. In particular, the procurement and transplantation of allograft tissue is subject to federal regulation under the National Organ Transplant Act, or NOTA, a criminal statute that prohibits the purchase and sale of human organs, including bone and other tissue. NOTA permits the payment of reasonable fees associated with the transportation, processing, preservation, quality control and storage of human tissue. If NOTA were amended or interpreted in a way that made us unable to include some of these costs in the amounts we charge our customers, it could reduce our revenues and therefore hurt our business. It is possible that more restrictive interpretations or expansions of NOTA could be adopted which could require us to change one or more aspects of our business, at a substantial cost, in order to continue to comply with this statute.
A variety of additional local, state, federal and international government laws and regulations govern our business, including those relating to the storage, handling, generation, manufacture and disposal of medical wastes from the processing of tissue. If we fail to conduct our business in compliance with these laws and regulations, we could be subject to significant liabilities for which our insurance may not be adequate. Moreover, such insurance may not always be available in the future on commercially reasonable terms, if at all. If our insurance proves to be inadequate to pay a damage award, we may not have sufficient funds to do so, which would harm our financial condition and liquidity.
Our success depends on the continued acceptance of our allograft and xenograft implants and technologies by the medical community.
New allograft and xenograft implants, technologies or enhancements to our existing implants may never achieve broad market acceptance, which can be affected by numerous factors, including lack of clinical acceptance of implants and technologies; introduction of competitive tissue repair treatment options which render implants and technologies too expensive or obsolete; lack of availability of third-party reimbursement; and difficulty training surgeons in the use of tissue implants and technologies.
16
Table of Contents
Market acceptance will also depend on our ability to demonstrate that our existing and new implants and technologies are an attractive alternative to existing tissue repair treatment options. Our ability to do so will depend on surgeons’ evaluations of the clinical safety, efficacy, ease of use, reliability and cost-effectiveness of these tissue repair options and technologies. For example, we believe that some in the medical community have lingering concerns over the risk of disease transmission through the use of allografts.
Furthermore, we believe that even if the medical community generally accepts our implants and technologies, recommendations and endorsements by influential surgeons will be important to their broad commercial success. If our implants and technologies are not broadly accepted in the marketplace, we may not achieve a competitive position in the market.
Rapid technological changes could result in reduced demand for our products.
Technologies change rapidly in the industry in which we operate. For example, steady improvements have been made in synthetic human tissue substitutes which compete with our tissue implants. Unlike allografts, synthetic tissue technologies are not dependent on the availability of tissue. If one of our competitors successfully introduces synthetic technologies using recombinant technologies, which stimulate the growth of tissue surrounding an implant, it could result in a decline in demand for tissue implants. We may not be able to respond effectively to technological changes and emerging industry standards, or to successfully identify, develop or support new technologies or enhancements to existing implants in a timely and cost-effective manner, if at all. If we are unable to achieve the improvements in our implants necessary for their successful commercialization, the demand for our implants will suffer.
We face intense competition, which could result in reduced acceptance and demand for our implants and technologies.
The medical technology/biotechnology industry is intensely competitive. We compete with companies in the United States and internationally that engage in the development and production of medical technologies and processes including biotechnology, orthopedic, pharmaceutical, biomaterial and other companies; academic and scientific institutions; and public and private research organizations.
Many of our competitors have much greater financial, technical, research, marketing, distribution, service and other resources than ours. Moreover, our competitors may offer a broader array of tissue repair treatment products and technologies or may have greater name recognition in the marketplace. For example, we compete with a number of divisions of Johnson & Johnson, a company with significantly greater resources and brand recognition than ours. Our competitors, including several development stage companies, may develop or market technologies that are more effective or commercially attractive than our technologies, or that may render our technologies obsolete. For example, the development of a synthetic tissue product that permits remodeling of bones could reduce the demand for allograft and xenograft-based products and technologies.
If we do not manage the medical release of donor tissue into processing in an effective and efficient manner, it could adversely affect profitability.
Many factors affect the level and timing of donor medical releases, including the effectiveness of donor screening currently performed by our donor recovery groups, the timely receipt, recording and review of required medical documentation, and employee loss and turnover in our medical records department. We can provide no assurance that releases will occur at levels which maximize our processing efficiency and minimize our cost per allograft processed.
17
Table of Contents
Negative publicity concerning methods of human tissue recovery and screening of donor tissue in the industry in which we operate may reduce demand for our allografts and impact the supply of available donor tissue.
Media reports or other negative publicity concerning both improper methods of tissue recovery from donors and disease transmission from donated tissue may limit widespread acceptance of our allografts. Unfavorable reports of improper or illegal tissue recovery practices, both in the United States and internationally, as well as incidents of improperly processed tissue leading to transmission of disease, may broadly affect the rate of future tissue donation and market acceptance of allograft technologies.
Potential patients may not be able to distinguish our allografts, technologies and the tissue recovery and the processing procedures from those of our competitors or others engaged in tissue recovery. In addition, families of potential donors may become reluctant to agree to donate tissue to for-profit tissue processors.
If our patents and the other means we use to protect our intellectual property prove to be inadequate, our competitors could exploit our intellectual property to compete more effectively against us.
The law of patents and trade secrets is constantly evolving and often involves complex legal and factual questions. The U.S. government may deny or significantly reduce the coverage we seek our patent applications before or after a patent is issued. We cannot be sure that any particular patent for which we apply will be issued, that the scope of the patent protection will be comprehensive enough to provide adequate protection from competing technologies, that interference proceedings regarding any of our patent applications will not be filed, or that we will achieve any other competitive advantage from a patent. In addition, it is possible that one or more of our patents will be held invalid if challenged or that others will claim rights in or ownership of our patents and other proprietary rights. If any of these events occur, our competitors may be able to use our intellectual property to compete more effectively against us.
Because patent applications are secret until patents are actually issued (or until 18 months after a patent application has been filed) and the publication of discoveries in the scientific or patent literature lags behind actual discoveries, we cannot be certain that our patent application was the first application filed covering a particular invention. If another party’s rights to an invention are superior to ours, we may not be able to obtain a license to use that party’s invention on commercially reasonable terms, if at all. In addition, our competitors, many of which have greater resources than ours, could obtain patents that will prevent, limit or interfere with our ability to make use of our inventions either in the United States or in international markets. Further, the laws of some foreign countries do not always protect our intellectual property rights to the same extent as the laws of the United States. Litigation or regulatory proceedings in the United States or foreign countries also may be necessary to enforce our patent or other intellectual property rights or to determine the scope and validity of the proprietary rights of its competitors. These proceedings can be costly, result in development delays, and divert the attention of our management.
We rely upon unpatented proprietary techniques and processes in tissue recovery, research and development, tissue processing and quality assurance. It is possible that others will independently develop technology similar to our technology or otherwise gain access to or disclose its proprietary technologies. We may not be able to meaningfully protect our rights in these proprietary technologies, which would reduce our ability to compete.
Our success depends in part on our ability to operate without infringing on or misappropriating the proprietary rights of others, and if we are unable to do so we may be liable for damages.
We cannot be certain that U.S. or foreign patents or patent applications of other companies do not exist or will not be issued that would prevent us from commercializing our allografts and technologies. Third parties may sue us for infringing or misappropriating their patent or other intellectual property rights. Intellectual property
18
Table of Contents
litigation is costly. If we do not prevail in litigation, in addition to any damages we might have to pay, we could be required to stop the infringing activity or obtain a license requiring us to make royalty payments. It is possible that a required license will not be available to us on commercially acceptable terms, if at all. In addition, a required license may be non-exclusive, and therefore our competitors may have access to the same technology licensed to us. If we fail to obtain a required license or are unable to design around another company’s patent, we may be unable to make use of some of the affected technologies or distribute the affected allografts, which would reduce our revenues.
The defense costs and settlements for patent infringement lawsuits are not covered by insurance. Patent infringement lawsuits can take years to settle. If we are not successful in our defenses or are not successful in obtaining dismissals of any such lawsuit, legal fees or settlement costs could have a material adverse effect on the our results of operations and the financial position.
We or our competitors may be exposed to product or professional liability claims which could cause us to be liable for damages or cause investors to think we will be liable for similar claims in the future.
The development of allografts and technologies for human tissue repair and treatment entails an inherent risk of product or professional liability claims, and substantial product or professional liability claims may be asserted against us. We are party to a number of legal proceedings relating to product liability.
The implantation of donated human tissue products creates the potential for transmission of communicable diseases. Although we comply with Federal and state regulations and guidelines intended to prevent communicable disease transmission, and our tissue suppliers are also required to comply with such regulations, there can be no assurances that: (i) our tissue suppliers will comply with such regulations intended to prevent communicable disease transmissions; (ii) even if such compliance is achieved, that our products have not been or will not be associated with transmission of disease; or (iii) a patient otherwise infected with disease would not erroneously assert a claim that the use of our products resulted in disease transmission.
We currently have $20 million of product liability insurance and $20 million of professional liability insurance to cover claims. This amount of insurance may not be adequate for potential claims if we are not successful in our defenses. Moreover, insurance covering our business may not always be available in the future on commercially reasonable terms, if at all. If our insurance proves to be inadequate to pay a damage award, we may not have sufficient funds to do so, which would harm our financial condition and liquidity. In addition, successful product liability claims made against one of our competitors could cause claims to be made against us or expose us to a perception that we are vulnerable to similar claims. Claims against us, regardless of their merit or potential outcome, may also hurt our ability to obtain surgeon endorsement of our allografts or to expand our business.
If we are not successful in expanding our distribution activities into international markets, we will not be able to pursue one of our strategies for increasing revenues.
Our international distribution strategies vary by market, as well as within each country in which we operate. For example, we distribute only a portion of our line of allograft and xenograft products within each country. Our international operations will be subject to a number of risks which may vary from the risks we face in the United States, including the need to obtain regulatory approvals in additional foreign countries before we can offer our implants and technologies for use; longer distribution-to-collection cycles, as well as difficulty in collecting accounts receivable; dependence on local distributors; limited protection of intellectual property rights; fluctuations in the values of foreign currencies; and political and economic instability.
We may need to secure additional financing to fund our long-term strategic plan.
We expect to continue to make investments in our business to support our distribution efforts and future programs and initiatives, which may deplete our available cash balances. We believe that our working capital as of December 31, 2009 will be adequate to fund our on-going operations. However, our future liquidity and
19
Table of Contents
capital requirements will depend upon numerous factors, including but not limited to, the progress of our product development and the need for and associated costs relating to regulatory approval, if any, which may be needed to commercialize some of our products under development, or those commercialized products whose regulatory status may change, controlling costs and our ability to continue and grow our product distributions.
We may need to raise additional funds through the issuance of equity and/or debt financing in private placements or public offerings to provide funds to meet the needs of our long-term strategic plan. Additional funds may not be available, or if available, may not be available on favorable terms. Further equity financings, if obtained, may substantially dilute the interest of our pre-existing shareholders. Any additional debt financing may contain restrictive terms that limit our operating flexibility. As a result, any future financings or lack of funding could have a material adverse effect on our business, financial condition or results of operations.
Item 1B. UNRESOLVED STAFF COMMENTS.
None.
UNITED STATES. Our headquarters and U.S. manufacturing facilities are located in Alachua, Florida, near metropolitan Gainesville, include three buildings on approximately 21 acres of property that we own, including a 65,000 square foot processing facility, a 50,000 square foot office building and a 20,000 square foot commons building. These facilities include clean-rooms for tissue processing and packaging, BioCleanse® sterilization chambers, freezers for storage of tissue and laboratory facilities. Our processing facility meets the FDA’s Current Good Manufacturing Practices requirements and allows us to meet the requirements of an FDA approved medical device manufacturer. We believe that we have sufficient space to meet our current and foreseeable future needs.
We currently have separate BioCleanse® and TUTOPLAST® processing units and laboratory operations in approximately 27,000 square feet of leased space related to processing and research in Alachua, Florida.
We also lease space at three of our recovery group locations throughout the United States.
GERMANY. Our facility in Neunkirchen consists of six buildings totaling approximately 33,000 square feet on approximately two acres of land. We own this property and believe it will be sufficient in size and condition to handle anticipated production levels for international markets into the foreseeable future.
FRANCE. Our facility in Aix-en-Provence consists of a small leased distribution office.
We are, from time to time, involved in litigation relating to claims arising out of our operations in the ordinary course of business. We believe that none of these claims that were outstanding as of December 31, 2009 will have a material adverse impact on our financial position or results of operations.
The development of allografts and technologies for human tissue repair and treatment entails an inherent risk of product or professional liability claims, and substantial product or professional liability claims may be asserted against us. We are party to a number of legal proceedings relating to product liability.
The implantation of donated human tissue products creates the potential for transmission of communicable disease. Although we comply with Federal and state regulations and guidelines intended to prevent communicable disease transmission, and our tissue suppliers are also required to comply with such regulations, there can be no assurances that: (i) our tissue suppliers will comply with such regulations intended to prevent communicable disease transmissions; (ii) even if such compliance is achieved, that our products have not been or will not be associated with transmission of disease; or (iii) a patient otherwise infected with disease would not erroneously assert a claim that the use of our products resulted in disease transmission.
20
Table of Contents
We currently have $20 million of product liability insurance and $20 million of professional liability insurance to cover claims. This amount of insurance may not be adequate for potential claims if we are not successful in our defenses. Moreover, insurance covering our business may not always be available in the future on commercially reasonable terms, if at all. If our insurance proves to be inadequate to pay a damage award, we may not have sufficient funds to do so, which would harm our financial condition and liquidity. In addition, successful product liability claims made against one of our competitors could cause claims to be made against us or expose us to a perception that we are vulnerable to similar claims. Claims against us, regardless of their merit or potential outcome, may also hurt our ability to obtain surgeon endorsement of our allografts or to expand our business.
Terminated Litigation
Biomedical Tissue Service, Ltd.—We were a party, along with a number of other defendants, in lawsuits primarily pending in the United States District Court for the District of New Jersey and in the Eighth Judicial Circuit in and for Alachua County, Florida relating to the recall of tissue recovered by Biomedical Tissue Service, Ltd., an unaffiliated recovery agency (“BTS”). In December 2009, we entered into settlement agreements with more than half of the nearly 1,000 cases brought by plaintiffs affected by the recall and as of February 12, 2010 the settlement agreements were finalized for substantially all other cases. All financial terms of the settlements were within our remaining insurance limits and did not materially impact us. We continue to maintain the position that there was no risk of disease transmission from these allograft implants, due to the sterilization methods that these implants were subjected to at RTI.
Osteotech, Inc.—We were a defendant in a lawsuit filed in September 2006 in the United States District Court for the District of New Jersey by Osteotech, Inc. claiming, as amended, infringement of two of their patents by our BioCleanse® process. On December 31, 2009, we entered into a settlement agreement, which provided for, among other things, a de minimis payment to Osteotech, Inc. in exchange for the dismissal of all claims against us. We maintain our position that no infringement of the patents occurred by our BioCleanse® process.
21
Table of Contents
Item 5. MARKET FOR REGISTRANT’S COMMON EQUITY, RELATED STOCKHOLDER MATTERS AND ISSUER PURCHASES OF EQUITY SECURITIES
Market Information and Holders
Our common stock is quoted on the Nasdaq Stock Market under the symbol “RTIX.” The following table sets forth the range of high and low sales prices for our common stock for each quarterly period in the last two fiscal years.
| 2008 |
High | Low | ||||
| First Quarter |
$ | 10.20 | $ | 7.02 | ||
| Second Quarter |
$ | 10.51 | $ | 8.59 | ||
| Third Quarter |
$ | 10.38 | $ | 7.61 | ||
| Fourth Quarter |
$ | 9.45 | $ | 1.30 | ||
| 2009 |
High | Low | ||||
| First Quarter |
$ | 3.38 | $ | 2.08 | ||
| Second Quarter |
$ | 5.02 | $ | 2.40 | ||
| Third Quarter |
$ | 5.11 | $ | 3.41 | ||
| Fourth Quarter |
$ | 4.34 | $ | 3.19 | ||
As of February 16, 2010, we had 398 stockholders of record of our common stock. The closing sale price of our common stock on February 16, 2010 was $3.46 per share.
22
Table of Contents
Stock Performance Graph
The Securities and Exchange Commission requires us to present a chart comparing the cumulative total stockholder return on our common stock with the cumulative total stockholder return of: (1) a broad equity market index, and (2) a published industry or line-of-business index. We selected the Standards & Poors Biotechnology Index based on our good faith determination that this index fairly represents the companies which compete in the same industry or line-of-business as we do. The chart below compares our common stock with the Nasdaq Composite Index and the Standards & Poors Biotechnology Index and assumes an investment of $100 on December 31, 2004 in each of the common stock, the stocks comprising the Nasdaq Composite Index and the stocks comprising the Standards & Poors Biotechnology Index.
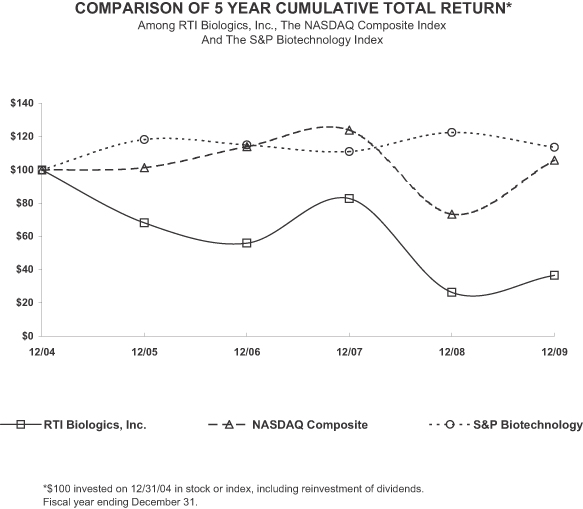
Copyright©2010 S&P, a division of The McGraw-Hill Companies Inc. All rights reserved.
| Total Return Analysis |
12/04 | 12/05 | 12/06 | 12/07 | 12/08 | 12/09 | ||||||
| RTI Biologics, Inc. |
100.00 | 68.23 | 55.92 | 82.82 | 26.34 | 36.64 | ||||||
| NASDAQ Composite |
100.00 | 101.41 | 114.05 | 123.94 | 73.43 | 105.89 | ||||||
| S&P Biotechnology |
100.00 | 118.28 | 115.04 | 111.10 | 122.56 | 113.66 |
23
Table of Contents
Dividend Policy
We have never paid cash dividends. We do not expect to declare or pay any dividends on our common stock in the foreseeable future, but instead intend to retain all earnings, if any, to invest in our operations. The payment of future dividends, if any, will depend upon our future earnings, if any, our capital requirements, financial condition, debt covenant terms, and other relevant factors.
Item 6. SELECTED FINANCIAL DATA.
The statement of operations data set forth below for the years ended December 31, 2009, 2008, and 2007, and selected balance sheet data as of December 31, 2009, and 2008 have been derived from our audited consolidated financial statements and accompanying notes. The consolidated financial statements as of December 31, 2009, and 2008 and for the three years ended December 31, 2009 are included elsewhere in this Form 10-K. The selected consolidated financial data set forth below should be read along with “Item 7. Management’s Discussion and Analysis of Financial Condition and Results of Operations,” and our consolidated financial statements and accompanying notes included elsewhere in this document.
24
Table of Contents
The statement of operations data set forth below for the years ended December 31, 2006, and 2005, and the balance sheet data set forth as of December 31, 2007, 2006 and 2005 have been derived from our audited consolidated financial statements and accompanying notes which are not included elsewhere in this Form 10-K.
| Year Ended December 31, | ||||||||||||||||||||
| 2009 | 2008 | 2007 | 2006 | 2005 | ||||||||||||||||
| (In thousands, except share and per share data) | ||||||||||||||||||||
| Statement of Operations Data: |
||||||||||||||||||||
| Revenues: |
||||||||||||||||||||
| Fees from tissue distribution |
$ | 160,044 | $ | 140,886 | $ | 88,708 | $ | 70,158 | $ | 72,337 | ||||||||||
| Other revenues |
4,483 | 5,749 | 5,499 | 3,812 | 2,862 | |||||||||||||||
| Total revenues |
164,527 | 146,635 | 94,207 | 73,970 | 75,199 | |||||||||||||||
| Costs of processing and distribution |
87,034 | 77,821 | 56,557 | 54,647 | 55,457 | |||||||||||||||
| Gross profit |
77,493 | 68,814 | 37,650 | 19,323 | 19,742 | |||||||||||||||
| Expenses: |
||||||||||||||||||||
| Marketing, general and administrative |
59,325 | 54,168 | 31,040 | 27,252 | 23,350 | |||||||||||||||
| Research and development |
8,899 | 8,143 | 5,190 | 5,403 | 5,003 | |||||||||||||||
| Gain on business exchange |
— | — | (197 | ) | — | — | ||||||||||||||
| Restructuring charges |
42 | 451 | — | — | — | |||||||||||||||
| Goodwill impairment |
— | 103,007 | — | — | — | |||||||||||||||
| Asset impairments and abandonments |
208 | 1,402 | 4,185 | 4,202 | 336 | |||||||||||||||
| Total expenses |
68,474 | 167,171 | 40,218 | 36,857 | 28,689 | |||||||||||||||
| Operating income (loss) |
9,019 | (98,357 | ) | (2,568 | ) | (17,534 | ) | (8,947 | ) | |||||||||||
| Other (expense) income: |
||||||||||||||||||||
| Interest expense |
(544 | ) | (788 | ) | (753 | ) | (898 | ) | (862 | ) | ||||||||||
| Interest income |
273 | 567 | 849 | 934 | 361 | |||||||||||||||
| Foreign exchange loss |
(293 | ) | (9 | ) | — | — | — | |||||||||||||
| Total other (expense) income—net |
(564 | ) | (230 | ) | 96 | 36 | (501 | ) | ||||||||||||
| Income (loss) before income tax (provision) benefit |
8,455 | (98,587 | ) | (2,472 | ) | (17,498 | ) | (9,448 | ) | |||||||||||
| Income tax (provision) benefit |
(2,600 | ) | (1,391 | ) | 376 | 6,373 | 3,897 | |||||||||||||
| Net income (loss) |
$ | 5,855 | $ | (99,978 | ) | $ | (2,096 | ) | $ | (11,125 | ) | $ | (5,551 | ) | ||||||
| Net income (loss) per common share—basic |
$ | 0.11 | $ | (2.00 | ) | $ | (0.07 | ) | $ | (0.37 | ) | $ | (0.20 | ) | ||||||
| Net income (loss) per common share—diluted |
$ | 0.11 | $ | (2.00 | ) | $ | (0.07 | ) | $ | (0.37 | ) | $ | (0.20 | ) | ||||||
| Weighted average shares outstanding—basic |
54,349,391 | 49,912,154 | 29,824,816 | 29,753,166 | 27,754,003 | |||||||||||||||
| Weighted average shares outstanding—diluted |
54,772,489 | 49,912,154 | 29,824,816 | 29,753,166 | 27,754,003 | |||||||||||||||
| As of December 31, | ||||||||||||||||||||
| 2009 | 2008 | 2007 | 2006 | 2005 | ||||||||||||||||
| Balance Sheet Data: |
||||||||||||||||||||
| Cash and cash equivalents |
$ | 17,382 | $ | 20,076 | $ | 18,560 | $ | 15,509 | $ | 25,559 | ||||||||||
| Working capital |
114,944 | 90,189 | 70,621 | 56,784 | 69,597 | |||||||||||||||
| Total assets |
354,507 | 334,080 | 135,966 | 129,808 | 142,262 | |||||||||||||||
| Long-term obligations—less current portion |
11,029 | 3,183 | 1,875 | 3,401 | 5,606 | |||||||||||||||
| Total stockholders’ equity |
289,889 | 281,050 | 111,643 | 109,890 | 117,813 | |||||||||||||||
25
Table of Contents
Item 7. MANAGEMENT’S DISCUSSION AND ANALYSIS OF FINANCIAL CONDITION AND RESULTS OF OPERATIONS.
You should read the following discussion of our financial condition and results of operations together with those financial statements and the notes to these statements included elsewhere in this filing. This discussion contains forward looking statements based on our current expectations, assumptions, estimates and projections about us and our industry. Our actual results could differ materially from those anticipated in these forward looking statements. We undertake no obligation to update publicly any forward looking statements for any reason, even if new information becomes available or other events occur in the future.
Management Overview: Recent Developments
Given the macroeconomic climate we are seeing a decline in elective surgery in our markets which is impacting our growth rates in several of our revenue categories.
Our principal goals for 2010 are to build on our competitive strengths in the marketplace to increase revenues, profitability and cash flow as we focus on improved operational efficiency, productivity and asset management. In addition, after making significant investments in inventories in 2009, we will implement procedures and processes to allow us to reduce inventories and generate positive cash flow from operations.
During 2010 we will maintain our commitment to research and development and introduce new strategically targeted allograft and xenograft implants and focus clinical efforts to support their market acceptance.
Merger with Tutogen Medical, Inc.
On February 27, 2008, we completed our merger with TMI, a Delaware corporation, in a tax-free stock-for-stock merger transaction. TMI, with its consolidated subsidiaries, processes, manufactures and distributes specialty surgical products and performs tissue processing services for dental, spine, urology, hernia repair, breast reconstruction, ophthalmology, and ear, nose and throat applications. The transaction was accounted for using the purchase method of accounting in accordance with Financial Accounting Standards Board (“FASB”) ASC 805, Business Combinations. The results of TMI’s operations have been included in our consolidated financial statements since the merger date of February 27, 2008.
Pursuant to the merger agreement, TMI shareholders received 1.22 shares of our common stock in exchange for each share of TMI common stock held. We issued 23,706,632 shares of our common stock as consideration for this merger. In addition, we assumed 2,889,021 TMI stock options that became fully vested on February 27, 2008, as part of the transaction.
Total purchase price consideration includes $245,557 which represents the fair market value of our securities issued to TMI shareholders, and $20,357 which represents the fair value of the TMI stock options which became fully vested on February 27, 2008 in accordance with change of control provisions included in the stock option agreements. The fair value of the outstanding options was determined using a Black-Scholes valuation model with the following weighted- average assumptions: volatility of 52.87%; risk-free interest rate of 3.35%; remaining expected term of three years; and dividend yield of zero.
A summary of the components of the purchase price consideration is as follows:
| Fair market value of securities issued |
$ | 245,557 | |
| Fair market value of TMI vested stock options assumed |
20,357 | ||
| Transaction costs not included in TMI net tangible assets acquired |
4,714 | ||
| Net receivables from TMI on date of merger |
282 | ||
| Total purchase price |
$ | 270,910 | |
26
Table of Contents
The following unaudited pro forma information shows the results of the Company’s operations as though the merger had occurred as of the beginning of that period for the years ended December 31, 2008 and 2007 (in thousands, except per share data):
| Year Ended December 31, | ||||||||
| 2008 | 2007 | |||||||
| Total revenues |
$ | 155,128 | $ | 148,523 | ||||
| Net loss |
$ | (101,230 | ) | $ | (2,597 | ) | ||
| Basic net loss per share |
$ | (1.86 | ) | $ | (0.05 | ) | ||
| Diluted net loss per share |
$ | (1.86 | ) | $ | (0.05 | ) | ||
The pro forma results have been prepared for comparative purposes only and are not necessarily indicative of the actual results of operations had the merger taken place as of the beginning of the periods presented, or the results that may occur in the future.
Critical Accounting Policies
Although our financial statements have been prepared in accordance with accounting principles generally accepted in the United States, we must often make estimates and judgments that affect reported amounts. These estimates and judgments are based on historical experience and assumptions that we believe to be reasonable under the circumstances. Assumptions and judgments based on historical experience may provide reported results which differ from actual results; however, these assumptions and judgments historically have not varied significantly from actual experience and we therefore do not expect them to vary significantly in the future.
The accounting policies which we believe are “critical,” or require the most use of estimates and judgment, relate to the following items presented in our financial statements: 1) Tissue Inventory Valuation; 2) Accounts Receivable Allowances; 3) Long-Lived Assets; 4) Intangible assets and Goodwill and; 5) Revenue Recognition.
Tissue Inventory Valuation. Accounting principles generally accepted in the United States require that inventory be stated at the lower of cost or market value. Due to various reasons, some tissue within our inventory will never become available for distribution. Therefore, we must make estimates of future distribution from existing inventory in order to write-off inventory which will not be distributed and which therefore has reduced or no market value.
Our management reviews available information regarding processing costs, inventory distribution rates, industry supply and demand, medical releases and processed tissue rejections, in order to determine write-offs of cost above market value. For a variety of reasons, we may from time to time be required to adjust our assumptions as processes change and as we gain better information. Although we continue to refine the information on which we base our estimates, we cannot be sure that our estimates are accurate indicators of future events. Accordingly, future adjustments may result from refining these estimates. Such adjustments may be significant.
Accounts Receivable Allowances. We maintain allowances for doubtful accounts based on our review and assessment of payment history and our estimate of the ability of each customer to make payments on amounts invoiced. If the financial condition of any of our customers were to deteriorate, additional allowances might be required. From time to time we must adjust our estimates. Changes in estimates of the collection risk related to accounts receivable can result in decreases and increases to current period net income.
Long-Lived Assets. We periodically evaluate the period of depreciation or amortization for long-lived assets to determine whether current circumstances warrant revised estimates of useful lives. We review our property, plant and equipment for impairment whenever events or changes in circumstances indicate the carrying value of an asset may not be recoverable. Recoverability is measured by a comparison of the carrying amount to
27
Table of Contents
the net undiscounted cash flows expected to be generated by the asset. An impairment loss would be recorded for the excess of net carrying value over the fair value of the asset impaired. The fair value is estimated based on expected discounted future cash flows. The results of impairment tests are subject to our estimates and assumptions of projected cash flows and operating results. Changes in assumptions or market conditions could result in a change in estimated future cash flows and the likelihood of materially different reported results.
Intangible Assets and Goodwill. FASB ASC 350, Goodwill and Other Intangible Assets, requires companies to test goodwill for impairment on an annual basis at the reporting unit level (or an interim basis if an event occurs that might reduce the fair value of a reporting unit below its carrying value). The Company has one reporting unit and the annual impairment test is performed at each year-end unless indicators of impairment are present and require more frequent testing. FASB ASC 350 also requires that the carrying value of an identifiable intangible asset that has an indefinite life be determined by using a fair value based approach.
Intangible assets generally consist of patents, trademarks, procurement contracts, customer lists, non-compete agreements, distribution agreements and acquired exclusivity rights. Patents and trademarks are amortized on the straight-line method over the shorter of the remaining protection period or estimated useful lives of between 8 and 16 years. Procurement contracts, customer lists, non-compete agreements and distribution agreements are amortized over estimated useful lives of between 5 to 25 years. The acquired exclusivity rights are being amortized over eight years, the remaining term of the amended distribution agreement.
Goodwill is tested for impairment by comparing the fair value of the reporting unit to its carrying amount, including goodwill. In concluding as to fair value of the reporting unit for purposes of testing goodwill, an income approach and a market approach are utilized. The conclusion from these two approaches are weighted equally and then adjusted to incorporate a control premium or acquisition premium that reflects the additional amount a buyer is willing to pay for elements of control and for a premium that reflects the buyer’s perception of its ability to add value through synergies.
In general, the income approach employs a discounted cash flow model that considers 1) assumptions that marketplace participants would use in their estimates of fair value, including the cash flow period, terminal values based on a terminal growth rate and the discount rate, 2) current period actual results, and 3) projected results for future periods that have been prepared and approved by senior management of the Company. The forecasted cash flows do not include synergies that a marketplace participant would be expecting to achieve.
The market approach employs market multiples from guideline public companies operating in our industry. Estimates of fair value are derived by applying multiples based on revenue and earnings before interest, taxes, depreciation and amortization (“EBITDA”) adjusted for size and performance metrics relative to peer companies. A control premium was included in determining the fair value under this approach.
If the carrying amount of the reporting unit exceeds its calculated fair value, the second step of the goodwill impairment test is performed in accordance with FASB ASC 350 to measure the amount of the impairment loss, if any.
Both approaches used in the analysis have a degree of uncertainty. Potential events or changes in circumstances which could impact the key assumptions used in our goodwill impairment evaluation are as follows:
| • | Change in peer group or performance of peer group companies |
| • | Change in the Company’s markets and estimates of future operating performance |
| • | Change in the Company’s estimated market cost of capital |
| • | Change in implied control premiums related to acquisitions in the medical device industry. |
The Company is not aware of any potential events and/or changes in circumstances that could reasonably be expected to negatively affect the key assumptions utilized in its goodwill impairment evaluation.
28
Table of Contents
The valuation of goodwill and intangible assets with indefinite useful lives requires management to use significant judgments and estimates including, but not limited to, projected future revenue and cash flows. Changes in assumptions or market conditions could result in a change in estimated future cash flows and the likelihood of materially different report results. The valuation of the goodwill associated with the merger of TMI will be evaluated on an annual basis in accordance with the provisions of FASB ASC 350 and is subject to risk based on the performance of the Company following the acquisition.
If we overestimate the useful life of an asset, or overestimate the fair value of an asset, and at some time in the future we dispose of that asset for a lower amount than its carrying value, our historically reported total assets and net income would have been higher than they would have been during periods prior to our recognition of the loss on disposal of assets, and lower during the period when we recognize the loss.
Long-lived assets include the goodwill associated with our acquisition of TMI. The fair value of these long-term investments is dependent on their performance, as well as volatility inherent in the external markets for these investments. These determinations require complex calculations based on estimated future benefit and fair value. We have often made investments for which the expected future benefit has not been easily estimated. Examples of such investments include, but are not limited to, our acquisition of TMI, our acquisition of RTI Biologics, Inc.—Cardiovascular (inactive); our investment in equipment; and our investment in obtaining patents. In assessing potential impairment for these investments, we consider these factors as well as forecasted financial performance. If forecasts are not met, impairment charges may be required.
Revenue Recognition. We recognize revenue upon shipping, or receipt by our customers of the processed tissue for implantation, depending on our distribution agreements with our customers or distributors. We recognize our other revenues when all appropriate contractual obligations have been satisfied.
We permit returns of tissue in accordance with the terms of contractual agreements with customers if the tissue is returned in a timely manner, in unopened packaging and from the normal channels of distribution. We provide allowances for returns based upon analysis of our historical patterns of returns, matched against the fees from which they originated. Historical returns have been within the amounts we reserved.
On July 13, 2009, the Company and Davol Inc., a subsidiary of C.R. Bard, Inc. (“Davol”), amended their January 2006 distribution agreement with TMI. Under the amended agreement, 1) Davol paid us $8,000 in non-refundable fees for exclusive distribution rights for the distribution to the breast reconstruction market until July 13, 2019, 2) the exclusive worldwide distribution agreement related to the hernia market was extended to July 13, 2019, and 3) Davol agreed to pay us certain additional exclusive distribution rights fees contingent upon the achievement of certain revenue milestones by Davol during the duration of the contract. The $8,000 exclusivity payment has been deferred and is being recognized as other revenue on a straight-line basis over ten years, the initial term of the contract.
On May 14, 2007, we entered into an exclusive distribution agreement with Zimmer with an initial term of 10 years. The distribution agreement relates to certain new products currently in production. As part of the agreement, Zimmer paid us $5.0 million for the aforementioned exclusive distribution rights, and has to maintain certain minimum order volumes. The $5.0 million exclusivity payment has been deferred and is being recognized as other revenue on a straight-line basis over ten years, the initial term of the contract.
New Accounting Standards. In September 2006, FASB issued FASB ASC 820, Fair Value Measurements and Disclosures, which defines fair value, establishes a framework for measuring fair value in generally accepted accounting principles and expands disclosures about fair value measurements. FASB ASC 820 is effective for financial assets and liabilities in fiscal years beginning after November 15, 2007, and for non-financial assets and liabilities in fiscal years beginning after November 15, 2008. The Company adopted FASB ASC 820 for financial assets and liabilities in the first quarter of 2008 with no material impact to its condensed consolidated financial statements. The Company’s financial assets and liabilities consist of cash and cash equivalents, accounts receivable, accounts payable, debt, and certain current liabilities. Fair value for these instruments is
29
Table of Contents
based on readily available market prices. The Company adopted FASB ASC 820 fair value measurements for non-financial assets and non-financial liabilities in the first quarter of 2009 with no impact to its consolidated financial statements. The Company did not elect fair value accounting for any non-financial assets or non-financial liabilities during the year ended December 31, 2009.
In February 2007, the FASB issued FASB ASC 825, The Fair Value Option for Financial Assets and Financial Liabilities. FASB ASC 825 expands opportunities to use fair value measurement in financial reporting and permits entities to choose to measure many financial instruments and certain other items at fair value. FASB ASC 825 is effective for fiscal years beginning after November 15, 2007. The Company adopted FASB ASC 825 on January 1, 2008 resulting in no impact to its financial condition, results of operations or cash flows as the Company did not elect to report any financial instruments at fair value.
In December 2007, the FASB issued FASB ASC 810, Consolidation, which significantly changes the financial accounting and reporting of noncontrolling (or minority) interests of a subsidiary in consolidated financial statements. The Company adopted FASB ASC 810 in the first quarter of 2009 with no impact to its consolidated financial statements. No noncontrolling interests in entities were acquired by the Company during the year ended December 31, 2009.
In December 2007, the FASB issued FASB ASC 805, Business Combinations, which is intended to improve the relevance, representational faithfulness and comparability of information provided in financial reports about business combinations. FASB ASC 805 requires the acquirer to recognize assets acquired, liabilities assumed and any noncontrolling interest in the acquiree at fair value as of the date of acquisition, effectively eliminating the practice of allocating costs to assets acquired and liabilities assumed based on their estimated fair values as stipulated by FASB ASC 805. Costs incurred to effect the acquisition, previously considered in the aforementioned cost-allocation process, are to be recognized as a component of earnings. FASB ASC 805 is effective for acquisitions consummated on or after January 1, 2009. The Company adopted FASB ASC 805 in the first quarter of 2009 with no impact to its consolidated financial statements. No businesses were acquired by the Company during the year ended December 31, 2009.
In May 2009, the FASB issued FASB ASC 855, Subsequent Events. FASB ASC 855 establishes general standards of accounting for and disclosure of events that occur after the balance sheet date but before financial statements are issued or are available to be issued. FASB ASC 855 is effective for interim and annual financial periods ending after June 15, 2009. The Company adopted FASB ASC 855 during the three months ended June 30, 2009. The Company evaluated subsequent events as of the issuance date of the financial statements, March 1, 2010. FASB ASC 855 did not have a material impact on the Company’s consolidated financial statements.
In June 2009, the FASB issued FASB ASC 105, Generally Accepted Accounting Principles. FASB ASC 105 establishes the FASB Accounting Standards Codification™ as the source of authoritative U.S. GAAP recognized by the FASB to be applied by nongovernmental entities. FASB ASC 105, which changes the referencing of financial standards, was effective for interim or annual financial periods ending after September 15, 2009. The Company adopted FASB ASC 105 during the three months ended September 30, 2009.
Off Balance-Sheet Arrangements
As of December 31, 2009, we had no off-balance-sheet arrangements, as defined in Item 303(a)(4)(ii) of Regulation S-K.
Recent Regulatory Actions
| • | August 2009: Tutoplast Bovine Pericardium—US FDA 510(k) clearance; modified labeling. |
| • | October 2009: Sterling Cancellous Chips, Cubes and Wedge bone void fillers—medical device license approved in Canada. |
30
Table of Contents
Certifications, Accreditations and Inspections
| • | February 2009: State of Florida medical device inspection at RTI Alachua, Florida facility. |
| • | April 2009: American Association of Tissue Banks (AATB) inspection at RTI Alachua, Florida facility. |
| • | May 2009: SGS ISO 13485 surveillance audit at RTI Alachua, Florida facility. |
| • | October 2009: SGS ISO 13485 scope expansion audit at RTI Alachua, Florida facility. |
All registrations, licensures, certifications and accreditations were renewed or continued and no regulatory actions are pending from state and federal inspections.
In June 2009, RTI initiated a voluntary recall of allografts processed from a single donor due to an issue at the testing laboratory. The recall is complete.
Results of Operations
The following tables set forth, in both dollars and as a percentage of revenues, the results of our operations for the years indicated:
| Year Ended December 31, | |||||||||||||||||||||
| 2009 | 2008 | 2007 | |||||||||||||||||||
| (Dollars in thousands) | |||||||||||||||||||||
| Statement of Operations Data: |
|||||||||||||||||||||
| Revenues: |
|||||||||||||||||||||
| Fees from tissue distribution |
$ | 160,044 | $ | 140,886 | $ | 88,708 | |||||||||||||||
| Other revenues |
4,483 | 5,749 | 5,499 | ||||||||||||||||||
| Total revenues |
164,527 | 100.0 | % | 146,635 | 100.0 | % | 94,207 | 100.0 | % | ||||||||||||
| Costs of processing and distribution |
87,034 | 52.9 | 77,821 | 53.1 | 56,557 | 60.0 | |||||||||||||||
| Gross profit |
77,493 | 47.1 | 68,814 | 46.9 | 37,650 | 40.0 | |||||||||||||||
| Expenses: |
|||||||||||||||||||||
| Marketing, general and administrative |
59,325 | 36.1 | 54,168 | 36.9 | 31,040 | 32.9 | |||||||||||||||
| Research and development |
8,899 | 5.4 | 8,143 | 5.6 | 5,190 | 5.5 | |||||||||||||||
| Gain on business exchange |
— | — | — | — | (197 | ) | (0.2 | ) | |||||||||||||
| Restructuring charges |
42 | 0.0 | 451 | 0.3 | — | — | |||||||||||||||
| Goodwill impairment |
— | — | 103,007 | 70.2 | — | — | |||||||||||||||
| Asset impairment and abandonments |
208 | 0.1 | 1,402 | 1.0 | 4,185 | 4.4 | |||||||||||||||
| Total expenses |
68,474 | 41.6 | 167,171 | 114.0 | 40,218 | 42.7 | |||||||||||||||
| Operating income (loss) |
9,019 | 5.5 | (98,357 | ) | (67.1 | ) | (2,568 | ) | (2.7 | ) | |||||||||||
| Other (expense) income: |
|||||||||||||||||||||
| Interest expense |
(544 | ) | (0.3 | ) | (788 | ) | (0.6 | ) | (753 | ) | (0.8 | ) | |||||||||
| Interest income |
273 | 0.2 | 567 | 0.4 | 849 | 0.9 | |||||||||||||||
| Foreign exchange loss |
(293 | ) | (0.2 | ) | (9 | ) | — | — | — | ||||||||||||
| Total other (expense) income—net |
(564 | ) | (0.3 | ) | (230 | ) | (0.2 | ) | 96 | 0.1 | |||||||||||
| Income (loss) before income tax (provision) benefit |
8,455 | 5.2 | (98,587 | ) | (67.3 | ) | (2,472 | ) | (2.6 | ) | |||||||||||
| Income tax (provision) benefit |
(2,600 | ) | (1.6 | ) | (1,391 | ) | (0.9 | ) | 376 | 0.4 | |||||||||||
| Net income (loss) |
$ | 5,855 | 3.6 | % | $ | (99,978 | ) | (68.2 | %) | $ | (2,096 | ) | (2.2 | %) | |||||||
31
Table of Contents
| Year Ended December 31, | Percent Change | ||||||||||||||
| 2009 | 2008(1) | 2007(2) | 2009/2008 | 2008/2007 | |||||||||||
| (In thousands) | |||||||||||||||
| Fees from tissue distribution: |
|||||||||||||||
| Spine |
$ | 41,087 | $ | 41,817 | $ | 41,067 | -1.7 | % | 1.8 | % | |||||
| Sports medicine |
39,533 | 36,330 | 27,685 | 8.8 | % | 31.2 | % | ||||||||
| Dental |
29,985 | 27,365 | — | 9.6 | % | — | |||||||||
| Surgical specialties |
26,278 | 15,350 | — | 71.2 | % | — | |||||||||
| Bone graft substitutes |
15,662 | 14,393 | 17,011 | 8.8 | % | -15.4 | % | ||||||||
| General orthopedic |
7,499 | 5,631 | 993 | 33.2 | % | 467.1 | % | ||||||||
| Cardiovascular(3) |
— | — | 1,952 | — | -100.0 | % | |||||||||
| Other revenues |
4,483 | 5,749 | 5,499 | -22.0 | % | 4.5 | % | ||||||||
| Total revenues |
$ | 164,527 | $ | 146,635 | $ | 94,207 | 12.2 | % | 55.7 | % | |||||
| Domestic revenues |
$ | 141,275 | $ | 126,957 | $ | 88,121 | 11.3 | % | 44.1 | % | |||||
| International revenues |
23,252 | 19,678 | 6,086 | 18.2 | % | 223.3 | % | ||||||||
| Total revenues |
$ | 164,527 | $ | 146,635 | $ | 94,207 | 12.2 | % | 55.7 | % | |||||
| (1) | Includes results of Tutogen Medical, Inc. beginning on February 28, 2008. |
| (2) | Regeneration Technologies, Inc. only. |
| (3) | We exited the cardiovascular business as of December 31, 2007. |
2009 Compared to 2008
Revenues. Our total revenues increased $17.9 million, or 12.2%, to $164.5 million for the year ended December 31, 2009 compared to $146.6 million for the year ended December 31, 2008. The increase in year over year revenues is partially due to the inclusion of TMI revenues for a ten month period in 2008 versus the full year in 2009.
Spine—Revenues from spinal allografts decreased $730,000, or 1.7%, to $41 million for the year ended December 31, 2009 compared to the year ended December 31, 2008. Unit volumes were down 3.8% primarily as a result of lower distributions of cervical grafts offset by higher average revenue per unit of 2.1% due primarily to changes in product mix for both current and new distributors.
Sports Medicine—Revenues from sports medicine allografts increased $3.2 million, or 8.8%, to $39.5 million for the year ended December 31, 2009 compared to the year ended December 31, 2008. Sports medicine revenues increased primarily as a result of unit volume increases. Unit volumes increased by 6.9% due to higher numbers of tendons distributed and new product launches. The remainder of the increase resulted from favorable impact of distribution mix and increases in average revenue per unit.
Dental—Revenues from dental allografts increased $2.6 million, or 9.6%, to $29.9 million for the year ended December 31, 2009 compared to the year ended December 31, 2008. The increase is primarily attributable to twelve months of Dental revenues for the period ended December 31, 2009 versus ten months in 2008, as we did not offer dental allografts prior to our merger with TMI, which closed on February 27, 2008. Revenues from dental allografts for the year ended December 31, 2008 were $27.4 million.
Surgical Specialties—Revenues from surgical specialty allografts increased $10.9 million, or 71.2%, to $26.2 million for the year ended December 31, 2009 compared to the year ended December 31, 2008. The increase resulted primarily from increases in average revenue per unit of 28.0% and higher unit volumes of 34.0% as we recovered higher levels of donated tissue to support this market. In addition, the increase is also due to twelve months of surgical specialties revenues for the period ended December 31, 2009 versus ten months in 2008, as we did not offer surgical specialty allografts (hernia repair, breast reconstruction, urology, and ophthalmology) prior to our merger with TMI Revenues from surgical specialty allografts for the year ended December 31, 2008 were $15.4 million.
32
Table of Contents
Bone Graft Substitutes—Revenues from bone graft substitutes increased $1.3 million, or 8.8%, to $15.6 million for the year ended December 31, 2009 compared to the year ended December 31, 2008. Bone graft substitutes revenues increased primarily as a result of unit volumes increasing by 27.7% offset by a decrease in average revenue per unit of 15% primarily due to changes in product mix. Unit volumes increases related primarily to new product launches during the year.
General Orthopedic—Revenues from general orthopedic allografts increased $1.9 million or 33.2%, to $7.5 million for the year ended December 31, 2009 compared to the year ended December 31, 2008. The increase is primarily attributable an increase in average revenue per unit of 38% due to changes in product mix offset by a decrease in unit volumes of 3.6%. In addition, the increase is also attributable to revenues associated with TMI operations for the twelve months ended December 31, 2009 versus ten months in 2008.
Other Revenues—Revenues from other sources, consisting of tissue recovery fees, biomedical laboratory fees, deferred revenues, shipping fees, distribution of reproductions of our allografts to distributors for demonstration purposes, and restocking fees, decreased by $1.3 million, or 22%, to $4.5 million for the year ended December 31, 2009 compared to the year ended December 31, 2008. The decrease was due to lower tissue recovery fees for the prior year.
Costs of Processing and Distribution. Costs of processing and distribution increased by $9.2 million, or 11.8%, to $87.0 million for the year ended December 31, 2009. As a percentage of revenues, costs of processing and distribution decreased from 53.1% for the year ended December 31, 2008 to 52.9% for the year ended December 31, 2009. The increase in cost of processing and distribution was primarily due to higher levels of tissue distributed during the year.
Marketing, General and Administrative Expenses. Marketing, general and administrative expenses increased by $5.2 million, or 9.5%, to $59.3 million for the year ended December 31, 2009 from $54.1 million for the year ended December 31, 2008. Marketing, general and administrative expenses decreased as a percentage of revenues from 36.9% for the year ended December 31, 2008 to 36.1% for the year ended December 31, 2009. Marketing, general and administrative expenses associated with the TMI German and French business operations increased by $2.5 million compared to the prior year which was primarily attributable to twelve months of TMI expenses for year ended December 31, 2009 compared to ten months in the prior year. In addition, domestic expenses increased $2.7 million, which was primarily due to an increase in direct sales commissions expense of $2.5 million and an increase in legal expenses of $809,000 primarily due to patent litigation, offset by a decrease in payroll and benefits expenses of $1.2 million.
Research and Development Expenses. Research and development expenses increased by $756,000, or 9.3%, to $8.9 million for the year ended December 31, 2009 compared to the year ended December 31, 2008. As a percentage of revenues, research and development expenses decreased from 5.6% for the year ended December 31, 2008 to 5.4% for the year ended December 31, 2009. These increases in expenses are primarily due to an increase in the use of human and animal tissues used in research and development, and an increase in payroll and benefits expense.
Restructuring Charges. As a result of the merger with TMI we implemented a formal restructuring plan which resulted in $42,000 of expenses in the year ended December 31, 2009 compared to $451,000 for the year ended December 31, 2008. These expenses represent severance benefits.
Goodwill Impairment, Asset Impairments and Abandonments. Asset abandonments were $208,000 for the year ended December 31, 2009, which were primarily due to the disposal of non-productive assets. We recognized a $104.4 million loss on goodwill impairment, asset impairments and abandonments during the year ended December 31, 2008. The other than temporary goodwill impairment, asset impairments and abandonment charges of $104.4 million reduced our goodwill and other intangible assets, and includes the abandonment of our remaining cardiovascular assets and other non-productive assets.
33
Table of Contents
Net Other (Expense) Income. Net other expense was $564,000 for the year ended December 31, 2009 compared to net other expense of $230,000 for the year ended December 31, 2008. Interest income decreased by $294,000 for the year ended December 31, 2009 to $273,000 from $567,000 for the year ended December 31, 2008 due to the lower interest earned on the investment of excess cash in interest bearing cash equivalents than the comparable prior year period. Interest expense decreased by $244,000 for the year ended December 31, 2009 to $544,000 from $788,000 for the year ended December 31, 2008 due to lower interest rates paid on long-term obligations. Foreign exchange loss was $293,000 for the year ended December 31, 2009 compared to an exchange loss of $9,000 for the year ended December 31, 2008 due to changes in the value of the U.S. dollar versus the Euro and the timing of payments on foreign currency liabilities
Income Tax Provision. Income tax provision for the year ended December 31, 2009 was $2.6 million compared to an income tax provision of $1.4 million for the year ended December 31, 2008. Our effective tax rate for the year ended December 31, 2009 and 2008 was 30.8% and 1.4%, respectively. Our effective tax rate for the year ended December 31, 2009 as compared to 2008 was impacted by the non-deductible goodwill impairment in year ended December 31, 2008.
2008 Compared to 2007
Revenues. Our total revenues increased $52.4 million, or 55.7%, to $146.6 million for the year ended December 31, 2008 compared to $94.2 million for the year ended December 31, 2007. The increase in year over year revenues includes the revenues from TMI since completion of the merger on February 27, 2008.
Spine—Revenues from spinal allografts increased $750,000, or 1.8%, to $41.8 million for the year ended December 31, 2008 compared to the year ended December 31, 2007. Spine revenues increased primarily due to $1.9 million of revenues associated with TMI for the year ended December 31, 2008 and new product launches. The increase was offset by inventory reductions by distributors. Unit volumes were up 4.3% as a result of higher distributions of cervical grafts to both current and new distributors. Average revenue per unit decreased 2.4% due to changes in product mix.
Sports Medicine—Revenues from sports medicine allografts increased $8.6 million, or 31.2%, to $36.3 million for the year ended December 31, 2008 compared to the year ended December 31, 2007. Sports medicine revenues increased primarily as a result of unit volume increases. Unit volumes increased by 21.5% due to higher numbers of tendons distributed and new product launches. The remainder of the increase resulted from favorable impact of distribution mix and increases in average revenue per unit. Average revenue per unit increased 8.3% due to changes in product mix.
Dental—We did not offer dental allografts prior to our merger with TMI, which closed on February 27, 2008. Revenues from dental allografts for the year ended December 31, 2008 were $27.4 million.
Surgical Specialties—We did not offer surgical specialty allografts (hernia repair, breast reconstruction, urology, and ophthalmology) prior to our merger with TMI, which closed on February 27, 2008. Revenues from surgical specialty allografts for the year ended December 31, 2008 were $15.4 million.
Bone Graft Substitutes—Revenues from bone graft substitutes decreased $2.6 million, or 15.4%, to $14.4 million for the year ended December 31, 2008 compared to the year ended December 31, 2007. Bone graft substitutes revenues decreased primarily as a result of unit volume decreasing by 10.5% due to delays in launching new products and reductions in inventory levels by distributors. The remainder of the decrease was due to unfavorable impact of distribution mix and decrease in average revenue per unit. Average revenue per unit decreased 5.0% due to changes in product mix.
General Orthopedic—Revenues from general orthopedic allografts increased $4.6 million or 467.1%, to $5.6 million for the year ended December 31, 2008 compared to the year ended December 31, 2007. The increase is primarily attributable to $3.9 million of revenues associated with TMI for the year ended December 31, 2008.
34
Table of Contents
Cardiovascular—For the year ended December 31, 2007, we recognized revenues of $2.0 million on distribution of cardiovascular tissue. We completed our exit of the cardiovascular business at the end of 2007 and consequently recognized no comparable revenues in 2008.
Other Revenues—Revenues from other sources, consisting of tissue recovery fees, biomedical laboratory fees, deferred revenues, shipping fees, distribution of reproductions of our allografts to distributors for demonstration purposes, and restocking fees, increased by $250,000, or 4.5%, to $5.7 million for the year ended December 31, 2008 compared to the year ended December 31, 2007.
Costs of Processing and Distribution. Costs of processing and distribution increased by $21.3 million, or 37.6%, to $77.8 million for the year ended December 31, 2008. As a percentage of revenues, costs of processing and distribution decreased from 60.0% for the year ended December 31, 2007 to 53.1% for the year ended December 31, 2008.
The increase in cost of processing and distribution was primarily due to higher levels of tissue distributed during the year. The decrease in cost of processing as a percentage of revenues is due primarily to the acquired TMI product lines which have higher average gross margins than those previously recognized by Regeneration Technologies. Gross margin increased from 40.0% for the year ended December 31, 2007 to 46.9% for the year ended December 31, 2008.
Marketing, General and Administrative Expenses. Marketing, general and administrative expenses increased by $23.1 million, or 74.5%, to $54.2 million for the year ended December 31, 2008 from $31.0 million for the year ended December 31, 2007. Marketing, general and administrative expenses increased as a percentage of revenues from 32.9% for the year ended December 31, 2007 to 36.9% for the year ended December 31, 2008. The increase was primarily due to an increase in distributor commissions of $9.4 million, as a result of higher sports medicine revenue and the addition of commissions on the acquired dental product line of implants; an increase in domestic payroll and benefits expense of $4.1 million; and the addition of $7.3 million in marketing, general and administrative costs associated with the TMI processing facility in Germany.
Research and Development Expenses. Research and development expenses increased by $3.0 million, or 56.9%, to $8.1 million for the year ended December 31, 2008 compared to the year ended December 31, 2007. As a percentage of revenues, research and development expenses increased from 5.5% for the year ended December 31, 2007 to 5.6% for the year ended December 31, 2008. These increases are primarily due to an increase in domestic payroll and benefits expense of $1.5 million, and the addition of $1.2 million in research and development expenses associated with the acquired TMI processing facility in Germany.
Restructuring Charges. As a result of the merger with TMI we implemented a formal restructuring plan which resulted in $451,000 of expenses in the year ended December 31, 2008. These expenses represent severance benefits.
Goodwill Impairment, Asset Impairments and Abandonments. We recognized a $104.4 million loss on goodwill impairment, asset impairments and abandonments during the year ended December 31, 2008 as compared to $4.2 million for the year ended December 31, 2007. The other than temporary goodwill impairment, asset impairments and abandonment charges of $104.4 million reduced our goodwill and other intangible assets, and includes the abandonment of our remaining cardiovascular assets and other non-productive assets.
Net Other (Expense) Income. Net other expense was $230,000 for the year ended December 31, 2008 compared to net other income of $96,000 for the year ended December 31, 2007. Interest income decreased by $282,000 for the year ended December 31, 2008 to $567,000 from $849,000 for the year ended December 31, 2007 due to the lower interest earned on the investment of excess cash in interest bearing cash equivalents than the comparable prior year period. Interest expense increased by $35,000 for the year ended December 31, 2008 to $788,000 from $753,000 for the year ended December 31, 2007 due to additional interest paid on long-term obligations. Foreign exchange loss was $9,000 for the year ended December 31, 2008. We were not subject to currency exchange fluctuations prior to the merger with TMI.
35
Table of Contents
Income Tax Provision. Income tax provision for the year ended December 31, 2008 was $1.4 million compared to an income tax benefit of $376,000 for the year ended December 31, 2007. Our effective tax rate for the year ended December 31, 2008 and 2007 was 1.4% and 15.2%, respectively. Our effective tax rate for the year ended December 31, 2008 as compared to 2007 was negatively impacted by the non-deductible goodwill impairment.
Liquidity and Capital Resources
Cash Flows.
Our cash flows used in operating activities were $4.4 million for the year ended December 31, 2009, compared to cash flows used in operating activities of $631,000 for the year ended December 31, 2008. The cash used in operating activities was primarily due to an investment in inventories of $20.5 million consisting of a growth in unprocessed donor tissue of $6.9 million, tissue in process of $1.4 million, and implantable donor tissue of $10.5 million, offset primarily by $8.0 million in fees for exclusive distribution rights and utilization of tax loss carry-forwards to reduce income taxes payable of $2.9 million.
Our cash flows used in investing activities were $4.8 million for the year ended December 31, 2009 compared to cash used in investing activities of $752,000 for the year ended December 31, 2008. Our investing activities for the year ended December 31, 2009 consisted primarily of purchases of property, plant and equipment of $4.4 million. Our investing activities for the year ended December 31, 2008 consisted primarily of purchases of property, plant and equipment of $5.5 million, offset by cash acquired with the merger with TMI, net of transaction costs of $808,000, and proceeds from the sale of marketable securities of $5.2 million.
Our cash flows provided by financing activities were $6.4 million for the year ended December 31, 2009, compared to cash flows provided by financing activities of $3.0 million for the year ended December 31, 2008. Cash provided by financing activities for the year ended December 31, 2009 consisted primarily of proceeds of long-term obligations of $13.1 million offset by payments on long-term obligations of $5.4 million and net payments of $2.1 million on short-term obligations. Our financing activities for the year ended December 31, 2008 consisted primarily of net proceeds from short-term obligations of $3.5 million, $1.8 million proceeds from long-term obligations and 2.5 million proceeds from exercises of stock options, offset by payments on long-term obligations of $5.1 million.
Liquidity.
As of December 31, 2009, we had $17.4 million of cash and cash equivalents and $2.1 million available under credit lines. We believe that our working capital at December 31, 2009, together with our borrowing ability under our revolving line of credit, will be adequate to fund ongoing operations.
Our accounts receivable days sales outstanding were 49 as of December 31, 2009 and 35 as of December 31, 2008. The increase was due to higher revenues from shipments to customers than cash receipts from customers in the fourth quarter of 2009. Our inventory days outstanding were 386 as of December 31, 2009, compared to 294 as of December 31, 2008. The increase reflects increases in unprocessed donor tissue due to higher expenditures for tissue recoveries during 2009 and higher levels of implantable donor tissue as we increased levels of implants available for our spine, dental, sports medicine and surgical specialties businesses to support additional customers and higher levels of revenue.
Certain Commitments.
On November 24, 2008, we entered into a License Agreement with LifeNet Health, Inc. to license from LifeNet Health certain intellectual property rights that may be used in or useful to our tissue processing efforts. The term of the License Agreement is for seven years or the remaining life of any patent covered by the License
36
Table of Contents
Agreement, whichever is longer. Total monetary consideration for the License Agreement is $4.9 million, to be paid in five annual installments of $1.0 million in each of November 2008 through 2012. The asset is being expensed using straight-line basis over the life of the asset.
On May 14, 2007, we entered into an exclusive distribution agreement with Zimmer with an initial term of 10 years, relating to certain new bone graft substitutes products. As part of the agreement, Zimmer made payments to us totaling $5.0 million for the aforementioned exclusive distribution rights, and has to maintain certain minimum order volumes commencing in 2010. The $5.0 million exclusivity payment has been deferred and is being recognized as other revenue on a straight-line basis over the initial term of the contract. The contract provides for repayment, on a pro rata basis, of the exclusivity payments during the initial contract term for specific events of non-performance, as defined in the agreement. The agreement also includes automatic two-year renewal terms, as well as buy-out provisions by both parties upon proper notice of cancellation.
On December 30, 2008, we refinanced an outstanding term loan of $1.75 million with an interim loan secured by cash deposits until a further refinancing was completed. On January 28, 2009, we, together with our subsidiaries Tutogen Medical, Inc. and Tutogen Medical (United States), Inc., entered into a new credit agreement with Mercantile Bank, a division of Carolina First Bank. The agreement refinanced the interim loan and provides for a $10.0 million revolving line of credit. Both credit facilities mature on February 3, 2011, subject to acceleration upon the occurrence of an event of default, including but not limited to a failure to maintain certain financial ratios. The term loan is payable monthly at $125,000 plus interest at 30 day LIBOR plus 3.0% and the revolving line of credit bears interest at 30 day LIBOR plus 2.50%—3.25% depending on the financial performance of the Company. The facilities are secured by our domestic accounts receivable and inventory.
The new credit agreement also contains various restrictive covenants which limit, among other things, indebtedness, liens and minimum cash balances of $5.0 million with Mercantile Bank.
As part of the merger with TMI on February 27, 2008, we acquired TMI’s long-term obligations, which consist of revolving credit facilities, term loans, and lines of credit.
Under the terms of revolving credit facilities with two German banks, we may borrow up to 1.5 million Euros (1.0 million Euros and 500,000 Euros, respectively) or approximately $2.2 million for working capital needs. At December 31, 2009, we had 1.4 million Euros, or $2.1 million, of borrowings outstanding under the revolving credit agreements with a variable interest rate of 4.50%. The 1.0 million Euro revolving credit facility is secured by a mortgage on our German facility and a 4.0 million Euro guarantee by TMI. The 500,000 Euro revolving credit facility is secured by accounts receivable of TMI’s German subsidiary.
We also have five term loans with a German bank. The first loan of 147,000 Euros, or $211,000, as of December 31, 2009, has an interest rate of 5.00%, payable monthly, maturing June of 2011. The second loan of 563,000 Euros, or $807,000, as of December 31, 2009, has an interest rate of 5.15%, payable quarterly, maturing March of 2012. The third loan of 770,000 Euros, or $1.1 million, as of December 31, 2009 is payable semi-annually at a fixed rate of 5.60% maturing December 2016. The fourth loan of 143,000 Euros, or $205,000, as of December 31, 2009, is payable quarterly at a fixed rate of 5.75%, maturing September 2012. The fifth loan of 810,000 Euros, or $1.2 million, as of December 31, 2009, is payable quarterly at a fixed rate of 4.95%, maturing June 2014. The senior debt and the 1.0 million Euro revolving credit facility with a German bank are secured by a mortgage on our German facility and a $4.0 million Euro guarantee by the TMI parent company. There are no financial covenants under this debt.
In 2008, we entered into a financing agreement with a German bank to finance the expansion of our processing facility in Germany. The agreement called for an interim line of credit during the expansion. The expansion was completed in June 2009 and the line of credit was converted to a term loan. As of December 31, 2009, 810,000 Euros, or $1.2 million, was outstanding on the term loan. Interest on the term loan is 4.95%.
37
Table of Contents
The following table provides a summary of our debt obligations, operating lease payments, estimated future expenditures, other purchase obligations, and unrecognized tax benefits as of December 31, 2009.
| Contractual Payments Due by Period | ||||||||||||||||||
| Total | 2010 | 2011 | 2012 | 2013 | After 2013 | |||||||||||||
| (In thousands) | ||||||||||||||||||
| Debt obligations |
$ | 14,992 | $ | 4,022 | $ | 9,057 | $ | 765 | $ | 496 | $ | 652 | ||||||
| Operating lease payments |
3,211 | 1,509 | 857 | 483 | 257 | 105 | ||||||||||||
| Other significant obligations(1) |
4,676 | 2,316 | 1,120 | 1,110 | 130 | — | ||||||||||||
| Unrecognized tax benefits(2) |
— | — | — | — | — | — | ||||||||||||
| Total |
$ | 22,879 | $ | 7,847 | $ | 11,034 | $ | 2,358 | $ | 883 | $ | 757 | ||||||
| (1) | These amounts consist of contractual obligations for tissue recovery development grants and licensing fees. |
| (2) | Our unrecognized tax benefits of $1,269 at December 31, 2009 has been excluded due to the uncertainty of reliable estimates about the period of cash settlement. |
As of December 31, 2009, we had federal and state net operating loss carryforwards of $16.5 million and $24.5 million, respectively, and research and experimentation tax credit carryforwards of $4.4 million. We anticipate a portion of these amounts will be utilized to offset our tax liability in 2010, with any remainder used in ensuing years. When these carryforwards are fully utilized, they will reduce our taxes payable by $11.0 million.
Impact of Inflation
Inflation generally affects us by increasing our cost of labor, equipment and processing tools and supplies. We do not believe that the relatively low rates of inflation experienced in the United States since the time we began operations have had any material effect on our business.
Item 7A. QUANTITATIVE AND QUALITATIVE DISCLOSURES ABOUT MARKET RISK.
We are subject to market risk from exposure to changes in interest rates based upon our financing, investing and cash management activities. We do not expect changes in interest rates to have a material adverse effect on our income or our cash flows in 2010. However, we cannot assure that interest rates will not significantly change in the future.
In the United States and Germany, the Company is exposed to interest rate risk. Changes in interest rates affect interest income earned on cash and cash equivalents and interest expense on revolving credit arrangements. Except for an interest rate swap associated with 563,000 Euros (or $807,000) of long-term debt over six years that was started March 31, 2006, the Company does not enter into derivative transactions related to cash and cash equivalents or debt. Accordingly, the Company is subject to changes in interest rates. Based on December 31, 2009 outstanding intercompany balances, a 1% change in interest rates would have had a de-minimis impact on our results of operations.
The value of the U.S. dollar compared to the Euro affects our financial results. Changes in exchange rates may positively or negatively affect revenues, gross margins, operating expenses and net income. The international operation currently transacts business primarily in the Euro. Assets and liabilities of foreign subsidiaries are translated at the period end exchange rate while revenues and expenses are translated at the average exchange rate for the period. Intercompany transactions are translated from the Euro to the U.S. dollar. Based on December 31, 2009 outstanding intercompany balances, a 1% change in currency rates would have had a de-minimis impact on our results of operations.
38
Table of Contents
Item 8. FINANCIAL STATEMENTS AND SUPPLEMENTARY DATA.
Our consolidated financial statements and supplementary data required in this item are set forth at the pages indicated in Item 15(a)(1).
Item 9. CHANGES IN AND DISAGREEMENTS WITH ACCOUNTANTS ON ACCOUNTING AND FINANCIAL DISCLOSURE.
Not applicable.
Item 9A. CONTROLS AND PROCEDURES.
Attached as exhibits to this Form 10-K are certifications of our Chief Executive Officer (CEO) and Chief Financial Officer (CFO), which are required in accordance with Rule 13a-15 of the Exchange Act. This “Controls and Procedures” section includes information concerning the controls and controls evaluation referred to in the certifications. The report of Deloitte & Touche LLP, our independent registered public accounting firm, regarding its audit of our internal control over financial reporting appears on pages 44 and 45. This section should be read in conjunction with the certifications and the Deloitte & Touche LLP report for a more complete understanding of the topics presented.
As of the end of the period covered by this report, an evaluation was performed on the effectiveness of the design and operation of our disclosure controls and procedures under the supervision and with the participation of our management, including our Chief Executive Officer and Chief Financial Officer. Disclosure controls and procedures include controls and other procedures that are designed to ensure that information required to be disclosed by the Company in the reports that it files or submits under the Exchange Act is recorded, processed, summarized and reported, within the time periods specified in the Commission’s rules and forms, and accumulated and communicated to the Company’s management, including its principal executive and principal financial officers, or persons performing similar functions, as appropriate to allow timely decisions regarding required disclosure. Based upon that evaluation, our Chief Executive Officer and Chief Financial Officer concluded that the design and operation of our disclosure controls and procedures were effective as of the end of the period covered by this report.
Changes in Internal Controls
There have been no changes in the Company’s internal control over financial reporting during the Company’s last fiscal quarter that materially affected, or are reasonably likely to materially affect the Company’s internal control over financial reporting.
Management’s Report on Effectiveness of Internal Controls
The management of RTI Biologics, Inc. and subsidiaries (the “Company”) is responsible for establishing and maintaining adequate internal control over financial reporting (as defined in Securities Exchange Act Rules 13a-15(f) and 15d-15(f)). The Company’s internal control system was designed to provide reasonable assurance to the Company’s management and board of directors regarding the preparation and fair presentation of published financial statements.
All internal control systems, no matter how well designed, have inherent limitations. Therefore, even those systems determined to be effective can provide only reasonable assurance with respect to financial statement preparation and presentation.
The Company’s management assessed the effectiveness of the Company’s internal control over financial reporting as of December 31, 2009. In making this assessment, it used the criteria set forth by the Committee of
39
Table of Contents
Sponsoring Organizations of the Treadway Commission (“COSO”) in Internal Control—Integrated Framework. Based on this assessment, management believes that, as of December 31, 2009, the Company’s internal control over financial reporting is effective based on those criteria.
The Company’s independent registered public accounting firm has issued a report on the Company’s internal control over financial reporting. This report appears on pages 44 and 45.
None.
40
Table of Contents
Item 10. DIRECTORS, EXECUTIVE OFFICERS AND CORPORATE GOVERNANCE.
The information set forth under the caption “Directors and Executive Officers” in our definitive proxy statement to be used in connection with our 2010 Annual Meeting of Stockholders is incorporated by reference. Information relating to our Code of Ethics that applies to our senior financial professionals is available on our website at www.rtix.com/codeofethics.aspx.
Item 11. EXECUTIVE COMPENSATION.
The information set forth under the caption “Executive Compensation” in our definitive proxy statement to be used in connection with our 2010 Annual Meeting of Stockholders is incorporated by reference.
Item 12. SECURITY OWNERSHIP OF CERTAIN BENEFICIAL OWNERS AND MANAGEMENT AND RELATED STOCKHOLDER MATTERS.
The information set forth under the captions “Beneficial Ownership of Common Stock by Certain Stockholders and Management” and “Securities Authorized For Issuance Under Equity Compensation Plans” in our definitive proxy statement to be used in connection with our 2010 Annual Meeting of Stockholders is incorporated by reference.
Item 13. CERTAIN RELATIONSHIPS AND RELATED TRANSACTIONS, AND DIRECTOR INDEPENDENCE.
The information set forth under the caption “Certain Relationships and Related Transactions” in our definitive proxy statement to be used in connection with our 2010 Annual Meeting of Stockholders is incorporated by reference.
Item 14. PRINCIPAL ACCOUNTING FEES AND SERVICES.
The information set forth under the caption “Audit Matters—Audit Fees” in our definitive proxy statement to be used in connection with our 2010 Annual Meeting of Stockholders is incorporated by reference.
41
Table of Contents
Item 15. EXHIBITS AND FINANCIAL STATEMENT SCHEDULES.
| (a) | (1) Financial Statements: |
See “Index to Consolidated Financial Statements and Consolidated Financial Statement Schedule” on page 43, the Independent Registered Public Accounting Firm’s Report on pages 44 and 45 and the Consolidated Financial Statements on pages 46 to 49, all of which are incorporated herein by reference.
| (2) | Financial Statement Schedule: |
The following consolidated financial statement schedule is filed as part of this Report:
Schedule II, Valuation and Qualifying Accounts for the years ended December 31, 2009, 2008 and 2007 is included in the Consolidated Financial Statements of RTI Biologics, Inc. and subsidiaries on page 72. All other financial statement schedules are omitted because they are inapplicable, not required or the information is indicated elsewhere in the consolidated financial statements or the notes thereto.
| (3) | Exhibits: |
The information required by this item is set forth on the exhibit index that follows the signature page of this report.
42
Table of Contents
INDEX TO CONSOLIDATED FINANCIAL STATEMENTS
| Page | ||
| Consolidated Financial Statements of RTI Biologics, Inc. and Subsidiaries |
||
| 44 | ||
| 46 | ||
| Consolidated Statements of Operations—Years Ended December 31, 2009, 2008 and 2007 |
47 | |
| Consolidated Statements of Stockholders’ Equity—Years Ended December 31, 2009, 2008 and 2007 |
48 | |
| Consolidated Statements of Cash Flows—Years Ended December 31, 2009, 2008 and 2007 |
49 | |
| Notes to Consolidated Financial Statements—Years Ended December 31, 2009, 2008 and 2007 |
50 - 71 | |
| 72 | ||
43
Table of Contents
REPORT OF INDEPENDENT REGISTERED PUBLIC ACCOUNTING FIRM
To the Board of Directors and Stockholders of
RTI Biologics, Inc.
Alachua, Florida
We have audited the accompanying consolidated balance sheets of RTI Biologics, Inc. and subsidiaries (the “Company”) as of December 31, 2009 and 2008, and the related consolidated statements of operations, stockholders’ equity, and cash flows for each of the three years in the period ended December 31, 2009. Our audits also included the financial statement schedule listed in Item 15(a)(2). We also have audited the Company’s internal control over financial reporting as of December 31, 2008, based on criteria established in Internal Control—Integrated Framework issued by the Committee of Sponsoring Organizations of the Treadway Commission. The Company’s management is responsible for these financial statements and financial statement schedule, for maintaining effective internal control over financial reporting, and for its assessment of the effectiveness of internal control over financial reporting, included in the accompanying Management’s Report on Effectiveness of Internal Controls. Our responsibility is to express an opinion on these financial statements and financial statement schedule and an opinion on the Company’s internal control over financial reporting based on our audits.
We conducted our audits in accordance with the standards of the Public Company Accounting Oversight Board (United States). Those standards require that we plan and perform the audit to obtain reasonable assurance about whether the financial statements are free of material misstatement and whether effective internal control over financial reporting was maintained in all material respects. Our audits of the financial statements included examining, on a test basis, evidence supporting the amounts and disclosures in the financial statements, assessing the accounting principles used and significant estimates made by management, and evaluating the overall financial statement presentation. Our audit of internal control over financial reporting included obtaining an understanding of internal control over financial reporting, assessing the risk that a material weakness exists, testing and evaluating the design and operating effectiveness of internal control based on the assessed risk. Our audits also included performing such other procedures as we considered necessary in the circumstances. We believe that our audits provide a reasonable basis for our opinions.
A company’s internal control over financial reporting is a process designed by, or under the supervision of, the company’s principal executive and principal financial officers, or persons performing similar functions, and effected by the company’s board of directors, management, and other personnel to provide reasonable assurance regarding the reliability of financial reporting and the preparation of financial statements for external purposes in accordance with generally accepted accounting principles. A company’s internal control over financial reporting includes those policies and procedures that (1) pertain to the maintenance of records that, in reasonable detail, accurately and fairly reflect the transactions and dispositions of the assets of the company; (2) provide reasonable assurance that transactions are recorded as necessary to permit preparation of financial statements in accordance with generally accepted accounting principles and that receipts and expenditures of the company are being made only in accordance with authorizations of management and directors of the company; and (3) provide reasonable assurance regarding prevention or timely detection of unauthorized acquisition, use, or disposition of the company’s assets that could have a material effect on the financial statements.
Because of the inherent limitations of internal control over financial reporting, including the possibility of collusion or improper management override of controls, material misstatements due to error or fraud may not be prevented or detected on a timely basis. Also, projections of any evaluation of the effectiveness of the internal control over financial reporting to future periods are subject to the risk that the controls may become inadequate because of changes in conditions, or that the degree of compliance with the policies or procedures may deteriorate.
44
Table of Contents
In our opinion, the consolidated financial statements referred to above present fairly, in all material respects, the financial position of RTI Biologics, Inc. and subsidiaries as of December 31, 2009 and 2008, and the results of their operations and their cash flows for each of the three years in the period ended December 31, 2009, in conformity with accounting principles generally accepted in the United States of America. Also, in our opinion, such financial statement schedule, when considered in relation to the basic consolidated financial statements taken as a whole, presents fairly, in all material respects, the information set forth therein. Also, in our opinion, the Company maintained, in all material respects, effective internal control over financial reporting as of December 31, 2009, based on the criteria established in Internal Control—Integrated Framework issued by the Committee of Sponsoring Organizations of the Treadway Commission.
/s/ DELOITTE & TOUCHE LLP
Certified Public Accountants
Tampa, Florida
March 1, 2010
45
Table of Contents
RTI BIOLOGICS, INC. AND SUBSIDIARIES
Consolidated Balance Sheets
(In thousands, except share data)
| December 31, | ||||||||
| 2009 | 2008 | |||||||
| Assets | ||||||||
| Current Assets: |
||||||||
| Cash and cash equivalents |
$ | 17,382 | $ | 20,076 | ||||
| Accounts receivable—less allowances of $1,296 at December 31, 2009 and $1,735 at December 31, 2008 |
22,228 | 14,668 | ||||||
| Inventories—net |
93,935 | 75,182 | ||||||
| Prepaid and other current assets |
2,066 | 4,044 | ||||||
| Deferred tax assets—net |
17,331 | 17,740 | ||||||
| Total current assets |
152,942 | 131,710 | ||||||
| Property, plant and equipment—net |
46,562 | 47,622 | ||||||
| Deferred tax assets—net |
7,007 | 7,348 | ||||||
| Goodwill |
134,681 | 134,432 | ||||||
| Other intangible assets—net |
12,301 | 12,675 | ||||||
| Other assets—net |
1,014 | 293 | ||||||
| Total assets |
$ | 354,507 | $ | 334,080 | ||||
| Liabilities and Stockholders’ Equity | ||||||||
| Current Liabilities: |
||||||||
| Accounts payable |
$ | 19,844 | $ | 16,915 | ||||
| Accrued expenses |
11,707 | 16,539 | ||||||
| Short-term obligations |
2,101 | 4,166 | ||||||
| Deferred tax liabilities |
839 | — | ||||||
| Current portion of deferred revenue |
1,645 | 2,264 | ||||||
| Current portion of long-term obligations |
1,862 | 1,637 | ||||||
| Total current liabilities |
37,998 | 41,521 | ||||||
| Long-term obligations—less current portion |
11,029 | 3,183 | ||||||
| Other long-term liabilities |
5,104 | 4,183 | ||||||
| Deferred tax liabilities |
106 | 129 | ||||||
| Deferred revenue |
10,381 | 4,014 | ||||||
| Total liabilities |
64,618 | 53,030 | ||||||
| Stockholders’ equity: |
||||||||
| Common stock, $.001 par value: 150,000,000 shares authorized; |
55 | 55 | ||||||
| Additional paid-in capital |
406,339 | 403,746 | ||||||
| Accumulated other comprehensive loss |
(374 | ) | (765 | ) | ||||
| Accumulated deficit |
(116,117 | ) | (121,972 | ) | ||||
| Less treasury stock, 133,296 shares, at cost |
(14 | ) | (14 | ) | ||||
| Total stockholders’ equity |
289,889 | 281,050 | ||||||
| Total liabilities and stockholders’ equity |
$ | 354,507 | $ | 334,080 | ||||
See notes to consolidated financial statements.
46
Table of Contents
RTI BIOLOGICS, INC. AND SUBSIDIARIES
Consolidated Statements of Operations
(In thousands, except share and per share data)
| Year Ended December 31, | ||||||||||||
| 2009 | 2008 | 2007 | ||||||||||
| Revenues: |
||||||||||||
| Fees from tissue distribution |
$ | 160,044 | $ | 140,886 | $ | 88,708 | ||||||
| Other revenues |
4,483 | 5,749 | 5,499 | |||||||||
| Total revenues |
164,527 | 146,635 | 94,207 | |||||||||
| Costs of processing and distribution |
87,034 | 77,821 | 56,557 | |||||||||
| Gross profit |
77,493 | 68,814 | 37,650 | |||||||||
| Expenses: |
||||||||||||
| Marketing, general and administrative |
59,325 | 54,168 | 31,040 | |||||||||
| Research and development |
8,899 | 8,143 | 5,190 | |||||||||
| Gain on business exchange |
— | — | (197 | ) | ||||||||
| Restructuring charges |
42 | 451 | — | |||||||||
| Goodwill impairment |
— | 103,007 | — | |||||||||
| Asset impairments and abandonments |
208 | 1,402 | 4,185 | |||||||||
| Total expenses |
68,474 | 167,171 | 40,218 | |||||||||
| Operating income (loss) |
9,019 | (98,357 | ) | (2,568 | ) | |||||||
| Other (expense) income: |
||||||||||||
| Interest expense |
(544 | ) | (788 | ) | (753 | ) | ||||||
| Interest income |
273 | 567 | 849 | |||||||||
| Foreign exchange loss |
(293 | ) | (9 | ) | — | |||||||
| Total other (expense) income—net |
(564 | ) | (230 | ) | 96 | |||||||
| Income (loss) before income tax (provision) benefit |
8,455 | (98,587 | ) | (2,472 | ) | |||||||
| Income tax (provision) benefit |
(2,600 | ) | (1,391 | ) | 376 | |||||||
| Net income (loss) |
$ | 5,855 | $ | (99,978 | ) | $ | (2,096 | ) | ||||
| Net income (loss) per common share—basic |
$ | 0.11 | $ | (2.00 | ) | $ | (0.07 | ) | ||||
| Net income (loss) per common share—diluted |
$ | 0.11 | $ | (2.00 | ) | $ | (0.07 | ) | ||||
| Weighted average shares outstanding—basic |
54,349,391 | 49,912,154 | 29,824,816 | |||||||||
| Weighted average shares outstanding—diluted |
54,772,489 | 49,912,154 | 29,824,816 | |||||||||
See notes to consolidated financial statements.
47
Table of Contents
RTI BIOLOGICS, INC. AND SUBSIDIARIES
Consolidated Statements of Stockholders’ Equity
(In thousands)
| Common Stock |
Additional Paid-in Capital |
Accumulated Other Comprehensive Loss |
Accumulated Deficit |
Treasury Stock |
Total | |||||||||||||||||
| Balance, January 1, 2007 |
$ | 30 | $ | 129,772 | $ | — | $ | (19,898 | ) | $ | (14 | ) | $ | 109,890 | ||||||||
| Exercise of common stock options |
— | 725 | — | — | — | 725 | ||||||||||||||||
| Stock-based compensation |
— | 2,974 | — | — | — | 2,974 | ||||||||||||||||
| Income tax benefit from nonqualified stock option exercises |
— | 150 | — | — | — | 150 | ||||||||||||||||
| Net loss |
— | — | — | (2,096 | ) | — | (2,096 | ) | ||||||||||||||
| Balance, December 31, 2007 |
30 | 133,621 | — | (21,994 | ) | (14 | ) | 111,643 | ||||||||||||||
| Net loss |
— | — | — | (99,978 | ) | — | (99,978 | ) | ||||||||||||||
| Foreign currency translation adjustment |
— | — | (765 | ) | — | — | (765 | ) | ||||||||||||||
| Comprehensive loss |
— | — | (765 | ) | (99,978 | ) | — | (100,743 | ) | |||||||||||||
| Exercise of common stock options |
1 | 2,492 | — | — | — | 2,493 | ||||||||||||||||
| Equity instruments issued in connection with Tutogen Medical merger—net of fees |
24 | 265,890 | — | — | — | 265,914 | ||||||||||||||||
| Stock-based compensation |
— | 1,648 | — | — | — | 1,648 | ||||||||||||||||
| Income tax benefit from nonqualified stock option exercises |
— | 95 | — | — | — | 95 | ||||||||||||||||
| Balance, December 31, 2008 |
55 | 403,746 | (765 | ) | (121,972 | ) | (14 | ) | 281,050 | |||||||||||||
| Net income |
— | — | — | 5,855 | — | 5,855 | ||||||||||||||||
| Foreign currency translation adjustment |
— | — | 391 | — | — | 391 | ||||||||||||||||
| Comprehensive income |
— | — | 391 | 5,855 | — | 6,246 | ||||||||||||||||
| Exercise of common stock options |
— | 525 | — | — | — | 525 | ||||||||||||||||
| Stock-based compensation |
— | 1,882 | — | — | — | 1,882 | ||||||||||||||||
| Income tax benefit from nonqualified stock option exercises |
— | 186 | — | — | — | 186 | ||||||||||||||||
| Balance, December 31, 2009 |
$ | 55 | $ | 406,339 | $ | (374 | ) | $ | (116,117 | ) | $ | (14 | ) | $ | 289,889 | |||||||
See notes to consolidated financial statements.
48
Table of Contents
RTI BIOLOGICS, INC. AND SUBSIDIARIES
Consolidated Statements of Cash Flows
(In thousands)
| Year Ended December 31, | ||||||||||||
| 2009 | 2008 | 2007 | ||||||||||
| Cash flows from operating activities: |
||||||||||||
| Net income (loss) |
$ | 5,855 | $ | (99,978 | ) | $ | (2,096 | ) | ||||
| Adjustments to reconcile net income (loss) to net cash (used in) provided by operating activities: |
||||||||||||
| Depreciation and amortization expense |
7,139 | 7,994 | 5,586 | |||||||||
| Amortization of deferred financing costs |
72 | 199 | 170 | |||||||||
| Provision for bad debts and product returns |
209 | 638 | 386 | |||||||||
| Provision for inventory writedowns |
1,940 | 2,372 | 1,479 | |||||||||
| Amortization of deferred revenue |
(2,283 | ) | (2,033 | ) | (333 | ) | ||||||
| Deferred income tax benefit (provision) |
1,529 | 334 | (1,127 | ) | ||||||||
| Stock-based compensation |
1,882 | 1,648 | 2,974 | |||||||||
| Asset impairments |
— | 103,927 | 4,094 | |||||||||
| Tax benefit attributable from exercise of stock options |
212 | 432 | 150 | |||||||||
| Excess tax benefit from exercise of stock options |
(186 | ) | (337 | ) | (150 | ) | ||||||
| Gain on business exchange |
— | — | (197 | ) | ||||||||
| Loss on asset abandonments |
200 | 442 | 11 | |||||||||
| Write-off of capitalized patent and trademark expenses |
8 | 40 | 80 | |||||||||
| Changes in assets and liabilities: |
— | |||||||||||
| Accounts receivable |
(7,665 | ) | (294 | ) | (802 | ) | ||||||
| Inventories |
(20,540 | ) | (22,360 | ) | (4,300 | ) | ||||||
| Prepaid and other current assets |
1,984 | 1,771 | (4,326 | ) | ||||||||
| Other long-term assets |
(790 | ) | (144 | ) | 242 | |||||||
| Accounts payable |
2,007 | 1,787 | (1,416 | ) | ||||||||
| Accrued expenses |
(4,866 | ) | 89 | 1,898 | ||||||||
| Other non-current liabilities |
919 | 2,842 | 460 | |||||||||
| Deferred revenue |
8,000 | — | 5,000 | |||||||||
| Net cash (used in) provided by operating activities |
(4,374 | ) | (631 | ) | 7,783 | |||||||
| Cash flows from investing activities: |
||||||||||||
| Purchases of property, plant and equipment |
(4,422 | ) | (5,474 | ) | (2,173 | ) | ||||||
| Cash acquired in merger, net of transaction costs |
— | 808 | (492 | ) | ||||||||
| Proceeds from sale of marketable securities |
— | 5,192 | — | |||||||||
| Proceeds from sale of property, plant and equipment |
18 | 63 | 80 | |||||||||
| Patent and acquired intangible asset costs |
(387 | ) | (1,341 | ) | (721 | ) | ||||||
| Net cash used in investing activities |
(4,791 | ) | (752 | ) | (3,306 | ) | ||||||
| Cash flows from financing activities: |
||||||||||||
| Proceeds from exercise of stock options |
525 | 2,492 | 725 | |||||||||
| Excess tax benefit from exercise of stock options |
186 | 337 | 150 | |||||||||
| Net (payments) proceeds on short-term obligations |
(2,092 | ) | 3,529 | — | ||||||||
| Proceeds from long-term obligations |
13,103 | 1,750 | — | |||||||||
| Payments on long-term obligations |
(5,358 | ) | (5,144 | ) | (2,301 | ) | ||||||
| Net cash provided by (used in) financing activities |
6,364 | 2,964 | (1,426 | ) | ||||||||
| Effect of exchange rate changes on cash and cash equivalents |
107 | (65 | ) | — | ||||||||
| Net (decrease) increase in cash and cash equivalents |
(2,694 | ) | 1,516 | 3,051 | ||||||||
| Cash and cash equivalents, beginning of year |
20,076 | 18,560 | 15,509 | |||||||||
| Cash and cash equivalents, end of year |
$ | 17,382 | $ | 20,076 | $ | 18,560 | ||||||
See notes to consolidated financial statements.
49
Table of Contents
RTI BIOLOGICS, INC. AND SUBSIDIARIES
Notes to Consolidated Financial Statements
Years Ended December 31, 2009, 2008 and 2007
(In thousands, except share and per share data)
1. Business
RTI Biologics, Inc. (“RTI”), and its subsidiaries (collectively, the “Company”) process human and animal tissue. The processing transforms the tissue into either conventional or precision machined allograft implants (human) or xenograft implants (animal), for orthopedic and other surgical applications to promote the natural healing of human bone and other human tissue. These implants are distributed domestically and internationally, for use in reconstruction and fracture repair.
2. Summary of Significant Accounting Policies
Principles of Consolidation—The consolidated financial statements include the accounts of RTI and its wholly owned subsidiaries, Tutogen Medical, Inc. (“TMI”), RTI Biologics, Inc.—Cardiovascular (inactive), Biological Recovery Group (inactive), and RTI Services, Inc. The consolidated financial statements also include the accounts of RTI Donor Services, Inc. (“RTIDS”), which is a controlled entity. The consolidated financial statements have been prepared in accordance with accounting principles generally accepted in the United States of America. All intercompany balances and transactions have been eliminated in consolidation.
RTIDS is a taxable not-for-profit entity organized and controlled by the Company. RTIDS is the corporate entity that is responsible for procuring tissue for the Company. Expenses incurred by RTIDS to procure tissue are passed through to the Company. RTIDS has no significant assets or liabilities except for its intercompany account and accounts payable to tissue recovery agencies. The Company pays all expenses of RTIDS.
Foreign Currency Translation—The functional currency of the Company’s German subsidiary is the Euro. Assets and liabilities of foreign subsidiaries are translated at the period end exchange rate while revenues and expenses are translated at the average exchange rate for the period. The resulting translation adjustments, representing unrealized, noncash gains and losses are recorded and presented as a component of comprehensive loss. Gains and losses resulting from transactions of the Company and its subsidiaries, which are made in currencies different from their own, are included in income or loss as they occur and are included in interest expense in the consolidated statements of operations.
Cash and Cash Equivalents—The Company considers all funds in banks and short-term investments with an original maturity of three months or less to be cash and cash equivalents.
Derivative Instruments—The Company accounts for its hedging activities in accordance with Financial Accounting Standards Board (“FASB”) ASC 815, Accounting for Derivatives and Hedging Activities, as amended. FASB ASC 815 requires that all hedging activities be recognized in the balance sheet as assets or liabilities and be measured at fair value. Gains or losses from the change in fair value of hedging instruments that qualify for hedge accounting are recorded in other comprehensive income. The Company’s policy is to specifically identify the assets, liabilities or future commitments being hedged and monitor the hedge to determine if it continues to be effective. The Company does not enter into or hold derivative instruments for trading or speculative purposes.
Inventories—Implantable donor tissue inventories are stated at the lower of cost or market, with cost determined using the first-in, first-out method. Inventory writedowns are recorded for unprocessed donor tissue based on the estimated amount of inventory that will not pass the quality control process based on historical data, and the amount of inventory that is not readily distributable or unusable. In addition, provisions for inventory
50
Table of Contents
writedowns are estimated for tissue in process inventory that is not readily distributable or unusable. Any implantable donor tissue deemed to be obsolete is included in the writedown at the time the determination is made.
Product Recalls—The Company accrues the estimated cost of recalls of products at the date the recall is initiated. The cost of recalls is primarily comprised of product replacement costs. In 2009 and 2008, the Company had one recall and two recalls respectively, and incurred immaterial costs related to those recalls.
Property, Plant and Equipment—Property, plant, and equipment are stated at cost less accumulated depreciation and amortization. The cost of equipment under capital leases and leasehold improvements is amortized on the straight-line method over the shorter of the lease term or the estimated useful life of the asset. Depreciation is computed on the straight-line method over the following estimated useful lives of the assets:
| Buildings |
25 to 40 years | |
| Building improvements and leasehold improvements |
8 to 40 years | |
| Processing equipment |
8 to 10 years | |
| Office equipment, furniture and fixtures |
5 to 7 years | |
| Computer hardware and software |
3 years |
Software Costs—Included in property, plant and equipment are costs related to purchased software that are capitalized.
Debt Issuance Costs—Debt issuance costs include costs incurred to obtain financing. Upon funding of debt offerings, deferred financing costs are capitalized as debt issuance costs and are amortized using the straight-line method, which approximates the effective interest method, over the life of the related debt. At December 31, 2009 gross debt issuance costs were $89, net of accumulated amortization of $72. At December 31, 2008, gross debt issuance costs were $84, net of accumulated amortization of $852. Debt issuance costs are included in other assets—net in the accompanying consolidated balance sheets.
Research and Development Costs—Research and development costs, including the cost of research and development conducted for others and the cost of contracted research and development, are expensed as incurred. Research and development costs for the years ended December 31, 2009, 2008 and 2007 were $8,899, $8,143 and $5,190, respectively.
Revenue Recognition—Revenue is recognized upon shipping, or receipt by the Company’s customers of the processed tissue for implantation, depending on the Company’s distribution agreements with the Company’s customers or distributors. Other revenues are recognized when all significant contractual obligations have been satisfied.
The Company permits returns of tissue in accordance with the terms of contractual agreements with customers if the tissue is returned in a timely manner, in unopened packaging, and from the normal channels of distribution. Allowances for returns are provided based upon analysis of the Company’s historical patterns of returns matched against the revenues from which they originated.
On July 13, 2009, the Company and Davol Inc., a subsidiary of C.R. Bard, Inc. (“Davol”), amended their previous distribution agreement with TMI for human dermis implants. Under the amended agreement, 1) Davol paid the Company $8,000 in non-refundable fees for exclusive distribution rights for the distribution to the breast reconstruction market until July 13, 2019, 2) the exclusive worldwide distribution agreement related to the hernia market was extended to July 13, 2019, and 3) Davol agreed to pay the Company certain additional exclusive distribution rights fees contingent upon the achievement of certain revenue milestones by Davol during the duration of the contract. In 2006, Davol paid TMI $3,300 in fees under the previous agreement for exclusive distribution rights of human dermis for hernia repair. The $8,000 and the remaining $456 of exclusivity payments has been deferred and is being recognized as other revenue on a straight-line basis over ten years, the initial term of the contract.
51
Table of Contents
On May 14, 2007, the Company entered into an exclusive distribution agreement with Zimmer, for distribution of bone graft substitute products with an initial term of 10 years. The distribution agreement relates to certain new products currently in production. As part of the agreement, Zimmer paid the Company $5,000 for the aforementioned exclusive distribution rights, and has to maintain certain minimum order volumes. The $5,000 exclusivity payment has been deferred and is being recognized as other revenue on a straight-line basis over ten years, the initial term of the contract.
Other Revenues—Other revenues consists of tissue recovery fees, biomedical laboratory fees, deferred revenues, shipping fees, grants, distribution of reproductions of our allografts to distribute for demonstration purposes, and restocking fees.
Comprehensive Income (Loss)—Comprehensive income (loss) includes net gain (loss) and cumulative foreign currency translation adjustments.
Income Taxes—The Company uses the asset and liability method of accounting for income taxes. Deferred income taxes are recorded to reflect the tax consequences on future years for differences between the tax basis of assets and liabilities and their financial reporting amounts at each year-end based on enacted tax laws and statutory tax rates applicable to the periods in which the differences are expected to affect taxable income. Valuation allowances are established when necessary to reduce deferred tax assets to amounts which are more likely than not to be realized.
Stock-Based Compensation Plans—The Company accounts for its stock based compensation plans in accordance with FASB ASC 718, Accounting for Stock Compensation. FASB ASC 718 requires the measurement and recognition of compensation expense for all stock-based awards made to employees and directors, including employee stock options and restricted stock. Under the provisions of FASB ASC 718, and U.S. Securities and Exchange Commission Staff Accounting Bulletin No. 107 (“SAB 107”), stock-based compensation cost is measured at the grant date, based on the calculated fair value of the award, and is recognized as an expense on a straight-line basis over the requisite service period of the entire award (generally the vesting period of the award).
The Company elected to use the modified prospective transition method as permitted by ASC 718 and, therefore, financial results for periods prior to 2006 have not been restated. Under this transition method, stock-based compensation expense for the years ended December 31, 2009, 2008 and 2007 includes expense for all equity awards granted prior to, but not yet vested as of January 1, 2006, based on the grant-date fair value estimated in accordance with the original provisions of ASC 718. Since the adoption of ASC 718, there have been no changes to the Company’s stock compensation plans or modifications to outstanding stock-based awards which would increase the value of any awards outstanding. Compensation expense for all stock-based compensation awards granted subsequent to January 1, 2006 was based on the grant-date fair value determined in accordance with the provisions of ASC 718.
ASC 718 also requires the benefits of tax deductions in excess of recognized compensation cost to be reported as a financing cash flow.
Earnings Per Share—Basic earnings per share (“EPS”) is computed by dividing earnings attributable to common stockholders by the weighted-average number of common shares outstanding for the periods. Diluted EPS reflects the potential dilution of securities that could share in the earnings. A reconciliation of the number of common shares used in the calculation of basic and diluted EPS is presented below:
| Year Ended December 31, | ||||||
| 2009 | 2008 | 2007 | ||||
| Basic shares |
54,349,391 | 49,912,154 | 29,824,816 | |||
| Effect of dilutive securities: |
||||||
| Stock options |
423,098 | — | — | |||
| Diluted shares |
54,772,489 | 49,912,154 | 29,824,816 | |||
52
Table of Contents
Options to purchase 6,259,952 shares of common stock at prices ranging from $1.76 to $14.95 per share were outstanding as of December 31, 2009 were included in the computation of diluted EPS because dilutive shares are factored into the calculation of EPS when a profit from continuing operations is reported.
Options to purchase 6,140,494, and 3,727,739 shares of common stock at prices ranging from $0.77 to $14.95 per share were outstanding as of December 31, 2008 and 2007, respectively, and were not included in the computation of diluted EPS because dilutive shares are not factored into the calculation of EPS when a loss from continuing operations is reported as they would be anti-dilutive.
Use of Estimates—The preparation of consolidated financial statements in conformity with accounting principles generally accepted in the United States of America requires management to make estimates and assumptions that affect the reported amounts of assets and liabilities and disclosures of contingent assets and liabilities at the date of the financial statements and the reported amounts of revenues and expenses during the reporting period. Estimates and assumptions relating to inventories, receivables, long-lived assets, investment valuations and litigation are made at the end of each financial reporting period by management. Actual results could differ from those estimates.
Long-Lived Assets—The Company periodically evaluates the period of depreciation or amortization for long-lived assets to determine whether current circumstances warrant revised estimates of useful lives. The Company reviews its property, plant and equipment for impairment whenever events or changes in circumstances indicate the carrying value of an asset may not be recoverable. Recoverability is measured by a comparison of the carrying amount to the net undiscounted cash flows expected to be generated by the asset. An impairment loss would be recorded for the excess of net carrying value over the fair value of the asset impaired. The fair value is estimated based on expected discounted future cash flows. The results of impairment tests are subject to management’s estimates and assumptions of projected cash flows and operating results. Changes in assumptions or market conditions could result in a change in estimated future cash flows and the likelihood of materially different reported results. Past estimates by management of the fair values and useful lives of long-lived assets and investments have been accurate but have periodically been impacted by one-time events.
Intangible Assets and Goodwill. FASB ASC 350, Goodwill and Other Intangible Assets, requires companies to test goodwill for impairment on an annual basis at the reporting unit level (or an interim basis if an event occurs that might reduce the fair value of a reporting unit below its carrying value). The Company has one reporting unit and the annual impairment test is performed at each year-end unless indicators of impairment are present and require more frequent testing. FASB ASC 350 also requires that the carrying value of an identifiable intangible asset that has an indefinite life be determined by using a fair value based approach.
Intangible assets generally consist of patents, trademarks, procurement contracts, customer lists, non-compete agreements, distribution agreements and acquired exclusivity rights. Patents and trademarks are amortized on the straight-line method over the shorter of the remaining protection period or estimated useful lives of between 8 and 16 years. Procurement contracts, customer lists, non-compete agreements and distribution agreements are amortized over estimated useful lives of between 5 to 25 years. The acquired exclusivity rights are being amortized over eight years, the remaining term of the amended distribution agreement.
Goodwill is tested for impairment by comparing the fair value of the reporting unit to its carrying amount, including goodwill. In concluding as to fair value of the reporting unit for purposes of testing goodwill, an income approach and a market approach are utilized. The conclusion from these two approaches are weighted equally and then adjusted to incorporate a control premium or acquisition premium that reflects the additional amount a buyer is willing to pay for elements of control and for a premium that reflects the buyer’s perception of its ability to add value through synergies.
In general, the income approach employs a discounted cash flow model that considers 1) assumptions that marketplace participants would use in their estimates of fair value, including the cash flow period, terminal
53
Table of Contents
values based on a terminal growth rate and the discount rate, 2) current period actual results, and 3) projected results for future periods that have been prepared and approved by senior management of the Company. The forecasted cash flows do not include synergies that a marketplace participant would be expecting to achieve.
The market approach employs market multiples from guideline public companies operating in our industry. Estimates of fair value are derived by applying multiples based on revenue and earnings before interest, taxes, depreciation and amortization (“EBITDA”) adjusted for size and performance metrics relative to peer companies. A control premium was included in determining the fair value under this approach.
If the carrying amount of the reporting unit exceeds its calculated fair value, the second step of the goodwill impairment test is performed in accordance with FASB ASC 350 to measure the amount of the impairment loss, if any.
Both approaches used in the analysis have a degree of uncertainty. Potential events or changes in circumstances which could impact the key assumptions used in our goodwill impairment evaluation are as follows:
| • | Change in peer group or performance of peer group companies |
| • | Change in the Company’s markets and estimates of future operating performance |
| • | Change in the Company’s estimated market cost of capital |
| • | Change in implied control premiums related to acquisitions in the medical device industry. |
The Company is not aware of any potential events and/or changes in circumstances that could reasonably be expected to negatively affect the key assumptions utilized in its goodwill impairment evaluation.
Fair Value of Financial Instruments—The estimated fair value of financial instruments disclosed in the consolidated financial statements has been determined by using available market information and appropriate valuation methodologies. The carrying value of all current assets and current liabilities approximates fair value because of their short-term nature. The carrying value of the long-term debt obligations approximates the fair value. The fair value of capital lease obligations approximates the carrying value, based on current market prices.
New Accounting Standards. In December 2007, the FASB issued FASB ASC 810, Consolidation, which significantly changes the financial accounting and reporting of noncontrolling (or minority) interests of a subsidiary in consolidated financial statements. The Company adopted FASB ASC 810 in the first quarter of 2009 with no impact to its consolidated financial statements. No noncontrolling interests in entities were acquired by the Company during the year ended December 31, 2009.
In December 2007, the FASB issued FASB ASC 805, Business Combinations, which is intended to improve the relevance, representational faithfulness and comparability of information provided in financial reports about business combinations. FASB ASC 805 requires the acquirer to recognize assets acquired, liabilities assumed and any noncontrolling interest in the acquiree at fair value as of the date of acquisition, effectively eliminating the practice of allocating costs to assets acquired and liabilities assumed based on their estimated fair values as stipulated by FASB ASC 805. Costs incurred to effect the acquisition, previously considered in the aforementioned cost-allocation process, are to be recognized as a component of earnings. FASB ASC 805 is effective for acquisitions consummated on or after January 1, 2009. The Company adopted FASB ASC 805 in the first quarter of 2009 with no impact to its consolidated financial statements. No businesses were acquired by the Company during the year ended December 31, 2009.
In May 2009, the FASB issued FASB ASC 855 Subsequent Events. FASB ASC 855 establishes general standards of accounting for and disclosure of events that occur after the balance sheet date but before financial statements are issued or are available to be issued. FASB ASC 855 is effective for interim and annual financial periods ending after June 15, 2009. The Company adopted FASB ASC 855 during the three months ended
54
Table of Contents
June 30, 2009. The Company evaluated subsequent events as of the issuance date of the financial statements, March 1, 2010. FASB ASC 855 did not have a material impact on the Company’s consolidated financial statements.
In June 2009, the FASB issued FASB ASC 105, Generally Accepted Accounting Principles. FASB ASC 105 establishes the FASB Accounting Standards Codification™ as the source of authoritative U.S. GAAP recognized by the FASB to be applied by nongovernmental entities. FASB ASC 105, which changes the referencing of financial standards, is effective for interim or annual financial periods ending after September 15, 2009. The Company adopted FASB ASC 105 during the three months ended September 30, 2009 with no impact to its consolidated financial statements.
3. Merger with Tutogen Medical, Inc.
On February 27, 2008, the Company completed its merger with TMI, a Delaware corporation, in a stock-for-stock merger transaction. TMI, with its consolidated subsidiaries, performed tissue processing services for dental, spine, urology, hernia repair, breast reconstruction, ophthalmology, and ear, nose and throat applications. The transaction was accounted for using the purchase method of accounting in accordance with ASC 350. The results of TMI’s operations have been included in the Company’s consolidated financial statements since the merger date of February 27, 2008.
The Company believes that the merger with TMI offers the potential for substantial strategic and financial benefits. The Company believes the merger will enhance stockholder value through, among other things, enabling the Company to capitalize on the following strategic advantages and opportunities:
| • | Diversification of markets, enabling the combined company to help more patients with sterile, biological solutions. |
| • | Balanced distribution model with reduced concentration risk. |
| • | Accelerated growth of xenograft products. |
| • | Combination of domestic and international recovery networks. |
| • | Expansion of distribution and marketing team. |
| • | Increased operational efficiencies. |
| • | Expected revenue and cost synergies. |
The Company believes that these primary factors support the amount of goodwill recognized as a result of the purchase price paid for TMI, in relation to other acquired tangible and intangible assets.
Pursuant to the merger agreement, TMI shareholders received 1.22 shares of the Company’s common stock in exchange for each share of TMI common stock held. The Company issued 23,706,632 shares of its common stock as consideration for this merger. In addition, the Company assumed 2,889,021 TMI stock options that became fully vested on February 27, 2008, as part of the transaction.
Total purchase price consideration includes $245,557 which represents the fair market value of the Company’s securities issued to TMI shareholders, and $20,357 which represents the fair value of the TMI stock options which became fully vested on February 27, 2008 in accordance with change of control provisions included in the stock option agreements. The fair value of the outstanding options was determined using a Black-Scholes valuation model with the following weighted-average assumptions: volatility of 52.87%; risk-free interest rate of 3.35%; remaining expected term of three years; and dividend yield of zero.
55
Table of Contents
A summary of the components of the purchase price consideration is as follows:
| Fair market value of securities issued |
$ | 245,557 | |
| Fair market value of TMI vested stock options assumed |
20,357 | ||
| Transaction costs not included in TMI net tangible assets acquired |
4,714 | ||
| Net receivables from TMI on date of merger |
282 | ||
| Total purchase price |
$ | 270,910 | |
The fair value of the Company’s shares used in determining the purchase price was based on the average of the closing price of the Company’s common stock for a range of five trading days, including two days prior to and two days subsequent to November 12, 2007, the measurement date. The measurement date was determined per the guidance in Emerging Issues Task Force (“EITF”) No. 99-12, Determination of the Measurement Date for the Market Price of Acquirer Securities Issued in a Purchase Business Combination. Based on these closing prices, the Company estimated the fair value of its common stock to be $10.36 per share.
The TMI purchase price was allocated to tangible and intangible assets acquired and liabilities assumed based on their estimated fair values at the merger date of February 27, 2008. The excess of the purchase price over the fair value of net assets acquired was allocated to goodwill. The allocation of purchase price related to the TMI merger was finalized in the first quarter of 2009.
The following table summarizes the fair values of net assets acquired:
| Current assets |
$ | 38,552 | ||
| Property, plant and equipment, net |
13,484 | |||
| Other assets |
3,730 | |||
| Current liabilities |
(17,787 | ) | ||
| Other long-term liabilities |
(5,950 | ) | ||
| 32,029 | ||||
| Tangible assets: |
||||
| Cash and cash equivalents |
5,030 | |||
| Short-term investments |
5,428 | |||
| Accounts receivable |
6,363 | |||
| Inventory |
15,692 | |||
| Deferred taxes |
8,892 | |||
| Property, plant and equipment |
13,484 | |||
| Other |
876 | |||
| Total tangible assets |
55,765 | |||
| Tangible liabilities: |
||||
| Accounts payable |
4,522 | |||
| Accrued expenses |
9,402 | |||
| Short-term borrowings and long-term obligations |
5,221 | |||
| Deferred revenue and other liabilities |
4,591 | |||
| Total tangible liabilities |
23,736 | |||
| Net tangible assets acquired |
32,029 | |||
| Identifiable intangible assets (procurement contracts and distributor relationships) |
1,378 | |||
| Goodwill |
237,503 | |||
| Total net assets acquired |
$ | 270,910 | ||
Short-term investments consist primarily of a certificate of deposit from a bank with an initial term of five months. Short-term borrowings at February 27, 2008 of 511 Euros ($760) are due to a German bank with an
56
Table of Contents
interest rate of 7.5%. Long-term obligations at February 27, 2008 of 2,624 Euros ($3,898) are due to the same German bank with interest rates ranging from 5.15% to 5.75%. The above loans are collateralized by a mortgage on the German facility and up to a 4,000 Euro ($5,942 at February 27, 2008) guarantee from TMI.
Deferred revenue consists primarily of up-front exclusivity fees paid by TMI’s distributors that are being amortized on a straight line basis over the term of the exclusivity relationship.
The following unaudited pro forma information shows the results of the Company’s operations as though the merger had occurred as of the beginning of that period (in thousands, except per share data):
| Year Ended December 31, | ||||||||
| 2008 | 2007 | |||||||
| Total revenues |
$ | 155,128 | $ | 148,523 | ||||
| Net loss |
$ | (101,230 | ) | $ | (2,597 | ) | ||
| Basic net loss per share |
$ | (1.86 | ) | $ | (0.05 | ) | ||
| Diluted net loss per share |
$ | (1.86 | ) | $ | (0.05 | ) | ||
The pro forma results have been prepared for comparative purposes only and are not necessarily indicative of the actual results of operations had the merger taken place as of the beginning of the periods presented, or the results that may occur in the future.
4. Stock-Based Compensation
The Company has four stock-based compensation plans under which employees, consultants and outside directors have received stock options and other equity-based awards. At December 31, 2009, awards relating to 6,259,952 shares were outstanding, and 793,821 shares remained available for the grant of awards under our plans. For the year ended December 31, 2009, employees and outside directors of the Company were granted 885,000 stock options under the plans. Stock options are granted with an exercise price equal to 100% of the market value of a share of common stock on the date of the grant, generally have ten-year contractual terms, and vest over a one to five year period from the date of grant.
2004 Equity Incentive Plan—In 2004, the Company adopted an equity incentive plan (the “2004 Plan”) which provides for the grant of incentive and nonqualified stock options and restricted stock to key employees, including officers and directors of the Company, and consultants and advisors. The option or grant of restricted stock price per share may not be less than 100% of the fair market value of such shares on the date granted. The 2004 Plan allows for up to 2,000,000 shares of common stock to be issued with respect to awards granted. Awards or shares which are forfeited, surrendered or otherwise terminated are available for further awards; provided, however, that any such shares that are surrendered in connection with any award or that are otherwise forfeited after issuance shall not be available for purchase pursuant to incentive stock options intended to qualify under Code Section 422.
1998 Stock Option Plan—In July 1998, the Company adopted a stock option plan (the “1998 Plan”) which provides for the grant of incentive and nonqualified stock options to key employees, including officers and directors of the Company, and consultants and advisors. The option price per share may not be less than 100% of the fair market value of such shares on the date such option is granted. The 1998 Plan allows for up to 4,406,400 shares of common stock to be issued with respect to awards granted. New stock options may no longer be awarded under the 1998 Plan.
TMI 1996 Stock Option Plan and TMI 2006 Incentive and Non-Statutory Stock Option Plan—In connection with the merger with TMI, the Company assumed the TMI 1996 Stock Option Plan and the TMI 2006 Incentive and Non-Statutory Stock Option Plan (“TMI Plans”). The TMI Plans allow for 4,880,000 and
57
Table of Contents
1,830,000 shares of common stock, respectively, which may be issued with respect to stock options granted to former TMI employees or employees of the Company hired subsequent to the TMI acquisition. New stock options may no longer be awarded under the TMI 1996 Stock Option Plan. Outstanding stock options of the TMI Plans were exchanged for stock options to acquire common stock of the Company as described below.
The Company uses the Black-Scholes model to value its stock option grants under FASB ASC 718 and expenses the related compensation cost using the straight-line method over the vesting period. The fair value of stock options is determined on the grant date using assumptions for the expected term, expected volatility, dividend yield, and the risk free interest rate. The term assumption is primarily based on the contractual vesting term of the option and historic data related to exercise and post-vesting cancellation history experienced by the Company. The Company uses the simplified method for estimating the expected term used to determine the fair value of options under FASB ASC 718. The expected term is determined separately for options issued to the Company’s directors and to employees. The Company’s anticipated volatility level is primarily based on the historic volatility of the Company’s common stock. The Company’s model includes a zero dividend yield assumption, as the Company has not historically paid nor does it anticipate paying dividends on its common stock. The risk free interest rate approximates recent U.S. Treasury note auction results with a similar life to that of the option. The Company’s model does not include a discount for post-vesting restrictions, as the Company has not issued awards with such restrictions. The period expense is then determined based on the valuation of the options, and at that time an estimated forfeiture rate is used to reduce the expense recorded. The Company’s estimate of pre-vesting forfeitures is primarily based on the recent historical experience of the Company, and is adjusted to reflect actual forfeitures as the options vest.
The following weighted-average assumptions were used to determine the fair value of options under FASB ASC 718:
| Year Ended December 31, | |||||||||
| 2009 | 2008 | 2007 | |||||||
| Expected term (years) |
6.27 | 6.24 | 6.38 | ||||||
| Risk free interest rate |
2.25 | % | 3.14 | % | 4.71 | % | |||
| Volatility factor |
63.42 | % | 61.02 | % | 61.30 | % | |||
| Dividend yield |
— | — | — | ||||||
Stock Options
Outstanding options under all option plans vest over a one to five year period. Options expire ten years from the date of grant. The weighted-average grant-date fair value of options granted for the year ended December 31, 2009 was $1.83. The total intrinsic value of options exercised for the year ended December 31, 2009 was $857. The intrinsic value of a stock option at December 31, 2009 is the difference between the Company’s closing stock price on the last trading day of 2009 and the exercise price, multiplied by the number of in-the-money options that would have been received by the option holders had all option holders exercised their options on December 31, 2009. This amount changes based on the fair market value of the Company’s stock. Cash received from option exercises for the year ended December 31, 2009 was $525.
As of December 31, 2009, there was $2,682 of total unrecognized compensation cost related to nonvested stock options. That cost is expected to be recognized over a weighted-average period of 2.69 years.
58
Table of Contents
Stock options outstanding and exercisable at December 31, 2009 are summarized as follows:
| Number of Shares |
Weighted Average Exercise Price |
Weighted Average Remaining Contractual Life (Years) |
Aggregate Intrinsic Value | ||||||||
| Outstanding at January 1, 2009 |
6,140,494 | $ | 6.55 | ||||||||
| Granted |
885,000 | 3.04 | |||||||||
| Exercised |
(311,156 | ) | 1.69 | ||||||||
| Forfeited or expired |
(454,386 | ) | 7.92 | ||||||||
| Outstanding at December 31, 2009 |
6,259,952 | $ | 6.20 | 4.98 | $ | 2,006 | |||||
| Vested or expected to vest at December 31, 2009 |
5,887,255 | $ | 6.25 | 4.81 | $ | 1,862 | |||||
| Exercisable at December 31, 2009 |
4,728,555 | $ | 6.62 | 4.03 | $ | 1,288 | |||||
| Available for grant at December 31, 2009 |
793,821 | ||||||||||
The aggregate intrinsic value in the table above represents the total pre-tax intrinsic value.
For the years ended December 31, 2009, 2008, and 2007, the Company recognized stock-based compensation as follows:
| Year Ended December 31, | |||||||||
| 2009 | 2008 | 2007 | |||||||
| Stock-based compensation: |
|||||||||
| Costs of processing and distribution |
$ | 338 | $ | 280 | $ | 496 | |||
| Marketing, general and administrative |
1,443 | 1,269 | 2,295 | ||||||
| Research and development |
101 | 99 | 183 | ||||||
| Total |
$ | 1,882 | $ | 1,648 | $ | 2,974 | |||
Other information concerning stock options for the years ended December 31 is as follows:
| 2009 | 2008 | 2007 | |||||||
| Weighted average fair value of options granted |
$ | 1.83 | $ | 4.54 | $ | 5.73 | |||
| Intrinsic value of options exercised |
$ | 857 | $ | 2,580 | $ | 411 | |||
5. Inventories
Inventories by stage of completion are as follows:
| December 31, | ||||||
| 2009 | 2008 | |||||
| Unprocessed donor tissue |
$ | 26,986 | $ | 20,075 | ||
| Tissue in process |
40,821 | 39,413 | ||||
| Implantable donor tissue |
24,641 | 14,094 | ||||
| Supplies |
1,487 | 1,600 | ||||
| $ | 93,935 | $ | 75,182 | |||
For the years ended December 31, 2009, 2008, and 2007, the Company had inventory write-downs of $1,940, $2,372, $1,479, respectively, relating primarily to product obsolescence.
59
Table of Contents
6. Prepaid and Other Current Assets
Prepaid and other current assets are as follows:
| December 31, | ||||||
| 2009 | 2008 | |||||
| Distribution rights receivable |
$ | — | $ | 2,000 | ||
| Other |
2,066 | 2,044 | ||||
| $ | 2,066 | $ | 4,044 | |||
On May 14, 2007, the Company entered into an exclusive distribution agreement with Zimmer, Inc. (“Zimmer”) with an initial term of 10 years, relating to certain new bone graft substitutes products. As part of the agreement, Zimmer agreed to make payments to the Company totaling $5.0 million for the aforementioned exclusive distribution rights. The final $2.0 million payment was received in the fourth quarter of 2009.
7. Property, Plant and Equipment
Property, plant and equipment are as follows:
| December 31, | ||||||||
| 2009 | 2008 | |||||||
| Land |
$ | 1,898 | $ | 1,874 | ||||
| Buildings and improvements |
44,713 | 43,226 | ||||||
| Processing equipment |
28,919 | 25,672 | ||||||
| Office equipment, furniture and fixtures |
2,351 | 1,401 | ||||||
| Computer equipment and software |
3,823 | 3,706 | ||||||
| Construction in process |
233 | 1,316 | ||||||
| Equipment under capital leases: |
||||||||
| Processing equipment |
285 | 20 | ||||||
| 82,222 | 77,215 | |||||||
| Less accumulated depreciation and amortization |
(35,660 | ) | (29,593 | ) | ||||
| $ | 46,562 | $ | 47,622 | |||||
Depreciation expense for the years ended December 31, 2009, 2008, and 2007 was $5,632, $6,494, and $4,698, respectively.
8. Goodwill
The changes in the carrying amount of goodwill for the year ended December 31, 2009, are as follows:
| December 31, 2009 | |||||||
| Gross Carrying Amount |
Accumulated Impairment | ||||||
| Balance at January 1, 2009 |
$ | 237,654 | $ | 103,222 | |||
| Purchase price adjustment |
256 | — | |||||
| Other |
(7 | ) | — | ||||
| $ | 237,903 | $ | 103,222 | ||||
The carrying value of goodwill was $134,681 and $134,432 at December 31, 2009 and 2008.
60
Table of Contents
Goodwill includes the excess of the TMI purchase price over the sum of the amounts assigned to assets acquired less liabilities assumed. The Company believes that the merger with TMI offers the potential for substantial strategic and financial benefits.
As a result of the Company’s goodwill impairment test as of December 31, 2008, the adverse macro-economic environment and the decline in the market value of the Company’s equity during the fourth quarter of 2008, the Company recorded a goodwill impairment charge of $103,007. The fair value of the Company was estimated using a combination of techniques including the expected present value of future cash flows and market multiples.
The Company performed its annual goodwill impairment test as of December 31, 2009 and concluded that there was no further goodwill impairment.
9. Other Intangible Assets
Other intangible assets are as follows:
| December 31, 2009 | December 31, 2008 | |||||||||||
| Gross Carrying Amount |
Accumulated Amortization |
Gross Carrying Amount |
Accumulated Amortization | |||||||||
| Patents |
$ | 4,433 | $ | 879 | $ | 4,256 | $ | 698 | ||||
| Acquired exclusivity rights |
2,941 | 1,300 | 2,941 | 928 | ||||||||
| Acquired licensing rights |
5,850 | 758 | 4,900 | 58 | ||||||||
| Procurement contracts |
1,755 | 331 | 1,755 | 262 | ||||||||
| Selling and marketing relationships |
500 | 170 | 500 | 100 | ||||||||
| Customer lists |
406 | 364 | 399 | 278 | ||||||||
| Non-compete agreement |
275 | 83 | 275 | 55 | ||||||||
| Trademarks |
58 | 32 | 58 | 30 | ||||||||
| Total |
$ | 16,218 | $ | 3,917 | $ | 15,084 | $ | 2,409 | ||||
On November 24, 2008, the Company entered into a License Agreement with LifeNet Health, Inc. (“LifeNet”) to license from LifeNet certain intellectual property rights to be used in the Company’s tissue processing efforts. The term of the License Agreement is for seven years or the remaining life of any patent covered by the License Agreement, whichever is longer. Total monetary consideration for the License Agreement is $4,900, to be paid in five annual installments of $980 from November 2008 to 2012.
During the year ended December 31, 2006, the Company and Medtronic (“MDT”) entered into an amended distribution agreement which allows the Company, among other things, the ability to distribute spinal allografts through other distributors. In conjunction with the amendment, the Company paid MDT $3,000 to buyout exclusivity provisions under the former distribution agreement. Of this payment, $2,444 relates to the acquired exclusivity rights and has been recorded as an intangible asset and the remaining $556 reduced deferred revenue.
On December 15, 2006 the Company recorded $2,908 in intangibles related to CryoLife’s orthopedic sports medicine business which are recorded in other intangible assets.
As a result of the Company’s other intangible assets impairment test as of December 31, 2008, the Company concluded that due to the termination of several agreements with independent distributors for its sports medicine business during the fourth quarter of 2008, the customer lists and selling and marketing relationships acquired in connection with the CryoLife exchange were impaired. The Company recorded an intangible asset impairment charge of $920 included in asset impairments and abandonments in the consolidated statements of operations, which reduced the respective intangible assets to zero. The fair value of these intangible assets was estimated using the expected present value of future cash flows.
61
Table of Contents
Patents and trademarks are amortized on the straight-line method over the shorter of the remaining protection period or estimated useful life of between 8 and 16 years. The acquired exclusivity rights are being amortized over eight years, the remaining term of the amended distribution agreement. Procurement contracts, customer lists, non-compete agreements and distribution agreements are amortized over estimated useful lives of between 5 to 25 years. Amortization expense for the years ended December 31, 2009, 2008, and 2007 was $1,507 $1,500, and $887, respectively. Management estimates amortization expense of $1,600 per year for the next five years.
10. Other Assets
Other assets are as follows:
| December 31, | ||||||||
| 2009 | 2008 | |||||||
| Debt issuance costs |
$ | 161 | $ | 936 | ||||
| Other |
925 | 209 | ||||||
| 1,086 | 1,145 | |||||||
| Less accumulated amortization |
(72 | ) | (852 | ) | ||||
| $ | 1,014 | $ | 293 | |||||
The Company recognized interest expense associated with the amortization of its debt issuance costs for the years ended December 31, 2009, 2008, and 2007 of $72, $199, $170, respectively.
As of December 31, 2007 the Company owned 1,285,347 shares of convertible preferred stock issued by Organ Recovery Systems, Inc., a privately held company, for which the purchase price was $5,250. In the fourth quarter of 2006 the Company wrote down the Company’s investment in LSI by $4,100 due to an other than temporary impairment in the asset, as a result of LSI not successfully executing its operational strategies in 2006. Organ Recovery Systems, Inc. changed its name to Lifeline Scientific, Inc. (“LSI”), and offered shares on the Alternative Investment Market, (“AIM”), of the London Stock Exchange as of January 7, 2008. As a result of the AIM offering the Company’s convertible preferred stock was converted to common stock in LSI. The conversion resulted in significant dilution of the Company’s ownership in the equity of LSI. In the fourth quarter of 2007, the Company wrote down its investment in LSI by an additional $1,149 due to an other than temporary impairment in the asset resulting from the AIM offering. The dilutive impact resulted in the Company’s investment being valued at $1.
The write down in 2007 is included in asset impairments and abandonments in the consolidated statement of operations.
11. Accrued Expenses
Accrued expenses are as follows:
| December 31, 2009 |
December 31, 2008 | |||||
| Accrued compensation |
$ | 2,783 | $ | 2,580 | ||
| Accrued donor recovery fees |
2,001 | 6,052 | ||||
| Accrued distributor fees and marketing commissions |
1,237 | 1,145 | ||||
| Accrued severance |
517 | 1,009 | ||||
| Accrued licensing fees |
1,550 | 980 | ||||
| Accrued taxes |
184 | 653 | ||||
| Accrued professional service fees |
246 | 765 | ||||
| Other |
3,189 | 3,355 | ||||
| $ | 11,707 | $ | 16,539 | |||
The Company accrues for the estimated recovery fees due to third party recovery agencies as tissue is received.
62
Table of Contents
12. Short and Long-Term Obligations
Short and long-term obligations are as follows:
| Current Interest Rate |
Maturity Date |
December 31, 2009 |
December 31, 2008 |
|||||||||||||||||
| (Euro) | (US Dollar) | (Euro) | (US Dollar) | |||||||||||||||||
| Short-term obligations |
||||||||||||||||||||
| United States |
||||||||||||||||||||
| Credit facility |
(1) | $ | 1,500 | |||||||||||||||||
| Germany |
||||||||||||||||||||
| Credit facilities: |
||||||||||||||||||||
| Line of credit—1 |
5.25 | %(2) | None | € | 779 | $ | 1,117 | € | 1,023 | 1,442 | ||||||||||
| Line of credit—2 |
2.93 | %(2) | None | 492 | 705 | — | — | |||||||||||||
| Line of credit—3 |
6.44 | %(3) | None | 195 | 279 | — | — | |||||||||||||
| Interim line of credit |
6.00 | %(3) | (7) | — | — | 868 | 1,224 | |||||||||||||
| Total short-term obligations |
€ | 1,466 | $ | 2,101 | € | 1,891 | $ | 4,166 | ||||||||||||
| Long-term obligations |
||||||||||||||||||||
| United States |
||||||||||||||||||||
| Credit facility |
2.76 | %(4) | 2/2011 | $ | 8,004 | — | ||||||||||||||
| Term loan—1 |
3.26 | %(5) | 2/2011 | 500 | $ | 1,750 | ||||||||||||||
| Term loan—2 |
4.55 | %(6) | 6/2013 | 741 | — | |||||||||||||||
| Germany |
||||||||||||||||||||
| Term loans: |
||||||||||||||||||||
| Senior debt |
5.00 | %(3) | 6/2011 | 147 | 211 | 244 | 344 | |||||||||||||
| Construction I |
5.15 | %(3) | 3/2012 | 563 | 807 | 812 | 1,145 | |||||||||||||
| Construction II |
5.60 | %(3) | 12/2016 | 770 | 1,104 | 880 | 1,241 | |||||||||||||
| Construction III |
5.75 | %(3) | 9/2012 | 143 | 205 | 195 | 275 | |||||||||||||
| Construction IV |
4.95 | %(3) | 6/2014 | 810 | 1,161 | — | — | |||||||||||||
| Capital leases |
5.00%-8.46 | % | 5/2010 - 2/2011 | — | 158 | — | 65 | |||||||||||||
| Total long-term obligations |
€ | 2,433 | $ | 12,891 | € | 2,131 | $ | 4,820 | ||||||||||||
| Less current portion |
(1,862 | ) | (1,637 | ) | ||||||||||||||||
| Long-term portion |
$ | 11,029 | $ | 3,183 | ||||||||||||||||
| (1) | Refinanced with long-term credit facility |
| (2) | Fixed interest rate is negotiated annually in March |
| (3) | Fixed interest rates |
| (4) | LIBOR plus 2.5% to 3.5% |
| (5) | LIBOR plus 3.0% |
| (6) | Prime plus 1.3% |
| (7) | Interim line of credit converted to term loan June 2009 |
On June 11, 2009, the Company entered into an amended credit agreement with Mercantile Bank, a division of Carolina First Bank. The amended agreement provided for an additional term loan to finance certain new equipment of $848 maturing on June 11, 2013, subject to acceleration upon the occurrence of an event of default, including but not limited to a failure to maintain certain financial ratios. The additional term loan is payable monthly at $18 plus interest at prime rate plus 1.3%.
The revolving credit facility with a U.S. bank contains various restrictive covenants which limit, among other things, indebtedness and liens and requires minimum cash balances. Under the agreement, the credit facility and term loans are secured by the Company’s domestic accounts receivable, inventory and certain processing equipment. The Company is required to maintain an average cash balance of $5,000 with the financial institution.
63
Table of Contents
Under the terms of the revolving credit facilities with three German banks, the Company may borrow up to 1,700 Euros, or approximately $2,500 for working capital needs. The 1,000 Euro revolving credit facility is secured by a mortgage on the Company’s German facility and a 4,000 Euro guarantee by the Company. The 500 Euro revolving credit facility is secured by accounts receivable of the Company’s German subsidiary.
In 2008, the Company entered into a financing agreement with a German bank to finance the expansion of its processing facility in Germany. The agreement called for an interim line of credit of up to 900 Euros or approximately $1,300 while the expansion is being completed. The line of credit was converted to a term loan in June 2009.
The Company was in compliance with all covenants related to its credit facilities and term loans as of December 31, 2009.
At December 31, 2009, the Company had an outstanding interest rate swap agreement relating to the German term loan of 563 Euro, or $807 maturing March 31, 2012. Under this agreement, the Company pays a fixed interest rate of 5.15%. Payments or receipts on the agreement are recorded as adjustments to interest expense. Such adjustments have not been significant.
As of December 31, 2009, contractual maturities of long-term obligations are as follows:
| Term Loans | Capital Leases |
Credit Facilities |
Total | |||||||||
| 2010 |
$ | 1,764 | $ | 157 | $ | 1,921 | ||||||
| 2011 |
1,052 | 1 | $ | 8,004 | 9,057 | |||||||
| 2012 |
765 | — | — | 765 | ||||||||
| 2013 |
496 | — | — | 496 | ||||||||
| 2014 and beyond |
652 | — | — | 652 | ||||||||
| $ | 4,729 | $ | 158 | $ | 8,004 | $ | 12,891 | |||||
13. Income Taxes
The Company’s income tax benefit (provision) consists of the following components:
| Year Ended December 31, | ||||||||||||
| 2009 | 2008 | 2007 | ||||||||||
| Current: |
||||||||||||
| Federal |
$ | (187 | ) | $ | (99 | ) | $ | (140 | ) | |||
| State |
— | — | — | |||||||||
| International |
— | (150 | ) | — | ||||||||
| Total current |
(187 | ) | (249 | ) | (140 | ) | ||||||
| Deferred: |
||||||||||||
| Federal |
(1,694 | ) | (1,179 | ) | 479 | |||||||
| State |
(205 | ) | (142 | ) | — | |||||||
| International |
(514 | ) | 179 | 37 | ||||||||
| Total deferred |
(2,413 | ) | (1,142 | ) | 516 | |||||||
| Total income tax (provision) benefit |
$ | (2,600 | ) | $ | (1,391 | ) | $ | 376 | ||||
64
Table of Contents
The components of the deferred tax assets and liabilities consisted of the following at:
| December 31, 2009 | December 31, 2008 | |||||||||||||||
| Deferred Income Tax | Deferred Income Tax | |||||||||||||||
| Asset | Liability | Asset | Liability | |||||||||||||
| Current: |
||||||||||||||||
| International |
$ | — | $ | (839 | ) | $ | 2 | $ | — | |||||||
| Allowance for bad debts |
33 | — | 88 | — | ||||||||||||
| RTI-CV impairment |
1,112 | — | 1,112 | — | ||||||||||||
| Inventory write-downs |
6,089 | — | 8,108 | — | ||||||||||||
| Net operating losses |
6,527 | — | 4,947 | — | ||||||||||||
| Accrued liabilities |
3,570 | — | 3,483 | — | ||||||||||||
| Total current |
17,331 | (839 | ) | 17,740 | — | |||||||||||
| Noncurrent: |
||||||||||||||||
| Depreciation |
— | (3,644 | ) | — | (3,414 | ) | ||||||||||
| Amortization |
— | (87 | ) | — | (610 | ) | ||||||||||
| International |
— | (106 | ) | — | (129 | ) | ||||||||||
| LSI (formerly ORS) impairment |
1,982 | — | 1,982 | — | ||||||||||||
| Unearned revenue |
4,457 | — | 2,079 | — | ||||||||||||
| Net operating losses |
— | — | 4,238 | — | ||||||||||||
| Research and development credit |
4,426 | — | 3,493 | — | ||||||||||||
| Charitable contributions |
225 | — | 76 | — | ||||||||||||
| AMT credit |
631 | — | 444 | — | ||||||||||||
| Other |
155 | 217 | ||||||||||||||
| Valuation allowance |
(1,138 | ) | — | (1,157 | ) | — | ||||||||||
| Total noncurrent |
10,738 | (3,837 | ) | 11,372 | (4,153 | ) | ||||||||||
| Total |
$ | 28,069 | $ | (4,676 | ) | $ | 29,112 | $ | (4,153 | ) | ||||||
Valuation allowances are established when necessary to reduce deferred tax assets to amounts which are more likely than not to be realized. As such, valuation allowances of $1,138 and $1,157 have been established at December 31, 2009 and 2008, respectively, against a portion of the deferred tax assets based on the characteristics of the research and experimentation tax credits claimed and on the nature of the credits claimed for certain state net operating loss carryforwards.
The Company recorded a non-cash tax benefit from the exercise of incentive stock options as an addition to its deferred income tax assets in the amount of $212 and $432 for the years ended December 31, 2009 and 2008, respectively.
As of December 31, 2009, the Company has federal net operating loss carryforwards of $16,483 that will expire in the years 2010 to 2012, 2018 and 2021 to 2028, as well as state net operating loss carryforwards of $24,532 that will expire in the years 2021, 2022, and 2024 to 2027.
As of December 31, 2009, the Company has research and experimentation tax credit carryforwards of $4,425 that will expire in years 2018 through 2028, as well as alternative minimum tax credit carryforwards of $631 that are carried forward indefinitely.
The Company expects the domestic deferred tax assets of approximately $24,338, net of the valuation allowance at December 31, 2009 of $1,138, to be realized through the generation of future taxable income and the reversal of existing taxable temporary differences. Valuation allowances have been recorded for certain state tax loss carryforwards as the Company does not believe that it will have future income in the state to utilize the loss carry forwards, and tax deductions taken for certain merger-related costs.
65
Table of Contents
During the past three years the Company has improved its business model to produce predictable earnings through the following:
| • | improved tissue availability |
| • | renegotiated distributor agreements |
| • | exiting unprofitable business through business exchange |
| • | the acquisition of TMI |
| • | increased diversification of product portfolio |
| • | reduced concentration risk on independent distributors |
The Company considered the improvements in its operating performance, as well as the impact of recent losses as it relates to the realization of remaining net deferred tax assets, and based on the weight of evidence, among other facts and circumstances, management determined that it was more likely than not that such net deferred tax assets would be realized.
At the date of the adoption, January 1, 2007, of ASC 740, Accounting for Uncertainty in Income Taxes, the Company reclassified a valuation allowance from noncurrent deferred tax assets in the amount of $717 to unrecognized tax benefits which included $240 during 2009 and recorded in other long-term liabilities in the accompanying consolidated balance sheet. The unrecognized tax benefits increased by $77 during 2008 as a result of the Company’s income tax positions. If these tax benefits were recognized by the Company our effective tax rate would be favorably impacted. There were no significant changes to the Company’s unrecognized tax benefits for income tax positions during 2009.
| Year Ended December 31, | ||||||||||
| 2009 | 2008 | 2007 | ||||||||
| Opening balance |
$ | 897 | $ | 820 | $ | 717 | ||||
| Additions based on tax positions related to the current year |
240 | 77 | 103 | |||||||
| Additions for tax positions of prior years |
493 | — | — | |||||||
| Reductions for tax positions of prior years |
(361 | ) | — | — | ||||||
| Settlements |
— | — | — | |||||||
| $ | 1,269 | $ | 897 | $ | 820 | |||||
The Company’s policy is to recognize interest accrued related to unrecognized benefits in interest expense and penalties in the provision for income taxes. There were no interest and penalties recorded in 2009, 2008 and 2007 and no interest and penalties accrued at December 31, 2009 and December 31, 2008.
The Company files income tax returns in the U.S. federal jurisdiction and various states. With few exceptions, the Company is no longer subject to U.S. federal, state and local income tax examinations for years before 2000. The income tax examination of the Company’s U.S. federal filings for the years 2001 and 2002 was completed in 2008 with no additional taxes payable.
66
Table of Contents
The effective tax rate differs from the statutory federal income tax rate for the following reasons:
| Year Ended December 31, | |||||||||
| 2009 | 2008 | 2007 | |||||||
| Statutory federal rate |
34.00 | % | 34.00 | % | 34.00 | % | |||
| State income taxes—net of federal tax benefit |
3.03 | % | 3.76 | % | 3.76 | % | |||
| Impairment of goodwill |
0.00 | % | (39.19 | %) | 0.00 | % | |||
| Research and development credit |
(11.03 | %) | 0.30 | % | 16.27 | % | |||
| Exercise of incentive stock options |
2.85 | % | (0.23 | %) | (19.78 | %) | |||
| Valuation allowance |
2.61 | % | (0.16 | %) | (16.12 | %) | |||
| Miscellaneous |
(0.71 | %) | 0.11 | % | (2.98 | %) | |||
| Effective tax rate |
30.75 | % | (1.41 | %) | 15.15 | % | |||
14. Stockholders’ Equity
Preferred Stock—The Company has 5,000,000 shares of preferred stock authorized under its Certificate of Incorporation, none of which currently is outstanding. These shares may be issued in one or more series having such terms as may be determined by the Company’s Board of Directors.
Common Stock—The Company has 150,000,000 shares of common stock authorized. The common stock’s voting, dividend, and liquidation rights presently are not subject to or qualified by the rights of the holders of any outstanding shares of preferred stock, as the Company presently does not have any shares of preferred stock outstanding. Holders of common stock are entitled to one vote for each share held at all stockholder meetings. Shares of common stock do not have redemption rights.
15. Restructuring Charges
At the time of the merger with TMI, the Company instituted a restructuring plan primarily related to severance of certain of its employees as a result of the integration activities following the merger. The total estimated restructuring charges approximated $493 and was recognized in full prior at March 31, 2009. The severance payments were made over periods ranging from one month to twelve months and did not have a material impact on cash flows of the Company in any quarterly period. An analysis of the restructuring charges is as follows:
| Accrued restructuring charges at January 1, 2009 |
$ | 64 | ||
| Employee separation benefits accrued |
42 | |||
| Non-cash stock based compensation |
— | |||
| Cash payments |
(106 | ) | ||
| Accrued restructuring charges at December 31, 2009 |
$ | — | ||
16. Retirement Benefits
The Company has a qualified 401(k) plan available to all United States employees who meet certain eligibility requirements. The 401(k) plan allows each employee to contribute up to the annual maximum allowed under the Internal Revenue Code. The Company has the discretion to make matching contributions up to 6% of the employee’s earnings. For the years ended December 31, 2009, 2008, and 2007, the Company’s contributions to the plan were $1,343, $1,251, and $777, respectively.
17. Concentrations of Risk
Distribution—The Company’s principal concentration of risk is related to its limited distribution channels. The Company’s revenues include the distribution efforts of eleven independent companies with significant
67
Table of Contents
revenues coming from two of the distribution companies, MDT and Zimmer. For years ended December 31, 2009, 2008, and 2007, the amount of revenues derived from MDT were approximately 22%, 24%, and 47%, respectively. For year ended December 31, 2009 and 2008, the amount of revenues derived from Zimmer was approximately 22% and 19% respectively.
The Company’s distribution agreements are subject to termination by either party for a variety of causes. No assurance can be given that such distribution agreements will be renewed beyond their expiration dates, continue in their current form or at similar rate structures. Any termination or interruption in the distribution of the Company’s products through one of its major distributors could have a material adverse effect on the Company’s operations.
Tissue Supply—The Company’s operations are dependent on the availability of tissue from human donors. For the majority of the tissue recoveries, the Company relies on the efforts of independent procurement agencies to educate the public and increase the willingness to donate bone tissue. These procurement agencies may not be able to obtain sufficient tissue to meet present or future demands. Any interruption in the supply of tissue from these procurement agencies could have a material adverse effect on the Company’s operations.
18. Supplemental Disclosure of Cash Flow and Non-Cash Investing and Financing Activities
Selected cash payments, receipts, and noncash activities are as follows:
| Year Ended December 31, | ||||||||||
| 2009 | 2008 | 2007 | ||||||||
| Cash paid for interest |
$ | 472 | $ | 625 | $ | 595 | ||||
| Income taxes paid |
505 | 341 | — | |||||||
| Accrual for purchases of property, plant and equipment |
175 | 525 | 551 | |||||||
| Accrual for business combination costs |
— | — | 746 | |||||||
| Acquired licensing rights |
950 | 3,920 | — | |||||||
| Common stock issued and stock options assumed for acquisition of TMI |
— | 265,914 | — | |||||||
| Deposit applied against notes payable |
— | 300 | — | |||||||
| Income tax benefit from non-qualified stock option exercises |
186 | 337 | 150 | |||||||
| Business exchange with CryoLife, Inc.: |
||||||||||
| Goodwill |
— | — | (2,712 | ) | ||||||
| Other intangible assets |
— | — | 2,909 | |||||||
| Gain on business exchange |
— | — | 197 | |||||||
19. Commitments and Contingencies
Potential Value Added Tax (VAT) Assessment—In 2008, the Company was audited by the German VAT authorities and received an assessment for 600 Euro, or $860, for the year ended December 31, 2008. For the year ended December 31, 2009, the Company estimates an additional potential assessment of 1,580 Euros, or $2,265. The Company believes the assessment is without merit and will vigorously challenge the assessment. The Company has not accrued a liability for this contingency. The Company does not believe that it is probable that it will ultimately be required to pay the assessment to the German VAT authorities.
Distribution Agreement with Davol—On July 13, 2009, the Company and Davol amended their previous distribution agreement with TMI for human dermis implants. Under the amended agreement, 1) Davol paid the Company $8,000 in non-refundable fees for exclusive distribution rights for the distribution to the breast reconstruction market until July 13, 2019, 2) the exclusive worldwide distribution agreement related to the hernia market was extended to July 13, 2019, and 3) Davol agreed to pay the Company certain additional exclusive distribution rights fees contingent upon the achievement of certain revenue milestones by Davol during the duration of the contract. In 2006, Davol paid TMI $3,300 in fees under the previous agreement for exclusive
68
Table of Contents
distribution rights of human dermis for hernia repair. The $8,000 and the remaining $456 of exclusivity payments has been deferred and is being recognized as other revenue on a straight-line basis over ten years, the initial term of the contract.
Distribution Agreement with Zimmer—On May 14, 2007, the Company entered into an exclusive distribution agreement with Zimmer with an initial term of ten years, relating to certain new bone graft substitutes implants. As part of the agreement, Zimmer made payments to the Company totaling $5,000 for the aforementioned exclusive distribution rights, and has to maintain certain minimum order volumes beginning in 2010. The $5,000 exclusivity payment has been deferred and is being recognized as other revenue on a straight-line basis over the initial term of the contract. The contract provides for repayment, on a pro rata basis, of the exclusivity payments during the initial contract term for specific events of non-performance, as defined in the agreement. The agreement also includes automatic two-year renewal terms, as well as buy-out provisions by both parties upon proper notice of cancellation.
Leases—The Company leases certain facilities, items of office equipment and vehicles under non-cancelable operating lease arrangements expiring on various dates through 2016. The facility leases generally contain renewal options and escalation clauses based upon increases in the lessors’ operating expenses and other charges. The Company anticipates that most of these leases will be renewed or replaced upon expiration. At December 31, 2009, the aggregate future minimum lease payments under all non-cancelable lease agreements were as follows:
Future minimum lease commitments under non-cancelable operating leases as of December 31, 2009 are as follows:
| Operating Leases | |||
| 2010 |
$ | 1,509 | |
| 2011 |
857 | ||
| 2012 |
483 | ||
| 2013 |
257 | ||
| 2014 and beyond |
105 | ||
| $ | 3,211 | ||
Rent expense for the years ended December 31, 2009, 2008, and 2007 was $1,222, $1,542, and $926, respectively, and is included as a component of marketing, general and administrative expenses.
20. Legal and Regulatory Actions
The Company is, from time to time, involved in litigation relating to claims arising out of its operations in the ordinary course of business. The Company believes that none of these claims that were outstanding as of December 31, 2009 will have a material adverse impact on its financial position or results of operations.
The Company’s accounting policy is to accrue for legal costs as they are incurred.
69
Table of Contents
21. Segment Data
The Company processes human and bovine animal tissue and distributes the tissue through various distribution channels. The Company’s lines of business are comprised primarily of six product categories: spine, sports medicine, dental, surgical specialties, bone graft substitutes, and general orthopedic. The following table presents revenues from tissue distribution, and other revenues and percentage of our revenues for the years ended December 31, 2009, 2008 and 2007:
| Year Ended December 31, | ||||||||||||||||||
| 2009 | 2008(1) | 2007(2) | ||||||||||||||||
| Fees from tissue distribution: |
||||||||||||||||||
| Spine |
$ | 41,087 | 25.0 | % | $ | 41,817 | 28.5 | % | $ | 41,067 | 43.6 | % | ||||||
| Sports medicine |
39,533 | 24.0 | % | 36,330 | 24.8 | % | 27,685 | 29.4 | % | |||||||||
| Dental |
29,985 | 18.2 | % | 27,365 | 18.7 | % | — | 0.0 | % | |||||||||
| Surgical specialties |
26,278 | 16.0 | % | 15,350 | 10.5 | % | — | 0.0 | % | |||||||||
| Bone graft substitutes |
15,662 | 9.6 | % | 14,393 | 9.8 | % | 17,011 | 18.1 | % | |||||||||
| General orthopedic |
7,499 | 4.6 | % | 5,631 | 3.8 | % | 993 | 1.1 | % | |||||||||
| Cardiovascular(3) |
— | 0.0 | % | — | 0.0 | % | 1,952 | 2.1 | % | |||||||||
| Other revenues |
4,483 | 2.7 | % | 5,749 | 3.9 | % | 5,499 | 5.8 | % | |||||||||
| Total revenues |
$ | 164,527 | 100.0 | % | $ | 146,635 | 100.0 | % | $ | 94,207 | 100.0 | % | ||||||
| Domestic revenues |
141,275 | 85.9 | % | 126,957 | 86.6 | % | 88,121 | 93.5 | % | |||||||||
| International revenues |
23,252 | 14.1 | % | 19,678 | 13.4 | % | 6,086 | 6.5 | % | |||||||||
| Total revenues |
$ | 164,527 | 100.0 | % | $ | 146,635 | 100.0 | % | $ | 94,207 | 100.0 | % | ||||||
| (1) | Includes results of Tutogen Medical, Inc. beginning on February 28, 2008. |
| (2) | Regeneration Technologies, Inc. only. |
| (3) | We exited the cardiovascular business as of December 31, 2007. |
For the years ended December 31, 2009, 2008, and 2007, the Company derived approximately 22%, 24%, and 47%, respectively, of its total revenues from MDT.
For the year ended December 31, 2009 and 2008, the Company derived approximately 22% and 19% respectively, of its total revenues from Zimmer.
For the years ended December 31, 2009, 2008, and 2007, the Company derived approximately 14.1%, 13.4%, and 6.5%, respectively, of its total revenues from foreign distribution.
As of December 31, 2009, the Company had $34,133 of net property, plant and equipment located domestically, and $12,429 of net property, plant and equipment located at its processing facility in Germany.
22. Quarterly Results of Operations (Unaudited)
The following table sets forth the results of operations for the periods indicated:
| March 31, 2009 |
June 30, 2009 |
September 30, 2009 |
December 31, 2009 | |||||||||
| Quarter Ended: |
||||||||||||
| Revenues |
$ | 38,623 | $ | 41,131 | $ | 42,813 | $ | 41,960 | ||||
| Gross profit |
18,151 | 18,799 | 20,614 | 19,929 | ||||||||
| Net income (loss) |
1,032 | 1,021 | 2,313 | 1,489 | ||||||||
| Net income (loss) per common share: |
||||||||||||
| Basic |
$ | 0.02 | $ | 0.02 | $ | 0.04 | $ | 0.03 | ||||
| Diluted |
$ | 0.02 | $ | 0.02 | $ | 0.04 | $ | 0.03 | ||||
70
Table of Contents
During 2009, the Company experienced an increase in revenues in the sports medicine, dental, surgical specialties, bone graft substitutes, and general orthopedic product categories, and a decrease in its spine product category. Sports medicine and surgical specialties product categories were positively impacted by increases in unit volumes and favorable product distribution mixes. The Company’s bone graft substitutes product category was positively impacted by new product launches. Revenue increases in the Company’s dental and general orthopedic categories were primarily attributable to twelve months of revenue on products added in the TMI acquisition for 2009 versus ten months in 2008. Gross profits increased as a result of higher revenues.
The following table sets forth the results of operations for the periods indicated:
| March 31, 2008 |
June 30, 2008 |
September 30, 2008 |
December 31, 2008 |
||||||||||
| Quarter Ended: |
|||||||||||||
| Revenues |
$ | 29,910 | $ | 40,828 | $ | 38,534 | $ | 37,363 | |||||
| Gross profit |
13,800 | 19,412 | 17,947 | 17,655 | |||||||||
| Net income (loss) |
645 | 1,504 | 388 | (102,515 | ) | ||||||||
| Net income (loss) per common share: |
|||||||||||||
| Basic |
$ | 0.02 | $ | 0.03 | $ | 0.01 | $ | (1.89 | ) | ||||
| Diluted |
$ | 0.02 | $ | 0.03 | $ | 0.01 | $ | (1.89 | ) | ||||
During 2008, the Company experienced an increase in revenues due to the acquisition of TMI resulting in the addition of the dental and surgical specialties product categories and increases in general orthopedic, and continued growth in the sports medicine product category. In 2008, the Company experienced a decrease in bone graft substitutes revenues due to lower demand for its products in this area and in cardiovascular revenues due to the exit from this business in 2007. The sports medicine product category was positively impacted by the Company’s increased availability of tissue, new product launches and expansion of its distribution network. Gross profits increased as a result of higher revenues, products added in the TMI acquisition with higher profit margins and changes in the mix of implants distributed. During the fourth quarter, the Company recognized a goodwill impairment of $103,007 and asset impairments and abandonments of $1,402 on the Company’s other intangible assets, remaining cardiovascular assets and other non-productive assets.
71
Table of Contents
RTI BIOLOGICS, INC. AND SUBSIDIARIES
Schedule II
Valuation and Qualifying Accounts
Years Ended December 31, 2009, 2008 and 2007
(Dollars in thousands)
| Description |
Balance at Beginning of Period |
Charged to Costs and Expenses |
Deductions- Write-offs, Payments or Other Adjustments(1) |
Balance at End of Period | |||||||||
| For the year ended December 31, 2009: |
|||||||||||||
| Allowance for doubtful accounts |
$ | 1,231 | $ | 92 | $ | 220 | $ | 1,103 | |||||
| Allowance for product returns |
504 | 117 | 428 | 193 | |||||||||
| Allowance for obsolescence |
16,826 | 1,940 | 6,635 | 12,131 | |||||||||
| For the year ended December 31, 2008: |
|||||||||||||
| Allowance for doubtful accounts |
232 | 311 | (688 | ) | 1,231 | ||||||||
| Allowance for product returns |
363 | 327 | 186 | 504 | |||||||||
| Allowance for obsolescence |
10,734 | 2,372 | (3,720 | ) | 16,826 | ||||||||
| For the year ended December 31, 2007: |
|||||||||||||
| Allowance for doubtful accounts |
197 | 73 | 38 | 232 | |||||||||
| Allowance for product returns |
50 | 313 | — | 363 | |||||||||
| Allowance for obsolescence |
14,742 | 1,479 | 5,487 | 10,734 | |||||||||
| (1) | Other adjustments include the balances acquired as part of the acquisition of TMI on February 27, 2008. |
72
Table of Contents
SIGNATURES
Pursuant to the requirements of Section 13 or 15(d) of the Securities Exchange Act of 1934, the registrant has duly caused this report to be signed on its behalf by the undersigned, thereunto duly authorized.
| March 1, 2010 | RTI BIOLOGICS, INC. | |||||||
| By: | /s/ Brian K. Hutchison | |||||||
| Brian K. Hutchison | ||||||||
| Chairman and Chief Executive Officer | ||||||||
Pursuant to the requirements of the Securities Exchange Act of 1934, this report has been signed below by the following persons on behalf of the registrant and in the capacities and on the dates indicated.
| Signature |
Title |
Date | ||
| /s/ Brian K. Hutchison Brian K. Hutchison |
Chairman, and Chief Executive Officer (Principal Executive Officer) | March 1, 2010 | ||
| /s/ Thomas F. Rose Thomas F. Rose |
Executive Vice President, Chief Financial Officer and Secretary | March 1, 2010 | ||
| /s/ Philip R. Chapman Philip R. Chapman |
Director | March 1, 2010 | ||
| /s/ Peter F. Gearen Peter F. Gearen |
Director | March 1, 2010 | ||
| /s/ Michael J. Odrich Michael J. Odrich |
Director | March 1, 2010 | ||
| /s/ Gregory P. Rainey Gregory P. Rainey |
Director | March 1, 2010 | ||
| /s/ David J. Simpson David J. Simpson |
Director | March 1, 2010 | ||
| /s/ Julianne M. Bowler Julianne M. Bowler |
Director | March 1, 2010 | ||
| /s/ Roy D. Crowninshield Roy D. Crowninshield |
Director | March 1, 2010 | ||
| /s/ Udo Henseler Udo Henseler |
Director | March 1, 2010 | ||
| /s/ Adrian J.R. Smith Adrian J.R. Smith |
Director | March 1, 2010 | ||
Table of Contents
EXHIBIT INDEX
| Exhibit |
Description | |
| 3.1 | Amended and Restated Certificate of Incorporation of RTI Biologics, Inc.1 | |
| 3.2 | Bylaws.2 | |
| 4.3 | Specimen Stock Certificate.3 | |
| 10.1 | Omnibus Stock Option Plan.3 | |
| 10.2 | Year 2000 Compensation Plan.3 | |
| 10.3 | Form of Indemnification Agreement between RTI Biologics, Inc. and its directors and executive officers.3 | |
| 10.4 | Employment Agreement between RTI Biologics, Inc. and Brian K. Hutchison, dated November 30, 2001.4 | |
| 10.5 | Employment Agreement between RTI Biologics, Inc. and Thomas F. Rose, dated May 1, 2002.5 | |
| 10.6 | Incentive Stock Option Grant Agreement between RTI Biologics, Inc. and Brian K. Hutchison, dated December 3, 2001.4 | |
| 10.7 | Employment Agreement between RTI Biologics, Inc. and Roger W. Rose, dated October 21, 2002.6 | |
| 10.8 | RTI Biologics, Inc. 2004 Equity Incentive Plan.7 | |
| 10.9 | Form of Nonqualified Stock Option Grant Agreement.8 | |
| 10.10 | Form of Incentive Stock Option Grant Agreement.8 | |
| 10.11 | License Agreement, dated November 24, 2008, between RTI Biologics, Inc. and LifeNet Health, Inc.†9 | |
| 10.12 | Credit Agreement, dated January 28, 2008, between RTI Biologics, Inc. and Mercantile Bank.9 | |
| 10.13 | First Amendment to the Credit Agreement, dated June 11, 2009, between RTI Biologics, Inc. and Mercantile Bank.10 | |
| 21 | Subsidiaries of the Registrant.9 | |
| 23.1 | Consent of Independent Registered Public Accounting Firm. | |
| 31.1 | Certification of Brian K. Hutchison, Chairman, President and Chief Executive Officer, pursuant to Section 302 of the Sarbanes-Oxley Act of 2002. | |
| 31.2 | Certification of Thomas F. Rose, Vice President, Chief Financial Officer and Secretary, pursuant to Section 302 of the Sarbanes-Oxley Act of 2002. | |
| 32.1 | Certification of Brian K. Hutchison, Chairman, President and Chief Executive Officer, pursuant to Section 906 of the Sarbanes-Oxley Act of 2002, regarding the information contained in RTI Biologics, Inc.’s Annual Report on Form 10-K for the year ended December 31, 2009. | |
| 32.2 | Certification of Thomas F. Rose, Vice President, Chief Financial Officer and Secretary, pursuant to Section 906 of the Sarbanes-Oxley Act of 2002, regarding the information contained in RTI Biologics, Inc.’s Annual Report on Form 10-K for the year ended December 31, 2009. | |
| 1 | Incorporated by reference to our Current Report on Form 8-K filed February 29, 2008. |
| 2 | Incorporated by reference to our Current Report on Form 8-K filed August 4, 2008. |
| 3 | Incorporated by reference to our Registration Statement on Form S-1 (File No. 333-35756). |
| 4 | Incorporated by reference to our Annual Report on Form 10-K for the year ended December 31, 2001. |
| 5 | Incorporated by reference to our Annual Report on Form 10-K for the year ended December 31, 2003. |
| 6 | Incorporated by reference to our Quarterly Report on Form 10-Q for the quarter ended March 31, 2004. |
| 7 | Incorporated by reference to our Quarterly Report on Form 10-Q for the quarter ended June 30, 2004. |
| 8 | Incorporated by reference to our Annual Report on Form 10-K for the year ended December 31, 2004. |
| 9 | Incorporated by reference to our Annual Report on Form 10-K for the year ended December 31, 2008. |
| 10 | Incorporated by reference to our Quarterly Report on Form 10-Q for the quarter ended June 30, 2009. |
| † | Confidential treatment requested as to certain portions, which portions were omitted and filed separately with the Commission. |