Attached files
| file | filename |
|---|---|
| 8-K - FORM 8-K INVESTOR PRESENTATION 3/1/10 - KITE REALTY GROUP TRUST | form8k030110.htm |
EXHIBIT
99.1

Kite
Realty Group Trust
Investor Presentation
Information as of December 31, 2009
Investor Presentation
Information as of December 31, 2009

2
|
§ Stable
Operating Portfolio
|
§ 55
Operating Properties in 9 states
§ 91%
leased
§ Diverse
tenant base
§ 5
mile demographics: Population
120,000; Average HHI $83,000
|
|
§ Increased
Leasing Productivity
|
§ 300,000
square feet of leases executed in Q4 2009
§ 700,000
square feet of leases executed in CY 2009
§ 14
Jr. Anchor new leases and renewals completed in 2009
|
|
§ Proven
Debt Management
|
§ No
remaining 2010 debt maturities
§ $300
million of property refinancings and extensions since 3Q 2008
§ Of
the 2011 maturities, only 2 are CMBS loans totaling $20
million
§ 82%
of maturities through 2012 held by relationship lenders
|
|
§ Mitigating
Development Exposure
|
§ Only
two developments under construction - combined 73% leased
§ Executed
Whole Foods lease at Cobblestone Plaza in Florida
§ Rent
commencements 2010-2011
§ Reduced
development as % of gross RE assets 1800 bps since
12/07
|
Information as of
December 31, 2009
COMPANY
OVERVIEW

3
§ Rent
commencement on executed Jr anchor leases
§ Jr
anchor leases in negotiation
§ Return
to normal small shop occupancy
§ Execute
on the redevelopment pipeline
§ Complete
the current development pipeline
§ Shadow
pipeline potential
§ Joint
venture capital
GROWTH
SOURCES
4
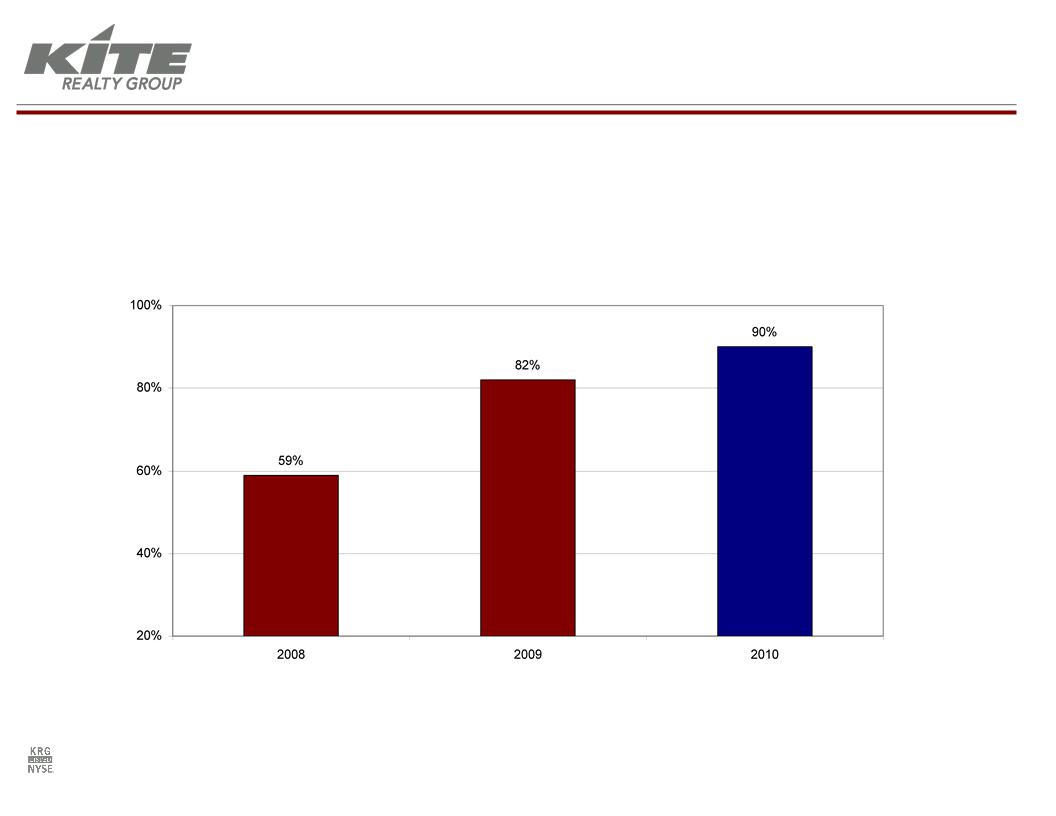
§ We
have made a concerted effort to improve the quality and predictability
of
our FFO stream.
our FFO stream.
Real
Estate Rental Operations as a Percent of FFO(1)
(1) 2010
as projected within the Company’s previously released earning’s
guidance.
IMPROVING FFO
QUALITY
5
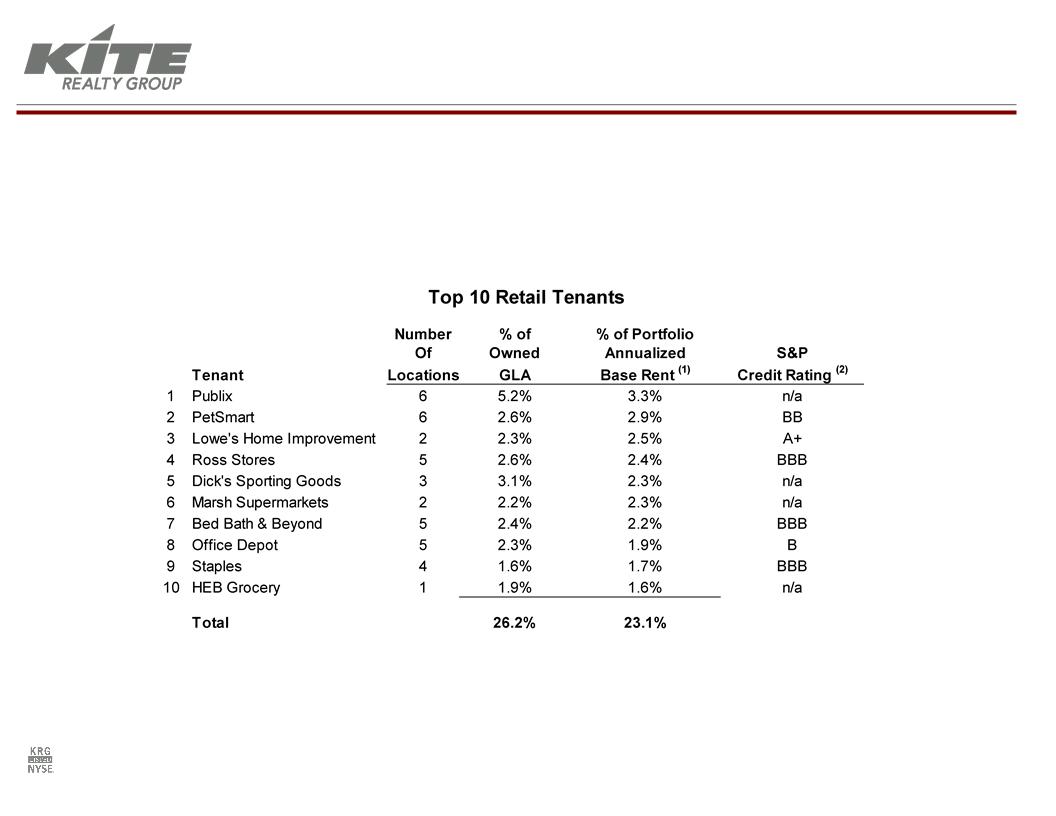
(1) Annualized
base rent represents the monthly contractual rent for December 2009 for each
applicable tenant multiplied by 12.
(2) S&P
credit ratings for parent company as of 2/19/10.
§ Largest
single retail tenant comprises only 3.3% of total annualized base
rent
§ Top
10 retail tenants account for only 23.1% of total annualized base
rent
Information as of
December 31, 2009
(unless
otherwise noted)
DIVERSE
TENANT BASE
6
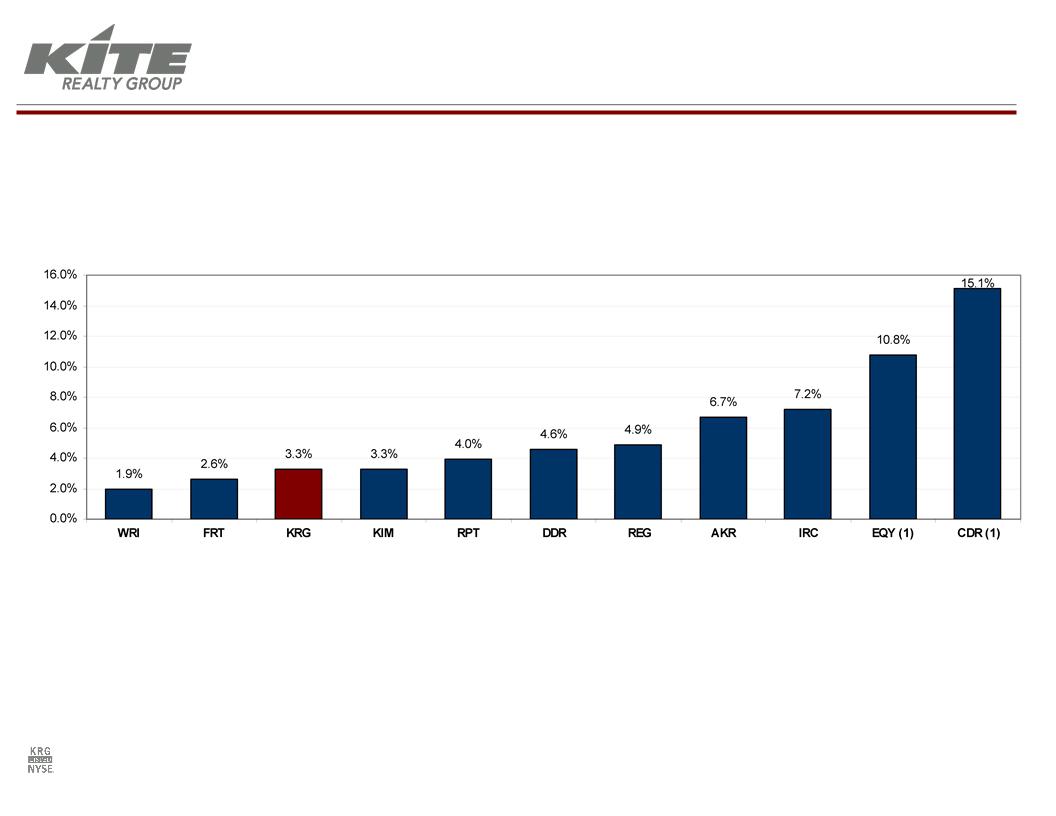
Peer
Group Assessment:
Top
Tenant as a Percent of Annualized Base Rent
|
Kroger
|
Bed
Bath
Beyond |
Publix
|
Home
Depot |
TJ
Maxx
|
Wal-Mart/
Sam’s |
Kroger
|
A&P
|
Supervalu
|
Publix
|
Giant
Foods |
(1) Information
as of September 30, 2009.
Source:
Company SEC filings.
Information as of
December 31, 2009
(unless
otherwise noted)
DIVERSE
TENANT BASE
7
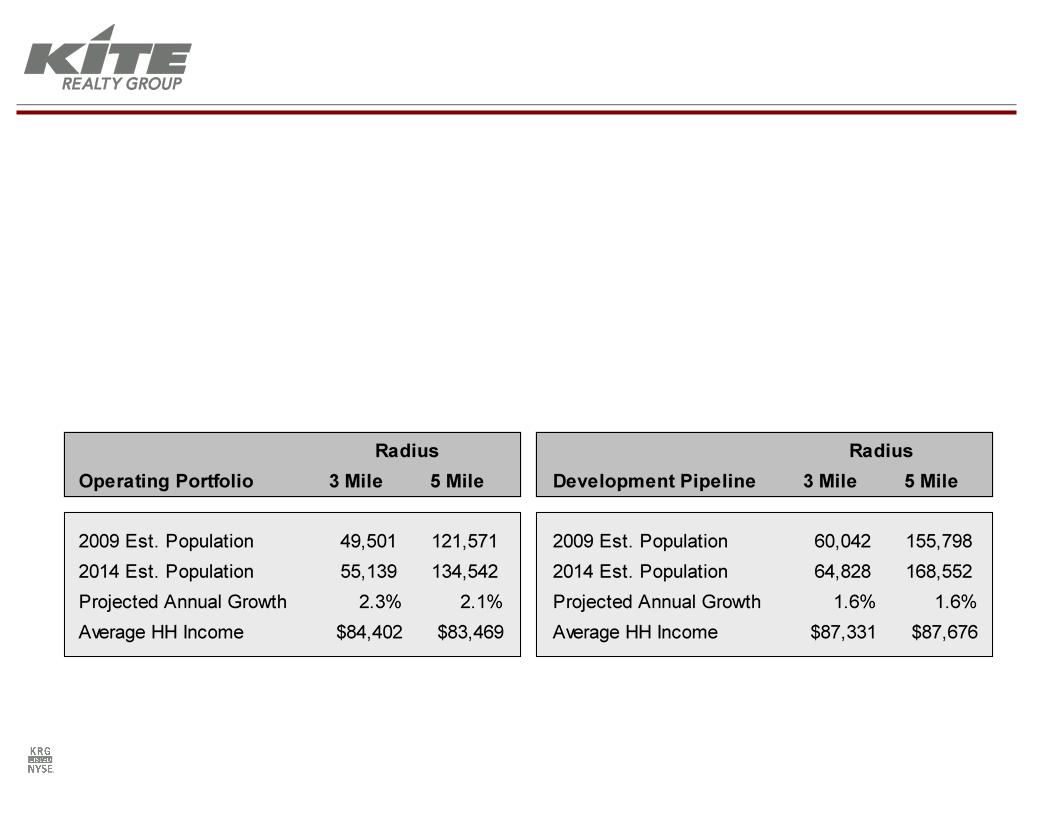
Source:
Applied Geographic Solutions.
§ High
quality assets with an average age of only eight years
§ Approximately
half of the current portfolio was developed by KRG
§ Portfolio
benefits from 100% non-owned anchor occupancy
§ Strong
household incomes surrounding operating portfolio and development
pipelines
Portfolio
Demographics Comparison
Operating Portfolio
vs. Development Pipelines
STRONG
DEMOGRAPHICS
8
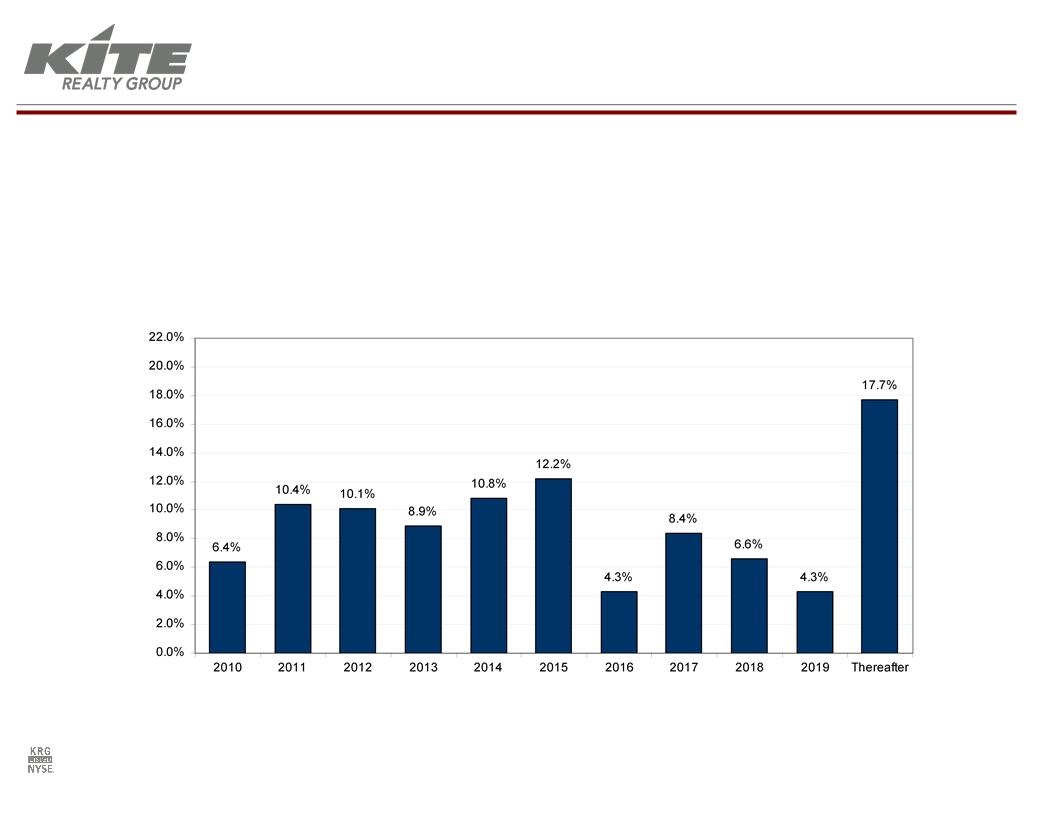
(1) Lease
expirations of operating portfolio and excludes option periods and ground
leases. Annualized base rent represents the monthly contractual rent
for December 2009 for each applicable property multiplied by 12.
for December 2009 for each applicable property multiplied by 12.
§ No
more than 12.2% of total annualized rent is expected to rollover in any one
year
§ Higher
2011-2015 rollover defers renewal negotiations to a potentially
stronger
leasing environment
leasing environment
Percentage
of Lease Expiration by Total Annualized Base Rent(1)
Information as of
December 31, 2009
WELL-STAGGERED LEASE
EXPIRATIONS
9
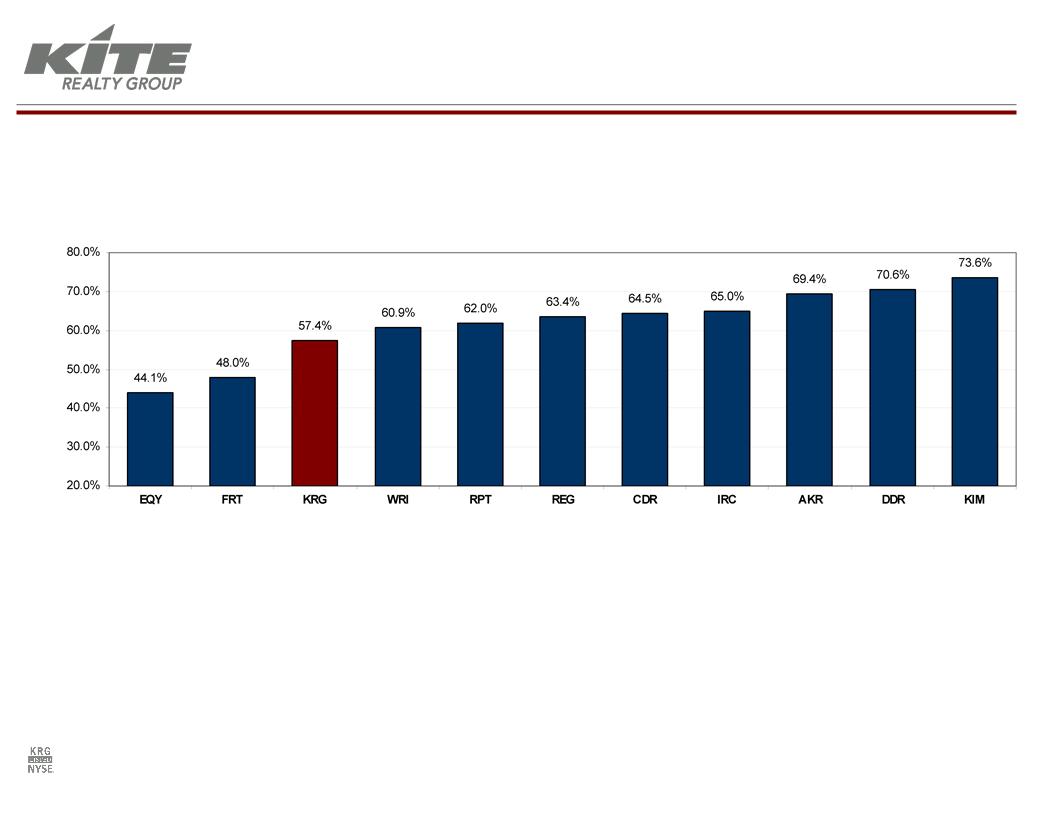
Peer
Group Assessment:
Debt
Plus Preferred as a Percent of Gross Assets
(1) Source: KeyBanc
Capital Markets Leaderboard, 2/19/2010.
Calculation: Consolidated
Debt / Total Consolidated Assets
MANAGING
LEVERAGE
10
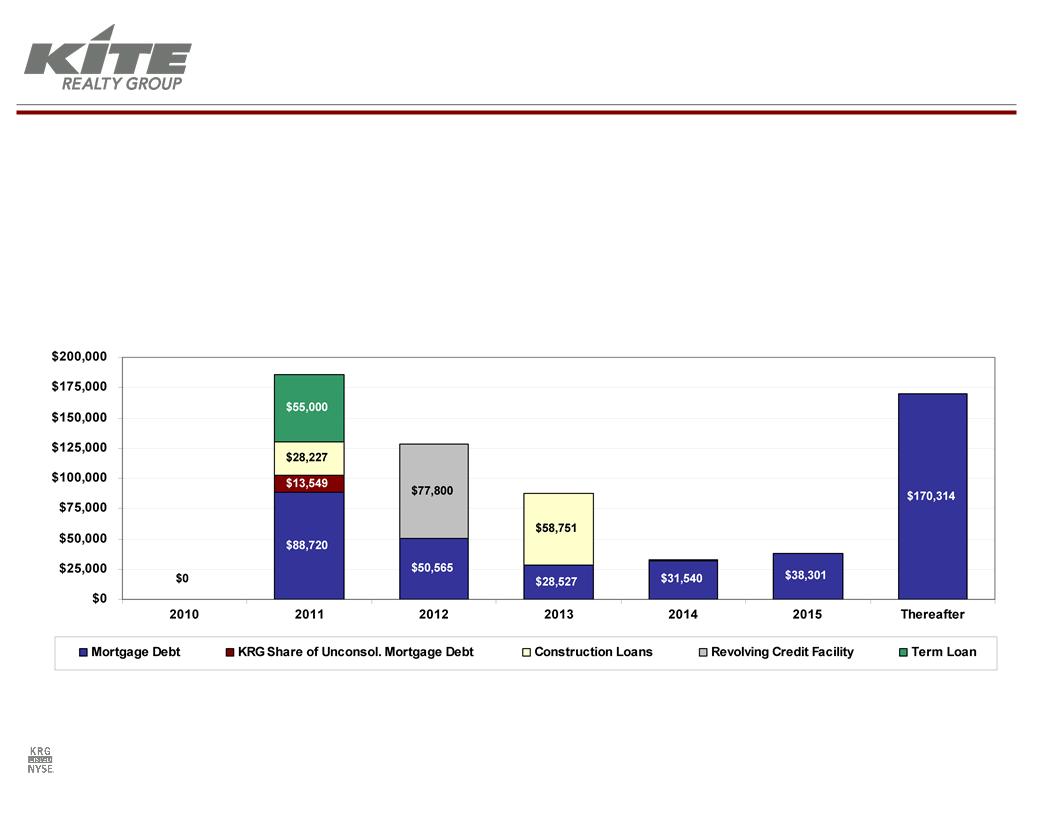
Scheduled
Debt Maturities (1)(2)(3)(4)
(1) Maturities
exclude annual principal amortization.
(2) Includes
effects of loan closings, payoffs, and commitments that occurred subsequent to
December 31, 2009.
(3) Amount
due in 2012 includes the outstanding balance on our unsecured revolving credit
facility, and assumes exercise of available extension option.
(4) Dollars
in thousands.
§ Extended
or refinanced all 2010 debt maturities by February 2010
§ 2011
maturities are in process:
§ Only
2 CMBS loans totaling $20 million
§ 5
of 7 property loans held on balance sheet were underwritten with more stringent
2008-09 standards
§ Approximately
82% of debt maturities through 2012 are held on balance sheet by relationship
banks including
unsecured term loan
unsecured term loan
MANAGING
LEVERAGE

11
§ Eddy Street Commons
at Notre Dame
§ 72% pre-leased or
committed
§ 79% of projected
costs incurred
Current
Development Pipeline - Two Projects
Information as of
December 31, 2009
§ Capital
Summary
(Dollars in
thousands)
§ Eddy Street
Estimated Project Costs: $35,000
§ Cobblestone Plaza
Estimated Project Costs:
$52,000
§ Total Cost Incurred
as of 12/31/09:
($72,811)
§ Remaining Cost to be
Spent:
$14,189
§ Cobblestone Plaza,
Ft. Lauderdale, FL
§ 74% pre-leased with
Whole Foods executed lease
§ 87% of projected
costs incurred
REDUCING
DEVELOPMENT
12
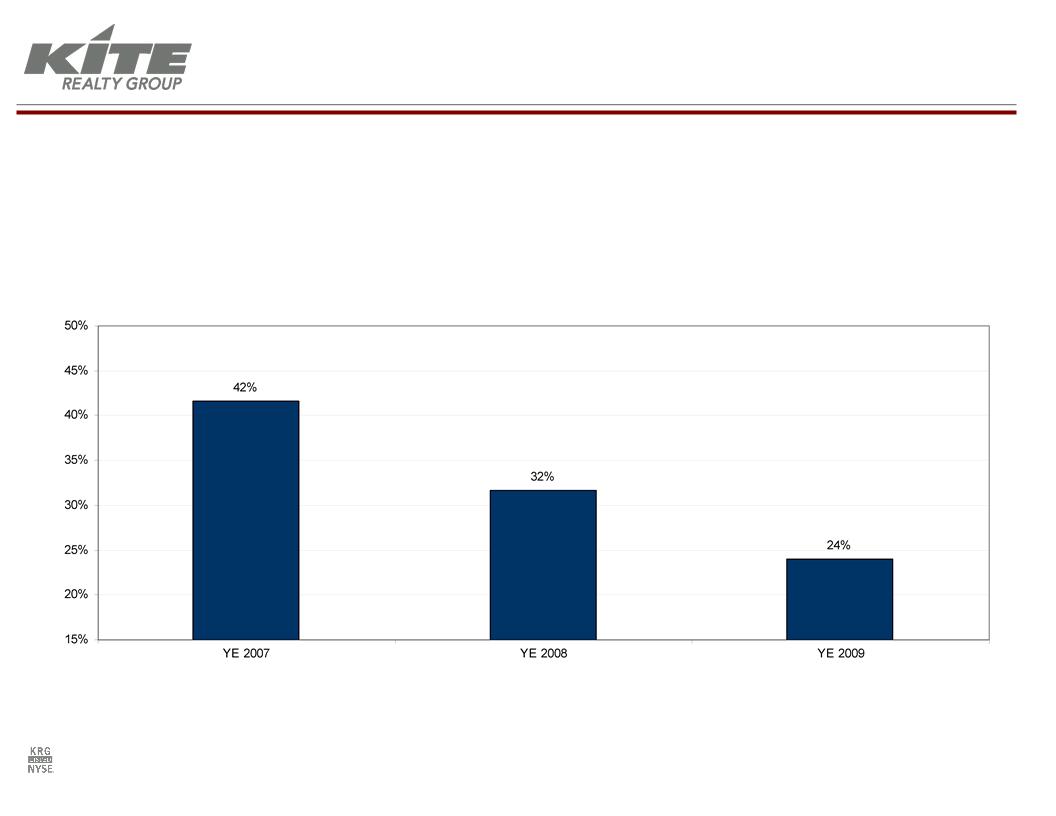
§ Ongoing
effort to reduce the size of our development pipeline.
Total
Development Pipeline as a Percent of Gross Real Estate Assets (1)(2)
(1) Development
Pipeline includes Current Developments, Redevelopments and Shadow Pipeline with
the Company’s share of Parkside Town Commons reflected at 20%.
(2) Also
includes unconsolidated Gross Real Estate Assets with the Company’s share of
Parkside Town Commons reflected at 20%.
REDUCING
DEVELOPMENT
13
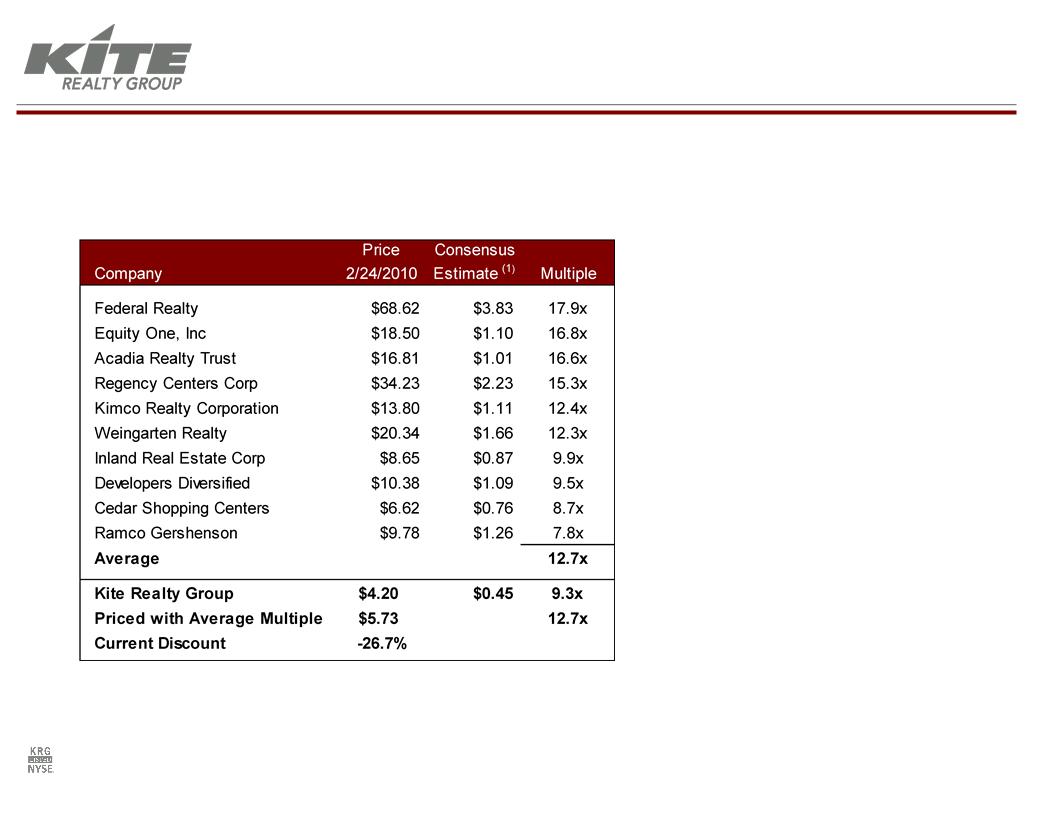
§ Assuming
a peer group average
multiple of 12.7x, our stock is
trading at a 27% discount
multiple of 12.7x, our stock is
trading at a 27% discount
(1) Source: Thomson
mean 2010 estimate as of February 24, 2010.
Peer
Group Assessment:
FFO
Multiple
PEER
GROUP ANALYSIS
14
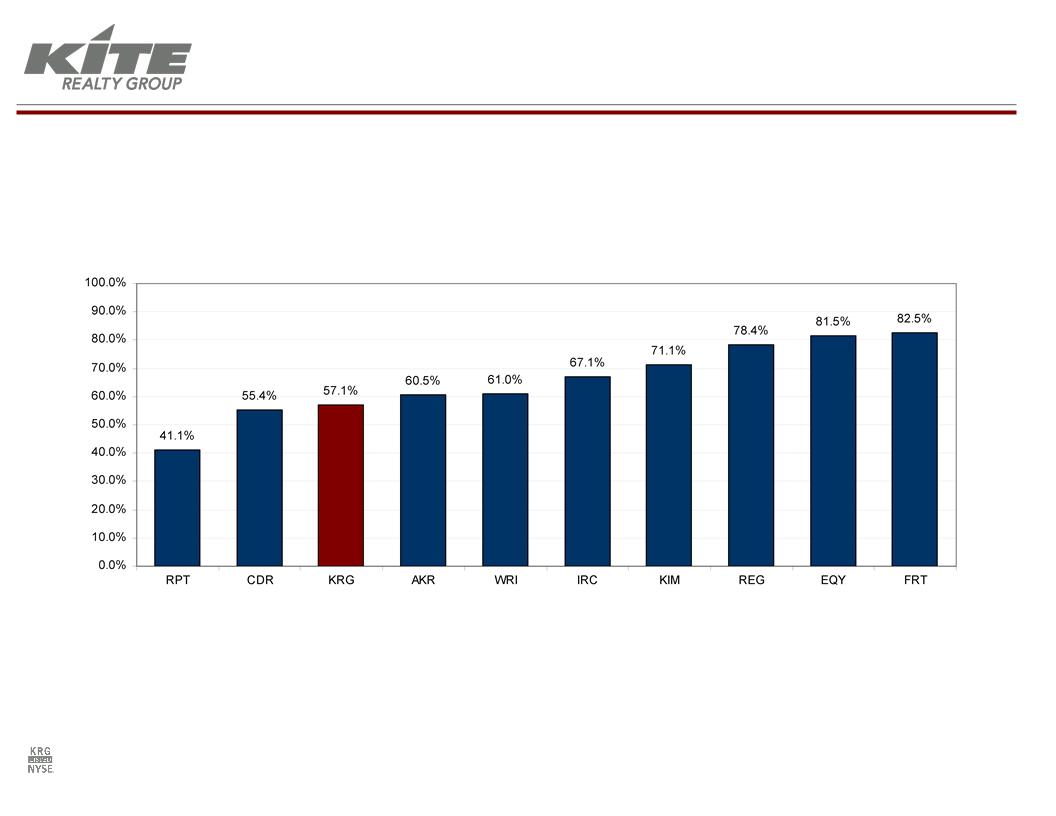
Peer
Group Assessment:
2009
AFFO PAYOUT RATIO
(1) Source: Company
filings and KeyBanc Capital Markets Leaderboard, 2/19/10.
PEER
GROUP ANALYSIS
15
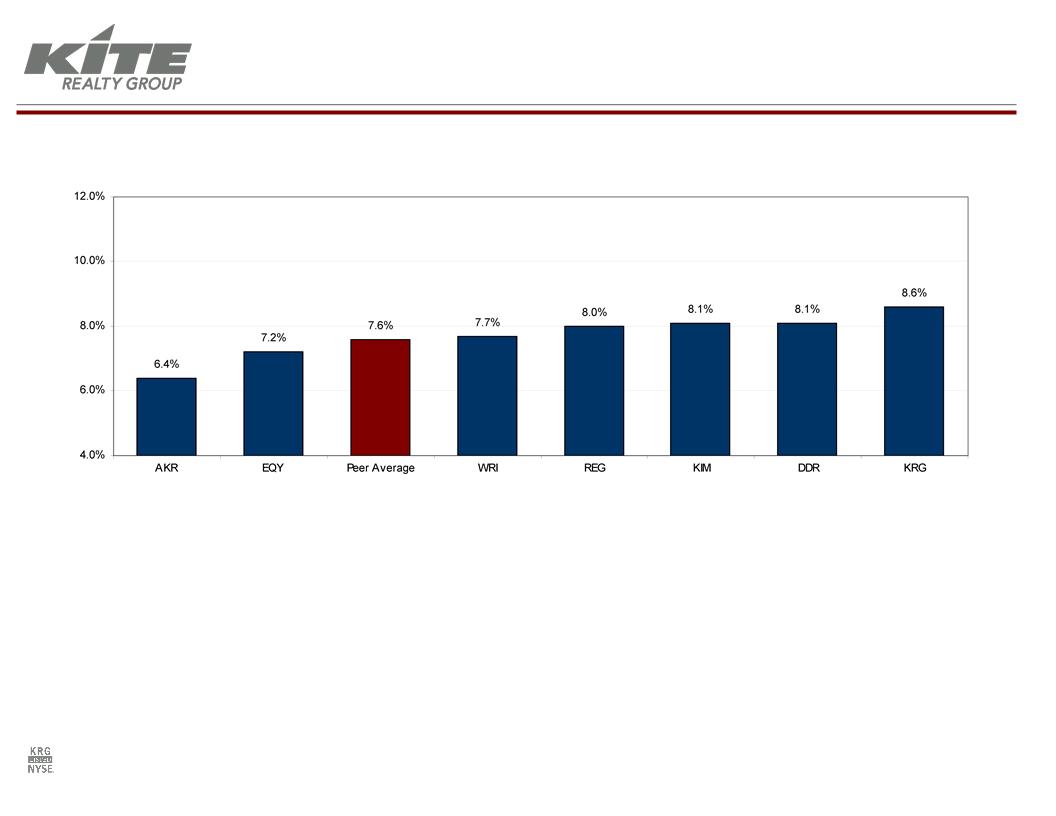
Peer
Group Analysis:
Implied
Cap Rate
(1) Source: Citigroup
Investment Research, 2/24/2010.
§ Using
the peer group average implied cap rate of 7.6%, KRG is trading at a 23%
discount
§ KRG
Share Price 2/24/10: $4.20
§ KRG
Share Price using 7.6% implied cap rate: $5.45
PEER
GROUP ANALYSIS

16
2010
FFO Guidance
§ Estimated FFO
guidance range of $0.42 to $0.47 per diluted share
§ Includes the full
year effect of the May 2009 common equity offering;
§ Portfolio leased
percentage ranging from 90% to 92% at December 31, 2010;
§ A decrease in same
property net operating income ranging from 0.0% to 2.0%;
§ An interest rate
environment consistent with the current forward yield curve for one month
LIBOR
and the 10-year US Treasury note;
and the 10-year US Treasury note;
§ Transactional FFO
ranging from $0.01 to $0.03 on a pretax basis;
§ General and
administrative expense ranging from approximately $5.5 million to $5.8
million;
§ No material
acquisition or disposition activity;
§ Construction and
service fee net margin ranging from $0.01 to $0.03 on a pretax
basis.
GUIDANCE

17
DISCLAIMER
Certain statements
in this presentation that are not historical fact may constitute
forward-looking
statements within the meaning of the Private Securities Litigation Reform Act of 1995. Such
forward-looking statements involve known and unknown risks, uncertainties and other factors
which may cause the actual results of the Company to differ materially from historical results or
from any results expressed or implied by such forward-looking statements, including without
limitation: national and local economic, business, real estate and other market conditions; the
ability of tenants to pay rent; the competitive environment in which the Company operates;
financing risks, including access to capital at desirable terms; the risk that the Company’s
assumptions related to its 2010 net income and FFO guidance change; property management
risks; the level and volatility of interest rates; financial stability of tenants; the Company’s ability to
maintain its status as a REIT for federal income tax purposes; acquisition, disposition, development
and joint venture risks; potential environmental and other liabilities; risks related to property
impairments; and other factors affecting the real estate industry generally. The Company refers you
to the documents filed by the Company from time to time with the Securities and Exchange
Commission, which discuss these and other factors that could adversely affect the Company’s
results. The Company undertakes no obligation to publicly update or revise these forward-looking
statements (including the FFO and net income estimates), whether as a result of new information,
future events or otherwise.