Attached files
| file | filename |
|---|---|
| EX-99.1 - TAX DISCLOSURE - KITE REALTY GROUP TRUST | exhibit99_1x2017x10k.htm |
| EX-32.2 - CEO AND CFO CERTIFICATION - KITE REALTY GROUP TRUST | exhibit32_2x2017x10k.htm |
| EX-32.1 - CEO AND CFO CERTIFICATION - KITE REALTY GROUP TRUST | exhibit32_1x2017x10k.htm |
| EX-31.4 - CFO CERTIFICATION - KITE REALTY GROUP TRUST | exhibit31_4x2017x10k.htm |
| EX-31.3 - CEO CERTIFICATION - KITE REALTY GROUP TRUST | exhibit31_3x2017x10k.htm |
| EX-31.2 - CFO CERTIFICATION - KITE REALTY GROUP TRUST | exhibit31_2x2017x10k.htm |
| EX-31.1 - CEO CERTIFICATION - KITE REALTY GROUP TRUST | exhibit31_1x2017x10k.htm |
| EX-23.2 - CONSENT - KITE REALTY GROUP TRUST | exhibit23_2x2017x10k.htm |
| EX-23.1 - CONSENT - KITE REALTY GROUP TRUST | exhibit23_1x2017x10k.htm |
| EX-21.1 - SUBSIDIARIES - KITE REALTY GROUP TRUST | exhibit21_1x2017x10k.htm |
| EX-12.2 - RATIOS - KITE REALTY GROUP TRUST | exhibit12_2x2017x10k.htm |
| EX-12.1 - RATIOS - KITE REALTY GROUP TRUST | exhibit12_1x2017x10k.htm |
| EX-10.49 - TRUSTEE FEES - KITE REALTY GROUP TRUST | exhibit10_49x2017x10k.htm |
UNITED STATES
SECURITIES AND EXCHANGE COMMISSION
Washington, D.C. 20549
FORM 10-K
(Mark One) | |
x | Annual report pursuant to Section 13 or 15(d) of the Securities Exchange Act of 1934 |
For the fiscal year ended December 31, 2017 | |
o | Transition report pursuant to Section 13 or 15(d) of the Securities Exchange Act of 1934 |
For the transition period from ___________to___________ | |
Commission File Number: 001-32268 (Kite Realty Group Trust) | |
Commission File Number: 333-202666-01 (Kite Realty Group, L.P.) | |
Kite Realty Group Trust
Kite Realty Group, L.P.
(Exact name of registrant as specified in its charter)
Maryland (Kite Realty Group Trust) | 11-3715772 | |
Delaware (Kite Realty Group, L.P.) | 20-1453863 | |
(State or other jurisdiction of incorporation or organization) | (IRS Employer Identification No.) | |
30 S. Meridian Street, Suite 1100 | ||
Indianapolis, Indiana 46204 | ||
(Address of principal executive offices) (Zip code) | ||
(317) 577-5600 | ||
(Registrant’s telephone number, including area code) | ||
Title of each class | Name of each exchange on which registered | |
Common Shares, $0.01 par value | New York Stock Exchange | |
Securities registered pursuant to Section 12(g) of the Act: None
Indicate by check mark if the Registrant is a well-known seasoned issuer, as defined by Rule 405 of the Securities Act.
Kite Realty Group Trust | Yes x | No o | Kite Realty Group, L.P. | Yes x | No o |
Indicate by check mark if the Registrant is not required to file reports pursuant to Section 13 of Section 15(d) of the Act.
Kite Realty Group Trust | Yes o | No x | Kite Realty Group, L.P. | Yes o | No x |
Indicate by check mark whether the Registrant (1) has filed all reports required to be filed by Section 13 or 15(d) of the Securities Exchange Act of 1934 during the preceding 12 months (or for such shorter period that the Registrant was required to file such reports), and (2) has been subject to such filing requirements for the past 90 days.
Kite Realty Group Trust | Yes x | No o | Kite Realty Group, L.P. | Yes x | No o |
Indicate by check mark whether the Registrant has submitted electronically and posted on its corporate Web site, if any, every Interactive Data File required to be submitted and posted pursuant to Rule 405 of Regulation S-T during the preceding 12 months (or for such shorter period that the registrant was required to submit and post such files).
Kite Realty Group Trust | Yes x | No o | Kite Realty Group, L.P. | Yes x | No o |
Indicate by check mark if disclosure of delinquent filers pursuant to Item 405 of Regulation S-K is not contained herein, and will not be contained, to the best of Registrant’s knowledge, in definitive proxy or information statements incorporated by reference in Part III of this Form 10-K or any amendment to this Form 10-K. x
Indicate by check mark whether the Registrant is a large accelerated filer, an accelerated filer, a non-accelerated filer, or a smaller reporting company, or an emerging growth company. See the definitions of “large accelerated filer,” “accelerated filer,” “smaller reporting company,” and "emerging growth company" in Rule 12b-2 of the Exchange Act.
Kite Realty Group Trust:
Large accelerated filer | x | Accelerated filer | o | Non-accelerated filer (do not check if a smaller reporting company) | o | Smaller reporting company | o |
Emerging growth company | o | ||||||
Kite Realty Group, L.P.:
Large accelerated filer | o | Accelerated filer | o | Non-accelerated filer (do not check if a smaller reporting company) | x | Smaller reporting company | o |
Emerging growth company | o | ||||||
If an emerging growth company, indicate by check mark if the registrant has elected not to use the extended transition period for complying with any new or revised financial accounting standards provided pursuant to Section 13(a) of the Exchange Act. o
Indicate by check mark whether the Registrant is a shell company (as defined in Rule 12b-2 of the Act)
Kite Realty Group Trust | Yes o | No x | Kite Realty Group, L.P. | Yes o | No x |
The aggregate market value of the voting and non-voting common shares held by non-affiliates of the Registrant as the last business day of the Registrant’s most recently completed second quarter was $1.6 billion based upon the closing price on the New York Stock Exchange on such date.
The number of Common Shares outstanding as of February 16, 2018 was 83,599,742 ($.01 par value).
Documents Incorporated by Reference
Portions of the definitive Proxy Statement relating to the Registrant’s Annual Meeting of Shareholders, scheduled to be held on May 9, 2018, to be filed with the Securities and Exchange Commission, are incorporated by reference into Part III, Items 10-14 of this Annual Report on Form 10-K as indicated herein.
EXPLANATORY NOTE
This report combines the annual reports on Form 10-K for the year ended December 31, 2017 of Kite Realty Group Trust, Kite Realty Group, L.P. and its subsidiaries. Unless stated otherwise or the context otherwise requires, references to “Kite Realty Group Trust” or the “Parent Company” mean Kite Realty Group Trust, and references to the “Operating Partnership” mean Kite Realty Group, L.P. and its consolidated subsidiaries. The terms “Company,” “we,” “us,” and “our” refer to the Parent Company and the Operating Partnership collectively, and those entities owned or controlled by the Parent Company and/or the Operating Partnership.
The Operating Partnership is engaged in the ownership, operation, acquisition, development and redevelopment of high-quality neighborhood and community shopping centers in select markets in the United States. The Parent Company is the sole general partner of the Operating Partnership and as of December 31, 2017 owned approximately 97.7% of the common partnership interests in the Operating Partnership (“General Partner Units”). The remaining 2.3% of the common partnership interests (“Limited Partner Units” and, together with the General Partner Units, the “Common Units”) are owned by the limited partners.
We believe combining the annual reports on Form 10-K of the Parent Company and the Operating Partnership into this single report benefits investors by:
• | enhancing investors’ understanding of the Parent Company and the Operating Partnership by enabling investors to view the business as a whole in the same manner as management views and operates the business; |
• | eliminating duplicative disclosure and providing a more streamlined and readable presentation of information because a substantial portion of the Company’s disclosure applies to both the Parent Company and the Operating Partnership; and |
• | creating time and cost efficiencies through the preparation of one combined report instead of two separate reports. |
We believe it is important to understand the few differences between the Parent Company and the Operating Partnership in the context of how we operate as an interrelated consolidated company. The Parent Company has no material assets or liabilities other than its investment in the Operating Partnership. The Parent Company issues public equity from time to time but does not have any indebtedness as all debt is incurred by the Operating Partnership. In addition, the Parent Company currently does not nor does it intend to guarantee any debt of the Operating Partnership. The Operating Partnership has numerous wholly-owned subsidiaries, and it also owns interests in certain joint ventures. These subsidiaries and joint ventures own and operate retail shopping centers and other real estate assets. The Operating Partnership is structured as a partnership with no publicly-traded equity. Except for net proceeds from equity issuances by the Parent Company, which are contributed to the Operating Partnership in exchange for General Partner Units, the Operating Partnership generates the capital required by the business through its operations, its incurrence of indebtedness and the issuance of Limited Partner Units to third parties.
Shareholders’ equity and partners’ capital are the main areas of difference between the consolidated financial statements of the Parent Company and those of the Operating Partnership. In order to highlight this and other differences between the Parent Company and the Operating Partnership, there are separate sections in this report, as applicable, that separately discuss the Parent Company and the Operating Partnership, including separate financial statements and separate Exhibit 31 and 32 certifications. In the sections that combine disclosure of the Parent Company and the Operating Partnership, this report refers to actions or holdings as being actions or holdings of the collective Company.
KITE REALTY GROUP TRUST AND KITE REALTY GROUP, L.P. AND SUBSIDIARIES
Annual Report on Form 10-K
For the Fiscal Year Ended
December 31, 2017
TABLE OF CONTENTS
Page | |||
Item No. | |||
Part I | |||
1 | |||
1A. | |||
1B. | |||
2 | |||
3 | |||
4 | |||
Part II | |||
5 | |||
6 | |||
7 | |||
7A. | |||
8 | |||
9 | |||
9A. | |||
9B. | |||
Part III | |||
10 | |||
11 | |||
12 | |||
13 | |||
14 | |||
Part IV | |||
15 | |||
16 | |||
Forward-Looking Statements
This Annual Report on Form 10-K, together with other statements and information publicly disseminated by us, contains certain forward-looking statements within the meaning of Section 27A of the Securities Act of 1933 and Section 21E of the Securities Exchange Act of 1934. Such statements are based on assumptions and expectations that may not be realized and are inherently subject to risks, uncertainties and other factors, many of which cannot be predicted with accuracy and some of which might not even be anticipated. Future events and actual results, performance, transactions or achievements, financial or otherwise, may differ materially from the results, performance, transactions or achievements, financial or otherwise, expressed or implied by the forward-looking statements. Risks, uncertainties and other factors that might cause such differences, some of which could be material, include but are not limited to:
• | national and local economic, business, real estate and other market conditions, particularly in light of low growth in the U.S. economy as well as economic uncertainty caused by fluctuations in the prices of oil and other energy sources and inflationary trends or outlook; |
• | financing risks, including the availability of, and costs associated with, sources of liquidity; |
• | our ability to refinance, or extend the maturity dates of, our indebtedness; |
• | the level and volatility of interest rates; |
• | the financial stability of tenants, including their ability to pay rent and the risk of tenant bankruptcies; |
• | the competitive environment in which we operate; |
• | acquisition, disposition, development and joint venture risks; |
• | property ownership and management risks; |
• | our ability to maintain our status as a real estate investment trust for federal income tax purposes; |
• | potential environmental and other liabilities; |
• | impairment in the value of real estate property we own; |
• | the impact of online retail competition and the perception that such competition has on the value of shopping center assets; |
• | risks related to the geographical concentration of our properties in Florida, Indiana and Texas; |
• | insurance costs and coverage; |
• | risks associated with cybersecurity attacks and the loss of confidential information and other business disruptions; |
• | other factors affecting the real estate industry generally; and |
• | other risks identified in this Annual Report on Form 10-K and, in other reports we file from time to time with the Securities and Exchange Commission (the “SEC”) or in other documents that we publicly disseminate. |
We undertake no obligation to publicly update or revise these forward-looking statements, whether as a result of new information, future events or otherwise.
2
PART I
ITEM 1. BUSINESS
Unless the context suggests otherwise, references to “we,” “us,” “our” or the “Company” refer to Kite Realty Group Trust and our business and operations conducted through our directly or indirectly owned subsidiaries, including Kite Realty Group, L.P., our operating partnership (the “Operating Partnership”).
Overview
Kite Realty Group Trust is a publicly-held real estate investment trust which, through its majority-owned subsidiary, Kite Realty Group, L.P., owns interests in various operating subsidiaries and joint ventures engaged in the ownership, operation, acquisition, development, and redevelopment of high-quality neighborhood and community shopping centers in selected markets in the United States. We derive revenues primarily from activities associated with the collection of contractual rents and reimbursement payments from tenants at our properties. Our operating results therefore depend materially on, among other things, the ability of our tenants to make required lease payments, the health and resilience of the United States retail sector, interest rate volatility, job growth and overall economic and real estate market conditions.
As of December 31, 2017, we owned interests in 117 operating and redevelopment properties totaling approximately 23.3 million square feet. We also owned two development projects under construction as of this date. Our retail operating portfolio was 94.8% leased to a diversified retail tenant base, with no single retail tenant accounting for more than 2.5% of our total annualized base rent. In the aggregate, our largest 25 tenants accounted for 34.9% of our annualized base rent. See Item 2, “Properties” for a list of our top 25 tenants by annualized base rent.
Significant 2017 Activities
Operating Activities
We continued to drive strong operating results from our portfolio as follows:
• | Net income attributable to common shareholders was $11.9 million for the year ended December 31, 2017; |
• | Same Property Net Operating Income ("Same Property NOI") increased 2.9% in 2017 compared to 2016 primarily due to increases in rental rates, an increase in economic occupancy, and improved expense control and operating expense recovery; |
• | We executed leases on 393 individual spaces for approximately 2.3 million square feet of retail space, achieving a blended cash rent spread of 9.0% for comparable leases; |
• | Including the eight properties under redevelopment, our operating portfolio annual base rent per square foot as of December 31, 2017 was $16.32, an increase of $0.54 or 3.4% from the end of the prior year; and |
• | Small shop leased percentage was 90.5% as of December 31, 2017, an increase of 160 basis points over the prior year. |
Development and Redevelopment Activities
We believe evaluating our operating properties for development and redevelopment opportunities enhances shareholder value as it will make them more attractive for leasing to new tenants and it improves long-term values and economic returns. We initiated, advanced, and completed a number of development and redevelopment activities in 2017, including the following:
• | Eddy Street Commons – Phase II in South Bend, Indiana – Phase II of Eddy Street Commons is a mixed-use development at the University of Notre Dame that will include a retail component, apartments, townhomes, and a community center. The total projected costs for the project are currently $89.2 million. We are in the final stages of entering into a ground sublease with a multi-family developer who will fund the majority of these costs, leaving our share of the projected costs at $8.4 million. |
We also began construction of a full-service Embassy Suites hotel at Phase I of Eddy Street Commons, which we project will cost $45.7 million to construct. In the fourth quarter of 2017, we entered into a joint venture in which we own a 35% non-controlling interest to develop and own this hotel. We expect our pro-rata share
3
of the total estimated project costs to be $13.9 million. Funding for both Eddy Street Commons projects will include a total of $22.1 million in net tax increment financing proceeds.
• | Holly Springs Towne Center – Phase II near Raleigh, North Carolina – O2 Fitness opened in December 2017, completing the Phase II expansion. This development is also anchored by Bed Bath & Beyond, DSW, and Carmike Theatres. |
• | Parkside Town Commons – Phase II near Raleigh, North Carolina – Phase II of this development is anchored by Frank CineBowl and Grille, Golf Galaxy, Stein Mart, and Hobby Lobby, the latter opening in December 2017. We transitioned this development project to the operating portfolio at the end of the second quarter of 2017. The property is 97.5% leased as of December 31, 2017. |
• | Under Construction Redevelopment, Reposition, and Repurpose (“3-R”) Projects. Our 3-R initiative continued to progress in 2017. There are a total of seven projects currently under construction, which have an estimated combined annualized return of approximately 8% to 9%, with an aggregate cost expected to range from $71 million to $77 million. Another four projects are under active evaluation. |
We completed construction on the following 3-R projects during 2017:
◦ | Bolton Plaza in Jacksonville, Florida – We replaced vacant shop space with Marshalls, which opened in March 2017, and Aldi, which opened in January 2018. Total costs were $5.2 million, and the projected annual return is 10.5%. |
◦ | Castleton Crossing in Indianapolis, Indiana – We demolished certain existing space and created a new outparcel small shop building. The new tenants include Chipotle, Capriotti's and Verizon Wireless. Total costs were $3.3 million, and the projected annual return is 11.8%. |
◦ | Centennial Gateway in Las Vegas, Nevada – We recaptured an existing anchor space and retenanted with Trader Joe's, which opened in June 2017. Total costs were $1.1 million, and the projected annual return is 30.0%. |
◦ | Market Street Village in Fort Worth, Texas – We recaptured a 15,000 square foot anchor space and retenanted with Party City, which opened in April 2017. Total costs were $0.8 million, and the projected annual return is 30.9%. |
◦ | Northdale Promenade in Tampa, Florida – We rightsized and demolished certain small shop space to add Ulta Beauty and Crispers, which opened in 2016, and Tuesday Morning, which opened in July 2017. Total costs were $4.2 million, and the projected annual return is 14.4%. |
◦ | Portofino Shopping Center - Phase I in Houston, Texas – We constructed two small shop buildings on outparcels and added several tenants, including Mattress Firm and Destination XL. Total costs were $5.1 million, and the projected annual return is 9.1%. |
◦ | Trussville Promenade in Birmingham, Alabama – We replaced vacant shop space with Ross Dress for Less, which opened in November 2017. Total costs were $3.7 million, and the projected annual return is 9.5%. |
We commenced construction on the following 3-R projects during 2017:
◦ | Beechwood Promenade in Athens, Georgia – This project includes replacing vacant anchor and shop space with Michaels and constructing a new outlot for Starbucks. We expect total costs for this project to range between $8 million to $9 million, with an estimated annualized return of approximately 8.5% to 9.5%. |
◦ | Burnt Store Promenade in Punta Gorda, Florida – We completed construction on a new expanded Publix Supermarket, which opened in July 2017. We executed leases with Pet Supermarket, Inc., which opened in July 2017, and Anytime Fitness, which opened in October 2017. We expect to lease additional vacant shop space in 2018. We expect total costs for this project to range between $9 million to $10 million, with an estimated annualized return of approximately 10.5% to 11.5%. |
◦ | Centennial Center in Las Vegas, Nevada – This project will include repositioning two retail buildings totaling 14,000 square feet, construction of a new Panera Bread outlot, and enhancing |
4
buildings and improving access to the main entry point. We expect total costs for this project to range between $4 million to $5 million, with an estimated annualized return of approximately 10.0% to 11.0%.
◦ | Fishers Station in Indianapolis, Indiana – We demolished the previous anchor space and executed a 123,000 square foot ground lease for a new Kroger Marketplace. We expect total costs for this project to range between $10.5 million to $11.5 million, with an estimated annualized return of approximately 9.5% to 10.5%. |
◦ | Rampart Commons in Las Vegas, Nevada – This project includes relocating, retenanting, and renegotiating leases as part of a new development plan. We will upgrade building facades and landscape throughout the center. This project is anchored by Williams Sonoma, Pottery Barn, Ann Taylor, North Italia, Athleta, Flower Child, Honey Salt and P.F. Chang's. We expect total costs for this project to range between $16 million to $17 million, with an estimated annualized return of approximately 7.0% to 7.5%. |
Financing and Capital Raising Activities.
In 2017, we were able to maintain our strong balance sheet, financial flexibility and liquidity to fund future growth. We ended the year with approximately $398 million of combined cash and borrowing capacity on our unsecured revolving credit facility. We have a well-laddered debt maturity schedule with only $82.4 million maturing through December 31, 2020 and a debt service coverage ratio of 3.5x as of December 31, 2017. We have been assigned investment grade corporate credit ratings from two nationally recognized credit rating agencies. These ratings were unchanged during 2017.
Portfolio Recycling Activities
During 2017, we sold four non-core operating properties. These sales generated $78 million of gross proceeds that were used to pay down our existing unsecured revolving credit facility and partially fund our redevelopment costs.
Cash Distributions
We declared total cash distributions of $1.225 per common share with payment dates as follows:
Payment Date | Amount Per Share | |||
April 13, 2017 | $ | 0.3025 | ||
July 13, 2017 | $ | 0.3025 | ||
October 13, 2017 | $ | 0.3025 | ||
January 12, 2018 | $ | 0.3175 | ||
Business Objectives and Strategies
Our primary business objectives are to increase the cash flow and value of our properties, achieve sustainable long-term growth and maximize shareholder value primarily through the operation, acquisition, development, and redevelopment of well-located community and neighborhood shopping centers. We invest in properties with well-located real estate and strong demographics, and we use our leasing and management strategies to improve the long-term values and economic returns of our properties. We believe the properties in our 3-R initiative represent attractive opportunities for profitable renovation and expansion.
We seek to implement our business objectives through the following strategies, each of which is more completely described in the sections that follow:
• | Operating Strategy: Maximizing the internal growth in revenue from our operating properties by leasing and re-leasing to a diverse group of retail tenants at increasing rental rates, when possible, and redeveloping or renovating certain properties to make them more attractive to existing and prospective tenants and consumers; |
• | Growth Strategy: Using cash flow, equity, and debt capital prudently to selectively acquire additional retail properties and redevelop or renovate our existing properties where we believe that investment returns would meet or exceed internal benchmarks; and |
5
• | Financing and Capital Preservation Strategy: Maintaining a strong balance sheet with sufficient flexibility to fund our operating and investment activities. Funding sources include the public equity and debt market, our existing revolving credit facility, new secured debt, internally generated funds, proceeds from selling land and properties that no longer fit our strategy, and potential strategic joint ventures. We continuously monitor the capital markets and may consider raising additional capital when appropriate. |
Operating Strategy. Our primary operating strategy is to maximize rental rates and occupancy levels by attracting and retaining a strong and diverse tenant base. Most of our properties are located in regional and neighborhood trade areas with attractive demographics, which allows us to maintain and, in many cases, increase occupancy and rental rates. We seek to implement our operating strategy by, among other things:
• | increasing rental rates upon the renewal of expiring leases or re-leasing space to new tenants while minimizing vacancy to the extent possible; |
• | maximizing the occupancy of our operating portfolio; |
• | minimizing tenant turnover; |
• | maintaining leasing and property management strategies that maximize rent growth and cost recovery; |
• | maintaining a diverse tenant mix that limits our exposure to the financial condition of any one tenant or any category of tenants; |
• | maintaining and improving the physical appearance, condition, and design of our properties and other improvements located on our properties to enhance our ability to attract customers; |
• | implementing defensive strategies against e-commerce competition; |
• | actively managing costs to minimize overhead and operating costs; |
• | maintaining strong tenant and retailer relationships in order to avoid rent interruptions and reduce marketing, leasing and tenant improvement costs that result from re-leasing space to new tenants; and |
• | taking advantage of under-utilized land or existing square footage, reconfiguring properties for more profitable use, and adding ancillary income sources to existing facilities. |
We successfully executed our operating strategy in 2017 in a number of ways, including Same Property NOI growth of 2.9%, or 3.2% excluding the impact of the 3-R initiative, a blended new and renewal cash leasing spread of 9.0%, and an increase in our small shop leased percentage to 90.5% as of year end, an increase of 160 basis points over the prior year. We have placed significant emphasis on maintaining a diverse retail tenant mix which has resulted in no tenant accounting for more than 2.5% of our annualized base rent. See Item 2, “Properties” for a list of our top tenants by gross leasable area ("GLA") and annualized base rent.
Growth Strategy. Our growth strategy includes the selective deployment of resources to projects that are expected to generate investment returns that meet or exceed our internal benchmarks. We implement our growth strategy in a number of ways, including:
• | continually evaluating our operating properties for redevelopment and renovation opportunities that we believe will make them more attractive for leasing to new tenants, right sizing anchor space while increasing rental rates, or re-leasing to existing tenants at increased rental rates; |
• | disposing of selected assets that no longer meet our long-term investment criteria and recycling the net proceeds into assets that provide attractive returns and rent growth potential in targeted markets or using the proceeds to repay debt, thereby reducing our leverage; and |
• | selectively pursuing the acquisition of retail operating properties, portfolios and companies in markets with strong demographics. |
In evaluating opportunities for potential acquisition, development, redevelopment and disposition, we consider a number of factors, including:
• | the expected returns and related risks associated with the investments relative to our combined cost of capital to make such investments; |
6
• | the current and projected cash flow and market value of the property and the potential to increase cash flow and market value if the property were to be successfully re-leased or redeveloped; |
• | the price being offered for the property, the current and projected operating performance of the property, the tax consequences of the transaction, and other related factors; |
• | opportunities for improving the tenant mix at our properties through the placement of anchor tenants such as value retailers, grocers, soft goods stores, theaters, or sporting goods retailers, as well as an further enhancing a diverse tenant mix that includes restaurants, specialty shops, service retailers such as banks, dry cleaners and hair salons, and shoe and clothing retailers, some of which provide staple goods to the community and offer a high level of convenience; |
• | the configuration of the property, including ease of access, availability of parking, visibility, and the demographics of the surrounding area; and |
• | the level of success of existing properties in the same or nearby markets. |
In 2017, we delivered nine development and 3-R projects to the operating portfolio, and we expect to deliver several more in 2018. Our 3-R initiative currently includes seven projects under construction with total estimated costs of $71 million to $77 million. In addition, we are currently evaluating additional opportunities at four of our operating properties, with total estimated costs expected to be in the range of $40 million to $56 million.
Financing and Capital Preservation Strategy. We finance our acquisition, development, and redevelopment activities seeking to use the most advantageous sources of capital available to us at the time. These sources may include the reinvestment of cash flows generated by operations, the sale of common or preferred shares through public offerings or private placements, the reinvestment of proceeds from the disposition of assets, the incurrence of additional indebtedness through secured or unsecured borrowings, and entering into real estate joint ventures.
Our primary financing and capital preservation strategy is to maintain a strong balance sheet and enhance our flexibility to fund operating and investment activities in the most cost-effective way. We consider a number of factors when evaluating the amount and type of additional indebtedness we may elect to incur. Among these factors are the construction costs or purchase prices of properties to be developed or acquired, the estimated market value of our properties and the Company as a whole upon consummation of the financing, and the ability to generate cash flow to cover expected debt service.
Strengthening our balance sheet continues to be one of our top priorities. We maintain an investment grade credit rating and completed an inaugural public offering of senior unsecured notes in 2016. We expect our investment grade credit rating will continue to enable us to opportunistically access the public unsecured bond market and will allow us to lower our cost of capital and provide greater flexibility in managing the acquisition and disposition of assets in our operating portfolio.
We intend to continue implementing our financing and capital strategies in a number of ways, which may include one or more of the following actions:
• | prudently managing our balance sheet, including maintaining sufficient capacity under our unsecured revolving credit facility so that we have additional capacity available to fund our development and redevelopment projects and pay down maturing debt if refinancing that debt is not practical; |
• | extending the maturity dates of and/or refinancing our near-term mortgage, construction and other indebtedness; |
• | expanding our unencumbered asset pool; |
• | raising additional capital through the issuance of common shares, preferred shares or other securities; |
• | managing our exposure to interest rate increases on our variable-rate debt through the selective use of fixed rate hedging transactions; |
• | issuing unsecured bonds in the public markets, and securing property-specific long-term non-recourse financing; and |
• | entering into joint venture arrangements in order to access less expensive capital and to mitigate risk. |
Competition
7
The United States commercial real estate market continues to be highly competitive. We face competition from other REITs and other owner-operators engaged in the ownership, leasing, acquisition, and development of shopping centers as well as from numerous local, regional and national real estate developers and owners in each of our markets. Some of these competitors may have greater capital resources than we do, although we do not believe that any single competitor or group of competitors in any of the primary markets where our properties are located are dominant in that market.
We face significant competition in our efforts to lease available space to prospective tenants at our operating, development and redevelopment properties. The nature of the competition for tenants varies based on the characteristics of each local market in which we own properties. We believe that the principal competitive factors in attracting tenants in our market areas are location, demographics, rental rates, the presence of anchor stores, competitor shopping centers in the same geographic area and the maintenance, appearance, access and traffic patterns of our properties. There can be no assurance in the future that we will be able to compete successfully with our competitors in our development, acquisition and leasing activities.
Government Regulation
We and our properties are subject to a variety of federal, state, and local environmental, health, safety and similar laws, including:
Americans with Disabilities Act. Our properties must comply with Title III of the Americans with Disabilities Act (the "ADA"), to the extent that such properties are public accommodations as defined by the ADA. The ADA may require removal of structural barriers to access by persons with disabilities in certain public areas of our properties where such removal is readily achievable. We believe our properties are in substantial compliance with the ADA and that we will not be required to make substantial capital expenditures to address the requirements of the ADA. However, noncompliance with the ADA could result in the imposition of fines or an award of damages to private litigants. The obligation to make readily accessible accommodations is an ongoing one, and we will continue to assess our properties and make alterations as appropriate in this respect.
Affordable Care Act. Effective January 2015, we may be subject to excise taxes under the employer mandate provisions of the Affordable Care Act ("ACA") if we (i) do not offer health care coverage to substantially all of our full-time employees and their dependents or (ii) do not offer health care coverage that meets the ACA's affordability and minimum value standards. The excise tax is based on the number of full-time employees. We do not anticipate being subject to a penalty under the ACA; however, even in the event that we are, any such penalty would be less than $0.3 million, as we had 147 full-time employees as of December 31, 2017.
Environmental Regulations. Some properties in our portfolio contain, may have contained or are adjacent to or near other properties that have contained or currently contain underground storage tanks for petroleum products or other hazardous or toxic substances. These storage tanks may have released, or have the potential to release, such substances into the environment.
In addition, some of our properties have tenants which may use hazardous or toxic substances in the routine course of their businesses. In general, these tenants have covenanted in their leases with us to use these substances, if any, in compliance with all environmental laws and have agreed to indemnify us for any damages we may suffer as a result of their use of such substances. However, these lease provisions may not fully protect us in the event that a tenant becomes insolvent. Finally, one of our properties has contained asbestos-containing building materials, or ACBM, and another property may have contained such materials based on the date of its construction. Environmental laws require that ACBM be properly managed and maintained, and fines and penalties may be imposed on building owners or operators for failure to comply with these requirements. The laws also may allow third parties to seek recovery from owners or operators for personal injury associated with exposure to asbestos fibers.
Neither existing environmental, health, safety and similar laws nor the costs of our compliance with these laws has had a material adverse effect on our financial condition or results operations, and management does not believe they will in the future. In addition, we have not incurred, and do not expect to incur, any material costs or liabilities due to environmental contamination at properties we currently own or have owned in the past. However, we cannot predict the impact of new or changed laws or regulations on properties we currently own or may acquire in the future.
With environmental sustainability becoming a national priority, we have continued to demonstrate our strong commitment to be a responsible corporate citizen through resource reduction and employee training that have resulted in reductions of energy consumption, waste and improved maintenance cycles.
Insurance
8
We carry comprehensive liability, fire, extended coverage, and rental loss insurance that covers all properties in our portfolio. We believe the policy specifications and insured limits are appropriate and adequate given the relative risk of loss, the cost of the coverage, and industry practice. Certain risks such as loss from riots, war or acts of God, and, in some cases, flooding are not insurable; and therefore, we do not carry insurance for these losses. Some of our policies, such as those covering losses due to terrorism and floods, are insured subject to limitations involving large deductibles or co-payments and policy limits that may not be sufficient to cover losses.
Offices
Our principal executive office is located at 30 S. Meridian Street, Suite 1100, Indianapolis, IN 46204. Our telephone number is (317) 577-5600.
Employees
As of December 31, 2017, we had 147 full-time employees. The majority of these employees were based at our Indianapolis, Indiana headquarters.
Segment Reporting
Our primary business is the ownership and operation of neighborhood and community shopping centers. We do not distinguish or group our operations on a geographical basis, or any other basis, when measuring performance. Accordingly, we have one operating segment, which also serves as our reportable segment for disclosure purposes in accordance with accounting principles generally accepted in the United States ("GAAP").
Available Information
Our Internet website address is www.kiterealty.com. You can obtain on our website, free of charge, a copy of our Annual Report on Form 10-K, our quarterly reports on Form 10-Q, our current reports on Form 8-K, and any amendments to those reports, as soon as reasonably practicable after we electronically file such reports or amendments with, or furnish them to, the SEC. Our Internet website and the information contained therein or connected thereto are not intended to be incorporated into this Annual Report on Form 10-K.
Also available on our website, free of charge, are copies of our Code of Business Conduct and Ethics, our Code of Ethics for Principal Executive Officer and Senior Financial Officers, our Corporate Governance Guidelines, and the charters for each of the committees of our Board of Trustees—the Audit Committee, the Corporate Governance and Nominating Committee, and the Compensation Committee. Copies of our Code of Business Conduct and Ethics, our Code of Ethics for Principal Executive Officer and Senior Financial Officers, our Corporate Governance Guidelines, and our committee charters are also available from us in print and free of charge to any shareholder upon request. Any person wishing to obtain such copies in print should contact our Investor Relations department by mail at our principal executive office.
ITEM 1A. RISK FACTORS
The following factors, among others, could cause actual results to differ materially from those contained in forward-looking statements made in this Annual Report on Form 10-K and presented elsewhere by our management from time to time. These factors, among others, may have a material adverse effect on our business, financial condition, operating results and cash flows, and you should carefully consider them. It is not possible to predict or identify all such factors. You should not consider this list to be a complete statement of all potential risks or uncertainties. Past performance should not be considered an indication of future performance.
We have separated the risks into three categories:
• | risks related to our operations; |
• | risks related to our organization and structure; and |
• | risks related to tax matters. |
RISKS RELATED TO OUR OPERATIONS
9
Ongoing challenging conditions in the United States and global economies and the challenges facing our retail tenants and non-owned anchor tenants may have a material adverse effect on our financial condition and results of operations.
Certain sectors of the United States economy are experiencing sustained weakness. Over the past several years, this structural weakness has resulted in the bankruptcy or weakened financial condition of a number of retailers, decreased consumer spending, increased home foreclosures, low consumer confidence, and reduced demand and rental rates for certain retail space. General economic factors that are beyond our control, including, but not limited to, economic recessions, decreases in consumer confidence and spending, decreases in business confidence and business spending, reductions in consumer credit availability, increasing consumer debt levels, rising energy costs, higher tax rates or other changes in taxation, rising interest rates, business layoffs, downsizing and industry slowdowns, unemployment and/or rising or falling inflation, could have a negative impact on the business of our retail tenants. In turn, this could have a material adverse effect on our business because current or prospective tenants may, among other things, (i) have difficulty paying their rent obligations as they struggle to sell goods and services to consumers, (ii) be unwilling to enter into or renew leases with us on favorable terms or at all, (iii) seek to terminate their existing leases with us or request rent concessions on such leases, or (iv) be forced to curtail operations or declare bankruptcy. We are also susceptible to other developments and conditions that could have a material adverse effect on our business. These developments and conditions include relocations of businesses, changing demographics (including the number of households and average household income surrounding our properties), increasing consumer shopping via the internet (or e-commerce), other changes in retailers' and consumers' preferences and behaviors, infrastructure quality, federal, state, and local budgetary constraints and priorities, increases in real estate and other taxes, increased government regulation and the related compliance cost, decreasing valuations of real estate, and other factors.
Further, we continually monitor events and changes in circumstances that could indicate that the carrying value of our real estate assets may not be recoverable. Challenging market conditions could require us to recognize impairment charges with respect to one or more of our properties, or a loss on the disposition of one or more of our properties.
The expansion of e-commerce may impact our tenants and our business
E-commerce continues to gain in popularity and its growth is likely to continue in the future. E-commerce could result in a downturn in the businesses of some of our tenants and affect the way current and prospective tenants lease space or operate their businesses, including by reducing the size or number of their retail locations in the future. We cannot predict with certainty how the growth in e-commerce will impact the demand for space at our properties or the revenue generated at our properties in the future. Although we continue to respond to these trends, including by entering into or renewing leases with tenants whose businesses are perceived as relatively resistant to e-commerce (such as services, restaurant, grocery, specialty and other experiential retailers), the risks associated with e-commerce could have an adverse effect on our cash flow and operating results.
If our tenants are unable to secure financing necessary to continue to operate and grow their businesses and pay us rent, we could be materially and adversely affected.
Many of our tenants rely on external sources of financing to operate and grow their businesses. Disruptions in credit markets may adversely affect our tenants’ ability to obtain debt financing at favorable rates or at all. If our tenants are unable to secure financing necessary to continue to operate or expand their businesses, they may be unable to meet their rent obligations to us or enter into new leases with us or be forced to declare bankruptcy and reject our leases with them, which could materially and adversely affect us.
Our business is significantly influenced by demand for retail space generally, a decrease in which may have a greater adverse effect on our business than if we owned a more diversified real estate portfolio.
Because our portfolio of properties consists primarily of community and neighborhood shopping centers, a decrease in the demand for retail space, due to the economic factors discussed above or otherwise, may have a greater adverse effect on our business and financial condition than if we owned a more diversified real estate property portfolio. The market for retail space has been, and could be in the future, adversely affected by weakness in the national, regional and local economies, the adverse financial condition of some large retailing companies, the ongoing consolidation in the retail sector, the excess amount of retail space in a number of markets and increasing e-commerce and the perception such online retail has on the value of shopping center assets. To the extent that any of these conditions occur, they are likely to negatively affect market rents for retail space and could materially and adversely affect our financial condition, results of operations, cash flow, common share trading price, and ability to satisfy our debt service obligations and to pay distributions to our shareholders.
The closure of any stores by any non-owned anchor tenant or major tenant with leases in multiple locations, because of a deterioration of its financial condition or otherwise, could have a material adverse effect on our results of operations.
10
We derive the majority of our revenue from tenants who lease space from us at our properties. Therefore, our ability to generate cash from operations is dependent on the rents that we are able to charge and collect from our tenants. Our leases generally do not contain provisions designed to ensure the creditworthiness of our tenants. At any time, our tenants may experience a downturn in their business that may significantly weaken their financial condition, particularly during periods of economic or political uncertainty. Economic and political uncertainty, including uncertainty related to taxation, may affect our tenants, joint venture partners, lenders, financial institutions and general economic conditions, such as consumer confidence and spending, business confidence and spending and the volatility of the stock market. In the event of a prolonged or severe economic downturn, our tenants may delay lease commencements, decline to extend or renew leases upon expiration, fail to make rental payments when due, close a number of stores or declare bankruptcy. Any of these actions could result in the termination of the tenant’s leases and the loss of rental income attributable to the terminated leases. Lease terminations or failure of a major tenant or non-owned anchor to occupy the premises could result in lease terminations or reductions in rent by other tenants in the same shopping centers because of contractual co-tenancy termination or rent reduction rights under the terms of some leases. In that event, we may be unable to re-lease the vacated space at attractive rents or at all. In some cases, it may take significant time to re-lease a space, particularly space once occupied by a major tenant or non-owned anchor. Additionally, in the event our tenants are involved in mergers or acquisitions with or by third parties or undertake other restructurings, such tenants may choose to terminate their leases, vacate the leased premises or not renew their leases if they consolidate, downsize or relocate their operations as a result of the transaction. The occurrence of any of the situations described above, particularly if it involves a substantial tenant or a non-owned anchor with ground leases in multiple locations, could have a material adverse effect on our results of operations.
We face potential material adverse effects from tenant bankruptcies, and we may be unable to collect balances due from such tenants, replace the tenant at current rates, or at all.
Tenant bankruptcies may increase during periods of difficult economic conditions. We cannot make any assurances that a tenant that files for bankruptcy protection will continue to pay its rent obligations. A bankruptcy filing by one of our tenants or a lease guarantor would legally prohibit us from collecting pre-bankruptcy debts from that tenant or the lease guarantor, unless we receive an order from the bankruptcy court permitting us to do so. Such bankruptcies could delay or ultimately preclude collection of amounts owed to us. A tenant in bankruptcy may attempt to renegotiate the lease or request significant rent concessions. If a lease is assumed by the tenant in bankruptcy, all pre-bankruptcy balances due under the lease must be paid to us in full. However, if a lease is rejected by a tenant in bankruptcy, we would have only a general unsecured claim for damages, including pre-bankruptcy balances. Any unsecured claim we hold may be paid only to the extent that funds are available and only in the same percentage as is paid to all other holders of unsecured claims, and there are restrictions under bankruptcy laws that limit the amount of the claim we can make if a lease is rejected. As a result, it is likely that we would recover substantially less than the full value of any unsecured claims we hold from a tenant in bankruptcy, which would result in a reduction in our cash flow and in the amount of cash available for distribution to our shareholders.
Moreover, we are continually re-leasing vacant spaces resulting from tenant lease terminations. The bankruptcy of a tenant, particularly an anchor tenant, may make it more difficult to lease the remainder of the affected properties. Future tenant bankruptcies could materially adversely affect our properties or impact our ability to successfully execute our re-leasing strategy.
Our performance and value are subject to risks associated with real estate assets and the real estate industry.
Our ability to make expected distributions to our shareholders depends on our being able to generate substantial revenues from our properties. Periods of economic slowdown or recession, rising interest rates or declining demand for real estate, or the public perception that any of these events may occur, could result in a general decline in rents or an increased incidence of defaults under existing leases. Such events would materially and adversely affect our financial condition, results of operations, cash flow, per share trading price of our common shares, ability to satisfy debt service obligations, and ability to make distributions to shareholders.
In addition, other events and conditions generally applicable to owners and operators of real property that are beyond our control may decrease cash available for distribution and the value of our properties. These events include but are not limited to:
• | adverse changes in the national, regional and local economic climate, particularly in Florida, Indiana and Texas where 25%, 14% and 12%, respectively, of our total annualized base rent is located; |
• | tenant bankruptcies; |
• | local oversupply of rental space, increased competition or reduction in demand for rentable space; |
11
• | inability to collect rent from tenants or having to provide significant rent concessions to tenants; |
• | vacancies or our inability to rent space on favorable terms; |
• | downward trends in market rental rates; |
• | inability to finance property development, tenant improvements and acquisitions on favorable terms; |
• | increased operating costs, including costs incurred for maintenance, insurance premiums, utilities and real estate taxes and a decrease in our ability to recover such increased costs from our tenants; |
• | the need to periodically fund the costs to repair, renovate and re-lease spaces in our operating properties; |
• | decreased attractiveness of our properties to tenants; |
• | weather conditions that may increase energy costs and other weather-related expenses, such as snow removal costs; |
• | changes in laws and governmental regulations and costs of complying with such changed laws and governmental regulations, including those involving health, safety, usage, zoning, the environment and taxes; |
• | civil unrest, acts of terrorism, earthquakes, hurricanes and other national disasters or acts of God that may result in underinsured or uninsured losses; |
• | the relative illiquidity of real estate investments; |
• | changing demographics (including the number of households and average household income surrounding our properties); and |
• | changing customer traffic patterns. |
We face significant competition, which may impede our ability to renew leases or re-lease space as leases expire or require us to undertake unexpected capital improvements.
We compete with numerous developers, owners and operators of retail shopping centers, regional malls, and outlet malls for tenants. These competitors include institutional investors, other REITs and other owner-operators of community and neighborhood shopping centers, some of which own or may in the future own properties similar to ours in the same markets as ours but which have greater capital resources. As of December 31, 2017, leases representing 7.1% of our total annualized base rent were scheduled to expire in 2018. If our competitors offer space at rental rates below current market rates, or below the rental rates we currently charge our tenants, we may be unable to lease on satisfactory terms and we may be pressured to reduce our rental rates below those we currently charge in order to retain tenants when our leases with them expire. We also may be required to offer more substantial rent abatements, tenant improvements and early termination rights or accommodate requests for renovations, build-to-suit remodeling and other improvements than we have historically. As a result, our financial condition, results of operations, cash flow, trading price of our common shares and ability to satisfy our debt service obligations and to pay distributions to our shareholders may be materially adversely affected. In addition, increased competition for tenants may require us to make capital improvements to properties that we would not have otherwise planned to make, which would reduce cash available for distributions to shareholders. If retailers or consumers perceive that shopping at other venues, online or by phone is more convenient, cost-effective or otherwise more attractive, our revenues and profitability also may suffer.
Because of our geographic concentration in Florida, Indiana and Texas, a prolonged economic downturn in these states could materially and adversely affect our financial condition and results of operations.
The specific markets in which we operate may face challenging economic conditions that could persist into the future. In particular, as of December 31, 2017, rents from our owned square footage in the states of Florida, Indiana and Texas comprised 25%, 14%, and 12% of our annualized base rent, respectively. This level of concentration could expose us to greater economic risks than if we owned properties in numerous geographic regions. Adverse economic or real estate trends in Florida, Indiana, Texas, or the surrounding regions, or any decrease in demand for retail space resulting from the local regulatory environment, business climate or fiscal problems in these states, could materially and adversely affect our financial condition, results of operations, cash flow, the trading price of our common shares and our ability to satisfy our debt service obligations and to pay distributions to our shareholders.
12
Disruptions in the financial markets could affect our ability to obtain financing on reasonable terms, or at all, and have other material adverse effects on our business.
Disruptions in the financial markets generally, or relating to the real estate industry specifically, may adversely affect our ability to obtain debt financing on favorable terms or at all. These disruptions could impact the overall amount of equity and debt financing available, lower loan to value ratios, cause a tightening of lender underwriting standards and terms and cause higher interest rate spreads. As a result, we may be unable to refinance or extend our existing indebtedness or the terms of any refinancing may not be as favorable as the terms of our existing indebtedness. We have approximately $82.4 million of debt maturities through December 31, 2020, with other significant debt obligations maturing after 2020. If we are not successful in refinancing our outstanding debt when it becomes due, we may have to dispose of properties on disadvantageous terms, which might adversely affect our ability to service other debt and to meet our other obligations. We currently have sufficient capacity under our unsecured revolving credit facility and operating cash flows to retire outstanding debt maturing through 2020 in the event we are not able to refinance such debt when it becomes due, but we cannot provide any assurance that we will be able to maintain capacity to retire any or all of our outstanding debt beyond 2020.
If economic conditions deteriorate in any of our markets, we may have to seek less attractive, alternative sources of financing and adjust our business plan accordingly. These factors may make it more difficult for us to sell properties or may adversely affect the price we receive for properties that we do sell, as prospective buyers may experience increased costs of financing or difficulties in obtaining financing. These events also may make it difficult or costly to raise capital through the issuance of our common shares or preferred shares. The disruptions in the financial markets have had, and may continue to have, a material adverse effect on the market value of our common shares and other aspects of our business, as well as the economy in general. Furthermore, there can be no assurances that government responses to disruptions in the financial markets will restore consumer confidence, stabilize the markets or increase liquidity and the availability of equity or debt financing.
Our real estate assets may be subject to impairment charges, which may negatively affect our net income.
Our long-lived assets, primarily real estate held for investment, are carried at cost unless circumstances indicate that the carrying value of the assets may not be recoverable through future operations. On at least a quarterly basis, we evaluate whether there are any indicators, including poor operating performance or deteriorating general market conditions, that the value of our real estate properties (including any related amortizable intangible assets or liabilities) may not be recoverable. As part of this evaluation, we compare the current carrying value of the asset to the estimated undiscounted cash flows that are directly associated with the use and ultimate disposition of the asset. Our estimated cash flows are based on several key assumptions, including current and projected rental rates, costs of tenant improvements, leasing commissions, anticipated hold periods, and assumptions regarding the residual value upon disposition, including the exit capitalization rate. These key assumptions are subjective in nature and could differ materially from actual results. Changes in our disposition strategy or changes in the marketplace may alter the hold period of an asset or asset group, which may result in an impairment loss, and such loss could be material to our financial condition or operating performance. To the extent that the carrying value of the asset exceeds the estimated undiscounted cash flows, an impairment loss is recognized equal to the excess of carrying value over estimated fair value. If such negative indicators, as described above, are not identified, management will not assess the recoverability of a property's carrying value.
The estimation of the fair value of real estate assets is highly subjective and is typically determined through comparable sales information and other market data if available or through use of an income approach such as the direct capitalization method or the traditional discounted cash flow approach. Such cash flow projections consider factors, including expected future operating income, trends and prospects, as well as the effects of demand, competition and other factors, and therefore are subject to a significant degree of management judgment. Changes in those factors could impact the determination of fair value. In estimating the fair value of undeveloped land, we generally use market data and comparable sales information.
These subjective assessments have a direct impact on our net income because recording an impairment charge results in an immediate negative adjustment to net income. There can be no assurance that we will not take additional charges in the future related to the impairment of our assets. Any future impairment could have a material adverse effect on our results of operations in the period in which the charge is taken.
We had $1.7 billion of consolidated indebtedness outstanding as of December 31, 2017, which may have a material adverse effect on our financial condition and results of operations and reduce our ability to incur additional indebtedness to fund our growth.
Required repayments of debt and related interest, along with any applicable prepayment premium, may materially adversely affect our operating performance. We had $1.7 billion of consolidated outstanding indebtedness as of December 31, 2017. At December 31, 2017, $573.7 million of our debt bore interest at variable rates ($138.2 million when reduced by our $435.5 million
13
of fixed interest rate swaps). Interest rates are currently low relative to historical levels and may increase significantly in the future. If our interest expense increased significantly, it could materially adversely affect our results of operations. For example, if market rates of interest on our variable rate debt outstanding, net of cash flow hedges, as of December 31, 2017 increased by 1%, the increase in interest expense on our unhedged variable rate debt would decrease future cash flows by approximately $1.4 million annually.
We may incur additional debt in connection with various development and redevelopment projects and may incur additional debt upon the future acquisition of operating properties. Our organizational documents do not limit the amount of indebtedness that we may incur. We may borrow new funds to develop or acquire properties. In addition, we may increase our mortgage debt by obtaining loans secured by some or all of the real estate properties we develop or acquire. We also may borrow funds if necessary to satisfy the requirement that we distribute to shareholders at least 90% of our annual “REIT taxable income” (determined before the deduction of dividends paid and excluding net capital gains) or otherwise as is necessary or advisable to ensure that we maintain our qualification as a REIT for federal income tax purposes or otherwise avoid paying taxes that can be eliminated through distributions to our shareholders.
Our substantial debt could materially and adversely affect our business in other ways, including by, among other things:
• | requiring us to use a substantial portion of our funds from operations to pay principal and interest, which reduces the amount available for distributions; |
• | placing us at a competitive disadvantage compared to our competitors that have less debt; |
• | making us more vulnerable to economic and industry downturns and reducing our flexibility in responding to changing business and economic conditions; and |
• | limiting our ability to borrow more money for operating or capital needs or to finance development and acquisitions in the future. |
Agreements with lenders supporting our unsecured revolving credit facility and various other loan agreements contain default provisions which, among other things, could result in the acceleration of principal and interest payments or the termination of the facilities.
Our unsecured revolving credit facility and various other debt agreements contain certain Events of Default which include, but are not limited to, failure to make principal or interest payments when due, failure to perform or observe any term, covenant or condition contained in the agreements, failure to maintain certain financial and operating ratios and other criteria, misrepresentations, acceleration of other material indebtedness and bankruptcy proceedings. In the event of a default under any of these agreements, the lender would have various rights including, but not limited to, the ability to require the acceleration of the payment of all principal and interest due and/or to terminate the agreements and, to the extent such debt is secured, to foreclose on the properties. The declaration of a default and/or the acceleration of the amount due under any such credit agreement could have a material adverse effect on our business, limit our ability to make distributions to our shareholders, and prevent us from obtaining additional funds needed to address cash shortfalls or pursue growth opportunities.
Certain of our loan agreements contain cross-default provisions which provide that a violation by the Company of any financial covenant set forth in our unsecured revolving credit facility agreement will constitute an event of default under such loans. The agreements relating to our unsecured revolving credit facility, unsecured term loan and seven-year unsecured term loan contain provisions providing that any “Event of Default” under one of these facilities or loans will constitute an “Event of Default” under the other facility or loan. In addition, these agreements relating to our unsecured revolving credit facility, unsecured term loan and seven-year unsecured term loan, as well as the agreement relating to our senior unsecured notes, include a provision providing that any payment default under an agreement relating to any material indebtedness will constitute an “Event of Default” thereunder. These provisions could allow the lending institutions to accelerate the amount due under the loans. If payment is accelerated, our assets may not be sufficient to repay such debt in full, and, as a result, such an event may have a material adverse effect on our cash flow, financial condition and results of operations. We were in compliance with all applicable covenants under the agreements relating to our unsecured revolving credit facility, unsecured term loan and seven-year unsecured term loan and senior unsecured notes as of December 31, 2017, although there can be no assurance that we will continue to remain in compliance in the future.
Mortgage debt obligations expose us to the possibility of foreclosure, which could result in the loss of our investment in a property or group of properties subject to mortgage debt.
14
A significant amount of our indebtedness is secured by our real estate assets. If a property or group of properties is mortgaged to secure payment of debt and we are unable to make the required periodic mortgage payments, the lender or the holder of the mortgage could foreclose on the property, resulting in the loss of our investment. For tax purposes, a foreclosure of any of our properties would be treated as a sale of the property for a purchase price equal to the outstanding balance of the debt secured by the mortgage. If the outstanding balance of the debt secured by the mortgage exceeds our tax basis in the property, we would recognize taxable income on foreclosure, but we would not receive any cash proceeds, which could hinder our ability to meet the REIT distribution requirements imposed by the Internal Revenue Code of 1986, as amended (the "Code"). If any of our properties are foreclosed on due to a default, our ability to pay cash distributions to our shareholders and our earnings will be limited. In addition, as a result of cross-collateralization or cross-default provisions contained in certain of our mortgage loans, a default under one mortgage loan could result in a default on other indebtedness and cause us to lose other better performing properties, which could materially and adversely affect our financial condition and results of operations.
We are subject to risks associated with hedging agreements.
We use a combination of interest rate protection agreements, including interest rate swaps, to manage risk associated with interest rate volatility. This may expose us to additional risks, including a risk that the counterparty to a hedging arrangement may fail to honor its obligations. Developing an effective interest rate risk strategy is complex and no strategy can completely insulate us from risks associated with interest rate fluctuations. There can be no assurance that our hedging activities will have the desired beneficial effect on our results of operations or financial condition. Further, should we choose to terminate a hedging agreement, there could be significant costs and cash requirements involved to fulfill our initial obligation under such agreement.
Our financial covenants may restrict our operating and acquisition activities.
Our unsecured revolving credit facility contains certain financial and operating covenants, including, among other things, certain coverage ratios, as well as limitations on our ability to incur debt, make dividend payments, sell all or substantially all of our assets and engage in mergers and consolidations and certain acquisitions. These covenants may restrict our ability to pursue certain business initiatives or certain acquisition transactions. In addition, certain of our mortgages contain customary covenants which, among other things, limit our ability, without the prior consent of the lender, to further mortgage the property, to enter into new leases or materially modify existing leases, and to discontinue insurance coverage. Failure to meet any of the financial covenants could cause an event of default under and/or accelerate some or all of our indebtedness, which could have a material adverse effect on us.
Our current and any future joint venture investments could be adversely affected by our lack of sole decision-making authority, our reliance on joint venture partners’ financial condition, any disputes that may arise between us and our joint venture partners and our exposure to potential losses from the actions of our joint venture partners.
As of December 31, 2017, we owned nine of our operating properties through consolidated joint ventures and interests in two properties through unconsolidated joint ventures. As of December 31, 2017, the nine properties represented 13.4% of the annualized base rent of the portfolio. In addition, we currently own land held for development through one consolidated joint venture. Our joint ventures may involve risks not present with respect to our wholly owned properties, including the following:
• | we may share decision-making authority with our joint venture partners regarding certain major decisions affecting the ownership or operation of the joint venture and the joint venture property, such as the sale of the property or the making of additional capital contributions for the benefit of the property, which may prevent us from taking actions that are opposed by our joint venture partners; |
• | prior consent of our joint venture partners may be required for a sale or transfer to a third party of our interests in the joint venture, which restricts our ability to dispose of our interest in the joint venture; |
• | our joint venture partners might become bankrupt or fail to fund their share of required capital contributions, which may delay construction or development of a property or increase our financial commitment to the joint venture; |
• | our joint venture partners may have business interests or goals with respect to the property that conflict with our business interests and goals, which could increase the likelihood of disputes regarding the ownership, management or disposition of the property; |
• | disputes may develop with our joint venture partners over decisions affecting the property or the joint venture, which may result in litigation or arbitration that would increase our expenses and distract our officers and/or trustees from focusing their time and effort on our business and possibly disrupt the day-to-day operations of |
15
the property, such as by delaying the implementation of important decisions until the conflict or dispute is resolved; and
• | we may suffer losses as a result of the actions of our joint venture partners with respect to our joint venture investments, and the activities of a joint venture could adversely affect our ability to qualify as a REIT, even though we may not control the joint venture. |
In the future, we may seek to co-invest with third parties through joint ventures that may involve similar or additional risks.
Our future developments, redevelopments and acquisitions may not yield the returns we expect or may result in dilution in shareholder value.
As of December 31, 2017, we have two development projects and 11 3-R projects under construction or in the development planning stage including de-leasing space, evaluating development plans and costs with potential tenants and in some cases modified uses such as apartments. New development and redevelopment projects and property acquisitions are subject to a number of risks, including, but not limited to:
• | abandonment of development and redevelopment activities after expending resources to determine feasibility; |
• | construction delays or cost overruns that may increase project costs; |
• | the failure of our pre-acquisition investigation of a property or building , and any related representations we may receive from the seller, to reveal various liabilities or defects or identify necessary repairs until after the property is acquired, which could reduce the cash flow from the property or increase our acquisition costs; |
• | as a result of competition for attractive development and acquisition opportunities, we may be unable to acquire assets as we desire or the purchase price may be significantly elevated, which may impede our growth; |
• | the failure to meet anticipated occupancy or rent levels within the projected time frame, if at all; |
• | inability to operate successfully in new markets where new properties are located; |
• | inability to successfully integrate new properties into existing operations; |
• | exposure to fluctuations in the general economy due to the significant time lag between commencement and completion of development and redevelopment projects; |
• | failure to receive required zoning, occupancy, land use and other governmental permits and authorizations and changes in applicable zoning and land use laws; and |
• | difficulty or inability to obtain any required consents of third parties, such as tenants, mortgage lenders and joint venture partners. |
In addition, if a project is delayed or if we are unable to lease designated space to anchor tenants, certain tenants may have the right to terminate their leases. If any of these situations occur, development costs for a project may increase, which may result in reduced returns, or even losses, from such investments. In deciding whether to acquire, develop, or redevelop a particular property, we make certain assumptions regarding the expected future performance of that property. If these properties do not perform as expected, our financial performance may be materially and adversely affected, or an impairment charge could occur. In addition, the issuance of equity securities as consideration for any significant acquisitions could be dilutive to our shareholders.
We may not be successful in acquiring desirable operating properties, for which we face significant competition, or identifying development and redevelopment projects that meet our investment criteria, both of which may impede our growth.
Part of our business strategy is expansion through property acquisitions and development and redevelopment projects, which requires us to identify suitable opportunities that meet our criteria and are compatible with our growth and profitability strategies. We continue to evaluate the market and may acquire properties when we believe strategic opportunities exist. However, we may be unable to acquire a desired property because of competition from other real estate investors with substantial capital, including other REITs and institutional investment funds. Even if we are able to acquire a desired property, competition from other potential acquirers may significantly increase the purchase price, reducing the return to our shareholders. Additionally, we may not be successful in identifying suitable real estate properties or other assets that meet our development or redevelopment criteria,
16
or we may fail to complete developments, redevelopments, acquisitions or investments on satisfactory terms. Failure to identify or complete developments, redevelopments or acquisitions could slow our growth, which could in turn materially adversely affect our operations.
Development and redevelopment activities may be delayed or may not perform as expected and, in the case of an unsuccessful project, our entire investment could be at risk for loss.
We currently have two development projects and seven 3-R projects under construction. We have also identified four additional 3-R opportunities at our operating properties and expect to commence redevelopment in the future. In connection with any development or redevelopment of our properties, we will bear certain risks, including the risk of construction delays or cost overruns that may increase project costs and make a project uneconomical, the risk that occupancy or rental rates at a completed project will not be sufficient to enable us to pay operating expenses or earn the targeted rate of return on investment, and the risk of incurrence of predevelopment costs in connection with projects that are not pursued to completion. In addition, various tenants may have the right to withdraw from a property if a development or redevelopment project is not completed on schedule and required third-party consents may be withheld. In the case of an unsuccessful redevelopment project, our entire investment could be at risk for loss, or an impairment charge could occur.
We may not be able to sell properties when appropriate or on terms favorable to us and could, under certain circumstances, be required to pay a 100% "prohibited transaction" penalty tax related to the properties we sell.
Real estate property investments generally cannot be sold quickly. Our ability to dispose of properties on advantageous terms depends on factors beyond our control, including competition from other sellers and the availability of attractive financing for potential buyers of our properties, and we cannot predict the various market conditions affecting real estate investments that will exist at any particular time in the future. Before a property can be sold, we may need to make expenditures to correct defects or to make improvements. We may not have funds available to correct such defects or to make such improvements, and if we cannot do so, we might not be able to sell the property or might be required to sell the property on unfavorable terms. Furthermore, in acquiring a property, we might agree to provisions that materially restrict us from selling that property for a period of time or impose other restrictions, such as limitations on the amount of debt that can be placed or repaid on that property. These factors and any others that would impede our ability to respond to adverse changes in the performance of our properties could adversely affect our financial condition and results of operations.
Also, the tax laws applicable to REITs impose a 100% penalty tax on any net income from “prohibited transactions.” In general, prohibited transactions are sales or other dispositions of property held primarily for sale to customers in the ordinary course of business. The determination as to whether a particular sale is a prohibited transaction depends on the facts and circumstances related to that sale. The need to avoid prohibited transactions could cause us to forego or defer sales of properties that might otherwise be in our best interest to sell. Therefore, we may be unable to adjust our portfolio mix promptly in response to market conditions, which may adversely affect our financial position. In addition, we will be subject to income taxes on gains from the sale of any properties owned by any taxable REIT subsidiary.
Uninsured losses or losses in excess of insurance coverage could materially and adversely affect our cash flow, financial condition and results of operations.
We do not carry insurance for generally uninsurable losses such as loss from riots, war or acts of God, and, in some cases, flooding. Some of our policies, such as those covering losses due to terrorism and floods, are insured subject to limitations involving large deductibles or co-payments and policy limits that may not be sufficient to cover all losses. In addition, tenants generally are required to indemnify and hold us harmless from liabilities resulting from injury to persons or damage to personal or real property, on the premises, due to activities conducted by tenants or their agents on the properties (including without limitation any environmental contamination) and, at the tenant’s expense, to obtain and keep in full force during the term of the lease, liability and property damage insurance policies. However, tenants may not properly maintain their insurance policies or have the ability to pay the deductibles associated with such policies. If we experience a loss that is uninsured or that exceeds policy limits, we could lose the capital invested in the damaged properties as well as the anticipated future cash flows from those properties. Inflation, changes in building codes and ordinances, environmental considerations, and other factors also might make it impractical or undesirable to use insurance proceeds to replace a property after it has been damaged or destroyed. In addition, if the damaged properties are subject to recourse indebtedness, we would continue to be liable for the indebtedness, even if these properties were irreparably damaged.
Insurance coverage on our properties may be expensive or difficult to obtain, exposing us to potential risk of loss.
17
In the future, we may be unable to renew or duplicate our current insurance coverage at adequate levels or at reasonable prices. In addition, insurance companies may no longer offer coverage against certain types of losses, such as losses due to terrorist acts, environmental liabilities, or other catastrophic events including hurricanes and floods, or, if offered, the expense of obtaining these types of insurance may not be justified. We therefore may cease to have insurance coverage against certain types of losses and/or there may be decreases in the limits of insurance available. If an uninsured loss or a loss in excess of our insured limits occurs, we could lose all or a portion of the capital we have invested in a property, as well as the anticipated future revenue from the property after a covered period of time, but still remain obligated for any mortgage debt or other financial obligations related to the property. We cannot guarantee that material losses in excess of insurance proceeds will not occur in the future. If any of our properties were to experience a catastrophic loss, it could seriously disrupt our operations, delay revenue and result in large expenses to repair or rebuild the property. Events such as these could adversely affect our results of operations and our ability to meet our obligations.
Rising operating expenses could reduce our cash flow and funds available for future distributions, particularly if such expenses are not offset by an increase in corresponding revenues.
Our existing properties and any properties we develop or acquire in the future are and will continue to be subject to operating risks common to real estate in general, any or all of which may negatively affect us. The expenses of owning and operating properties generally do not decrease, and may increase, when circumstances such as market factors and competition cause a reduction in income from the properties. Our properties continue to be subject to increases in real estate and other tax rates, utility costs, operating expenses, insurance costs, repairs and maintenance and administrative expenses, regardless of such properties’ occupancy rates. As a result, if any property is not fully occupied or if rents are being paid in an amount that is insufficient to cover operating expenses, we could be required to expend funds for that property’s operating expenses. Therefore, rising operating expenses could reduce our cash flow and funds available for future distributions, particularly if such expenses are not offset by corresponding revenues.
Our business faces potential risks associated with natural disasters, severe weather conditions and climate change, which could have an adverse effect on our cash flow and operating results.
Changing weather patterns and climatic conditions may affect the predictability and frequency of natural disasters in some parts of the world and create additional uncertainty as to future trends and exposures. Our properties are located in many areas that are subject to or have been affected by natural disasters and severe weather conditions such as hurricanes, tropical storms, tornadoes, earthquakes, droughts, floods and fires. Over time, the occurrence of natural disasters, severe weather conditions and changing climatic conditions can delay new development and redevelopment projects, increase repair costs and future insurance costs and negatively impact the demand for lease space in the affected areas, or in extreme cases, affect our ability to operate the properties at all. These risks could have an adverse effect on our cash flow and operating results.
We could incur significant costs related to environmental matters.
Under various federal, state and local laws, ordinances and regulations, an owner or operator of real estate may be required to investigate and clean up hazardous or toxic substances or petroleum product releases at a property and may be held liable to a governmental entity or to third parties for property damage and for investigation and clean-up costs incurred by such parties in connection with contamination. The cost of investigation, remediation or removal of such substances may be substantial, and the presence of such substances, or the failure to properly remediate such substances, may adversely affect the owner’s ability to sell or rent such property or to borrow using such property as collateral. In connection with the ownership, operation and management of real properties, we are potentially liable for removal or remediation costs, as well as certain other related costs, including governmental fines and injuries to persons and property. We may also be liable to third parties for damage and injuries resulting from environmental contamination emanating from the real estate. Environmental laws also may create liens on contaminated sites in favor of the government for damages and costs it incurs to address such contamination. Moreover, if contamination is discovered on our properties, environmental laws may impose restrictions on the manner in which that property may be used or how businesses may be operated on that property.
Some of the properties in our portfolio contain, may have contained or are adjacent to or near other properties that have contained or currently contain underground storage tanks for petroleum products or other hazardous or toxic substances. These tanks may have released, or have the potential to release, such substances into the environment. In addition, some of our properties have tenants that may use hazardous or toxic substances in the routine course of their businesses. In general, these tenants have covenanted in their leases with us to use these substances, if any, in compliance with all environmental laws and have agreed to indemnify us for any damages that we may suffer as a result of their use of such substances. However, these lease provisions may not fully protect us in the event that a tenant becomes insolvent. Finally, one of our properties has contained asbestos-containing building materials, or ACBM, and another property may have contained such materials based on the date of its construction.
18
Environmental laws require that ACBM be properly managed and maintained, and may impose fines and penalties on building owners or operators for failure to comply with these requirements. The laws also may allow third parties to seek recovery from owners or operators for personal injury associated with exposure to asbestos fibers.
Our efforts to identify environmental liabilities may not be successful.
We test our properties for compliance with applicable environmental laws on a limited basis. We cannot give assurance that:
• | existing environmental studies with respect to our properties reveal all potential environmental liabilities; |
• | any previous owner, occupant or tenant of one of our properties did not create any material environmental condition not known to us; |
• | the current environmental condition of our properties will not be affected by tenants and occupants, by the condition of nearby properties, or by other unrelated third parties; or |
• | future uses or conditions (including, without limitation, changes in applicable environmental laws and regulations or the interpretation thereof) will not result in environmental liabilities. |
Compliance with the Americans with Disabilities Act and fire, safety and other regulations may require us to make expenditures that adversely affect our cash flows.
Our properties must comply with Title III of the ADA to the extent that such properties are public accommodations as defined by the ADA. The ADA may require removal of structural barriers to access by persons with disabilities in certain public areas of our properties where such removal is readily achievable. Noncompliance with the ADA could result in imposition of fines or an award of damages to private litigants and the incurrence of additional costs associated with bringing the properties into compliance. Although we believe the properties in our portfolio substantially comply with present requirements of the ADA, we have not conducted an audit or investigation of all of our properties to determine our compliance. While the tenants to whom our properties are leased are obligated by law to comply with the ADA provisions, and typically under tenant leases are obligated to cover costs associated with compliance, if required changes involve greater expenditures than anticipated, or if the changes must be made on a more accelerated basis than anticipated, the ability of these tenants to cover costs could be adversely affected. As a result, we could be required to expend funds to comply with the provisions of the ADA, which could adversely affect our results of operations and financial condition. In addition, we are required to operate the properties in compliance with fire and safety regulations, building codes and other land use regulations, as they may be adopted by governmental agencies and bodies and become applicable to the properties. We may be required to make substantial capital expenditures to comply with, and we may be restricted in our ability to renovate the properties subject to, those requirements. The resulting expenditures and restrictions could have a material adverse effect on our ability to meet our financial obligations.
Inflation may adversely affect our financial condition and results of operations.
Most of our leases contain provisions requiring the tenant to pay a share of operating expenses, including common area maintenance, real estate taxes and insurance. However, increased inflation could have a more pronounced negative impact on our mortgage and debt interest and general and administrative expenses, as these costs could increase at a rate higher than our rents. Also, inflation may adversely affect tenant leases with stated rent increases or limits on such tenant’s obligation to pay its share of operating expenses, which could be lower than the increase in inflation at any given time. It may also limit our ability to recover all of our operating expenses. Inflation could also have an adverse effect on consumer spending, which could impact our tenants’ sales and, in turn, our average rents, and in some cases, our percentage rents, where applicable. In addition, renewals of leases or future leases may not be negotiated on current terms, in which event we may recover a smaller percentage of our operating expenses.
Rising interest rates could increase our borrowing costs, thereby adversely affecting our cash flows and the amounts available for distributions to our shareholders, as well as decrease our share price, if investors seek higher yields through other investments.
An environment of rising interest rates could lead investors to seek higher yields through other investments, which could adversely affect the market price of our common shares. One of the factors that may influence the price of our common shares in public markets is the annual distribution rate we pay as compared with the yields on alternative investments. Several other factors, such as governmental regulatory action and tax laws, could have a significant impact on the future market price of our common
19
shares. In addition, increases in market interest rates could result in increased borrowing costs for us, which may adversely affect our cash flow and the amounts available for distributions to our shareholders.
We and our tenants face risks relating to cybersecurity attacks that could cause loss of confidential information and other business disruptions.
We rely extensively on computer systems to process transactions and manage our business, and our business is at risk from and may be impacted by cybersecurity attacks. These could include attempts to gain unauthorized access to our data and computer systems. Attacks can be both individual and/or highly organized attempts by very sophisticated hacking organizations. A cybersecurity attack could compromise the confidential information of our employees, tenants, and vendors. Additionally, we rely on a number of service providers and vendors, and cybersecurity risks at these service providers and vendors create additional risks for our information and business. A successful attack could lead to identity theft, fraud or other disruptions to our business operations, any of which may negatively affect our results of operations.
We employ a number of measures to prevent, detect and mitigate these threats. These prevention measures include password protection, frequent password change events, firewall detection systems, frequent backups, a redundant data system for core applications and penetration testing. We conduct periodic assessments of (i) the nature, sensitivity and location of information that we collect, process and store and the technology systems we use; (ii) internal and external cybersecurity threats to and vulnerabilities of our information and technology systems; (iii) security controls and processes currently in place; (iv) the impact should our technology systems become compromised; and (v) the effectiveness of our management of cybersecurity risk. The results of these assessments are used to create and implement a strategy designed to prevent, detect and respond to cybersecurity threats. However, there is no guarantee such efforts will be successful in preventing a cyber-attack.
RISKS RELATED TO OUR ORGANIZATION AND STRUCTURE
Our organizational documents contain provisions that generally would prohibit any person (other than members of the Kite family who, as a group, are currently allowed to own up to 21.5% of our outstanding common shares) from beneficially owning more than 7% of our outstanding common shares (or up to 9.8% in the case of certain designated investment entities, as defined in our declaration of trust), which may discourage third parties from conducting a tender offer or seeking other change of control transactions that could involve a premium price for our shares or otherwise benefit our shareholders.
Our organizational documents contain provisions that may have an anti-takeover effect and inhibit a change in our management.
(1) There are ownership limits and restrictions on transferability in our declaration of trust. In order for us to qualify as a REIT, no more than 50% of the value of our outstanding shares may be owned, actually or constructively, by five or fewer individuals at any time during the last half of each taxable year. To make sure that we will not fail to satisfy this requirement and for anti-takeover reasons, our declaration of trust generally prohibits any shareholder (other than an excepted holder or certain designated investment entities, as defined in our declaration of trust) from owning (actually, constructively or by attribution), more than 7% of the value or number of our outstanding common shares. Our declaration of trust provides an excepted holder limit that allows members of the Kite family (Al Kite, John Kite and Paul Kite, their family members and certain entities controlled by one or more of the Kites), as a group, to own more than 7% of our outstanding common shares, so long as, under the applicable tax attribution rules, no one excepted holder treated as an individual would hold more than 21.5% of our common shares, no two excepted holders treated as individuals would own more than 28.5% of our common shares, no three excepted holders treated as individuals would own more than 35.5% of our common shares, no four excepted holders treated as individuals would own more than 42.5% of our common shares, and no five excepted holders treated as individuals would own more than 49.5% of our common shares. Currently, one of the excepted holders would be attributed all of the common shares owned by each other excepted holder and, accordingly, the excepted holders as a group would not be allowed to own in excess of 21.5% of our common shares. If at a later time, there were not one excepted holder that would be attributed all of the shares owned by the excepted holders as a group, the excepted holder limit would not permit each excepted holder to own 21.5% of our common shares. Rather, the excepted holder limit would prevent two or more excepted holders who are treated as individuals under the applicable tax attribution rules from owning a higher percentage of our common shares than the maximum amount of common shares that could be owned by any one excepted holder (21.5%), plus the maximum amount of common shares that could be owned by any one or more other individual common shareholders who are not excepted holders (7%). Certain entities that are defined as designated investment entities in our declaration of trust, which generally include pension funds, mutual funds, and certain investment management companies, are permitted to own up to 9.8% of our outstanding common shares, so long as each beneficial owner of the shares owned by such designated investment entity would satisfy the 7% ownership limit if those beneficial owners owned directly their proportionate share of the common shares owned by the designated investment entity. Our Board of Trustees may waive, and has waived in the
20
past, the 7% ownership limit or the 9.8% designated investment entity limit for a shareholder that is not an individual if such shareholder provides information and makes representations that are satisfactory to the Board of Trustees, in its reasonable discretion, to establish that such person’s ownership in excess of the 7% limit or the 9.8% limit, as applicable, would not jeopardize our qualification as a REIT. In addition, our declaration of trust contains certain other ownership restrictions intended to prevent us from earning income from related parties if such income would cause us to fail to comply with the REIT gross income requirements. The various ownership restrictions may:
• | discourage a tender offer or other transactions or a change in management or control that might involve a premium price for our shares or otherwise be in the best interests of our shareholders; or |
• | compel a shareholder who has acquired our shares in excess of these ownership limitations to dispose of the additional shares and, as a result, to forfeit the benefits of owning the additional shares. Any acquisition of our common shares in violation of these ownership restrictions will be void ab initio and will result in automatic transfers of our common shares to a charitable trust, which will be responsible for selling the common shares to permitted transferees and distributing at least a portion of the proceeds to the prohibited transferees. |
(2) Our declaration of trust permits our Board of Trustees to issue preferred shares with terms that may discourage a third party from acquiring us. Our declaration of trust permits our Board of Trustees to issue up to 40,000,000 preferred shares, having those preferences, conversion or other rights, voting powers, restrictions, limitations as to distributions, qualifications, or terms or conditions of redemption as determined by our Board of Trustees. Thus, our Board of Trustees could authorize the issuance of additional preferred shares with terms and conditions that could have the effect of discouraging a takeover or other transaction in which holders of some or a majority of our shares might receive a premium for their shares over the then-prevailing market price of our shares. In addition, any preferred shares that we issue likely would rank senior to our common shares with respect to payment of distributions, in which case we could not pay any distributions on our common shares until full distributions were paid with respect to such preferred shares.
(3) Our declaration of trust and bylaws contain other possible anti-takeover provisions. Our declaration of trust and bylaws contain other provisions that may have the effect of delaying, deferring or preventing a change in control of our company or the removal of existing management and, as a result, could prevent our shareholders from being paid a premium for their common shares over the then-prevailing market prices. These provisions include advance notice requirements for shareholder proposals and our Board of Trustees’ power to reclassify shares and issue additional common shares or preferred shares and the absence of cumulative voting rights. Furthermore, our Board of Trustees has the sole power to amend our bylaws and may amend our bylaws in a way that may have the effect of delaying, deferring or preventing a change in control of our company or the removal of existing management or may otherwise be detrimental to your interests.
Certain provisions of Maryland law could inhibit changes in control.
Certain provisions of Maryland law may have the effect of inhibiting a third party from making a proposal to acquire us or of impeding a change of control under circumstances that otherwise could provide the holders of our common shares with the opportunity to realize a premium over the then-prevailing market price of such shares, including:
• | “business combination moratorium/fair price” provisions that, subject to limitations, prohibit certain business combinations between us and an “interested shareholder” (defined generally as any person who beneficially owns 10% or more of the voting power of our shares or an affiliate thereof) for five years after the most recent date on which the shareholder becomes an interested shareholder, and thereafter imposes stringent fair price and super-majority shareholder voting requirements on these combinations; and |
• | “control share” provisions that provide that “control shares” of our company (defined as shares which, when aggregated with other shares controlled by the shareholder, entitle the shareholder to exercise one of three increasing ranges of voting power in electing trustees) acquired in a “control share acquisition” (defined as the direct or indirect acquisition of ownership or control of “control shares” from a party other than the issuer) have no voting rights except to the extent approved by our shareholders by the affirmative vote of at least two thirds of all the votes entitled to be cast on the matter, excluding all interested shares, and are subject to redemption in certain circumstances. |
We have opted out of these provisions of Maryland law. However, our Board of Trustees may opt to make these provisions applicable to us at any time.
21
A substantial number of common shares eligible for future issuance or sale could cause our common share price to decline significantly and may be dilutive to current shareholders.
Our declaration of trust authorizes our Board of Trustees to, among other things, issue additional common shares without shareholder approval. The issuance of substantial numbers of our common shares in the public market or the perception that such issuances might occur could adversely affect the per share trading price of our common shares. In addition, any such issuance could dilute our existing shareholders' interests in our company. Furthermore, if our shareholders sell, or the market perceives that our shareholders intend to sell, substantial amounts of our common shares in the public market, the market price of our common shares could decline significantly. These sales also might make it more difficult for us to sell equity or equity-related securities in the future at a time and price that we deem appropriate. As of December 31, 2017, we had outstanding 83,606,068 common shares, and substantially all of these shares are freely tradable. In addition, 1,974,830 units of our Operating Partnership were owned by our executive officers and other individuals as of December 31, 2017, and are redeemable by the holder for cash or, at our election, common shares. Pursuant to registration rights of certain of our executive officers and other individuals, we filed a registration statement with the SEC to register common shares issued (or issuable upon redemption of units in our Operating Partnership) in our formation transactions. As units are redeemed for common shares, the market price of our common shares could drop significantly if the holders of such shares sell them or are perceived by the market as intending to sell them.
Certain officers and trustees may have interests that conflict with the interests of shareholders.
Certain of our officers own limited partner units in our Operating Partnership. These individuals may have personal interests that conflict with the interests of our shareholders with respect to business decisions affecting us and our Operating Partnership, such as interests in the timing and pricing of property sales or refinancings in order to obtain favorable tax treatment. As a result, the effect of certain transactions on these unit holders may influence our decisions affecting these properties.
Departure or loss of our key officers could have an adverse effect on us.
Our future success depends, to a significant extent, upon the continued services of our existing executive officers. The experience of our executive officers in the areas of real estate acquisition, development, finance and management is a critical element of our future success. We have entered into employment agreements with certain members of senior management. Each employment agreement automatically renewed for one additional year on July 1, 2017. Each agreement will continue to renew each July 1st thereafter unless we or the individual elects not to renew the agreement. If one or more of our key executive officers were to die, become disabled or otherwise leave our employ, we may not be able to replace this person with an executive of equal skill, ability, and industry expertise within a reasonable timeframe. Until suitable replacements could be identified and hired, our operations and financial condition could be negatively affected.
We depend on external capital to fund our capital needs.
To qualify as a REIT, we are required to distribute to our shareholders each year at least 90% of our “REIT taxable income” (determined before the deduction for dividends paid and excluding net capital gains). In order to eliminate federal income tax, we are required to distribute annually 100% of our net taxable income, including capital gains. Partly because of these distribution requirements, we may not be able to fund all future capital needs, including capital for property development, redevelopment and acquisitions, with income from operations. We therefore will have to rely on third-party sources of capital, which may or may not be available on favorable terms, if at all. Any additional debt we incur will increase our leverage, expose us to the risk of default and may impose operating restrictions on us, and any additional equity we raise could be dilutive to existing shareholders. Our access to third-party sources of capital depends on a number of things, including:
• | general market conditions; |
• | the market’s perception of our growth potential; |
• | our current debt levels; |
• | our current and potential future earnings; |
• | our cash flow and cash distributions; |
• | our ability to qualify as a REIT for federal income tax purposes; and |
• | the market price of our common shares. |
22
If we cannot obtain capital from third-party sources, we may not be able to acquire or develop properties when strategic opportunities exist, satisfy our principal and interest obligations or make distributions to our shareholders.
Our rights and the rights of our shareholders to take action against our trustees and officers are limited.
Maryland law provides that a director or officer has limited liability in that capacity if he or she performs his or her duties in good faith and in a manner that he or she reasonably believes to be in our best interests and that an ordinarily prudent person in a like position would use under similar circumstances. Our declaration of trust and bylaws require us to indemnify our trustees and officers for actions taken by them in those capacities to the extent permitted by Maryland law.
Our shareholders have limited ability to prevent us from making any changes to our policies that they believe could harm our business, prospects, operating results or share price.
Our investment, financing, borrowing and dividend policies and our policies with respect to all other activities, including growth, debt, capitalization and operations, will be determined by our management and, in certain cases, approved by our Board of Trustees. These policies may be amended or revised from time to time at the discretion of our Board of Trustees without a vote of our shareholders. This means that our shareholders will have limited control over changes in our policies. Such changes in our policies intended to improve, expand or diversify our business may not have the anticipated effects and consequently may adversely affect our business and prospects, results of operations and share price.
Our common share price could be volatile and could decline, resulting in a substantial or complete loss of our shareholders’ investment.
The stock markets (including The New York Stock Exchange (the “NYSE”) on which we list our common shares) have experienced significant price and volume fluctuations. The market price of our common shares could be similarly volatile, and investors in our shares may experience a decrease in the value of their shares, including decreases unrelated to our operating performance or prospects. Among the market conditions that may affect the market price of our publicly traded securities are the following:
• | our financial condition and operating performance and the performance of other similar companies; |
• | actual or anticipated differences in our quarterly operating results; |
• | changes in our revenues or earnings estimates or recommendations by securities analysts; |
• | perceived or actual effects of e-commerce competition; |
• | bankruptcy or negative publicity about one or more of our larger tenants; |
• | our credit or analyst ratings; |
• | publication by securities analysts of research reports about us, our industry, or the retail industry; |
• | additions and departures of key personnel; |
• | strategic decisions by us or our competitors, such as acquisitions, divestments, spin-offs, joint ventures, strategic investments or changes in business strategy; |
• | the reputation of REITs generally and the reputation of REITs with portfolios similar to ours; |
• | the attractiveness of the securities of REITs in comparison to securities issued by other entities (including securities issued by other real estate companies); |
• | an increase in market interest rates, which may lead prospective investors to demand a higher distribution rate in relation to the price paid for our shares; |
• | the passage of legislation or other regulatory developments that adversely affect us or our industry including tax reform; |
• | speculation in the press or investment community; |
• | actions by institutional shareholders, hedge funds or other investors; |
23
• | increases or decreases in dividends; |
• | changes in accounting principles; |
• | terrorist acts; and |
• | general market conditions, including factors unrelated to our performance. |
In the past, securities class action litigation has often been instituted against companies following periods of volatility in their stock price. This type of litigation could result in substantial costs and divert our management’s attention and resources.
Changes in accounting standards may adversely impact our financial results.
The Financial Accounting Standards Board (the “FASB”), in conjunction with the SEC, has issued and may issue key pronouncements that impact how we account for our material transactions, including, but not limited to, lease accounting, business combinations and the recognition of other revenues. We are unable to predict which, if any, proposals may be issued in the future or what level of impact any such proposal could have on the presentation of our consolidated financial statements, our results of operations and the financial ratio required by our debt covenants.
The cash available for distribution to shareholders may not be sufficient to pay distributions at expected levels, nor can we assure you of our ability to make distributions in the future. We may use borrowed funds to make cash distributions and/or may choose to make distributions in party payable in our common shares.
If cash available for distribution generated by our assets decreases in future periods from expected levels, our inability to make expected distributions could result in a decrease in the market price of our common shares. All distributions will be made at the discretion of our Board of Trustees and will depend on our earnings, our financial condition, maintenance of our REIT qualification and other factors as our Board of Trustees may deem relevant from time to time. We may not be able to make distributions in the future. In addition, some of our distributions may include a return of capital. To the extent that we decide to make distributions in excess of our current and accumulated earnings and profits, such distributions would generally be considered a return of capital for federal income tax purposes to the extent of the holder’s adjusted tax basis in their shares. A return of capital is not taxable, but it has the effect of reducing the holder’s adjusted tax basis in its investment. To the extent that distributions exceed the adjusted tax basis of a holder’s shares, they will be treated as gain from the sale or exchange of such shares. If we borrow to fund distributions, our future interest costs would increase, thereby reducing our earnings and cash available for distribution from what they otherwise would have been. Finally, although we do not currently intend to do so, in order to maintain our REIT qualification, we may make distributions that are in part payable in our common shares. Taxable shareholders receiving such distributions will be required to include the full amount of such distributions as ordinary dividend income to the extent of our current or accumulated earnings and profits and may be required to sell shares received in such distribution or may be required to sell other shares or assets owned by them, at a time that may be disadvantageous, in order to satisfy any tax imposed on such distribution. If a significant number of our shareholders determine to sell common shares in order to pay taxes owed on dividend income, such sale may put downward pressure on the market price of our common shares.
Future offerings of debt securities, which would be senior to our equity securities, may adversely affect the market prices of our common shares.
In the future, we may attempt to increase our capital resources by making offerings of debt securities, including unsecured notes, medium term notes, and senior or subordinated notes. Holders of our debt securities will generally be entitled to receive interest payments, both current and in connection with any liquidation or sale, prior to the holders of our common shares being entitled to receive distributions. Future offerings of debt securities, or the perception that such offerings may occur, may reduce the market prices of our common shares and/or the distributions that we pay with respect to our common shares. Because we may generally issue such debt securities in the future without obtaining the consent of our shareholders, our shareholders will bear the risk of our future offerings reducing the market prices of our equity securities.
If securities or industry analysts do not publish research or reports about our business, or if they downgrade their recommendations regarding our common shares, our share price and trading volume could be negatively affected.
The trading market for our shares is influenced by the research and reports that industry or securities analysts publish about us or our business. If any of the analysts who cover us downgrade our common shares or publish inaccurate or unfavorable research about our business, our share price may decline. If analysts cease coverage of us or fail to regularly publish reports on us, we could lose visibility in the financial markets, which in turn could cause our common share price or
24
trading volume to decline and our shares to be less liquid. An inactive market may also impair our ability to raise capital by selling shares and may impair our ability to acquire additional properties or other businesses by using our shares as consideration, which in turn could materially adversely affect our business. In addition, the stock market in general, and the NYSE and REITs in particular, have within the last year experienced significant price and volume fluctuations. These broad market and industry factors may decrease the market price of our shares, regardless of our actual operating performance. For these reasons, among others, the market price of our shares may decline substantially and quickly.
TAX RISKS
Failure of our company to qualify as a REIT would have serious adverse consequences to us and our shareholders.
We believe that we have qualified for taxation as a REIT for federal income tax purposes commencing with our taxable year ended December 31, 2004. We intend to continue to meet the requirements for qualification and taxation as a REIT, but we cannot assure shareholders that we will qualify as a REIT. We have not requested and do not plan to request a ruling from the IRS that we qualify as a REIT, and the statements in this Annual Report on Form 10-K are not binding on the IRS or any court. As a REIT, we generally will not be subject to federal income tax on our income that we distribute currently to our shareholders. Many of the REIT requirements, however, are highly technical and complex. The determination that we are a REIT requires an analysis of various factual matters and circumstances that may not be totally within our control. For example, to qualify as a REIT, at least 95% of our gross income must come from specific passive sources, such as rent, that are itemized in the REIT tax laws. In addition, to qualify as a REIT, we cannot own specified amounts of debt and equity securities of some issuers. We also are required to distribute to our shareholders with respect to each year at least 90% of our “REIT taxable income” (determined before the deduction for dividends paid and excluding net capital gains). The fact that we hold substantially all of our assets through our Operating Partnership and its subsidiaries and joint ventures further complicates the application of the REIT requirements for us. Even a technical or inadvertent mistake could jeopardize our REIT status, and, given the highly complex nature of the rules governing REITs and the ongoing importance of factual determinations, we cannot provide any assurance that we will continue to qualify as a REIT. Furthermore, Congress and the IRS might make changes to the tax laws and regulations, and the courts might issue new rulings, that make it more difficult, or impossible, for us to remain qualified as a REIT.
If we fail to qualify as a REIT for federal income tax purposes and are unable to avail ourselves of certain savings provisions set forth in the Code:
• | We would be taxed as a non-REIT "C" corporation, which under current laws, among other things, means being able to take a deduction for distributions to shareholders in computing our taxable income or pass through long term capital gains to individual shareholders at favorable rates and being subject to the federal alternative minimum tax (for taxable years beginning before December 31, 2017) and possibly increased state and local taxes; |
• | We would not be able to elect to be taxed as a REIT for four years following the year we first failed to qualify. Since we are the successor to Inland Diversified Real Estate Trust, Inc. ("Inland Diversified") for federal income tax purposes as a result of its merger with us (the "Merger"), the rule against re-electing REIT status following a loss of such status also would apply to us if Inland Diversified failed to qualify as a REIT in any of its 2011 through 2014 tax years. Although Inland Diversified believed that it was organized and operated in conformity with the requirements for qualification and taxation as a REIT for each of its taxable years prior to the Merger, Inland Diversified did not request a ruling from the IRS that it qualified as a REIT, and thus no assurance can be given that it qualified as a REIT; |
• | We would have to pay significant income taxes, which would reduce our net earnings available for investment or distribution to our shareholders. Moreover, such failure would cause an event of default under our unsecured revolving credit facility and unsecured term loans and may adversely affect our ability to raise capital and to service our debt. This likely would have a significant adverse effect on our earnings and the value of our securities. In addition, we would no longer be required to pay any distributions to shareholders; and |
• | We would be required to pay penalty taxes of $50,000 or more for each such failure. |
If Inland Diversified failed to qualify as a REIT for a taxable year before the Merger or for the taxable year that includes the Merger and no relief is available, in connection with the Merger we would succeed to any earnings and profits accumulated by Inland Diversified for the taxable periods that it did not qualify as a REIT, and we would have to pay a special dividend and/or employ applicable deficiency dividend procedures (including significant interest payments to the IRS) to eliminate such earnings and profits.
25
We will pay some taxes even if we qualify as a REIT.
Even if we qualify as a REIT for federal income tax purposes, we will be required to pay certain federal, state and local taxes on our income and property. For example, we will be subject to income tax to the extent we distribute less than 100% of our REIT taxable income (including capital gains). Additionally, we will be subject to a 4% nondeductible excise tax on the amount, if any, by which dividends paid by us in any calendar year are less than the sum of 85% of our ordinary income, 95% of our capital gain net income and 100% of our undistributed income from prior years. Moreover, if we have net income from “prohibited transactions,” that income will be subject to a 100% tax. In general, prohibited transactions are sales or other dispositions of property held primarily for sale to customers in the ordinary course of business. The determination as to whether a particular sale is a prohibited transaction depends on the facts and circumstances related to that sale. While we will undertake sales of assets if those assets become inconsistent with our long-term strategic or return objectives, we do not believe that those sales should be considered prohibited transactions, but there can be no assurance that the IRS would not contend otherwise. The need to avoid prohibited transactions could cause us to forego or defer sales of properties that might otherwise be in our best interest to sell.
In addition, any net taxable income earned directly by our taxable REIT subsidiaries, or through entities that are disregarded for federal income tax purposes as entities separate from our taxable REIT subsidiaries, will be subject to federal and possibly state corporate income tax. We have elected to treat Kite Realty Holdings, LLC as a taxable REIT subsidiary, and we may elect to treat other subsidiaries as taxable REIT subsidiaries in the future. In this regard, several provisions of the laws applicable to REITs and their subsidiaries ensure that a taxable REIT subsidiary will be subject to an appropriate level of federal income taxation. For example, a taxable REIT subsidiary is limited in its ability to deduct interest payments made to an affiliated REIT. In addition, the REIT has to pay a 100% penalty tax on some payments that it receives or on some deductions taken by the taxable REIT subsidiaries if the economic arrangements between the REIT, the REIT’s tenants, and the taxable REIT subsidiary are not comparable to similar arrangements between unrelated parties. Finally, some state and local jurisdictions may tax some of our income even though as a REIT we are not subject to federal income tax on that income because not all states and localities treat REITs the same way they are treated for federal income tax purposes. To the extent that we and our affiliates are required to pay federal, state and local taxes, we will have less cash available for distributions to our shareholders.
If Inland Diversified failed to qualify as a REIT for a taxable year before the Merger or the taxable year that includes the Merger and no relief is available, as a result of the Merger (a) we would inherit any corporate income tax liabilities of Inland Diversified for Inland Diversified’s open tax years (generally three years or Inland Diversified’s 2011 through 2014 tax years but possibly extending back six years or Inland Diversified’s initial 2009 tax year through its 2014 tax year), including penalties and interest, and (b) we would be subject to tax on the built-in gain on each asset of Inland Diversified existing at the time of the Merger if we were to dispose of the Inland Diversified asset within five years following the Merger (i.e. before July 1, 2019).
REIT distribution requirements may increase our indebtedness.
We may be required from time to time, under certain circumstances, to accrue income for tax purposes that has not yet been received. In such event, or upon our repayment of principal on debt, we could have taxable income without sufficient cash to enable us to meet the distribution requirements of a REIT. Accordingly, we could be required to borrow funds or liquidate investments on adverse terms in order to meet these distribution requirements. Additionally, the sale of properties resulting in significant tax gains could require higher distributions to our shareholders or payment of additional income taxes in order to maintain our REIT status.
Complying with REIT requirements may limit our ability to hedge effectively and may cause us to incur tax liabilities.
The REIT provisions of the Code may limit our ability to hedge our assets and operations. Under these provisions, any income that we generate from transactions intended to hedge our interest rate risk will be excluded from gross income for purposes of the REIT 75% and 95% gross income tests if the instrument hedges interest rate risk on liabilities used to carry or acquire real estate assets or manages the risk of certain currency fluctuations, and such instrument is properly identified under applicable Treasury Regulations. Income from hedging transactions that do not meet these requirements will generally constitute non-qualifying income for purposes of both the REIT 75% and 95% gross income tests. As a result of these rules, we may have to limit our use of hedging techniques that might otherwise be advantageous or implement those hedges through a taxable REIT subsidiary. This could increase the cost of our hedging activities because our taxable REIT subsidiary would be subject to tax on gains or expose us to greater risks associated with changes in interest rates than we would otherwise want to bear. In addition, losses in our taxable REIT subsidiary will generally not provide any tax benefit, except for being carried back or forward against past or future taxable income in the taxable REIT subsidiary, provided, however, losses in our taxable REIT subsidiary arising in taxable years beginning after December 31, 2017 may only be carried forward and may only be deducted against 80% of future taxable income in the taxable REIT subsidiary.
26
Complying with the REIT requirements may cause us to forgo and/or liquidate otherwise attractive investments.
To qualify as a REIT, we must continually satisfy tests concerning, among other things, the sources of our income, the nature and diversification of our assets, the amounts that we distribute to our shareholders and the ownership of our shares. To meet these tests, we may be required to take actions we would otherwise prefer not to take or forgo taking actions that we would otherwise consider advantageous. For instance, in order to satisfy the gross income or asset tests applicable to REITs under the Code, we may be required to forgo investments that we otherwise would make. Furthermore, we may be required to liquidate from our portfolio otherwise attractive investments. In addition, we may be required to make distributions to shareholders at disadvantageous times or when we do not have funds readily available for distribution. These actions could reduce our income and amounts available for distribution to our shareholders. Thus, compliance with the REIT requirements may hinder our investment performance.
Dividends paid by REITs generally do not qualify for effective tax rates as low as dividends paid by non-REIT "C" corporations.
The maximum rate applicable to “qualified dividend income” paid by non-REIT “C” corporations to certain non-corporate U.S. shareholders has been reduced by legislation to 23.8% (taking into account the 3.8% Medicare tax applicable to net investment income). Dividends payable by REITs, however, generally are not eligible for the reduced rates. Effective for taxable years beginning after December 31, 2017 and before January 1, 2026, non-corporate shareholders may deduct 20% of their dividends from REITs (excluding qualified dividend income and capital gains dividends). For non-corporate shareholders in the top marginal tax bracket of 37%, the deduction for REIT dividends yields an effective income tax rate of 29.6% on REIT dividends, which is higher than the 20% tax rate on qualified dividend income paid by non-REIT “C” corporations. This does not adversely affect the taxation of REITs, however, it could cause certain non-corporate investors to perceive investments in REITs to be relatively less attractive than investments in the shares of non-REIT “C” corporations that pay dividends, which could adversely affect the value of our common shares.
If the Operating Partnership fails to qualify as a partnership for U.S. federal income tax purposes, we could fail to qualify as a REIT and suffer other adverse consequences.
We believe that our Operating Partnership is organized and operated in a manner so as to be treated as a partnership and not an association or a publicly traded partnership taxable as a corporation, for U.S. federal income tax purposes. As a partnership, our Operating Partnership is not subject to U.S. federal income tax on its income. Instead, each of the partners is allocated its share of our Operating Partnership’s income. No assurance can be provided, however, that the IRS will not challenge our Operating Partnership’s status as a partnership for U.S. federal income tax purposes or that a court would not sustain such a challenge. If the IRS were successful in treating our Operating Partnership as an association or publicly traded partnership taxable as a corporation for U.S. federal income tax purposes, we would fail to meet the gross income tests and certain of the asset tests applicable to REITs and, accordingly, would cease to qualify as a REIT. Also, the failure of the Operating Partnership to qualify as a partnership would cause it to become subject to U.S. federal corporate income tax, which would reduce significantly the amount of its cash available for distribution to its partners, including us.
There is a risk that the tax laws applicable to REITs may change.
The IRS, the United States Treasury Department and Congress frequently review federal income tax legislation, regulations and other guidance. The Company cannot predict whether, when or to what extent new U.S. federal tax laws, regulations, interpretations or rulings will be adopted. Any legislative action may prospectively or retroactively modify the Company's tax treatment and, therefore, may adversely affect our taxation or taxation of our shareholders. In particular, H.R.1 (Tax Cuts & Jobs Act), which was signed into law on December 22, 2017 and which generally takes effect for taxable years beginning on or after January 1, 2018, makes many significant changes to the federal income tax laws that will profoundly impact the taxation of individuals and corporations (both non-REIT “C” corporations as well as corporations that have elected to be taxed as REITs). A number of changes that affect non-corporate taxpayers will expire at the end of 2025 unless Congress acts to extend them. These changes will impact us and our shareholders in various ways, some of which are adverse or potentially adverse compared to prior law. To date, the IRS has issued only limited guidance with respect to certain of the new provisions, and there are numerous interpretive issues that will require guidance. It is highly likely that technical corrections legislation will be needed to clarify certain aspects of the new law and give proper effect to Congressional intent. There can be no assurance, however, that technical clarifications or changes needed to prevent unintended or unforeseen tax consequences will be enacted by Congress in the near future.
ITEM 1B. UNRESOLVED STAFF COMMENTS
27
None
ITEM 2. PROPERTIES
Retail Operating Properties
As of December 31, 2017, we owned interests in a portfolio of 105 retail operating properties totaling approximately 21.2 million square feet of total GLA (including approximately 6.2 million square feet of non-owned anchor space). The following table sets forth more specific information with respect to our retail operating properties as of December 31, 2017:
Property1 | Location (MSA) | Year Built/ Renovated | Owned GLA2 | Leased % | ABR per SqFt | Grocery Anchors4 | Other Retailers4 | |||||||||||||
Total | Anchors | Shops | Total | Anchors | Shops | |||||||||||||||
Alabama | ||||||||||||||||||||
Trussville Promenade | Birmingham | 1999 | 463,836 | 376,010 | 87,826 | 95.2 | % | 100.0 | % | 74.5 | % | $ | 9.67 | Wal-Mart, (Sam's Club) | Regal Cinemas, Marshalls, Big Lots, PetSmart, Dollar Tree, Ross Dress for Less, (Kohl's) | |||||
Arizona | ||||||||||||||||||||
The Corner | Tucson | 2008 | 79,902 | 55,883 | 24,019 | 100.0 | % | 100.0 | % | 100.0 | % | 29.50 | Total Wine & More | Nordstrom Rack, Panera Bread, (Home Depot) | ||||||
Connecticut | ||||||||||||||||||||
Killingly Commons3 | Killingly | 2010 | 205,683 | 148,250 | 57,433 | 96.9 | % | 100.0 | % | 89.0 | % | 16.30 | Stop & Shop Supermarket, (Target) | TJ Maxx, Bed Bath & Beyond, Michaels, Petco, Staples, Lowe's Home Improvement Center | ||||||
Florida | ||||||||||||||||||||
12th Street Plaza | Vero Beach | 1978/2003 | 135,016 | 121,376 | 13,640 | 100.0 | % | 100.0 | % | 100.0 | % | 10.05 | Publix | Stein Mart, Tuesday Morning | ||||||
Bayport Commons | Tampa | 2008 | 97,163 | 71,540 | 25,623 | 64.5 | % | 58.0 | % | 82.6 | % | 18.45 | (Target) | PetSmart, Michaels | ||||||
Bolton Plaza | Jacksonville | 1986/2014 | 154,555 | 136,195 | 18,360 | 100.0 | % | 100.0 | % | 100.0 | % | 9.76 | Aldi | LA Fitness, Academy Sports, Marshalls, Panera Bread | ||||||
Centre Point Commons | Bradenton | 2007 | 119,275 | 93,574 | 25,701 | 100.0 | % | 100.0 | % | 100.0 | % | 17.50 | Best Buy, Dick's Sporting Goods, Office Depot, Panera Bread, (Lowe's Home Improvement Center) | |||||||
Cobblestone Plaza | Ft. Lauderdale | 2011 | 133,220 | 68,169 | 65,051 | 84.9 | % | 70.4 | % | 100.0 | % | 30.78 | Whole Foods | Party City | ||||||
Colonial Square | Fort Myers | 2010 | 186,609 | 150,505 | 36,104 | 69.7 | % | 71.9 | % | 60.6 | % | 13.06 | Kohl's, Hobby Lobby, PetSmart, | |||||||
Delray Marketplace3 | Miami | 2013 | 260,181 | 118,136 | 142,045 | 99.3 | % | 100.0 | % | 98.6 | % | 26.35 | Publix | Frank Theatres, Burt & Max's, Carl's Patio, Ann Taylor Loft, Chicos, White House Black Market | ||||||
Estero Town Commons | Naples | 2006 | 25,696 | — | 25,696 | 80.4 | % | — | % | 80.4 | % | 14.72 | Lowe's Home Improvement Center, Dollar Tree | |||||||
Gainesville Plaza | Gainesville | 1970/2015 | 162,309 | 125,162 | 37,147 | 92.3 | % | 100.0 | % | 66.4 | % | 9.44 | Save a Lot | Ross Dress for Less, Burlington, 2nd and Charles | ||||||
Hunter's Creek Promenade | Orlando | 1994 | 119,729 | 55,999 | 63,730 | 100.0 | % | 100.0 | % | 100.0 | % | 14.67 | Publix | |||||||
Indian River Square | Vero Beach | 1997/2004 | 142,592 | 109,000 | 33,592 | 92.5 | % | 100.0 | % | 68.2 | % | 11.43 | (Target) | Beall's, Office Depot, Dollar Tree | ||||||
International Speedway Square | Daytona | 1999/2013 | 233,424 | 203,405 | 30,019 | 98.3 | % | 100.0 | % | 86.7 | % | 11.30 | Total Wine & More | Bed, Bath & Beyond, Stein Mart, Old Navy, Staples, Michaels, Dick’s Sporting Goods, Shoe Carnival | ||||||
Kings Lake Square | Naples | 1986/2014 | 88,588 | 45,600 | 42,988 | 95.5 | % | 100.0 | % | 90.8 | % | 18.50 | Publix | |||||||
Lake City Commons | Lake City | 2008 | 65,723 | 45,600 | 20,123 | 100.0 | % | 100.0 | % | 100.0 | % | 14.82 | Publix | |||||||
Lake City Commons - Phase II | Lake City | 2011 | 16,291 | 12,131 | 4,160 | 100.0 | % | 100.0 | % | 100.0 | % | 15.62 | Publix | PetSmart | ||||||
Lake Mary Plaza | Orlando | 2009 | 21,370 | 14,880 | 6,490 | 100.0 | % | 100.0 | % | 100.0 | % | 37.49 | Walgreens | |||||||
Lakewood Promenade | Jacksonville | 1948/1998 | 196,739 | 77,840 | 118,899 | 85.8 | % | 100.0 | % | 76.6 | % | 12.42 | Winn Dixie | SteinMart, Starbuck's, Salon Lofts | ||||||
Lithia Crossing | Tampa | 2003/2013 | 90,505 | 53,547 | 36,958 | 98.7 | % | 100.0 | % | 96.8 | % | 15.19 | The Fresh Market | Stein Mart, Chili's, Panera Bread | ||||||
Miramar Square | Ft. Lauderdale | 2008 | 224,737 | 137,505 | 87,232 | 86.6 | % | 85.5 | % | 93.6 | % | 16.07 | Kohl's, Miami Children's Hospital, Dollar General | |||||||
Northdale Promenade | Tampa | 1985/2017 | 173,862 | 118,269 | 55,593 | 99.4 | % | 100.0 | % | 98.1 | % | 12.84 | (Winn Dixie) | TJ Maxx, Ulta Beauty, Beall's, Crunch Fitness, Tuesday Morning | ||||||
Palm Coast Landing at Town Square | Palm Coast | 2010 | 168,352 | 100,822 | 67,530 | 98.6 | % | 100.0 | % | 96.6 | % | 18.91 | (Target) | Michaels, PetSmart, Ross Dress for Less, TJ Maxx, Ulta Beauty | ||||||
Pine Ridge Crossing | Naples | 1993 | 105,962 | 66,435 | 39,527 | 100.0 | % | 100.0 | % | 100.0 | % | 17.92 | Publix, (Target) | Ulta Beauty, (Beall's) | ||||||
29
Property1 | Location (MSA) | Year Built/ Renovated | Owned GLA2 | Leased % | ABR per SqFt | Grocery Anchors4 | Other Retailers4 | |||||||||||||
Total | Anchors | Shops | Total | Anchors | Shops | |||||||||||||||
Pleasant Hill Commons | Orlando | 2008 | 70,643 | 45,600 | 25,043 | 98.3 | % | 100.0 | % | 95.2 | % | $ | 15.15 | Publix | ||||||
Riverchase Plaza | Naples | 1991/2001 | 78,291 | 48,890 | 29,401 | 100.0 | % | 100.0 | % | 100.0 | % | 16.31 | Publix | |||||||
Saxon Crossing | Orange City | 2009 | 119,907 | 95,304 | 24,603 | 94.2 | % | 100.0 | % | 71.9 | % | 15.00 | (Target) | Hobby Lobby, LA Fitness, (Lowe's Home Improvement Center) | ||||||
Shoppes of Eastwood | Orlando | 1997 | 69,076 | 51,512 | 17,564 | 98.1 | % | 100.0 | % | 92.5 | % | 13.53 | Publix | |||||||
Shops at Eagle Creek | Naples | 1983/2013 | 70,768 | 50,187 | 20,581 | 98.4 | % | 100.0 | % | 94.3 | % | 15.81 | The Fresh Market | Staples, (Lowe's Home Improvement Center), Panera Bread | ||||||
Tamiami Crossing | Naples | 2016 | 121,705 | 121,705 | — | 100.0 | % | 100.0 | % | — | % | 12.51 | Aldi, (Wal-Mart) | Marshalls, Michaels, PetSmart, Ross Dress for Less, Stein Mart, Ulta Beauty | ||||||
Tarpon Bay Plaza | Naples | 2007 | 82,528 | 60,139 | 22,389 | 96.6 | % | 100.0 | % | 87.5 | % | 17.80 | (Target) | PetSmart, Cost Plus World Market, Staples, Panera Bread | ||||||
Temple Terrace | Temple Terrace | 2012 | 90,328 | 58,798 | 31,530 | 92.9 | % | 100.0 | % | 79.6 | % | 10.55 | Winn Dixie | Burger King | ||||||
The Landing at Tradition | Port St. Lucie | 2007 | 360,276 | 290,396 | 69,880 | 83.8 | % | 86.1 | % | 74.2 | % | 16.00 | (Target) | TJ Maxx, Ulta Salon, Bed Bath & Beyond, LA Fitness, Michaels, Old Navy, PetSmart, Pier 1, DSW, Five Below | ||||||
The Shops at Julington Creek | Jacksonville | 2011 | 40,219 | 21,038 | 19,181 | 96.5 | % | 100.0 | % | 92.6 | % | 19.43 | The Fresh Market | |||||||
Tradition Village Center | Port St. Lucie | 2006 | 84,084 | 45,600 | 38,484 | 95.5 | % | 100.0 | % | 90.2 | % | 17.08 | Publix | |||||||
Waterford Lakes Village | Orlando | 1997 | 77,971 | 51,703 | 26,268 | 98.4 | % | 100.0 | % | 95.2 | % | 13.13 | Winn Dixie | |||||||
Georgia | ||||||||||||||||||||
Mullins Crossing | Evans | 2005 | 251,712 | 205,716 | 45,996 | 100.0 | % | 100.0 | % | 100.0 | % | 12.73 | (Target) | Ross Dress for Less, Babies "R" Us, Kohls, La-Z Boy, Marshalls, Office Max, Petco, Ulta Beauty, Panera Bread | ||||||
Publix at Acworth | Atlanta | 1996 | 69,640 | 37,888 | 31,752 | 98.3 | % | 100.0 | % | 96.2 | % | 12.52 | Publix | |||||||
The Centre at Panola | Atlanta | 2001 | 73,061 | 51,674 | 21,387 | 100.0 | % | 100.0 | % | 100.0 | % | 13.04 | Publix | |||||||
Illinois | ||||||||||||||||||||
Fox Lake Crossing | Chicago | 2002 | 99,136 | 65,977 | 33,159 | 90.7 | % | 100.0 | % | 72.2 | % | 13.34 | Dominick's Finer Foods | Dollar Tree | ||||||
Naperville Marketplace | Chicago | 2008 | 83,743 | 61,683 | 22,060 | 100.0 | % | 100.0 | % | 100.0 | % | 13.83 | (Caputo's Fresh Market) | TJ Maxx, PetSmart, | ||||||
South Elgin Commons | Chicago | 2011 | 128,000 | 128,000 | — | 100.0 | % | 100.0 | % | — | % | 14.55 | (Target) | LA Fitness, Ross Dress for Less, Toys "R" Us/Babies "R" Us | ||||||
Indiana | ||||||||||||||||||||
54th & College | Indianapolis | 2008 | — | — | — | — | % | — | % | — | % | 0.00 | The Fresh Market | |||||||
Beacon Hill | Crown Point | 2006 | 56,820 | 11,043 | 45,777 | 98.0 | % | 100.0 | % | 97.5 | % | 16.09 | (Strack & Van Till) | (Walgreens), Jimmy John's, Rosati's, Great Clips | ||||||
Bell Oaks Centre | Newburgh | 2008 | 94,958 | 74,122 | 20,836 | 100.0 | % | 100.0 | % | 100.0 | % | 12.17 | Schnuck's Market | |||||||
Boulevard Crossing | Kokomo | 2004 | 124,634 | 74,440 | 50,194 | 94.7 | % | 100.0 | % | 86.7 | % | 14.83 | Petco, TJ Maxx, Ulta Beauty, Shoe Carnival, (Kohl's) | |||||||
Bridgewater Marketplace | Indianapolis | 2008 | 25,975 | — | 25,975 | 86.8 | % | — | % | 86.8 | % | 20.58 | (Walgreens), The Local Eatery, Original Pancake House | |||||||
Castleton Crossing | Indianapolis | 1975/2012 | 286,377 | 247,710 | 38,667 | 100.0 | % | 100.0 | % | 100.0 | % | 11.86 | TJ Maxx/Home Goods, Burlington, Shoe Carnival, Value City Furniture, K&G Menswear, Chipotle, Verizon, Five Below | |||||||
Cool Creek Commons | Indianapolis | 2005 | 124,272 | 53,600 | 70,672 | 93.8 | % | 100.0 | % | 89.2 | % | 18.30 | The Fresh Market | Stein Mart, McAlister's Deli, Beauty Brands, Buffalo Wild Wings, Pet People | ||||||
Depauw University Bookstore and Café | Greencastle | 2012 | 11,974 | — | 11,974 | 100.0 | % | — | % | 100.0 | % | 9.17 | Folletts, Starbucks | |||||||
30
Property1 | Location (MSA) | Year Built/ Renovated | Owned GLA2 | Leased % | ABR per SqFt | Grocery Anchors4 | Other Retailers4 | |||||||||||||
Total | Anchors | Shops | Total | Anchors | Shops | |||||||||||||||
Eddy Street Commons at Notre Dame | South Bend | 2009 | 87,991 | 20,154 | 67,837 | 96.0 | % | 100.0 | % | 94.8 | % | $ | 25.59 | Hammes Bookstore & Cafe, Chipotle, Urban Outfitters, Five Guy's, Kilwin's, Blaze Pizza | ||||||
Geist Pavilion | Indianapolis | 2006 | 63,910 | 29,700 | 34,210 | 100.0 | % | 100.0 | % | 100.0 | % | 16.98 | Ace Hardware, Goodwill, Ale Emporium, Pure Barre | |||||||
Glendale Town Center | Indianapolis | 1958/2008 | 393,002 | 329,546 | 63,456 | 97.8 | % | 100.0 | % | 86.6 | % | 7.33 | (Target) | Macy’s, Staples, Landmark Theaters, Pei Wei, LensCrafter's, Panera Bread, (Walgreens), (Lowe's Home Improvement Center) | ||||||
Greyhound Commons | Indianapolis | 2005 | 9,152 | — | 9,152 | 100.0 | % | — | % | 100.0 | % | 13.60 | ||||||||
Lima Marketplace | Fort Wayne | 2008 | 100,461 | 71,521 | 28,940 | 94.8 | % | 100.0 | % | 81.8 | % | 14.81 | Aldi, (Wal-Mart) | PetSmart, Office Depot, Aldi, Dollar Tree | ||||||
Rangeline Crossing | Indianapolis | 1986/2013 | 100,196 | 47,962 | 52,234 | 99.0 | % | 100.0 | % | 98.2 | % | 22.21 | Earth Fare | Walgreens, Panera Bread, Pet Valu, City BBQ | ||||||
Rivers Edge | Indianapolis | 2011 | 150,428 | 117,890 | 32,538 | 100.0 | % | 100.0 | % | 100.0 | % | 21.92 | Nordstrom Rack, The Container Store, Arhaus Furniture, Bicycle Garage of Indy, Buy Buy Baby, J Crew Mercantile | |||||||
Stoney Creek Commons | Indianapolis | 2000/2013 | 84,330 | 84,330 | — | 64.1 | % | 64.1 | % | — | % | 13.44 | LA Fitness, Goodwill, (Lowe's Home Improvement Center) | |||||||
Traders Point I | Indianapolis | 2005 | 279,646 | 238,721 | 40,925 | 74.7 | % | 71.6 | % | 93.0 | % | 14.99 | Dick's Sporting Goods, AMC Theatre, Bed, Bath & Beyond, Michaels, Old Navy, PetSmart, Books-A-Million | |||||||
Traders Point II | Indianapolis | 2005 | 45,977 | — | 45,977 | 92.2 | % | — | % | 92.2 | % | 26.42 | ||||||||
Whitehall Pike | Bloomington | 1999 | 128,997 | 128,997 | — | 100.0 | % | 100.0 | % | — | % | 7.86 | Lowe's Home Improvement Center | |||||||
Nevada | ||||||||||||||||||||
Cannery Corner3 | Las Vegas | 2008 | 30,738 | — | 30,738 | 94.4 | % | — | % | 94.4 | % | 36.19 | (Sam's Club) | Chipotle, Five Guys, (Lowe's Home Improvement Center) | ||||||
Centennial Center3 | Las Vegas | 2002 | 334,377 | 158,196 | 176,181 | 88.6 | % | 85.3 | % | 91.6 | % | 24.53 | Sam's Club, Wal-Mart | Ross Dress for Less, Big Lots, Famous Footwear, Michaels, Party City, Petco, Rhapsodielle, Home Depot | ||||||
Centennial Gateway3 | Las Vegas | 2005 | 193,085 | 139,913 | 53,172 | 91.8 | % | 92.1 | % | 91.2 | % | 24.19 | Trader Joe's | 24 Hour Fitness, Sportsman's Warehouse, Walgreens | ||||||
Eastern Beltway Center3 | Las Vegas | 1998/2006 | 158,938 | 83,982 | 74,956 | 98.1 | % | 100.0 | % | 96.0 | % | 24.46 | Sam's Club, Wal-Mart | Office Max, Petco, Ross Dress for Less, Skechers, (Home Depot) | ||||||
Eastgate Plaza3 | Las Vegas | 2002 | 96,594 | 53,030 | 43,564 | 79.9 | % | 76.4 | % | 84.1 | % | 23.45 | (Wal-Mart) | 99 Cent Only Store, Party City | ||||||
Lowe's Plaza3 | Las Vegas | 2007 | 30,210 | — | 30,210 | 67.6 | % | — | % | 67.6 | % | 27.89 | Anytime Fitness, Starbucks, (Lowe's Home Improvement Center) | |||||||
New Hampshire | ||||||||||||||||||||
Merrimack Village Center | Merrimack | 2007 | 78,892 | 54,000 | 24,892 | 100.0 | % | 100.0 | % | 100.0 | % | 14.72 | Supervalue/Shaw's | |||||||
New Jersey | ||||||||||||||||||||
Bayonne Crossing | Bayonne | 2011 | 106,137 | 52,219 | 53,918 | 97.0 | % | 100.0 | % | 94.1 | % | 28.28 | Wal-Mart | Michaels, New York Sports Club, Lowe's Home Improvement Center | ||||||
Livingston Shopping Center | Newark | 1997 | 139,559 | 133,125 | 6,434 | 95.4 | % | 100.0 | % | — | % | 19.77 | Cost Plus, Buy Buy Baby, Nordstrom Rack, DSW, TJ Maxx, Ulta Beauty | |||||||
North Carolina | ||||||||||||||||||||
Holly Springs Towne Center - Phase I | Raleigh | 2013 | 207,566 | 109,233 | 98,333 | 92.2 | % | 100.0 | % | 83.4 | % | 16.87 | (Target) | Dick's Sporting Goods, Marshalls, Petco, Ulta Beauty, Michaels | ||||||
Holly Springs Towne Center - Phase II | Raleigh | 2016 | 145,009 | 111,843 | 33,166 | 100.0 | % | 100.0 | % | 100.0 | % | 17.98 | (Target) | Bed Bath & Beyond, DSW, AMC Theatre/Carmike, 02 Fitness | ||||||
31
Property1 | Location (MSA) | Year Built/ Renovated | Owned GLA2 | Leased % | ABR per SqFt | Grocery Anchors4 | Other Retailers4 | |||||||||||||
Total | Anchors | Shops | Total | Anchors | Shops | |||||||||||||||
Memorial Commons | Goldsboro | 2008 | 111,022 | 73,876 | 37,146 | 100.0 | % | 100.0 | % | 100.0 | % | $ | 13.26 | Harris Teeter/Kroger | Office Depot | |||||
Northcrest Shopping Center | Charlotte | 2008 | 133,674 | 65,576 | 68,098 | 95.1 | % | 100.0 | % | 90.5 | % | 22.65 | (Target) | REI Co-Op, David's Bridal, Dollar Tree, Old Navy, Five Below | ||||||
Oleander Place | Wilmington | 2012 | 45,530 | 30,144 | 15,386 | 100.0 | % | 100.0 | % | 100.0 | % | 17.03 | Whole Foods | |||||||
Parkside Town Commons - Phase I | Raleigh | 2015 | 55,390 | 22,500 | 32,890 | 100.0 | % | 100.0 | % | 100.0 | % | 24.35 | Harris Teeter/Kroger, (Target) | Petco, Guitar Center | ||||||
Parkside Town Commons - Phase II | Raleigh | 2017 | 291,713 | 191,988 | 99,725 | 97.5 | % | 100.0 | % | 92.5 | % | 19.66 | (Target) | Frank Theatres, Golf Galaxy, Hobby Lobby, Stein Mart, Chuy's, Starbucks, Panera Bread, Levity Live | ||||||
Perimeter Woods | Charlotte | 2008 | 125,646 | 105,262 | 20,384 | 100.0 | % | 100.0 | % | 100.0 | % | 21.10 | Best Buy, Off Broadway Shoes, Office Max, PetSmart, Lowe's Home Improvement Center | |||||||
Toringdon Market | Charlotte | 2004 | 60,314 | 26,072 | 34,242 | 100.0 | % | 100.0 | % | 100.0 | % | 21.49 | Earth Fare | |||||||
Ohio | ||||||||||||||||||||
Eastgate Pavilion | Cincinnati | 1995 | 236,230 | 231,730 | 4,500 | 100.0 | % | 100.0 | % | 100.0 | % | 9.15 | Best Buy, Dick's Sporting Goods, Value City Furniture, Petsmart, DSW, Bed Bath & Beyond | |||||||
Oklahoma | ||||||||||||||||||||
Belle Isle Station | Oklahoma City | 2000 | 164,407 | 92,783 | 71,624 | 98.5 | % | 100.0 | % | 96.5 | % | 17.35 | (Wal-Mart) | Shoe Carnival, Old Navy, Ross Stores, Nordstrom Rack, Babies "R" Us, Ulta Beauty | ||||||
Shops at Moore | Moore | 2010 | 260,530 | 187,916 | 72,614 | 94.7 | % | 100.0 | % | 80.9 | % | 12.16 | Bed Bath and Beyond, Best Buy, Hobby Lobby, Office Depot, PetSmart, Ross Dress for Less, (JC Penny) | |||||||
Silver Springs Pointe | Oklahoma City | 2001 | 48,474 | 20,515 | 27,959 | 79.1 | % | 100.0 | % | 63.7 | % | 15.88 | (Sam's Club), (Wal-Mart) | Kohls, Office Depot, (Home Depot) | ||||||
University Town Center | Norman | 2009 | 158,375 | 77,097 | 81,278 | 91.3 | % | 100.0 | % | 83.0 | % | 18.00 | (Target) | Office Depot, Petco, TJ Maxx, Ulta Beauty | ||||||
University Town Center Phase II | Norman | 2012 | 190,487 | 133,546 | 56,941 | 93.0 | % | 100.0 | % | 76.7 | % | 12.68 | (Target) | Academy Sports, DSW, Home Goods, Michaels, Kohls, Guitar Center | ||||||
South Carolina | ||||||||||||||||||||
Hitchcock Plaza | Augusta-Aiken | 2006 | 252,370 | 214,480 | 37,890 | 88.8 | % | 89.7 | % | 84.2 | % | 10.38 | TJ Maxx, Ross Dress for Less, Academy Sports, Bed Bath and Beyond, Farmers Home Furniture, Old Navy, Petco | |||||||
Publix at Woodruff | Greenville | 1997 | 68,055 | 47,955 | 20,100 | 100.0 | % | 100.0 | % | 100.0 | % | 11.17 | Publix | |||||||
Shoppes at Plaza Green | Greenville | 2000 | 194,807 | 172,136 | 22,671 | 94.7 | % | 94.1 | % | 100.0 | % | 13.33 | Bed Bath & Beyond, Christmas Tree Shops, Sears, Party City, Shoe Carnival, AC Moore, Old Navy | |||||||
Tennessee | ||||||||||||||||||||
Cool Springs Market | Nashville | 1995 | 230,980 | 172,712 | 58,268 | 99.5 | % | 100.0 | % | 97.9 | % | 15.78 | (Kroger) | Dick's Sporting Goods, Marshalls, Buy Buy Baby, DSW, Staples, Jo-Ann Fabric, Panera Bread | ||||||
Hamilton Crossing - Phase II & III | Alcoa | 2008 | 175,464 | 135,737 | 39,727 | 94.8 | % | 100.0 | % | 77.2 | % | 14.95 | Dicks Sporting Goods, Michaels, Old Navy, PetSmart, Ross Dress for Less | |||||||
Texas4 | ||||||||||||||||||||
Chapel Hill Shopping Center | Fort Worth | 2001 | 126,989 | 43,450 | 83,539 | 94.6 | % | 100.0 | % | 91.7 | % | 25.23 | H-E-B Grocery | The Container Store, Cost Plus World Market | ||||||
32
Property1 | Location (MSA) | Year Built/ Renovated | Owned GLA2 | Leased % | ABR per SqFt | Grocery Anchors4 | Other Retailers4 | |||||||||||||
Total | Anchors | Shops | Total | Anchors | Shops | |||||||||||||||
Colleyville Downs | Dallas | 2014 | 190,895 | 142,073 | 48,822 | 97.8 | % | 100.0 | % | 91.3 | % | $ | 12.99 | Whole Foods | Westlake Hardware, Vineyard's Antique Mall, Goody Goody Liquor, Petco | |||||
Kingwood Commons | Houston | 1999 | 164,366 | 74,836 | 89,530 | 100.0 | % | 100.0 | % | 100.0 | % | 19.99 | Randall's Food and Drug | Petco, Chico's, Talbots, Ann Taylor | ||||||
Market Street Village/ Pipeline Point | Fort Worth | 1970/2011 | 156,621 | 136,742 | 19,879 | 100.0 | % | 100.0 | % | 100.0 | % | 13.06 | Jo-Ann Fabric, Ross, Office Depot, Buy Buy Baby, Party City | |||||||
Plaza at Cedar Hill | Dallas | 2000/2010 | 302,458 | 244,065 | 58,393 | 100.0 | % | 100.0 | % | 100.0 | % | 13.34 | Sprouts Farmers Market | DSW, Ross Dress for Less, Hobby Lobby, Office Max, Marshalls, Toys “R” Us/Babies “R” Us, Home Goods | ||||||
Plaza Volente | Austin | 2004 | 156,296 | 105,000 | 51,296 | 97.2 | % | 100.0 | % | 91.4 | % | 17.41 | H-E-B Grocery | |||||||
Portofino Shopping Center | Houston | 1999/2010 | 386,647 | 218,909 | 167,738 | 95.5 | % | 100.0 | % | 89.7 | % | 19.73 | (Sam's Club) | DSW, Michaels, PGA Superstore, SteinMart, PetSmart, Old Navy, TJ Maxx, Nordstrom Rack | ||||||
Sunland Towne Centre | El Paso | 1996/2014 | 306,454 | 265,037 | 41,417 | 98.9 | % | 100.0 | % | 91.7 | % | 12.02 | Sprouts Farmers Market | PetSmart, Ross, Bed Bath & Beyond, Specs Fine Wines | ||||||
Waxahachie Crossing | Waxahachie | 2010 | 97,127 | 72,191 | 24,936 | 100.0 | % | 100.0 | % | 100.0 | % | 14.76 | Best Buy, PetSmart, Ross Dress for Less, (Home Depot), (JC Penny) | |||||||
Westside Market | Dallas | 2013 | 93,377 | 70,000 | 23,377 | 100.0 | % | 100.0 | % | 100.0 | % | 16.13 | Randall's Tom Thumb | |||||||
Utah | ||||||||||||||||||||
Draper Crossing | Salt Lake City | 2012 | 164,080 | 115,916 | 48,164 | 95.0 | % | 100.0 | % | 82.8 | % | 15.63 | Kroger/Smith's | TJ Maxx, Dollar Tree, Downeast Home | ||||||
Draper Peaks | Salt Lake City | 2012 | 227,970 | 101,464 | 126,506 | 97.6 | % | 100.0 | % | 95.6 | % | 20.14 | Michaels, Office Depot, Petco, Quilted Bear, Ross Dress for Less, (Kohl's) | |||||||
Virginia | ||||||||||||||||||||
Landstown Commons | Virginia Beach | 2007 | 397,835 | 207,300 | 190,535 | 95.1 | % | 100.0 | % | 89.7 | % | 19.31 | Ross Dress for Less, Bed Bath & Beyond, Best Buy, PetSmart, Ulta Beauty, Walgreens, AC Moore, Kirkland's, Five Below, Office Max, (Kohl's) | |||||||
Wisconsin | ||||||||||||||||||||
Village at Bay Park | Ashwaubenon | 2005 | 82,238 | 23,878 | 58,360 | 88.5 | % | 100.0 | % | 83.7 | % | 16.08 | DSW, JC Penney, Kirkland's, Chico's, Dress Barn | |||||||
Total | 14,989,433 | 10,245,806 | 4,743,627 | 94.8 | % | 96.7 | % | 90.5 | % | $ | 16.07 | |||||||||
Total Including 3-R Properties not in the Operating Portfolio | $ | 16.32 | ||||||||||||||||||
____________________ | |
1 | All properties are wholly owned, except as indicated. Unless otherwise noted, each property is owned in fee simple by the Company. |
2 | Percentage of Owned GLA Leased reflects Owned GLA/NRA leased as of December 31, 2017, except for Greyhound Commons and 54th & College. |
3 | Operating property is a joint venture. |
4 | Tenants within parentheses are non-owned. |
33
Office Operating Properties and Other
As of December 31, 2017, we owned interests in one office operating property and an associated parking garage. In addition, two of our retail properties contain stand-alone office components. Together, these properties have a total of 0.4 million square feet of net rentable area (“NRA”) office space. The following table sets forth more specific information with respect to our office, parking and other properties as of December 31, 2017:
($ in thousands, except per square foot data) | |||||||||||||||||
Property | MSA | Year Built/ Renovated | Acquired, Redeveloped or Developed | Owned NRA | Percentage Of Owned NRA Leased | Annualized Base Rent1 | Percentage of Annualized Office and Other Base Rent | Base Rent Per Leased Sq. Ft. | Major Tenants | ||||||||
Office Properties | |||||||||||||||||
Thirty South Meridian2 | Indianapolis | 1905/2002 | Redeveloped | 287,928 | 70.7 | % | $ | 3,762 | 60.7 | % | $ | 18.47 | Stifel, Kite Realty Group, Lumina Foundation | ||||
Union Station Parking Garage3 | Indianapolis | 1986 | Acquired | N/A | N/A | N/A | N/A | N/A | Denison Parking | ||||||||
Stand-alone Office Components of Retail Properties | |||||||||||||||||
Eddy Street Office (part of Eddy Street Commons)4 | South Bend | 2009 | Developed | 81,628 | 100.0 | % | 1,256 | 20.2 | % | 15.38 | University of Notre Dame Offices | ||||||
Tradition Village Office (part of Tradition Village Square)5 | Port St. Lucie | 2006 | Acquired | 24,206 | 87.4 | % | 594 | 9.6 | % | 28.05 | |||||||
Total Office Properties | 393,762 | 77.8 | % | $ | 5,611 | 90.5 | % | $ | 18.31 | ||||||||
Lessee of Land on Short Term Renewal | |||||||||||||||||
Burlington | San Antonio | 1992/2000 | Acquired | 107,400 | 100.0 | % | $ | 591 | 9.5 | % | $ | 5.50 | Burlington | ||||
107,400 | 100.0 | % | $ | 591 | 9.5 | % | $ | 5.50 | |||||||||
Total Office and Other | 501,162 | 82.6 | % | $ | 6,202 | 100.0 | % | $ | 14.99 | ||||||||
Multi-Family | |||||||||||||||||
Lake Lofts at Deerwood6 | Jacksonville | 2017 | Developed | — | — | — | — | 130 Apartment Units | |||||||||
____________________ | |
1 | Annualized Base Rent represents the monthly contractual rent for December 2017 for each applicable property, multiplied by 12. |
2 | Annualized Base Rent includes $793,117 from the Company and subsidiaries as of December 31, 2017, which is eliminated for purposes of our consolidated financial statement presentation. |
3 | The garage is managed by a third party. |
4 | The Company also owns the Eddy Street Commons retail shopping center in South Bend, Indiana, along with a parking garage that serves a hotel and the office and retail components of the property. |
5 | The Company also owns the Tradition Village Square retail shopping center in Port St. Lucie, Florida. |
6 | Lake Lofts at Deerwood has 82 leases executed as of December 31, 2017. |
34
Development Projects Under Construction
In addition to our retail and office operating properties, as of December 31, 2017, we owned interests in two development projects currently under construction. The following table sets forth more specific information with respect to the Company’s retail development properties as of December 31, 2017:
($ in thousands) | |||||||||||||||||||
Project | Company Ownership % | MSA | Projected Stabilization Date1 | Projected Owned GLA2 | Projected Total GLA3 | Percent of Owned GLA Occupied | Percent of Owned GLA Pre-Leased/ Committed | KRG Share of Total Estimated Project Cost 4 | KRG Share of Cost Incurred as of December 31, 2017 | Major Tenants and Non-owned Anchors | |||||||||
Embassy Suites at the University of Notre Dame | 35% | South Bend | Q4 2018 | 152,460 | 152,460 | NA | NA | $ | 13,895 | $ | 3,840 | Embassy Suites full-service hotel | |||||||
Eddy Street Commons at Notre Dame, IN - Phase II 5 | 100% | South Bend | Q4 2020 | 8,500 | 530,000 | — | % | — | % | $ | 8,447 | $ | 1,247 | Ground lease with multi-family developer on 450 units; 8,500 square feet of owned retail. | |||||
Total | 160,960 | 682,460 | — | % | — | % | $ | 22,342 | $ | 5,087 | |||||||||
____________________ | ||||||||||
1 | Stabilization date represents near completion of project construction and substantial occupancy of the property. | |||||||||
2 | Projected Owned GLA represents gross leasable area we project we will own. It excludes square footage that we project will be attributable to non-owned outlot structures on land owned by us and expected to be ground leased to tenants. It also excludes non-owned anchor space. | |||||||||
3 | Projected Total GLA includes Projected Owned GLA, projected square footage attributable to non-owned outlot structures on land that we own, and non-owned anchor space that currently exists or is under construction. | |||||||||
4 | Total Estimated Project Cost of $13.9 million reflects Kite's pro-rata share of the gross project cost ($45.7 million) after deducting the TIF contribution ($6 million) | |||||||||
5 | Total estimated cost of all components of Eddy Street Phase II equals $89.2 million. This consists of KRG estimated project cost ($8.4 million), Tax Increment Financing ($16.1 million), and residential apartments and townhomes to be ground subleased to unrelated third party ($64.7 million). | |||||||||
35
Under Construction Redevelopment, Reposition, and Repurpose ("3-R") Projects
In addition to our development projects, as displayed in the table above, we currently have several 3-R projects under construction. The following table sets forth more specific information with respect to our ongoing 3-R projects as of December 31, 2017 and 3-R projects completed in 2017:
($ in thousands) | ||||||
Property | Location (MSA) | Description | Projected ROI | Projected Cost | Percentage of Cost Spent | Est. Stabilized Period |
Beechwood Promenade* | Athens | Backfilling vacant anchor and shop space with Michaels, and construction of outlot for Starbucks. | 8.5% - 9.5% | $8,000 - $9,000 | 18% | 2H 2018 |
Burnt Store Marketplace* | Punta Gorda | Demolition and rebuild of a 45,000 square foot Publix under a new 20 year lease, as well as additional center upgrades. | 10.5% - 11.5% | $9,000 - $10,000 | 92% | 1H 2018 |
Centennial Center A | Las Vegas | Reposition of two retail buildings totaling 14,000 square feet, as well as Panera Bread outlot. Addition of traffic signal and other significant building/site enhancements. | 10.0% - 11.0% | $4,000 - $5,000 | 51% | 2H 2018 |
City Center* | New York City | Reactivating street-level retail components and enhancing overall shopping experience within multi-level project. | 6.5% - 7.0% | $17,000 - $17,500 | 88% | 1H 2018 |
Fishers Station* | Indianapolis | Demolition and expansion of previous anchor space and replacement with a Kroger ground lease. Center upgrades and new shop space. | 9.5% - 10.5% | $10,500 - $11,500 | 80% | 2H 2018 |
Portofino Shopping Center, Phase II | Houston | Demolition and expansion of vacant space to accommodate Nordstrom Rack; rightsizing of existing Old Navy, and relocation of shop tenants. | 8.0% - 8.5% | $6,500 - $7,000 | 69% | 1H 2018 |
Rampart Commons* | Las Vegas | Relocating, re-tenanting, and renegotiating leases as a part of new development plan. Upgrades to building façades and hardscape throughout the center. | 7.0% - 7.5% | $16,000 - $17,000 | 37% | 2H 2018 |
UNDER CONSTRUCTION REDEVELOPMENT, REPOSITION, REPURPOSE TOTALS | 8.0% - 9.0% | $71,000 - $77,000 | 64% | |||
Note: These projects are subject to various contingencies, many of which are beyond the Company's control. Projected costs and returns are based on current estimates. Actual costs and returns may not meet our expectations. | ||||||
COMPLETED PROJECTS DURING 2017 | ||||||
Property | Location (MSA) | Description | Annual Projected ROI | Cost | ||
Bolton Plaza, Phase II | Jacksonville | Replaced vacant shop space with Marshalls and a ground lease with Aldi, as well as additional center upgrades. | 10.5% | $5,217 | ||
Castleton Crossing | Indianapolis | Demolition of existing structure to create new outparcel small shop building. | 11.8% | $3,300 | ||
Centennial Gateway | Las Vegas | Retenanting 13,950 square foot anchor location to enhance overall quality of the center; also includes additional structural improvements and building upgrades. | 30.0% | $1,120 | ||
Market Street Village | Fort Worth | Retenanting 15,000 square foot anchor space with Party City. | 30.9% | $840 | ||
Northdale Promenade | Tampa | Multi-phase project involving rightsizing of an existing shop tenant to accommodate construction of new junior anchor, and the demolition of shop space to add another junior anchor, enhance space visibility, and improve overall small shop mix. | 14.4% | $4,200 | ||
Portofino Shopping Center, Phase I | Houston | Addition of two small shop buildings on outparcels. | 9.1% | $5,100 | ||
Trussville Promenade 1 | Birmingham | Replaced vacant small shops with a 22,000 square foot Ross. | 9.5% | $3,695 | ||
COMPLETED PROJECTS TOTALS | 12.3% | $23,472 | ||||
____________________ | |
1 | Refers to Trussville I |
* | Asterisk represents redevelopment assets removed from the operating portfolio. |
36
Redevelopment, Reposition, and Repurpose ("3-R") Opportunities
In addition to our 3-R projects under construction, we are currently evaluating additional redevelopment, repositioning, and repurposing opportunities at a number of operating properties.
($ in thousands) | |||
Property | Type of Project | Location (MSA) | Description |
Courthouse Shadows* | Redevelopment | Naples | Recapture of natural lease expiration; demolition of the site to add mixed use format and outparcel development. |
Hamilton Crossing Centre* | Redevelopment | Indianapolis | Recapture of lease expiration; substantially enhancing merchandising mix and replacing vacant anchor tenant. |
Centennial Center B | Reposition 1 | Las Vegas | General building enhancements to five remaining outparcels. Addition of two restaurants to anchor the small shop building. |
The Corner* | Repurpose | Indianapolis | Creation of a mixed use (retail and multi-family) development to replace an unanchored small shop center. |
Total Targeted Return | 9.0% - 11.0% | ||
Total Expected Cost | $40,000 - $56,000 | ||
____________________ | |||||
1 | Reposition refers to less substantial asset enhancements based on internal costs. | ||||
* | Asterisk represents redevelopment assets removed from the operating portfolio. | ||||
Note: | These opportunities are merely potential at this time and are subject to various contingencies, many of which are beyond the Company's control. Targeted return is based upon our current expectations of capital expenditures, budgets, anticipated leases and certain other factors relating to such opportunities. The actual return on these investments may not meet our expectations. | ||||
37
Tenant Diversification
No individual retail or office tenant accounted for more than 2.5% of the portfolio’s annualized base rent for the year ended December 31, 2017. The following table sets forth certain information for the largest 10 tenants and non-owned anchor tenants (based on total GLA) open for business or for which ground lease payments are being made at the Company’s retail properties based on minimum rents in place as of December 31, 2017:
TOP 10 RETAIL TENANTS BY GROSS LEASABLE AREA
Tenant | Number of Locations | Total GLA | Number of Leases | Company Owned GLA | Ground Lease GLA | Number of Anchor Owned Locations | Anchor Owned GLA | ||||||||||||||
Wal-Mart Stores, Inc.1 | 15 | 2,578,323 | 6 | 203,742 | 811,956 | 9 | 1,562,625 | ||||||||||||||
Target Corporation | 15 | 2,175,101 | — | — | — | 15 | 2,175,101 | ||||||||||||||
Lowe's Companies, Inc. | 14 | 2,072,666 | 5 | 128,997 | 650,161 | 9 | 1,293,508 | ||||||||||||||
Home Depot Inc. | 6 | 788,167 | 1 | — | 131,858 | 5 | 656,309 | ||||||||||||||
Kohl's Corporation | 9 | 782,386 | 5 | 184,516 | 244,010 | 4 | 353,860 | ||||||||||||||
Publix Super Markets, Inc. | 14 | 670,665 | 14 | 670,665 | — | — | — | ||||||||||||||
The TJX Companies, Inc. 2 | 22 | 656,931 | 22 | 656,931 | — | — | — | ||||||||||||||
Ross Stores, Inc. | 18 | 510,707 | 18 | 510,707 | — | — | — | ||||||||||||||
Bed Bath & Beyond, Inc. 3 | 19 | 493,719 | 19 | 493,719 | — | — | — | ||||||||||||||
Petsmart, Inc. | 19 | 390,843 | 19 | 390,843 | — | — | — | ||||||||||||||
Total | 151 | 11,119,508 | 109 | 3,240,120 | 1,837,985 | 42 | 6,041,403 | ||||||||||||||
____________________ | |
1 | Includes Sam's Club, which is owned by the same parent company. |
2 | Includes TJ Maxx (13), Home Goods (2) and Marshalls (7), all of which are owned by the same parent company. |
3 | Includes Buy Buy Baby (4), Christmas Tree Shops (1) and Cost Plus (3), all of which are owned by the same parent company. |
38
The following table sets forth certain information for the largest 25 tenants open for business at the Company’s retail properties based on minimum rents in place as of December 31, 2017:
TOP 25 TENANTS BY ANNUALIZED BASE RENT
($ in thousands, except per square foot data) | |||||||||||||||||||
Tenant | Number of Stores | Leased GLA/NRA1 | % of Owned GLA/NRA of the Portfolio | Annualized Base Rent2,3 | Annualized Base Rent per Sq. Ft.3 | % of Total Portfolio Annualized Base Rent3 | |||||||||||||
The TJX Companies, Inc.4 | 22 | 656,931 | 2.7 | % | $ | 6,833 | $ | 10.40 | 2.5 | % | |||||||||
Publix Super Markets, Inc. | 14 | 670,665 | 2.7 | % | 6,739 | 10.05 | 2.5 | % | |||||||||||
Petsmart, Inc. | 19 | 390,843 | 1.6 | % | 6,152 | 15.74 | 2.2 | % | |||||||||||
Bed Bath & Beyond, Inc.5 | 19 | 493,719 | 2.0 | % | 6,050 | 12.25 | 2.2 | % | |||||||||||
Ross Stores, Inc. | 18 | 510,707 | 2.1 | % | 5,791 | 11.34 | 2.1 | % | |||||||||||
Lowe's Companies, Inc. | 5 | 128,997 | 0.5 | % | 5,039 | 6.47 | 1.8 | % | |||||||||||
Office Depot (9) / Office Max (6) | 15 | 307,788 | 1.3 | % | 4,242 | 13.78 | 1.6 | % | |||||||||||
Dick's Sporting Goods, Inc.6 | 8 | 390,502 | 1.6 | % | 4,167 | 10.67 | 1.5 | % | |||||||||||
Nordstrom, Inc. | 6 | 197,845 | 0.8 | % | 3,995 | 20.19 | 1.5 | % | |||||||||||
Michaels Stores, Inc. | 14 | 295,066 | 1.2 | % | 3,884 | 13.16 | 1.4 | % | |||||||||||
Ascena Retail Group7 | 33 | 202,482 | 0.8 | % | 3,817 | 18.85 | 1.4 | % | |||||||||||
Wal-Mart Stores, Inc.8 | 6 | 203,742 | 0.8 | % | 3,655 | 3.60 | 1.3 | % | |||||||||||
LA Fitness | 5 | 208,209 | 0.8 | % | 3,447 | 16.56 | 1.3 | % | |||||||||||
Best Buy Co., Inc. | 6 | 213,604 | 0.9 | % | 3,069 | 14.37 | 1.1 | % | |||||||||||
Mattress Firm Holdings Corp (18) / Sleepy's (5) | 23 | 105,001 | 0.4 | % | 2,935 | 27.95 | 1.1 | % | |||||||||||
Kohl's Corporation | 5 | 184,516 | 0.8 | % | 2,927 | 6.83 | 1.1 | % | |||||||||||
Toys "R" Us, Inc.9 | 6 | 179,316 | 0.7 | % | 2,924 | 11.82 | 1.1 | % | |||||||||||
National Amusements | 1 | 80,000 | 0.3 | % | 2,898 | 36.22 | 1.1 | % | |||||||||||
Petco Animal Supplies, Inc. | 12 | 167,455 | 0.7 | % | 2,819 | 16.83 | 1.0 | % | |||||||||||
Ulta Beauty, Inc. | 12 | 127,451 | 0.5 | % | 2,559 | 20.08 | 0.9 | % | |||||||||||
DSW Inc. | 9 | 175,133 | 0.7 | % | 2,491 | 14.22 | 0.9 | % | |||||||||||
Stein Mart, Inc. | 9 | 307,222 | 1.3 | % | 2,378 | 7.74 | 0.9 | % | |||||||||||
Frank Theatres | 2 | 122,224 | 0.5 | % | 2,311 | 18.91 | 0.8 | % | |||||||||||
Hobby Lobby Stores, Inc. | 5 | 271,254 | 1.1 | % | 2,190 | 8.07 | 0.8 | % | |||||||||||
Walgreens Boots Alliance, Inc. | 4 | 67,212 | 0.3 | % | 2,099 | 31.23 | 0.8 | % | |||||||||||
TOTAL | 278 | 6,657,884 | 27.1 | % | $ | 95,412 | $ | 11.36 | 34.9 | % | |||||||||
____________________ | |
1 | Excludes the estimated size of the structures located on land owned by the Company and ground leased to tenants. |
2 | Annualized base rent represents the monthly contractual rent for December 31, 2017 for each applicable tenant multiplied by 12. Annualized base rent does not include tenant reimbursements. |
3 | Annualized base rent and percent of total portfolio includes ground lease rent. |
4 | Includes TJ Maxx (13), Marshalls (7) and HomeGoods (2), all of which are owned by the same parent company. |
5 | Includes Bed Bath and Beyond (11), Buy Buy Baby (4) Christmas Tree Shops (1) and Cost Plus (3), all of which are owned by the same parent company. |
6 | Includes Dick's Sporting Goods (7) and Golf Galaxy (1), both of which are owned by the same parent company. |
7 | Includes Ann Taylor (5), Catherine's (2), Dress Barn (11), Lane Bryant (7), Justice Stores (4) and Maurices (4), all of which are owned by the same parent company. |
8 | Includes Sam's Club, which is owned by the same parent company. |
9 | Includes Babies "R" Us (3), and Toys "R" Us/Babies "R" Us combination stores (3), both of which are owned by the same parent company. |
39
Geographic Diversification – Annualized Base Rent by Region and State
The Company owns interests in 117 operating and redevelopment properties. We also own interests in two development properties under construction. The total operating portfolio consists of approximately 16.8 million of owned square feet in 20 states. The following table summarizes the Company’s operating properties by region and state as of December 31, 2017:
($ in thousands) | |||||||||||||||||||||||||||||
Total Operating Portfolio Excluding Developments and Redevelopments | Developments and Redevelopments2 | Total Operating Portfolio Including Developments and Redevelopments | |||||||||||||||||||||||||||
Region/State | Owned GLA/NRA1 | Annualized Base Rent | Owned GLA/NRA1 | Annualized Base Rent | Number of Properties | Owned GLA/NRA1 | Annualized Base Rent - Ground Leases | Total Annualized Base Rent | Percent of Annualized Base Rent | ||||||||||||||||||||
Florida | |||||||||||||||||||||||||||||
Florida | 4,211,900 | $ | 61,602 | 220,597 | $ | 1,278 | 37 | 4,432,497 | $ | 3,885 | $ | 66,765 | 24.6% | ||||||||||||||||
Southeast | |||||||||||||||||||||||||||||
North Carolina | 1,175,864 | 21,847 | — | — | 9 | 1,175,864 | 3,745 | 25,592 | 9.4% | ||||||||||||||||||||
Georgia | 394,413 | 5,013 | 331,198 | 3,361 | 4 | 725,611 | 511 | 8,885 | 3.3% | ||||||||||||||||||||
Tennessee | 406,444 | 6,113 | — | — | 2 | 406,444 | — | 6,113 | 2.3% | ||||||||||||||||||||
South Carolina | 515,232 | 5,548 | — | — | 3 | 515,232 | — | 5,548 | 2.0% | ||||||||||||||||||||
Alabama | 463,836 | 4,267 | — | — | 1 | 463,836 | 151 | 4,418 | 1.6% | ||||||||||||||||||||
Total Southeast | 2,955,789 | 42,788 | 331,198 | 3,361 | 19 | 3,286,987 | 4,407 | 50,556 | 18.6% | ||||||||||||||||||||
Mid-Central | |||||||||||||||||||||||||||||
Texas | 1,981,230 | 31,331 | — | — | 10 | 1,981,230 | 1,082 | 32,413 | 11.9% | ||||||||||||||||||||
Oklahoma | 822,273 | 11,267 | — | — | 5 | 822,273 | 1,188 | 12,455 | 4.6% | ||||||||||||||||||||
Texas - Other | 107,400 | 591 | — | — | 1 | 107,400 | — | 591 | 0.2% | ||||||||||||||||||||
Total Mid-Central | 2,910,903 | 43,189 | — | — | 16 | 2,910,903 | 2,270 | 45,459 | 16.7% | ||||||||||||||||||||
Midwest | |||||||||||||||||||||||||||||
Indiana - Retail | 2,169,100 | 28,998 | 178,758 | 1,619 | 23 | 2,347,858 | 1,171 | 31,788 | 11.7% | ||||||||||||||||||||
Indiana - Other | 369,556 | 5,017 | 152,460 | — | 3 | 522,016 | — | 5,017 | 1.8% | ||||||||||||||||||||
Illinois | 310,879 | 4,219 | — | — | 3 | 310,879 | — | 4,219 | 1.6% | ||||||||||||||||||||
Ohio | 236,230 | 2,162 | — | — | 1 | 236,230 | — | 2,162 | 0.8% | ||||||||||||||||||||
Wisconsin | 82,238 | 1,170 | — | — | 1 | 82,238 | 381 | 1,551 | 0.6% | ||||||||||||||||||||
Total Midwest | 3,168,003 | 41,566 | 331,218 | 1,619 | 31 | 3,499,221 | 1,552 | 44,737 | 16.5% | ||||||||||||||||||||
West | |||||||||||||||||||||||||||||
Nevada | 844,942 | 18,829 | 79,455 | 1,462 | 7 | 924,397 | 3,963 | 24,254 | 8.9% | ||||||||||||||||||||
Utah | 392,050 | 6,916 | — | — | 2 | 392,050 | 68 | 6,984 | 2.6% | ||||||||||||||||||||
Arizona | 79,902 | 2,357 | — | — | 1 | 79,902 | — | 2,357 | 0.8% | ||||||||||||||||||||
Total West | 1,316,894 | 28,102 | 79,455 | 1,462 | 10 | 1,396,349 | 4,031 | 33,595 | 12.3% | ||||||||||||||||||||
Northeast | |||||||||||||||||||||||||||||
New York | — | — | 361,618 | 9,448 | 1 | 361,618 | — | 9,448 | 3.5% | ||||||||||||||||||||
New Jersey | 245,696 | 5,545 | — | — | 2 | 245,696 | 2,251 | 7,796 | 2.9% | ||||||||||||||||||||
Virginia | 397,835 | 7,302 | — | — | 1 | 397,835 | 294 | 7,596 | 2.8% | ||||||||||||||||||||
Connecticut | 205,683 | 3,250 | — | — | 1 | 205,683 | 1,034 | 4,284 | 1.6% | ||||||||||||||||||||
New Hampshire | 78,892 | 1,162 | — | — | 1 | 78,892 | 168 | 1,330 | 0.5% | ||||||||||||||||||||
Total Northeast | 928,106 | 17,259 | 361,618 | 9,448 | 6 | 1,289,724 | 3,747 | 30,454 | 11.3% | ||||||||||||||||||||
15,491,595 | $ | 234,506 | 1,324,086 | $ | 17,168 | 119 | 16,815,681 | $ | 19,892 | $ | 271,566 | 100.0% | |||||||||||||||||
____________________ | ||||||||||||||
1 | Owned GLA/NRA represents gross leasable area or net leasable area owned by the Company. It also excludes the square footage of Union Station Parking Garage. | |||||||||||||
2 | Represents the eight redevelopment and two development projects not in the retail operating portfolio. | |||||||||||||
40
Lease Expirations
In 2018, leases representing 7.1% of total annualized base rent and 6.3% of total GLA/NRA expire. The following tables show scheduled lease expirations for retail and office tenants and in-process development property tenants open for business as of December 31, 2017, assuming none of the tenants exercise renewal options.
LEASE EXPIRATION TABLE – OPERATING PORTFOLIO
($ in thousands, except per square foot data) | ||||||||||||||||||||||||
Number of Expiring Leases1 | Expiring GLA/NRA2 | % of Total GLA/NRA Expiring | Expiring Annualized Base Rent3, 4 | % of Total Annualized Base Rent | Expiring Annualized Base Rent per Sq. Ft. | Expiring Ground Lease Revenue | ||||||||||||||||||
2018 | 218 | 967,337 | 6.3 | % | $ | 17,938 | 7.1 | % | $ | 18.54 | $ | 68 | ||||||||||||
2019 | 254 | 1,692,272 | 11.0 | % | 25,225 | 10.0 | % | 14.91 | 653 | |||||||||||||||
2020 | 255 | 2,078,070 | 13.4 | % | 28,458 | 11.3 | % | 13.69 | 1,592 | |||||||||||||||
2021 | 300 | 1,779,909 | 11.5 | % | 29,724 | 11.8 | % | 16.70 | 911 | |||||||||||||||
2022 | 314 | 2,167,081 | 14.0 | % | 36,769 | 14.6 | % | 16.97 | 1,240 | |||||||||||||||
2023 | 227 | 1,915,798 | 12.4 | % | 32,155 | 12.8 | % | 16.78 | 1,979 | |||||||||||||||
2024 | 101 | 902,748 | 5.8 | % | 16,589 | 6.6 | % | 18.38 | 288 | |||||||||||||||
2025 | 82 | 776,566 | 5.0 | % | 13,604 | 5.4 | % | 17.52 | 806 | |||||||||||||||
2026 | 80 | 767,131 | 5.0 | % | 11,292 | 4.5 | % | 14.72 | 1,320 | |||||||||||||||
2027 | 83 | 793,480 | 5.1 | % | 12,671 | 5.0 | % | 15.97 | 358 | |||||||||||||||
Beyond | 92 | 1,613,068 | 10.5 | % | 27,250 | 10.8 | % | 16.89 | 10,678 | |||||||||||||||
2,006 | 15,453,460 | 100.0 | % | $ | 251,674 | 100.0 | % | $ | 16.29 | $ | 19,892 | |||||||||||||
____________________ | |
1 | Lease expiration table reflects rents in place as of December 31, 2017 and does not include option periods; 2018 expirations include 15 month-to-month tenants. This column also excludes ground leases. |
2 | Expiring GLA excludes estimated square footage attributable to non-owned structures on land owned by the Company and ground leased to tenants. |
3 | Annualized base rent represents the monthly contractual rent for December 2017 for each applicable tenant multiplied by 12. Excludes tenant reimbursements and ground lease revenue. |
4 | 55% of our annualized base rent is generated from tenants less than 16,000 square feet. |
41
LEASE EXPIRATION TABLE – RETAIL ANCHOR TENANTS1
($ in thousands, except per square foot data) | ||||||||||||||||||||||||
Number of Expiring Leases2 | Expiring GLA/NRA3 | % of Total GLA/NRA Expiring | Expiring Annualized Base Rent4 | % of Total Annualized Base Rent | Expiring Annualized Base Rent per Sq. Ft. | Expiring Ground Lease Revenue | ||||||||||||||||||
2018 | 18 | 482,006 | 3.1 | % | $ | 5,432 | 2.2 | % | $ | 11.27 | $ | — | ||||||||||||
2019 | 34 | 1,103,859 | 7.1 | % | 10,789 | 4.3 | % | 9.77 | — | |||||||||||||||
2020 | 39 | 1,538,271 | 10.0 | % | 15,534 | 6.2 | % | 10.10 | 1,111 | |||||||||||||||
2021 | 43 | 1,112,245 | 7.2 | % | 12,925 | 5.1 | % | 11.62 | 318 | |||||||||||||||
2022 | 53 | 1,434,297 | 9.3 | % | 18,204 | 7.2 | % | 12.69 | 745 | |||||||||||||||
2023 | 46 | 1,244,074 | 8.1 | % | 17,651 | 7.0 | % | 14.19 | 1,454 | |||||||||||||||
2024 | 21 | 593,523 | 3.8 | % | 9,191 | 3.7 | % | 15.49 | — | |||||||||||||||
2025 | 20 | 511,713 | 3.3 | % | 7,112 | 2.8 | % | 13.90 | 381 | |||||||||||||||
2026 | 16 | 512,101 | 3.3 | % | 4,972 | 2.0 | % | 9.71 | 750 | |||||||||||||||
2027 | 20 | 570,380 | 3.7 | % | 6,839 | 2.7 | % | 11.99 | — | |||||||||||||||
Beyond | 37 | 1,401,881 | 9.1 | % | 21,699 | 8.6 | % | 15.48 | 6,377 | |||||||||||||||
347 | 10,504,350 | 68.0 | % | $ | 130,347 | 51.8 | % | $ | 12.41 | $ | 11,135 | |||||||||||||
____________________ | |
1 | Retail anchor tenants are defined as tenants that occupy 10,000 square feet or more. |
2 | Lease expiration table reflects rents in place as of December 31, 2017 and does not include option periods. |
3 | Expiring GLA excludes square footage for non-owned ground lease structures on land we own and ground leased to tenants. |
4 | Annualized base rent represents the monthly contractual rent for December 2017 for each applicable tenant multiplied by 12. Excludes tenant reimbursements and ground lease revenue. |
LEASE EXPIRATION TABLE – RETAIL SHOPS
($ in thousands, except per square foot data) | |||||||||||||||||||||
Number of Expiring Leases1 | Expiring GLA/NRA2 | % of Total GLA/NRA Expiring | Expiring Annualized Base Rent3 | % of Total Annualized Base Rent | Expiring Annualized Base Rent per Sq. Ft. | Expiring Ground Lease Revenue | |||||||||||||||
2018 | 199 | 474,533 | 3.1% | $ | 12,260 | 4.9% | $ | 25.84 | $ | 68 | |||||||||||
2019 | 219 | 583,160 | 3.8% | 14,335 | 5.7% | 24.58 | 653 | ||||||||||||||
2020 | 214 | 526,488 | 3.4% | 12,667 | 5.0% | 24.06 | 481 | ||||||||||||||
2021 | 254 | 658,665 | 4.3% | 16,570 | 6.6% | 25.16 | 593 | ||||||||||||||
2022 | 256 | 667,764 | 4.3% | 17,302 | 6.9% | 25.91 | 495 | ||||||||||||||
2023 | 176 | 521,876 | 3.4% | 13,038 | 5.2% | 24.98 | 525 | ||||||||||||||
2024 | 77 | 234,999 | 1.5% | 6,197 | 2.5% | 26.37 | 288 | ||||||||||||||
2025 | 58 | 178,174 | 1.2% | 5,074 | 2.0% | 28.48 | 425 | ||||||||||||||
2026 | 64 | 255,030 | 1.7% | 6,320 | 2.5% | 24.78 | 570 | ||||||||||||||
2027 | 62 | 213,946 | 1.4% | 5,562 | 2.2% | 26.00 | 358 | ||||||||||||||
Beyond | 55 | 211,187 | 1.4% | 5,550 | 2.2% | 26.28 | 4,301 | ||||||||||||||
1,634 | 4,525,822 | 29.3% | $ | 114,874 | 45.6% | $ | 25.38 | $ | 8,757 | ||||||||||||
____________________ | |
1 | Lease expiration table reflects rents in place as of December 31, 2017, and does not include option periods; 2018 expirations include 15 month-to-month tenants. This column also excludes ground leases. |
2 | Expiring GLA excludes estimated square footage attributable to non-owned structures on land we own and ground leased to tenants. |
3 | Annualized base rent represents the monthly contractual rent for December 2017 for each applicable tenant multiplied by 12. Excludes tenant reimbursements and ground lease revenue. |
42
LEASE EXPIRATION TABLE – OFFICE TENANTS
($ in thousands, except per square foot data) | |||||||||||||||||
Number of Expiring Leases1 | Expiring GLA/NRA1 | % of Total GLA/NRA Expiring | Expiring Annualized Base Rent2 | % of Total Annualized Base Rent | Expiring Annualized Base Rent per Sq. Ft. | ||||||||||||
2018 | 1 | 10,798 | 0.1% | $ | 246 | 0.1% | $ | 22.81 | |||||||||
2019 | 1 | 5253 | —% | 101 | —% | 19.25 | |||||||||||
2020 | 2 | 13,311 | 0.1% | 256 | 0.1% | 19.25 | |||||||||||
2021 | 3 | 8,999 | 0.1% | 229 | 0.1% | 25.49 | |||||||||||
2022 | 5 | 65,020 | 0.4% | 1,263 | 0.5% | 19.43 | |||||||||||
2023 | 5 | 149,848 | 1.0% | 1,466 | 0.6% | 9.79 | |||||||||||
20243 | 3 | 74,226 | 0.5% | 1,201 | 0.5% | 16.19 | |||||||||||
2025 | 4 | 86,679 | 0.6% | 1,418 | 0.6% | 16.36 | |||||||||||
2026 | — | — | —% | — | —% | — | |||||||||||
2027 | 1 | 9,154 | 0.1% | 270 | 0.1% | 29.50 | |||||||||||
Beyond | — | — | —% | — | —% | — | |||||||||||
25 | 423,288 | 2.7% | $ | 6,452 | 2.6% | $ | 15.24 | ||||||||||
____________________ | |
1 | Lease expiration table reflects rents in place as of December 31, 2017 and does not include option periods. This column also excludes ground leases. |
2 | Annualized base rent represents the monthly contractual rent for December 2017 for each applicable tenant multiplied by 12. Excludes tenant reimbursements. |
3 | Expiring annualized base rent includes $0.7 million from Kite Realty Group and subsidiaries. |
Lease Activity – New and Renewal
In 2017, the Company executed new and renewal leases on 393 individual spaces totaling 2,311,632 square feet. New leases were signed on 170 individual spaces for 521,621 square feet of GLA, while renewal leases were signed on 223 individual spaces for 1,790,011 square feet of GLA.
For comparable signed leases, which are defined as leases signed for which there was a former tenant within the last 12 months, we achieved a blended rent spread of 9.0% while incurring $8.80 per square foot of incremental capital improvement costs. The average rents for the 75 new comparable leases that were signed on individual spaces in 2017 were $21.44 per square foot compared to average expiring rents of $17.43 per square foot. The average rents for the 223 renewals signed on individual spaces in 2017 were $16.81 per square foot compared to average expiring rents of $15.77 per square foot. Further, average leasing costs for new comparable leases signed in 2017 were $55.29 per square foot, while there were minimal leasing costs incurred for renewal leases.
ITEM 3. LEGAL PROCEEDINGS
We are not subject to any material litigation nor, to management’s knowledge, is any material litigation currently threatened against us. We are parties to routine litigation, claims, and administrative proceedings arising in the ordinary course of business. Management believes that such matters will not have a material adverse impact on our consolidated financial condition, results of operations or cash flows taken as a whole.
ITEM 4. MINE SAFETY DISCLOSURES
Not applicable.
43
PART II
ITEM 5. MARKET FOR REGISTRANT’S COMMON EQUITY, RELATED SHAREHOLDER MATTERS AND ISSUER PURCHASES OF EQUITY SECURITIES
Market Information
Our common shares are currently listed and traded on the NYSE under the symbol “KRG.” On February 16, 2018, the closing price of our common shares on the NYSE was $15.48.
The following table sets forth, for the periods indicated, the high and low prices for our common shares:
Quarter Ended December 31, 2017 | $ | 20.71 | $ | 18.10 | ||||
Quarter Ended September 30, 2017 | $ | 21.57 | $ | 18.16 | ||||
Quarter Ended June 30, 2017 | $ | 22.34 | $ | 17.60 | ||||
Quarter Ended March 31, 2017 | $ | 24.52 | $ | 19.91 | ||||
Quarter Ended December 31, 2016 | $ | 27.69 | $ | 22.50 | ||||
Quarter Ended September 30, 2016 | $ | 30.45 | $ | 27.04 | ||||
Quarter Ended June 30, 2016 | $ | 30.00 | $ | 25.58 | ||||
Quarter Ended March 31, 2016 | $ | 28.32 | $ | 23.75 | ||||
Holders
The number of registered holders of record of our common shares was 1,274 as of February 16, 2018. This total excludes beneficial or non-registered holders that held their shares through various brokerage firms. This figure does not represent the actual number of beneficial owners of our common shares because our common shares are frequently held in “street name” by securities dealers and others for the benefit of beneficial owners who may vote the shares.
Distributions
Our Board of Trustees declared the following cash distributions per share to our common shareholders for the periods indicated:
Quarter | Record Date | Distribution Per Share | Payment Date | |||||
4th 2017 | January 5, 2018 | $ | 0.3175 | January 12, 2018 | ||||
3rd 2017 | October 6, 2017 | $ | 0.3025 | October 13, 201 | ||||
2nd 2017 | July 6, 2017 | $ | 0.3025 | July 13, 2017 | ||||
1st 2017 | April 6, 2017 | $ | 0.3025 | April 13, 2017 | ||||
4th 2016 | January 6, 2017 | $ | 0.3025 | January 13, 2017 | ||||
3rd 2016 | October 6, 2016 | $ | 0.2875 | October 13, 2016 | ||||
2nd 2016 | July 7, 2016 | $ | 0.2875 | July 14, 2016 | ||||
1st 2016 | April 6, 2016 | $ | 0.2875 | April 13, 2016 | ||||
Our management and Board of Trustees will continue to evaluate our distribution policy on a quarterly basis as they monitor the capital markets and the impact of the economy on our operations.
Future distributions, if any, will be declared and paid at the discretion of our Board of Trustees and will depend upon a number of factors, including cash generated by operating activities, our financial condition, capital requirements, annual distribution requirements under the REIT provisions of the Code, and such other factors as our Board of Trustees deem relevant.
Distributions by us to the extent of our current and accumulated earnings and profits for federal income tax purposes will be taxable to shareholders as either ordinary dividend income or capital gain income if so declared by us. Distributions in excess
of taxable earnings and profits generally will be treated as a non-taxable return of capital. These distributions, to the extent that they do not exceed the shareholder’s adjusted tax basis in its common shares, have the effect of deferring taxation until the sale of a shareholder’s common shares. To the extent that distributions are both in excess of taxable earnings and profits and in excess of the shareholder’s adjusted tax basis in its common shares, the distribution will be treated as gain from the sale of common shares. In order to maintain our qualification as a REIT, we must make annual distributions to shareholders of at least 90% of our “REIT taxable income” (determined before the deduction for dividends paid and excluding net capital gains) and we must make distributions to shareholders equal to 100% of our net taxable income to eliminate federal income tax liability. Under certain circumstances, we could be required to make distributions in excess of cash available for distributions in order to meet such requirements. For the taxable year ended December 31, 2017, approximately 24% of our distributions to shareholders constituted a return of capital, approximately 65% constituted taxable ordinary income dividends and approximately 11% constituted taxable capital gains.
Under our unsecured revolving credit facility, we are permitted to make distributions to our shareholders that do not exceed 95% of our Funds From Operations (“FFO”) provided that no event of default exists. If an event of default exists, we may only make distributions sufficient to maintain our REIT status. However, we may not make any distributions if any event of default resulting from nonpayment or bankruptcy exists, or if our obligations under the unsecured revolving credit facility are accelerated.
Issuer Repurchases; Unregistered Sales of Securities
During the three months ended December 31, 2017, we did not repurchase any of our common shares, and none of our employees surrendered common shares owned by them to satisfy their statutory minimum federal and state tax obligations associated with the vesting of restricted common shares of beneficial interest issued under our 2013 Equity Incentive Plan. We did not sell any unregistered securities during 2017.
Issuances Under Equity Compensation Plans
For information regarding the securities authorized for issuance under our equity compensation plans, see Item 12 of this Annual Report on Form 10-K.
Performance Graph
Notwithstanding anything to the contrary set forth in any of our filings under the Securities Act or the Exchange Act that might incorporate SEC filings, in whole or in part, the following performance graph will not be incorporated by reference into any such filings.
The following graph compares the cumulative total shareholder return of our common shares for the period from December 31, 2012 to December 31, 2017, to the S&P 500 Index and to the published NAREIT All Equity REIT Index over the same period. The graph assumes that the value of the investment in our common shares and each index was $100 at December 31, 2012 and that all cash distributions were reinvested. The shareholder return shown on the graph below is not indicative of future performance.
45
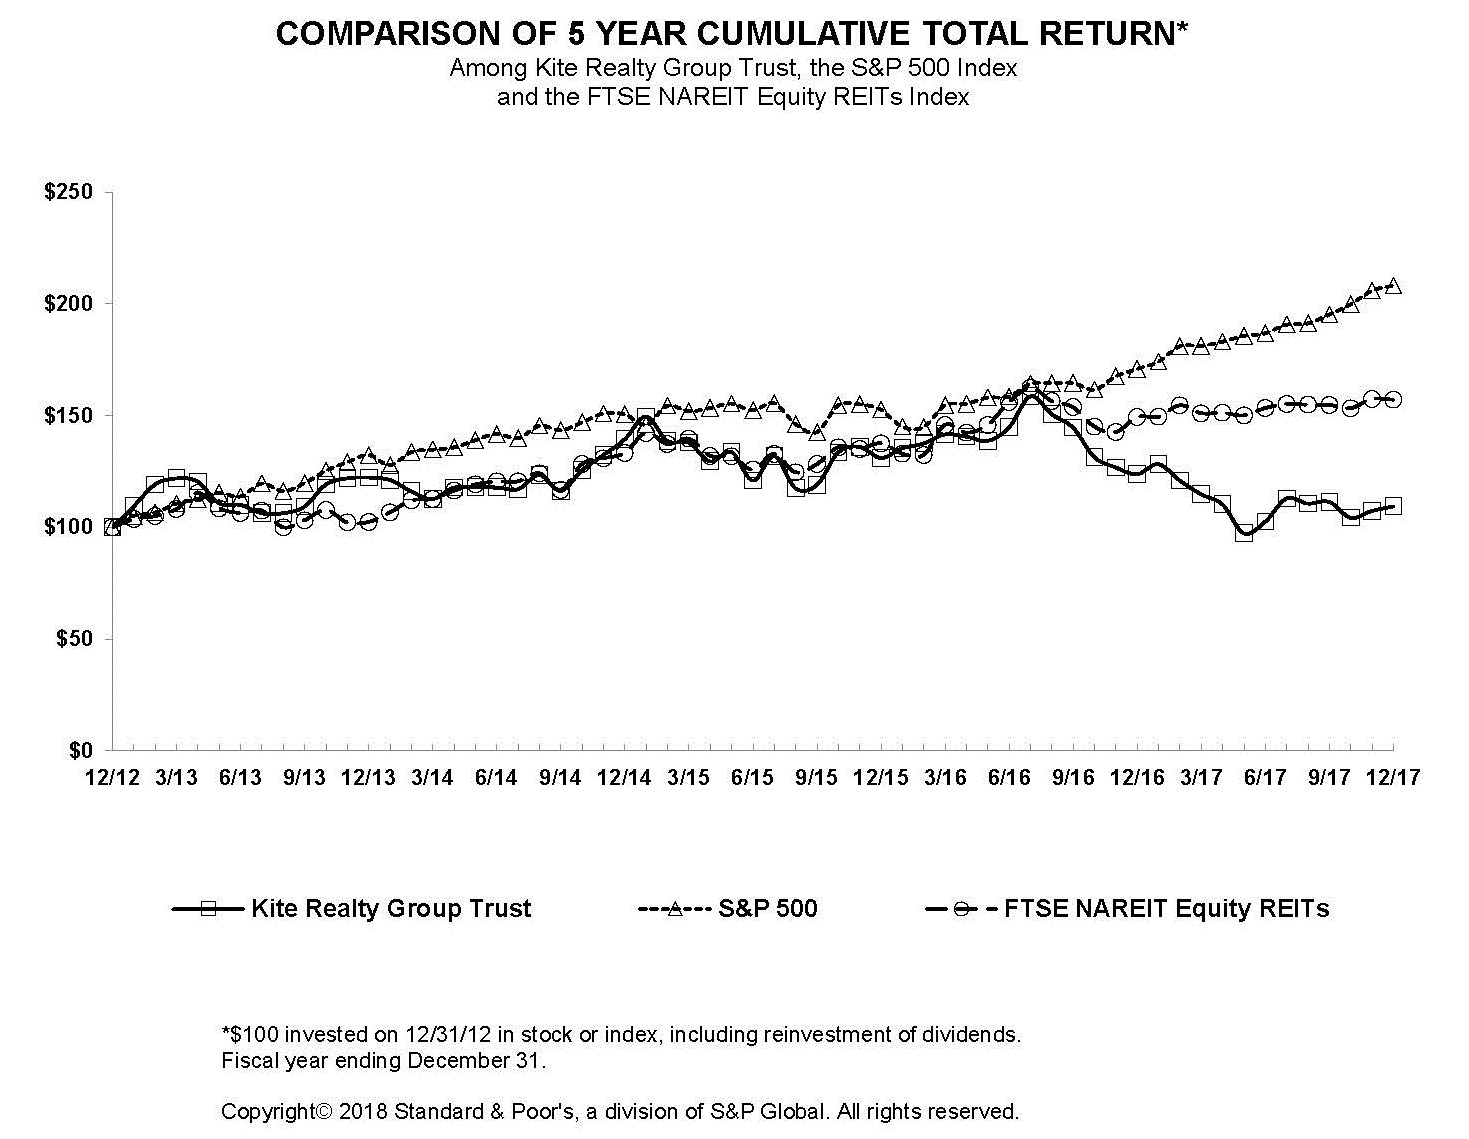 |
12/12 | 6/13 | 12/13 | 6/14 | 12/14 | 6/15 | 12/15 | 6/16 | 12/16 | 6/17 | 12/17 | |||||||||||||||||||||||
Kite Realty Group Trust | 100.00 | 110.04 | 122.30 | 117.86 | 139.42 | 120.94 | 131.06 | 144.71 | 123.78 | 102.51 | 109.41 | ||||||||||||||||||||||
S&P 500 | 100.00 | 113.82 | 132.39 | 141.84 | 150.51 | 152.36 | 152.59 | 158.45 | 170.84 | 186.80 | 208.14 | ||||||||||||||||||||||
FTSE NAREIT Equity REITs | 100.00 | 106.49 | 102.47 | 120.56 | 133.35 | 125.78 | 137.61 | 156.02 | 149.33 | 153.37 | 157.14 | ||||||||||||||||||||||
ITEM 6. SELECTED FINANCIAL DATA
The following tables set forth, on a historical basis, selected unaudited financial and operating information. The financial information has been derived from our consolidated balance sheets and statements of operations. The share and per share information has been restated for the effects of our one-for-four reverse share split that occurred in August 2014. This information should be read in conjunction with our audited consolidated financial statements and Item 7, “Management’s Discussion and Analysis of Financial Condition and Results of Operations” appearing elsewhere in this Annual Report on Form 10-K.
($ in thousands, except per share data) | Year Ended December 31 (Unaudited) | |||||||||||||||||||
20171 | 20162 | 20153 | 20144 | 20135 | ||||||||||||||||
Operating Data: | ||||||||||||||||||||
46
Revenues: | ||||||||||||||||||||
Rental related revenue | $ | 358,442 | $ | 354,122 | $ | 347,005 | $ | 259,528 | $ | 129,488 | ||||||||||
Fee income | 377 | — | — | — | — | |||||||||||||||
Total revenues | 358,819 | 354,122 | 347,005 | 259,528 | 129,488 | |||||||||||||||
Expenses: | ||||||||||||||||||||
Property operating | 49,643 | 47,923 | 49,973 | 38,703 | 21,729 | |||||||||||||||
Real estate taxes | 43,180 | 42,838 | 40,904 | 29,947 | 15,263 | |||||||||||||||
General, administrative, and other | 21,749 | 20,603 | 18,709 | 13,043 | 8,211 | |||||||||||||||
Transaction costs | — | 2,771 | 1,550 | 27,508 | 2,214 | |||||||||||||||
Non-cash gain from release of assumed earnout liability | — | — | (4,832 | ) | — | — | ||||||||||||||
Impairment charge | 7,411 | — | 1,592 | — | — | |||||||||||||||
Depreciation and amortization | 172,091 | 174,564 | 167,312 | 120,998 | 54,479 | |||||||||||||||
Total expenses | 294,074 | 288,699 | 275,208 | 230,199 | 101,896 | |||||||||||||||
Operating income | 64,745 | 65,423 | 71,797 | 29,329 | 27,592 | |||||||||||||||
Interest expense | (65,702 | ) | (65,577 | ) | (56,432 | ) | (45,513 | ) | (27,994 | ) | ||||||||||
Income tax benefit (expense) of taxable REIT subsidiary | 100 | (814 | ) | (186 | ) | (24 | ) | (262 | ) | |||||||||||
Non-cash gain on debt extinguishment | — | — | 5,645 | — | — | |||||||||||||||
Gain on settlement | — | — | 4,520 | — | — | |||||||||||||||
Other expense, net | (415 | ) | (169 | ) | (95 | ) | (244 | ) | (62 | ) | ||||||||||
(Loss) income from continuing operations | (1,272 | ) | (1,137 | ) | 25,249 | (16,452 | ) | (726 | ) | |||||||||||
Discontinued operations: | ||||||||||||||||||||
Income from operations, excluding impairment charge | — | — | — | — | 834 | |||||||||||||||
Impairment charge | — | — | — | — | (5,372 | ) | ||||||||||||||
Non-cash gain on debt extinguishment | — | — | — | — | 1,242 | |||||||||||||||
Gains on sale of operating properties | — | — | — | 3,198 | 487 | |||||||||||||||
Income (loss) from discontinued operations | — | — | — | 3,198 | (2,809 | ) | ||||||||||||||
(Loss) income before gain on sale of operating properties | (1,272 | ) | (1,137 | ) | 25,249 | (13,254 | ) | (3,535 | ) | |||||||||||
Gains on sale of operating properties, net | 15,160 | 4,253 | 4,066 | 8,578 | — | |||||||||||||||
Consolidated net income (loss) | 13,888 | 3,116 | 29,315 | (4,676 | ) | (3,535 | ) | |||||||||||||
Net (income) loss attributable to noncontrolling interests: | (2,014 | ) | (1,933 | ) | (2,198 | ) | (1,025 | ) | 685 | |||||||||||
Net income (loss) attributable to Kite Realty Group Trust: | 11,874 | 1,183 | 27,117 | (5,701 | ) | (2,850 | ) | |||||||||||||
Dividends on preferred shares | — | — | (7,877 | ) | (8,456 | ) | (8,456 | ) | ||||||||||||
Non-cash adjustment for redemption of preferred shares | — | — | (3,797 | ) | — | — | ||||||||||||||
Net income (loss) attributable to common shareholders | $ | 11,874 | $ | 1,183 | $ | 15,443 | $ | (14,157 | ) | $ | (11,306 | ) | ||||||||
Income (loss) per common share – basic: | ||||||||||||||||||||
Income (loss) from continuing operations attributable to Kite Realty Group Trust common shareholders | $ | 0.14 | $ | 0.01 | $ | 0.19 | $ | (0.29 | ) | $ | (0.37 | ) | ||||||||
Income (loss) from discontinued operations attributable to Kite Realty Group Trust common shareholders | — | — | — | 0.05 | (0.11 | ) | ||||||||||||||
Net income (loss) attributable to Kite Realty Group Trust common shareholders | $ | 0.14 | $ | 0.01 | $ | 0.19 | $ | (0.24 | ) | $ | (0.48 | ) | ||||||||
Income (loss) per common share – diluted: | ||||||||||||||||||||
Income (loss) from continuing operations attributable to Kite Realty Group Trust common shareholders | $ | 0.14 | $ | 0.01 | $ | 0.18 | $ | (0.29 | ) | $ | (0.37 | ) | ||||||||
Income (loss) from discontinued operations attributable to Kite Realty Group Trust common shareholders | — | — | — | 0.05 | (0.11 | ) | ||||||||||||||
Net income (loss) attributable to Kite Realty Group Trust common shareholders | $ | 0.14 | $ | 0.01 | $ | 0.18 | $ | (0.24 | ) | $ | (0.48 | ) | ||||||||
Weighted average Common Shares outstanding – basic | 83,585,333 | 83,436,511 | 83,421,904 | 58,353,448 | 23,535,434 | |||||||||||||||
Weighted average Common Shares outstanding – diluted | 83,690,418 | 83,465,500 | 83,534,381 | 58,353,448 | 23,535,434 | |||||||||||||||
Distributions declared per Common Share | $ | 1.2250 | $ | 1.1700 | $ | 1.0900 | $ | 1.0200 | $ | 0.9600 | ||||||||||
Net income (loss) attributable to Kite Realty Group Trust common shareholders: | ||||||||||||||||||||
Income (loss) from continuing operations6 | $ | 11,874 | $ | 1,183 | $ | 15,443 | $ | (17,268 | ) | $ | (8,686 | ) | ||||||||
Income (loss) from discontinued operations | — | — | — | 3,111 | (2,620 | ) | ||||||||||||||
Net income (loss) attributable to Kite Realty Group Trust common shareholders | $ | 11,874 | $ | 1,183 | $ | 15,443 | $ | (14,157 | ) | $ | (11,306 | ) | ||||||||
47
____________________ | |
1 | In 2017, we disposed of four operating properties. The operations of these properties are not reflected as discontinued operations as none of the disposals individually, nor in the aggregate, represent a strategic shift that has or will have a major effect on our operations and financial results. |
2 | In 2016, we disposed of two operating properties. The operations of these properties are not reflected as discontinued operations as none of the disposals individually, nor in the aggregate, represent a strategic shift that has or will have a major effect on our operations and financial results. |
3 | In 2015, we disposed of nine operating properties. The operations of these properties are not reflected as discontinued operations as none of the disposals individually, nor in the aggregate, represent a strategic shift that has or will have a major effect on our operations and financial results. |
4 | In 2014, we disposed of a number of operating properties. Of our 2014 disposals, the only property’s operations reflected as discontinued operations for each of the years presented is 50th and 12th, as the other disposals individually or in the aggregate did not represent a strategic shift that has or will have a major effect on our operations and financial results. Further, the 50th and 12th operating property is included in discontinued operations, as the property was classified as held for sale as of December 31, 2013. |
5 | In 2013, we disposed of the following properties: Cedar Hill Village and Kedron Village. The operations of these properties are reflected as discontinued operations for each of the years presented above. |
6 | Includes gain on sale of operating properties and preferred dividends. |
($ in thousands) | As of December 31 | |||||||||||||||||||
2017 | 2016 | 2015 | 2014 | 2013 | ||||||||||||||||
Balance Sheet Data (Unaudited): | ||||||||||||||||||||
Investment properties, net | $ | 3,293,270 | $ | 3,435,382 | $ | 3,500,845 | $ | 3,417,655 | $ | 1,644,478 | ||||||||||
Cash and cash equivalents | 24,082 | 19,874 | 33,880 | 43,826 | 18,134 | |||||||||||||||
Assets held for sale | — | — | — | 179,642 | — | |||||||||||||||
Total assets | 3,512,498 | 3,656,371 | 3,756,428 | 3,866,413 | 1,758,179 | |||||||||||||||
Mortgage and other indebtedness | 1,699,239 | 1,731,074 | 1,724,449 | 1,546,460 | 851,396 | |||||||||||||||
Liabilities held for sale | — | — | — | 81,164 | — | |||||||||||||||
Total liabilities | 1,874,285 | 1,923,940 | 1,937,364 | 1,839,183 | 957,146 | |||||||||||||||
Limited partners' interests in Operating Partnership and other redeemable noncontrolling interests | 72,104 | 88,165 | 92,315 | 125,082 | 43,928 | |||||||||||||||
Kite Realty Group Trust shareholders’ equity | 1,565,411 | 1,643,574 | 1,725,976 | 1,898,784 | 753,557 | |||||||||||||||
Noncontrolling interests | 698 | 692 | 773 | 3,364 | 3,548 | |||||||||||||||
Total liabilities and equity | 3,512,498 | 3,656,371 | 3,756,428 | 3,866,413 | 1,758,179 | |||||||||||||||
ITEM 7. MANAGEMENT’S DISCUSSION AND ANALYSIS OF FINANCIAL CONDITION AND RESULTS OF OPERATIONS
The following discussion should be read in conjunction with the accompanying audited consolidated financial statements and related notes thereto and Item 1A, “Risk Factors,” appearing elsewhere in this Annual Report on Form 10-K. In this discussion, unless the context suggests otherwise, references to “our Company,” “we,” “us,” and “our” mean Kite Realty Group Trust and its direct and indirect subsidiaries, including Kite Realty Group, L.P.
Overview
In the following overview, we discuss, among other things, the status of our business and properties, the effect that current United States economic conditions is having on our retail tenants and us, and the current state of the financial markets and how it impacts our financing strategy.
Our Business and Properties
Kite Realty Group Trust is a publicly-held real estate investment trust which, through its majority-owned subsidiary, Kite Realty Group, L.P., owns interests in various operating subsidiaries and joint ventures engaged in the ownership, operation, acquisition, development, and redevelopment of high-quality neighborhood and community shopping centers in selected markets in the United States. We derive revenues primarily from activities associated with the collection of contractual rents and reimbursement payments from tenants at our properties. Our operating results therefore depend materially on, among other things, the ability of our tenants to make required lease payments, the health and resilience of the United States retail sector, interest rate volatility, job growth and overall economic and real estate market conditions.
48
As of December 31, 2017, we owned interests in 117 operating and redevelopment properties totaling approximately 23.3 million square feet. We also owned two development projects under construction as of this date.
Portfolio Update
In evaluating acquisition, development, and redevelopment opportunities, we look for strong sub-markets where average household income is above the broader market average. We also focus on locations with population density, high traffic counts, and strong daytime workforce populations. Household incomes in our largest sub-markets are significantly higher than the medians for those broader markets.
In 2017, we transitioned the Parkside Town Commons – Phase II development project to the operating portfolio. We completed construction on our expansion of Holly Springs Towne Center – Phase II and began construction on Eddy Street Commons – Phase II, which includes an Embassy Suites hotel. The hotel is owned by a unconsolidated joint venture in which we own a 35% interest. Our 3-R initiative, which includes a total of 11 existing and potential projects, continued to progress in 2017. Seven of these projects are under construction with total estimated costs of $71 million to $77 million and estimated combined returns of 8% to 9%. There are four additional potential projects with estimated costs of $40 million to $56 million and potential estimated returns of 9.0% to 11.0%. We completed construction on seven 3-R projects in 2017: Bolton Plaza, Castleton Crossing, Centennial Gateway, Market Street Village, Northdale Promenade, Portofino Shopping Center, and Trussville Promenade with total costs of $23.5 million and an estimated combined return of 12.3%.
In addition to targeting sub-markets with strong consumer demographics, we focus on having the most desirable tenant mix at each center. We have aggressively targeted and executed leases with notable grocers including Kroger, Aldi, Publix and Trader Joe's, expanding discount retailers such as Hobby Lobby, Marshalls and Ross Dress for Less, service and restaurant retailers such as Starbucks, North Italia and Flower Child and other retailers such as Ulta, Party City and Tempurpedic. Additionally, we have identified cost-efficient ways to relocate, re-tenant and renegotiate leases at several of our properties allowing us to attract more suitable tenants. In addition, many of our redevelopment and 3-R projects include consolidating small shop space to accommodate construction of new junior anchor space.
Capital and Financing Activities
Our ability to obtain capital on satisfactory terms and to refinance borrowings as they mature is affected by the condition of the economy in general and by the financial strength of properties securing borrowings.
Throughout 2017, we were able to maintain our strong balance sheet, financial flexibility and liquidity to fund future growth. We ended the year with approximately $398 million of combined cash and borrowing capacity on our unsecured revolving credit facility. In addition, as of December 31, 2017, we have approximately $82.4 million of debt maturities through December 31, 2020.
The amount that we may borrow under our unsecured revolving credit facility is limited by the value of the assets in our unencumbered asset pool. As of December 31, 2017, the value of the assets in our unencumbered asset pool was $1.4 billion.
The investment grade credit ratings we have received provide us with access to the unsecured public bond market, which we may continue to use in the future to finance acquisition activity, repay maturing debt and fix interest rates.
Summary of Critical Accounting Policies and Estimates
Our significant accounting policies are more fully described in Note 2 to the accompanying consolidated financial statements. As disclosed in Note 2, the preparation of financial statements in accordance with GAAP requires management to make estimates and assumptions about future events that affect the amounts reported in the financial statements and accompanying notes. Actual results could differ from those estimates. We believe that the following discussion addresses our most critical accounting policies, which are those that are most important to the compilation of our financial condition and results of operations and require management’s most difficult, subjective, and complex judgments.
Valuation of Investment Properties
Management reviews operational and development projects, land parcels and intangible assets for impairment on at least a quarterly basis or whenever events or changes in circumstances indicate that the carrying value of the asset may not be recoverable. The review for possible impairment requires management to make certain assumptions and estimates and requires significant judgment. Impairment losses for investment properties and intangible assets are measured when the undiscounted cash flows
49
estimated to be generated by the investment properties during the expected holding period are less than the carrying amounts of those assets. Impairment losses are recorded as the excess of the carrying value over the estimated fair value of the asset. Our impairment review for land and development properties assumes we have the intent and the ability to complete the developments or projected uses for the land parcels. If we determine those plans will not be completed or our assumptions with respect to operating assets are not realized, an impairment loss may be appropriate.
Depreciation may be accelerated for a redevelopment project, including partial demolition of existing structures after the asset is assessed for impairment.
Operating properties will be classified as held for sale only when those properties are available for immediate sale in their present condition and for which management believes it is probable that a sale of the property will be completed within one year, among other factors. Operating properties classified as held for sale are carried at the lower of cost or fair value less estimated costs to sell. Depreciation and amortization are suspended during the held-for-sale period.
Our operating properties have operations and cash flows that can be clearly distinguished from the rest of our activities. Historically, the operations reported in discontinued operations include those operating properties that were sold or were considered held for sale and for which operations and cash flows can be clearly distinguished. The operations from these properties are eliminated from ongoing operations, and we will not have a continuing involvement after disposition. In 2014, we adopted the provisions of ASU 2014-08, Presentation of Financial Statements (Topic 205) and Property, Plant, and Equipment (Topic 360): Reporting Discontinued Operations and Disclosures of Disposals of Components of an Entity, which will result in fewer real estate sales being classified within discontinued operations, as only disposals representing a strategic shift in operations will be presented as discontinued operations. No properties that have been sold, or designated as held-for-sale, since the adoption of ASU 2014-08, have met the revised criteria for classification within discontinued operations.
Acquisition of Real Estate Investments
Upon acquisition of real estate operating properties, we estimate the fair value of acquired identifiable tangible assets and identified intangible assets and liabilities, assumed debt, and any noncontrolling interest in the acquiree at the date of acquisition, based on evaluation of information and estimates available at that date. Based on these estimates, we record the estimated fair value to the applicable assets and liabilities. In making estimates of fair values, a number of sources are utilized, including information obtained as a result of pre-acquisition due diligence, marketing and leasing activities. The estimates of fair value were determined to have primarily relied upon Level 2 and Level 3 inputs, as defined below.
Fair value is determined for tangible assets and intangibles, including:
• | the fair value of the building on an as-if-vacant basis and the fair value of land determined either by comparable market data, real estate tax assessments, independent appraisals or other relevant data; |
• | above-market and below-market in-place lease values for acquired properties, which are based on the present value (using an interest rate which reflects the risks associated with the leases acquired) of the difference between (i) the contractual amounts to be paid pursuant to the in-place leases and (ii) management’s estimate of fair market lease rates for the corresponding in-place leases, measured over the remaining non-cancelable term of the leases. Any below-market renewal options are also considered in the in-place lease values. The capitalized above-market and below-market lease values are amortized as a reduction of or addition to rental income over the term of the lease. Should a tenant vacate, terminate its lease, or otherwise notify us of its intent to do so, the unamortized portion of the lease intangibles would be charged or credited to income; |
• | the value of having a lease in place at the acquisition date. We utilize independent and internal sources for our estimates to determine the respective in-place lease values. Our estimates of value are made using methods similar to those used by independent appraisers. Factors we consider in our analysis include an estimate of costs to execute similar leases including tenant improvements, leasing commissions and foregone costs and rent received during the estimated lease-up period as if the space was vacant. The value of in-place leases is amortized to expense over the remaining initial terms of the respective leases; and |
• | the fair value of any assumed financing that is determined to be above or below market terms. We utilize third party and independent sources for our estimates to determine the respective fair value of each mortgage payable. The fair market value of each mortgage payable is amortized to interest expense over the remaining initial terms of the respective loan. |
50
We also consider whether there is any value to in-place leases that have a related customer relationship intangible value. Characteristics we consider in determining these values include the nature and extent of existing business relationships with the tenant, growth prospects for developing new business with the tenant, the tenant’s credit quality, and expectations of lease renewals, among other factors. To date, a tenant relationship has not been developed that is considered to have a current intangible value.
We finalize the measurement period of our business combinations when all facts and circumstances are understood, but in no circumstances will the measurement period exceed one year.
Revenue Recognition
As a lessor of real estate assets, the Company retains substantially all of the risks and benefits of ownership and accounts for its leases as operating leases.
Contractual rent, percentage rent, and expense reimbursements from tenants for common area maintenance costs, insurance and real estate taxes are our principal sources of revenue. Base minimum rents are recognized on a straight-line basis over the terms of the respective leases. Certain lease agreements contain provisions that grant additional rents based on a tenant’s sales volume (contingent overage rent). Overage rent is recognized when tenants achieve the specified sales targets as defined in their lease agreements. Overage rent is included in other property related revenue in the accompanying consolidated statements of operations. As a result of generating this revenue, we will routinely have accounts receivable due from tenants. We are subject to tenant defaults and bankruptcies that may affect the collection of outstanding receivables. To address the collectability of these receivables, we analyze historical write-off experience, tenant credit-worthiness and current economic trends when evaluating the adequacy of our allowance for uncollectible accounts and straight line rent reserve. Although we estimate uncollectible receivables and provide for them through charges against income, actual experience may differ from those estimates.
Gains or losses from sales of real estate have historically been recognized when a sale has been consummated, the buyer’s initial and continuing investment is adequate to demonstrate a commitment to pay for the asset, we have transferred to the buyer the usual risks and rewards of ownership, and we do not have a substantial continuing financial involvement in the property. As part of our ongoing business strategy, we will, from time to time, sell land parcels and outlots, some of which are ground leased to tenants.
Fair Value Measurements
We follow the framework established under accounting standard FASB ASC 820 , Fair Value Measurements and Disclosures, for measuring fair value of non-financial assets and liabilities that are not required or permitted to be measured at fair value on a recurring basis but only in certain circumstances, such as a business combination or upon determination of impairment.
Assets and liabilities recorded at fair value on the consolidated balance sheets are categorized based on the inputs to the valuation techniques as follows:
• | Level 1 fair value inputs are quoted prices in active markets for identical instruments to which we have access. |
• | Level 2 fair value inputs are inputs other than quoted prices included in Level 1 that are observable for similar instruments, either directly or indirectly, and appropriately consider counterparty creditworthiness in the valuations. |
• | Level 3 fair value inputs reflect our best estimate of inputs and assumptions market participants would use in pricing an instrument at the measurement date. The inputs are unobservable in the market and significant to the valuation estimate. |
In instances where the determination of the fair value measurement is based on inputs from different levels of the fair value hierarchy, the level in the fair value hierarchy within which the entire fair value measurement falls is based on the lowest level input that is significant to the fair value measurement in its entirety. Our assessment of the significance of a particular input to the fair value measurement in its entirety requires judgment and considers factors specific to the asset or liability. As discussed in Note 10 to the Financial Statements, we have determined that derivative valuations are classified in Level 2 of the fair value hierarchy.
Cash and cash equivalents, accounts receivable, escrows and deposits, and other working capital balances approximate fair value.
51
Note 7 to the Financial Statements includes a discussion of the fair values recorded for assets acquired and liabilities assumed. Note 8 to the Financial Statements includes a discussion of the fair values recorded when we recognized impairment charges in 2017 and 2015. Level 3 inputs to these transactions include our estimations of market leasing rates, tenant-related costs, discount rates, and disposal values.
Income Taxes and REIT Compliance
Parent Company
The Parent Company, which is considered a corporation for federal income tax purposes, has been organized and intends to continue to operate in a manner that will enable it to maintain its qualification as a REIT for federal income tax purposes. As a result, it generally will not be subject to federal income tax on the earnings that it distributes to the extent it distributes its “REIT taxable income” (determined before the deduction for dividends paid and excluding net capital gains) to shareholders of the Parent Company and meets certain other requirements on a recurring basis. To the extent that it satisfies this distribution requirement, but distributes less than 100% of its taxable income, it will be subject to federal corporate income tax on its undistributed REIT taxable income. REITs are subject to a number of organizational and operational requirements. If the Parent Company fails to qualify as a REIT in any taxable year, it will be subject to federal income tax on its taxable income at regular corporate rates for a period of four years following the year in which qualification is lost. We may also be subject to certain federal, state and local taxes on our income and property and to federal income and excise taxes on our undistributed taxable income even if the Parent Company does qualify as a REIT. The Operating Partnership intends to continue to make distributions to the Parent Company in amounts sufficient to assist the Parent Company in adhering to REIT requirements and maintaining its REIT status.
We have elected to treat Kite Realty Holdings, LLC as a taxable REIT subsidiary of the Operating Partnership, and we may elect to treat other subsidiaries as taxable REIT subsidiaries in the future. This election enables us to receive income and provide services that would otherwise be impermissible for a REIT. Deferred tax assets and liabilities are established for temporary differences between the financial reporting bases and the tax bases of assets and liabilities at the tax rates expected to be in effect when the temporary differences reverse. Deferred tax assets are reduced by a valuation allowance if it is more likely than not that some portion or all of the deferred tax asset will not be realized.
Operating Partnership
The allocated share of income and loss, other than the operations of our taxable REIT subsidiary, is included in the income tax returns of the Operating Partnership's partners. Accordingly, the only federal income taxes included in the accompanying consolidated financial statements are in connection with the taxable REIT subsidiary.
Inflation
Inflation rates have been near historical lows in recent years and, therefore, have not had a significant impact on our results of operations. Most of our leases contain provisions designed to mitigate the adverse impact of inflation by requiring the tenant to pay its share of operating expenses, including common area maintenance, real estate taxes and insurance, or include a fixed amount for these costs that escalates over time, thereby reducing our exposure to increases in operating expenses resulting from inflation. Also, most of our leases have original terms of fewer than ten years, which enables us to adjust rental rates to market upon lease renewal.
Results of Operations
As of December 31, 2017, we owned interests in 117 operating and redevelopment properties and two development projects currently under construction. The following table sets forth the total operating and redevelopment properties and development projects that we owned as of December 31, 2017, 2016 and 2015:
52
# of Properties | |||||||||
2017 | 2016 | 2015 | |||||||
Operating Retail Properties | 105 | 108 | 110 | ||||||
Operating Office Properties and Other | 4 | 2 | 2 | ||||||
Redevelopment Properties | 8 | 9 | 6 | ||||||
Total Operating and Redevelopment Properties | 117 | 119 | 118 | ||||||
Development Projects: | 2 | 2 | 3 | ||||||
Total All Properties | 119 | 121 | 121 | ||||||
The comparability of results of operations is affected by our development, redevelopment, and operating property acquisition and disposition activities in 2015 through 2017. Therefore, we believe it is most useful to review the comparisons of our results of operations for these years (as set forth below under “Comparison of Operating Results for the Years Ended December 31, 2017 and 2016” and “Comparison of Operating Results for the Years Ended December 31, 2016 and 2015”) in conjunction with the discussion of these activities during those periods, which is set forth below.
Property Acquisition Activities
During the three years ended December 31, 2017, we acquired the properties listed in the table below.
Property Name | MSA | Acquisition Date | Owned GLA | ||||
Colleyville Downs | Dallas, TX | April 2015 | 190,895 | ||||
Belle Isle Station | Oklahoma City, OK | May 2015 | 164,407 | ||||
Livingston Shopping Center | New York - Newark | July 2015 | 139,559 | ||||
Chapel Hill Shopping Center | Fort Worth / Dallas, TX | August 2015 | 126,989 | ||||
Operating Property Disposition Activities
During the three years ended December 31, 2017, we sold the operating properties listed in the table below.
Property Name | MSA | Disposition Date | Owned GLA | ||||
Sale of seven operating properties | Various | March 2015 | 740,034 | ||||
Cornelius Gateway | Portland, OR | December 2015 | 21,326 | ||||
Four Corner Square | Seattle, WA | December 2015 | 107,998 | ||||
Shops at Otty | Portland, OR | June 2016 | 9,845 | ||||
Publix at St. Cloud | St. Cloud, FL | December 2016 | 78,820 | ||||
Cove Center | Stuart, FL | March 2017 | 155,063 | ||||
Clay Marketplace | Birmingham, AL | June 2017 | 63,107 | ||||
The Shops at Village Walk | Fort Myers, FL | June 2017 | 78,533 | ||||
Wheatland Towne Crossing | Dallas, TX | June 2017 | 194,727 | ||||
Development Activities
During the three years ended December 31, 2017, the following development properties became operational and were transferred to the operating portfolio:
Property Name | MSA | Transition to Operating Portfolio | Owned GLA | ||||
Tamiami Crossing | Naples, FL | June 2016 | 121,705 | ||||
Holly Springs Towne Center – Phase II | Raleigh, NC | June 2016 | 145,009 | ||||
Parkside Town Commons – Phase II | Raleigh, NC | June 2017 | 152,460 | ||||
53
Redevelopment Activities
During portions of the three years ended December 31, 2017, the following properties were under active redevelopment and removed from our operating portfolio:
Property Name | MSA | Transition to Redevelopment1 | Transition to Operating Portfolio | Owned GLA | |||||
Gainesville Plaza | Gainesville, FL | June 2013 | December 2015 | 162,309 | |||||
Cool Springs Market | Nashville, TN | July 2015 | December 2015 | 230,980 | |||||
Courthouse Shadows2 | Naples, FL | June 2013 | Pending | 124,802 | |||||
Hamilton Crossing Centre2 | Indianapolis, IN | June 2014 | Pending | 89,983 | |||||
City Center2 | White Plains, NY | December 2015 | Pending | 361,618 | |||||
Fishers Station2 | Indianapolis, IN | December 2015 | Pending | 52,544 | |||||
Beechwood Promenade2 | Athens, GA | December 2015 | Pending | 331,198 | |||||
The Corner2 | Indianapolis, IN | December 2015 | Pending | 27,731 | |||||
Rampart Commons2 | Las Vegas, NV | March 2016 | Pending | 79,455 | |||||
Northdale Promenade3 | Tampa, FL | March 2016 | June 2017 | 173,862 | |||||
Burnt Store2 | Punta Gorda, FL | June 2016 | Pending | 95,795 | |||||
____________________ | |
1 | Transition date represents the date the property was transferred from our operating portfolio into redevelopment status. |
2 | This property has been identified as a redevelopment property and is not included in the operating portfolio or the same property pool. |
3 | This property was transitioned to the operating portfolio in the second quarter of 2017; however, it remains excluded from the same property pool because it has not been in the operating portfolio four full quarters after the property was transitioned to operations. |
Net Operating Income and Same Property Net Operating Income
We use property net operating income (“NOI”), a non-GAAP financial measure, to evaluate the performance of our properties. We define NOI as income from our real estate, including lease termination fees received from tenants, less our property operating expenses. NOI excludes amortization of capitalized tenant improvement costs and leasing commissions and certain corporate level expenses. We believe that NOI is helpful to investors as a measure of our operating performance because it excludes various items included in net income that do not relate to or are not indicative of our operating performance, such as depreciation and amortization, interest expense, and impairment, if any.
We also use same property NOI ("Same Property NOI"), a non-GAAP financial measure, to evaluate the performance of our retail properties. Same Property NOI excludes properties that have not been owned for the full period presented. It also excludes net gains from outlot sales, straight-line rent revenue, provision for credit losses, net of recoveries, lease termination fees, amortization of lease intangibles and significant prior period expense recoveries and adjustments, if any. We believe that Same Property NOI is helpful to investors as a measure of our operating performance because it includes only the NOI of properties that have been owned for the full period presented, which eliminates disparities in net income due to the acquisition or disposition of properties during the particular period presented and thus provides a more consistent metric for the comparison of our properties. Full year Same Property NOI represents the sum of the four quarters, as reported.
NOI and Same Property NOI should not, however, be considered as alternatives to net income (calculated in accordance with GAAP) as indicators of our financial performance. Our computation of NOI and Same Property NOI may differ from the methodology used by other REITs, and therefore may not be comparable to such other REITs.
When evaluating the properties that are included in the same property pool, we have established specific criteria for determining the inclusion of properties acquired or those recently under development. An acquired property is included in the same property pool when there is a full quarter of operations in both years subsequent to the acquisition date. Development and redevelopment properties are included in the same property pool four full quarters after the properties have been transferred to the operating portfolio. A redevelopment property is first excluded from the same property pool when the
54
execution of a redevelopment plan is likely and we begin recapturing space from tenants. At December 31, 2017, same property pool excluded eight properties in redevelopment, a recently completed redevelopment, and two office properties.
The following table reflects Same Property NOI1 and a reconciliation to net income attributable to common shareholders for the years ended December 31, 2017 and 2016 (unaudited):
($ in thousands) | Years Ended December 31, | ||||||||||
2017 | 2016 | % Change | |||||||||
Leased percentage at period end | 94.6 | % | 95.3 | % | |||||||
Economic Occupancy percentage2 | 93.6 | % | 93.0 | % | |||||||
Same Property NOI3 | $ | 222,267 | $ | 216,097 | 2.9 | % | |||||
Same Property NOI - excluding the impact of the 3-R initiative | 3.2 | % | |||||||||
Reconciliation of Same Property NOI to Most Directly Comparable GAAP Measure: | |||||||||||
Net operating income - same properties | $ | 222,267 | $ | 216,097 | |||||||
Net operating income - non-same activity4 | 46,156 | 49,078 | |||||||||
Provision for credit losses, net of recoveries - same properties | (2,427 | ) | (1,814 | ) | |||||||
Other expense, net | (315 | ) | (983 | ) | |||||||
General, administrative and other | (21,749 | ) | (20,603 | ) | |||||||
Transaction costs | — | (2,771 | ) | ||||||||
Impairment charge | (7,411 | ) | — | ||||||||
Depreciation and amortization expense | (172,091 | ) | (174,564 | ) | |||||||
Interest expense | (65,702 | ) | (65,577 | ) | |||||||
Gains on sales of operating properties | 15,160 | 4,253 | |||||||||
Net income attributable to noncontrolling interests | (2,014 | ) | (1,933 | ) | |||||||
Net income attributable to common shareholders | $ | 11,874 | $ | 1,183 | |||||||
____________________ | |
1 | Same Property NOI excludes eight properties in redevelopment, the recently completed Northdale Promenade redevelopment as well as office properties (Thirty South Meridian and Eddy Street Commons). |
2 | Excludes leases that are signed but for which tenants have not yet commenced the payment of cash rent. Calculated as a weighted average based on the timing of cash rent commencement and expiration during the period. |
3 | Same Property NOI excludes net gains from outlot sales, straight-line rent revenue, provision for credit losses, net of recoveries, lease termination fees, amortization of lease intangibles and significant prior period expense recoveries and adjustments, if any. |
4 | Includes non-cash activity across the portfolio as well as net operating income (including provision for credit losses, net of recoveries) from properties not included in the same property pool. |
Our Same Property NOI increased 2.9% in 2017 compared to 2016. This increase was primarily due to increases in rental rates, increase in economic occupancy, and improved expense control and operating expense recoveries..
Funds From Operations
Funds from Operations ("FFO") is a widely used performance measure for real estate companies and is provided here as a supplemental measure of operating performance. We calculate FFO, a non-GAAP financial measure, in accordance with the best practices described in the April 2002 National Policy Bulletin of the National Association of Real Estate Investment Trusts ("NAREIT"). The NAREIT white paper defines FFO as net income (determined in accordance with GAAP), excluding gains (or
55
losses) from sales and impairments of depreciated property, plus depreciation and amortization, and after adjustments for unconsolidated partnerships and joint ventures.
Considering the nature of our business as a real estate owner and operator, we believe that FFO is helpful to investors in measuring our operational performance because it excludes various items included in net income that do not relate to or are not indicative of our operating performance, such as gains or losses from sales of depreciated property and depreciation and amortization, which can make periodic and peer analyses of operating performance more difficult. For informational purposes, we have also provided FFO adjusted for accelerated amortization of debt issuance costs, transaction costs, a severance charge and a debt extinguishment loss in 2016. We believe this supplemental information provides a meaningful measure of our operating performance. We believe our presentation of FFO, as adjusted, provides investors with another financial measure that may facilitate comparison of operating performance between periods and among our peer companies. FFO should not be considered as an alternative to net income (determined in accordance with GAAP) as an indicator of our financial performance, is not an alternative to cash flow from operating activities (determined in accordance with GAAP) as a measure of our liquidity, and is not indicative of funds available to satisfy our cash needs, including our ability to make distributions. Our computation of FFO may not be comparable to FFO reported by other REITs that do not define the term in accordance with the current NAREIT definition or that interpret the current NAREIT definition differently than we do.
Our calculations of FFO1 and reconciliation to consolidated net income and FFO, as adjusted for the years ended December 31, 2017, 2016 and 2015 (unaudited) are as follows:
($ in thousands) | Years Ended December 31, | |||||||||||
2017 | 2016 | 2015 | ||||||||||
Consolidated net income | $ | 13,888 | $ | 3,116 | $ | 29,315 | ||||||
Less: cash dividends on preferred shares | — | — | (7,877 | ) | ||||||||
Less: non-cash adjustment for redemption of preferred shares | — | — | (3,797 | ) | ||||||||
Less: net income attributable to noncontrolling interests in properties | (1,731 | ) | (1,844 | ) | (1,854 | ) | ||||||
Less: gains on sales of operating properties | (15,160 | ) | (4,253 | ) | (4,066 | ) | ||||||
Add: impairment charge | 7,411 | — | 1,592 | |||||||||
Add: depreciation and amortization of consolidated entities, net of noncontrolling interests | 170,315 | 173,578 | 166,509 | |||||||||
FFO of the Operating Partnership1 | 174,723 | 170,597 | 179,822 | |||||||||
Less: Limited Partners' interests in FFO | (3,966 | ) | (3,872 | ) | (3,789 | ) | ||||||
FFO attributable to Kite Realty Group Trust common shareholders1 | $ | 170,757 | $ | 166,725 | $ | 176,033 | ||||||
FFO of the Operating Partnership1 | $ | 174,723 | $ | 170,597 | $ | 179,822 | ||||||
Less: gain on settlement | — | — | (4,520 | ) | ||||||||
Add: accelerated amortization of debt issuance costs (non-cash) | — | 1,121 | — | |||||||||
Add: transaction costs | — | 2,771 | 1,550 | |||||||||
Add: severance charge | — | 500 | — | |||||||||
Add: adjustment for redemption of preferred shares (non-cash) | — | — | 3,797 | |||||||||
Less: gain from release of assumed earnout liability (non-cash) | — | — | (4,832 | ) | ||||||||
Add: loss on debt extinguishment | — | 819 | (5,645 | ) | ||||||||
FFO, as adjusted, of the Operating Partnership | $ | 174,723 | $ | 175,808 | $ | 170,172 | ||||||
____________________ | |
1 | “FFO of the Operating Partnership" measures 100% of the operating performance of the Operating Partnership’s real estate properties. “FFO attributable to Kite Realty Group Trust common shareholders” reflects a reduction for the redeemable noncontrolling weighted average diluted interest in the Operating Partnership. |
Earnings before Interest, Tax, Depreciation, and Amortization (EBITDA)
56
We define EBITDA, a non-GAAP financial measure, as net income before depreciation and amortization, interest expense and income tax expense of taxable REIT subsidiary. For informational purposes, we have also provided Adjusted EBITDA, which we define as EBITDA less (i) EBITDA from unconsolidated entities, (ii) gains on sales of operating properties or impairment charges, (iii) other income and expense, (iv) noncontrolling interest EBITDA and (v) other non-recurring activity or items impacting comparability from period to period. Annualized Adjusted EBITDA is Adjusted EBITDA for the most recent quarter multiplied by four. Net Debt to Adjusted EBITDA is our share of net debt divided by Annualized Adjusted EBITDA. EBITDA, Adjusted EBITDA, Annualized Adjusted EBITDA and Net Debt to Adjusted EBITDA, as calculated by us, are not comparable to EBITDA and EBITDA-related measures reported by other REITs that do not define EBITDA and EBITDA-related measures exactly as we do. EBITDA, Adjusted EBITDA and Annualized Adjusted EBITDA do not represent cash generated from operating activities in accordance with GAAP, and should not be considered alternatives to net income as an indicator of performance or as alternatives to cash flows from operating activities as an indicator of liquidity.
Considering the nature of our business as a real estate owner and operator, we believe that EBITDA, Adjusted EBITDA and the ratio of Net Debt to Adjusted EBITDA are helpful to investors in measuring our operational performance because they exclude various items included in net income that do not relate to or are not indicative of our operating performance, such as gains or losses from sales of depreciated property and depreciation and amortization, which can make periodic and peer analyses of operating performance more difficult. For informational purposes, we have also provided Annualized Adjusted EBITDA, adjusted as described above. We believe this supplemental information provides a meaningful measure of our operating performance. We believe presenting EBITDA and the related measures in this manner allows investors and other interested parties to form a more meaningful assessment of our operating results.
The following table presents a reconciliation of our EBITDA, Adjusted EBITDA and Annualized Adjusted EBITDA to consolidated net income (the most directly comparable GAAP measure) and a calculation of Net Debt to Adjusted EBITDA.
($ in thousands) | Three Months Ended December 31, | |||
Consolidated net income | $ | 2,795 | ||
Adjustments to net income: | ||||
Depreciation and amortization | 40,758 | |||
Interest expense | 16,452 | |||
Income tax expense of taxable REIT subsidiary | (36 | ) | ||
Earnings Before Interest, Taxes, Depreciation and Amortization (EBITDA) | 59,969 | |||
Adjustments to EBITDA: | ||||
Unconsolidated EBITDA | 34 | |||
Other income and expense, net | 101 | |||
Noncontrolling interest | (351 | ) | ||
Adjusted EBITDA | 59,753 | |||
Annualized Adjusted EBITDA1 | $ | 239,012 | ||
Company share of net debt: | ||||
Mortgage and other indebtedness | 1,699,239 | |||
Less: Partner share of consolidated joint venture debt | (13,373 | ) | ||
Less: Cash, cash equivalents, and restricted cash | (32,176 | ) | ||
Plus: Debt Premium | 1,411 | |||
Company Share of Net Debt | 1,655,101 | |||
Net Debt to Adjusted EBITDA | 6.9x | |||
____________________ | |
1 | Represents Adjusted EBITDA for the three months ended December 31, 2017 (as shown in the table above) multiplied by four. |
57
Comparison of Operating Results for the Years Ended December 31, 2017 and 2016
The following table reflects changes in the components of our consolidated statements of operations for the years ended December 31, 2017 and 2016:
($ in thousands) | 2017 | 2016 | Net change 2016 to 2017 | ||||||||
Revenue: | |||||||||||
Rental income (including tenant reimbursements) | $ | 346,444 | $ | 344,541 | $ | 1,903 | |||||
Other property related revenue | 11,998 | 9,581 | 2,417 | ||||||||
Fee income | 377 | — | 377 | ||||||||
Total revenue | 358,819 | 354,122 | 4,697 | ||||||||
Expenses: | |||||||||||
Property operating | 49,643 | 47,923 | 1,720 | ||||||||
Real estate taxes | 43,180 | 42,838 | 342 | ||||||||
General, administrative, and other | 21,749 | 20,603 | 1,146 | ||||||||
Transaction costs | — | 2,771 | (2,771 | ) | |||||||
Impairment charge | 7,411 | — | 7,411 | ||||||||
Depreciation and amortization | 172,091 | 174,564 | (2,473 | ) | |||||||
Total expenses | 294,074 | 288,699 | 5,375 | ||||||||
Operating income | 64,745 | 65,423 | (678 | ) | |||||||
Interest expense | (65,702 | ) | (65,577 | ) | (125 | ) | |||||
Income tax benefit (expense) of taxable REIT subsidiary | 100 | (814 | ) | 914 | |||||||
Other expense, net | (415 | ) | (169 | ) | (246 | ) | |||||
Loss before gains on sale of operating properties, net | (1,272 | ) | (1,137 | ) | (135 | ) | |||||
Gains on sale of operating properties, net | 15,160 | 4,253 | 10,907 | ||||||||
Consolidated net income | 13,888 | 3,116 | 10,772 | ||||||||
Net income attributable to noncontrolling interests | (2,014 | ) | (1,933 | ) | (81 | ) | |||||
Net income attributable to Kite Realty Group Trust common shareholders | $ | 11,874 | $ | 1,183 | $ | 10,691 | |||||
Property operating expense to total revenue ratio | 13.8 | % | 13.5 | % | 0.3 | % | |||||
Rental income (including tenant reimbursements) increased $1.9 million, or 0.6%, due to the following:
($ in thousands) | Net change 2016 to 2017 | ||
Properties sold during 2016 and 2017 | $ | (6,363 | ) |
Properties under redevelopment during 2016 and/or 2017 | (3,323 | ) | |
Development projects completed during 2016 and/or 2017 | 3,608 | ||
Properties fully operational during 2016 and 2017 and other | 7,981 | ||
Total | $ | 1,903 | |
The net increase of $8.0 million in rental income for properties that were fully operational during 2016 and 2017 is primarily attributable to an increase in rental rates and an increase in occupancy, which leads to more tenants paying rent. The increase in rental revenue is primarily due to multiple anchor and small shop tenants opening as we completed or partially completed various redevelopment and repositioning projects including Trader Joe's at Centennial Gateway, Ross Dress for Less at Trussville Promenade, Party City at Market Street Village, Marshalls at Bolton Plaza, Ulta Salon at Pine Ridge Crossing, Tuesday Morning at Northdale Promenade, Petco at Hitchcock Plaza, Petsmart at Tarpon Bay Plaza, Buy Buy Baby at Cool Springs Market, Five Below at Shops at Moore and new small shop buildings at Castleton Crossing and Portofino Shopping Center. The net increase of $3.6 million in rental income for recently completed development projects during 2016 and 2017 is primarily due to multiple
58
anchor tenants opening including Carmike Cinemas at Holly Springs Towne Center - Phase II, Ross Dress for Less and Michaels at Tamiami Crossing and Stein Mart at Parkside Town Commons - Phase II.
The average rents for new comparable leases signed in 2017 were $21.44 per square foot compared to average expiring rents of $17.43 per square foot in that period. The average rents for renewals signed in 2017 were $16.81 per square foot compared to average expiring rents of $15.77 per square foot in that period. For our retail operating portfolio, annualized base rent per square foot improved to $16.07 per square foot as of December 31, 2017, up from $15.53 per square foot as of December 31, 2016.
Other property related revenue primarily consists of parking revenues, overage rent, lease termination income and gains on sales of undepreciated assets. This revenue increased by $2.4 million, primarily as a result of higher gains on sales of undepreciated assets of $1.3 million (including the effect of a $4.9 million gain on the sale of an outlot at Cove Center during the second quarter of 2017) and an increase of $1.0 million in lease termination income.
We recorded fee income of $0.4 million for the year ended December 31, 2017. In December 2017, we formed a joint venture with an unrelated third party to develop and own an Embassy Suites full-service hotel next to our Eddy Street Commons operating property at the University of Notre Dame. See additional discussion in Note 2 to the consolidated financial statements.
Property operating expenses increased $1.7 million, or 3.6%, due to the following:
($ in thousands) | Net change 2016 to 2017 | ||
Properties sold during 2016 and 2017 | $ | (927 | ) |
Properties under redevelopment during 2016 and/or 2017 | 722 | ||
Development projects completed during 2016 and/or 2017 | 546 | ||
Properties fully operational during 2016 and 2017 and other | 1,379 | ||
Total | $ | 1,720 | |
The net increase $1.4 million in property operating expenses for properties that were fully operational during 2016 and 2017 is primarily due to a combination of increases of $0.8 million in provision for credit losses attributable to certain anchor bankruptcies in 2017, $0.8 million in general building repair and landscaping costs at certain properties, $0.3 million in marketing expense, and $0.1 million in non-recoverable utility expense. The increases were partially offset by a decrease of $0.6 million in insurance expense.
As a percentage of revenue, property operating expenses increased between years from 13.5% to 13.8%. The increase was mostly due to an increase in certain non-recoverable expenses including provision for credit losses, marketing expenses, and non-recoverable utility expense at several of our properties.
Real estate taxes increased $0.3 million, or 0.8%, due to the following:
($ in thousands) | Net change 2016 to 2017 | ||
Properties sold during 2016 and 2017 | $ | (863 | ) |
Properties under redevelopment during 2016 and/or 2017 | (81 | ) | |
Development projects completed during 2016 and/or 2017 | 403 | ||
Properties fully operational during 2016 and 2017 and other | 883 | ||
Total | $ | 342 | |
The net increase of $0.9 million in real estate taxes for properties that were fully operational during 2016 and 2017 is primarily due to an increase in current year tax assessments at certain operating properties. The majority of real estate tax expense is recoverable from tenants and such recovery is reflected in tenant reimbursement revenue.
General, administrative and other expenses increased $1.1 million, or 5.6%. The increase is due primarily to higher personnel costs and company overhead expenses, which are partially offset by a severance charge of $0.5 million in 2016.
59
Transaction costs decreased by $2.8 million, as we did not incur any transaction costs for the year ended December 31, 2017.
In 2017, we recorded an impairment charge of $7.4 million related to one of our operating properties as a result of our conclusion the estimated undiscounted cash flows over the expected holding period did not exceed the carrying value of the asset. See additional discussion in Note 8 to the consolidated financial statements.
Depreciation and amortization expense decreased $2.5 million, or 1.4%, due to the following:
($ in thousands) | Net change 2016 to 2017 | ||
Properties sold during 2016 and 2017 | $ | (3,687 | ) |
Properties under redevelopment during 2016 and/or 2017 | 3,920 | ||
Development projects completed during 2016 and/or 2017 | (304 | ) | |
Properties fully operational during 2016 and 2017 and other | (2,402 | ) | |
Total | $ | (2,473 | ) |
The net increase of $3.9 million in properties under redevelopment during 2016 and 2017 is primarily due to $5.8 million of accelerated depreciation and amortization from the demolition of a building at our Fishers Station redevelopment property in preparation for replacing the anchor tenant and from the demolition of a building at The Corner redevelopment property. This increase was partially offset by $2.2 million of accelerated depreciation and amortization from the demolition of a portion of a building at our Burnt Store Promenade operating property in 2016. The net decrease of $2.4 million in depreciation and amortization at properties fully operational during 2016 and 2017 is primarily due to a decrease of $1.6 million in depreciation and amortization caused by tenant-specific assets becoming fully depreciated in 2017 and a decrease of $0.7 million in accelerated depreciation and amortization on tenant-specific assets caused by a tenant vacating prior to their lease expiration in 2016.
Interest expense increased $0.1 million or 0.2%. The increase is due to certain development projects, including Tamiami Crossing, Parkside Town Commons - Phase II and Holly Springs Towne Center - Phase II, becoming operational or partially operational throughout 2016. As a portion of a development project becomes operational, we cease capitalization of the related interest expense. This increase in interest expense was offset by reductions in debt utilizing proceeds from current year property sales.
We recorded an income tax benefit of our taxable REIT subsidiary of $0.1 million compared to an income tax expense of our taxable REIT subsidiary of $0.8 million for the years ended December 31, 2017 and 2016, respectively. The decrease is primarily due to lower gains on sales of residential units at Eddy Street Commons for the year ended December 31, 2017, compared to the same period in 2016. The last of the units in Phase I were sold in 2016.
We recorded a net gain of $15.2 million on the sale of our Cove Center, Clay Marketplace, The Shops at Village Walk and Wheatland Towne Center operating properties for the year ended December 31, 2017, compared to a net gain of $4.3 million on the sale of our Shops at Otty and Publix at St. Cloud operating properties for the year ended December 31, 2016.
Comparison of Operating Results for the Years Ended December 31, 2016 and 2015
The following table reflects changes in the components of our consolidated statements of operations for the years ended December 31, 2016 and 2015:
60
($ in thousands) | 2016 | 2015 | Net change 2015 to 2016 | ||||||||
Revenue: | |||||||||||
Rental income (including tenant reimbursements) | $ | 344,541 | $ | 334,029 | $ | 10,512 | |||||
Other property related revenue | 9,581 | 12,976 | (3,395 | ) | |||||||
Total revenue | 354,122 | 347,005 | 7,117 | ||||||||
Expenses: | |||||||||||
Property operating | 47,923 | 49,973 | (2,050 | ) | |||||||
Real estate taxes | 42,838 | 40,904 | 1,934 | ||||||||
General, administrative, and other | 20,603 | 18,709 | 1,894 | ||||||||
Transaction costs | 2,771 | 1,550 | 1,221 | ||||||||
Non-cash gain from release of assumed earnout liability | — | (4,832 | ) | 4,832 | |||||||
Impairment charge | — | 1,592 | (1,592 | ) | |||||||
Depreciation and amortization | 174,564 | 167,312 | 7,252 | ||||||||
Total expenses | 288,699 | 275,208 | 13,491 | ||||||||
Operating income | 65,423 | 71,797 | (6,374 | ) | |||||||
Interest expense | (65,577 | ) | (56,432 | ) | (9,145 | ) | |||||
Income tax expense of taxable REIT subsidiary | (814 | ) | (186 | ) | (628 | ) | |||||
Non-cash gain on debt extinguishment | — | 5,645 | (5,645 | ) | |||||||
Gain on settlement | — | 4,520 | (4,520 | ) | |||||||
Other expense, net | (169 | ) | (95 | ) | (74 | ) | |||||
(Loss) income before gain on sale of operating properties | (1,137 | ) | 25,249 | (26,386 | ) | ||||||
Gain on sale of operating properties, net | 4,253 | 4,066 | 187 | ||||||||
Consolidated net income | 3,116 | 29,315 | (26,199 | ) | |||||||
Net income attributable to noncontrolling interests | (1,933 | ) | (2,198 | ) | 265 | ||||||
Net income attributable to Kite Realty Group Trust | 1,183 | 27,117 | (25,934 | ) | |||||||
Dividends on preferred shares | — | (7,877 | ) | 7,877 | |||||||
Non-cash adjustment for redemption of preferred shares | — | (3,797 | ) | 3,797 | |||||||
Net income attributable to common shareholders | $ | 1,183 | $ | 15,443 | $ | (14,260 | ) | ||||
Property operating expense to total revenue ratio | 13.5 | % | 14.4 | % | (0.9 | )% | |||||
Rental income (including tenant reimbursements) increased $10.5 million, or 3.1%, due to the following:
($ in thousands) | Net change 2015 to 2016 | ||
Properties acquired during 2015 | $ | 7,275 | |
Development properties that became operational or were partially operational in 2015 and/or 2016 | 4,917 | ||
Properties sold during 2015 and 2016 | (5,762 | ) | |
Properties under redevelopment during 2015 and/or 2016 | 1,109 | ||
Properties fully operational during 2015 and 2016 and other | 2,973 | ||
Total | $ | 10,512 | |
The net increase of $3.0 million in rental income for properties fully operational during 2015 and 2016 is primarily attributable to an increase in rental rates, increase in economic occupancy percentage, and improved expense control and operating expense recovery resulting in an improvement in net recoveries of $1.9 million.
The average rents for new comparable leases signed in 2016 were $20.83 per square foot compared to average expiring rents of $17.57 per square foot in that period. The average rents for renewals signed in 2016 were $15.85 per square foot compared to average expiring rents of $14.79 per square foot in that period. Our same property economic occupancy improved to 93.4%
61
as of December 31, 2016 from 92.9% as of December 31, 2015. For our retail operating portfolio, annualized base rent per square foot improved to $15.53 per square foot as of December 31, 2016, up from $15.22 per square foot as of December 31, 2015.
Other property related revenue primarily consists of parking revenues, overage rent, lease termination income and gains on sales of undepreciated assets. This revenue decreased by $3.4 million, primarily as a result lower gains on sales of undepreciated assets of $1.7 million, decreases of $1.1 million in lease termination income, and fluctuations in other miscellaneous activities.
Property operating expenses decreased $2.1 million, or 4.1%, due to the following:
($ in thousands) | Net change 2015 to 2016 | ||
Properties acquired during 2015 | $ | 1,577 | |
Development properties that became operational or were partially operational in 2015 and/or 2016 | 683 | ||
Properties sold during 2015 and 2016 | (1,288 | ) | |
Properties under redevelopment during 2015 and/or 2016 | (444 | ) | |
Properties fully operational during 2015 and 2016 and other | (2,578 | ) | |
Total | $ | (2,050 | ) |
The net $2.6 million decrease for properties fully operational during 2015 and 2016 is primarily due to a combination of decreases of $1.2 million in provision for credit losses, $0.8 million in trash removal expense as tenants began contracting for this item directly with outside vendors, $0.5 million in insurance costs as we generated efficiencies with our larger operating platform, $0.3 million in utility expense, and $0.2 million in snow removal expense. The decreases were offset by an increase of $0.5 million in landscaping expense.
As a percentage of revenue, property operating expenses decreased between years from 14.4% to 13.5%. The decrease was mostly due to an improvement in expense control and an improvement in operating expense recoveries from tenants as a result of higher occupancy rates.
Real estate taxes increased $1.9 million, or 4.7%, due to the following:
($ in thousands) | Net change 2015 to 2016 | ||
Properties acquired during 2015 | $ | 1,417 | |
Development properties that became operational or were partially operational in 2015 and/or 2016 | 372 | ||
Properties sold during 2015 and 2016 | (636 | ) | |
Properties under redevelopment during 2015 and/or 2016 | (127 | ) | |
Properties fully operational during 2015 and 2016 and other | 908 | ||
Total | $ | 1,934 | |
The net $0.9 million increase in real estate taxes for properties fully operational during 2015 and 2016 is due to higher tax assessments at certain operating properties. The majority of our real estate tax expense is recoverable from tenants and reflected in tenant reimbursement revenue.
General, administrative and other expenses increased $1.9 million, or 10.1%. The increase is due primarily to higher payroll costs and company overhead expenses of $1.4 million and a severance charge of $0.5 million in the first quarter of 2016.
Transaction costs generally consist of legal, lender, due diligence, and other expenses for professional services. Such costs increased $1.2 million as we had terminated transaction costs of $2.8 million in 2016, compared to property acquisition costs of $1.6 million over the same period in 2015.
We recorded a non-cash gain from the release of an assumed earnout liability of $4.8 million for the year ended December 31, 2015. The expiration date of the underlying third party earnout agreement was December 28, 2015, and the original sellers were unable to perform the necessary leasing activity by this date that would have resulted in payment by us of the previously recorded obligation.
62
We recorded an impairment charge of $1.6 million related to our Shops at Otty operating property for the year ended December 31, 2015. This charge was recorded due to our intent to sell the property in the near term, which shortened the intended holding period. This property was sold in the second quarter of 2016. See additional discussion in Note 8 to the consolidated financial statements.
Depreciation and amortization expense increased $7.3 million, or 4.3%, due to the following:
($ in thousands) | Net change 2015 to 2016 | ||
Properties acquired during 2015 | $ | 3,763 | |
Development properties that became operational or were partially operational in 2015 and/or 2016 | 4,572 | ||
Properties sold during 2015 and 2016 | (1,603 | ) | |
Properties under redevelopment during 2015 and/or 2016 | 2,434 | ||
Properties fully operational during 2015 and 2016 and other | (1,914 | ) | |
Total | $ | 7,252 | |
The net increase of $2.4 million in properties under redevelopment during 2015 and 2016 is primarily due to an increase of $1.9 million in accelerated depreciation and amortization from the demolition of a portion of a building at one of our redevelopment properties. The net decrease of $1.9 million in depreciation at properties fully operational during 2015 and 2016 is due to a decrease in accelerated depreciation and amortization on tenant-specific assets from multiple tenants vacating at several operating properties in 2016, compared to the same period in 2015.
Interest expense increased $9.1 million or 16.2%. The increase is due to recording $1.0 million in accelerated amortization of debt issuance costs from amending the unsecured term loans, retiring one of our term loans and securing longer-term fixed rate debt through the issuance of senior unsecured notes in the second half of 2015 and in the third quarter of 2016 that carried higher interest rates than the variable rate on our unsecured revolving credit facility, which was paid down with the proceeds. We also redeemed all of our outstanding preferred shares in the fourth quarter of 2015 using the proceeds from the senior unsecured notes. The increase is also due to certain development projects, including Parkside Town Commons - Phase I and Holly Springs Towne Center - Phase II becoming operational. As a portion of the project becomes operational, we cease capitalization of the related interest expense.
We recorded a non-cash gain on debt extinguishment of $5.6 million for the year ended December 31, 2015, related to the retirement of the $90 million loan secured by our City Center operating property.
We recorded a gain on settlement of $4.5 million for the year ended December 31, 2015, related to the settlement of a dispute related to eminent domain and related damages at one of our operating properties. See additional discussion in Note 3 to the consolidated financial statements.
Liquidity and Capital Resources
Overview
Our primary finance and capital strategy is to maintain a strong balance sheet with sufficient flexibility to fund our operating and investment activities in a cost-effective manner. We consider a number of factors when evaluating our level of indebtedness and when making decisions regarding additional borrowings or equity offerings, including the estimated value of properties to be developed or acquired, the estimated market value of our properties and the Company as a whole upon placement of the borrowing or offering, and the ability of particular properties to generate cash flow to cover debt service. We will continue to monitor the capital markets and may consider raising additional capital through the issuance of our common or preferred shares, unsecured debt securities, or other securities.
Our Principal Capital Resources
For a discussion of cash generated from operations, see “Cash Flows,” beginning on page 66. In addition to cash generated from operations, we discuss below our other principal capital resources.
63
The continued positive operating cash flows of the Company have enhanced our liquidity position and reduced our borrowing costs. We continue to focus on a balanced approach to growth and staggering debt maturities in order to retain our financial flexibility.
In 2017, we sold our Cove Center operating property in Stuart, Florida, our Clay Marketplace operating property in Birmingham, Alabama, our Shops at Village Walk operating property in Fort Myers, Florida, and our Wheatland Towne Crossing operating property in Dallas, Texas, for aggregate gross proceeds of $77.7 million and a net gain of $15.2 million. We utilized these proceeds to pay down the unsecured revolving credit facility and fund a portion of our development costs.
As of December 31, 2017, we had approximately $373.8 million available under our unsecured revolving credit facility for future borrowings based on the unencumbered asset pool allocated to the unsecured revolving credit facility. We also had $24.1 million in cash and cash equivalents as of December 31, 2017.
We were in compliance with all applicable financial covenants under our unsecured revolving credit facility, our unsecured term loans, and our senior unsecured notes as of December 31, 2017.
We have on file with the SEC a shelf registration statement on Form S-3 relating to the offer and sale, from time to time, of an indeterminate amount of equity and debt securities. Equity securities may be offered and sold by the Parent Company, and the net proceeds of any such offerings would be contributed to the Operating Partnership in exchange for additional General Partner Units. Debt securities may be offered and sold by the Operating Partnership with the Operating Partnership receiving the proceeds. From time to time, we may issue securities under this shelf registration statement to fund the repayment of long-term debt upon maturity and for other general corporate purposes. We plan to file a new shelf registration statement on Form S-3 prior to expiration of the current registration statement.
In the future, we will continue to monitor the capital markets and may consider raising additional capital through the issuance of our common shares, preferred shares or other securities. We may also raise capital by disposing of properties, land parcels or other assets that are no longer core components of our growth strategy. The sale price may differ from our carrying value at the time of sale.
Our Principal Liquidity Needs
Short-Term Liquidity Needs
Near-Term Debt Maturities. As of December 31, 2017, we had $37.9 million of secured debt scheduled to mature in 2018, excluding scheduled monthly principal payments. We believe we have sufficient liquidity to repay these obligations from current resources and our unsecured revolving credit facility.
Other Short-Term Liquidity Needs. The requirements for qualifying as a REIT and for a tax deduction for some or all of the dividends paid to shareholders necessitate that we distribute at least 90% of our taxable income on an annual basis. Such requirements cause us to have substantial liquidity needs over both the short term and the long term. Our short-term liquidity needs consist primarily of funds necessary to pay operating expenses associated with our operating properties, interest expense and scheduled principal payments on our debt, expected dividend payments to our common shareholders and to Common Unit holders, and recurring capital expenditures.
In November 2017, our Board of Trustees declared a cash distribution of $0.3175 per common share and Common Unit for the fourth quarter of 2017, which represented a 5.0% increase over our previous quarterly distribution. This distribution, totaling $27.2 million, was paid on January 12, 2018 to common shareholders and Common Unit holders of record as of January 5, 2018. Future dividends are at the discretion of the Board of Trustees.
Other short-term liquidity needs also include expenditures for tenant improvements, renovation costs, external leasing commissions and recurring capital expenditures. During the year ended December 31, 2017, we incurred $2.9 million of costs for recurring capital expenditures on operating properties and also incurred $15.0 million of costs for tenant improvements and external leasing commissions (excluding development and redevelopment properties). We currently anticipate incurring approximately $14 million to $16 million of additional major tenant improvements during 2018 at a number of our operating properties.
As of December 31, 2017, we had two development projects under construction, both at our Eddy Street Commons property across the street from the University of Notre Dame in South Bend, Indiana. For the first project - Eddy Street Commons, Phase II - the total estimated cost equals $89.2 million. This consists of our estimated costs of $8.4 million, tax increment financing of
64
$16.1 million, and residential apartments and townhomes costs of $64.7 million that we expect will be covered by an unrelated third party under a ground sublease that is currently being negotiated. For the second project - the Embassy Suites hotel - our share of the total estimated costs after deducting $6.0 million of tax increment financing is approximately $13.9 million, of which $3.8 million had been incurred as of December 31, 2017. We anticipate incurring the majority of the remaining costs for both projects over the next 12 to 36 months. We believe we have sufficient financing in place to fund these projects through cash flow from operations and borrowings on the hotel construction loan.
We have seven properties in our 3-R initiative that are currently under construction. Total estimated costs of this construction are expected to be in the range of $71 million to $77 million. We have already spent $47.8 million and the remaining costs are expected to be incurred through the end of 2018. We expect to be able to fund these costs largely from operating cash flow, draws from our unsecured revolving credit facility or proceeds from asset sales.
Long-Term Liquidity Needs
Our long-term liquidity needs consist primarily of funds necessary to pay for any new development projects, redevelopment of existing properties, non-recurring capital expenditures, acquisitions of properties, and payment of indebtedness at maturity.
Potential Redevelopment, Reposition, Repurpose Opportunities. We are currently evaluating additional redevelopment, repositioning, and repurposing of several other operating properties as part of our 3-R initiative. Total estimated costs of these properties are currently expected to be in the range of $40 million to $56 million. We believe we will have sufficient funding for these projects through cash flow from operations, borrowings on our unsecured revolving credit facility and proceeds from asset sales.
Selective Acquisitions, Developments and Joint Ventures. We may selectively pursue the acquisition and development of other properties, which would require additional capital. It is unlikely that we would have sufficient funds on hand to meet these long-term capital requirements, requiring us to satisfy these needs through additional borrowings, sales of common or preferred shares, issuance of Operating Partnership units, cash generated through property dispositions or future property acquisitions and/or participation in joint venture arrangements. We cannot be certain that we would have access to these sources of capital on satisfactory terms, if at all, to fund our long-term liquidity requirements. We evaluate all future opportunities against pre-established criteria including, but not limited to, location, demographics, expected return, tenant credit quality, tenant relationships, and amount of existing retail space in the market. Our ability to access the capital markets will be dependent on a number of factors, including general capital market conditions.
Capitalized Expenditures on Consolidated Properties
The following table summarizes cash capital expenditures for our development and redevelopment properties and other capital expenditures for the year ended December 31, 2017:
Year to Date | |||
($ in thousands) | December 31, 2017 | ||
Developments | $ | 4,121 | |
Under Construction 3-R Projects | 39,868 | ||
3-R Opportunities | 1,865 | ||
Recently completed developments/redevelopments and other1 | 8,659 | ||
Recurring operating capital expenditures (primarily tenant improvement payments) | 16,013 | ||
Total | $ | 70,526 | |
____________________ | |
1 | This classification includes Parkside Town Commons - Phase II, Holly Springs Towne Center - Phase II, Tamiami Crossing, Northdale Promenade and Trussville Promenade. |
We capitalize certain indirect costs such as interest, payroll, and other general and administrative costs related to these development activities. If we had experienced a 10% reduction in development and redevelopment activities, without a corresponding decrease in indirect project costs, we would have recorded additional expense of $0.3 million for the year ended December 31, 2017.
65
Impact of Changes in Credit Ratings on Our Liquidity
We have been assigned investment grade corporate credit ratings from two nationally recognized credit rating agencies. These ratings were unchanged during 2017.
In the future, the ratings could change based upon, among other things, the impact that prevailing economic conditions may have on our results of operations and financial condition. Credit rating reductions by one or more rating agencies could also adversely affect our access to funding sources, the cost and other terms of obtaining funding, as well as our overall financial condition, operating results and cash flow.
Cash Flows
As of December 31, 2017, we had cash and cash equivalents on hand of $24.1 million. We may be subject to concentrations of credit risk with regard to our cash and cash equivalents. We place our cash and short-term cash investments with highly rated financial institutions. While we attempt to limit our exposure at any point in time, occasionally, such cash and investments may temporarily be in excess of FDIC and SIPC insurance limits. We also maintain certain compensating balances in several financial institutions in support of borrowings from those institutions. Such compensating balances were not material to the consolidated balance sheets.
Comparison of the Year Ended December 31, 2017 to the Year Ended December 31, 2016
Cash provided by operating activities was $153.7 million for the year ended December 31, 2017, a decrease of $1.3 million from the same period of 2016. The slight decrease was primarily due to a decrease in cash provided by operating activities due to our 2017 property sales, partially offset by the completion of several 3-R projects, and higher revenue on sales of undepreciated assets in 2017.
Cash used in investing activities was $0.1 million for the year ended December 31, 2017, as compared to cash used in investing activities of $82.7 million in the same period of 2016. The major changes in cash used in investing activities are as follows:
• | Net proceeds of $76.1 million related to the sale of Cove Center, Clay Marketplace, The Shops at Village Walk and Wheatland Towne Crossing in 2017, compared to net proceeds of $14.2 million from two property sales in 2016; and |
• | Decrease in capital expenditures of $23.8 million, partially offset by a decrease in construction payables of $4.3 million. In 2017, we incurred additional construction costs at our Parkside Towne Commons - Phase II and Holly Springs Towne Center - Phase II development projects, and additional construction costs at several of our redevelopment properties. |
Cash used in financing activities was $149.3 million for the year ended December 31, 2017, compared to cash used in financing activities of $86.3 million in the same period of 2016. Highlights of significant cash sources and uses in financing activities during 2017 are as follows:
• | We retired the $6.7 million loan secured by our Pleasant Hill Commons operating property using a draw on the unsecured revolving credit facility; |
• | We borrowed $91.0 million on the unsecured revolving credit facility to fund development activities, redevelopment activities, and tenant improvement costs; |
• | We used the $76.1 million proceeds from the sale of four operating properties to pay down the unsecured revolving credit facility; |
• | We repaid $48.2 million on the unsecured revolving credit facility using cash flows generated from operations; |
• | We paid $8.3 million to partners in one of our joint ventures to fund the partial redemption of their redeemable noncontrolling interests; and |
• | We made distributions to common shareholders and Common Unit holders of $105.0 million. |
66
Comparison of the Year Ended December 31, 2016 to the Year Ended December 31, 2015
Cash provided by operating activities was $154.9 million for the year ended December 31, 2016, a decrease of $14.4 million from the same period of 2015. The decrease was primarily due to the timing of real estate tax payments and annual insurance payments and an increase in leasing costs.
Cash used in investing activities was $82.7 million for the year ended December 31, 2016, as compared to cash used in investing activities of $84.4 million in the same period of 2015. Highlights of significant cash sources and uses are as follows:
• | Net proceeds of $14.2 million related to the sale of operating properties in 2016, compared to net proceeds of $170.0 million related to the sale of seven operating properties in March 2015 and the sale of our Four Corner Square and Cornelius Gateway operating properties in December 2015; |
• | There were no property acquisitions in 2016, while there was a net cash outflow of $166.4 million related to acquisitions over the same period in 2015; and |
• | Increase in capital expenditures of $1.8 million, in addition to a decrease in construction payables of $3.0 million. In 2016, we substantially completed construction at our Tamiami Crossing and Holly Springs Towne Center - Phase II development properties, and incurred additional construction costs at several of our redevelopment properties. |
Cash used in financing activities was $86.3 million for the year ended December 31, 2016, compared to cash used in financing activities of $94.9 million in the same period of 2015. Highlights of significant cash sources and uses in financing activities during 2016 are as follows:
• | We retired approximately $139 million of secured loans that were secured by multiple operating properties via draws on our unsecured revolving credit facility; |
• | We issued $300 million of our senior unsecured notes in a public offering. The net proceeds of which were utilized to retire a $200 million term loan and the $75.9 million construction loan secured by our Parkside Town Commons operating property and to fund a portion of the retirement of $35 million in secured loans. |
• | We drew the remaining $100 million on our $200 million seven-year unsecured term loan and used the proceeds to pay down the unsecured revolving credit facility; |
• | We issued 137,229 of our common shares at an average price per share of $29.52 pursuant to our at-the-market equity program, generating gross proceeds of approximately $4.1 million and, after deducting commissions and other costs, net proceeds of approximately $3.8 million. The proceeds from these offerings were contributed to the Operating Partnership and used to pay down our unsecured revolving credit facility; and |
• | We made distributions to common shareholders and Common Unit holders of $98.6 million. |
Other Matters
Financial Instruments
We are exposed to capital market risk, such as changes in interest rates. In order to reduce the volatility relating to interest rate risk, we may enter into interest rate hedging arrangements from time to time. We do not utilize derivative financial instruments for trading or speculative purposes.
Off-Balance Sheet Arrangements
We do not currently have any off-balance sheet arrangements that in our opinion have, or are reasonably likely to have, a material current or future effect on our financial condition, results of operations, liquidity, capital expenditures or capital resources. We do, however, have certain obligations related to some of the projects in our operating and development properties.
As of December 31, 2017, we have outstanding letters of credit totaling $6.3 million, against which no amounts were advanced.
67
Contractual Obligations
The following table summarizes our contractual obligations to third parties based on contracts executed as of December 31, 2017.
($ in thousands) | Consolidated Long-term Debt and Interest1 | Development Activity and Tenant Allowances2 | Operating Ground Leases | Employment Contracts3 | Total | |||||||||||||||
2018 | $ | 110,663 | $ | 14,538 | $ | 1,686 | $ | 943 | $ | 127,830 | ||||||||||
2019 | 71,514 | — | 1,694 | — | 73,208 | |||||||||||||||
2020 | 113,121 | — | 1,777 | — | 114,898 | |||||||||||||||
2021 | 480,374 | — | 1,789 | — | 482,163 | |||||||||||||||
2022 | 447,348 | — | 1,814 | — | 449,162 | |||||||||||||||
Thereafter | 848,307 | — | 73,790 | — | 922,097 | |||||||||||||||
Total | $ | 2,071,327 | $ | 14,538 | $ | 82,550 | $ | 943 | $ | 2,169,358 | ||||||||||
____________________ | |
1 | Our long-term debt consists of both variable and fixed-rate debt and includes both principal and interest. Interest expense for variable-rate debt was calculated using the interest rates as of December 31, 2017. |
2 | Tenant allowances include commitments made to tenants at our operating and under construction development and redevelopment properties. |
3 | We have entered into employment agreements with certain members of senior management. Each employment agreement automatically renewed for one additional year on July 1, 2017. Each agreement will continue to renew each July 1st thereafter unless we or the individual elects not to renew the agreement. |
Obligations in Connection with Development and Redevelopment Projects Under Construction
We are obligated under various completion guarantees with lenders and tenants to complete all or portions of our under construction development and redevelopment projects. We believe we currently have sufficient financing in place to fund our investment in any existing or future projects through cash from operations, borrowings on our unsecured revolving credit facility and through our joint venture's borrowings on its construction loan for the Embassy Suites at University of Notre Dame.
Our share of estimated future costs for our under construction and future developments and redevelopments is further discussed on page 64 in the "Short and Long-Term Liquidity Needs" section.
Outstanding Indebtedness
The following table presents details of outstanding consolidated indebtedness as of December 31, 2017 and 2016 adjusted for hedges:
($ in thousands) | December 31, 2017 | December 31, 2016 | ||||||
Senior unsecured notes | $ | 550,000 | $ | 550,000 | ||||
Unsecured revolving credit facility | 60,100 | 79,600 | ||||||
Unsecured term loans | 400,000 | 400,000 | ||||||
Mortgage notes payable - fixed rate | 576,927 | 587,762 | ||||||
Mortgage notes payable - variable rate | 113,623 | 114,388 | ||||||
Net debt premiums and issuance costs, net | (1,411 | ) | (676 | ) | ||||
Total mortgage and other indebtedness | $ | 1,699,239 | $ | 1,731,074 | ||||
Consolidated indebtedness, including weighted average maturities and weighted average interest rates at December 31, 2017, is summarized below:
68
($ in thousands) | Outstanding Amount | Ratio | Weighted Average Interest Rate | Weighted Average Maturity (in years) | ||||||||
Fixed rate debt1 | $ | 1,562,423 | 92 | % | 4.10 | % | 5.6 | |||||
Variable rate debt | 138,227 | 8 | % | 3.06 | % | 4.1 | ||||||
Net debt premiums and issuance costs, net | (1,411 | ) | N/A | N/A | N/A | |||||||
Total | $ | 1,699,239 | 100 | % | 4.02 | % | 5.5 | |||||
____________________ | |
1 | Fixed rate debt includes, and variable rate date excludes, the portion of such debt that has been hedged by interest rate derivatives. As of December 31, 2017, $435.5 million in variable rate debt is hedged for a weighted average 1.9 years. |
Mortgage indebtedness is collateralized by certain real estate properties and leases. Mortgage indebtedness is generally repaid in monthly installments of interest and principal and matures over various terms through 2030.
Variable interest rates on mortgage indebtedness are based on LIBOR plus spreads ranging from 160 to 225 basis points. At December 31, 2017, the one-month LIBOR interest rate was 1.56%. Fixed interest rates on mortgage loans range from 3.78% to 6.78%.
69
ITEM 7A. QUANTITATIVE AND QUALITATIVE DISCLOSURES ABOUT MARKET RISK
Our future income, cash flows and fair values relevant to financial instruments depend upon prevailing interest rates. We are exposed to interest rate changes primarily through our variable-rate unsecured credit facility and unsecured term loans and other property-specific variable-rate mortgages. Our objectives with respect to interest rate risk are to limit the impact of interest rate changes on operations and cash flows, and to lower its overall borrowing costs. To achieve these objectives, we may borrow at fixed rates and may enter into derivative financial instruments such as interest rate swaps, hedges, etc., in order to mitigate its interest rate risk on a related variable-rate financial instrument. As a matter of policy, we do not utilize financial instruments for trading or speculative transactions.
We had $1.7 billion of outstanding consolidated indebtedness as of December 31, 2017 (inclusive of net unamortized net debt premiums and issuance costs of $1.4 million). As of December 31, 2017, we were party to various consolidated interest rate hedge agreements totaling $435.5 million, with maturities over various terms through 2021. Reflecting the effects of these hedge agreements, our fixed and variable rate debt would have been $1.6 billion (92%) and $0.1 billion (8%), respectively, of our total consolidated indebtedness at December 31, 2017.
We have $37.9 million of fixed rate debt maturing during 2018. A 100 basis point increase in market interest rates would not materially impact the annual cash flows associated with these loans. A 100 basis point change in interest rates on our unhedged variable rate debt as of December 31, 2017 would change our annual cash flow by $1.4 million. Based upon the terms of our variable rate debt, we are most vulnerable to a change in short-term LIBOR interest rates.
ITEM 8. FINANCIAL STATEMENTS AND SUPPLEMENTARY DATA
The consolidated financial statements of the Company included in this Report are listed in Part IV, Item 15(a) of this report.
ITEM 9. CHANGES IN AND DISAGREEMENTS WITH ACCOUNTANTS ON ACCOUNTING AND FINANCIAL DISCLOSURE
None.
ITEM 9A. CONTROLS AND PROCEDURES
Kite Realty Group Trust
Evaluation of Disclosure Controls and Procedures
An evaluation was performed under the supervision and with the participation of the Parent Company’s management, including its Chief Executive Officer and Chief Financial Officer, of the effectiveness of its disclosure controls and procedures (as defined in Rules 13a-15(e) and 15d-15(e) under the Securities and Exchange Act of 1934, as amended) as of the end of the period covered by this report. Based on that evaluation, the Parent Company's Chief Executive Officer and Chief Financial Officer concluded that these disclosure controls and procedures were effective.
Changes in Internal Control Over Financial Reporting
There has been no change in the Parent Company’s internal control over financial reporting (as defined in Rule 13a-15(f) under the Securities Exchange Act of 1934) identified in connection with the evaluation required by Rule 13a-15(b) under the Securities Exchange Act of 1934 of the effectiveness of our disclosure controls and procedures (as defined in Rule 13a-15(e) under the Securities Exchange Act of 1934) as of December 31, 2017 that has materially affected, or is reasonably likely to materially affect, its internal control over financial reporting.
Management Report on Internal Control Over Financial Reporting
The Parent Company is responsible for establishing and maintaining adequate internal control over financial reporting, as that term is defined in Rule 13a-15(f) of the Exchange Act. Under the supervision of and with the participation of the Parent Company's management, including its Chief Executive Officer and Chief Financial Officer, the Parent Company conducted an evaluation of the effectiveness of its internal control over financial reporting based on the 2013 framework in Internal Control – Integrated Framework issued by the Committee of Sponsoring Organizations of the Treadway Commission. Based on its evaluation under the framework in Internal Control – Integrated Framework, the Parent Company's management has concluded that its internal control over financial reporting was effective as of December 31, 2017.
70
The Parent Company's independent auditors, Ernst & Young LLP, an independent registered public accounting firm, have issued a report on its internal control over financial reporting as stated in their report which is included herein.
The Parent Company's internal control system was designed to provide reasonable assurance to our management and Board of Trustees regarding the preparation and fair presentation of published financial statements. All internal control systems, no matter how well designed, have inherent limitations. Therefore, even those systems determined to be effective can provide only reasonable assurance with respect to financial statement preparation and presentation.
Kite Realty Group, L.P.
Evaluation of Disclosure Controls and Procedures
An evaluation was performed under the supervision and with the participation of the Operating Partnership’s management, including its Chief Executive Officer and Chief Financial Officer, of the effectiveness of its disclosure controls and procedures (as defined in Rules 13a-15(e) and 15d-15(e) under the Securities and Exchange Act of 1934, as amended) as of the end of the period covered by this report. Based on that evaluation, the Operating Partnership's Chief Executive Officer and Chief Financial Officer concluded that these disclosure controls and procedures were effective.
Changes in Internal Control Over Financial Reporting
There has been no change in the Operating Partnership’s internal control over financial reporting (as defined in Rule 13a-15(f) under the Securities Exchange Act of 1934) identified in connection with the evaluation required by Rule 13a-15(b) under the Securities Exchange Act of 1934 of the effectiveness of our disclosure controls and procedures (as defined in Rule 13a-15(e) under the Securities Exchange Act of 1934) as of December 31, 2017 that has materially affected, or is reasonably likely to materially affect, its internal control over financial reporting.
Management Report on Internal Control Over Financial Reporting
The Operating Partnership is responsible for establishing and maintaining adequate internal control over financial reporting, as that term is defined in Rule 13a-15(f) of the Exchange Act. Under the supervision of and with the participation of the Operating Partnership's management, including its Chief Executive Officer and Chief Financial Officer, the Operating Partnership conducted an evaluation of the effectiveness of its internal control over financial reporting based on the 2013 framework in Internal Control – Integrated Framework issued by the Committee of Sponsoring Organizations of the Treadway Commission. Based on its evaluation under the framework in Internal Control – Integrated Framework, the Operating Partnership's management has concluded that its internal control over financial reporting was effective as of December 31, 2017.
The Operating Partnership's independent auditors, Ernst & Young LLP, an independent registered public accounting firm, have issued a report on its internal control over financial reporting as stated in their report which is included herein.
The Operating Partnership's internal control system was designed to provide reasonable assurance to our management and Board of Trustees regarding the preparation and fair presentation of published financial statements. All internal control systems, no matter how well designed, have inherent limitations. Therefore, even those systems determined to be effective can provide only reasonable assurance with respect to financial statement preparation and presentation.
Report of Independent Registered Public Accounting Firm
The Shareholders and the Board of Trustees of Kite Realty Group Trust:
Opinion on Internal Control over Financial Reporting
We have audited Kite Realty Group Trust’s internal control over financial reporting as of December 31, 2017, based on criteria established in Internal Control - Integrated Framework issued by the Committee of Sponsoring Organizations of the Treadway Commission (2013 Framework) (the COSO criteria). In our opinion, Kite Realty Group Trust (the Company) maintained, in all material respects, effective internal control over financial reporting as of December 31, 2017, based on the COSO criteria.
We also have audited, in accordance with the standards of the Public Company Accounting Oversight Board (United States) (PCAOB), the 2017 consolidated financial statements of the Company and our report dated February 20, 2018 expressed an unqualified opinion thereon.
Basis for Opinion
The Company’s management is responsible for maintaining effective internal control over financial reporting and for its assessment of the effectiveness of internal control over financial reporting included in the accompanying Management’s Report on Internal Control over Financial Reporting. Our responsibility is to express an opinion on the Company’s internal control over financial reporting based on our audit. We are a public accounting firm registered with the PCAOB and are required to be independent with respect to the Company in accordance with the U.S. federal securities laws and the applicable rules and regulations of the Securities and Exchange Commission and the PCAOB.
We conducted our audit in accordance with the standards of the PCAOB. Those standards require that we plan and perform the audit to obtain reasonable assurance about whether effective internal control over financial reporting was maintained in all material respects.
Our audit included obtaining an understanding of internal control over financial reporting, assessing the risk that a material weakness exists, testing and evaluating the design and operating effectiveness of internal control based on the assessed risk, and performing such other procedures as we considered necessary in the circumstances. We believe that our audit provides a reasonable basis for our opinion.
Definition and Limitations of Internal Control Over Financial Reporting
A company’s internal control over financial reporting is a process designed to provide reasonable assurance regarding the reliability of financial reporting and the preparation of financial statements for external purposes in accordance with generally accepted accounting principles. A company’s internal control over financial reporting includes those policies and procedures that (1) pertain to the maintenance of records that, in reasonable detail, accurately and fairly reflect the transactions and dispositions of the assets of the company; (2) provide reasonable assurance that transactions are recorded as necessary to permit preparation of financial statements in accordance with generally accepted accounting principles, and that receipts and expenditures of the company are being made only in accordance with authorizations of management and directors of the company; and (3) provide reasonable assurance regarding prevention or timely detection of unauthorized acquisition, use, or disposition of the company’s assets that could have a material effect on the financial statements.
Because of its inherent limitations, internal control over financial reporting may not prevent or detect misstatements. Also, projections of any evaluation of effectiveness to future periods are subject to the risk that controls may become inadequate because of changes in conditions, or that the degree of compliance with the policies or procedures may deteriorate.
/s/ Ernst & Young LLP
Indianapolis, Indiana
February 20, 2018
Report of Independent Registered Public Accounting Firm
The Partners of Kite Realty Group, L.P. and subsidiaries and the Board of Trustees of Kite Realty Group Trust:
Opinion on Internal Control over Financial Reporting
We have audited Kite Realty Group, L.P. and subsidiaries’ internal control over financial reporting as of December 31, 2017, based on criteria established in Internal Control - Integrated Framework issued by the Committee of Sponsoring Organizations of the Treadway Commission (2013 Framework) (the COSO criteria). In our opinion, Kite Realty Group, L.P and subsidiaries’ (the Partnership) maintained, in all material respects, effective internal control over financial reporting as of December 31, 2017, based on the COSO criteria.
We also have audited, in accordance with the standards of the Public Company Accounting Oversight Board (United States) (PCAOB), the 2017 consolidated financial statements of the Partnership and our report dated February 20, 2018 expressed an unqualified opinion thereon.
Basis for Opinion
The Partnership’s management is responsible for maintaining effective internal control over financial reporting and for its assessment of the effectiveness of internal control over financial reporting included in the accompanying Management’s Report on Internal Control over Financial Reporting. Our responsibility is to express an opinion on the Partnership’s internal control over financial reporting based on our audit. We are a public accounting firm registered with the PCAOB and are required to be independent with respect to the Partnership in accordance with the U.S. federal securities laws and the applicable rules and regulations of the Securities and Exchange Commission and the PCAOB.
We conducted our audit in accordance with the standards of the PCAOB. Those standards require that we plan and perform the audit to obtain reasonable assurance about whether effective internal control over financial reporting was maintained in all material respects.
Our audit included obtaining an understanding of internal control over financial reporting, assessing the risk that a material weakness exists, testing and evaluating the design and operating effectiveness of internal control based on the assessed risk, and performing such other procedures as we considered necessary in the circumstances. We believe that our audit provides a reasonable basis for our opinion.
Definition and Limitations of Internal Control Over Financial Reporting
A company’s internal control over financial reporting is a process designed to provide reasonable assurance regarding the reliability of financial reporting and the preparation of financial statements for external purposes in accordance with generally accepted accounting principles. A company’s internal control over financial reporting includes those policies and procedures that (1) pertain to the maintenance of records that, in reasonable detail, accurately and fairly reflect the transactions and dispositions of the assets of the company; (2) provide reasonable assurance that transactions are recorded as necessary to permit preparation of financial statements in accordance with generally accepted accounting principles, and that receipts and expenditures of the company are being made only in accordance with authorizations of management and directors of the company; and (3) provide reasonable assurance regarding prevention or timely detection of unauthorized acquisition, use, or disposition of the company’s assets that could have a material effect on the financial statements.
Because of its inherent limitations, internal control over financial reporting may not prevent or detect misstatements. Also, projections of any evaluation of effectiveness to future periods are subject to the risk that controls may become inadequate because of changes in conditions, or that the degree of compliance with the policies or procedures may deteriorate.
/s/ Ernst & Young LLP
Indianapolis, Indiana
February 20, 2018
ITEM 9B. OTHER INFORMATION
None
74
PART III
ITEM 10. DIRECTORS, EXECUTIVE OFFICERS AND CORPORATE GOVERNANCE
The information required by this Item is hereby incorporated by reference to the material appearing in our 2018 Annual Meeting Proxy Statement (the “Proxy Statement”), which we intend to file within 120 days after our fiscal year-end in accordance with Regulation 14A.
ITEM 11. EXECUTIVE COMPENSATION
The information required by this Item is hereby incorporated by reference to the material appearing in our Proxy Statement.
ITEM 12. SECURITY OWNERSHIP OF CERTAIN BENEFICIAL OWNERS AND MANAGEMENT AND RELATED SHAREHOLDER MATTERS
The information required by this Item is hereby incorporated by reference to the material appearing in our Proxy Statement.
ITEM 13. CERTAIN RELATIONSHIPS AND RELATED TRANSACTIONS AND DIRECTOR INDEPENDENCE
The information required by this Item is hereby incorporated by reference to the material appearing in our Proxy Statement.
ITEM 14. PRINCIPAL ACCOUNTANT FEES AND SERVICES
The information required by this Item is hereby incorporated by reference to the material appearing in our Proxy Statement.
PART IV
ITEM 15. EXHIBITS, AND FINANCIAL STATEMENT SCHEDULE
(a) | Documents filed as part of this report: | |||
(1) | Financial Statements: | |||
Consolidated financial statements for the Company listed on the index immediately preceding the financial statements at the end of this report. | ||||
(2) | Financial Statement Schedule: | |||
Financial statement schedule for the Company listed on the index immediately preceding the financial statements at the end of this report. | ||||
(3) | Exhibits: | |||
The Company files as part of this report the exhibits listed on the Exhibit Index. | ||||
(b) | Exhibits: | |||
The Company files as part of this report the exhibits listed on the Exhibit Index. Other financial statement schedules are omitted because they are not applicable or the required information is shown in the financial statements or notes thereto. | ||||
(c) | Financial Statement Schedule: | |||
The Company files as part of this report the financial statement schedule listed on the index immediately preceding the financial statements at the end of this report. | ||||
ITEM 16. FORM 10-K SUMMARY
Not applicable.
EXHIBIT INDEX
Exhibit No. | Description | Location | ||
2.1 | Incorporated by reference to Exhibit 2.1 to the Current Report on Form 8-K of Kite Realty Group Trust filed with the SEC on February 11, 2014 | |||
3.1 | Incorporated by reference to Exhibit 3.1 to the Annual Report on Form 10-K of Kite Realty Group Trust filed with the SEC on February 27, 2015 | |||
3.2 | Incorporated by reference to Exhibit 3.1 to the Current Report on Form 8-K of Kite Realty Group Trust filed with the SEC on May 28, 2015 | |||
3.3 | Incorporated by reference to Exhibit 3.2 to the Annual Report on Form 10-K of Kite Realty Group Trust filed with the SEC on February 27, 2015 | |||
3.4 | Incorporated by reference to Exhibit 3.2 to the Current Report on Form 8-K of Kite Realty Group Trust filed with the SEC on May 28, 2015 | |||
4.1 | Incorporated by reference to Exhibit 4.1 to Kite Realty Group Trust’s registration statement on Form S-11 (File No. 333-114224) declared effective by the SEC on August 10, 2004 | |||
4.2 | Incorporated by reference to Exhibit 4.1 to the Current Report on Form 8-K of Kite Realty Group Trust filed with the SEC on September 27, 2016 | |||
4.3 | Incorporated by reference to Exhibit 4.2 to the Current Report on Form 8-K of Kite Realty Group Trust filed with the SEC on September 27, 2016 | |||
4.4 | Incorporated by reference to Exhibits 4.2 and 4.3 to the Current Report on Form 8-K of Kite Realty Group Trust filed with the SEC on September 27, 2016 | |||
10.1 | Incorporated by reference to Exhibit 10.1 to the Current Report on Form 8-K of Kite Realty Group Trust filed with the SEC on August 20, 2004 | |||
10.2 | Incorporate by reference to Exhibit 10.1 to the Current Report on Form 8-K of Kite Realty Group Trust filed with the SEC on December 13, 2010 | |||
10.3 | Incorporated by reference to Exhibit 10.1 to the Current Report on Form 8-K of Kite Realty Group Trust filed with the SEC on March 12, 2012 | |||
10.4 | Incorporated by reference to Exhibit 10.1 to the Current Report on Form 8-K of Kite Realty Group Trust filed with the SEC on July 29, 2014 | |||
77
10.5 | Incorporated by reference to Exhibit 10.2 to the Current Report on Form 8-K of Kite Realty Group Trust filed with the SEC on July 29, 2014 | |||
10.6 | Incorporated by reference to Exhibit 10.3 to the Current Report on Form 8-K of Kite Realty Group Trust filed with the SEC on July 29, 2014 | |||
10.7 | Incorporated by reference to Exhibit 10.4 to the Current Report on Form 8-K of Kite Realty Group Trust filed with the SEC on July 29, 2014 | |||
10.8 | Incorporated by reference to Exhibit 10.8 the Quarterly Report on Form 10-Q of Kite Realty Group Trust for the period ended September 30, 2014. | |||
10.9 | Incorporated by reference to Exhibit 10.16 to the Current Report on Form 8-K of Kite Realty Group Trust filed with the SEC on August 20, 2004 | |||
10.10 | Incorporated by reference to Exhibit 10.17 to the Current Report on Form 8-K of Kite Realty Group Trust filed with the SEC on August 20, 2004 | |||
10.11 | Incorporated by reference to Exhibit 10.18 to the Current Report on Form 8-K of Kite Realty Group Trust filed with the SEC on August 20, 2004 | |||
10.12 | Incorporated by reference to Exhibit 10.19 to the Current Report on Form 8-K of Kite Realty Group Trust filed with the SEC on August 20, 2004 | |||
10.13 | Incorporated by reference to Exhibit 10.13 to the Annual Report on Form 10-K of Kite Realty Group Trust filed with the SEC on February 27, 2015 | |||
10.14 | Incorporated by reference to Exhibit 10.20 to the Current Report on Form 8-K of Kite Realty Group Trust filed with the SEC on August 20, 2004 | |||
10.15 | Incorporated by reference to Exhibit 10.21 to the Current Report on Form 8-K of Kite Realty Group Trust filed with the SEC on August 20, 2004 | |||
10.16 | Incorporated by reference to Exhibit 10.22 to the Current Report on Form 8-K of Kite Realty Group Trust filed with the SEC on August 20, 2004 | |||
10.17 | Incorporated by reference to Exhibit 10.23 to the Current Report on Form 8-K of Kite Realty Group Trust filed with the SEC on August 20, 2004 | |||
10.18 | Incorporated by reference to Exhibit 10.24 to the Current Report on Form 8-K of Kite Realty Group Trust filed with the SEC on August 20, 2004 | |||
78
10.19 | Incorporated by reference to Exhibit 10.4 to the Quarterly Report on Form 10-Q of Kite Realty Group Trust for the period ended September 30, 2008 | |||
10.20 | Incorporated by reference to Exhibit 10.20 to the Annual Report on Form 10-K of Kite Realty Group Trust for the period ended December 31, 2012 | |||
10.21 | Incorporated by reference to Exhibit 10.21 to the Annual Report on Form 10-K of Kite Realty Group Trust for the year ended December 31, 2013 | |||
10.22 | Incorporated by reference to Exhibit 10.22 to the Annual Report on Form 10-K of Kite Realty Group Trust for the year ended December 31, 2013 | |||
10.23 | Incorporated by reference to Exhibit 10.23 to the Annual Report on Form 10-K of Kite Realty Group Trust for the year ended December 31, 2013 | |||
10.24 | Incorporated by reference to Exhibit 10.24 to the Annual Report on Form 10-K of Kite Realty Group Trust filed with the SEC on February 27, 2015 | |||
10.25 | Incorporated by reference to Exhibit 10.25 to the Annual Report on Form 10-K of Kite Realty Group Trust filed with the SEC on February 27, 2015 | |||
10.26 | Incorporated by reference to Exhibit 10.26 to the Annual Report on Form 10-K of Kite Realty Group Trust filed with the SEC on February 27, 2015 | |||
10.27 | Incorporated by reference to Exhibit 10.1 to the Current Report on Form 8-K of Kite Realty Group Trust filed with the SEC on May 12, 2008 | |||
10.28 | Incorporated by reference to Exhibit 10.32 to the Current Report on Form 8-K of Kite Realty Group Trust filed with the SEC on August 20, 2004 | |||
10.29 | Incorporated by reference to Exhibit 10.2 to the Quarterly Report on Form 10-Q of Kite Realty Group Trust for the period ended September 30, 2005 | |||
10.30 | Incorporated by reference to Exhibit 10.33 to the Current Report on Form 8-K of Kite Realty Group Trust filed with the SEC on August 20, 2004 | |||
10.31 | Incorporated by reference to Exhibit 10.5 to the Current Report on Form 8-K of Kite Realty Group Trust filed with the SEC on July 29, 2014 | |||
10.32 | Incorporated by reference to Exhibit 10.1 to the Current Report on Form 8-K of Kite Realty Group Trust filed with the SEC on February 3, 2016 | |||
79
10.33 | Incorporated by reference to Exhibit 10.1 to the Registration Statement on Form S-8 of Kite Realty Group Trust filed with the SEC on May 8, 2013 | |||
10.34 | Incorporated by reference to Exhibit 10.1 to the Current Report on Form 8-K of Kite Realty Group Trust filed with the SEC on May 14, 2013 | |||
10.35 | Incorporated by reference to Exhibit 10.2 of the Current Report on Form 8-K of Kite Realty Group Trust filed with the SEC on May 14, 2013 | |||
10.36 | Incorporated by reference to Exhibit 10.36 of the Annual Report on Form 10-K of Kite Realty Group Trust filed with the SEC on February 26, 2016 | |||
10.37 | Incorporated by reference to Exhibit 10.1 to the Quarterly Report on Form 10-Q of Kite Realty Group Trust for the period ended June 30, 2006 | |||
10.38 | Incorporated by reference to Exhibit 10.38 of the Annual Report on Form 10-K of Kite Realty Group Trust filed with the SEC on February 27, 2017 | |||
10.39 | Incorporated by reference to Exhibit 10.1 to the Current Report on Form 8-K of Kite Realty Group Trust filed with the SEC on July 29, 2016 | |||
10.40 | Incorporated by reference to Exhibit 10.2 to the Current Report on Form 8-K of Kite Realty Group Trust filed with the SEC on July 29, 2016 | |||
10.41 | Incorporated by reference to Exhibit 10.1 to the Current Report on Form 8-K of Kite Realty Group Trust filed with the SEC on May 4, 2012 | |||
10.42 | Incorporated by reference to Exhibit 10.3 to the Current Report on Form 8-K of Kite Realty Group Trust filed with the SEC on March 4, 2013 | |||
10.43 | Incorporated by reference to Exhibit 10.1 to the Current Report on Form 8-K of Kite Realty Group Trust filed with the SEC on August 27, 2013 | |||
10.44 | Incorporated by reference to Exhibit 10.2 to the Current Report on Form 8-K of Kite Realty Group Trust filed with the SEC on May 4, 2012 | |||
10.45 | Incorporated by reference to Exhibit 10.1 to the Current Report on Form 8-K of Kite Realty Group Trust filed with the SEC on September 22, 2014 | |||
80
10.46 | Incorporated by reference to Exhibit 10.1 to the Current Report on Form 8-K of Kite Realty Group Trust filed with the SEC on September 3, 2015 | |||
10.47 | Incorporated by reference to Exhibit 10.1 to the Current Report on Form 8-K of Kite Realty Group Trust filed with the SEC on October 30, 2015 | |||
10.48 | Incorporated by reference to Exhibit 10.3 to the Current Report on Form 8-K of Kite Realty Group Trust filed with the SEC on July 29, 2016 | |||
10.49 | Filed herewith | |||
12.1 | Filed herewith | |||
12.2 | Filed herewith | |||
21.1 | Filed herewith | |||
23.1 | Filed herewith | |||
23.2 | Filed herewith | |||
31.1 | Filed herewith | |||
31.2 | Filed herewith | |||
31.3 | Filed herewith | |||
31.4 | Filed herewith | |||
32.1 | Filed herewith | |||
32.2 | Filed herewith | |||
99.1 | Filed herewith | |||
101.INS | XBRL Instance Document | Filed herewith | ||
81
101.SCH | XBRL Taxonomy Extension Schema Document | Filed herewith | ||
101.CAL | XBRL Taxonomy Extension Calculation Linkbase Document | Filed herewith | ||
101.DEF | XBRL Taxonomy Extension Definition Linkbase Document | Filed herewith | ||
101.LAB | XBRL Taxonomy Extension Label Linkbase Document | Filed herewith | ||
101.PRE | XBRL Taxonomy Extension Presentation Linkbase Document | Filed herewith | ||
____________________ |
* Denotes a management contract or compensatory, plan contract or arrangement. |
82
SIGNATURES
Pursuant to the requirements of Section 13 or 15(d) of the Securities Exchange Act of 1934, the Registrant has duly caused this report to be signed on its behalf by the undersigned thereunto duly authorized.
KITE REALTY GROUP TRUST | ||
(Registrant) | ||
/s/ John A. Kite | ||
John A. Kite | ||
February 20, 2018 | Chairman and Chief Executive Officer | |
(Date) | (Principal Executive Officer) | |
/s/ Daniel R. Sink | ||
Daniel R. Sink | ||
February 20, 2018 | Chief Financial Officer | |
(Date) | (Principal Financial Officer) | |
KITE REALTY GROUP L.P. AND SUBSIDIARIES | ||
(Registrant) | ||
/s/ John A. Kite | ||
John A. Kite | ||
February 20, 2018 | Chairman and Chief Executive Officer | |
(Date) | (Principal Executive Officer) | |
/s/ Daniel R. Sink | ||
Daniel R. Sink | ||
February 20, 2018 | Chief Financial Officer | |
(Date) | (Principal Financial Officer) | |
Pursuant to the requirements of the Securities Exchange Act of 1934, this report has been signed below by persons on behalf of the Registrant and in the capacities and on the dates indicated.
83
Signature | Title | Date | ||
/s/ John A. Kite | Chairman, Chief Executive Officer, and Trustee (Principal Executive Officer) | February 20, 2018 | ||
(John A. Kite) | ||||
/s/ William E. Bindley | Trustee | February 20, 2018 | ||
(William E. Bindley) | ||||
/s/ Victor J. Coleman | Trustee | February 20, 2018 | ||
(Victor J. Coleman) | ||||
/s/ Christie B. Kelly | Trustee | February 20, 2018 | ||
(Christie B. Kelly) | ||||
/s/ David R. O’Reilly | Trustee | February 20, 2018 | ||
(David R. O’Reilly) | ||||
/s/ Barton R. Peterson | Trustee | February 20, 2018 | ||
(Barton R. Peterson) | ||||
/s/ Lee A. Daniels | Trustee | February 20, 2018 | ||
(Lee A. Daniels) | ||||
/s/ Gerald W. Grupe | Trustee | February 20, 2018 | ||
(Gerald W. Grupe) | ||||
/s/ Charles H. Wurtzebach | Trustee | February 20, 2018 | ||
(Charles H. Wurtzebach) | ||||
/s/ Daniel R. Sink | Chief Financial Officer (Principal Financial Officer) | February 20, 2018 | ||
(Daniel R. Sink) | ||||
/s/ David E. Buell | Senior Vice President, Chief Accounting Officer | February 20, 2018 | ||
(David E. Buell) | ||||
84
Kite Realty Group Trust and Kite Realty Group, L.P. and subsidiaries
Index to Financial Statements
Page | ||
Consolidated Financial Statements: | ||
Kite Realty Group Trust: | ||
F-1 | ||
Kite Realty Group, L.P. and subsidiaries | ||
F-2 | ||
Kite Realty Group Trust: | ||
F-3 | ||
F-4 | ||
F-5 | ||
F-6 | ||
Kite Realty Group, L.P. and subsidiaries | ||
F-7 | ||
F-8 | ||
F-9 | ||
F-10 | ||
Kite Realty Group Trust and Kite Realty Group, L.P. and subsidiaries: | ||
F-11 | ||
Financial Statement Schedule: | ||
Kite Realty Group Trust and Kite Realty Group, L.P. and subsidiaries: | ||
F-44 | ||
F-49 | ||
All other schedules for which provision is made in the applicable accounting regulation of the Securities and Exchange Commission are not required under the related instructions or are inapplicable and therefore have been omitted. | ||
Report of Independent Registered Public Accounting Firm
The Shareholders and Board of Trustees of Kite Realty Group Trust:
Opinion on the Financial Statements
We have audited the accompanying consolidated balance sheets of Kite Realty Group Trust (the Company) as of December 31, 2017 and 2016, and the related consolidated statements of operations and comprehensive income, shareholders’ equity and cash flows for each of the three years in the period ended December 31, 2017, and the related notes and financial statement schedule listed in the Index at Item 15(a) (collectively referred to as the “consolidated financial statements”). In our opinion, the consolidated financial statements present fairly, in all material respects, the financial position of the Company at December 31, 2017 and 2016, and the results of its operations and its cash flows for each of the three years in the period ended December 31, 2017, in conformity with U.S. generally accepted accounting principles.
We also have audited, in accordance with the standards of the Public Company Accounting Oversight Board (United States) (PCAOB), the Company’s internal control over financial reporting as of December 31, 2017, based on criteria established in Internal Control-Integrated Framework issued by the Committee of sponsoring organizations of the Treadway Commission (2013 Framework) and our report dated February 20, 2018 expressed an unqualified opinion thereon.
Basis for Opinion
These financial statements are the responsibility of the Company’s management. Our responsibility is to express an opinion on the Company’s financial statements based on our audits. We are a public accounting firm registered with the PCAOB and are required to be independent with respect to the Company in accordance with the U.S. federal securities laws and the applicable rules and regulations of the Securities and Exchange Commission and the PCAOB.
We conducted our audits in accordance with the standards of the PCAOB. Those standards require that we plan and perform the audit to obtain reasonable assurance about whether the financial statements are free of material misstatement, whether due to error or fraud. Our audits included performing procedures to assess the risks of material misstatement of the financial statements, whether due to error or fraud, and performing procedures that respond to those risks. Such procedures included examining, on a test basis, evidence regarding the amounts and disclosures in the financial statements. Our audits also included evaluating the accounting principles used and significant estimates made by management, as well as evaluating the overall presentation of the financial statements. We believe that our audits provide a reasonable basis for our opinion.
/s/ Ernst & Young LLP
We have served as the Company’s auditor since 2004.
Indianapolis, Indiana
February 20, 2018
F-1
Report of Independent Registered Public Accounting Firm
The Partners of Kite Realty Group, L.P. and subsidiaries and the Board of Trustees of Kite Realty Group Trust:
Opinion on the Financial Statements
We have audited the accompanying consolidated balance sheets of Kite Realty Group, L.P. and subsidiaries (the Partnership) as of December 31, 2017 and 2016, and the related consolidated statements of operations and comprehensive income, partner’s equity and cash flows for each of the three years in the period ended December 31, 2017, and the related notes and financial statement schedule listed in the Index at Item 15(a) (collectively referred to as the “consolidated financial statements”). In our opinion, the consolidated financial statements present fairly, in all material respects, the financial position of the Partnership at December 31, 2017 and 2016, and the results of its operations and its cash flows for each of the three years in the period ended December 31, 2017, in conformity with U.S. generally accepted accounting principles.
We also have audited, in accordance with the standards of the Public Company Accounting Oversight Board (United States) (PCAOB), the Partnership’s internal control over financial reporting as of December 31, 2017, based on criteria established in Internal Control - Integrated Framework issued by the Committee of sponsoring organizations of the Treadway Commission (2013 Framework) and our report dated February 20, 2018 expressed an unqualified opinion thereon.
Basis for Opinion
These financial statements are the responsibility of the Partnership’s management. Our responsibility is to express an opinion on the Partnership’s financial statements based on our audits. We are a public accounting firm registered with the PCAOB and are required to be independent with respect to the Partnership in accordance with the U.S. federal securities laws and the applicable rules and regulations of the Securities and Exchange Commission and the PCAOB.
We conducted our audits in accordance with the standards of the PCAOB. Those standards require that we plan and perform the audit to obtain reasonable assurance about whether the financial statements are free of material misstatement, whether due to error or fraud. Our audits included performing procedures to assess the risks of material misstatement of the financial statements, whether due to error or fraud, and performing procedures that respond to those risks. Such procedures included examining, on a test basis, evidence regarding the amounts and disclosures in the financial statements. Our audits also included evaluating the accounting principles used and significant estimates made by management, as well as evaluating the overall presentation of the financial statements. We believe that our audits provide a reasonable basis for our opinion.
/s/ Ernst & Young LLP
We have served as the Partnership’s auditor since 2015.
Indianapolis, Indiana
February 20, 2018
F-2
Kite Realty Group Trust
Consolidated Balance Sheets
($ in thousands, except share data)
December 31, 2017 | December 31, 2016 | ||||||
Assets: | |||||||
Investment properties, at cost | $ | 3,957,884 | $ | 3,996,065 | |||
Less: accumulated depreciation | (664,614 | ) | (560,683 | ) | |||
3,293,270 | 3,435,382 | ||||||
Cash and cash equivalents | 24,082 | 19,874 | |||||
Tenant and other receivables, including accrued straight-line rent of $31,747 and $28,703 respectively, net of allowance for uncollectible accounts | 58,328 | 53,087 | |||||
Restricted cash and escrow deposits | 8,094 | 9,037 | |||||
Deferred costs and intangibles, net | 112,359 | 129,264 | |||||
Prepaid and other assets | 16,365 | 9,727 | |||||
Total Assets | $ | 3,512,498 | $ | 3,656,371 | |||
Liabilities and Equity: | |||||||
Mortgage and other indebtedness | $ | 1,699,239 | $ | 1,731,074 | |||
Accounts payable and accrued expenses | 78,482 | 80,664 | |||||
Deferred revenue and intangibles, net and other liabilities | 96,564 | 112,202 | |||||
Total Liabilities | 1,874,285 | 1,923,940 | |||||
Commitments and contingencies | — | — | |||||
Limited partners' interests in Operating Partnership and other redeemable noncontrolling interests | 72,104 | 88,165 | |||||
Equity: | |||||||
Kite Realty Group Trust Shareholders’ Equity | |||||||
Common Shares, $.01 par value, 225,000,000 shares authorized, 83,606,068 and 83,545,398 shares issued and outstanding at December 31, 2017 and December 31, 2016, respectively | 836 | 835 | |||||
Additional paid in capital and other | 2,071,418 | 2,062,360 | |||||
Accumulated other comprehensive income (loss) | 2,990 | (316 | ) | ||||
Accumulated deficit | (509,833 | ) | (419,305 | ) | |||
Total Kite Realty Group Trust Shareholders' Equity | 1,565,411 | 1,643,574 | |||||
Noncontrolling Interests | 698 | 692 | |||||
Total Equity | 1,566,109 | 1,644,266 | |||||
Total Liabilities and Equity | $ | 3,512,498 | $ | 3,656,371 | |||
The accompanying notes are an integral part of these consolidated financial statements.
F-3
Kite Realty Group Trust
Consolidated Statements of Operations and Comprehensive Income
($ in thousands, except share and per share data)
Year Ended December 31, | |||||||||||
2017 | 2016 | 2015 | |||||||||
Revenue: | |||||||||||
Minimum rent | $ | 273,444 | $ | 274,059 | $ | 263,794 | |||||
Tenant reimbursements | 73,000 | 70,482 | 70,235 | ||||||||
Other property related revenue | 11,998 | 9,581 | 12,976 | ||||||||
Fee income | 377 | — | — | ||||||||
Total revenue | 358,819 | 354,122 | 347,005 | ||||||||
Expenses: | |||||||||||
Property operating | 49,643 | 47,923 | 49,973 | ||||||||
Real estate taxes | 43,180 | 42,838 | 40,904 | ||||||||
General, administrative, and other | 21,749 | 20,603 | 18,709 | ||||||||
Transaction costs | — | 2,771 | 1,550 | ||||||||
Non-cash gain from release of assumed earnout liability | — | — | (4,832 | ) | |||||||
Impairment charge | 7,411 | — | 1,592 | ||||||||
Depreciation and amortization | 172,091 | 174,564 | 167,312 | ||||||||
Total expenses | 294,074 | 288,699 | 275,208 | ||||||||
Operating income | 64,745 | 65,423 | 71,797 | ||||||||
Interest expense | (65,702 | ) | (65,577 | ) | (56,432 | ) | |||||
Income tax benefit (expense) of taxable REIT subsidiary | 100 | (814 | ) | (186 | ) | ||||||
Non-cash gain on debt extinguishment | — | — | 5,645 | ||||||||
Gain on settlement | — | — | 4,520 | ||||||||
Other expense, net | (415 | ) | (169 | ) | (95 | ) | |||||
(Loss) income before gains on sale of operating properties, net | (1,272 | ) | (1,137 | ) | 25,249 | ||||||
Gains on sale of operating properties, net | 15,160 | 4,253 | 4,066 | ||||||||
Consolidated net income | 13,888 | 3,116 | 29,315 | ||||||||
Net income attributable to noncontrolling interests | (2,014 | ) | (1,933 | ) | (2,198 | ) | |||||
Net income attributable to Kite Realty Group Trust | 11,874 | 1,183 | 27,117 | ||||||||
Dividends on preferred shares | — | — | (7,877 | ) | |||||||
Non-cash adjustment for redemption of preferred shares | — | — | (3,797 | ) | |||||||
Net income attributable to common shareholders | $ | 11,874 | $ | 1,183 | $ | 15,443 | |||||
Net income per common share – basic | $ | 0.14 | $ | 0.01 | $ | 0.19 | |||||
Net income per common share – diluted | $ | 0.14 | $ | 0.01 | $ | 0.18 | |||||
Weighted average common shares outstanding - basic | 83,585,333 | 83,436,511 | 83,421,904 | ||||||||
Weighted average common shares outstanding - diluted | 83,690,418 | 83,465,500 | 83,534,381 | ||||||||
Dividends declared per common share | $ | 1.225 | $ | 1.165 | $ | 1.090 | |||||
Consolidated net income | $ | 13,888 | $ | 3,116 | $ | 29,315 | |||||
Change in fair value of derivatives | 3,384 | 1,871 | (995 | ) | |||||||
Total comprehensive income | 17,272 | 4,987 | 28,320 | ||||||||
Comprehensive income attributable to noncontrolling interests | (2,092 | ) | (1,975 | ) | (2,173 | ) | |||||
Comprehensive income attributable to Kite Realty Group Trust | $ | 15,180 | $ | 3,012 | $ | 26,147 | |||||
The accompanying notes are an integral part of these consolidated financial statements.
F-4
Kite Realty Group Trust
Consolidated Statements of Shareholders’ Equity
($ in thousands, except share data)
Preferred Shares | Common Shares | Additional Paid-in Capital | Accumulated Other Comprehensive (Loss) Income | Accumulated Deficit | Total | ||||||||||||||||||||||||
Shares | Amount | Shares | Amount | ||||||||||||||||||||||||||
Balances, December 31, 2014 | 4,100,000 | $ | 102,500 | 83,490,663 | $ | 835 | $ | 2,044,425 | $ | (1,175 | ) | $ | (247,801 | ) | $ | 1,898,784 | |||||||||||||
Stock compensation activity | — | — | (173,798 | ) | (2 | ) | 3,744 | — | — | 3,742 | |||||||||||||||||||
Other comprehensive loss attributable to Kite Realty Group Trust | — | — | — | — | — | (970 | ) | — | (970 | ) | |||||||||||||||||||
Distributions declared to common shareholders | — | — | — | — | — | — | (90,899 | ) | (90,899 | ) | |||||||||||||||||||
Distributions to preferred shareholders | — | — | — | — | — | — | (7,877 | ) | (7,877 | ) | |||||||||||||||||||
Redemption of preferred shares | (4,100,000 | ) | (102,500 | ) | — | — | 3,797 | — | (3,797 | ) | (102,500 | ) | |||||||||||||||||
Net income attributable to Kite Realty Group Trust | — | — | — | — | — | — | 27,117 | 27,117 | |||||||||||||||||||||
Acquisition of partners' interests in consolidated joint ventures | — | — | — | — | 1,445 | — | — | 1,445 | |||||||||||||||||||||
Exchange of redeemable noncontrolling interests for common shares | — | — | 18,000 | — | 487 | — | — | 487 | |||||||||||||||||||||
Adjustment to redeemable noncontrolling interests | — | — | — | — | (3,353 | ) | — | — | (3,353 | ) | |||||||||||||||||||
Balances, December 31, 2015 | — | $ | — | 83,334,865 | $ | 833 | $ | 2,050,545 | $ | (2,145 | ) | $ | (323,257 | ) | $ | 1,725,976 | |||||||||||||
Stock compensation activity | — | — | 67,804 | 1 | 5,042 | — | — | 5,043 | |||||||||||||||||||||
Issuance of common shares under at-the-market plan, net | — | — | 137,229 | 1 | 3,836 | — | — | 3,837 | |||||||||||||||||||||
Other comprehensive income attributable to Kite Realty Group Trust | — | — | — | — | — | 1,829 | — | 1,829 | |||||||||||||||||||||
Distributions declared to common shareholders | — | — | — | — | — | — | (97,231 | ) | (97,231 | ) | |||||||||||||||||||
Net income attributable to Kite Realty Group Trust | — | — | — | — | — | — | 1,183 | 1,183 | |||||||||||||||||||||
Exchange of redeemable noncontrolling interests for common shares | — | — | 5,500 | — | 149 | — | — | 149 | |||||||||||||||||||||
Adjustment to redeemable noncontrolling interests | — | — | — | — | 2,788 | — | — | 2,788 | |||||||||||||||||||||
Balances, December 31, 2016 | — | $ | — | 83,545,398 | $ | 835 | $ | 2,062,360 | $ | (316 | ) | $ | (419,305 | ) | $ | 1,643,574 | |||||||||||||
Stock compensation activity | — | — | 48,670 | 1 | 5,915 | — | — | 5,916 | |||||||||||||||||||||
Other comprehensive income attributable to Kite Realty Group Trust | — | — | — | — | 3,306 | — | 3,306 | ||||||||||||||||||||||
Distributions declared to common shareholders | — | — | — | — | — | — | (102,402 | ) | (102,402 | ) | |||||||||||||||||||
Net income attributable to Kite Realty Group Trust | — | — | — | — | — | — | 11,874 | 11,874 | |||||||||||||||||||||
Acquisition of partner's noncontrolling interest in Fishers Station operating property | — | — | (3,750 | ) | — | — | (3,750 | ) | |||||||||||||||||||||
Exchange of redeemable noncontrolling interests for common shares | — | — | 12,000 | — | 236 | — | — | 236 | |||||||||||||||||||||
Adjustment to redeemable noncontrolling interests | — | — | 6,657 | — | — | 6,657 | |||||||||||||||||||||||
Balances, December 31, 2017 | — | $ | — | 83,606,068 | $ | 836 | $ | 2,071,418 | $ | 2,990 | $ | (509,833 | ) | $ | 1,565,411 | ||||||||||||||
The accompanying notes are an integral part of these consolidated financial statements.
F-5
Kite Realty Group Trust
Consolidated Statements of Cash Flows
($ in thousands)
Year Ended December 31, | |||||||||||
2017 | 2016 | 2015 | |||||||||
Cash flow from operating activities: | |||||||||||
Consolidated net income | $ | 13,888 | $ | 3,116 | $ | 29,315 | |||||
Adjustments to reconcile consolidated net income to net cash provided by operating activities: | |||||||||||
Gain on sale of operating properties, net of tax | (15,160 | ) | (4,253 | ) | (4,066 | ) | |||||
Impairment charge | 7,411 | — | 1,592 | ||||||||
Non-cash gain on debt extinguishment | — | — | (5,645 | ) | |||||||
Loss on debt extinguishment | — | 1,430 | — | ||||||||
Straight-line rent | (4,696 | ) | (5,453 | ) | (5,638 | ) | |||||
Depreciation and amortization | 174,625 | 179,084 | 170,521 | ||||||||
Provision for credit losses, net of recoveries | 2,786 | 2,771 | 4,331 | ||||||||
Compensation expense for equity awards | 5,987 | 5,214 | 4,580 | ||||||||
Amortization of debt fair value adjustment | (2,913 | ) | (4,412 | ) | (5,834 | ) | |||||
Amortization of in-place lease liabilities | (3,677 | ) | (6,863 | ) | (3,347 | ) | |||||
Non-cash gain from release of assumed earnout liability | — | — | (4,832 | ) | |||||||
Changes in assets and liabilities: | |||||||||||
Tenant receivables | (5,832 | ) | (519 | ) | (1,510 | ) | |||||
Deferred costs and other assets | (12,533 | ) | (13,509 | ) | (6,646 | ) | |||||
Accounts payable, accrued expenses, deferred revenue, and other liabilities | (6,228 | ) | (388 | ) | (903 | ) | |||||
Payments on assumed earnout liability | — | (1,285 | ) | (2,581 | ) | ||||||
Net cash provided by operating activities | 153,658 | 154,933 | 169,337 | ||||||||
Cash flow from investing activities: | |||||||||||
Acquisitions of interests in properties | — | — | (166,411 | ) | |||||||
Capital expenditures, net | (70,526 | ) | (94,319 | ) | (92,564 | ) | |||||
Net proceeds from sales of operating properties | 76,076 | 14,186 | 170,016 | ||||||||
Change in construction payables | (4,276 | ) | (3,024 | ) | 4,562 | ||||||
Collection of note receivable | — | 500 | — | ||||||||
Capital contribution to unconsolidated joint venture | (1,400 | ) | — | — | |||||||
Net cash used in investing activities | (126 | ) | (82,657 | ) | (84,397 | ) | |||||
Cash flow from financing activities: | |||||||||||
Proceeds from issuance of common shares, net | — | 4,402 | — | ||||||||
Payments for redemption of preferred shares | — | — | (102,500 | ) | |||||||
Repurchases of common shares upon the vesting of restricted shares | (808 | ) | (1,125 | ) | (1,002 | ) | |||||
Purchase of redeemable noncontrolling interests | — | — | (33,998 | ) | |||||||
Acquisition of partner's interest in Fishers Station operating property | (3,750 | ) | — | — | |||||||
Loan proceeds | 97,700 | 608,301 | 984,303 | ||||||||
Loan transaction costs | — | (8,084 | ) | (4,913 | ) | ||||||
Loan payments | (129,156 | ) | (589,501 | ) | (835,019 | ) | |||||
Loss on debt extinguishment | — | (1,430 | ) | — | |||||||
Distributions paid – common shareholders | (101,128 | ) | (94,669 | ) | (89,379 | ) | |||||
Distributions paid – preferred shareholders | — | — | (8,582 | ) | |||||||
Distributions paid – redeemable noncontrolling interests | (3,921 | ) | (3,924 | ) | (3,681 | ) | |||||
Distributions to noncontrolling interests | — | (252 | ) | (115 | ) | ||||||
Payment for partial redemption of redeemable noncontrolling interests | (8,261 | ) | — | — | |||||||
Net cash used in financing activities | (149,324 | ) | (86,282 | ) | (94,886 | ) | |||||
Increase (decrease) in cash and cash equivalents | 4,208 | (14,006 | ) | (9,946 | ) | ||||||
Cash and cash equivalents, beginning of year | 19,874 | 33,880 | 43,826 | ||||||||
Cash and cash equivalents, end of year | $ | 24,082 | $ | 19,874 | $ | 33,880 | |||||
Supplemental disclosures | |||||||||||
Cash paid for interest, net of capitalized interest | $ | 68,819 | $ | 67,172 | $ | 61,306 | |||||
Cash paid for taxes | $ | — | $ | 545 | $ | 281 | |||||
The accompanying notes are an integral part of these consolidated financial statements.
F-6
Kite Realty Group, L.P. and subsidiaries
Consolidated Balance Sheets
($ in thousands, except unit data)
December 31, 2017 | December 31, 2016 | ||||||
Assets: | |||||||
Investment properties, at cost | $ | 3,957,884 | $ | 3,996,065 | |||
Less: accumulated depreciation | (664,614 | ) | (560,683 | ) | |||
3,293,270 | 3,435,382 | ||||||
Cash and cash equivalents | 24,082 | 19,874 | |||||
Tenant and other receivables, including accrued straight-line rent of $31,747 and $28,703 respectively, net of allowance for uncollectible accounts | 58,328 | 53,087 | |||||
Restricted cash and escrow deposits | 8,094 | 9,037 | |||||
Deferred costs and intangibles, net | 112,359 | 129,264 | |||||
Prepaid and other assets | 16,365 | 9,727 | |||||
Total Assets | $ | 3,512,498 | $ | 3,656,371 | |||
Liabilities and Equity: | |||||||
Mortgage and other indebtedness | $ | 1,699,239 | $ | 1,731,074 | |||
Accounts payable and accrued expenses | 78,482 | 80,664 | |||||
Deferred revenue and intangibles, net and other liabilities | 96,564 | 112,202 | |||||
Total Liabilities | 1,874,285 | 1,923,940 | |||||
Commitments and contingencies | — | — | |||||
Limited partners' interests in Operating Partnership and other redeemable noncontrolling interests | 72,104 | 88,165 | |||||
Partners Equity: | |||||||
Parent Company: | |||||||
Common equity, 83,606,068 and 83,545,398 units issued and outstanding at December 31, 2017 and December 31, 2016, respectively | 1,562,421 | 1,643,890 | |||||
Accumulated other comprehensive income (loss) | 2,990 | (316 | ) | ||||
Total Partners Equity | 1,565,411 | 1,643,574 | |||||
Noncontrolling Interests | 698 | 692 | |||||
Total Equity | 1,566,109 | 1,644,266 | |||||
Total Liabilities and Equity | $ | 3,512,498 | $ | 3,656,371 | |||
The accompanying notes are an integral part of these consolidated financial statements.
F-7
Kite Realty Group, L.P. and subsidiaries
Consolidated Statements of Operations and Comprehensive Income
($ in thousands, except unit and per unit data)
Year Ended December 31, | |||||||||||
2017 | 2016 | 2015 | |||||||||
Revenue: | |||||||||||
Minimum rent | $ | 273,444 | $ | 274,059 | $ | 263,794 | |||||
Tenant reimbursements | 73,000 | 70,482 | 70,235 | ||||||||
Other property related revenue | 11,998 | 9,581 | 12,976 | ||||||||
Fee income | 377 | — | — | ||||||||
Total revenue | 358,819 | 354,122 | 347,005 | ||||||||
Expenses: | |||||||||||
Property operating | 49,643 | 47,923 | 49,973 | ||||||||
Real estate taxes | 43,180 | 42,838 | 40,904 | ||||||||
General, administrative, and other | 21,749 | 20,603 | 18,709 | ||||||||
Transaction costs | — | 2,771 | 1,550 | ||||||||
Non-cash gain from release of assumed earnout liability | — | — | (4,832 | ) | |||||||
Impairment charge | 7,411 | — | 1,592 | ||||||||
Depreciation and amortization | 172,091 | 174,564 | 167,312 | ||||||||
Total expenses | 294,074 | 288,699 | 275,208 | ||||||||
Operating income | 64,745 | 65,423 | 71,797 | ||||||||
Interest expense | (65,702 | ) | (65,577 | ) | (56,432 | ) | |||||
Income tax benefit (expense) of taxable REIT subsidiary | 100 | (814 | ) | (186 | ) | ||||||
Non-cash gain on debt extinguishment | — | — | 5,645 | ||||||||
Gain on settlement | — | — | 4,520 | ||||||||
Other expense, net | (415 | ) | (169 | ) | (95 | ) | |||||
(Loss) income before gains on sale of operating properties, net | (1,272 | ) | (1,137 | ) | 25,249 | ||||||
Gain on sale of operating properties, net | 15,160 | 4,253 | 4,066 | ||||||||
Consolidated net income | 13,888 | 3,116 | 29,315 | ||||||||
Net income attributable to noncontrolling interests | (1,733 | ) | (1,906 | ) | (1,854 | ) | |||||
Dividends on preferred units | — | — | (7,877 | ) | |||||||
Non-cash adjustment for redemption of preferred shares | — | — | (3,797 | ) | |||||||
Net income attributable to common unitholders | $ | 12,155 | $ | 1,210 | $ | 15,787 | |||||
Allocation of net income: | |||||||||||
Limited Partners | $ | 281 | $ | 27 | $ | 344 | |||||
Parent Company | 11,874 | 1,183 | 15,443 | ||||||||
$ | 12,155 | $ | 1,210 | $ | 15,787 | ||||||
Net income per unit - basic | $ | 0.14 | $ | 0.01 | $ | 0.19 | |||||
Net income per unit - diluted | $ | 0.14 | $ | 0.01 | $ | 0.18 | |||||
Weighted average common units outstanding - basic | 85,566,272 | 85,374,910 | 85,219,827 | ||||||||
Weighted average common units outstanding - diluted | 85,671,358 | 85,403,899 | 85,332,303 | ||||||||
Distributions declared per common unit | $ | 1.225 | $ | 1.165 | $ | 1.090 | |||||
Consolidated net income | $ | 13,888 | $ | 3,116 | $ | 29,315 | |||||
Change in fair value of derivatives | 3,384 | 1,871 | (995 | ) | |||||||
Total comprehensive income | 17,272 | 4,987 | 28,320 | ||||||||
Comprehensive income attributable to noncontrolling interests | (1,733 | ) | (1,906 | ) | (1,854 | ) | |||||
Comprehensive income attributable to common unitholders | $ | 15,539 | $ | 3,081 | $ | 26,466 | |||||
The accompanying notes are an integral part of these consolidated financial statements.
F-8
Kite Realty Group, L.P. and subsidiaries
Consolidated Statements of Partner's Equity
($ in thousands)
General Partner | Total | ||||||||||||||
Common Equity | Preferred Equity | Accumulated Other Comprehensive (Loss) Income | |||||||||||||
Balances, December 31, 2014 | $ | 1,797,459 | $ | 102,500 | $ | (1,175 | ) | $ | 1,898,784 | ||||||
Stock compensation activity | 3,742 | — | — | 3,742 | |||||||||||
Other comprehensive loss attributable to Parent Company | — | — | (970 | ) | (970 | ) | |||||||||
Distributions declared to Parent Company | (90,899 | ) | — | — | (90,899 | ) | |||||||||
Distributions to preferred unitholders | — | (7,877 | ) | — | (7,877 | ) | |||||||||
Redemption of preferred units | 3,797 | (102,500 | ) | — | (98,703 | ) | |||||||||
Net income | 15,443 | 7,877 | — | 23,320 | |||||||||||
Acquisition of partners' interests in consolidated joint ventures | 1,445 | — | — | 1,445 | |||||||||||
Conversion of Limited Partner Units to shares of the Parent Company | 487 | — | — | 487 | |||||||||||
Adjustment to redeemable noncontrolling interests | (3,353 | ) | — | — | (3,353 | ) | |||||||||
Balances, December 31, 2015 | $ | 1,728,121 | $ | — | $ | (2,145 | ) | $ | 1,725,976 | ||||||
Stock compensation activity | 5,043 | — | — | 5,043 | |||||||||||
Capital Contribution from the General Partner | 3,837 | — | — | 3,837 | |||||||||||
Other comprehensive income attributable to Parent Company | — | — | 1,829 | 1,829 | |||||||||||
Distributions declared to Parent Company | (97,231 | ) | — | — | (97,231 | ) | |||||||||
Net income | 1,183 | — | — | 1,183 | |||||||||||
Conversion of Limited Partner Units to shares of the Parent Company | 149 | — | — | 149 | |||||||||||
Adjustment to redeemable noncontrolling interests | 2,788 | — | — | 2,788 | |||||||||||
Balances, December 31, 2016 | $ | 1,643,890 | $ | — | $ | (316 | ) | $ | 1,643,574 | ||||||
Stock compensation activity | 5,916 | — | — | 5,916 | |||||||||||
Other comprehensive income attributable to Parent Company | — | — | 3,306 | 3,306 | |||||||||||
Distributions declared to Parent Company | (102,402 | ) | — | — | (102,402 | ) | |||||||||
Net income | 11,874 | — | — | 11,874 | |||||||||||
Acquisition of partner's interest in Fishers Station operating property | (3,750 | ) | — | — | (3,750 | ) | |||||||||
Conversion of Limited Partner Units to shares of the Parent Company | 236 | — | — | 236 | |||||||||||
Adjustment to redeemable noncontrolling interests | 6,657 | — | — | 6,657 | |||||||||||
Balances, December 31, 2017 | $ | 1,562,421 | $ | — | $ | 2,990 | $ | 1,565,411 | |||||||
The accompanying notes are an integral part of these consolidated financial statements.
F-9
Kite Realty Group, L.P. and subsidiaries
Consolidated Statements of Cash Flows
($ in thousands)
Year Ended December 31, | |||||||||||
2017 | 2016 | 2015 | |||||||||
Cash flow from operating activities: | |||||||||||
Consolidated net income | $ | 13,888 | $ | 3,116 | $ | 29,315 | |||||
Adjustments to reconcile consolidated net income to net cash provided by operating activities: | |||||||||||
Gain on sale of operating properties, net of tax | (15,160 | ) | (4,253 | ) | (4,066 | ) | |||||
Impairment charge | 7,411 | — | 1,592 | ||||||||
Non-cash gain on debt extinguishment | — | — | (5,645 | ) | |||||||
Loss on debt extinguishment | — | 1,430 | — | ||||||||
Straight-line rent | (4,696 | ) | (5,453 | ) | (5,638 | ) | |||||
Depreciation and amortization | 174,625 | 179,084 | 170,521 | ||||||||
Provision for credit losses, net of recoveries | 2,786 | 2,771 | 4,331 | ||||||||
Compensation expense for equity awards | 5,987 | 5,214 | 4,580 | ||||||||
Amortization of debt fair value adjustment | (2,913 | ) | (4,412 | ) | (5,834 | ) | |||||
Amortization of in-place lease liabilities | (3,677 | ) | (6,863 | ) | (3,347 | ) | |||||
Non-cash gain from release of assumed earnout liability | — | — | (4,832 | ) | |||||||
Changes in assets and liabilities: | |||||||||||
Tenant receivables | (5,832 | ) | (519 | ) | (1,510 | ) | |||||
Deferred costs and other assets | (12,533 | ) | (13,509 | ) | (6,646 | ) | |||||
Accounts payable, accrued expenses, deferred revenue, and other liabilities | (6,228 | ) | (388 | ) | (903 | ) | |||||
Payments on assumed earnout liability | — | (1,285 | ) | (2,581 | ) | ||||||
Net cash provided by operating activities | 153,658 | 154,933 | 169,337 | ||||||||
Cash flow from investing activities: | |||||||||||
Acquisitions of interests in properties | — | — | (166,411 | ) | |||||||
Capital expenditures, net | (70,526 | ) | (94,319 | ) | (92,564 | ) | |||||
Net proceeds from sales of operating properties | 76,076 | 14,186 | 170,016 | ||||||||
Change in construction payables | (4,276 | ) | (3,024 | ) | 4,562 | ||||||
Collection of note receivable | — | 500 | — | ||||||||
Capital contribution to unconsolidated joint venture | (1,400 | ) | — | — | |||||||
Net cash used in investing activities | (126 | ) | (82,657 | ) | (84,397 | ) | |||||
Cash flow from financing activities: | |||||||||||
Contributions from the Parent Company | — | 4,402 | — | ||||||||
Payments for redemption of preferred units | — | — | (102,500 | ) | |||||||
Distributions to the Parent Company for repurchases of common shares upon the vesting of restricted shares | (808 | ) | (1,125 | ) | (1,002 | ) | |||||
Purchase of redeemable noncontrolling interests | — | — | (33,998 | ) | |||||||
Acquisition of partner's interest in Fishers Station operating property | (3,750 | ) | — | — | |||||||
Loan proceeds | 97,700 | 608,301 | 984,303 | ||||||||
Loan transaction costs | — | (8,084 | ) | (4,913 | ) | ||||||
Loan payments | (129,156 | ) | (589,501 | ) | (835,019 | ) | |||||
Loss on debt extinguishment | — | (1,430 | ) | — | |||||||
Distributions paid – common unitholders | (101,128 | ) | (94,669 | ) | (89,379 | ) | |||||
Distributions paid – preferred unitholders | — | — | (8,582 | ) | |||||||
Distributions paid – redeemable noncontrolling interests | (3,921 | ) | (3,924 | ) | (3,681 | ) | |||||
Distributions to noncontrolling interests | — | (252 | ) | (115 | ) | ||||||
Payment for partial redemption of redeemable noncontrolling interests | (8,261 | ) | — | — | |||||||
Net cash used in financing activities | (149,324 | ) | (86,282 | ) | (94,886 | ) | |||||
Increase (decrease) in cash and cash equivalents | 4,208 | (14,006 | ) | (9,946 | ) | ||||||
Cash and cash equivalents, beginning of year | 19,874 | 33,880 | 43,826 | ||||||||
Cash and cash equivalents, end of year | $ | 24,082 | $ | 19,874 | $ | 33,880 | |||||
Supplemental disclosures | |||||||||||
Cash paid for interest, net of capitalized interest | $ | 68,819 | $ | 67,172 | $ | 61,306 | |||||
Cash paid for taxes | $ | — | $ | 545 | $ | 281 | |||||
The accompanying notes are an integral part of these consolidated financial statements.
F-10
Kite Realty Group Trust and Kite Realty Group, L.P. and subsidiaries
Notes to Consolidated Financial Statements
December 31, 2017
($ in thousands, except share and per share data)
Note 1. Organization
Kite Realty Group Trust (the "Parent Company"), through its majority-owned subsidiary, Kite Realty Group, L.P. (the “Operating Partnership”), owns interests in various operating subsidiaries and joint ventures engaged in the ownership, operation, acquisition, development and redevelopment of high-quality neighborhood and community shopping centers in selected markets in the United States. The terms "Company," "we," "us," and "our" refer to the Parent Company and the Operating Partnership, collectively, and those entities owned or controlled by the Parent Company and/or the Operating Partnership.
The Operating Partnership was formed on August 16, 2004, when the Parent Company contributed properties and the net proceeds from an initial public offering of shares of its common stock to the Operating Partnership. The Parent Company was organized in Maryland in 2004 to succeed in the development, acquisition, construction and real estate businesses of its predecessor. We believe the Company qualifies as a real estate investment trust (a “REIT”) under provisions of the Internal Revenue Code of 1986, as amended.
The Parent Company is the sole general partner of the Operating Partnership, and as of December 31, 2017 owned approximately 97.7% of the common partnership interests in the Operating Partnership (“General Partner Units”). The remaining 2.3% of the common partnership interests (“Limited Partner Units” and, together with the General Partner Units, the “Common Units”) were owned by the limited partners. As the sole general partner of the Operating Partnership, the Parent Company has full, exclusive and complete responsibility and discretion in the day-to-day management and control of the Operating Partnership. The Parent Company and the Operating Partnership are operated as one enterprise. The management of the Parent Company consists of the same members as the management of the Operating Partnership. As the sole general partner with control of the Operating Partnership, the Parent Company consolidates the Operating Partnership for financial reporting purposes, and the Parent Company does not have any significant assets other than its investment in the Operating Partnership.
At December 31, 2017, we owned interests in 117 operating and redevelopment properties totaling approximately 23.3 million square feet. We also owned two development projects under construction as of this date.
At December 31, 2016, we owned interests in 119 operating and redevelopment properties totaling approximately 23.4 million square feet. We also owned two development projects under construction as of this date.
Note 2. Basis of Presentation and Summary of Significant Accounting Policies
The accompanying financial statements have been prepared in accordance with accounting principles generally accepted in the United States (“GAAP”). GAAP requires management to make estimates and assumptions that affect the reported amounts of assets and liabilities, disclosure of contingent assets and liabilities at the date of the financial statements, and revenues and expenses during the reported period. Actual results could differ from these estimates.
Components of Investment Properties
The Company’s investment properties as of December 31, 2017 and December 31, 2016 were as follows:
($ in thousands) | Balance at | |||||||
December 31, 2017 | December 31, 2016 | |||||||
Investment properties, at cost: | ||||||||
Land, buildings and improvements | $ | 3,873,149 | $ | 3,885,223 | ||||
Furniture, equipment and other | 8,453 | 7,246 | ||||||
Land held for development | 31,142 | 34,171 | ||||||
Construction in progress | 45,140 | 69,425 | ||||||
$ | 3,957,884 | $ | 3,996,065 | |||||
Consolidation and Investments in Joint Ventures
F-11
The accompanying financial statements are presented on a consolidated basis and include all accounts of the Parent Company, the Operating Partnership, the taxable REIT subsidiary of the Operating Partnership, subsidiaries of the Operating Partnership that are controlled and any variable interest entities (“VIEs”) in which the Operating Partnership is the primary beneficiary. In general, a VIE is a corporation, partnership, trust or any other legal structure used for business purposes that either (a) has equity investors that do not provide sufficient financial resources for the entity to support its activities, (b) does not have equity investors with voting rights or (c) has equity investors whose votes are disproportionate from their economics and substantially all of the activities are conducted on behalf of the investor with disproportionately fewer voting rights.
The Operating Partnership accounts for properties that are owned by joint ventures in accordance with the consolidation guidance. The Operating Partnership evaluates each joint venture and determines first whether to follow the VIE or the voting interest entity ("VOE") model. Once the appropriate consolidation model is identified, the Operating Partnership then evaluates whether it should consolidate the joint venture. Under the VIE model, the Operating Partnership consolidates an entity when it has (i) the power to direct the activities of the VIE that most significantly impact the VIE’s economic performance, and (ii) the obligation to absorb losses or the right to receive benefits that could potentially be significant to the VIE. Under the VOE model, the Operating Partnership consolidates an entity when (i) it controls the entity through ownership of a majority voting interest if the entity is not a limited partnership or (ii) it controls the entity through its ability to remove the other partners or owners in the entity, at its discretion, when the entity is a limited partnership.
In determining whether to consolidate a VIE with the Operating Partnership, we consider all relationships between the Operating Partnership and the applicable VIE, including development agreements, management agreements and other contractual arrangements, in determining whether we have the power to direct the activities of the VIE that most significantly affect the VIE's performance. As of December 31, 2017, we owned investments in three joint ventures that were VIEs in which the partners did not have substantive participating rights and we were the primary beneficiary. As of this date, these VIEs had total debt of $238.8 million, which were secured by assets of the VIEs totaling $497.5 million. The Operating Partnership guarantees the debt of these VIEs.
The Operating Partnership is considered a VIE as the limited partners do not hold kick-out rights or substantive participating rights. The Parent Company consolidates the Operating Partnership as it is the primary beneficiary in accordance with the VIE model.
Embassy Suites at the University of Notre Dame
In December 2017, we formed a new joint venture with an unrelated third party to develop and own an Embassy Suites full-service hotel next to our Eddy Street Commons operating property at the University of Notre Dame. For the year ended December 31, 2017, we recorded fee income of $0.4 million. We contributed $1.4 million of cash to the joint venture in return for a 35% ownership interest in the venture. The joint venture has entered into a $33.8 million construction loan, against which no amount was drawn as of December 31, 2017. The joint venture is not considered a VIE. We are accounting for the joint venture under the equity method as both members have substantive participating rights and we do not control the activities of the venture.
Fishers Station Operating Property
In March 2017, we acquired our partner's noncontrolling interest in our Fishers Station operating property for $3.8 million. The transaction increased our controlling interest to 100% and was accounted for through equity in the consolidated statement of shareholders' equity.
Cornelius Gateway Operating Property
In 2015, we sold our Cornelius Gateway operating property that was owned in a consolidated joint venture. The loss, which was not material and is included in "gains on sale of operating properties, net" in the accompanying consolidated statement of operations, was allocated 80% and 20% between us and our partner in accordance with the joint venture's operating agreement.
Beacon Hill Operating Property
In 2015, we acquired our partner's interest in our Beacon Hill operating property. The transaction was accounted for as an equity transaction as we retained our controlling financial interest.
Acquisition of Real Estate Properties
F-12
Upon acquisition of real estate operating properties, we estimate the fair value of acquired identifiable tangible assets and identified intangible assets and liabilities, assumed debt, and any noncontrolling interest in the acquiree at the date of acquisition, based on evaluation of information and estimates available at that date. Based on these estimates, we record the estimated fair value to the applicable assets and liabilities. In making estimates of fair values, a number of sources are utilized, including information obtained as a result of pre-acquisition due diligence, marketing and leasing activities. The estimates of fair value were determined to have primarily relied upon Level 2 and Level 3 inputs, as defined below.
Fair value is determined for tangible assets and intangibles, including:
• | the fair value of the building on an as-if-vacant basis and the fair value of land determined either by comparable market data, real estate tax assessments, independent appraisals or other relevant data; |
• | above-market and below-market in-place lease values for acquired properties, which are based on the present value (using an interest rate which reflects the risks associated with the leases acquired) of the difference between (i) the contractual amounts to be paid pursuant to the in-place leases and (ii) management’s estimate of fair market lease rates for the corresponding in-place leases, measured over the remaining non-cancelable term of the leases. Any below-market renewal options are also considered in the in-place lease values. The capitalized above-market and below-market lease values are amortized as a reduction of or addition to rental income over the term of the lease. Should a tenant vacate, terminate its lease, or otherwise notify us of its intent to do so, the unamortized portion of the lease intangibles would be charged or credited to income; |
• | the value of having a lease in place at the acquisition date. We utilize independent and internal sources for our estimates to determine the respective in-place lease values. Our estimates of value are made using methods similar to those used by independent appraisers. Factors we consider in our analysis include an estimate of costs to execute similar leases including tenant improvements, leasing commissions and foregone costs and rent received during the estimated lease-up period as if the space was vacant. The value of in-place leases is amortized to expense over the remaining initial terms of the respective leases; and |
• | the fair value of any assumed financing that is determined to be above or below market terms. We utilize third party and independent sources for our estimates to determine the respective fair value of each mortgage payable. The fair market value of each mortgage payable is amortized to interest expense over the remaining initial terms of the respective loan. |
We also consider whether there is any value to in-place leases that have a related customer relationship intangible value. Characteristics we consider in determining these values include the nature and extent of existing business relationships with the tenant, growth prospects for developing new business with the tenant, the tenant’s credit quality, and expectations of lease renewals, among other factors. To date, a tenant relationship has not been developed that is considered to have a current intangible value.
We finalize the measurement period of our business combinations when all facts and circumstances are understood, but in no circumstances will the measurement period exceed one year.
Investment Properties
Capitalization and Depreciation
Investment properties are recorded at cost and include costs of land acquisition, development, pre-development, construction, certain allocated overhead, tenant allowances and improvements, and interest and real estate taxes incurred during construction. Significant renovations and improvements are capitalized when they extend the useful life, increase capacity, or improve the efficiency of the asset. If a tenant vacates a space prior to the lease expiration, terminates its lease, or otherwise notifies the Company of its intent to do so, any related unamortized tenant allowances are expensed over the shortened lease period. Maintenance and repairs that do not extend the useful lives of the respective assets are reflected in property operating expense.
Pre-development costs are incurred prior to vertical construction and for certain land held for development during the due diligence phase and include contract deposits, legal, engineering, cost of internal resources and other professional fees related to evaluating the feasibility of developing or redeveloping a shopping center or other project. These pre-development costs are capitalized and included in construction in progress in the accompanying consolidated balance sheets. If we determine that the
F-13
completion of a development project is no longer probable, all previously incurred pre-development costs are immediately expensed. Land is transferred to construction in progress once construction commences on the related project.
We also capitalize costs such as land acquisition, building construction, interest, real estate taxes, and the costs of personnel directly involved with the development of our properties. As a portion of a development property becomes operational, we expense a pro rata amount of related costs.
Depreciation on buildings and improvements is provided utilizing the straight-line method over estimated original useful lives ranging from 10 to 35 years. Depreciation on tenant allowances and tenant improvements are provided utilizing the straight-line method over the term of the related lease. Depreciation on equipment and fixtures is provided utilizing the straight-line method over 5 to 10 years. Depreciation may be accelerated for a redevelopment project including partial demolition of existing structure after the asset is assessed for impairment.
Impairment
Management reviews operational and development projects, land parcels and intangible assets for impairment on at least a quarterly basis or whenever events or changes in circumstances indicate that the carrying value of the asset may not be recoverable. The review for possible impairment requires management to make certain assumptions and estimates and requires significant judgment. Impairment losses for investment properties and intangible assets are measured when the undiscounted cash flows estimated to be generated by the investment properties during the expected holding period are less than the carrying amounts of those assets. Impairment losses are recorded as the excess of the carrying value over the estimated fair value of the asset. Our impairment review for land and development properties assumes we have the intent and the ability to complete the developments or projected uses for the land parcels. If we determine those plans will not be completed or our assumptions with respect to operating assets are not realized, an impairment loss may be appropriate.
Held for Sale and Discontinued Operations
Operating properties will be classified as held for sale only when those properties are available for immediate sale in their present condition and for which management believes it is probable that a sale of the property will be completed within one year, among other factors. Operating properties classified as held for sale are carried at the lower of cost or fair value less estimated costs to sell. Depreciation and amortization are suspended during the held-for-sale period.
Escrow Deposits
Escrow deposits consist of cash held for real estate taxes, property maintenance, insurance and other requirements at specific properties as required by lending institutions and certain municipalities.
Cash and Cash Equivalents
We consider all highly liquid investments purchased with an original maturity of 90 days or less to be cash and cash equivalents. From time to time, such investments may temporarily be held in accounts that are in excess of FDIC and SIPC insurance limits; however the Company attempts to limit its exposure at any one time.
Fair Value Measurements
We follow the framework established under accounting standard FASB ASC 820 , Fair Value Measurements and Disclosures, for measuring fair value of non-financial assets and liabilities that are not required or permitted to be measured at fair value on a recurring basis but only in certain circumstances, such as a business combination or upon determination of impairment.
Assets and liabilities recorded at fair value on the consolidated balance sheets are categorized based on the inputs to the valuation techniques as follows:
• | Level 1 fair value inputs are quoted prices in active markets for identical instruments to which we have access. |
• | Level 2 fair value inputs are inputs other than quoted prices included in Level 1 that are observable for similar instruments, either directly or indirectly, and appropriately consider counterparty creditworthiness in the valuations. |
• | Level 3 fair value inputs reflect our best estimate of inputs and assumptions market participants would use in pricing an instrument at the measurement date. The inputs are unobservable in the market and significant to the valuation estimate. |
F-14
In instances where the determination of the fair value measurement is based on inputs from different levels of the fair value hierarchy, the level in the fair value hierarchy within which the entire fair value measurement falls is based on the lowest level input that is significant to the fair value measurement in its entirety. Our assessment of the significance of a particular input to the fair value measurement in its entirety requires judgment and considers factors specific to the asset or liability. As discussed in Note 10 to the Financial Statements, we have determined that derivative valuations are classified in Level 2 of the fair value hierarchy.
Cash and cash equivalents, accounts receivable, escrows and deposits, and other working capital balances approximate fair value.
Note 7 to the Financial Statements includes a discussion of the fair values recorded for assets acquired and liabilities assumed. Note 8 to the Financial Statements includes a discussion of the fair values recorded when we recognized impairment charges in 2017 and 2015. Level 3 inputs to these transactions include our estimations of market leasing rates, tenant-related costs, discount rates, and disposal values.
Derivative Financial Instruments
The Company accounts for its derivative financial instruments at fair value calculated in accordance with ASC 820, Fair Value Measurements and Disclosures. Gains or losses resulting from changes in the fair values of those derivatives are accounted for depending on the use of the derivative and whether it qualifies for hedge accounting. We use derivative instruments such as interest rate swaps or rate locks to mitigate interest rate risk on related financial instruments.
Changes in the fair values of derivatives that qualify as cash flow hedges are recognized in other comprehensive income (“OCI”) while any ineffective portion of a derivative’s change in fair value is recognized immediately in earnings. Gains and losses associated with the transaction are recorded in OCI and amortized over the underlying term of the hedged transaction. As of December 31, 2017 and 2016, all of our derivative instruments qualify for hedge accounting.
Revenue Recognition
As a lessor of real estate assets, the Company retains substantially all of the risks and benefits of ownership and accounts for its leases as operating leases.
Contractual rent, percentage rent, and expense reimbursements from tenants for common area maintenance costs, insurance and real estate taxes are our principal sources of revenue. Base minimum rents are recognized on a straight-line basis over the terms of the respective leases. Certain lease agreements contain provisions that grant additional rents based on a tenant’s sales volume (contingent overage rent). Overage rent is recognized when tenants achieve the specified sales targets as defined in their lease agreements. Overage rent is included in other property related revenue in the accompanying consolidated statements of operations. As a result of generating this revenue, we will routinely have accounts receivable due from tenants. We are subject to tenant defaults and bankruptcies that may affect the collection of outstanding receivables. To address the collectability of these receivables, we analyze historical write-off experience, tenant credit-worthiness and current economic trends when evaluating the adequacy of our allowance for uncollectible accounts and straight line rent reserve. Although we estimate uncollectible receivables and provide for them through charges against income, actual experience may differ from those estimates.
Gains or losses from sales of real estate have historically been recognized when a sale has been consummated, the buyer’s initial and continuing investment is adequate to demonstrate a commitment to pay for the asset, we have transferred to the buyer the usual risks and rewards of ownership, and we do not have a substantial continuing financial involvement in the property. As part of our ongoing business strategy, we will, from time to time, sell land parcels and outlots, some of which are ground leased to tenants. Net gains realized on such sales were $5.2 million, $3.9 million, and $5.6 million for the years ended December 31, 2017, 2016, and 2015, respectively, and are classified as other property related revenue in the accompanying consolidated statements of operations.
Tenant and Other Receivables and Allowance for Uncollectible Accounts
Tenant receivables consist primarily of billed minimum rent, accrued and billed tenant reimbursements, and accrued straight-line rent. The Company generally does not require specific collateral from its tenants other than corporate or personal guarantees. Other receivables consist primarily of amounts due from municipalities and from tenants for non-rental revenue related activities.
F-15
An allowance for uncollectible accounts is maintained for estimated losses resulting from the inability of certain tenants or others to meet contractual obligations under their lease or other agreements. Accounts are written off when, in the opinion of management, the balance is uncollectible.
($ in thousands) | 2017 | 2016 | 2015 | |||||||||
Balance, beginning of year | $ | 3,998 | $ | 4,325 | $ | 2,433 | ||||||
Provision for credit losses, net of recoveries | 2,786 | 2,771 | 4,331 | |||||||||
Accounts written off and other | (3,297 | ) | (3,098 | ) | (2,439 | ) | ||||||
Balance, end of year | $ | 3,487 | $ | 3,998 | $ | 4,325 | ||||||
For the years ended December 31, 2017, 2016 and 2015, the provision for credit losses, net of recoveries, represented 0.8%, 0.8% and 1.2% of total revenues, respectively.
Concentration of Credit Risk
We may be subject to concentrations of credit risk with regards to our cash and cash equivalents. We place cash and temporary cash investments with high-credit-quality financial institutions. From time to time, such cash and investments may temporarily be in excess of insurance limits.
In addition, our accounts receivable from and leases with tenants potentially subjects us to a concentration of credit risk related to our accounts receivable and revenue.
Total billed receivables due from tenants leasing space in the states of Florida, Indiana, and Texas, consisted of the following as of December 31, 2017 and 2016:
($ in thousands) | As of December 31, 2017 | ||||
2017 | 2016 | ||||
Florida | 61 | % | 53 | % | |
Indiana | 9 | % | 7 | % | |
Texas | 4 | % | 2 | % | |
For the years ended December 31, 2017, 2016, and 2015, the Company's revenue recognized from tenants leasing space in the states of Florida, Indiana, and Texas, were as follows:
($ in thousands) | Year Ended December 31, | |||||||
2017 | 2016 | 2015 | ||||||
Florida | 24 | % | 25 | % | 25 | % | ||
Indiana | 14 | % | 15 | % | 14 | % | ||
Texas | 13 | % | 13 | % | 12 | % | ||
Earnings Per Share
Basic earnings per share or unit is calculated based on the weighted average number of common shares or units outstanding during the period. Diluted earnings per share or unit is determined based on the weighted average common number of shares or units outstanding during the period combined with the incremental average common shares or units that would have been outstanding assuming the conversion of all potentially dilutive common shares or units into common shares or units as of the earliest date possible.
Potentially dilutive securities include outstanding options to acquire common shares; Limited Partner Units, which may be exchanged for either cash or common shares, at the Parent Company’s option and under certain circumstances; units under our Outperformance Incentive Compensation Plan ("Outperformance Plan"); and deferred common share units, which may be credited to the personal accounts of non-employee trustees in lieu of the payment of cash compensation or the issuance of common shares to such trustees. Limited Partner Units have been omitted from the Parent Company’s denominator for the purpose of computing
F-16
diluted earnings per share since the effect of including these amounts in the denominator would have no dilutive impact. Weighted average Limited Partner Units outstanding for the years ended December 31, 2017, 2016 and 2015 were 2.0 million, 1.9 million and 1.8 million, respectively.
Approximately 0.1 million outstanding options to acquire common shares were excluded from the computations of diluted earnings per share or unit because their impact was not dilutive for each of the twelve months ended December 31, 2017, 2016 and 2015.
Segment Reporting
Our primary business is the ownership and operation of neighborhood and community shopping centers. We do not distinguish or group our operations on a geographical basis, or any other basis, when measuring and evaluating financial performance. Accordingly, we have one operating segment, which also serves as our reportable segment for disclosure purposes in accordance with GAAP.
Income Taxes and REIT Compliance
Parent Company
The Parent Company, which is considered a corporation for federal income tax purposes, has been organized and intends to continue to operate in a manner that will enable it to maintain its qualification as a REIT for federal income tax purposes. As a result, it generally will not be subject to federal income tax on the earnings that it distributes to the extent it distributes its “REIT taxable income” (determined before the deduction for dividends paid and excluding net capital gains) to shareholders of the Parent Company and meets certain other requirements on a recurring basis. To the extent that it satisfies this distribution requirement, but distributes less than 100% of its taxable income, it will be subject to federal corporate income tax on its undistributed REIT taxable income. REITs are subject to a number of organizational and operational requirements. If the Parent Company fails to qualify as a REIT in any taxable year, it will be subject to federal income tax on its taxable income at regular corporate rates for a period of four years following the year in which qualification is lost. We may also be subject to certain federal, state and local taxes on our income and property and to federal income and excise taxes on our undistributed taxable income even if the Parent Company does qualify as a REIT. The Operating Partnership intends to continue to make distributions to the Parent Company in amounts sufficient to assist the Parent Company in adhering to REIT requirements and maintaining its REIT status.
We have elected to treat Kite Realty Holdings, LLC as a taxable REIT subsidiary of the Operating Partnership, and we may elect to treat other subsidiaries as taxable REIT subsidiaries in the future. This election enables us to receive income and provide services that would otherwise be impermissible for a REIT. Deferred tax assets and liabilities are established for temporary differences between the financial reporting bases and the tax bases of assets and liabilities at the tax rates expected to be in effect when the temporary differences reverse. Deferred tax assets are reduced by a valuation allowance if it is more likely than not that some portion or all of the deferred tax asset will not be realized.
Operating Partnership
The allocated share of income and loss, other than the operations of our taxable REIT subsidiary, is included in the income tax returns of the Operating Partnership's partners. Accordingly, the only federal income taxes included in the accompanying consolidated financial statements are in connection with the taxable REIT subsidiary.
Noncontrolling Interests
We report the non-redeemable noncontrolling interests in subsidiaries as equity and the amount of consolidated net income attributable to these noncontrolling interests is set forth separately in the consolidated financial statements. The non-redeemable noncontrolling interests in consolidated properties for the years ended December 31, 2017, 2016, and 2015 were as follows:
F-17
($ in thousands) | 2017 | 2016 | 2015 | |||||||||
Noncontrolling interests balance January 1 | $ | 692 | $ | 773 | $ | 3,364 | ||||||
Net income allocable to noncontrolling interests, excluding redeemable noncontrolling interests | 6 | 171 | 111 | |||||||||
Distributions to noncontrolling interests | — | (252 | ) | (115 | ) | |||||||
Acquisition of partner's interest in Beacon Hill operating property | — | — | (2,353 | ) | ||||||||
Partner's share of loss on sale of Cornelius Gateway operating property | — | — | (234 | ) | ||||||||
Noncontrolling interests balance at December 31 | $ | 698 | $ | 692 | $ | 773 | ||||||
Redeemable Noncontrolling Interests – Limited Partners
Limited Partner Units are redeemable noncontrolling interests in the Operating Partnership. We classify redeemable noncontrolling interests in the Operating Partnership in the accompanying consolidated balance sheets outside of permanent equity because we may be required to pay cash to holders of Limited Partner Units upon redemption of their interests in the Operating Partnership or deliver registered shares upon their conversion. The carrying amount of the redeemable noncontrolling interests in the Operating Partnership is reflected at the greater of historical book value or redemption value with a corresponding adjustment to additional paid-in capital. At December 31, 2017, and 2016, the redemption value of the redeemable noncontrolling interests in the Operating Partnership exceeded the historical book value, and the balance was accordingly adjusted to redemption value.
We allocate net operating results of the Operating Partnership after noncontrolling interests in the consolidated properties based on the partners’ respective weighted average ownership interest. We adjust the redeemable noncontrolling interests in the Operating Partnership at the end of each reporting period to reflect their interests in the Operating Partnership or redemption value. This adjustment is reflected in our shareholders’ and Parent Company's equity. For the years ended December 31, 2017, 2016, and 2015, the weighted average interests of the Parent Company and the limited partners in the Operating Partnership were as follows:
Year Ended December 31, | |||||||||
2017 | 2016 | 2015 | |||||||
Parent Company’s weighted average interest in Operating Partnership | 97.7 | % | 97.7 | % | 97.9 | % | |||
Limited partners' weighted average interests in Operating Partnership | 2.3 | % | 2.3 | % | 2.1 | % | |||
At December 31, 2017 and December 31, 2016, the Parent Company's interest and the limited partners' redeemable noncontrolling ownership interests in the Operating Partnership were 97.7% and 2.3% as of the end of each period presented.
Concurrent with the Parent Company’s initial public offering and related formation transactions, certain individuals received Limited Partner Units of the Operating Partnership in exchange for their interests in certain properties. The limited partners have the right to redeem Limited Partner Units for cash or, at the Parent Company's election, common shares of the Parent Company in an amount equal to the market value of an equivalent number of common shares of the Parent Company at the time of redemption. Such common shares must be registered, which is not fully in the Parent Company’s control. Therefore, the limited partners’ interest is not reflected in permanent equity. The Parent Company also has the right to redeem the Limited Partner Units directly from the limited partner in exchange for either cash in the amount specified above or a number of its common shares equal to the number of Limited Partner Units being redeemed.
There were 1,974,830 and 1,942,340 Limited Partner Units outstanding as of December 31, 2017 and 2016, respectively. The increase in Limited Partner Units outstanding from December 31, 2016 is due primarily to non-cash compensation awards made to our executive officers in the form of Limited Partner Units.
Redeemable Noncontrolling Interests - Subsidiaries
Prior to our merger with Inland Diversified Real Estate Trust, Inc. ("Inland Diversified") in 2014, Inland Diversified formed joint ventures with the previous owners of certain properties and issued Class B units in three joint ventures that indirectly own those properties. The Class B units related to two of these three joint ventures remain outstanding subsequent to the merger with Inland Diversified and are accounted for as noncontrolling interests in these properties. A portion of the Class B units became redeemable at our partner’s election in March 2017, and the remaining Class B units will become redeemable at our partner's
F-18
election in October 2022 based on the applicable joint venture and the fulfillment of certain redemption criteria. Beginning in December 2020 and November 2022, with respect to the applicable joint venture, the Class B units can be redeemed at the election of either our partner or us for cash or Limited Partner Units in the Operating Partnership. None of the issued Class B units have a maturity date and none are mandatorily redeemable unless either party has elected for the units to be redeemed. We consolidate these joint ventures because we control the decision making of each of the joint ventures and our joint venture partners have limited protective rights.
In March 2017, certain Class B unit holders exercised their right to redeem $8.3 million of their Class B units for cash. We funded the redemption using operating cash flows in December 2017.
In 2015, we acquired our partner’s redeemable interest in our City Center operating property for $34.0 million and other non-redeemable rights and interests held by our partner for $0.4 million. We funded this acquisition in part with a $30 million draw on our unsecured revolving credit facility with the remainder funded by the issuance of Limited Partner Units in the Operating Partnership. As a result of this transaction, our guarantee of a $26.6 million loan on behalf of LC White Plains Retail, LLC and LC White Plains Recreation, LLC was terminated.
We classify the remainder of the redeemable noncontrolling interests in certain subsidiaries in the accompanying consolidated balance sheets outside of permanent equity because, under certain circumstances, we may be required to pay cash to Class B unitholders in specific subsidiaries upon redemption of their interests. The carrying amount of these redeemable noncontrolling interests is required to be reflected at the greater of initial book value or redemption value with a corresponding adjustment to additional paid-in capital. As of December 31, 2017 and 2016, the redemption amounts of these interests did not exceed their fair value, nor did they exceed the initial book value.
The redeemable noncontrolling interests in the Operating Partnership and subsidiaries for the years ended December 31, 2017, 2016, and 2015 were as follows:
($ in thousands) | 2017 | 2016 | 2015 | |||||||||
Redeemable noncontrolling interests balance January 1 | $ | 88,165 | $ | 92,315 | $ | 125,082 | ||||||
Acquisition of partner's interest in City Center operating property | — | — | (33,998 | ) | ||||||||
Net income allocable to redeemable noncontrolling interests | 2,009 | 1,756 | 2,087 | |||||||||
Distributions declared to redeemable noncontrolling interests | (4,155 | ) | (3,993 | ) | (3,773 | ) | ||||||
Payment for partial redemption of redeemable noncontrolling interests | (8,261 | ) | — | — | ||||||||
Other, net including adjustments to redemption value | (5,654 | ) | (1,913 | ) | 2,917 | |||||||
Total limited partners' interests in Operating Partnership and other redeemable noncontrolling interests balance at December 31 | $ | 72,104 | $ | 88,165 | $ | 92,315 | ||||||
Limited partners' interests in Operating Partnership | $ | 39,573 | $ | 47,373 | $ | 50,085 | ||||||
Other redeemable noncontrolling interests in certain subsidiaries | 32,531 | 40,792 | 42,230 | |||||||||
Total limited partners' interests in Operating Partnership and other redeemable noncontrolling interests balance at December 31 | $ | 72,104 | $ | 88,165 | $ | 92,315 | ||||||
Effects of Accounting Pronouncements
In May 2014, the Financial Accounting Standards Board ("FASB") issued Accounting Standards Update ("ASU") 2014-09, Revenue from Contracts with Customers (“ASU 2014-09”). ASU 2014-09 is a comprehensive revenue recognition standard that will supersede nearly all existing GAAP revenue recognition guidance. It will also affect the existing GAAP guidance governing the sale of nonfinancial assets. The new standard’s core principle is that a company will recognize revenue when it satisfies performance obligations by transferring promised goods or services to customers in an amount that reflects the consideration to which the company expects to be entitled in exchange for fulfilling those performance obligations. In doing so, companies will need to exercise more judgment and make more estimates than under existing GAAP guidance.
Under this standard, entities will now generally recognize the sale, and any associated gain or loss, of a real estate property when control of the property transfers, as long as collectability of the consideration is probable.
F-19
We have preliminarily evaluated our revenue streams and estimate that less than 1% of our recurring revenue will be impacted by this new standard upon its initial adoption. Additionally, we have historically disposed of property and land in all-cash transactions with no continuing future involvement in the operations of the property and, therefore, we do not expect the new standard to significantly impact our recognition of property and land sales. For the year ended December 31, 2017, we disposed of several operating properties and land parcels in all-cash transactions with no continuing future involvement. The gains recognized were approximately 6% of our total revenue for the year ended December 31, 2017. As we do not have any continuing involvement in the operations of the operating properties and land sold, the accounting for the transactions would have been the same under ASC 2014-09.
ASU 2014-09 is effective for public entities for annual and interim reporting periods beginning after December 15, 2017. ASU 2014-09 allows for either recognizing the cumulative effect of application (i) at the start of the earliest comparative period presented (with the option to use any or all of three practical expedients) or (ii) as a cumulative effect adjustment as of the date of initial application, with no restatement of comparative periods presented. We expect to adopt ASU 2014-09 using the modified retrospective approach.
In February 2016, the FASB issued ASU 2016-02, Leases. ASU 2016-02 amends the existing accounting standards for lease accounting, including requiring lessees to recognize most leases on their balance sheets and making certain changes to lessor accounting, including the accounting for sales-type and direct financing leases. ASU 2016-02 will be effective for annual and interim reporting periods beginning on or after December 15, 2018, with early adoption permitted. The new standard requires a modified retrospective transition approach for all leases existing at, or entered into after, the date of initial application, with an option to use certain transition relief. As a result of the adoption of ASU 2016-02, we expect common area maintenance reimbursements that are of a fixed nature to be recognized on a straight line basis over the term of the lease as these tenant reimbursements will be considered a non-lease component and will be subject to ASU 2014-09. In January 2018, the FASB issued a proposed ASU related to ASC 842. The update would allow lessors to use a practical expedient to account for non-lease components and related lease components as a single lease component instead of accounting for them separately, if certain conditions are met. This proposal is currently under consideration by regulators. We also expect to recognize right of use assets on our balance sheet related to certain ground leases where we are the lessee. Upon adoption of the standard, we anticipate recognizing a right of use asset currently estimated to be between $35 million and $40 million. In addition to evaluating the impact of adopting the new accounting standard on our consolidated financial statements, we are evaluating our existing lease contracts and compensation structure, as well as our current and future information system capabilities.
The new leasing standard also amends ASC 340-40, Other Assets and Deferred Costs - Contracts with Customers. Under ASC 340-40, incremental costs of obtaining a contract are recognized as an asset if the entity expects to recover them, which will reduce the leasing costs currently capitalized. Upon adoption of the new standard, we expect a reduction in certain capitalized costs and a corresponding increase in general, administrative, and other expense and a decrease in amortization expense on our consolidated statement of operations, but the magnitude of that change is dependent upon certain variables currently under evaluation, including the compensation structure in place upon adoption.
In January 2017, the FASB issued ASU 2017-01, Business Combinations (Topic 805): Clarifying the Definition of a Business. ASU 2017-01 amends the existing accounting standards for business combinations, by providing a screen to determine when a set of assets and activities is not a business. The screen requires that when substantially all of the fair value of the gross assets acquired (or disposed of) is concentrated in a single identifiable asset or a group of similar identifiable assets, the assets and activities are not a business. This screen reduces the number of transactions that will likely qualify as business combinations. ASU 2017-01 will be effective for annual and interim reporting periods beginning on or after December 15, 2017, with early adoption permitted. We adopted ASU 2017-01 in the first quarter of 2017. We expect that future acquisitions of single investment properties or a portfolio of investment properties will likely not meet the definition of a business and, in such event, direct transaction costs will be capitalized.
In August 2017, the FASB issued ASU 2017-12, Derivatives and Hedging: Targeted Improvements to Accounting for Hedging Activities. ASU 2017-02 better aligns a company’s financial reporting for hedging activities with the economic objectives of those activities. ASU 2017-12 will be effective for annual and interim reporting periods beginning on or after December 15, 2018, with early adoption permitted using a modified retrospective transition method. This adoption method will require us to recognize the cumulative effect of initially applying the ASU as an adjustment to accumulated other comprehensive income with a corresponding adjustment to the opening balance of retained earnings as of the beginning of the fiscal year that an entity adopts the update. While we continue to assess all potential impacts of the standard, we do not expect the adoption of ASU 2017-12 to have a material impact on our consolidated financial statements.
Note 3. Gain on Settlement
F-20
In June 2015, we received $4.75 million to settle a dispute related to eminent domain and related damages at one of our operating properties. The settlement agreement did not restrict our use of the proceeds. These proceeds, net of certain costs, are included in gain on settlement within the consolidated statement of operations for the year ended December 31, 2015. We used the net proceeds to pay down the secured loan at this operating property.
Note 4. Share-Based Compensation
Overview
The Company's 2013 Equity Incentive Plan (the "Plan") authorizes options to acquire common shares and other share-based compensation awards to be granted to employees and trustees for up to an additional 1,500,000 common shares of the Company. The Company accounts for its share-based compensation in accordance with the fair value recognition provisions provided under Topic 718—“Stock Compensation” in the Accounting Standards Codification.
The total share-based compensation expense, net of amounts capitalized, included in general and administrative expenses for the years ended December 31, 2017, 2016, and 2015 was $5.8 million, $5.1 million, and $4.4 million, respectively. For the years ended December 31, 2017, 2016, and 2015, total share-based compensation cost capitalized for development and leasing activities was $1.7 million, $1.5 million, and $1.0 million, respectively.
As of December 31, 2017, there were 717,053 shares and units available for grant under the Plan.
Share Options
Pursuant to the Plan, the Company may periodically grant options to purchase common shares at an exercise price equal to the grant date fair value of the Company's common shares. Granted options typically vest over a five year period and expire 10 years from the grant date. The Company issues new common shares upon the exercise of options.
A summary of option activity under the Plan as of December 31, 2017, and changes during the year then ended, is presented below:
($ in thousands, except share and per share data) | Aggregate Intrinsic Value | Weighted-Average Remaining Contractual Term (in years) | Options | Weighted-Average Exercise Price | |||||||||
Outstanding at January 1, 2017 | 182,462 | $ | 37.58 | ||||||||||
Granted | — | — | |||||||||||
Exercised | — | — | |||||||||||
Expired | — | — | |||||||||||
Forfeited | (1,250 | ) | 10.56 | ||||||||||
Outstanding at December 31, 2017 | $ | 211,809 | 0.88 | 181,212 | $ | 37.77 | |||||||
Exercisable at December 31, 2017 | $ | 211,809 | 0.88 | 181,212 | $ | 37.77 | |||||||
Exercisable at December 31, 2016 | 182,378 | $ | 37.60 | ||||||||||
There were no options granted in 2017, 2016 or 2015.
The aggregate intrinsic value of the 47,591 options exercised during the year ended December 31, 2016 was $0.8 million.
Restricted Shares
In addition to share option grants, the Plan also authorizes the grant of share-based compensation awards in the form of restricted common shares. Under the terms of the Plan, these restricted shares, which are considered to be outstanding shares from the date of grant, typically vest over a period ranging from three to five years. The Company pays dividends on restricted shares and such dividends are charged directly to shareholders’ equity.
The following table summarizes all restricted share activity to employees and non-employee members of the Board of Trustees as of December 31, 2017 and changes during the year then ended:
F-21
Number of Restricted Shares | Weighted Average Grant Date Fair Value per share | ||||||
Restricted shares outstanding at January 1, 2017 | 291,608 | $ | 26.10 | ||||
Shares granted | 85,150 | 22.15 | |||||
Shares forfeited | (397 | ) | 26.24 | ||||
Shares vested | (117,254 | ) | 26.11 | ||||
Restricted shares outstanding at December 31, 2017 | 259,107 | $ | 24.80 | ||||
The following table summarizes the restricted share grants and vestings during the years ended December 31, 2017, 2016, and 2015:
($ in thousands, except share and per share data) | Number of Restricted Shares Granted | Weighted Average Grant Date Fair Value per share | Fair Value of Restricted Shares Vested | ||||||||
2017 | 85,150 | $ | 22.15 | $ | 2,529 | ||||||
2016 | 81,603 | 26.87 | 3,313 | ||||||||
2015 | 121,075 | 28.10 | 2,948 | ||||||||
As of December 31, 2017, there was $4.2 million of total unrecognized compensation cost related to restricted shares granted under the Plan, which is expected to be recognized in the consolidated statements of operations over a weighted-average period of 1.37 years. We expect to incur $2.1 million of this expense in 2018, $1.1 million in 2019, $0.6 million in 2020, $0.3 million in 2021, and the remainder in 2022.
Outperformance Plans
The Compensation Committee of the Board of Trustees (the “Compensation Committee”) previously adopted outperformance plans to further align the interests of our shareholders and management by encouraging our senior officers and other key employees to “outperform” and to create shareholder value. In 2014, the Compensation Committee adopted the 2014 Kite Realty Group Trust Outperformance Incentive Compensation Plan (the “2014 OPP”) under the Plan and the partnership agreement of our Operating Partnership for members of executive management and certain other employees, pursuant to which participants are eligible to earn profit interests ("LTIP Units") in the Operating Partnership based on the achievement of certain performance criteria related to the Company’s common shares. The 2014 OPP was adopted mid-year and the OPP awards granted at that time were intended to encompass OPP awards for both the 2014 and 2015 fiscal years. As a result, the Compensation Committee did not adopt an outperformance incentive compensation plan in 2015. No awards were granted under the 2014 OPP in the 2015 fiscal year.
In 2016, the Compensation Committee adopted the 2016 Kite Realty Group Trust Outperformance Incentive Compensation Plan (the “2016 OPP”) under the Plan and the partnership agreement of our Operating Partnership. Upon the adoption of the 2016 OPP, the Compensation Committee granted individual awards in the form of LTIP units that, subject to vesting and the satisfaction of other conditions, are exchangeable on a par unit value equal to the then trading price of one of our common shares. The terms of the 2016 OPP are similar to the terms of the 2014 OPP.
The Compensation Committee did not adopt an outperformance incentive compensation plan in the 2017 fiscal year.
In 2014 and 2016, participants in the 2014 OPP and the 2016 OPP were awarded the right to earn, in the aggregate, up to $7.5 million and up to $6.0 million of share-settled awards (the “bonus pool”) if, and only to the extent which, our total shareholder return (“TSR”) performance measures are achieved for the three-year period beginning July 1, 2014 and ending June 30, 2017 and for the three-year period beginning January 4, 2016 and ending December 31, 2018, respectively. Awarded interests not earned based on the TSR measures are forfeited.
If the TSR performance measures are achieved at the end of each three-year performance period, participants will receive their percentage interest in the bonus pool as LTIP Units in the Operating Partnership. Such LTIP Units vest over an additional two-year service period. The compensation cost of the 2014 and 2016 Outperformance Plans were fixed as of the grant date and will be recognized regardless of whether the LTIP Units are ultimately earned, assuming the service requirement is met.
F-22
The TSR performance measures were not achieved for the 2014 OPP and all potential awards were forfeited in 2017.
The 2014 and 2016 awards were valued at an aggregate value of $2.3 million and $1.9 million, respectively, utilizing a Monte Carlo model simulation that takes into account various assumptions including the nature and history of the Company, financial and economic conditions affecting the Company, past results, current operations and future prospects of the Company, the historical TSR and total return volatility of the SNL U.S. REIT Index, price return volatility, dividend yields of the Company's common shares and the terms of the awards. We expect to incur $0.8 million of this expense in 2018, $0.4 million in 2019 and $0.1 million in 2020.
Performance Awards
In 2015, the Compensation Committee established overall target values for incentive compensation for each executive officer, with 50% of the target value being granted in the form of time-based restricted share awards and the remaining 50% being granted in the form of three-year performance share awards.
Time-based restricted share awards were made on a discretionary basis in 2016 and 2017 based on review of each prior year's performance.
In 2015 and 2016, the Compensation Committee awarded each of the four named executive officers a three-year performance award in the form of restricted performance share units ("PSUs"). The 2015 PSUs may be earned over a three-year performance period from January 1, 2015 to December 31, 2017 and the 2016 PSUs may be earned over a three-year performance period from January 1, 2016 to December 31, 2018. The performance criteria will be based on the relative total shareholder return ("TSR") achieved by the Company measured against a peer group over the three-year measurement period. Any PSUs earned at the end of the three-year period will be fully vested at that date. The total number of PSUs issued each year to the executive officers was based on a target value of $1.0 million, but may be earned in a range from 0% to 200% of the target value depending on our TSR over the measurement period in relation to the peer group. Based on the relative TSR over the 2015 PSU measurement period, we do not expect any PSUs to be earned and awarded to our executive officers in 2018.
In 2017, the Compensation Committee awarded each of the four named executive officers a three-year performance award in the form of PSUs. The PSUs may be earned over a three-year performance period from January 1, 2017 to December 31, 2019. The performance criteria will be based 50% on the absolute TSR achieved by the Company over the three-year measurement period and 50% on the relative TSR achieved by the Company measured against a peer group over the three-year measurement period. The total number of PSUs issued to the executive officers was based on a target value of $2.0 million, but may be earned in a range from 0% to 200% of the target value depending on our absolute TSR over the measurement period and our relative TSR over the measurement period in relation to the peer group.
The 2017, 2016 and 2015 PSUs were valued at an aggregate value of $2.2 million, $1.3 million and $1.1 million, respectively, utilizing a Monte Carlo simulation. We expect to incur $1.2 million of this expense in 2018, $0.8 million in 2019 and less than $0.1 million in 2020.
The following table summarizes the activity for time-based restricted unit awards for the year ended December 31, 2017:
Number of Restricted Units | Weighted Average Grant Date Fair Value per unit | ||||||
Restricted units outstanding at January 1, 2017 | 183,979 | $ | 22.57 | ||||
Restricted units granted | 44,490 | 23.22 | |||||
Restricted units vested | (78,021 | ) | 21.87 | ||||
Restricted units outstanding at December 31, 2017 | 150,448 | $ | 23.13 | ||||
The following table summarizes the time-based restricted unit grants and vestings during the years ended December 31, 2017, 2016, and 2015:
F-23
($ in thousands, except unit and per unit data) | Number of Restricted Units Granted | Weighted Average Grant Date Fair Value per Unit | Fair Value of Restricted Units Vested | ||||||||
2017 | 44,490 | $ | 23.22 | $ | 1,516 | ||||||
2016 | 46,562 | 26.48 | 1,929 | ||||||||
2015 | — | — | 1,694 | ||||||||
As of December 31, 2017, there was $2.4 million of total unrecognized compensation cost related to restricted units granted under the Plan, which is expected to be recognized in the consolidated statements of operations over a weighted-average period of 1.09 years. We expect to incur $1.4 million of this expense in 2018, $0.6 million in 2019, $0.3 million in 2020, and the remainder in 2021.
Note 5. Deferred Costs and Intangibles, net
Deferred costs consist primarily of acquired lease intangible assets, broker fees and capitalized salaries and related benefits incurred in connection with lease originations. Deferred leasing costs, lease intangibles and similar costs are amortized on a straight-line basis over the terms of the related leases. At December 31, 2017 and 2016, deferred costs consisted of the following:
($ in thousands) | 2017 | 2016 | ||||||
Acquired lease intangible assets | $ | 107,668 | $ | 125,144 | ||||
Deferred leasing costs and other | 68,335 | 63,810 | ||||||
176,003 | 188,954 | |||||||
Less—accumulated amortization | (63,644 | ) | (59,690 | ) | ||||
Total | $ | 112,359 | $ | 129,264 | ||||
The estimated net amounts of amortization from acquired lease intangible assets for each of the next five years and thereafter are as follows:
($ in thousands) | Amortization of above market leases | Amortization of acquired lease intangible assets | Total | ||||||||
2018 | $ | 2,485 | $ | 9,441 | $ | 11,926 | |||||
2019 | 1,251 | 6,905 | 8,156 | ||||||||
2020 | 1,070 | 5,909 | 6,979 | ||||||||
2021 | 806 | 4,756 | 5,562 | ||||||||
2022 | 556 | 4,152 | 4,708 | ||||||||
Thereafter | 2,557 | 26,412 | 28,969 | ||||||||
Total | $ | 8,725 | $ | 57,575 | $ | 66,300 | |||||
Amortization of deferred leasing costs, leasing intangibles and other is included in depreciation and amortization expense in the accompanying consolidated statements of operations. The amortization of above market lease intangibles is included as a reduction to revenue. The amounts of such amortization included in the accompanying consolidated statements of operations are as follows:
($ in thousands) | For the year ended December 31, | |||||||||||
2017 | 2016 | 2015 | ||||||||||
Amortization of deferred leasing costs, lease intangibles and other | $ | 22,960 | $ | 24,898 | $ | 25,187 | ||||||
Amortization of above market lease intangibles | 4,025 | 6,602 | 6,860 | |||||||||
Note 6. Deferred Revenue, Intangibles, Net and Other Liabilities
F-24
Deferred revenue and other liabilities consist of the unamortized fair value of below market lease liabilities recorded in connection with purchase accounting, retainage payables for development and redevelopment projects, and tenant rent payments received in advance of the month in which they are due. The amortization of below market lease liabilities is recognized as revenue over the remaining life of the leases (including option periods for leases with below market renewal options) through 2046. Tenant rent payments received in advance are recognized as revenue in the period to which they apply, which is typically the month following their receipt.
At December 31, 2017 and 2016, deferred revenue, intangibles, net and other liabilities consisted of the following:
($ in thousands) | 2017 | 2016 | ||||||
Unamortized in-place lease liabilities | $ | 83,117 | $ | 95,360 | ||||
Retainages payable and other | 3,954 | 5,437 | ||||||
Tenant rents received in advance | 9,493 | 11,405 | ||||||
Total | $ | 96,564 | $ | 112,202 | ||||
The amortization of below market lease intangibles is included as a component of minimum rent in the accompanying consolidated statements and was $7.7 million, $13.5 million and $10.2 million for the years ended December 31, 2017, 2016 and 2015, respectively.
The estimated net amounts of amortization of in-place lease liabilities and the increasing effect on minimum rent for each of the next five years and thereafter is as follows:
($ in thousands) | |||
2018 | $ | 6,304 | |
2019 | 4,953 | ||
2020 | 4,454 | ||
2021 | 4,132 | ||
2022 | 3,957 | ||
Thereafter | 59,317 | ||
Total | $ | 83,117 | |
Note 7. Acquisitions and Transaction Costs
During the years ended December 31, 2017 and 2016, we did not acquire any operating properties.
The results of operations for the properties acquired during the year ended December 31, 2015, have been included in continuing operations within our consolidated financial statements since the respective dates of their acquisition.
The fair value of the real estate and other assets acquired by the Company were primarily determined using the income approach. The income approach required us to make assumptions about market leasing rates, tenant-related costs, discount rates, and disposal values. The estimates of fair value primarily relied upon Level 2 and Level 3 inputs, as previously defined.
Historically, transaction costs have been expensed as they are incurred, regardless of whether the transaction was ultimately completed or terminated. Transaction costs generally consist of legal, lender, due diligence, and other expenses for professional services. We did not incur any transaction costs for the year ended December 31, 2017. Transaction costs for the years ended December 31, 2016 and 2015 were $2.8 million and $1.6 million, respectively.
In 2015, we acquired four operating properties for total consideration of $185.8 million, including the assumption of an $18.3 million loan, which are summarized below:
F-25
Property Name | MSA | Acquisition Date | ||
Colleyville Downs | Dallas, TX | April 2015 | ||
Belle Isle Station | Oklahoma City, OK | May 2015 | ||
Livingston Shopping Center | Newark, NJ | July 2015 | ||
Chapel Hill Shopping Center | Fort Worth, TX | August 2015 | ||
The following table summarizes the estimation of the fair value of assets acquired and liabilities assumed for the properties acquired in 2015:
($ in thousands) | |||
Investment properties, net | $ | 176,223 | |
Lease-related intangible assets, net | 17,436 | ||
Other assets | 435 | ||
Total acquired assets | 194,094 | ||
Mortgage and other indebtedness | 18,473 | ||
Accounts payable and accrued expenses | 2,125 | ||
Deferred revenue and other liabilities | 8,269 | ||
Total assumed liabilities | 28,867 | ||
Fair value of acquired net assets | $ | 165,227 | |
The leases at the acquired properties had a weighted average remaining term at acquisition of approximately 9.4 years.
The operating properties acquired in 2015 generated revenues of $8.8 million and a loss from continuing operations of $1.3 million (inclusive of depreciation and amortization expense of $5.8 million) since their respective dates of acquisition through December 31, 2015. The revenues and loss from continuing operations are included in the consolidated statement of operations for the year ended December 31, 2015.
Note 8. Disposals of Operating Properties and Impairment Charges
During the year ended December 31, 2017, we sold four operating properties for aggregate gross proceeds of $76.1 million and a net gain of $15.2 million. The following summarizes our 2017 operating property dispositions.
Property Name | MSA | Disposition Date |
Cove Center | Stuart, FL | March 2017 |
Clay Marketplace | Birmingham, AL | June 2017 |
The Shops at Village Walk | Fort Myers, FL | June 2017 |
Wheatland Towne Crossing | Dallas, TX | June 2017 |
In connection with the preparation and review of the financial statements for the three months ended March 31, 2017, we evaluated an operating property for impairment including shortening of the intended holding period. We concluded the estimated undiscounted cash flows over the expected holding period did not exceed the carrying value of the asset. The Company estimated the fair value of the property to be $26.0 million using Level 3 inputs within the fair value hierarchy, primarily using the market approach. We compared the fair value measurement to the carrying value, which resulted in the recording of a non-cash impairment charge of $7.4 million.
During the year ended December 31, 2016, we sold two operating properties for aggregate gross proceeds of $14.2 million and a net gain of $4.3 million. The following summarizes our 2016 operating property dispositions.
F-26
Property Name | MSA | Disposition Date |
Shops at Otty | Portland, OR | June 2016 |
Publix at St. Cloud | St. Cloud, FL | December 2016 |
In 2015, we wrote off the book value of our Shops at Otty operating property and recorded a non-cash impairment charge of $1.6 million, as the estimated undiscounted cash flows over the remaining holding period did not exceed the carrying value of the asset.
During the year ended December 31, 2015, we sold nine properties for aggregate gross proceeds of $170.0 million and a net gain of $4.1 million. The following summarizes our 2015 operating property dispositions.
Property Name | MSA | Disposition Date | ||
Eastside Junction | Athens, AL | March 2015 | ||
Fairgrounds Crossing | Hot Springs, AR | March 2015 | ||
Hawk Ridge | Saint Louis, MO | March 2015 | ||
Prattville Town Center | Prattville, AL | March 2015 | ||
Regal Court | Shreveport, LA | March 2015 | ||
Whispering Ridge | Omaha, NE | March 2015 | ||
Walgreens Plaza | Jacksonville, NC | March 2015 | ||
Cornelius Gateway | Portland, OR | December 2015 | ||
Four Corner Square | Seattle, WA | December 2015 | ||
The results of all the operating properties sold in 2017, 2016 and 2015 are not included in discontinued operations in the accompanying statements of operations as none of the operating properties individually, nor in the aggregate, represent a strategic shift that has had or will have a material effect on our operations or financial results.
Note 9. Mortgage and Other Indebtedness
Mortgage and other indebtedness consisted of the following as of December 31, 2017 and 2016:
($ in thousands) | As of December 31, 2017 | |||||||||||||||
Principal | Unamortized Net Premiums | Unamortized Debt Issuance Costs | Total | |||||||||||||
Senior Unsecured Notes—Fixed Rate | ||||||||||||||||
Maturing at various dates through September 2027; interest rates ranging from 4.00% to 4.57% at December 31, 2017 | $ | 550,000 | $ | — | $ | (5,599 | ) | $ | 544,401 | |||||||
Unsecured Revolving Credit Facility | ||||||||||||||||
Matures July 20211; borrowing level up to $373.8 million available at December 31, 2017; interest at LIBOR + 1.35% or 2.91% at December 31, 2017 | 60,100 | — | (1,895 | ) | 58,205 | |||||||||||
Unsecured Term Loans | ||||||||||||||||
$200 million matures July 2021; interest at LIBOR + 1.30% or 2.86% at December 31, 2017; $200 million matures October 2022; interest at LIBOR + 1.60% or 3.16% at December 31, 2017 | 400,000 | — | (1,759 | ) | 398,241 | |||||||||||
Mortgage Notes Payable—Fixed Rate | ||||||||||||||||
Generally due in monthly installments of principal and interest; maturing at various dates through 2030; interest rates ranging from 3.78% to 6.78% at December 31, 2017 | 576,927 | 9,196 | (755 | ) | 585,368 | |||||||||||
Mortgage Notes Payable—Variable Rate | ||||||||||||||||
Due in monthly installments of principal and interest; maturing at various dates through 2023; interest at LIBOR + 1.60%-2.25%, ranging from 3.16% to 3.81% at December 31, 2017 | 113,623 | — | (599 | ) | 113,024 | |||||||||||
Total mortgage and other indebtedness | $ | 1,700,650 | $ | 9,196 | $ | (10,607 | ) | $ | 1,699,239 | |||||||
F-27
($ in thousands) | As of December 31, 2016 | |||||||||||||||
Principal | Unamortized Net Premiums | Unamortized Debt Issuance Costs | Total | |||||||||||||
Senior Unsecured Notes—Fixed Rate | ||||||||||||||||
Maturing at various dates through September 2027; interest rates ranging from 4.00% to 4.57% at December 31, 2016 | $ | 550,000 | $ | — | $ | (6,140 | ) | $ | 543,860 | |||||||
Unsecured Revolving Credit Facility | ||||||||||||||||
Matures July 20211; borrowing level up to $409.9 million available at December 31, 2016; interest at LIBOR + 1.35%2 or 2.12% at December 31, 2016 | 79,600 | — | (2,723 | ) | 76,877 | |||||||||||
Unsecured Term Loans | ||||||||||||||||
$200 million matures July 2021; interest at LIBOR + 1.30%2 or 2.07% at December 31, 2016; $200 million matures October 2022; interest at LIBOR + 1.60% or 2.37% at December 31, 2016 | 400,000 | — | (2,179 | ) | 397,821 | |||||||||||
Mortgage Notes Payable—Fixed Rate | ||||||||||||||||
Generally due in monthly installments of principal and interest; maturing at various dates through 2030; interest rates ranging from 3.78% to 6.78% at December 31, 2016 | 587,762 | 12,109 | (994 | ) | 598,877 | |||||||||||
Mortgage Notes Payable—Variable Rate | ||||||||||||||||
Due in monthly installments of principal and interest; maturing at various dates through 2023; interest at LIBOR + 1.60%-2.25%, ranging from 2.37% to 3.02% at December 31, 2016 | 114,388 | — | (749 | ) | 113,639 | |||||||||||
Total mortgage and other indebtedness | $ | 1,731,750 | $ | 12,109 | $ | (12,785 | ) | $ | 1,731,074 | |||||||
____________________ | |
1 | This presentation reflects the Company's exercise of its options to extend the maturity date for two additional periods of six months each, subject to certain conditions. |
2 | The interest rates on our unsecured revolving credit facility and unsecured term loan varied at certain parts of the year due to provisions in the agreement and the amendment and restatement of the agreement. |
The one month LIBOR interest rate was 1.56% and 0.77% as of December 31, 2017 and 2016, respectively.
Debt Issuance Costs
Debt issuance costs are amortized on a straight-line basis over the terms of the respective loan agreements.
The accompanying consolidated statements of operations include the following amounts of amortization of debt issuance costs as a component of interest expense:
($ in thousands) | For the year ended December 31, | |||||||||||
2017 | 2016 | 2015 | ||||||||||
Amortization of debt issuance costs | $ | 2,534 | $ | 4,521 | $ | 3,209 | ||||||
Unsecured Revolving Credit Facility and Unsecured Term Loans
We have an unsecured revolving credit facility (the "Credit Facility") with a total commitment of $500 million that matures in July 2021 (inclusive of the exercise of our option to extend the maturity date by one year), a $200 million unsecured term loan maturing in July 2021 ("Term Loan") and a $200 million seven-year unsecured term loan maturing in October 2022.
The Operating Partnership has the option to increase the borrowing availability of the Credit Facility to $1 billion and, the option to increase the Term Loan to provide for an additional $200 million, in each case subject to certain conditions, including obtaining commitments from one or more lenders.
F-28
As of December 31, 2017, $60.1 million was outstanding under the Credit Facility. Additionally, we had letters of credit outstanding which totaled $6.3 million, against which no amounts were advanced as of December 31, 2017.
The amount that we may borrow under our Credit Facility is limited by the value of the assets in our unencumbered asset pool. As of December 31, 2017, the value of the assets in our unencumbered asset pool, calculated pursuant to the Credit Facility agreement, was $1.4 billion. Taking into account outstanding borrowings on the line of credit, term loans, unsecured notes and letters of credit, we had $373.8 million available under our Credit Facility for future borrowings as of December 31, 2017.
Our ability to borrow under the Credit Facility is subject to our compliance with various restrictive and financial covenants, including with respect to liens, indebtedness, investments, dividends, mergers and asset sales. As of December 31, 2017, we were in compliance with all such covenants.
Senior Unsecured Notes
The Operating Partnership has $550 million of senior unsecured notes maturing at various dates through September 2027 (the "Notes"). The Notes contain a number of customary financial and restrictive covenants. As of December 31, 2017, we were in compliance with all such covenants.
Mortgage Loans
Mortgage loans are secured by certain real estate and in some cases by guarantees from the Operating Partnership, and are generally due in monthly installments of interest and principal and mature over various terms through 2030.
Debt Maturities
The following table presents maturities of mortgage debt and corporate debt as of December 31, 2017:
($ in thousands) | Scheduled Principal Payments | Term Maturities1 | Total | |||||||||
2018 | $ | 5,635 | $ | 37,584 | $ | 43,219 | ||||||
2019 | 5,975 | — | 5,975 | |||||||||
2020 | 5,920 | 42,339 | 48,259 | |||||||||
2021 | 4,625 | 419,975 | 424,600 | |||||||||
2022 | 1,113 | 405,208 | 406,321 | |||||||||
Thereafter | 7,236 | 765,040 | 772,276 | |||||||||
$ | 30,504 | $ | 1,670,146 | $ | 1,700,650 | |||||||
Unamortized net debt premiums and issuance costs, net | (1,411 | ) | ||||||||||
Total | $ | 1,699,239 | ||||||||||
____________________ | |
1 | This presentation reflects the Company's exercise of its options to extend the maturity date by one year to July 28, 2021 for the Company's unsecured credit facility. |
Other Debt Activity
For the year ended December 31, 2017, we had total new borrowings of $97.7 million and total repayments of $129.2 million. The components of this activity were as follows:
• | We retired the $6.7 million loan secured by our Pleasant Hill Commons operating property through a draw on our Credit Facility; |
• | We borrowed $91 million on the Credit Facility to fund redevelopment activities, development activities, and tenant improvement costs; |
• | We used the $76.1 million net proceeds from the sale of four operating properties to pay down the Credit Facility; |
F-29
• | We repaid $48.2 million on the Credit Facility using cash flows generated from operations; and |
• | We made scheduled principal payments on indebtedness during the year totaling $4.9 million. |
The amount of interest capitalized in 2017, 2016, and 2015 was $3.1 million, $4.1 million, and $4.6 million, respectively.
Fair Value of Fixed and Variable Rate Debt
As of December 31, 2017, the estimated fair value and book value of our fixed rate debt was $1.1 billion. The fair value was estimated using Level 2 and 3 inputs with cash flows discounted at current borrowing rates for similar instruments, which ranged from 3.78% to 6.78%. As of December 31, 2017, the estimated fair value of variable rate debt was $574.5 million compared to the book value of $573.7 million. The fair value was estimated using Level 2 and 3 inputs with cash flows discounted at current borrowing rates for similar instruments, which ranged from 2.86% to 3.81%.
Note 10. Derivative Instruments, Hedging Activities and Other Comprehensive Income
In order to manage potential future variable interest rate risk, we enter into interest rate derivative agreements from time to time. We do not use such agreements for trading or speculative purposes nor do we have any that are not designated as cash flow hedges. The agreements with each of our derivative counterparties provide that, in the event of default on any of our indebtedness, we could also be declared in default on our derivative obligations.
As of December 31, 2017, we were party to various cash flow derivative agreements with notional amounts totaling $435.5 million. These derivative agreements effectively fix the interest rate underlying certain variable rate debt instruments over expiration dates through 2021. Utilizing a weighted average interest rate spread over LIBOR on all variable rate debt resulted in fixing the weighted average interest rate at 3.15%.
These interest rate derivative agreements are the only assets or liabilities that we record at fair value on a recurring basis. The valuation of these assets and liabilities is determined using widely accepted techniques including discounted cash flow analysis. These techniques consider the contractual terms of the derivatives (including the period to maturity) and use observable market-based inputs such as interest rate curves and implied volatilities. We also incorporate credit valuation adjustments into the fair value measurements to reflect nonperformance risk on both our part and that of the respective counterparties.
We determined that the majority of the inputs used to value our derivatives fall within Level 2 of the fair value hierarchy, although the credit valuation adjustments associated with our derivatives utilize Level 3 inputs, such as estimates of current credit spreads to evaluate the likelihood of default by us and our counterparties. As of December 31, 2017 and December 31, 2016, we assessed the significance of the impact of the credit valuation adjustments on the overall valuation of our derivative positions and determined the credit valuation adjustments were not significant to the overall valuation of our derivatives. As a result, we determined our derivative valuations were classified within Level 2 of the fair value hierarchy.
As of December 31, 2017, the estimated fair value of our interest rate derivatives represented a net asset of $2.4 million, including accrued interest of $0.1 million. As of December 31, 2017, $3.1 million is reflected in prepaid and other assets and $0.7 million is reflected in accounts payable and accrued expenses on the accompanying consolidated balance sheet. At December 31, 2016 the estimated fair value of our interest rate derivatives was a net liability of $2.2 million, including accrued interest of $0.4 million. As of December 31, 2016, $0.9 million is reflected in prepaid and other assets and $3.1 million is reflected in accounts payable and accrued expenses on the accompanying consolidated balance sheet.
Amounts reported in accumulated other comprehensive income related to derivatives will be reclassified to earnings over time as the hedged items are recognized in earnings. Approximately $2.5 million, $4.8 million and $5.6 million was reclassified as a reduction to earnings during the years ended December 31, 2017, 2016 and 2015, respectively. As the interest payments on our derivatives are made over the next 12 months, we estimate the increase to interest expense to be $0.7 million, assuming the current LIBOR curve.
Unrealized gains and losses on our interest rate derivative agreements are the only components of the change in accumulated other comprehensive loss.
Note 11. Lease Information
Minimum Rentals from Tenant Leases
F-30
The Company receives rental income from the leasing of retail and office space under operating leases. The leases generally provide for certain increases in base rent, reimbursement for certain operating expenses and may require tenants to pay contingent rentals to the extent their sales exceed a defined threshold. The weighted average remaining term of the lease agreements is approximately 4.6 years. During the years ended December 31, 2017, 2016, and 2015, the Company earned overage rent of $1.1 million, $1.5 million, and $1.4 million, respectively.
As of December 31, 2017, future minimum rentals to be received under non-cancelable operating leases for each of the next five years and thereafter, excluding tenant reimbursements of operating expenses and percentage rent based on sales volume, are as follows:
($ in thousands) | |||
2018 | $ | 259,365 | |
2019 | 238,366 | ||
2020 | 215,584 | ||
2021 | 185,805 | ||
2022 | 151,127 | ||
Thereafter | 635,979 | ||
Total | $ | 1,686,226 | |
Commitments under Ground Leases
As of December 31, 2017, we are obligated under nine ground leases for approximately 47 acres of land. Most of these ground leases require fixed annual rent payments. The expiration dates of the remaining initial terms of these ground leases range from 2023 to 2092. These leases have five- to ten-year extension options ranging in total from 20 to 25 years. Ground lease expense incurred by the Company on these operating leases for the years ended December 31, 2017, 2016, and 2015 was $1.7 million, $1.8 million, and $1.1 million, respectively.
Future minimum lease payments due under ground leases for the next five years ending December 31 and thereafter are as follows:
($ in thousands) | |||
2018 | $ | 1,686 | |
2019 | 1,694 | ||
2020 | 1,777 | ||
2021 | 1,789 | ||
2022 | 1,815 | ||
Thereafter | 73,790 | ||
Total | $ | 82,551 | |
Note 12. Shareholders’ Equity
Common Equity
Our Board of Trustees declared a cash distribution of $0.3175 per common share and Common Unit for the fourth quarter of 2017, which represents a 5.0% increase over our previous quarterly distribution. This distribution was paid on January 12, 2018 to common shareholders and Common Unit holders of record as of January 5, 2018.
For the years ended December 31, 2017, 2016 and 2015, we declared cash distributions of $1.225, $1.165, and $1.090 respectively per common share and Common Units.
Accrued but unpaid distributions on common shares and units were $27.2 million and $25.9 million as of December 31, 2017 and 2016, respectively, and are included in accounts payable and accrued expenses in the accompanying consolidated balance sheets.
F-31
Preferred Equity
In 2015, we redeemed all 4,100,000 of our outstanding 8.25% Series A Cumulative Redeemable Perpetual Preferred Shares (the “Series A Preferred Shares”). The Series A Preferred Shares were redeemed at a total price of $25.0287 per share, which includes accrued and unpaid dividends or a total of $102.6 million. Prior to redemption the carrying value of these preferred shares, net of the original issuance costs, was reflected in Shareholders' Equity. In conjunction with the redemption, approximately $3.8 million of initial issuance costs were written off as a non-cash charge against income attributable to common shareholders.
Dividend Reinvestment and Share Purchase Plan
We maintain a Dividend Reinvestment and Share Purchase Plan, which offers investors the option to invest all or a portion of their common share dividends in additional common shares. Participants in this plan are also able to make optional cash investments with certain restrictions.
At-the-Market Equity Program
During 2016, we issued 137,229 of our common shares at an average price per share of $29.52 pursuant to our at-the-market equity program, generating gross proceeds of approximately $4.1 million and, after deducting commissions and other costs, net proceeds of approximately $3.8 million. The proceeds from these offerings were contributed to the Operating Partnership and used to pay down our unsecured revolving credit facility.
Note 13. Quarterly Financial Data (Unaudited)
Presented below is a summary of the consolidated quarterly financial data for the years ended December 31, 2017 and 2016.
($ in thousands, except per share data) | Quarter Ended March 31, 2017 | Quarter Ended June 30, 2017 | Quarter Ended September 30, 2017 | Quarter Ended December 31, 2017 | ||||||||||||
Total revenue | $ | 90,112 | $ | 92,649 | $ | 87,138 | $ | 88,919 | ||||||||
Operating income | 8,118 | 21,084 | 16,229 | 19,312 | ||||||||||||
(Loss) income before gains on sale of operating properties, net | (8,433 | ) | 4,568 | (204 | ) | 2,795 | ||||||||||
Gain on sale of operating properties, net | 8,870 | 6,290 | — | — | ||||||||||||
Consolidated net income (loss) | 437 | 10,858 | (204 | ) | 2,795 | |||||||||||
Net income (loss) attributable to Kite Realty Group Trust common shareholders | 5 | 10,180 | (622 | ) | 2,309 | |||||||||||
Net income (loss) per common share – basic and diluted | — | 0.12 | (0.01 | ) | 0.03 | |||||||||||
Weighted average Common Shares outstanding - basic | 83,565,325 | 83,585,736 | 83,594,163 | 83,595,677 | ||||||||||||
Weighted average Common Shares outstanding - diluted | 83,643,608 | 83,652,627 | 83,594,163 | 83,705,764 | ||||||||||||
F-32
($ in thousands, except per share data) | Quarter Ended March 31, 2016 | Quarter Ended June 30, 2016 | Quarter Ended September 30, 2016 | Quarter Ended December 31, 2016 | ||||||||||||
Total revenue | $ | 88,550 | $ | 87,575 | $ | 89,122 | $ | 88,874 | ||||||||
Operating income | 17,692 | 14,258 | 15,892 | 17,580 | ||||||||||||
Income (loss) before gains on sale of operating properties, net | 1,975 | (1,690 | ) | (1,262 | ) | (159 | ) | |||||||||
Gains on sale of operating properties, net | — | 194 | — | 4,059 | ||||||||||||
Consolidated net income (loss) | 1,975 | (1,496 | ) | (1,262 | ) | 3,900 | ||||||||||
Net income (loss) attributable to Kite Realty Group Trust common shareholders | 1,402 | (1,895 | ) | (1,682 | ) | 3,359 | ||||||||||
Net income (loss) per common share – basic and diluted | 0.02 | (0.02 | ) | (0.02 | ) | 0.04 | ||||||||||
Weighted average Common Shares outstanding - basic | 83,348,507 | 83,375,765 | 83,474,348 | 83,545,807 | ||||||||||||
Weighted average Common Shares outstanding - diluted | 83,490,979 | 83,375,765 | 83,474,348 | 83,571,663 | ||||||||||||
Note 14. Commitments and Contingencies
Other Commitments and Contingencies
We are not subject to any material litigation nor, to management’s knowledge, is any material litigation currently threatened against us. We are parties to routine litigation, claims, and administrative proceedings arising in the ordinary course of business. Management believes that such matters will not have a material adverse impact on our consolidated financial condition, results of operations or cash flows taken as a whole.
We are obligated under various completion guarantees with lenders and lease agreements with tenants to complete all or portions of the development and redevelopment projects. We believe we currently have sufficient financing in place to fund our investment in any existing or future projects through cash from operations, borrowings on our unsecured revolving credit facility and through borrowings on the construction loan for the Embassy Suites at University of Notre Dame.
In 2017, we provided a repayment guaranty on a $33.8 million construction loan associated with the development of the Embassy Suites at the University of Notre Dame consistent with our 35% ownership interest. No amount has been drawn on the loan as of December 31, 2017.
As of December 31, 2017, we had outstanding letters of credit totaling $6.3 million. At that date, there were no amounts advanced against these instruments.
Note 15. Supplemental Schedule of Non-Cash Financing Activities
The following schedule summarizes the non-cash financing activities of the Company for the years ended December 31, 2017, 2016 and 2015:
($ in thousands) | Year Ended December 31, | |||||||||||
2017 | 2016 | 2015 | ||||||||||
Assumption of mortgages by buyer upon sale of operating properties | $ | — | $ | — | $ | 40,303 | ||||||
Assumption of debt in connection with acquisition of Chapel Hill Shopping Center including debt premium of $212 | — | — | 18,462 | |||||||||
Note 16. Related Parties and Related Party Transactions
Subsidiaries of the Company provide certain management, construction management and other services to certain entities owned by certain members of the Company’s management. During the years ended December 31, 2017, 2016 and 2015, we earned less than $0.1 million during each year presented, from entities owned by certain members of management.
F-33
We reimburse an entity owned by certain members of our management for travel and related services. During the years ended December 31, 2017, 2016 and 2015, we paid $0.3 million, $0.4 million and $0.4 million, respectively, to this related entity.
Note 17. Subsequent Events
Dividend Declaration
On February 14, 2018, our Board of Trustees declared a cash distribution of $0.3175 per common share and Common Unit for the first quarter of 2018. This distribution is expected to be paid on or about April 13, 2018 to common shareholders and Common Unit holders of record as of April 6, 2018.
Redemption of Redeemable Noncontrolling Interests
On February 7, 2018, members in one of our operating subsidiaries provided notice that they were exercising their right to redeem their Class B units in the subsidiary for the cash redemption price, which is equal to $21.9 million. The amount that will be redeemed will be reclassified from temporary equity to accrued expenses in the consolidated balance sheets as of March 31, 2018 as the redemption is certain to occur as of that date. We expect to fund the redemption using cash on hand and borrowings on our unsecured revolving credit facility on or prior to August 7, 2018. For the redemption amount above $10.0 million, we can defer the closing for an additional three months until November 7, 2018.
F-34
Kite Realty Group Trust and Kite Realty Group, L.P. and subsidiaries
Schedule III
Consolidated Real Estate and Accumulated Depreciation
($ in thousands) | Initial Cost | Cost Capitalized Subsequent to Acquisition/Development | Gross Carrying Amount Close of Period | |||||||||||||||||||||||||||||||||||||
Building & | Building & | Building & | Accumulated | Year Built / | Year | |||||||||||||||||||||||||||||||||||
Name | Encumbrances | Land | Improvements | Land | Improvements | Land | Improvements | Total | Depreciation | Renovated | Acquired | |||||||||||||||||||||||||||||
Operating Properties | ||||||||||||||||||||||||||||||||||||||||
12th Street Plaza | $ | 5,000 | $ | 2,624 | $ | 13,237 | $ | — | $ | 382 | $ | 2,624 | $ | 13,619 | $ | 16,243 | $ | 3,078 | 1978/2003 | 2012 | ||||||||||||||||||||
54th & College * | — | 2,672 | — | — | — | 2,672 | — | 2,672 | — | 2008 | NA | |||||||||||||||||||||||||||||
Bayonne Crossing | 44,505 | 47,809 | 44,062 | — | 1,368 | 47,809 | 45,430 | 93,239 | 6,715 | 2011 | 2014 | |||||||||||||||||||||||||||||
Bayport Commons | 11,906 | 7,005 | 20,794 | — | 1,620 | 7,005 | 22,414 | 29,419 | 6,161 | 2008 | NA | |||||||||||||||||||||||||||||
Beacon Hill * | — | 3,272 | 13,426 | — | 996 | 3,272 | 14,423 | 17,695 | 4,197 | 2006 | NA | |||||||||||||||||||||||||||||
Bell Oaks Centre | 6,548 | 1,230 | 12,715 | — | 162 | 1,230 | 12,877 | 14,107 | 2,347 | 2008 | 2014 | |||||||||||||||||||||||||||||
Belle Isle Station * | — | 9,130 | 41,449 | — | 376 | 9,130 | 41,826 | 50,956 | 5,689 | 2000 | 2015 | |||||||||||||||||||||||||||||
Bolton Plaza * | — | 3,733 | 18,983 | 359 | 5,484 | 4,093 | 24,467 | 28,560 | 9,385 | 1986/2014 | NA | |||||||||||||||||||||||||||||
Boulevard Crossing | 10,683 | 4,386 | 9,175 | — | 2,099 | 4,386 | 11,274 | 15,660 | 4,688 | 2004 | NA | |||||||||||||||||||||||||||||
Bridgewater Marketplace * | — | 3,407 | 8,668 | — | 422 | 3,407 | 9,091 | 12,498 | 2,693 | 2008 | NA | |||||||||||||||||||||||||||||
Burlington * | — | 29 | 2,773 | — | — | 29 | 2,773 | 2,802 | 1,183 | 1992/2000 | 2000 | |||||||||||||||||||||||||||||
Cannery Corner | — | 6,267 | 10,516 | — | 415 | 6,267 | 10,932 | 17,199 | 1,862 | 2008 | 2014 | |||||||||||||||||||||||||||||
Castleton Crossing * | — | 9,761 | 28,977 | — | 3,238 | 9,761 | 32,215 | 41,976 | 7,667 | 1975 | 2013 | |||||||||||||||||||||||||||||
Chapel Hill Shopping Center | 18,250 | — | 35,074 | — | 409 | — | 35,483 | 35,483 | 4,026 | 2001 | 2015 | |||||||||||||||||||||||||||||
Centennial Center | 70,455 | 58,960 | 72,756 | — | 3,345 | 58,960 | 76,101 | 135,061 | 19,174 | 2002 | 2014 | |||||||||||||||||||||||||||||
Centennial Gateway | 44,385 | 5,305 | 48,712 | — | 1,803 | 5,305 | 50,515 | 55,820 | 9,116 | 2005 | 2014 | |||||||||||||||||||||||||||||
Centre Point Commons | 14,410 | 2,918 | 22,647 | — | 257 | 2,918 | 22,903 | 25,821 | 3,603 | 2007 | 2014 | |||||||||||||||||||||||||||||
Cobblestone Plaza * | — | 11,221 | 45,551 | — | 490 | 11,221 | 46,041 | 57,262 | 9,585 | 2011 | NA | |||||||||||||||||||||||||||||
Colonial Square * | — | 11,743 | 31,299 | — | 898 | 11,743 | 32,197 | 43,940 | 4,220 | 2010 | 2014 | |||||||||||||||||||||||||||||
Colleyville Downs * | — | 5,446 | 38,574 | — | 830 | 5,446 | 39,404 | 44,850 | 6,053 | 2014 | 2015 | |||||||||||||||||||||||||||||
Cool Creek Commons * | — | 6,062 | 13,430 | — | 1,807 | 6,062 | 15,236 | 21,298 | 5,405 | 2005 | NA | |||||||||||||||||||||||||||||
Cool Springs Market * | — | 12,684 | 21,454 | — | 8,262 | 12,684 | 29,716 | 42,400 | 6,726 | 1995 | 2013 | |||||||||||||||||||||||||||||
Crossing at Killingly Commons | 33,000 | 21,999 | 35,218 | — | 132 | 21,999 | 35,350 | 57,349 | 5,827 | 2010 | 2014 | |||||||||||||||||||||||||||||
Delray Marketplace | 56,850 | 18,750 | 88,877 | 1,284 | 4,818 | 20,034 | 93,695 | 113,729 | 14,919 | 2013 | NA | |||||||||||||||||||||||||||||
DePauw University Bookstore and Café | — | 64 | 663 | — | 45 | 64 | 708 | 772 | 274 | 2012 | NA | |||||||||||||||||||||||||||||
Draper Crossing * | — | 9,054 | 28,485 | — | 183 | 9,054 | 28,668 | 37,722 | 5,801 | 2012 | 2014 | |||||||||||||||||||||||||||||
Draper Peaks * | — | 11,498 | 46,876 | 522 | 2,340 | 12,020 | 49,216 | 61,236 | 5,912 | 2012 | 2014 | |||||||||||||||||||||||||||||
Eastern Beltway Center | 34,100 | 23,221 | 45,633 | — | 801 | 23,221 | 46,434 | 69,655 | 6,075 | 1998/2006 | 2014 | |||||||||||||||||||||||||||||
Eastgate Plaza | — | 4,073 | 20,207 | — | 164 | 4,073 | 20,372 | 24,445 | 3,193 | 2002 | 2014 | |||||||||||||||||||||||||||||
Eastgate Pavilion * | — | 8,026 | 18,899 | — | 1,715 | 8,026 | 20,614 | 28,640 | 8,147 | 1995 | 2004 | |||||||||||||||||||||||||||||
Eddy Street Commons | 23,131 | 1,900 | 37,739 | — | 1,249 | 1,900 | 38,988 | 40,888 | 10,508 | 2009 | NA | |||||||||||||||||||||||||||||
Estero Town Commons * | — | 8,973 | 9,960 | — | 979 | 8,973 | 10,939 | 19,912 | 3,033 | 2006 | NA | |||||||||||||||||||||||||||||
Fox Lake Crossing * | — | 5,685 | 9,274 | — | 347 | 5,685 | 9,621 | 15,306 | 3,775 | 2002 | 2005 | |||||||||||||||||||||||||||||
Gainesville Plaza * | — | 5,437 | 18,237 | — | 1,515 | 5,437 | 19,751 | 25,188 | 5,911 | 2015 | 2004 | |||||||||||||||||||||||||||||
Geist Pavilion * | — | 1,368 | 8,449 | — | 1,820 | 1,368 | 10,269 | 11,637 | 3,752 | 2006 | NA | |||||||||||||||||||||||||||||
Glendale Town Center * | — | 1,494 | 43,838 | — | 2,247 | 1,494 | 46,084 | 47,578 | 28,514 | 1958/2008 | 1999 | |||||||||||||||||||||||||||||
Greyhound Commons * | — | 2,629 | 794 | — | 887 | 2,629 | 1,681 | 4,310 | 696 | 2005 | NA | |||||||||||||||||||||||||||||
F-35
Initial Cost | Cost Capitalized Subsequent to Acquisition/Development | Gross Carrying Amount Close of Period | ||||||||||||||||||||||||||||||||||||||
Building & | Building & | Building & | Accumulated | Year Built / | Year | |||||||||||||||||||||||||||||||||||
Name | Encumbrances | Land | Improvements | Land | Improvements | Land | Improvements | Total | Depreciation | Renovated | Acquired | |||||||||||||||||||||||||||||
Operating Properties (continued) | ||||||||||||||||||||||||||||||||||||||||
Hamilton Crossing - Phase II & III * | $ | — | $ | 2,859 | $ | 23,190 | $ | — | $ | 451 | $ | 2,859 | $ | 23,641 | $ | 26,500 | $ | 3,427 | 2008 | 2014 | ||||||||||||||||||||
Hitchcock Plaza * | — | 4,260 | 21,960 | — | 2,488 | 4,260 | 24,447 | 28,707 | 2,893 | 2006 | 2014 | |||||||||||||||||||||||||||||
Holly Springs Towne Center - Phase I * | — | 12,319 | 46,689 | — | 1,458 | 12,319 | 48,147 | 60,466 | 7,474 | 2013 | NA | |||||||||||||||||||||||||||||
Holly Springs Towne Center - Phase II * | — | 11,910 | 49,212 | — | — | 11,910 | 49,212 | 61,122 | 2,162 | 2016 | NA | |||||||||||||||||||||||||||||
Hunters Creek Promenade * | — | 8,335 | 12,706 | — | 917 | 8,335 | 13,623 | 21,958 | 2,241 | 1994 | 2013 | |||||||||||||||||||||||||||||
Indian River Square * | — | 5,100 | 6,354 | — | 584 | 5,100 | 6,938 | 12,038 | 2,568 | 1997/2004 | 2005 | |||||||||||||||||||||||||||||
International Speedway Square * | 19,017 | 7,769 | 18,045 | — | 9,352 | 7,769 | 27,397 | 35,166 | 15,540 | 1999 | NA | |||||||||||||||||||||||||||||
Kings Lake Square * | — | 4,519 | 15,630 | — | 492 | 4,519 | 16,122 | 20,641 | 7,063 | 1986/2014 | 2003 | |||||||||||||||||||||||||||||
Kingwood Commons * | — | 5,715 | 30,891 | — | 143 | 5,715 | 31,034 | 36,749 | 6,916 | 1999 | 2013 | |||||||||||||||||||||||||||||
Lake City Commons | 5,200 | 3,415 | 10,242 | — | 349 | 3,415 | 10,591 | 14,006 | 1,853 | 2008 | 2014 | |||||||||||||||||||||||||||||
Lake City Commons - Phase II * | — | 1,277 | 2,225 | — | 16 | 1,277 | 2,241 | 3,518 | 361 | 2011 | 2014 | |||||||||||||||||||||||||||||
Lake Mary Plaza | 5,080 | 1,413 | 8,719 | — | 89 | 1,413 | 8,807 | 10,220 | 1,185 | 2009 | 2014 | |||||||||||||||||||||||||||||
Lakewood Promenade * | — | 1,783 | 25,471 | — | 1,256 | 1,783 | 26,728 | 28,511 | 6,706 | 1948/1998 | 2013 | |||||||||||||||||||||||||||||
Landstown Commons * | — | 18,672 | 92,045 | — | 2,626 | 18,672 | 94,671 | 113,343 | 16,404 | 2007 | 2014 | |||||||||||||||||||||||||||||
Lima Marketplace | 8,383 | 4,703 | 15,706 | — | 543 | 4,703 | 16,249 | 20,952 | 2,815 | 2008 | 2014 | |||||||||||||||||||||||||||||
Lithia Crossing * | — | 3,065 | 9,962 | — | 5,605 | 3,065 | 15,567 | 18,632 | 4,317 | 1993/2003 | 2011 | |||||||||||||||||||||||||||||
Livingston Shopping Center * | — | 10,372 | 35,537 | — | — | 10,372 | 35,537 | 45,909 | 3,181 | 1997 | 2015 | |||||||||||||||||||||||||||||
Lowe's Plaza | — | 2,125 | 5,976 | — | 53 | 2,125 | 6,029 | 8,154 | 997 | 2007 | 2014 | |||||||||||||||||||||||||||||
Market Street Village * | — | 9,764 | 16,360 | — | 2,920 | 9,764 | 19,280 | 29,044 | 6,533 | 1970/2004 | 2005 | |||||||||||||||||||||||||||||
Memorial Commons * | — | 1,568 | 14,628 | — | 341 | 1,568 | 14,969 | 16,537 | 2,022 | 2008 | 2014 | |||||||||||||||||||||||||||||
Merrimack Village Center | 5,445 | 1,921 | 12,777 | — | 149 | 1,921 | 12,927 | 14,848 | 2,277 | 2007 | 2014 | |||||||||||||||||||||||||||||
Miramar Square | 31,625 | 26,392 | 30,889 | 489 | 607 | 26,880 | 31,496 | 58,376 | 5,188 | 2008 | 2014 | |||||||||||||||||||||||||||||
Mullins Crossing * | — | 10,582 | 42,031 | — | 398 | 10,582 | 42,429 | 53,011 | 8,683 | 2005 | 2014 | |||||||||||||||||||||||||||||
Naperville Marketplace | 7,513 | 5,364 | 11,475 | — | 106 | 5,364 | 11,580 | 16,944 | 3,336 | 2008 | NA | |||||||||||||||||||||||||||||
Northcrest Shopping Center | 15,780 | 4,044 | 33,857 | — | 980 | 4,044 | 34,837 | 38,881 | 4,509 | 2008 | 2014 | |||||||||||||||||||||||||||||
Northdale Promenade * | — | 1,718 | 27,481 | — | — | 1,718 | 27,481 | 29,199 | 7,732 | 2017 | NA | |||||||||||||||||||||||||||||
Oleander Place * | — | 863 | 5,935 | — | 30 | 863 | 5,965 | 6,828 | 1,727 | 2012 | 2011 | |||||||||||||||||||||||||||||
Palm Coast Landing | 22,274 | 4,962 | 37,995 | — | 769 | 4,962 | 38,764 | 43,726 | 5,848 | 2010 | 2014 | |||||||||||||||||||||||||||||
Parkside Town Commons - Phase I * | — | 3,108 | 43,313 | — | — | 3,108 | 43,313 | 46,421 | 5,848 | 2015 | N/A | |||||||||||||||||||||||||||||
Parkside Town Commons - Phase II * | — | 20,722 | 66,766 | — | — | 20,722 | 66,766 | 87,488 | 6,012 | 2017 | N/A | |||||||||||||||||||||||||||||
Perimeter Woods | 33,330 | 35,793 | 27,257 | — | 706 | 35,793 | 27,964 | 63,757 | 3,923 | 2008 | 2014 | |||||||||||||||||||||||||||||
Pine Ridge Crossing * | — | 5,640 | 17,084 | — | 3,480 | 5,640 | 20,564 | 26,204 | 6,122 | 1993 | 2006 | |||||||||||||||||||||||||||||
Plaza at Cedar Hill * | — | 5,782 | 36,781 | — | 9,462 | 5,782 | 46,243 | 52,025 | 18,486 | 2000 | 2004 | |||||||||||||||||||||||||||||
Plaza Volente * | — | 4,600 | 29,074 | — | 1,042 | 4,600 | 30,117 | 34,717 | 11,625 | 2004 | 2005 | |||||||||||||||||||||||||||||
Pleasant Hill Commons * | — | 3,350 | 10,103 | — | 323 | 3,350 | 10,427 | 13,777 | 1,856 | 2008 | 2014 | |||||||||||||||||||||||||||||
Portofino Shopping Center * | — | 4,754 | 75,117 | — | 14,747 | 4,754 | 89,864 | 94,618 | 17,573 | 1999 | 2013 | |||||||||||||||||||||||||||||
Publix at Acworth | 5,557 | 1,357 | 7,938 | 39 | 1,115 | 1,395 | 9,053 | 10,448 | 3,490 | 1996 | 2004 | |||||||||||||||||||||||||||||
Publix at Woodruff * | — | 1,783 | 6,342 | — | 303 | 1,783 | 6,645 | 8,428 | 2,245 | 1997 | 2012 | |||||||||||||||||||||||||||||
F-36
Initial Cost | Cost Capitalized Subsequent to Acquisition/Development | Gross Carrying Amount Close of Period | ||||||||||||||||||||||||||||||||||||||
Building & | Building & | Building & | Accumulated | Year Built / | Year | |||||||||||||||||||||||||||||||||||
Name | Encumbrances | Land | Improvements | Land | Improvements | Land | Improvements | Total | Depreciation | Renovated | Acquired | |||||||||||||||||||||||||||||
Operating Properties (continued) | ||||||||||||||||||||||||||||||||||||||||
Rangeline Crossing * | $ | — | $ | 2,043 | $ | 18,414 | $ | — | $ | 564 | $ | 2,043 | $ | 18,979 | $ | 21,022 | $ | 5,782 | 1986/2013 | NA | ||||||||||||||||||||
Riverchase Plaza * | — | 3,889 | 11,404 | — | 1,348 | 3,889 | 12,752 | 16,641 | 4,369 | 1991/2001 | 2006 | |||||||||||||||||||||||||||||
Rivers Edge * | — | 5,647 | 31,358 | — | 1,354 | 5,647 | 32,712 | 38,359 | 7,695 | 2011 | 2008 | |||||||||||||||||||||||||||||
Saxon Crossing | 11,400 | 3,764 | 16,791 | — | 25 | 3,764 | 16,815 | 20,579 | 2,773 | 2009 | 2014 | |||||||||||||||||||||||||||||
Shoppes at Plaza Green * | — | 3,749 | 23,853 | — | 1,269 | 3,749 | 25,122 | 28,871 | 6,329 | 2000 | 2012 | |||||||||||||||||||||||||||||
Shoppes of Eastwood * | — | 1,688 | 8,926 | — | 563 | 1,688 | 9,489 | 11,177 | 2,361 | 1997 | 2013 | |||||||||||||||||||||||||||||
Shops at Eagle Creek * | — | 4,550 | 8,844 | — | 5,000 | 4,550 | 13,844 | 18,394 | 4,569 | 1998 | 2003 | |||||||||||||||||||||||||||||
Shops at Julington Creek | 4,785 | 2,372 | 7,976 | — | 103 | 2,372 | 8,079 | 10,451 | 1,351 | 2011 | 2014 | |||||||||||||||||||||||||||||
Shops at Moore | 21,300 | 8,030 | 33,380 | — | 1,677 | 8,030 | 35,057 | 43,087 | 7,333 | 2010 | 2014 | |||||||||||||||||||||||||||||
Silver Springs Pointe | 8,800 | 9,685 | 7,676 | — | 276 | 9,685 | 7,952 | 17,637 | 2,388 | 2001 | 2014 | |||||||||||||||||||||||||||||
South Elgin Commons * | — | 3,916 | 22,140 | — | 49 | 3,916 | 22,188 | 26,104 | 3,629 | 2011 | 2014 | |||||||||||||||||||||||||||||
Stoney Creek Commons * | — | 628 | 3,700 | — | 5,837 | 628 | 9,538 | 10,166 | 2,645 | 2000 | NA | |||||||||||||||||||||||||||||
Sunland Towne Centre * | — | 14,774 | 22,542 | — | 5,099 | 14,774 | 27,641 | 42,415 | 10,823 | 1996 | 2004 | |||||||||||||||||||||||||||||
Tamiami Crossing * | — | 19,810 | 29,227 | — | — | 19,810 | 29,227 | 49,037 | 1,567 | 2016 | NA | |||||||||||||||||||||||||||||
Tarpon Bay Plaza * | — | 4,273 | 23,856 | — | 2,735 | 4,273 | 26,592 | 30,865 | 7,439 | 2007 | NA | |||||||||||||||||||||||||||||
Temple Terrace * | — | 2,245 | 9,229 | — | 108 | 2,245 | 9,336 | 11,581 | 1,212 | 2012 | 2014 | |||||||||||||||||||||||||||||
The Centre at Panola * | 1,667 | 1,986 | 8,191 | — | 372 | 1,986 | 8,563 | 10,549 | 3,727 | 2001 | 2004 | |||||||||||||||||||||||||||||
The Corner | 14,750 | 3,772 | 24,605 | — | 80 | 3,772 | 24,686 | 28,458 | 3,344 | 2008 | 2014 | |||||||||||||||||||||||||||||
The Landing at Tradition * | — | 18,505 | 45,821 | — | 2,109 | 18,505 | 47,929 | 66,434 | 8,992 | 2007 | 2014 | |||||||||||||||||||||||||||||
Toringdon Market * | — | 5,448 | 9,411 | — | 291 | 5,448 | 9,703 | 15,151 | 2,084 | 2004 | 2013 | |||||||||||||||||||||||||||||
Traders Point * | — | 9,443 | 36,433 | — | 2,428 | 9,443 | 38,861 | 48,304 | 14,382 | 2005 | NA | |||||||||||||||||||||||||||||
Traders Point II * | — | 2,376 | 6,441 | — | 1,138 | 2,376 | 7,578 | 9,954 | 2,752 | 2005 | NA | |||||||||||||||||||||||||||||
Tradition Village Center * | — | 3,140 | 14,809 | — | 1,149 | 3,140 | 15,958 | 19,098 | 2,714 | 2006 | 2014 | |||||||||||||||||||||||||||||
Trussville Promenade * | — | 9,123 | 45,359 | — | 5,234 | 9,123 | 50,593 | 59,716 | 11,319 | 1999 | 2013 | |||||||||||||||||||||||||||||
University Town Center | 18,690 | 4,125 | 31,565 | — | 735 | 4,125 | 32,300 | 36,425 | 5,024 | 2009 | 2014 | |||||||||||||||||||||||||||||
University Town Center - Phase II | 10,500 | 7,902 | 24,164 | — | 765 | 7,902 | 24,929 | 32,831 | 4,588 | 2012 | 2014 | |||||||||||||||||||||||||||||
Village at Bay Park | 9,183 | 8,248 | 9,942 | — | 584 | 8,248 | 10,526 | 18,774 | 1,452 | 2005 | 2014 | |||||||||||||||||||||||||||||
Waterford Lakes Village * | — | 2,317 | 6,382 | — | 277 | 2,317 | 6,659 | 8,976 | 2,553 | 1997 | 2004 | |||||||||||||||||||||||||||||
Waxahachie Crossing | 7,750 | 1,411 | 15,698 | — | 105 | 1,411 | 15,803 | 17,214 | 2,010 | 2010 | 2014 | |||||||||||||||||||||||||||||
Westside Market * | — | 4,194 | 17,698 | — | 335 | 4,194 | 18,033 | 22,227 | 2,000 | 2013 | 2014 | |||||||||||||||||||||||||||||
Whitehall Pike | 4,569 | 3,689 | 6,109 | — | 233 | 3,689 | 6,341 | 10,030 | 4,397 | 1999 | NA | |||||||||||||||||||||||||||||
Total Operating Properties | 645,822 | 780,260 | 2,533,127 | 2,692 | 159,648 | 782,952 | 2,692,774 | 3,475,726 | 586,651 | |||||||||||||||||||||||||||||||
F-37
Initial Cost | Cost Capitalized Subsequent to Acquisition/Development | Gross Carrying Amount Close of Period | ||||||||||||||||||||||||||||||||||||||
Building & | Building & | Building & | Accumulated | Year Built / | Year | |||||||||||||||||||||||||||||||||||
Name | Encumbrances | Land | Improvements | Land | Improvements | Land | Improvements | Total | Depreciation | Renovated | Acquired | |||||||||||||||||||||||||||||
Office Properties | ||||||||||||||||||||||||||||||||||||||||
Thirty South | $ | 17,218 | $ | 1,643 | $ | 9,669 | $ | — | $ | 18,973 | $ | 1,643 | $ | 28,642 | $ | 30,285 | $ | 14,500 | 1905/2002 | 2001 | ||||||||||||||||||||
Union Station Parking Garage * | — | 904 | 2,650 | — | 1,268 | 904 | 3,918 | 4,822 | 1,642 | 1986 | 2001 | |||||||||||||||||||||||||||||
Total Office Properties | 17,218 | 2,547 | 12,319 | — | 20,241 | 2,547 | 32,560 | 35,107 | 16,142 | |||||||||||||||||||||||||||||||
Development and Redevelopment Properties | ||||||||||||||||||||||||||||||||||||||||
Beechwood Promenade * | — | 2,734 | 47,978 | — | — | 2,734 | 47,978 | 50,712 | 9,494 | NA | NA | |||||||||||||||||||||||||||||
Burnt Store Promenade * | — | 5,112 | 14,910 | — | — | 5,112 | 14,910 | 20,022 | 4,164 | NA | NA | |||||||||||||||||||||||||||||
City Center * | — | 20,565 | 177,389 | — | — | 20,565 | 177,389 | 197,954 | 23,611 | NA | NA | |||||||||||||||||||||||||||||
Courthouse Shadows * | — | 4,999 | 17,213 | — | — | 4,999 | 17,213 | 22,212 | 4,979 | NA | NA | |||||||||||||||||||||||||||||
Eddy Street Commons - Phase II * | — | 1,379 | — | — | — | 1,379 | — | 1,379 | — | NA | NA | |||||||||||||||||||||||||||||
Fishers Station | 6,555 | 3,736 | 16,297 | — | — | 3,736 | 16,297 | 20,033 | 4,391 | NA | NA | |||||||||||||||||||||||||||||
Hamilton Crossing Centre | 10,214 | 5,549 | 10,289 | — | — | 5,549 | 10,289 | 15,838 | 3,641 | NA | NA | |||||||||||||||||||||||||||||
Rampart Commons | 10,742 | 1,136 | 36,514 | — | — | 1,136 | 36,514 | 37,650 | 4,963 | NA | NA | |||||||||||||||||||||||||||||
The Corner * | — | 304 | 3,724 | — | — | 304 | 3,724 | 4,028 | 2,100 | NA | NA | |||||||||||||||||||||||||||||
Total Development and Redevelopment Properties | 27,511 | 45,514 | 324,314 | — | — | 45,514 | 324,314 | 369,828 | 57,342 | |||||||||||||||||||||||||||||||
Other ** | ||||||||||||||||||||||||||||||||||||||||
Bridgewater Marketplace * | — | 2,110 | — | — | — | 2,110 | — | 2,110 | — | NA | NA | |||||||||||||||||||||||||||||
Deerwood Lake * | — | 1,421 | 25,272 | — | — | 1,421 | 25,272 | 26,693 | 141 | NA | NA | |||||||||||||||||||||||||||||
Eddy Street Commons * | — | 277 | — | — | — | 277 | — | 277 | — | NA | NA | |||||||||||||||||||||||||||||
Fox Lake Crossing II | — | 3,458 | — | — | — | 3,458 | — | 3,458 | — | NA | NA | |||||||||||||||||||||||||||||
KRG Development | — | — | 655 | — | — | — | 656 | 656 | — | NA | NA | |||||||||||||||||||||||||||||
KRG New Hill * | — | 5,791 | — | — | — | 5,791 | — | 5,791 | — | NA | NA | |||||||||||||||||||||||||||||
KRG Peakway | — | 20,944 | — | — | — | 20,944 | — | 20,944 | — | NA | NA | |||||||||||||||||||||||||||||
Pan Am Plaza | — | 8,840 | — | — | — | 8,840 | — | 8,840 | — | NA | NA | |||||||||||||||||||||||||||||
Total Other | — | 42,841 | 25,928 | — | — | 42,841 | 25,929 | 68,770 | 141 | |||||||||||||||||||||||||||||||
Line of credit/Term Loan/Unsecured notes | 1,010,100 | — | — | — | — | — | — | — | — | NA | NA | |||||||||||||||||||||||||||||
Grand Total | $ | 1,700,650 | $ | 871,161 | $ | 2,895,688 | $ | 2,692 | $ | 179,889 | $ | 873,854 | $ | 3,075,577 | $ | 3,949,431 | $ | 660,276 | ||||||||||||||||||||||
____________________ | |
* | This property or a portion of the property is included as an unencumbered asset used in calculating our line of credit borrowing base. |
** | This category generally includes land held for development. We also have certain additional land parcels at our development and operating properties, which amounts are included elsewhere in this table. |
F-38
Kite Realty Group Trust and Kite Realty Group, L.P. and subsidiaries
Notes to Schedule III
Consolidated Real Estate and Accumulated Depreciation
($ in thousands)
Note 1. Reconciliation of Investment Properties
The changes in investment properties of the Company for the years ended December 31, 2017, 2016, and 2015 are as follows:
2017 | 2016 | 2015 | ||||||||||
Balance, beginning of year | $ | 3,988,819 | $ | 3,926,180 | $ | 3,897,131 | ||||||
Acquisitions | — | — | 176,068 | |||||||||
Improvements | 78,947 | 97,161 | 92,717 | |||||||||
Impairment | (10,897 | ) | — | (2,293 | ) | |||||||
Disposals | (107,438 | ) | (34,522 | ) | (237,443 | ) | ||||||
Balance, end of year | $ | 3,949,431 | $ | 3,988,819 | $ | 3,926,180 | ||||||
The unaudited aggregate cost of investment properties for federal tax purposes as of December 31, 2017 was $3.0 billion.
Note 2. Reconciliation of Accumulated Depreciation
The changes in accumulated depreciation of the Company for the years ended December 31, 2017, 2016, and 2015 are as follows:
2017 | 2016 | 2015 | ||||||||||
Balance, beginning of year | $ | 556,851 | $ | 428,930 | $ | 313,524 | ||||||
Depreciation expense | 148,346 | 148,947 | 141,516 | |||||||||
Impairment | (3,494 | ) | — | (833 | ) | |||||||
Disposals | (41,427 | ) | (21,026 | ) | (25,277 | ) | ||||||
Balance, end of year | $ | 660,276 | $ | 556,851 | $ | 428,930 | ||||||
Depreciation of investment properties reflected in the statements of operations is calculated over the estimated original lives of the assets as follows:
Buildings | 20-35 years |
Building improvements | 10-35 years |
Tenant improvements | Term of related lease |
Furniture and Fixtures | 5-10 years |
All other schedules have been omitted because they are inapplicable, not required or the information is included elsewhere in the consolidated financial statements or notes thereto.
F-39