Attached files
UNITED STATES
SECURITIES AND EXCHANGE COMMISSION
Washington, D.C. 20549
FORM 10-K
|
(Mark One)
|
|
|
x
|
Annual report pursuant to Section 13 or 15(d) of the Securities Exchange Act of 1934
|
|
For the fiscal year ended December 31, 2010
|
|
|
o
|
Transition report pursuant to Section 13 or 15(d) of the Securities Exchange Act of 1934
|
|
For the transition period from ___________to___________
|
|
|
Commission File Number: 001-32268
|
|
Kite Realty Group Trust
(Exact name of registrant as specified in its charter)
|
Maryland
|
11-3715772
|
||
|
(State or other jurisdiction of incorporation or organization)
|
(IRS Employer Identification No.)
|
||
|
30 S. Meridian Street, Suite 1100
|
|||
|
Indianapolis, Indiana 46204
|
|||
|
(Address of principal executive offices) (Zip code)
|
|||
|
(317) 577-5600
|
|||
|
(Registrant’s telephone number, including area code)
|
|||
|
Title of each class
|
Name of each exchange on which registered
|
||
|
Common Shares, $0.01 par value
|
New York Stock Exchange
|
||
|
8.25% Series A Cumulative Redeemable Perpetual Preferred Shares
|
New York Stock Exchange
|
||
Securities registered pursuant to Section 12(g) of the Act: None
Indicate by check mark if the Registrant is a well-known seasoned issuer, as defined by Rule 405 of the Securities Act. Yes o No x
Indicate by check mark if the Registrant is not required to file reports pursuant to Section 13 of Section 15(d) of the Act. Yes o No x
Indicate by check mark whether the Registrant (1) has filed all reports required to be filed by Section 13 or 15(d) of the Securities Exchange Act of 1934 during the preceding 12 months (or for such shorter period that the Registrant was required to file such reports), and (2) has been subject to such filing requirements for the past 90 days. Yes x No o
Indicate by check mark whether the Registrant has submitted electronically and posted on its corporate Web site, if any, every Interactive Data File required to be submitted and posted pursuant to Rule 405 of Regulation S-T during the preceding 12 months (or for such shorter period that the registrant was required to submit and post such files). Yes o No o
Indicate by check mark if disclosure of delinquent filers pursuant to Item 405 of Regulation S-K is not contained herein, and will not be contained, to the best of Registrant’s knowledge, in definitive proxy or information statements incorporated by reference in Part III of this Form 10-K or any amendment to this Form 10-K. x
Indicate by check mark whether the Registrant is a large accelerated filer, an accelerated filer, a non-accelerated filer, or a smaller reporting company. See the definitions of “large accelerated filer,” “accelerated filer,” and “smaller reporting company” in Rule 12b-2 of the Exchange Act.
|
Large accelerated filer
|
o
|
Accelerated filer
|
x
|
Non-accelerated filer
|
o
|
Smaller reporting company
|
o
|
|||||
|
(do not check if a smaller reporting company)
|
||||||||||||
Indicate by check mark whether the Registrant is a shell company (as defined in Rule 12b-2 of the Act) Yes o No x
The aggregate market value of the voting shares held by non-affiliates of the Registrant as the last business day of the Registrant’s most recently completed second quarter was $241 million based upon the closing price of $4.18 per share on the New York Stock Exchange on such date.
The number of Common Shares outstanding as of February 28, 2011 was 63,501,621 ($.01 par value).
Documents Incorporated by Reference
Portions of the Proxy Statement relating to the Registrant’s Annual Meeting of Shareholders, scheduled to be held on May 3, 2011, to be filed with the Securities and Exchange Commission, are incorporated by reference into Part III, Items 10-14 of this Annual Report on Form 10-K as indicated herein.
KITE REALTY GROUP TRUST
Annual Report on Form 10-K
For the Fiscal Year Ended
December 31, 2010
TABLE OF CONTENTS
|
Page
|
|||
|
Item No.
|
|||
|
Part I
|
|||
|
1.
|
2
|
||
|
1A.
|
9
|
||
|
1B.
|
19
|
||
|
2.
|
20
|
||
|
3.
|
32
|
||
|
4.
|
32
|
||
|
Part II
|
|||
|
5.
|
33
|
||
|
6.
|
36
|
||
|
7.
|
37
|
||
|
7A.
|
62
|
||
|
8.
|
62
|
||
|
9.
|
63
|
||
|
9A.
|
63
|
||
|
9B.
|
65
|
||
|
Part III
|
|||
|
10.
|
65
|
||
|
11.
|
65
|
||
|
12.
|
65
|
||
|
13.
|
65
|
||
|
14.
|
65
|
||
|
Part IV
|
|||
|
15.
|
66
|
||
|
Signatures
|
67
|
||
PART I
Unless the context suggests otherwise, references to “we,” “us,” “our” or the “Company” refer to Kite Realty Group Trust and our business and operations conducted through our directly or indirectly owned subsidiaries, including Kite Realty Group, L.P., our operating partnership (the “Operating Partnership”). References to “Kite Property Group” or the “Predecessor” mean our predecessor businesses.
Overview
Kite Realty Group Trust is a full-service, vertically integrated real estate company engaged in the ownership, operation, management, leasing, acquisition, construction management, redevelopment and development of neighborhood and community shopping centers and certain commercial real estate properties in selected markets in the United States. We also provide real estate facility management, construction management, development and other advisory services to third parties.
We conduct all of our business through our Operating Partnership, of which we are the sole general partner. As of December 31, 2010, we held an approximate 89% interest and limited partners owned the remaining 11% of the interests in our Operating Partnership.
As of December 31, 2010, we owned interests in a portfolio of 53 retail operating properties totaling approximately 8.0 million square feet of gross leasable area (including approximately 2.9 million square feet of non-owned anchor space) located in 9 states. Our retail operating portfolio was 92.2% leased to a diversified retail tenant base, with no single retail tenant accounting for more than 3.2% of our total annualized base rent. In the aggregate, our largest 25 tenants accounted for 39.4% of our annualized base rent. See Item 2, “Properties” for a list of our top 25 tenants by annualized base rent.
We also own interests in four commercial (office/industrial) operating properties totaling approximately 0.6 million square feet of net rentable area, all located in the state of Indiana. The occupancy of our commercial operating portfolio was 94.8% as of December 31, 2010.
As of December 31, 2010, we also had an interest in six retail properties in our in-process development and redevelopment pipelines. Upon completion, our in-process development and redevelopment properties are anticipated to have approximately 0.9 million square feet of gross leasable area (including approximately 0.2 million square feet of non-owned anchor space). In addition to our current in-process development and redevelopment pipelines, we have a future development pipeline which includes land parcels that are undergoing pre-development activities and are in various stages of preparation for construction to commence, including pre-leasing activity and negotiations for third-party financings. This pipeline consisted of five projects that are expected to contain 2.5 million square feet of total gross leasable area (including non-owned anchor space) upon completion.
In addition, as of December 31, 2010, we owned interests in various land parcels totaling 93 acres. These parcels are classified as “Land held for development” in the accompanying consolidated balance sheets and are expected to be used for future expansion of existing properties, development of new retail or commercial properties or sold to third parties.
Difficult economic conditions during the last three years have had a negative impact on consumer confidence and spending which caused segments of the retail industry to be negatively impacted as retailers struggled to sell goods and services. As an owner and developer of community and neighborhood shopping centers, our performance is directly linked to economic conditions in the retail industry in those markets where our operating centers and development properties are located. While we are still experiencing a challenging operating environment, we began to see evidence of a modest recovery in 2010. The retail environment has shown improvement and retailers are becoming more optimistic with their expansion plans and capital allocation decisions. See Item 7, “Management’s Discussion and Analysis of Financial Condition and Results of Operations,” for further discussion of the current economic conditions and their impact on us.
2
Significant 2010 Activities
Financing and Capital Raising Activities. As discussed in more detail below in “Business Objectives and Strategies,” our primary business objectives are to generate increasing cash flow, achieve long-term growth and maximize shareholder value primarily through the operation, acquisition, development and redevelopment of well-located community and neighborhood shopping centers. However, as discussed in Item 7, “Management’s Discussion and Analysis of Financial Condition and Results of Operations,” current economic and financial market conditions have created a need for most REITs, including us, to place a significant amount of emphasis on our financing and capital preservation strategy. Therefore, our current primary objective is the cost effective and opportunistic strengthening of our balance sheet to allow access to various sources of capital to fund our future commitments. We endeavor to continue improving our key financial ratios including our debt to EBITDA ratio. We ended the year 2010 with $62 million of combined cash and borrowing capacity on our unsecured revolving credit facility. We will remain focused on 2011 refinancing activity and will continue to aggressively manage our operating portfolio.
During 2010, we successfully completed various financing, refinancing and capital-raising activities. As a result of these actions, we reduced our total borrowings to $611 million at December 31, 2010 from $658 million at December 31, 2009. The significant financing, refinancing and capital raising activities completed during 2010 included the following:
Preferred Equity Offering
|
·
|
In December 2010, we completed an offering of 2,800,000 shares of Series A Cumulative Redeemable Perpetual Preferred Shares at an offering price of $25.00 per share for net proceeds of $67.5 million. A portion of the net proceeds were used to retire our $55 million unsecured term loan. The remaining net proceeds, along with borrowings on our revolving line of credit, were used to retire the $18.3 million loan encumbering our International Speedway Square property in Daytona, Florida.
|
Refinancings & Maturity Date Extensions in 2010
|
·
|
During the third quarter, we exercised the one-year extension option on our unsecured revolving credit facility and extended the maturity date for the facility to February 2012;
|
|
·
|
We extended the maturity date on the variable rate construction loan on our South Elgin Commons development property in a suburb of Chicago, Illinois to September 2013 at an interest rate of LIBOR + 325 basis points;
|
|
·
|
We extended the maturity date on the variable rate construction loan on our Cobblestone Plaza development property in Fort Lauderdale, Florida to February 2013 at an interest rate of LIBOR + 350 basis points; and
|
|
·
|
We converted the $14.3 million variable rate loan on our Rivers Edge redevelopment property in Indianapolis, Indiana to a construction loan at an interest rate of LIBOR + 325 basis points, and extended the maturity date to January 2016;
|
Refinancings & Maturity Date Extensions in 2011
|
·
|
In January 2011, we extended the maturity date of the $3.5 million variable rate loan on the Indiana State Motor pool commercial property (originally due February 2011) to February 2014 at an interest rate of LIBOR + 325 basis points.
|
|
·
|
In February 2011, we extended the maturity date of the $33.9 million variable rate construction loan on the unconsolidated Parkside Town Commons property (originally due February 2011) to August 2013 at an interest rate of LIBOR + 300 basis points and funded $5.5 million, which was our share of the paydown, with cash. We currently own a 40% interest in this property which declines to 20% upon the commencement of project construction.
|
Construction Financing
|
·
|
Draws totaling $6.1 million were made on the variable rate construction loan at the Eddy Street Commons development project; and
|
|
·
|
We used proceeds from our unsecured revolving credit facility, other borrowings and cash totaling $36.6 million for other development and redevelopment activities.
|
3
Repayments of Outstanding Indebtedness
|
·
|
We used a portion of the proceeds from our December 2010 preferred share offering to retire our $55 million unsecured term loan, which was due in July 2011;
|
|
·
|
We repaid the $18.3 million fixed rate loan on our International Speedway Square operating property in Daytona, Florida and temporarily contributed the related asset to the unsecured revolving credit facility collateral pool. We intend to secure long term financing for this asset in the first half of 2011; and
|
|
·
|
In connection with the 2010 extensions of the maturity dates of various permanent and construction loans, we paid down the balances of these loans by $19.8 million.
|
2010 Development and Redevelopment Activities
|
·
|
In the fourth quarter of 2010, we completed the redevelopment of our Coral Springs Plaza, and transitioned the former Circuit City-anchored center to the operating portfolio. The property is 100% leased to Toys “R” Us/Babies “R” Us and located in a suburb of Boca Raton, Florida;
|
|
·
|
We substantially completed the construction of the retail and office components of Eddy Street Commons, Phase I, a 465,000 square foot multi-use center located in South Bend, Indiana that includes a 300,000 square foot non-owned multi-family component. This project was 89% leased as of December 31, 2010 and is anchored by Follett Bookstore, Urban Outfitters and the University of Notre Dame;
|
|
·
|
We partially completed the construction of Cobblestone Plaza, a 138,000 square foot neighborhood shopping center located in Ft. Lauderdale, Florida. We commenced construction of a Whole Foods store during the fourth quarter and anticipate delivery to the tenant in the second quarter of 2011. This property was 84.4% leased or committed as of December 31, 2010; and
|
|
·
|
In the fourth quarter of 2010, we commenced construction at South Elgin Commons, Phase II, a 135,500 square foot center located in a suburb of Chicago, Illinois. This project was 100.0% leased and is anchored by Toys “R” Us/Babies “R” Us and Ross Stores and “shadow” anchored by Super Target.
|
As of December 31, 2010, we had four retail properties undergoing various stages of redevelopment:
|
·
|
Bolton Plaza, Jacksonville, Florida. This 173,000 square foot neighborhood shopping center was previously anchored by Wal-Mart. We executed a 66,500 square foot lease with Academy Sports & Outdoors to anchor this center and this tenant opened during the second half of 2010. We currently estimate the cost of this redevelopment to be $5.7 million;
|
|
·
|
Courthouse Shadows, Naples, Florida. We intend to modify the existing facade and pylon signage of this 135,000 square foot neighborhood shopping center and upgrade its landscaping and lighting. In 2009, Publix purchased the lease of the former anchor tenant and made certain improvements to the space. We currently anticipate our total investment in the redevelopment at Courthouse Shadows will be $2.5 million;
|
|
·
|
Four Corner Square, Seattle, Washington. In addition to the existing 29,000 square foot neighborhood shopping center, we also own an adjacent ten acres of land in our future development pipeline that may be used as part of the redevelopment. We currently estimate the cost of this redevelopment to be $0.5 million; and
|
|
·
|
Rivers Edge, Indianapolis, Indiana. We have secured Nordstrom Rack, the Container Store, Arhaus Furniture, Buy Buy Baby and BGI Fitness as new anchors for this neighborhood shopping center and have expanded it from 111,000 square feet to 152,000 square feet. The renovations to accommodate these new tenants began in the third quarter of 2010 with expected delivery occurring in the first half of 2011. We currently estimate the cost of this redevelopment to be $21.5 million.
|
2010 Cash Distributions
In 2010, we declared quarterly per common share cash distributions of $0.06 per common share with respect to each of the quarters.
2011 Acquisitions
|
·
|
In February 2011, we acquired a 52,000 square foot, 91.4% leased retail shopping center in Wilmington, North Carolina. This center was acquired in an off-market transaction for a purchase price of $3.5 million. This center is anchored by a 46,000 square foot Lowe’s Foods.
|
|
●
|
In February 2011, we completed the acquisition of the remaining 40% interest in The Centre from our joint venture partners and assumed leasing and management responsibilities. The Centre is an 81,000 square foot shopping center located in Carmel, Indiana, a suburb of Indianapolis. The purchase price was approximately $2.3 million, including the repayment of a $700,000 loan made by the Company.
|
4
Business Objectives and Strategies
Our primary business objectives are to increase the cash flow and consequently the value of our properties, achieve sustainable long-term growth and maximize shareholder value primarily through the operation, development, redevelopment and select acquisition of well-located community and neighborhood shopping centers. We invest in properties where cost effective renovation and expansion programs, combined with effective leasing and management strategies, can combine to improve the long-term values and economic returns of our properties. The Company believes that certain of its properties represent opportunities for future renovation and expansion.
We seek to implement our business objectives through the following strategies, each of which is more completely described in the sections that follow:
|
·
|
Operating Strategy: Maximizing the internal growth in revenue from our operating properties by leasing and re-leasing those properties to a diverse group of retail tenants at increasing rental rates, when possible, and redeveloping certain properties to make them more attractive to existing and prospective tenants and consumers or to permit additional or more productive uses of the properties;
|
|
·
|
Growth Strategy: Using debt and equity capital prudently to redevelop or renovate our existing properties, selectively acquire additional retail properties and develop shopping centers on land parcels that we currently own where we believe that investment returns would meet or exceed internal benchmarks; and
|
|
·
|
Financing and Capital Preservation Strategy: Maintain a strong balance sheet with sufficient flexibility to fund our operating and investment activities in a cost-effective manner including borrowings under our existing revolving credit facility, new secured debt, accessing the public securities markets when conditions are acceptable to us, internally generated funds and proceeds from selling land and properties that no longer fit our strategy, and investment in strategic joint ventures. We continue to monitor the capital markets and may consider raising additional capital through the issuance of our common shares, preferred shares or other securities.
|
Operating Strategy. Our primary operating strategy is to maximize revenue and maintain or increase occupancy levels by attracting and retaining a strong and diverse tenant base. Most of our properties are in regional and neighborhood trade areas with attractive demographics, which has allowed us to maintain and, in some cases, increase occupancy and rental rates. We seek to implement our operating strategy by, among other things:
|
·
|
increasing rental rates upon the renewal of expiring leases or re-leasing space to new tenants while minimizing vacancy to the extent possible;
|
|
·
|
maximizing the occupancy of our existing operating portfolio;
|
|
·
|
maximizing tenant absorption and minimizing tenant turnover;
|
|
·
|
maintaining efficient leasing and property management strategies to emphasize and maximize rent growth and cost-effective facilities;
|
|
·
|
maintaining a diverse tenant mix in an effort to limit our exposure to the financial condition of any one tenant or any category of tenants;
|
|
·
|
monitoring the physical appearance, condition, and design of our properties and other improvements located on our properties to maximize our ability to attract customers;
|
|
·
|
actively managing costs to minimize overhead and operating costs;
|
|
·
|
maintaining strong tenant and retailer relationships in order to avoid rent interruptions and reduce marketing, leasing and tenant improvement costs that result from re-tenanting space; and
|
|
·
|
taking advantage of under-utilized land or existing square footage, reconfiguring properties for better use, or adding ancillary income areas to existing facilities.
|
5
We employed our operating strategy in 2010 in a number of ways, including increasing our total leased percentage from 90.7% at December 31, 2009 to 92.5% at December 31, 2010, through the signing of over 1.1 million square feet of new and renewal leases in 2010. We have also been successful in maintaining a diverse retail tenant mix with no tenant accounting for more than 3.2% of our annualized base rent. See Item 2, “Properties” for a list of our top tenants by gross leasable area and annualized base rent.
Growth Strategy. While we are focused on conserving capital in the current difficult economic environment, our growth strategy includes the selective deployment of resources to projects that are expected to generate investment returns that meet or exceed our internal benchmarks. We intend to implement our growth strategy in a number of ways, including:
|
·
|
continually evaluating our operating properties for redevelopment and renovation opportunities that we believe will make them more attractive for leasing to new tenants or re-leasing to existing tenants at increased rental rates;
|
|
·
|
capitalizing on future development opportunities on currently owned land parcels through the achievement of anchor and small shop pre-leasing targets and obtaining financing prior to commencing construction;
|
|
·
|
disposing of selected assets that no longer meet our long-term investment criteria and recycling the resulting capital into assets that provide maximum returns and upside potential in desirable markets; and
|
|
·
|
selectively pursuing the acquisition of retail operating properties and portfolios in markets with attractive demographics which we believe can support retail development and therefore attract strong retail tenants.
|
In evaluating opportunities for potential acquisition, development, redevelopment and disposition, we consider a number of factors, including:
|
·
|
the expected returns and related risks associated with investments in these potential opportunities relative to our combined cost of capital to make such investments;
|
|
·
|
the current and projected cash flow and market value of the property, and the potential to increase cash flow and market value if the property were to be successfully re-leased or redeveloped;
|
|
·
|
the price being offered for the property, the current and projected operating performance of the property, the tax consequences of the sale and other related factors;
|
|
·
|
the current tenant mix at the property and the potential future tenant mix that the demographics of the property could support, including the presence of one or more additional anchors (for example, value retailers, grocers, soft goods stores, office supply stores, or sporting goods retailers), as well as an overall diverse tenant mix that includes restaurants, shoe and clothing retailers, specialty shops and service retailers such as banks, dry cleaners and hair salons, some of which provide staple goods to the community and offer a high level of convenience;
|
|
·
|
the configuration of the property, including ease of access, abundance of parking, maximum visibility, and the demographics of the surrounding area; and
|
|
·
|
the level of success of existing properties in the same or nearby markets.
|
In 2010, we were successful in executing new leases for anchor tenants at three properties in our development and redevelopment portfolio. We signed leases totaling 118,000 square feet with Nordstrom Rack, Buy Buy Baby, the Container Store, Arhaus Furniture and BGI Fitness to anchor our Rivers Edge redevelopment in Indianapolis, Indiana. We also signed a 58,000 square foot lease with Toys “R” Us/Babies “R” Us at our South Elgin Commons property in a suburb of Chicago, Illinois and an anchor lease with Urban Outfitters at our Eddy Street Commons property in South Bend, Indiana. We expect these tenants to open for business during the latter half of 2011.
Financing and Capital Preservation Strategy. We finance our development, redevelopment and acquisition activities seeking to use the most advantageous sources of capital available to us at the time. These sources may include the sale of common or preferred shares through public offerings or private placements, the incurrence of additional indebtedness through secured or unsecured borrowings, investment in real estate joint ventures and the reinvestment of proceeds from the disposition of assets.
Our primary financing and capital preservation strategy is to maintain a strong balance sheet with sufficient flexibility to fund our operating and development activities in the most cost-effective way possible. We consider a number of factors when evaluating our level of indebtedness and when making decisions regarding additional borrowings, including the purchase price of properties to be developed or acquired with debt financing, the estimated market value of our properties and the Company as a whole upon consummation of the refinancing, and the ability of particular properties to generate cash flow to cover expected debt service. As discussed in more detail in Item 7, “Management’s Discussion and Analysis of Financial Condition and Results of Operations,” the recent market conditions have heightened the need for most REITs, including us, to continue to place a significant emphasis on financing and capital preservation strategies. Our efforts to strengthen our balance sheet are essential to the success of our business. We intend to continue implementing our financing and capital strategies in a number of ways, including:
6
|
·
|
prudently managing our balance sheet, including reducing the aggregate amount of indebtedness outstanding under our unsecured revolving credit facility so that we have additional capacity available to fund our development and redevelopment projects and pay down maturing debt if refinancing that debt is not feasible;
|
|
·
|
seeking to replace our unsecured revolving credit facility, which had a balance of $122.3 million at December 31, 2010. The Company has entered into a non-binding term sheet for and amended and restated unsecured revolving credit facility with a three year term;
|
|
·
|
extending the maturity dates of and/or refinancing of our near-term mortgage, construction and other indebtedness. Through March 1, 2011, we refinanced $17 million of our 2011 maturities leaving $75 million to be addressed over the balance of the year. Based upon our experience with property level debt over the last couple of years, we expect to address all of these maturities;
|
|
·
|
entering into construction loans to fund our in-process developments, redevelopments, and future developments;
|
|
·
|
raising additional capital through the issuance of common shares, preferred shares or other securities. In December 2010 we issued 2.8 million shares of our Series A Cumulative Redeemable Perpetual Preferred Shares at an offering price of $25.00 per share for net proceeds of $67.5 million. A portion of the net proceeds from this offering were used to retire our $55 million unsecured term loan, which had a maturity date of July 2011. The remainder of the net proceeds, along with borrowings on our unsecured revolving line of credit were used to retire the $18.3 million loan encumbering our International Speedway Square property in Daytona, Florida;
|
|
·
|
managing our exposure to interest rate increases on our variable-rate debt through the use of fixed rate hedging transactions and securing long-term nonrecourse financing; and
|
|
·
|
investing in joint venture arrangements in order to access less expensive capital and to mitigate risk.
|
Business Segments
Our principal business is the ownership, operation, acquisition and development of high-quality neighborhood and community shopping centers in selected markets in the United States. We have aligned our operations into two business segments: (1) real estate operation and development, and (2) construction management and advisory services. See Note 13 to the accompanying consolidated financial statements for information on our two business segments and the reconciliation of total segment revenues to total revenues, total segment operating income to operating income, total segment net income to consolidated net income, and total segment assets to total assets for the years ended December 31, 2010, 2009 and 2008.
Competition
The United States commercial real estate market continues to be highly competitive. We face competition from institutional investors, other REITs, and owner-operators engaged in the development, acquisition, ownership and leasing of shopping centers as well as from numerous local, regional and national real estate developers and owners in each of our markets. Some of these competitors may have greater capital resources than we do, although we do not believe that any single competitor or group of competitors in any of the primary markets where our properties are located are dominant in that market.
We face significant competition in our efforts to lease available space to prospective tenants at our operating, development and redevelopment properties. The nature of the competition for tenants varies depending upon the characteristics of each local market in which we own and manage properties. We believe that the principal competitive factors in attracting tenants in our market areas are location, demographics, rental rates, the presence of anchor stores, competitor shopping centers in the same geographic area and the maintenance, appearance, access and traffic patterns of our properties. There can be no assurance in the future that we will be able to compete successfully with our competitors in our development, acquisition and leasing activities.
Government Regulation
We and our properties are subject to a variety of federal, state, and local environmental, health, safety and similar laws including:
Americans with Disabilities Act. Our properties must comply with Title III of the Americans with Disabilities Act, or ADA, to the extent that such properties are public accommodations as defined by the ADA. The ADA may require removal of structural barriers to access by persons with disabilities in certain public areas of our properties where such removal is readily achievable. We believe our properties are in substantial compliance with the ADA and that we will not be required to make substantial capital expenditures to address the requirements of the ADA. However, noncompliance with the ADA could result in the imposition of fines or an award of damages to private litigants. The obligation to make readily accessible accommodations is an ongoing one, and we will continue to assess our properties and make alterations as appropriate in this respect.
7
Environmental Regulations. Some properties in our portfolio contain, may have contained or are adjacent to or near other properties that have contained or currently contain underground storage tanks for petroleum products or other hazardous or toxic substances. These operations may have released, or have the potential to release, such substances into the environment.
In addition, some of our properties have tenants which may use hazardous or toxic substances in the routine course of their businesses. In general, these tenants have covenanted in their leases with us to use these substances, if any, in compliance with all environmental laws and have agreed to indemnify us for any damages we may suffer as a result of their use of such substances. However, these lease provisions may not fully protect us in the event that a tenant becomes insolvent. Finally, one of our properties has contained asbestos-containing building materials, or ACBM, and another property may have contained such materials based on the date of its construction. Environmental laws require that ACBM be properly managed and maintained, and fines and penalties may be imposed on building owners or operators for failure to comply with these requirements. The laws also may allow third parties to seek recovery from owners or operators for personal injury associated with exposure to asbestos fibers.
Neither existing environmental, health, safety and similar laws nor the costs of our compliance with these laws has had a material adverse effect on our financial condition or results operations, and management does not believe they will in the future. In addition, we have not incurred, and do not expect to incur, any material costs or liabilities due to environmental contamination at properties we currently own or have owned in the past. However, we cannot predict the impact of new or changed laws or regulations on properties we currently own or may acquire in the future.
Insurance
We carry comprehensive liability, fire, extended coverage, and rental loss insurance that covers all properties in our portfolio. We believe the policy specifications and insured limits are appropriate and adequate given the relative risk of loss, the cost of the coverage, and industry practice. We do not carry insurance for generally uninsurable losses such as loss from riots, war or acts of God, and, in some cases, flooding. Some of our policies, such as those covering losses due to terrorism and floods, are insured subject to limitations involving large deductibles or co-payments and policy limits that may not be sufficient to cover losses.
Offices
Our principal executive office is located at 30 S. Meridian Street, Suite 1100, Indianapolis, IN 46204. Our telephone number is (317) 577-5600.
Employees
As of December 31, 2010, we had 74 full-time employees. The majority of these employees were “home office” personnel.
Available Information
Our Internet website address is www.kiterealty.com. You can obtain on our website, free of charge, a copy of our Annual Report on Form 10-K, our quarterly reports on Form 10-Q, our current reports on Form 8-K, and any amendments to those reports, as soon as reasonably practicable after we electronically file such reports or amendments with, or furnish them to, the SEC. Our Internet website and the information contained therein or connected thereto are not intended to be incorporated into this Annual Report on Form 10-K.
Also available on our website, free of charge, are copies of our Code of Business Conduct and Ethics, our Code of Ethics for Principal Executive Officer and Senior Financial Officers, our Corporate Governance Guidelines, and the charters for each of the committees of our Board of Trustees—the Audit Committee, the Corporate Governance and Nominating Committee, and the Compensation Committee. Copies of our Code of Business Conduct and Ethics, our Code of Ethics for Principal Executive Officer and Senior Financial Officers, our Corporate Governance Guidelines, and our committee charters are also available from us in print and free of charge to any shareholder upon request. Any person wishing to obtain such copies in print should contact our Investor Relations department by mail at our principal executive office.
8
The following factors, among others, could cause actual results to differ materially from those contained in forward-looking statements made in this Annual Report on Form 10-K and presented elsewhere by our management from time to time. These factors, among others, may have a material adverse effect on our business, financial condition, operating results and cash flows, and you should carefully consider them. It is not possible to predict or identify all such factors. You should not consider this list to be a complete statement of all potential risks or uncertainties. Past performance should not be considered an indication of future performance.
We have separated the risks into three categories:
|
·
|
risks related to our operations;
|
|
·
|
risks related to our organization and structure; and
|
|
·
|
risks related to tax matters.
|
RISKS RELATED TO OUR OPERATIONS
Because of our geographical concentration in Indiana, Florida and Texas, a prolonged economic downturn in these states could materially and adversely affect our financial condition and results of operations.
The United States economy was in a recession during 2009 and for a portion of 2010. Similarly, the specific markets in which we operate continue to face very challenging economic conditions that will likely persist into the future. In particular, as of December 31, 2010, 41% of our owned square footage and 41% of our total annualized base rent is located in Indiana, 21% of our owned square footage and 21% of our total annualized base rent is located in Florida, and 19% of our owned square footage and 18% of our total annualized base rent is located in Texas. This level of concentration could expose us to greater economic risks than if we owned properties in numerous geographic regions. Many states continue to deal with state fiscal budget shortfalls, rising unemployment rates and home foreclosure rates. Continued adverse economic or real estate trends in Indiana, Florida, Texas, or the surrounding regions, or any continued decrease in demand for retail space resulting from the local regulatory environment, business climate or fiscal problems in these states, could materially and adversely affect our financial condition, results of operations, cash flow, the trading price of our common shares and our ability to satisfy our debt service obligations and to pay distributions to our shareholders.
Severe disruptions in the financial markets could affect our ability to obtain financing for development of our properties and other purposes on reasonable terms, or at all, and have other material adverse effects on our business.
Disruptions in the credit markets generally, or relating to the real estate industry specifically, may adversely affect our ability to obtain debt financing at favorable rates or at all. In 2008 and 2009, the United States financial and credit markets have experienced significant price volatility, dislocations and liquidity disruptions, which have caused market prices of many financial instruments to fluctuate substantially and the spreads on prospective debt financings to widen considerably. Those circumstances materially impacted liquidity in the financial markets, making terms for certain financings less attractive, and in some cases have resulted in the unavailability of financing. Although the credit markets have recovered from this severe dislocation, there are a number of continuing effects, including a weakening of many traditional sources of debt financing, a reduction in the overall amount of debt financing available, lower loan to value ratios, a tightening of lender underwriting standards and terms and higher interest rate spreads. As a result, we may be unable to refinance or extend our existing indebtedness or the terms of any refinancing may not be as favorable as the terms of our existing indebtedness. For example, as of February 15, 2011, we had approximately $78 million and $253 million of debt maturing in 2011 and 2012, respectively, including our $200 million unsecured revolving credit facility in February 2012. If we are not successful in refinancing our outstanding debt when it becomes due, we may be forced to dispose of properties on disadvantageous terms, which might adversely affect our ability to service other debt and to meet our other obligations.
If a dislocation similar to that which occurred in 2008 and 2009 occurs in the future, we may be forced to seek alternative sources of potentially less attractive financing, and may require us to adjust our business plan accordingly. In addition, we may be unable to obtain permanent financing on development projects we financed with construction loans or mezzanine debt. Our inability to obtain such permanent financing on favorable terms, if at all, could delay the completion of our development projects and/or cause us to incur additional capital costs in connection with completing such projects, either of which could have a material adverse effect on our business and our ability to execute our business strategy. These events also may make it more difficult or costly for us to raise capital through the issuance of our common stock or preferred stock. The disruptions in the financial markets have had and may continue to have a material adverse effect on the market value of our common shares and other adverse effects on our business.
If our tenants are unable to secure financing necessary to continue to operate their businesses and pay us rent, we could be materially and adversely affected.
Many of our tenants rely on external sources of financing to operate their businesses. As discussed above, there are a number of continuing effects of the severe disruptions experienced in the United States financial and credit markets in 2008 and 2009. If our tenants are unable to secure financing necessary to continue to operate their businesses, they may be unable to meet their rent obligations to us or enter into new leases with us or be forced to declare bankruptcy and reject our leases, which could materially and adversely affect us.
Ongoing challenging conditions in the United States and global economy, and the challenges facing our retail tenants and non-owned anchor tenants may have a material adverse affect on our financial condition and results of operations.
We are susceptible to adverse economic developments in the United States. The United States economy is still experiencing weakness from the severe recession that it recently experienced, which resulted in increased unemployment, the bankruptcy or weakened financial condition of a number of retailers, decreased consumer spending, low consumer confidence, a decline in residential and commercial property values and reduced demand and rental rates for retail space. Although the United States economy appears to have emerged from the recent recession, market conditions remain challenging as high levels of unemployment and low consumer confidence have persisted. There can be no assurance that the recovery will continue. General economic factors that are beyond our control, including, but not limited to, recessions, decreases in consumer confidence, reductions in consumer credit availability, increasing consumer debt levels, rising energy costs, tax rates, continued business layoffs, downsizing and industry slowdowns, and/or rising inflation, could have a negative impact on the business of our retail tenants. In turn, this could have a material adverse effect on our business because current or prospective tenants may, among other things (i) have difficulty paying us rent as they struggle to sell goods and services to consumers, (ii) be unwilling to enter into or renew leases with us on favorable terms or at all, (iii) seek to terminate their existing leases with us or seek downward rental adjustment to such leases, or (iv) be forced to curtail operations or declare bankruptcy. We are also
9
susceptible to other developments that, while not directly tied to the economy, could have a material adverse effect on our business. These developments include relocations of businesses, changing demographics, increased Internet shopping, infrastructure quality, federal, state, and local budgetary constraints and priorities, increases in real estate and other taxes, costs of complying with government regulations or increased regulation, decreasing valuations of real estate, and other factors.
Further, we continually monitor events and changes in circumstances that could indicate that the carrying value of our real estate assets may not be recoverable. The ongoing challenging market conditions could require us to recognize an impairment charge with respect to one or more of our properties.
Our business is significantly influenced by demand for retail space generally, and a decrease in such demand may have a greater adverse effect on our business than if we owned a more diversified real estate portfolio.
Because our portfolio of properties consists primarily of community and neighborhood shopping centers, a decrease in the demand for retail space, due to the economic factors discussed above or otherwise, may have a greater adverse effect on our business and financial condition than if we owned a more diversified real estate portfolio. The market for retail space has been, and could continue to be, adversely affected by weakness in the national, regional and local economies, the adverse financial condition of some large retailing companies, the ongoing consolidation in the retail sector, the excess amount of retail space in a number of markets, and increasing consumer purchases through catalogues or the Internet. To the extent that any of these conditions occur, they are likely to negatively affect market rents for retail space and could materially and adversely affect our financial condition, results of operations, cash flow, the trading price of our common shares and our ability to satisfy our debt service obligations and to pay distributions to our shareholders.
Failure by any major tenant with leases in multiple locations to make rental payments to us, because of a deterioration of its financial condition or otherwise, could have a material adverse effect on our results of operations.
We derive the majority of our revenue from tenants who lease space from us at our properties. Therefore, our ability to generate cash from operations is dependent on the rents that we are able to charge and collect from our tenants. Our leases generally do not contain provisions designed to ensure the creditworthiness of our tenants. At any time, our tenants may experience a downturn in their business that may significantly weaken their financial condition, particularly during periods of economic uncertainty such as what has recently occurred. As a result, our tenants may delay lease commencements, decline to extend or renew leases upon expiration, fail to make rental payments when due, close a number of stores or declare bankruptcy. Any of these actions could result in the termination of the tenant’s leases and the loss of rental income attributable to the terminated leases. In addition, lease terminations by a major tenant or non-owned anchor or a failure by that major tenant or non-owned anchor to occupy the premises could result in lease terminations or reductions in rent by other tenants in the same shopping centers because of contractual co-tenancy termination or rent reduction rights under the terms of some leases. In that event, we may be unable to re-lease the vacated space at attractive rents or at all. The occurrence of any of the situations described above, particularly if it involves a substantial tenant or a non-owned anchor with ground leases in multiple locations, could have a material adverse effect on our results of operations. As of December 31, 2010, the five largest tenants in our operating portfolio in terms of annualized base rent were Publix, PetSmart, Bed Bath & Beyond/Buy Buy Baby, Lowe’s Home Improvement, and Ross Stores, representing 3.2%, 2.8%, 2.4%, 2.4%, and 2.3%, respectively, of our total annualized base rent.
We face potential material adverse effects from tenant bankruptcies, and we may be unable to collect balances due from any tenant in bankruptcy or replace the tenant at current rates, or at all.
Bankruptcy filings by our retail tenants occur from time to time. Such bankruptcies may increase in times of economic uncertainty such as what has recently occurred. For example, A&P, which leases 59,000 square feet and accounts for 1.0% of our annualized base rent, filed for bankruptcy in December 2010. The number of bankruptcies among United States companies continue to be above historical levels. We cannot make any assurance that any tenant who files for bankruptcy protection will continue to pay us rent. A bankruptcy filing by or relating to one of our tenants or a lease guarantor would bar all efforts by us to collect pre-bankruptcy debts from that tenant or the lease guarantor, or their property, unless we receive an order permitting us to do so from the bankruptcy court. A tenant or lease guarantor bankruptcy could delay our efforts to collect past due balances under the relevant leases, and could ultimately preclude collection of these sums. If a lease is assumed by the tenant in bankruptcy, all pre-bankruptcy balances due under the lease must be paid to us in full. However, if a lease is rejected by a tenant in bankruptcy, we would have only a general unsecured claim for damages. Any unsecured claim we hold may be paid only to the extent that funds are available and only in the same percentage as is paid to all other holders of unsecured claims, and there are restrictions under bankruptcy laws that limit the amount of the claim we can make if a lease is rejected. As a result, it is likely that we will recover substantially less than the full value of any unsecured claims we hold from a tenant in bankruptcy, which would result in a reduction in our cash flow and in the amount of cash available for distribution to our shareholders.
Moreover, we are continually re-leasing vacant spaces resulting from tenant lease terminations. The bankruptcy of a tenant, particularly an anchor tenant such as A&P, may make it more difficult to lease the remainder of the affected properties. Future tenant bankruptcies could materially adversely affect our properties or impact our ability to successfully execute our re-leasing strategy.
We had $611 million of consolidated indebtedness outstanding as of December 31, 2010, which may have a material adverse effect on our financial condition and results of operations and reduce our ability to incur additional indebtedness to fund our growth.
Required repayments of debt and related interest may materially adversely affect our operating performance. We had $611 million of consolidated outstanding indebtedness as of December 31, 2010, of which $78 million is scheduled to mature in 2011 along with our share of mortgage debt of unconsolidated joint ventures of $14 million, and $253 million is scheduled to mature in 2012. At December 31, 2010, $333 million of our debt bore interest at variable rates ($114 million when reduced by our $219 million of interest rate swaps for fixed interest rates) along with our share of mortgage debt of unconsolidated joint ventures of $18 million. Interest rates are currently low relative to historical levels and may increase significantly in the future. If our interest expense increased significantly, it could materially adversely affect our results of operations. For example, if market rates of interest on our variable rate debt outstanding, net of cash flow hedges, as of December 31, 2010 increased by 1%, the increase in interest expense on our variable rate debt would decrease future cash flows by $1.3 million annually.
We also intend to incur additional debt in connection with various development and redevelopment projects, and may incur additional debt with acquisitions of properties. Our organizational documents do not limit the amount of indebtedness that we may incur. We may borrow new funds to develop or acquire properties. In addition, we may incur or increase our mortgage debt by obtaining loans secured by some or all of the real estate properties we develop or acquire. We also may borrow funds if necessary to satisfy the requirement that we distribute to shareholders at least 90% of our annual REIT taxable income, or otherwise as is necessary or advisable to ensure that we maintain our qualification as a REIT for federal income tax purposes or otherwise avoid paying taxes that can be eliminated through distributions to our shareholders.
10
Our substantial debt could materially and adversely affect our business in other ways, including by, among other things:
|
·
|
requiring us to use a substantial portion of our funds from operations to pay principal and interest, which reduces the amount available for distributions;
|
|
·
|
placing us at a competitive disadvantage compared to our competitors that have less debt;
|
|
·
|
making us more vulnerable to economic and industry downturns and reducing our flexibility in responding to changing business and economic conditions; and
|
|
·
|
limiting our ability to borrow more money for operating or capital needs or to finance development and acquisitions in the future.
|
Our unsecured revolving credit facility and various other debt agreements contain certain Events of Default which include, but are not limited to, failure to make principal or interest payments when due, failure to perform or observe any term, covenant or condition contained in the agreements, failure to maintain certain financial and operating ratios and other criteria, misrepresentations and bankruptcy proceedings. In the event of a default under any of these agreements, the lender would have various rights including, but not limited to, the ability to require the acceleration of the payment of all principal and interest due and/or to terminate the agreements, and to foreclose on the properties. The declaration of a default and/or the acceleration of the amount due under any such credit agreement could have a material adverse effect on our business. In addition, certain of our permanent and construction loans contain cross-default provisions which provide that a violation by the Company of any financial covenant set forth in our unsecured revolving credit facility agreement will constitute an event of default under the loans, which could allow the lending institutions to accelerate the amount due under the loans.
Mortgage debt obligations expose us to the possibility of foreclosure, which could result in the loss of our investment in a property or group of properties subject to mortgage debt.
A significant amount of our indebtedness is secured by our real estate assets. If a property or group of properties is mortgaged to secure payment of debt and we are unable to meet mortgage payments, the holder of the mortgage or lender could foreclose on the property, resulting in the loss of our investment. For tax purposes, a foreclosure of any of our properties would be treated as a sale of the property for a purchase price equal to the outstanding balance of the debt secured by the mortgage. If the outstanding balance of the debt secured by the mortgage exceeds our tax basis in the property, we would recognize taxable income on foreclosure, but we would not receive any cash proceeds, which could hinder our ability to meet the REIT distribution requirements imposed by the Internal Revenue Code. If any of our properties are foreclosed on due to a default, our ability to pay cash distributions to our shareholders will be limited.
We are subject to risks associated with hedging agreements.
We use a combination of interest rate protection agreements, including interest rate swaps, to manage risk associated with interest rate volatility. This may expose us to additional risks, including a risk that counterparty to a hedging arrangement may fail to honor its obligations. Developing an effective interest rate risk strategy is complex and no strategy can completely insulate us from risks associated with interest rate fluctuations. There can be no assurance that our hedging activities will have the desired beneficial impact on our results of operations or financial condition. Further, should we choose to terminate a hedging agreement, there could be significant costs and cash requirements involved to fulfill our initial obligation under the hedging agreement.
A substantial number of common shares eligible for future sale could cause our common share price to decline significantly.
If our shareholders sell, or the market perceives that our shareholders intend to sell, substantial amounts of our common shares in the public market, the market price of our common shares could decline significantly. These sales also might make it more difficult for us to sell equity or equity-related securities in the future at a time and price that we deem appropriate. As of December 31, 2010, we had outstanding 63,342,219 common shares. Of these shares, 63,165,142 are freely tradable, and the remainder of which are mostly held by our “affiliates,” as that term is defined by Rule 144 under the Securities Act. In addition, 7,858,498 units of our Operating Partnership are owned by certain of our executive officers and other individuals, and are redeemable by the holder for cash or, at our election, common shares. Pursuant to registration rights of certain of our executive officers and other individuals, we filed a registration statement with the SEC in August 2005 to register 9,115,149 common shares issued (or issuable upon redemption of units in our Operating Partnership) in our formation transactions. As units are redeemed for common shares, the market price of our common shares could drop significantly if the holders of such shares sell them or are perceived by the market as intending to sell them.
Our performance and value are subject to risks associated with real estate assets and with the real estate industry.
Our ability to make expected distributions to our shareholders depends on our ability to generate substantial revenues from our properties. Periods of economic slowdown or recession, rising interest rates or declining demand for real estate, or the public perception that any of these events may occur, could result in a general decline in rents or an increased incidence of defaults under existing leases. Such events would materially and adversely affect our financial condition, results of operations, cash flow, per share trading price of our common shares and ability to satisfy our debt service obligations and to make distributions to our shareholders.
In addition, other events and conditions generally applicable to owners and operators of real property that are beyond our control may decrease cash available for distribution and the value of our properties. These events include but are not limited to:
|
·
|
adverse changes in the national, regional and local economic climate, particularly in: Indiana, where 41% of our owned square footage and 41% of our total annualized base rent is located; Florida, where 21% of our owned square footage and 21% of our total annualized base rent is located; and Texas, where 19% of our owned square footage and 18% of our total annualized base rent is located;
|
|
·
|
tenant bankruptcies;
|
|
·
|
local oversupply of rental space, increased competition or reduction in demand for rentable space;
|
|
·
|
inability to collect rent from tenants, or having to provide significant rent concessions to tenants;
|
11
|
·
|
vacancies or our inability to rent space on favorable terms;
|
|
·
|
changes in market rental rates;
|
|
·
|
inability to finance property development, tenant improvements and acquisitions on favorable terms;
|
|
·
|
increased operating costs, including costs incurred for maintenance, insurance premiums, utilities and real estate taxes;
|
|
·
|
the need to periodically fund the costs to repair, renovate and re-lease space;
|
|
·
|
decreased attractiveness of our properties to tenants;
|
|
·
|
weather conditions that may increase or decrease energy costs and other weather-related expenses (such as snow removal costs);
|
|
·
|
costs of complying with changes in governmental regulations, including those governing usage, zoning, the environment and taxes;
|
|
·
|
civil unrest, acts of terrorism, earthquakes, hurricanes and other national disasters or acts of God that may result in underinsured or uninsured losses;
|
|
·
|
the relative illiquidity of real estate investments;
|
|
·
|
changing demographics; and
|
|
·
|
changing traffic patterns.
|
Our financial covenants may restrict our operating and acquisition activities.
Our unsecured revolving credit facility contains certain financial and operating covenants, including, among other things, certain coverage ratios, as well as limitations on our ability to incur debt, make dividend payments, sell all or substantially all of our assets and engage in mergers and consolidations and certain acquisitions. These covenants may restrict our ability to pursue certain business initiatives or certain acquisition transactions. In addition, certain of our mortgages contain customary covenants which, among other things, limit our ability, without the prior consent of the lender, to further mortgage the property, to enter into new leases or materially modify existing leases, and to discontinue insurance coverage. Failure to meet any of the financial covenants could cause an event of default under and/or accelerate some or all of our indebtedness, which could have a material adverse effect on us.
Our current and future joint venture investments could be adversely affected by our lack of sole decision-making authority, our reliance on joint venture partners’ financial condition, any disputes that may arise between us and our joint venture partners and our exposure to potential losses from the actions of our joint venture partners.
As of December 31, 2010, we owned nine of our operating properties through joint ventures. As of December 31, 2010, the nine properties represented 10.7% of our annualized base rent. In addition, one of the properties in our in-process development pipeline and two properties in our future development pipeline are currently owned through joint ventures, one of which is accounted for under the equity method as of December 31, 2010 as we do not exercise requisite control for consolidation treatment. We have also entered into an agreement with Prudential Real Estate Investors to pursue joint venture opportunities for the development and selected acquisition of community shopping centers in the United States. Our joint ventures involve risks not present with respect to our wholly owned properties, including the following:
|
·
|
we may share decision-making authority with our joint venture partners regarding major decisions affecting the ownership or operation of the joint venture and the joint venture property, such as the sale of the property or the making of additional capital contributions for the benefit of the property, which may prevent us from taking actions that are opposed by our joint venture partners;
|
|
·
|
prior consent of our joint venture partners may be required for a sale or transfer to a third party of our interests in the joint venture, which restricts our ability to dispose of our interest in the joint venture;
|
|
·
|
our joint venture partners might become bankrupt or fail to fund their share of required capital contributions, which may delay construction or development of a property or increase our financial commitment to the joint venture;
|
|
·
|
our joint venture partners may have business interests or goals with respect to the property that conflict with our business interests and goals, which could increase the likelihood of disputes regarding the ownership, management or disposition of the property;
|
|
·
|
disputes may develop with our joint venture partners over decisions affecting the property or the joint venture, which may result in litigation or arbitration that would increase our expenses and distract our officers and/or trustees from focusing their time and effort on our business, and possibly disrupt the day-to-day operations of the property such as by delaying the implementation of important decisions until the conflict or dispute is resolved; and
|
|
·
|
we may suffer losses as a result of the actions of our joint venture partners with respect to our joint venture investments and the activities of a joint venture could adversely affect our ability to qualify as a REIT, even though we may not control the joint venture.
|
In the future, we may seek to co-invest with third parties through joint ventures that may involve similar or additional risks.
12
We face significant competition, which may impede our ability to renew leases or re-lease space as leases expire or require us to undertake unbudgeted capital improvements.
We compete with numerous developers, owners and operators of retail shopping centers for tenants. These competitors include institutional investors, other REITs and other owner-operators of community and neighborhood shopping centers, some of which own or may in the future own properties similar to ours in the same markets in which our properties are located, but which have greater capital resources. As of December 31, 2010, leases were scheduled to expire on a total of 7.1% of the space at our properties in 2011. If our competitors offer space at rental rates below current market rates, or below the rental rates we currently charge our tenants, we may be unable to lease on satisfactory terms to potential tenants and we may be pressured to reduce our rental rates below those we currently charge in order to retain tenants when our leases with them expire. We also may be required to offer more substantial rent abatements, tenant improvements and early termination rights or accommodate requests for renovations, build-to-suit remodeling and other improvements than we have historically. As a result, our financial condition, results of operations, cash flow, trading price of our common shares and ability to satisfy our debt service obligations and to pay distributions to our shareholders may be materially adversely affected. In addition, increased competition for tenants may require us to make capital improvements to properties that we would not have otherwise planned to make. Any capital improvements we undertake may reduce cash available for distributions to shareholders.
Our future developments and acquisitions may not yield the returns we expect or may result in dilution in shareholder value.
We have two properties in our in-process development pipeline and five properties in our future development pipeline. New development projects and property acquisitions are subject to a number of risks, including, but not limited to:
|
·
|
abandonment of development activities after expending resources to determine feasibility;
|
|
·
|
construction delays or cost overruns that may increase project costs;
|
|
·
|
our investigation of a property or building prior to our acquisition, and any representations we may receive from the seller, may fail to reveal various liabilities or defects or identify necessary repairs until after the property is acquired, which could reduce the cash flow from the property or increase our acquisition costs;
|
|
·
|
as a result of competition for attractive development and acquisition opportunities, we may be unable to acquire assets as we desire or the purchase price may be significantly elevated, which may impede our growth;
|
|
·
|
financing risks;
|
|
·
|
the failure to meet anticipated occupancy or rent levels;
|
|
·
|
failure to receive required zoning, occupancy, land use and other governmental permits and authorizations and changes in applicable zoning and land use laws; and
|
|
·
|
the consent of third parties such as tenants, mortgage lenders and joint venture partners may be required, and those consents may be difficult to obtain or be withheld.
|
In addition, if a project is delayed or if we are unable to lease designated space to anchor tenants, certain tenants may have the right to terminate their leases. If any of these situations occur, development costs for a project will increase, which will result in reduced returns, or even losses, from such investments. In deciding whether to acquire or develop a particular property, we make certain assumptions regarding the expected future performance of that property. If these new properties do not perform as expected, our financial performance may be materially and adversely affected. In addition, the issuance of equity securities as consideration for any acquisitions could be substantially dilutive to our shareholders.
We may not be successful in identifying suitable acquisitions or development and redevelopment projects that meet our investment criteria, which may impede our growth.
Part of our business strategy is expansion through acquisitions and development and redevelopment projects, which requires us to identify suitable development or acquisition candidates or investment opportunities that meet our criteria and are compatible with our growth strategy. We may not be successful in identifying suitable real estate properties or other assets that meet our development or acquisition criteria, or we may fail to complete developments, acquisitions or investments on satisfactory terms. Failure to identify or complete developments or acquisitions could slow our growth, which could in turn materially adversely affect our operations.
Redevelopment activities may be delayed or otherwise may not perform as expected and, in the case of an unsuccessful redevelopment project, our entire investment could be at risk for loss.
We currently have four properties in our redevelopment pipeline. We expect to redevelop certain of our other properties in the future. In connection with any redevelopment of our properties, we will bear certain risks, including the risk of construction delays or cost overruns that may increase project costs and make a project uneconomical, the risk that occupancy or rental rates at a completed project will not be sufficient to enable us to pay operating expenses or earn the targeted rate of return on investment, and the risk of incurrence of predevelopment costs in connection with projects that are not pursued to completion. In addition, various tenants may have the right to withdraw from a property if a development and/or redevelopment project is not completed on time. In the case of a redevelopment project, consents may be required from various tenants in order to redevelop a center. In the case of an unsuccessful redevelopment project, our entire investment could be at risk for loss.
13
We may not be able to sell properties when appropriate and could, under certain circumstances, be required to pay certain tax indemnities related to the properties we sell.
Real estate property investments generally cannot be sold quickly. Our ability to dispose of properties on advantageous terms depends on factors beyond our control, including competition from other sellers and the availability of attractive financing for potential buyers of our properties, and we cannot predict the various market conditions affecting real estate investments that will exist at any particular time in the future. In addition, in connection with our formation at the time of our initial public offering (“IPO”), we entered into an agreement that restricts our ability, prior to December 31, 2016, to dispose of six of our properties in taxable transactions and limits the amount of gain we can trigger with respect to certain other properties without incurring reimbursement obligations owed to certain limited partners of our Operating Partnership. We have agreed that if we dispose of any interest in six specified properties in a taxable transaction before December 31, 2016, we will indemnify the contributors of those properties for their tax liabilities attributable to the built-in gain that exists with respect to such property interest as of the time of our IPO (and tax liabilities incurred as a result of the reimbursement payment). The six properties to which our tax indemnity obligations relate represented 17.6% of our annualized base rent in the aggregate as of December 31, 2010. These six properties are International Speedway Square, Shops at Eagle Creek, Whitehall Pike, Ridge Plaza Shopping Center, Thirty South and Market Street Village. We also agreed to limit the aggregate gain certain limited partners of our Operating Partnership would recognize, with respect to certain other contributed properties through December 31, 2016, to not more than $48 million in total, with certain annual limits, unless we reimburse them for the taxes attributable to the excess gain (and any taxes imposed on the reimbursement payments), and take certain other steps to help them avoid incurring taxes that were deferred in connection with the formation transactions.
The agreement described above is extremely complicated and imposes a number of procedural requirements on us, which makes it more difficult for us to ensure that we comply with all of the various terms of the agreement and therefore creates a greater risk that we may be required to make an indemnity payment. The complicated nature of this agreement also might adversely impact our ability to pursue other transactions, including certain kinds of strategic transactions and reorganizations.
Also, the tax laws applicable to REITs require that we hold our properties for investment, rather than primarily for sale in the ordinary course of business, which may cause us to forego or defer sales of properties that otherwise would be in our best interest. Therefore, we may be unable to adjust our portfolio mix promptly in response to market conditions, which may adversely affect our financial position. In addition, we will be subject to income taxes on gains from the sale of any properties owned by any taxable REIT subsidiary.
Potential losses may not be covered by insurance.
We do not carry insurance for generally uninsurable losses such as loss from riots, war or acts of God, and, in some cases, flooding. Some of our policies, such as those covering losses due to terrorism and floods, are insured subject to limitations involving large deductibles or co-payments and policy limits that may not be sufficient to cover all losses. If we experience a loss that is uninsured or that exceeds policy limits, we could lose the capital invested in the damaged properties as well as the anticipated future cash flows from those properties. Inflation, changes in building codes and ordinances, environmental considerations, and other factors also might make it impractical or undesirable to use insurance proceeds to replace a property after it has been damaged or destroyed. In addition, if the damaged properties are subject to recourse indebtedness, we would continue to be liable for the indebtedness, even if these properties were irreparably damaged.
Insurance coverage on our properties may be expensive or difficult to obtain, exposing us to potential risk of loss.
In the future, we may be unable to renew or duplicate our current insurance coverage in adequate amounts or at reasonable prices. In addition, insurance companies may no longer offer coverage against certain types of losses, such as losses due to terrorist acts, environmental liabilities, or other catastrophic events including hurricanes and floods, or, if offered, the expense of obtaining these types of insurance may not be justified. We therefore may cease to have insurance coverage against certain types of losses and/or there may be decreases in the limits of insurance available. If an uninsured loss or a loss in excess of our insured limits occurs, we could lose all or a portion of the capital we have invested in a property, as well as the anticipated future revenue from the property, but still remain obligated for any mortgage debt or other financial obligations related to the property. We cannot guarantee that material losses in excess of insurance proceeds will not occur in the future. If any of our properties were to experience a catastrophic loss, it could seriously disrupt our operations, delay revenue and result in large expenses to repair or rebuild the property. Events such as these could adversely affect our results of operations and our ability to meet our obligations.
Rising operating expenses could reduce our cash flow and funds available for future distributions, particularly if such expenses are not offset by corresponding revenues.
Our existing properties and any properties we develop or acquire in the future are and will be subject to operating risks common to real estate in general, any or all of which may negatively affect us. The expenses of owning and operating properties generally do not decrease, and may increase, when circumstances such as market factors and competition cause a reduction in income from the properties. As a result, if any property is not fully occupied or if rents are being paid in an amount that is insufficient to cover operating expenses, we could be required to expend funds for that property’s operating expenses. Our properties continue to be subject to increases in real estate and other tax rates, utility costs, operating expenses, insurance costs, repairs and maintenance and administrative expenses, regardless of such properties’ occupancy rates. Therefore, rising operating expenses could reduce our cash flow and funds available for future distributions, particularly if such expenses are not offset by corresponding revenues.
14
We could incur significant costs related to government regulation and environmental matters.
Under various federal, state and local laws, ordinances and regulations, an owner or operator of real estate may be required to investigate and clean up hazardous or toxic substances or petroleum product releases at a property and may be held liable to a governmental entity or to third parties for property damage and for investigation and clean up costs incurred by such parties in connection with contamination. The cost of investigation, remediation or removal of such substances may be substantial, and the presence of such substances, or the failure to properly remediate such substances, may adversely affect the owner’s ability to sell or rent such property or to borrow using such property as collateral. In connection with the ownership, operation and management of real properties, we are potentially liable for removal or remediation costs, as well as certain other related costs, including governmental fines and injuries to persons and property. We may also be liable to third parties for damage and injuries resulting from environmental contamination emanating from the real estate. Environmental laws also may create liens on contaminated sites in favor of the government for damages and costs it incurs to address such contamination. Moreover, if contamination is discovered on our properties, environmental laws may impose restrictions on the manner in which that property may be used or how businesses may be operated on that property.
Some of the properties in our portfolio contain, may have contained or are adjacent to or near other properties that have contained or currently contain underground storage tanks for petroleum products or other hazardous or toxic substances. These operations may have released, or have the potential to release, such substances into the environment. In addition, some of our properties have tenants that may use hazardous or toxic substances in the routine course of their businesses. In general, these tenants have covenanted in their leases with us to use these substances, if any, in compliance with all environmental laws and have agreed to indemnify us for any damages that we may suffer as a result of their use of such substances. However, these lease provisions may not fully protect us in the event that a tenant becomes insolvent. Finally, one of our properties has contained asbestos-containing building materials, or ACBM, and another property may have contained such materials based on the date of its construction. Environmental laws require that ACBM be properly managed and maintained, and may impose fines and penalties on building owners or operators for failure to comply with these requirements. The laws also may allow third parties to seek recovery from owners or operators for personal injury associated with exposure to asbestos fibers.
Our properties must also comply with Title III of the Americans with Disabilities Act, or ADA, to the extent that such properties are public accommodations as defined by the ADA. The ADA may require removal of structural barriers to access by persons with disabilities in certain public areas of our properties where such removal is readily achievable. Noncompliance with the ADA could result in imposition of fines or an award of damages to private litigants and the incurrence of additional costs associated with bringing the properties into compliance, any of which could adversely affect our financial condition.
Our efforts to identify environmental liabilities may not be successful.
We test our properties for compliance with applicable environmental laws on a limited basis. We cannot give assurance that:
|
·
|
existing environmental studies with respect to our properties reveal all potential environmental liabilities;
|
|
·
|
any previous owner, occupant or tenant of one of our properties did not create any material environmental condition not known to us;
|
|
·
|
the current environmental condition of our properties will not be affected by tenants and occupants, by the condition of nearby properties, or by other unrelated third parties; or
|
|
·
|
future uses or conditions (including, without limitation, changes in applicable environmental laws and regulations or the interpretation thereof) will not result in environmental liabilities.
|
Inflation may adversely affect our financial condition and results of operations.
Most of our leases contain provisions requiring the tenant to pay its share of operating expenses, including common area maintenance, real estate taxes and insurance, to the extent we are able to recover such costs from our tenants. However, increased inflation could have a more pronounced negative impact on our mortgage and debt interest and general and administrative expenses, as these costs could increase at a rate higher than our rents. Also, inflation may adversely affect tenant leases with stated rent increases or limits on such tenant’s obligation to pay its share of operating expenses, which could be lower than the increase in inflation at any given time, and limit our ability to recover all of our operating expenses. Inflation could also have an adverse effect on consumer spending, which could impact our tenants’ sales and, in turn, our average rents, and in some cases, our percentage rents, where applicable. In addition, renewals of leases or future leases may not be negotiated on current terms, in which event we may have to pay a greater percentage or all of our operating expenses.
Our share price could be volatile and could decline, resulting in a substantial or complete loss on our shareholders’ investment.
The stock markets (including The New York Stock Exchange, or the “NYSE,” on which we list our common and preferred shares) have experienced significant price and volume fluctuations. The market price of our common shares could be similarly volatile, and investors in our common shares may experience a decrease in the value of their shares, including decreases unrelated to our operating performance or prospects. Among the market conditions that may affect the market price of our publicly traded securities are the following:
|
·
|
our financial condition and operating performance and the performance of other similar companies;
|
|
·
|
actual or anticipated differences in our quarterly operating results;
|
15
|
·
|
changes in our revenues or earnings estimates or recommendations by securities analysts;
|
|
·
|
publication by securities analysts of research reports about us or our industry;
|
|
·
|
additions and departures of key personnel;
|
|
·
|
strategic decisions by us or our competitors, such as acquisitions, divestments, spin-offs, joint ventures, strategic investments or changes in business strategy;
|
|
·
|
the reputation of REITs generally and the reputation of REITs with portfolios similar to ours;
|
|
·
|
the attractiveness of the securities of REITs in comparison to securities issued by other entities (including securities issued by other real estate companies);
|
|
·
|
an increase in market interest rates, which may lead prospective investors to demand a higher distribution rate in relation to the price paid for our shares;
|
|
·
|
the passage of legislation or other regulatory developments that adversely affect us or our industry;
|
|
·
|
speculation in the press or investment community;
|
|
·
|
actions by institutional shareholders or hedge funds;
|
|
·
|
changes in accounting principles;
|
|
·
|
terrorist acts; and
|
|
·
|
general market conditions, including factors unrelated to our performance.
|
Moreover, an active trading market on the NYSE for our Series A Preferred Shares that were issued in December 2010 may not develop or, if it does develop, may not last, in which case the trading price of our Series A Preferred Shares could be adversely affected. In the past, securities class action litigation has often been instituted against companies following periods of volatility in their stock price. This type of litigation could result in substantial costs and divert our management’s attention and resources.
Holders of our Series A Preferred Shares have extremely limited voting rights.
Holders of our Series A Preferred Shares have extremely limited voting rights. Our common shares are the only class of our equity securities carrying full voting rights. Voting rights for holders of Series A Preferred Shares exist primarily with respect to the ability to appoint additional trustees to our Board of Trustees in the event that six quarterly dividends (whether or not consecutive) payable on our Series A Preferred Shares are in arrears, and with respect to voting on amendments to our declaration of trust or our Series A Preferred Shares Articles Supplementary that materially and adversely affect the rights of Series A Preferred Shares holders or create additional classes or series of preferred shares that are senior to our Series A Preferred Shares. Other than very limited circumstances, holders of our Series A Preferred Shares will not have voting rights.
RISKS RELATED TO OUR ORGANIZATION AND STRUCTURE
Our organizational documents contain provisions that generally would prohibit any person (other than members of the Kite family who, as a group, are currently allowed to own up to 21.5% of our outstanding common shares) from beneficially owning more than 7% of our outstanding common shares (or up to 9.8% in the case of certain designated investment entities, as defined in our declaration of trust), which may discourage third parties from conducting a tender offer or seeking other change of control transactions that could involve a premium price for our shares or otherwise benefit our shareholders.
Our organizational documents contain provisions that may have an anti-takeover effect and inhibit a change in our management.
(1) There are ownership limits and restrictions on transferability in our declaration of trust. In order for us to qualify as a REIT, no more than 50% of the value of our outstanding shares may be owned, actually or constructively, by five or fewer individuals at any time during the last half of each taxable year. To make sure that we will not fail to satisfy this requirement and for anti-takeover reasons, our declaration of trust generally prohibits any shareholder (other than an excepted holder or certain designated investment entities, as defined in our declaration of trust) from owning (actually, constructively or by attribution), more than 7% of the value or number of our outstanding common shares. Our declaration of trust provides an excepted holder limit that allows members of the Kite family (Al Kite, John Kite and Paul Kite, their family members and certain entities controlled by one or more of the Kites), as a group, to own more than 7% of our outstanding common shares, so long as, under the applicable tax attribution rules, no one excepted holder treated as an individual would hold more than 21.5% of our common shares, no two excepted holders treated as individuals would own more than 28.5% of our common shares, no three excepted holders treated as individuals would own more than 35.5% of our common shares, no four excepted holders treated as individuals would own more than 42.5% of our common shares, and no five excepted holders treated as individuals would own more than 49.5% of our common shares. Currently, one of the excepted holders would be attributed all of the common shares owned by each other excepted holder and, accordingly, the excepted holders as a group would not be allowed to own in excess of 21.5% of our common shares. If at a later time, there were not one excepted holder that would be attributed all of the shares owned by the excepted holders as a group, the excepted holder limit would not permit each excepted holder to own 21.5% of our common shares. Rather, the excepted holder limit would prevent two or more excepted holders who are treated as individuals under the applicable tax attribution rules from owning a higher percentage of our common shares than the maximum amount of common shares that could be owned by any one excepted holder (21.5%), plus the maximum amount of common shares that could be owned by any one or more other individual common shareholders who are not excepted holders (7%). Certain entities that are defined as designated investment entities in our declaration of trust, which generally includes pension funds, mutual funds, and certain investment management companies, are permitted to own up to 9.8% of our outstanding common shares, so long as each beneficial owner of the shares owned by such designated investment entity would satisfy the 7% ownership limit if those beneficial owners owned directly their proportionate share of the common shares owned by the designated investment entity. Our Board of Trustees may waive the 7% ownership limit or the 9.8% designated investment entity limit for a shareholder that is not an individual if such shareholder provides information and makes representations to the board that are satisfactory to the board, in its reasonable discretion, to establish that such person’s ownership in excess of the 7% limit or the 9.8% limit, as applicable, would not
16
jeopardize our qualification as a REIT. In addition, our declaration of trust contains certain other ownership restrictions intended to prevent us from earning income from related parties if such income would cause us to fail to comply with the REIT gross income requirements. The various ownership restrictions may:
|
·
|
discourage a tender offer or other transactions or a change in management or control that might involve a premium price for our shares or otherwise be in the best interests of our shareholders; or
|
|
·
|
compel a shareholder who has acquired our shares in excess of these ownership limitations to dispose of the additional shares and, as a result, to forfeit the benefits of owning the additional shares. Any acquisition of our common shares in violation of these ownership restrictions will be void ab initio and will result in automatic transfers of our common shares to a charitable trust, which will be responsible for selling the common shares to permitted transferees and distributing at least a portion of the proceeds to the prohibited transferees.
|
(2) Our declaration of trust permits our Board of Trustees to issue preferred shares with terms that may discourage a third party from acquiring us. Our declaration of trust permits our Board of Trustees to issue up to 40,000,000 preferred shares, having those preferences, conversion or other rights, voting powers, restrictions, limitations as to distributions, qualifications, or terms or conditions of redemption as determined by our Board. Thus, our Board could authorize the issuance of additional preferred shares with terms and conditions that could have the effect of discouraging a takeover or other transaction in which holders of some or a majority of our shares might receive a premium for their shares over the then-prevailing market price of our shares. In addition, any preferred shares that we issue likely would rank senior to our common shares with respect to payment of distributions, in which case we could not pay any distributions on our common shares until full distributions were paid with respect to such preferred shares.
(3) Our declaration of trust and bylaws contain other possible anti-takeover provisions. Our declaration of trust and bylaws contain other provisions that may have the effect of delaying, deferring or preventing a change in control of our company or the removal of existing management and, as a result, could prevent our shareholders from being paid a premium for their common shares over the then-prevailing market prices. These provisions include advance notice requirements for shareholder proposals and our Board of Trustees’ power to reclassify shares and issue additional common shares or preferred shares and the absence of cumulative voting rights.
Certain provisions of Maryland law could inhibit changes in control.
Certain provisions of Maryland law may have the effect of inhibiting a third party from making a proposal to acquire us or of impeding a change of control under circumstances that otherwise could provide the holders of our common shares with the opportunity to realize a premium over the then-prevailing market price of such shares, including:
|
·
|
“business combination moratorium/fair price” provisions that, subject to limitations, prohibit certain business combinations between us and an “interested shareholder” (defined generally as any person who beneficially owns 10% or more of the voting power of our shares or an affiliate thereof) for five years after the most recent date on which the shareholder becomes an interested shareholder, and thereafter imposes stringent fair price and super-majority shareholder voting requirements on these combinations; and
|
|
·
|
“control share” provisions that provide that “control shares” of our company (defined as shares which, when aggregated with other shares controlled by the shareholder, entitle the shareholder to exercise one of three increasing ranges of voting power in electing trustees) acquired in a “control share acquisition” (defined as the direct or indirect acquisition of ownership or control of “control shares” from a party other than the issuer) have no voting rights except to the extent approved by our shareholders by the affirmative vote of at least two thirds of all the votes entitled to be cast on the matter, excluding all interested shares, and are subject to redemption in certain circumstances.
|
We have opted out of these provisions of Maryland law. However, our Board of Trustees may opt to make these provisions applicable to us at any time.
Certain officers and trustees may have interests that conflict with the interests of shareholders.
Certain of our officers and members of our Board of Trustees own limited partner units in our Operating Partnership. These individuals may have personal interests that conflict with the interests of our shareholders with respect to business decisions affecting us and our Operating Partnership, such as interests in the timing and pricing of property sales or refinancings in order to obtain favorable tax treatment. As a result, the effect of certain transactions on these unit holders may influence our decisions affecting these properties.
Departure or loss of our key officers could have an adverse effect on us.
Our future success depends, to a significant extent, upon the continued services of our existing executive officers. Our executive officers’ experience in real estate acquisition, development and finance are critical elements of our future success. We have employment agreements for one-year terms with each of our executive officers. These agreements automatically renew for a one-year term unless either we or the officer elects not to renew the agreement. These agreements were automatically renewed for our three executive officers through December 31, 2011. If one or more of our key executives were to die, become disabled or otherwise leave the company's employ, we may not be able to replace this person with an executive officer of equal skill, ability, and industry expertise. Until suitable replacements could be identified and hired, if at all, our operations and financial condition could be impaired.
We depend on external capital to fund our capital needs.
To qualify as a REIT, we are required to distribute to our shareholders each year at least 90% of our net taxable income excluding net capital gains. In order to eliminate federal income tax, we are required to distribute annually 100% of our net taxable income, including capital gains. Partly because of these distribution requirements, we will not be able to fund all future capital needs, including capital for property development and acquisitions, with income from operations. We therefore will have to rely on third-party sources of capital, which may or may not be available on favorable terms, if at all. Any additional debt we incur will increase our leverage, expose us to the risk of default and may impose operating restrictions on us, and any additional equity we raise could be dilutive to existing shareholders. Our access to third-party sources of capital depends on a number of things, including:
|
·
|
general market conditions;
|
|
·
|
the market’s perception of our growth potential;
|
|
·
|
our current debt levels;
|
17
|
·
|
our current and potential future earnings;
|
|
·
|
our cash flow and cash distributions;
|
|
·
|
our ability to qualify as a REIT for federal income tax purposes; and
|
|
·
|
the market price of our common shares.
|
If we cannot obtain capital from third-party sources, we may not be able to acquire or develop properties when strategic opportunities exist, satisfy our principal and interest obligations or make distributions to our shareholders.
Our rights and the rights of our shareholders to take action against our trustees and officers are limited.
Maryland law provides that a director or officer has no liability in that capacity if he or she performs his or her duties in good faith, in a manner he or she reasonably believes to be in our best interests that an ordinarily prudent person in a like position would use under similar circumstances. Our declaration of trust and bylaws require us to indemnify our trustees and officers for actions taken by them in those capacities to the extent permitted by Maryland law. As a result, we and our shareholders may have more limited rights against our trustees and officers than might otherwise exist under common law. Accordingly, in the event that actions taken in good faith by any of our trustees or officers impede the performance of our company, our shareholders’ ability to recover damages from such trustee or officer will be limited.
Our shareholders have limited ability to prevent us from making any changes to our policies that they believe could harm our business, prospects, operating results or share price.
Our Board of Trustees has adopted policies with respect to certain activities. These policies may be amended or revised from time to time at the discretion of our Board of Trustees without a vote of our shareholders. This means that our shareholders will have limited control over changes in our policies. Such changes in our policies intended to improve, expand or diversify our business may not have the anticipated effects and consequently may adversely affect our business and prospects, results of operations and share price.
TAX RISKS
Failure of our company to qualify as a REIT would have serious adverse consequences to us and our shareholders.
We believe that we have qualified for taxation as a REIT for federal income tax purposes commencing with our taxable year ended December 31, 2004. We intend to continue to meet the requirements for qualification and taxation as a REIT, but we cannot assure shareholders that we will qualify as a REIT. We have not requested and do not plan to request a ruling from the IRS that we qualify as a REIT, and the statements in this Annual Report on Form 10-K are not binding on the IRS or any court. As a REIT, we generally will not be subject to federal income tax on our income that we distribute currently to our shareholders. Many of the REIT requirements, however, are highly technical and complex. The determination that we are a REIT requires an analysis of various factual matters and circumstances that may not be totally within our control. For example, to qualify as a REIT, at least 95% of our gross income must come from specific passive sources, such as rent, that are itemized in the REIT tax laws. In addition, to qualify as a REIT, we cannot own specified amounts of debt and equity securities of some issuers. We also are required to distribute to our shareholders with respect to each year at least 90% of our REIT taxable income (excluding capital gains). The fact that we hold substantially all of our assets through our Operating Partnership and its subsidiaries and joint ventures further complicates the application of the REIT requirements for us. Even a technical or inadvertent mistake could jeopardize our REIT status and, given the highly complex nature of the rules governing REITs and the ongoing importance of factual determinations, we cannot provide any assurance that we will continue to qualify as a REIT. Furthermore, Congress and the IRS might make changes to the tax laws and regulations, and the courts might issue new rulings, that make it more difficult, or impossible, for us to remain qualified as a REIT.
If we fail to qualify as a REIT for federal income tax purposes, and are unable to avail ourselves of certain savings provisions set forth in the Internal Revenue Code, we would be subject to federal income tax at regular corporate rates. As a taxable corporation, we would not be allowed to take a deduction for distributions to shareholders in computing our taxable income or pass through long term capital gains to individual shareholders at favorable rates. We also could be subject to the federal alternative minimum tax and possibly increased state and local taxes. We would not be able to elect to be taxed as a REIT for four years following the year we first failed to qualify unless the IRS were to grant us relief under certain statutory provisions. If we failed to qualify as a REIT, we would have to pay significant income taxes, which would reduce our net earnings available for investment or distribution to our shareholders. If we fail to qualify as a REIT, such failure would cause an event of default under our unsecured revolving credit facility and may adversely affect our ability to raise capital and to service our debt. This likely would have a significant adverse effect on our earnings and the value of our securities. In addition, we would no longer be required to pay any distributions to shareholders. If we fail to qualify as a REIT for federal income tax purposes and are able to avail ourselves of one or more of the statutory savings provisions in order to maintain our REIT status, we would nevertheless be required to pay penalty taxes of $50,000 or more for each such failure.
We will pay some taxes even if we qualify as a REIT.
Even if we qualify as a REIT for federal income tax purposes, we will be required to pay certain federal, state and local taxes on our income and property. For example, we will be subject to income tax to the extent we distribute less than 100% of our REIT taxable income (including capital gains). Additionally, we will be subject to a 4% nondeductible excise tax on the amount, if any, by which dividends paid by us in any calendar year are less than the sum of 85% of our ordinary income, 95% of our capital gain net income and 100% of our undistributed income from prior years. Moreover, if we have net income from “prohibited transactions,” that income will be subject to a 100% tax. In general, prohibited transactions are sales or other dispositions of property held primarily for sale to customers in the ordinary course of business. The determination as to whether a particular sale is a prohibited transaction depends on the facts and circumstances related to that sale. While we will undertake sales of assets if those assets become inconsistent with our long-term strategic or return objectives, we do not believe that those sales should be considered prohibited transactions, but there can be no assurance that the IRS would not contend otherwise. The need to avoid prohibited transactions could cause us to forego or defer sales of properties that our predecessors otherwise would have sold or that it might otherwise be in our best interest to sell.
In addition, any net taxable income earned directly by our taxable REIT subsidiaries, or through entities that are disregarded for federal income tax purposes as entities separate from our taxable REIT subsidiaries, will be subject to federal and possibly state corporate income tax. We have elected to treat Kite Realty Holdings, LLC as a taxable REIT subsidiary, and we may elect to treat other subsidiaries as taxable REIT subsidiaries in the future. In this regard, several provisions of the laws applicable to REITs and their subsidiaries ensure that a taxable REIT subsidiary will be subject to an appropriate level of federal income taxation. For example, a taxable REIT subsidiary is limited in its ability to deduct interest payments made to an affiliated REIT. In addition, the REIT has to pay a 100% penalty tax on some
18
payments that it receives or on some deductions taken by the taxable REIT subsidiaries if the economic arrangements between the REIT, the REIT’s tenants, and the taxable REIT subsidiary are not comparable to similar arrangements between unrelated parties. Finally, some state and local jurisdictions may tax some of our income even though as a REIT we are not subject to federal income tax on that income because not all states and localities treat REITs the same way they are treated for federal income tax purposes. To the extent that we and our affiliates are required to pay federal, state and local taxes, we will have less cash available for distributions to our shareholders.
REIT distribution requirements may increase our indebtedness.
We may be required from time to time, under certain circumstances, to accrue income for tax purposes that has not yet been received. In such event, or upon our repayment of principal on debt, we could have taxable income without sufficient cash to enable us to meet the distribution requirements of a REIT. Accordingly, we could be required to borrow funds or liquidate investments on adverse terms in order to meet these distribution requirements.
We may in the future choose to pay dividends in our own common shares, in which case shareholders may be required to pay income taxes in excess of the cash dividends they receive.
We may in the future distribute taxable dividends that are payable partly in cash and partly in our common shares. Under existing IRS guidance with respect to taxable years ending on or before December 31, 2011, up to 90% of such a dividend could be payable in our common shares. Taxable shareholders receiving such dividends will be required to include the full amount of the dividend as ordinary income to the extent of our current and accumulated earnings and profits for U.S. federal income tax purposes, regardless of whether such shareholder receives cash, REIT shares or a combination of cash and REIT shares. As a result, a shareholder may be required to pay income tax with respect to such dividends in excess of the cash dividend. If a shareholder sells the REIT shares it receives in order to pay this tax, the sales proceeds may be less than the amount included in income with respect to the dividend, if the market value of our shares decreases following the distribution. Furthermore, with respect to certain non-U.S. stockholders, we may be required to withhold U.S. federal income tax with respect to dividends paid in our common shares. In addition, if a significant number of our shareholders determine to sell shares of our common stock in order to pay taxes owed on dividends, it may put downward pressure on the trading price of our common shares.
Dividends paid by REITs generally do not qualify for reduced tax rates.
The maximum U.S. federal income tax rate applicable to income from “qualified dividends” payable to U.S. shareholders that are individuals, trusts and estates has been reduced by legislation to 15% (through 2010). Unlike dividends received from a corporation that is not a REIT, the Company’s distributions to individual shareholders generally are not eligible for the reduced rates. Although this legislation does not adversely affect the taxation of REITs or dividends payable by REITs, the more favorable rates applicable to regular corporate qualified dividends could cause investors who are individuals, trusts and estates to perceive investments in REITs to be relatively less attractive than investments in the shares of non-REIT corporations that pay dividends, which could adversely affect the value of the shares of REITs, including our common shares.
ITEM 1.B. UNRESOLVED STAFF COMMENTS
None
19
ITEM 2. PROPERTIES
Retail Operating Properties
As of December 31, 2010, we owned interests in a portfolio of 53 retail operating properties totaling 8.0 million square feet of gross leasable area (“GLA”) (including non-owned anchor space). The following tables set forth more specific information with respect to the Company’s retail operating properties as of December 31, 2010:
OPERATING RETAIL PROPERTIES - TABLE I
|
Property1
|
State
|
MSA
|
Year Built/Renovated
|
Year Added to Operating Portfolio
|
Acquired, Redeveloped, or Developed
|
Total GLA2
|
Owned GLA2
|
Percentage of Owned
GLA Leased3
|
|||||||||||||||
|
Bayport Commons6
|
FL
|
Oldsmar
|
2008
|
2008
|
Developed
|
268,556 | 97,112 | 91.5 | % | ||||||||||||||
|
Coral Springs
|
FL
|
Ft. Lauderdale
|
2004/2010 | 2004 |
Redeveloped
|
46,079 | 46,079 | 100.0 | % | ||||||||||||||
|
Estero Town Commons6
|
FL
|
Naples
|
2006 | 2007 |
Developed
|
206,600 | 25,631 | 57.0 | % | ||||||||||||||
|
Indian River Square
|
FL
|
Vero Beach
|
1997/2004 | 2005 |
Acquired
|
379,246 | 144,246 | 97.6 | % | ||||||||||||||
|
International Speedway Square
|
FL
|
Daytona
|
1999 | 1999 |
Developed
|
242,995 | 229,995 | 94.1 | % | ||||||||||||||
|
King's Lake Square
|
FL
|
Naples
|
1986 | 2003 |
Acquired
|
85,497 | 85,497 | 90.5 | % | ||||||||||||||
|
Pine Ridge Crossing
|
FL
|
Naples
|
1993 | 2006 |
Acquired
|
258,874 | 105,515 | 96.4 | % | ||||||||||||||
|
Riverchase Plaza
|
FL
|
Naples
|
1991/2001 | 2006 |
Acquired
|
78,380 | 78,380 | 100.0 | % | ||||||||||||||
|
Shops at Eagle Creek
|
FL
|
Naples
|
1983 | 2003 |
Redeveloped
|
72,271 | 72,271 | 52.0 | % | ||||||||||||||
|
Tarpon Springs Plaza
|
FL
|
Naples
|
2007 | 2007 |
Developed
|
276,346 | 82,547 | 95.1 | % | ||||||||||||||
|
Wal-Mart Plaza
|
FL
|
Gainesville
|
1970 | 2004 |
Acquired
|
177,826 | 177,826 | 94.6 | % | ||||||||||||||
|
Waterford Lakes Village
|
FL
|
Orlando
|
1997 | 2004 |
Acquired
|
77,948 | 77,948 | 95.0 | % | ||||||||||||||
|
Kedron Village
|
GA
|
Atlanta
|
2006 | 2006 |
Developed
|
282,125 | 157,409 | 89.3 | % | ||||||||||||||
|
Publix at Acworth
|
GA
|
Atlanta
|
1996 | 2004 |
Acquired
|
69,628 | 69,628 | 96.6 | % | ||||||||||||||
|
The Centre at Panola
|
GA
|
Atlanta
|
2001 | 2004 |
Acquired
|
73,079 | 73,079 | 100.0 | % | ||||||||||||||
|
Fox Lake Crossing
|
IL
|
Chicago
|
2002 | 2005 |
Acquired
|
99,072 | 99,072 | 79.9 | % | ||||||||||||||
|
Naperville Marketplace
|
IL
|
Chicago
|
2008 | 2008 |
Developed
|
169,600 | 83,758 | 96.1 | % | ||||||||||||||
|
South Elgin Commons
|
IL
|
Chicago
|
2009 | 2009 |
Developed
|
45,000 | 45,000 | 100.0 | % | ||||||||||||||
|
50 South Morton
|
IN
|
Indianapolis
|
1999 | 1999 |
Developed
|
2,000 | 2,000 | 100.0 | % | ||||||||||||||
|
54th & College
|
IN
|
Indianapolis
|
2008 | 2008 |
Developed
|
20,100 | — | * | |||||||||||||||
|
Beacon Hill6
|
IN
|
Crown Point
|
2006 | 2007 |
Developed
|
127,821 | 57,191 | 54.0 | % | ||||||||||||||
|
Boulevard Crossing
|
IN
|
Kokomo
|
2004 | 2004 |
Developed
|
213,696 | 123,696 | 93.0 | % | ||||||||||||||
|
Bridgewater Marketplace
|
IN
|
Indianapolis
|
2008 | 2008 |
Developed
|
50,820 | 25,975 | 61.6 | % | ||||||||||||||
|
Cool Creek Commons
|
IN
|
Indianapolis
|
2005 | 2005 |
Developed
|
137,107 | 124,578 | 96.9 | % | ||||||||||||||
|
Eddy Street Commons (Retail only)
|
IN
|
South Bend
|
2009 | 2010 |
Developed
|
87,762 | 87,762 | 85.3 | % | ||||||||||||||
|
Fishers Station4
|
IN
|
Indianapolis
|
1989 | 2004 |
Acquired
|
116,885 | 116,885 | 87.7 | % | ||||||||||||||
|
Geist Pavilion
|
IN
|
Indianapolis
|
2006 | 2006 |
Developed
|
64,114 | 64,114 | 83.7 | % | ||||||||||||||
|
Glendale Town Center
|
IN
|
Indianapolis
|
1958/2008 | 2008 |
Redeveloped
|
685,827 | 403,198 | 97.4 | % | ||||||||||||||
|
Greyhound Commons
|
IN
|
Indianapolis
|
2005 | 2005 |
Developed
|
153,187 | — | * | |||||||||||||||
|
Hamilton Crossing Centre
|
IN
|
Indianapolis
|
1999 | 2004 |
Acquired
|
87,424 | 82,424 | 92.1 | % | ||||||||||||||
|
Martinsville Shops
|
IN
|
Martinsville
|
2005 | 2005 |
Developed
|
10,986 | 10,986 | 16.4 | % | ||||||||||||||
|
Red Bank Commons
|
IN
|
Evansville
|
2005 | 2006 |
Developed
|
324,308 | 34,308 | 66.0 | % | ||||||||||||||
|
Stoney Creek Commons
|
IN
|
Indianapolis
|
2000 | 2000 |
Developed
|
189,527 | 49,330 | 100.0 | % | ||||||||||||||
|
The Centre5
|
IN
|
Indianapolis
|
1986 | 1986 |
Developed
|
80,689 | 80,689 | 96.5 | % | ||||||||||||||
|
The Corner
|
IN
|
Indianapolis
|
1984/2003 | 1984 |
Developed
|
42,612 | 42,612 | 100.0 | % | ||||||||||||||
|
Traders Point
|
IN
|
Indianapolis
|
2005 | 2005 |
Developed
|
348,835 | 279,674 | 99.0 | % | ||||||||||||||
|
Traders Point II
|
IN
|
Indianapolis
|
2005 | 2005 |
Developed
|
46,600 | 46,600 | 61.8 | % | ||||||||||||||
|
Whitehall Pike
|
IN
|
Bloomington
|
1999 | 1999 |
Developed
|
128,997 | 128,997 | 100.0 | % | ||||||||||||||
|
Zionsville Place
|
IN
|
Indianapolis
|
2006 | 2006 |
Developed
|
12,400 | 12,400 | 100.0 | % | ||||||||||||||
|
Ridge Plaza
|
NJ
|
Oak Ridge
|
2002 | 2003 |
Acquired
|
115,063 | 115,063 | 81.3 | % | ||||||||||||||
|
Eastgate Pavilion
|
OH
|
Cincinnati
|
1995 | 2004 |
Acquired
|
236,230 | 236,230 | 100.0 | % | ||||||||||||||
|
Cornelius Gateway6
|
OR
|
Portland
|
2006 | 2007 |
Developed
|
35,800 | 21,324 | 62.3 | % | ||||||||||||||
|
Shops at Otty7
|
OR
|
Portland
|
2004 | 2004 |
Developed
|
154,845 | 9,845 | 100.0 | % | ||||||||||||||
|
Burlington Coat Factory8
|
TX
|
San Antonio
|
1992/2000 | 2000 |
Redeveloped
|
107,400 | 107,400 | 100.0 | % | ||||||||||||||
|
Cedar Hill Village
|
TX
|
Dallas
|
2002 | 2004 |
Acquired
|
139,092 | 44,262 | 94.1 | % | ||||||||||||||
|
Market Street Village
|
TX
|
Hurst
|
1970/2004 | 2005 |
Acquired
|
163,625 | 156,625 | 100.0 | % | ||||||||||||||
|
Plaza at Cedar Hill
|
TX
|
Dallas
|
2000 | 2004 |
Acquired
|
299,847 | 299,847 | 89.5 | % | ||||||||||||||
|
Plaza Volente
|
TX
|
Austin
|
2004 | 2005 |
Acquired
|
160,333 | 156,333 | 86.0 | % | ||||||||||||||
|
Preston Commons
|
TX
|
Dallas
|
2002 | 2002 |
Developed
|
142,539 | 27,539 | 77.4 | % | ||||||||||||||
|
Sunland Towne Centre
|
TX
|
El Paso
|
1996 | 2004 |
Acquired
|
312,450 | 307,474 | 96.7 | % | ||||||||||||||
|
50th & 12th
|
WA
|
Seattle
|
2004 | 2004 |
Developed
|
14,500 | 14,500 | 100.0 | % | ||||||||||||||
|
Gateway Shopping Center9
|
WA
|
Seattle
|
2008 | 2008 |
Developed
|
285,200 | 99,444 | 92.8 | % | ||||||||||||||
|
Sandifur Plaza6
|
WA
|
Pasco
|
2008 | 2008 |
Developed
|
12,552 | 12,552 | 82.5 | % | ||||||||||||||
|
TOTAL
|
8,020,295 | 5,132,850 | 92.2 | % | |||||||||||||||||||
20
OPERATING RETAIL PROPERTIES - TABLE I (continued)
|
____________________
|
||
|
*
|
Property consists of ground leases only and, therefore, no Owned GLA. 54th & College is a single ground lease property; Greyhound Commons has two of four outlots leased.
|
|
|
1
|
All properties are wholly owned, except as indicated. Unless otherwise noted, each property is owned in fee simple by the Company.
|
|
|
2
|
Owned GLA represents gross leasable area that is owned by the Company. Total GLA includes Owned GLA, square footage attributable to non-owned anchor space, and non-owned structures on ground leases.
|
|
|
3
|
Percentage of Owned GLA Leased reflects Owned GLA leased as of December 31, 2010, except for Greyhound Commons and 54th & College (see * ).
|
|
|
4
|
This property is divided into two parcels: a grocery store and small shops. The Company owns a 25% interest in the small shops parcel through a joint venture and a 100% interest in the grocery store. The joint venture partner is entitled to an annual preferred payment of $96,000. All remaining cash flow is distributed to the Company.
|
|
|
5
|
As of December 31, 2010, the Company owns a 60% interest in this property through a joint venture with a third party that manages the property. Subsequent to year-end, the Company acquired the remaining 40% interest and assumed all leasing and management responsibilities.
|
|
|
6
|
The Company owns and manages the following properties through joint ventures with third parties: Bayport Commons (60%); Beacon Hill (50%); Cornelius Gateway (80%); Estero Town Commons (40%); and Sandifur Plaza (95%).
|
|
|
7
|
The Company does not own the land at this property. It has leased the land pursuant to two ground leases that expire in 2017. The Company has six five-year options to renew this lease.
|
|
|
8
|
The Company does not own the land at this property. It has leased the land pursuant to a ground lease that expires in 2012. The Company has six five-year renewal options and a right of first refusal to purchase the land.
|
|
|
9
|
The Company owns a 50% interest in Gateway Shopping Center through a joint venture with a third party. The joint venture partner performs on-site management of the property.
|
|
21
OPERATING RETAIL PROPERTIES – TABLE II
|
Property
|
State
|
MSA
|
Encumbrances
|
Annualized
Base Rent
Revenue1
|
Annualized Ground Lease Revenue
|
Annualized Total Retail Revenue
|
Percentage of Annualized Total Retail Revenue
|
Base Rent Per Leased Owned GLA2
|
Major Tenants and
Non-Owned Anchors3
|
||||||||||||||||||
|
Bayport Commons
|
FL
|
Oldsmar
|
$ | 14,923,016 | $ | 1,590,095 | $ | — | $ | 1,590,095 | 2.50 | % | $ | 17.89 |
Petsmart, Best Buy, Michaels, Target (non-owned)
|
||||||||||||
|
Coral Springs
|
FL
|
Ft. Lauderdale
|
— | 663,538 | — | 663,538 | 1.04 | % | 14.40 |
Toys “R” Us
|
|||||||||||||||||
|
Estero Town Commons4
|
FL
|
Naples
|
10,500,000 | 429,137 | 750,000 | 1,179,137 | 1.86 | % | 29.37 |
Lowe's Home Improvement
|
|||||||||||||||||
|
Indian River Square
|
FL
|
Vero Beach
|
13,040,043 | 1,447,614 | — | 1,447,614 | 2.28 | % | 10.29 |
Beall's, Office Depot, Target (non-owned),
Lowe's Home Improvement (non-owned)
|
|||||||||||||||||
|
International Speedway Square
|
FL
|
Daytona
|
— | 2,127,240 | 405,475 | 2,532,715 | 3.99 | % | 9.83 |
Bed Bath & Beyond, Stein Mart, Old Navy, Staples,
Michaels, Dick’s Sporting Goods
|
|||||||||||||||||
|
King's Lake Square
|
FL
|
Naples
|
— | 1,001,887 | — | 1,001,887 | 1.58 | % | 12.95 |
Publix, Retro Fitness
|
|||||||||||||||||
|
Pine Ridge Crossing
|
FL
|
Naples
|
17,500,000 | 1,558,098 | — | 1,558,098 | 2.45 | % | 15.31 |
Publix, Target (non-owned), Beall's (non-owned)
|
|||||||||||||||||
|
Riverchase Plaza
|
FL
|
Naples
|
10,500,000 | 1,118,669 | — | 1,118,669 | 1.76 | % | 14.27 |
Publix
|
|||||||||||||||||
|
Shops at Eagle Creek
|
FL
|
Naples
|
— | 606,337 | 55,104 | 661,441 | 1.04 | % | 16.15 |
Staples, Lowe’s (non-owned)
|
|||||||||||||||||
|
Tarpon Springs Plaza
|
FL
|
Naples
|
12,187,942 | 1,715,219 | 228,820 | 1,944,039 | 3.06 | % | 21.84 |
Cost Plus, AC Moore, Staples, Target (non-owned)
|
|||||||||||||||||
|
Wal-Mart Plaza
|
FL
|
Gainesville
|
— | 918,044 | — | 918,044 | 1.44 | % | 5.46 |
Books-A-Million, Save-A-Lot, Wal-Mart
|
|||||||||||||||||
|
Waterford Lakes Village
|
FL
|
Orlando
|
— | 893,050 | — | 893,050 | 1.41 | % | 12.06 |
Winn-Dixie
|
|||||||||||||||||
|
Kedron Village
|
GA
|
Atlanta
|
29,700,000 | 2,455,742 | — | 2,455,742 | 3.87 | % | 17.46 |
Bed Bath & Beyond, Ross, PETCO, Target (non-owned)
|
|||||||||||||||||
|
Publix at Acworth
|
GA
|
Atlanta
|
— | 775,824 | — | 775,824 | 1.22 | % | 11.54 |
Publix
|
|||||||||||||||||
|
The Centre at Panola
|
GA
|
Atlanta
|
3,464,489 | 888,318 | — | 888,318 | 1.40 | % | 12.16 |
Publix
|
|||||||||||||||||
|
Fox Lake Crossing
|
IL
|
Chicago
|
11,050,412 | 1,081,183 | — | 1,081,183 | 1.70 | % | 13.65 |
Dominick's Finer Foods
|
|||||||||||||||||
|
Naperville Marketplace
|
IL
|
Chicago
|
— | 993,744 | — | 993,744 | 1.56 | % | 12.34 |
TJ Maxx, PetSmart, Caputo’s (non-owned)
|
|||||||||||||||||
|
South Elgin Commons
|
IL
|
Chicago
|
9,170,000 | 843,750 | — | 843,750 | 1.33 | % | 18.75 |
LA Fitness, Super Target (non-owned)
|
|||||||||||||||||
|
50 South Morton
|
IN
|
Indianapolis
|
— | 126,000 | — | 126,000 | 0.20 | % | 63.00 | ||||||||||||||||||
|
54th & College
|
IN
|
Indianapolis
|
— | — | 260,000 | 260,000 | 0.41 | % | — |
The Fresh Market (non-owned)
|
|||||||||||||||||
|
Beacon Hill
|
IN
|
Crown Point
|
7,401,750 | 487,050 | — | 487,050 | 0.77 | % | 15.78 |
Strack & VanTill (non-owned), Walgreens (non-owned)
|
|||||||||||||||||
|
Boulevard Crossing
|
IN
|
Kokomo
|
— | 1,546,795 | — | 1,546,795 | 2.42 | % | 13.45 |
PETCO, TJ Maxx, Ulta Salon, Kohl's (non-owned)
|
|||||||||||||||||
|
Bridgewater Marketplace
|
IN
|
Indianapolis
|
7,000,000 | 275,517 | — | 275,517 | 0.43 | % | 17.22 |
Walgreens (non-owned)
|
|||||||||||||||||
|
Cool Creek Commons
|
IN
|
Indianapolis
|
17,643,234 | 1,987,878 | — | 1,987,878 | 3.13 | % | 16.47 |
The Fresh Market, Stein Mart, Cardinal Fitness
|
|||||||||||||||||
|
Eddy Street Commons
|
IN
|
South Bend
|
24,871,142 | 1,690,493 | — | 1,690,493 | 2.66 | % | 22.59 |
Hammes Bookstore, Urban Outfitters
|
|||||||||||||||||
|
Fishers Station
|
IN
|
Indianapolis
|
3,656,493 | 1,094,754 | — | 1,094,754 | 1.72 | % | 10.68 |
Marsh Supermarkets, Goodwill, Dollar Tree
|
|||||||||||||||||
|
Geist Pavilion
|
IN
|
Indianapolis
|
11,125,000 | 939,579 | — | 939,579 | 1.48 | % | 17.52 |
Partytree Superstore, Ace Hardware
|
|||||||||||||||||
|
Glendale Town Center
|
IN
|
Indianapolis
|
19,615,000 | 2,471,303 | — | 2,471,303 | 3.89 | % | 6.30 |
Macy’s, Landmark Theatres, Staples, Indianapolis Library,
Lowe's Home Improvement (non-owned),
Target (non-owned), Walgreens (non-owned)
|
|||||||||||||||||
|
Greyhound Commons
|
IN
|
Indianapolis
|
— | — | 221,748 | 221,748 | 0.35 | % | — |
Lowe's Home Improvement (non-owned)
|
|||||||||||||||||
|
Hamilton Crossing Centre
|
IN
|
Indianapolis
|
— | 1,362,204 | 78,650 | 1,440,854 | 2.27 | % | 17.94 |
Office Depot
|
|||||||||||||||||
|
Martinsville Shops
|
IN
|
Martinsville
|
— | 26,100 | — | 26,100 | 0.04 | % | — |
Walgreens (non-owned)
|
|||||||||||||||||
|
Red Bank Commons
|
IN
|
Evansville
|
— | 318,764 | — | 318,764 | 0.50 | % | 14.07 |
Wal-Mart (non-owned), Home Depot (non-owned)
|
|||||||||||||||||
|
Stoney Creek Commons
|
IN
|
Indianapolis
|
— | 464,755 | — | 464,755 | 0.73 | % | 9.42 |
HH Gregg, Office Depot,
Lowe's Home Improvement (non-owned),
|
|||||||||||||||||
|
The Centre4
|
IN
|
Indianapolis
|
— | 1,072,277 | — | 1,072,277 | 1.69 | % | 13.77 |
CVS
|
|||||||||||||||||
|
The Corner
|
IN
|
Indianapolis
|
1,486,488 | 647,522 | — | 647,522 | 1.02 | % | 15.20 |
Hancock Fabrics
|
|||||||||||||||||
|
Traders Point
|
IN
|
Indianapolis
|
45,895,436 | 4,047,159 | 435,000 | 4,482,159 | 7.05 | % | 14.62 |
Dick's Sporting Goods, AMC Theatre,Marsh, Bed Bath & Beyond, Michaels, Old Navy, Petsmart
|
|||||||||||||||||
|
Traders Point II
|
IN
|
Indianapolis
|
— | 743,901 | — | 743,901 | 1.17 | % | 25.83 | ||||||||||||||||||
|
Whitehall Pike
|
IN
|
Bloomington
|
8,039,656 | 1,014,000 | — | 1,014,000 | 1.60 | % | 7.86 |
Lowe's Home Improvement
|
|||||||||||||||||
|
Zionsville Place
|
IN
|
Indianapolis
|
— | 241,204 | — | 241,204 | 0.38 | % | 19.45 | ||||||||||||||||||
|
Ridge Plaza
|
NJ
|
Oak Ridge
|
14,746,436 | 1,549,071 | — | 1,549,071 | 2.44 | % | 16.56 |
A&P Grocery, CVS
|
|||||||||||||||||
|
Eastgate Pavilion
|
OH
|
Cincinnati
|
14,883,390 | 2,130,416 | — | 2,130,416 | 3.35 | % | 9.02 |
Best Buy, Dick's Sporting Goods, Value City Furniture, Petsmart, DSW
|
|||||||||||||||||
22
OPERATING RETAIL PROPERTIES – TABLE II (continued)
|
Property
|
State
|
MSA
|
Encumbrances
|
Annualized
Base Rent
Revenue1
|
Annualized Ground Lease Revenue
|
Annualized Total Retail Revenue
|
Percentage of Annualized Total Retail Revenue
|
Base Rent Per Leased Owned GLA2
|
Major Tenants and
Non-Owned Anchors3
|
||||||||||||||||||
|
Cornelius Gateway
|
OR
|
Portland
|
— | 264,744 | — | 264,744 | 0.42 | % | 19.93 |
Fedex/Kinkos
|
|||||||||||||||||
|
Shops at Otty
|
OR
|
Portland
|
— | 273,795 | 136,300 | 410,095 | 0.65 | % | 27.81 |
Wal-Mart (non-owned)
|
|||||||||||||||||
|
Burlington Coat Factory
|
TX
|
San Antonio
|
— | 510,150 | — | 510,150 | 0.80 | % | 4.75 |
Burlington Coat Factory
|
|||||||||||||||||
|
Cedar Hill Village
|
TX
|
Dallas
|
— | 675,305 | — | 675,305 | 1.06 | % | 16.21 |
24 Hour Fitness, JC Penny (non-owned)
|
|||||||||||||||||
|
Market Street Village
|
TX
|
Hurst
|
— | 1,747,312 | 33,000 | 1,780,312 | 2.80 | % | 11.16 |
Jo-Ann Fabric, Ross, Office Depot, Buy Buy Baby
|
|||||||||||||||||
|
Plaza at Cedar Hill
|
TX
|
Dallas
|
25,175,721 | 3,482,142 | — | 3,482,142 | 5.48 | % | 12.98 |
Hobby Lobby, Office Max, Ross, Marshalls, Sprouts Farmers Market, Toys “R” Us/Babies “R” Us
|
|||||||||||||||||
|
Plaza Volente
|
TX
|
Austin
|
28,119,431 | 1,934,204 | 110,000 | 2,044,204 | 3.22 | % | 14.39 |
H-E-B Grocery
|
|||||||||||||||||
|
Preston Commons
|
TX
|
Dallas
|
4,223,200 | 525,468 | — | 525,468 | 0.83 | % | 24.65 |
Lowe's Home Improvement (non-owned)
|
|||||||||||||||||
|
Sunland Towne Centre
|
TX
|
El Paso
|
25,000,000 | 3,082,397 | 104,809 | 3,187,206 | 5.02 | % | 10.36 |
Petsmart, Ross, HMY Roomstore, Kmart, Bed Bath & Beyond, Feldman’s Market
|
|||||||||||||||||
|
50th & 12th
|
WA
|
Seattle
|
4,293,034 | 475,000 | — | 475,000 | 0.75 | % | 32.76 |
Walgreens
|
|||||||||||||||||
|
Gateway Shopping Center4
|
WA
|
Seattle
|
20,712,866 | 2,059,098 | 144,000 | 2,203,098 | 3.47 | % | 22.32 |
Petsmart, Ross, Rite Aid, Party City, Kohl’s (non-owned),
Winco (non-owned)
|
|||||||||||||||||
|
Sandifur Plaza
|
WA
|
Pasco
|
— | 196,320 | — | 196,320 | 0.31 | % | 18.96 |
Walgreens (non-owned)
|
|||||||||||||||||
|
TOTAL
|
$ | 415,924,179 | $ | 60,570,166 | $ | 2,962,906 | $ | 63,533,072 | 100 | % | $ | 12.80 | |||||||||||||||
|
____________________
|
|
|
1
|
Annualized Base Rent Revenue represents the contractual rent for December 2010 for each applicable property, multiplied by 12. This table does not include Annualized Base Rent from development property tenants open for business as of December 31, 2010.
|
|
2
|
Owned GLA represents gross leasable area that is owned by the Company. Total GLA includes Owned GLA, square footage attributable to non-owned anchor space and non-owned structures on ground leases.
|
|
3
|
Represents the three largest tenants that occupy at least 10,000 square feet of GLA at the property, including non-owned anchors.
|
|
4
|
A third party manages this property.
|
23
Commercial Properties
As of December 31, 2010, we owned interests in four operating commercial properties totaling 0.6 million square feet of net rentable area (“NRA”). The following sets forth more specific information with respect to the Company’s commercial properties as of December 31, 2010:
OPERATING COMMERCIAL PROPERTIES
|
Property
|
MSA
|
Year Built/
Renovated
|
Acquired,
Redeveloped
or Developed
|
Encumbrances
|
Owned
NRA
|
Percentage
of Owned
NRA
Leased
|
Annualized
Base Rent1
|
Percentage
of
Annualized
Commercial
Base Rent
|
Base Rent
Per Leased
Sq. Ft.
|
Major Tenants
|
||||
|
Indiana
|
||||||||||||||
|
30 South2
|
Indianapolis
|
1905/2002
|
Redeveloped
|
$
|
21,303,984
|
298,346
|
92.6%
|
$
|
4,925,582
|
65.9%
|
$
|
17.84
|
Indiana Supreme Court, City Securities, Kite Realty Group, Lumina Foundation
|
|
|
Pen Products
|
Indianapolis
|
2003
|
Developed
|
—
|
85,875
|
100.0%
|
834,705
|
11.2%
|
9.72
|
Indiana Dept. of Administration
|
||||
|
Union Station Parking Garage3
|
Indianapolis
|
1986
|
Acquired
|
—
|
N/A
|
N/A
|
N/A
|
N/A
|
N/A
|
Denison Parking
|
||||
|
Indiana State Motorpool
|
Indianapolis
|
2004
|
Developed
|
3,467,910
|
115,000
|
100.0%
|
639,400
|
8.5%
|
5.56
|
Indiana Dept. of Administration
|
||||
|
Eddy Street Office (part of Eddy Street Commons) 4
|
South Bend
|
2009
|
Developed
|
—
|
82,159
|
90.5%
|
1,074,903
|
14.4%
|
14.46
|
Notre Dame Office
|
||||
|
TOTAL
|
$
|
24,771,894
|
581,380
|
94.8%
|
$
|
7,474,590
|
100.0%
|
$
|
13.56
|
|||||
|
____________________
|
|
|
1
|
Annualized Base Rent represents the monthly contractual rent for December 2010 for each applicable property, multiplied by 12.
|
|
2
|
Annualized Base Rent includes $779,507 from the Company and subsidiaries as of December 31, 2010.
|
|
3
|
The garage is managed by a third party.
|
|
4
|
The Company also owns a 50% interest in an unconsolidated limited service hotel at Eddy Street Commons in South Bend, Indiana along with a parking garage that serves the hotel and the office and retail components of the property.
|
24
In-Process Developments
In addition to our operating retail properties, as of December 31, 2010, we owned interests in two in-process developments that are expected to contain 0.5 million square feet of gross leasable area (including non-owned anchor space) upon completion. The following sets forth more specific information with respect to the Company’s retail development properties as of December 31, 2010:
|
In-Process Development Projects
|
Company Ownership %1
|
MSA
|
Encumbrances
|
Actual/
Projected Opening
Date2
|
Projected
Owned
GLA3
|
Projected
Total
GLA4
|
Percent
of Owned
GLA
Occupied5
|
Percent
of Owned
GLA
Pre-Leased/
Committed6
|
Total
Estimated
Project
Cost7
|
Cost
Incurred
as of
December 31, 20107
|
Major Tenants and Non-owned Anchors
|
|||||||||||||
|
Cobblestone Plaza, FL1
|
50%
|
Ft. Lauderdale
|
$
|
28,347,102
|
Q2 2009/
Q4 2011
|
132,743
|
138,386
|
32.5%
|
84.4%
|
$
|
52,000
|
$
|
48,083
|
Whole Foods, Pets Emporium, Party City
|
||||||||||
|
South Elgin Commons, IL – Phases I and II
|
100%
|
Chicago
|
—
|
Q4 2011
|
128,000
|
315,000
|
35.2%
|
100.0%
|
16,200
|
7,427
|
Ross, Toys “R” Us, LA Fitness (Phase I),
Super Target (non-owned)
|
|||||||||||||
|
Total In-Process Development Projects
|
$
|
28,347,102
|
260,743
|
453,386
|
33.8%
|
92.1%
|
$
|
68,200
|
$
|
55,510
|
||||||||||||||
|
Cost incurred as of 12/31/2010 included in Construction in progress on consolidated balance sheet8
|
$
|
30,332
|
||||||||||||||||||||||
|
____________________
|
|
|
1
|
The Company owns Cobblestone Plaza through a joint venture. Whole Foods is planning to take possession of their leased space in the second half of 2011.
|
|
2
|
Opening Date is defined as the first date a tenant is open for business or a ground lease payment is made. Stabilization (i.e., 85% occupied) typically occurs within six to twelve months after the opening date.
|
|
3
|
Projected Owned GLA represents gross leasable area we project we will own. It excludes square footage that we project will be attributable to non-owned outlot structures on land owned by us and expected to be ground leased to tenants. It also excludes non-owned anchor space.
|
|
4
|
Projected Total GLA includes Projected Owned GLA, projected square footage attributable to non-owned outlot structures on land that we own, and non-owned anchor space that currently exists or is under construction.
|
|
5
|
Includes tenants that have taken possession of their space or have begun paying rent.
|
|
6
|
Excludes outlot land parcels owned by the Company and ground leased to tenants. Includes leases under negotiation for 37,290 square feet for which the Company has signed non-binding letters of intent.
|
|
7
|
Dollars in thousands. Reflects both the Company’s and partners’ share of costs.
|
|
8
|
Cost incurred is reclassified to fixed assets on the consolidated balance sheet on a pro-rata basis as portions of the asset are placed in service.
|
25
Redevelopment Properties
In addition to our in-process development pipeline, as displayed in the table above, as of December 31, 2010, we owned four retail redevelopment properties that contain 0.5 million square feet of gross leasable area. The following sets forth more specific information with respect to the Company’s retail redevelopment properties as of December 31, 2010:
|
Redevelopment Projects1
|
Company Ownership %
|
MSA
|
Encumbrances
|
Existing Owned GLA
|
Projected
Owned
GLA2
|
Projected
Total
GLA3
|
Total
Estimated
Project
Cost4
|
Cost Incurred
as of
December 31, 20104
|
Major Tenants and Non-owned Anchors
|
||||||||
|
Rivers Edge, IN5
|
100%
|
Indianapolis
|
$
|
14,311,526
|
110,875
|
152,285
|
152,285
|
$
|
21,500
|
$
|
2,924
|
Nordstrom Rack, Buy Buy Baby, Container Store, Arhaus Furniture, BGI Fitness
|
|||||
|
Bolton Plaza, FL5
|
100%
|
Jacksonville
|
—
|
172,938
|
172,938
|
172,938
|
5,700
|
1,487
|
Academy Sports & Outdoors
|
||||||||
|
Courthouse Shadows, FL5
|
100%
|
Naples
|
—
|
134,867
|
134,867
|
134,867
|
2,500
|
378
|
Publix, Office Max
|
||||||||
|
Four Corner Square, WA5
|
100%
|
Seattle
|
—
|
29,177
|
44,000
|
44,000
|
500
|
62
|
Johnson Hardware Store
|
||||||||
|
Total Redevelopment Projects
|
$
|
14,311,526
|
447,857
|
504,090
|
504,090
|
$
|
30,200
|
$
|
4,851
|
||||||||
|
____________________
|
|
|
1
|
Redevelopment properties have been removed from the operating portfolio statistics.
|
|
2
|
Projected Owned GLA represents gross leasable area we project we will own. It excludes square footage that we project will be attributable to non-owned outlot structures on land owned by us and expected to be ground leased to tenants. It also excludes non-owned anchor space.
|
|
3
|
Projected Total GLA includes Projected Owned GLA, projected square footage attributable to non-owned outlot structures on land that we own, and non-owned anchor space that currently exists or is under construction.
|
|
4
|
Dollars in thousands. Reflects both the Company’s and partners’ share of costs.
|
|
5
|
The current estimate of the total project costs may increase depending on the outcome of current negotiations with additional tenants.
|
26
Other Development Activity
In addition to our in-process development and redevelopment pipeline, as displayed in the tables above, we have interests in a future development pipeline, which includes land parcels that are in various stages of preparation for construction to commence, including pre-leasing activity and negotiations for third party financings. With respect to each asset in the future development pipeline, our policy is to not commence verticial construction until pre-established leasing thresholds are achieved and the requisite third-party financing is in place. As of December 31, 2010, this visible future pipeline consisted of five projects that are expected to contain 2.5 million square feet at a total estimated project cost of $298.1 million, our share of which is expected to be $179.7 million, including our share of the unconsolidated project.
|
Project
|
MSA
|
KRG Ownership %
|
Encumbrances
|
Estimated Start Date
|
Estimated Total GLA1
|
Total Estimated Project Cost1,2
|
Cost Incurred as of Dec. 31, 20102
|
Potential Tenancy
|
||||||||||||
|
Unconsolidated –
|
||||||||||||||||||||
|
Parkside Town Commons, NC3
|
Raleigh
|
40%
|
$
|
33,873,000
|
TBD
|
1,500,000
|
$
|
148,000
|
$
|
62,063
|
Frank Theatres, Discount Department Store, Jr. Boxes, Restaurants
|
|||||||||
|
KRG Current Share of Unconsolidated Project Cost3 3
|
$
|
13,549,200
|
$
|
29,600
|
$
|
24,825
|
||||||||||||||
|
20%
|
40%
|
|||||||||||||||||||
|
Consolidated –
|
||||||||||||||||||||
|
Delray Marketplace, FL4
|
Delray Beach
|
50%
|
$
|
4,725,000
|
TBD
|
296,000
|
$
|
90,000
|
$
|
46,571
|
Publix, Frank Theatres, Jr. Boxes, Shops, Restaurants
|
|||||||||
|
Maple Valley, WA5
|
Seattle
|
100%
|
—
|
TBD
|
74,000
|
11,000
|
10,775
|
Hardware Store, Shops
|
||||||||||||
|
Broadstone Station, NC
|
Raleigh
|
100%
|
—
|
TBD
|
345,000
|
19,100
|
13,279
|
Shops, Pad Sales, Jr. Boxes, Super Wal-Mart (non-owned)
|
||||||||||||
|
New Hill Place, NC – I
|
Raleigh
|
100%
|
—
|
TBD
|
310,000
|
30,000
|
15,276
|
Target, Frank Theatres
|
||||||||||||
|
TOTAL
|
$
|
4,725,000
|
1,025,000
|
150,100
|
85,901
|
|||||||||||||||
|
KRG Current Share of Consolidated Project Cost
|
$
|
179,700
|
$
|
110,726
|
||||||||||||||||
|
____________________
|
|
|
1
|
Total Estimated Project Cost and Estimated Total GLA based on preliminary site plans and includes non-owned anchor space that exists or is currently under construction.. The current estimate of the total project costs may change depending on the outcome of negotiations with tenants.
|
|
2
|
Dollars in thousands. Reflects both the Company’s and partners’ share of costs.
|
|
3
|
Parkside Town Commons is owned through a joint venture with Prudential Real Estate Investors. The Company’s interest in this joint venture is 40% as of December 31, 2010 and will be reduced to 20% at the time of project specific construction financing.
|
|
4
|
The Company owns Delray Marketplace through a joint venture (preferred return, then 50%).
|
|
5
|
“Total Estimated Project Cost” includes a portion of the acquisition cost of the Four Corner Square shopping center which is a component of the Maple Valley redevelopment.
|
27
Land Held for Future Development
As of December 31, 2010, we owned interests in land parcels comprising 93 acres that are expected to be used for future expansion of existing properties, development of new retail or commercial properties or sold to third parties.
Tenant Diversification
No individual retail or commercial tenant accounted for more than 3.2% of the portfolio’s annualized base rent for the year ended December 31, 2010. The following table sets forth certain information for the largest 10 tenants and non-owned anchor tenants (based on total GLA) open for business or for which ground lease payments are being made at the Company’s retail properties based on minimum rents in place as of December 31, 2010:
TOP 10 RETAIL TENANTS BY GROSS LEASABLE AREA
|
Tenant
|
Number of
Locations
|
Total GLA
|
Number of
Leases
|
Company
Owned GLA1
|
Number of Anchor
Owned Locations
|
Anchor
Owned GLA2
|
||||||||||||||||||
|
Lowe's Home Improvement3
|
8 | 1,082,630 | 2 | 128,997 | 6 | 953,633 | ||||||||||||||||||
|
Target
|
6 | 665,732 | 0 | 0 | 6 | 665,732 | ||||||||||||||||||
|
Wal-Mart
|
4 | 618,161 | 1 | 103,161 | 3 | 515,000 | ||||||||||||||||||
|
Publix
|
6 | 289,779 | 6 | 289,779 | 0 | 0 | ||||||||||||||||||
|
Federated Department Stores
|
1 | 237,455 | 1 | 237,455 | 0 | 0 | ||||||||||||||||||
|
Dick's Sporting Goods
|
3 | 171,737 | 3 | 171,737 | 0 | 0 | ||||||||||||||||||
|
Ross Stores
|
5 | 147,648 | 5 | 147,648 | 0 | 0 | ||||||||||||||||||
|
Petsmart
|
6 | 147,079 | 6 | 147,079 | 0 | 0 | ||||||||||||||||||
|
Home Depot
|
1 | 140,000 | 0 | 0 | 1 | 140,000 | ||||||||||||||||||
|
Bed Bath & Beyound
|
5 | 134,298 | 5 | 134,298 | 0 | 0 | ||||||||||||||||||
| 45 | 3,634,519 | 29 | 1,360,154 | 16 | 2,274,365 | |||||||||||||||||||
|
____________________
|
|
|
1
|
Excludes the estimated size of the structures located on land owned by the Company and ground leased to tenants.
|
|
2
|
Includes the estimated size of the structures located on land owned by the Company and ground leased to tenants.
|
|
3
|
The Company has entered into one ground lease with Lowe’s Home Improvement for a total of 163,000 square feet, which is included in Anchor Owned GLA.
|
28
The following table sets forth certain information for the largest 25 tenants open for business at the Company’s retail and commercial properties based on minimum rents in place as of December 31, 2010:
TOP 25 TENANTS BY ANNUALIZED BASE RENT1, 2
|
Tenant
|
Type of
Property
|
Number of
Locations
|
Leased GLA/NRA2
|
% of Owned
GLA/NRA
of the
Portfolio
|
Annualized
Base Rent1,3
|
Annualized
Base Rent
per Sq. Ft.
|
% of Total
Portfolio
Annualized
Base Rent
|
||||||||||||||||||
|
Publix
|
Retail
|
6 | 289,779 | 5.1 | % | $ | 2,366,871 | $ | 8.17 | 3.2 | % | ||||||||||||||
|
Petsmart
|
Retail
|
6 | 147,079 | 2.6 | % | 2,057,838 | 13.99 | 2.8 | % | ||||||||||||||||
|
Bed Bath & Beyond/Buy Buy Baby
|
Retail
|
6 | 168,165 | 3.0 | % | 1,787,698 | 10.63 | 2.4 | % | ||||||||||||||||
|
Lowe's Home Improvement
|
Retail
|
2 | 128,997 | 2.3 | % | 1,764,000 | 6.04 | 2.4 | % | ||||||||||||||||
|
Ross Stores
|
Retail
|
5 | 147,648 | 2.6 | % | 1,681,504 | 11.39 | 2.3 | % | ||||||||||||||||
|
State of Indiana
|
Commercial
|
3 | 210,393 | 3.7 | % | 1,635,911 | 7.78 | 2.2 | % | ||||||||||||||||
|
Marsh Supermarkets
|
Retail
|
2 | 124,902 | 2.2 | % | 1,605,139 | 12.85 | 2.2 | % | ||||||||||||||||
|
Dick's Sporting Goods
|
Retail
|
3 | 171,737 | 3.0 | % | 1,404,508 | 8.18 | 1.9 | % | ||||||||||||||||
|
Indiana Supreme Court
|
Commercial
|
1 | 75,488 | 1.3 | % | 1,339,164 | 17.74 | 1.8 | % | ||||||||||||||||
|
Staples
|
Retail
|
4 | 89,797 | 1.6 | % | 1,226,835 | 13.66 | 1.7 | % | ||||||||||||||||
|
HEB Grocery Company
|
Retail
|
1 | 105,000 | 1.9 | % | 1,155,000 | 11.00 | 1.6 | % | ||||||||||||||||
|
Toys “R” Us
|
Retail
|
2 | 80,600 | 1.4 | % | 1,095,050 | 13.59 | 1.5 | % | ||||||||||||||||
|
Office Depot
|
Retail
|
4 | 103,402 | 1.8 | % | 1,069,504 | 10.34 | 1.4 | % | ||||||||||||||||
|
Best Buy
|
Retail
|
2 | 75,045 | 1.3 | % | 934,493 | 12.45 | 1.3 | % | ||||||||||||||||
|
Kmart
|
Retail
|
1 | 110,875 | 2.0 | % | 850,379 | 7.67 | 1.1 | % | ||||||||||||||||
|
LA Fitness
|
Retail
|
1 | 45,000 | 0.8 | % | 843,750 | 18.75 | 1.1 | % | ||||||||||||||||
|
TJX Companies
|
Retail
|
3 | 88,550 | 1.6 | % | 818,313 | 9.24 | 1.1 | % | ||||||||||||||||
|
Michaels
|
Retail
|
3 | 68,989 | 1.2 | % | 792,515 | 11.49 | 1.1 | % | ||||||||||||||||
|
Dominick's
|
Retail
|
1 | 65,977 | 1.2 | % | 775,230 | 11.75 | 1.0 | % | ||||||||||||||||
|
City Securities Corporation
|
Commercial
|
1 | 38,810 | 0.7 | % | 771,155 | 19.87 | 1.0 | % | ||||||||||||||||
|
A & P
|
Retail
|
1 | 58,732 | 1.0 | % | 763,516 | 13.00 | 1.0 | % | ||||||||||||||||
|
Mattress Firm
|
Retail
|
1 | 29,255 | 0.5 | % | 719,094 | 24.58 | 1.0 | % | ||||||||||||||||
|
Petco
|
Retail
|
3 | 40,778 | 0.7 | % | 595,945 | 14.61 | 0.8 | % | ||||||||||||||||
|
Beall's
|
Retail
|
2 | 79,611 | 1.4 | % | 588,000 | 7.39 | 0.8 | % | ||||||||||||||||
|
Landmark Theatres
|
Retail
|
1 | 43,050 | 0.8 | % | 573,504 | 13.32 | 0.8 | % | ||||||||||||||||
|
TOTAL
|
2,587,659 | 45.7 | % | $ | 29,214,916 | $ | 10.61 | 39.5 | % | ||||||||||||||||
|
____________________
|
|
|
1
|
Annualized base rent represents the monthly contractual rent for December 2010 for each applicable tenant multiplied by 12.
|
|
2
|
Excludes the estimated size of the structures located on land owned by the Company and ground leased to tenants.
|
|
3
|
Annualized base rent per square foot is adjusted to account for the estimated square footage attributed to structures on land owned by the Company and ground leased to tenants.
|
29
Geographic Information
The Company owns 53 operating retail properties, totaling approximately 5.1 million of owned square feet in nine states. As of December 31, 2010, the Company owned interests in four operating commercial properties, totaling approximately 0.6 million square feet of net rentable area,. All of these commercial properties are located in the state of Indiana. The following table summarizes the Company’s operating properties by state as of December 31, 2010:
|
Number of Operating Properties1
|
Owned GLA/NRA2
|
Percent of Owned GLA/NRA
|
Total
Number of
Leases
|
Annualized
Base Rent3
|
Percent of
Annualized
Base Rent
|
Annualized
Base Rent per
Leased Sq. Ft.
|
|||||
|
Indiana
|
25
|
2,354,799
|
41.2%
|
243
|
$
|
27,905,136
|
41.1%
|
$
|
12.82
|
||
|
· Retail
|
21
|
1,773,419
|
31.0%
|
225
|
20,557,254
|
30.3%
|
12.65
|
||||
|
· Commercial
|
4
|
581,380
|
10.2%
|
18
|
7,347,882
|
10.8%
|
13.33
|
||||
|
Florida
|
12
|
1,223,047
|
21.4%
|
152
|
14,068,927
|
20.7%
|
12.53
|
||||
|
Texas
|
7
|
1,099,480
|
19.2%
|
80
|
11,956,978
|
17.6%
|
11.64
|
||||
|
Georgia
|
3
|
300,116
|
5.3%
|
58
|
4,119,884
|
6.1%
|
14.66
|
||||
|
Washington
|
3
|
126,496
|
2.2%
|
19
|
2,730,418
|
4.0%
|
23.31
|
||||
|
Ohio
|
1
|
236,230
|
4.1%
|
7
|
2,130,416
|
3.1%
|
9.02
|
||||
|
Illinois
|
3
|
227,830
|
4.0%
|
17
|
2,918,677
|
4.3%
|
14.26
|
||||
|
New Jersey
|
1
|
115,063
|
2.0%
|
13
|
1,549,071
|
2.3%
|
16.56
|
||||
|
Oregon
|
2
|
31,169
|
0.6%
|
13
|
538,539
|
0.8%
|
23.28
|
||||
|
57
|
5,714,230
|
100.0%
|
602
|
$
|
67,918,046
|
100.0%
|
$
|
12.86
|
|||
|
____________________
|
|
|
1
|
This table includes operating retail properties, operating commercial properties, and ground lease tenants who commenced paying rent as of December 31, 2010.
|
|
2
|
Owned GLA/NRA represents gross leasable area or net leasable area owned by the Company. It does not include 29 parcels or outlots owned by the Company and ground leased to tenants, which contain 18 non-owned structures totaling approximately 357,104 square feet. It also excludes the square footage of Union Station Parking Garage.
|
|
3
|
Annualized Base Rent excludes $2,962,906 in annualized ground lease revenue attributable to parcels and outlots owned by the Company and ground leased to tenants.
|
Lease Expirations
In 2011, leases representing 7.5% of total annualized base rent and 7.1% of total GLA/NRA expire. The following tables show scheduled lease expirations for retail and commercial tenants and in-process and redevelopment property tenants open for business as of December 31, 2010, assuming none of the tenants exercise renewal options. The tables include tenants open for business at operating retail and commercial properties as of December 31, 2010.
LEASE EXPIRATION TABLE – OPERATING PORTFOLIO1
|
Number of Expiring Leases1
|
Expiring GLA/NRA2
|
% of Total GLA/NRA Expiring
|
Expiring Annualized Base Rent3
|
% of Total Annualized Base Rent
|
Expiring Annualized Base Rent per Sq. Ft.
|
Expiring Ground Lease Revenue
|
|||||||||||
|
2011
|
100
|
397,456
|
7.1%
|
$
|
5,431,745
|
7.5%
|
$
|
13.67
|
$
|
0
|
|||||||
|
2012
|
101
|
395,298
|
7.0%
|
6,334,586
|
8.8%
|
16.02
|
0
|
||||||||||
|
2013
|
77
|
541,444
|
9.6%
|
6,480,454
|
9.0%
|
11.97
|
0
|
||||||||||
|
2014
|
79
|
565,321
|
10.1%
|
7,571,118
|
10.5%
|
13.39
|
340,475
|
||||||||||
|
2015
|
93
|
739,573
|
13.2%
|
9,908,321
|
13.8%
|
13.40
|
198,650
|
||||||||||
|
2016
|
53
|
592,918
|
10.6%
|
4,824,389
|
6.7%
|
8.14
|
0
|
||||||||||
|
2017
|
28
|
414,614
|
7.4%
|
5,953,424
|
8.3%
|
14.36
|
266,300
|
||||||||||
|
2018
|
25
|
354,984
|
6.3%
|
4,847,673
|
6.7%
|
13.66
|
128,820
|
||||||||||
|
2019
|
17
|
191,139
|
3.4%
|
2,916,397
|
4.1%
|
15.26
|
33,000
|
||||||||||
|
2020
|
25
|
456,350
|
8.1%
|
4,939,110
|
6.9%
|
10.82
|
156,852
|
||||||||||
|
Beyond
|
42
|
967,983
|
17.2%
|
12,829,232
|
17.7%
|
13.25
|
1,838,809
|
||||||||||
|
640
|
5,617,080
|
100.0%
|
$
|
72,036,449
|
100.0%
|
$
|
12.82
|
$
|
2,962,906
|
||||||||
30
LEASE EXPIRATION TABLE – OPERATING PORTFOLIO (continued)
|
____________________
|
|
|
1
|
Lease expiration table reflects rents in place as of December 31, 2010, and does not include option periods; 2011 expirations include 17 month-to-month tenants. This column also excludes ground leases.
|
|
2
|
Expiring GLA excludes estimated square footage attributable to non-owned structures on land owned by the Company and ground leased to tenants.
|
|
3
|
Annualized base rent represents the monthly contractual rent for December 2010 for each applicable tenant multiplied by 12. Excludes ground lease revenue.
|
LEASE EXPIRATION TABLE – RETAIL ANCHOR TENANTS1
|
Number of Expiring Leases2
|
Expiring GLA/NRA3
|
% of Total GLA/NRA Expiring5
|
Expiring Annualized Base Rent4
|
% of Total Annualized Base Rent5
|
Expiring Annualized Base Rent per Sq. Ft.
|
Expiring Ground Lease Revenue
|
|||||||||||
|
2011
|
6
|
179,074
|
3.2%
|
$
|
1,400,772
|
1.9%
|
$
|
7.82
|
$
|
0
|
|||||||
|
2012
|
8
|
155,256
|
2.8%
|
1,403,082
|
2.0%
|
9.04
|
0
|
||||||||||
|
2013
|
4
|
254,062
|
4.5%
|
1,229,611
|
1.7%
|
4.84
|
0
|
||||||||||
|
2014
|
9
|
236,834
|
4.2%
|
2,355,657
|
3.3%
|
9.95
|
0
|
||||||||||
|
2015
|
18
|
500,359
|
8.9%
|
5,003,195
|
7.0%
|
10.00
|
0
|
||||||||||
|
2016
|
8
|
448,624
|
8.0%
|
2,156,822
|
3.0%
|
4.81
|
0
|
||||||||||
|
2017
|
11
|
277,112
|
4.9%
|
3,387,644
|
4.7%
|
12.22
|
0
|
||||||||||
|
2018
|
8
|
300,576
|
5.4%
|
3,580,504
|
5.0%
|
11.91
|
0
|
||||||||||
|
2019
|
6
|
150,989
|
2.7%
|
2,070,625
|
2.9%
|
13.71
|
0
|
||||||||||
|
2020
|
11
|
406,300
|
7.2%
|
3,671,329
|
5.1%
|
9.04
|
0
|
||||||||||
|
Beyond
|
20
|
804,179
|
14.3%
|
9,937,584
|
13.7%
|
12.36
|
990,000
|
||||||||||
|
109
|
3,713,365
|
66.1%
|
$
|
36,196,825
|
50.3%
|
$
|
9.75
|
$
|
990,000
|
||||||||
|
____________________
|
|
|
1
|
Retail anchor tenants are defined as tenants that occupy 10,000 square feet or more.
|
|
2
|
Lease expiration table reflects rents in place as of December 31, 2010, and does not include option periods; 2011 expirations include one month-to-month tenant. This column also excludes ground leases.
|
|
3
|
Expiring GLA excludes square footage for non-owned ground lease structures on land we own and ground leased to tenants.
|
|
4
|
Annualized base rent represents the monthly contractual rent for December 2010 for each applicable property multiplied by 12. Excludes ground lease revenue.
|
|
5
|
Percentage is percentage of base rent from all retail and commercial tenants
|
LEASE EXPIRATION TABLE – RETAIL SHOPS
|
Number of Expiring Leases1
|
Expiring GLA/NRA1,2
|
% of Total GLA/NRA Expiring4
|
Expiring Annualized Base Rent3
|
% of Total Annualized Base Rent4
|
Expiring Annualized Base Rent per Sq. Ft.
|
Expiring Ground Lease Revenue
|
|||||||||||
|
2011
|
93
|
201,344
|
3.6%
|
$
|
3,732,798
|
5.2%
|
$
|
18.54
|
$
|
0
|
|||||||
|
2012
|
92
|
230,524
|
4.1%
|
4,769,698
|
6.6%
|
20.69
|
0
|
||||||||||
|
2013
|
68
|
152,943
|
2.7%
|
3,525,834
|
4.9%
|
23.05
|
0
|
||||||||||
|
2014
|
67
|
165,799
|
3.0%
|
3,634,004
|
5.0%
|
21.92
|
340,475
|
||||||||||
|
2015
|
74
|
194,113
|
3.5%
|
4,125,619
|
5.7%
|
21.25
|
198,650
|
||||||||||
|
2016
|
45
|
144,294
|
2.6%
|
2,667,568
|
3.7%
|
18.49
|
0
|
||||||||||
|
2017
|
15
|
58,264
|
1.0%
|
1,159,297
|
1.6%
|
19.90
|
266,300
|
||||||||||
|
2018
|
16
|
47,369
|
0.8%
|
1,140,462
|
1.6%
|
24.08
|
128,820
|
||||||||||
|
2019
|
11
|
40,150
|
0.7%
|
845,772
|
1.2%
|
21.07
|
33,000
|
||||||||||
|
2020
|
14
|
50,050
|
0.9%
|
1,267,780
|
1.8%
|
25.33
|
156,852
|
||||||||||
|
Beyond
|
18
|
67,509
|
1.2%
|
1,622,909
|
2.2%
|
24.04
|
848,809
|
||||||||||
|
513
|
1,352,359
|
24.1%
|
$
|
28,491,741
|
39.5%
|
$
|
21.07
|
$
|
1,972,906
|
||||||||
31
LEASE EXPIRATION TABLE – RETAIL SHOPS (continued)
|
____________________
|
|
|
1
|
Lease expiration table reflects rents in place as of December 31, 2010, and does not include option periods; 2010 expirations include 16 month-to-month tenants. This column also excludes ground leases.
|
|
2
|
Expiring GLA excludes estimated square footage to non-owned structures on land we own and ground leased to tenants.
|
|
3
|
Annualized base rent represents the monthly contractual rent for December 2010 for each applicable property multiplied by 12. Excludes ground lease revenue.
|
|
4
|
Percentage is percentage of base rent from all retail and commercial tenants.
|
LEASE EXPIRATION TABLE – COMMERCIAL TENANTS
|
Number of Expiring Leases1
|
Expiring GLA/NLA1
|
% of Total GLA/NRA Expiring3
|
Expiring Annualized Base Rent2
|
% of Total Annualized Base Rent3
|
Expiring Annualized Base Rent per Sq. Ft.
|
|||||||||
|
2011
|
1
|
17,038
|
0.3%
|
$
|
298,176
|
0.4%
|
$
|
17.50
|
||||||
|
2012
|
1
|
9,518
|
0.2%
|
161,806
|
0.2%
|
17.00
|
||||||||
|
2013
|
5
|
134,439
|
2.4%
|
1,725,009
|
2.4%
|
12.83
|
||||||||
|
2014
|
3
|
162,688
|
2.9%
|
1,581,457
|
2.2%
|
9.72
|
||||||||
|
2015
|
1
|
45,101
|
0.8%
|
779,507
|
1.1%
|
17.28
|
||||||||
|
2016
|
0
|
0
|
0.0%
|
0
|
0.0%
|
0.00
|
||||||||
|
2017
|
2
|
79,238
|
1.4%
|
1,406,484
|
2.0%
|
17.75
|
||||||||
|
2018
|
1
|
7,039
|
0.1%
|
126,708
|
0.2%
|
18.00
|
||||||||
|
2019
|
0
|
0
|
0.0%
|
0
|
0.0%
|
0.00
|
||||||||
|
2020
|
0
|
0
|
0.0%
|
0
|
0.0%
|
0.00
|
||||||||
|
Beyond
|
4
|
96,295
|
1.7%
|
1,268,736
|
1.7%
|
13.18
|
||||||||
|
18
|
551,356
|
9.8%
|
$
|
7,347,883
|
10.2%
|
$
|
13.33
|
|||||||
|
____________________
|
|
|
1
|
Lease expiration table reflects rents in place as of December 31, 2010, and does not include option periods. This column also excludes ground leases.
|
|
2
|
Annualized base rent represents the monthly contractual rent for December 2010 for each applicable property multiplied by 12.
|
|
3
|
Percentage is percentage of base rent from all retail and commercial tenants.
|
ITEM 3. LEGAL PROCEEDINGS
We are a party to various legal proceedings, which arise in the ordinary course of business. We are not currently involved in any litigation nor, to our knowledge, is any litigation threatened against us the outcome of which would, in our judgment based on information currently available to us, have a material adverse effect on our consolidated financial position or consolidated results of operations.
ITEM 4. RESERVED
32
PART II
ITEM 5. MARKET FOR REGISTRANT’S COMMON EQUITY, RELATED SHAREHOLDER MATTERS AND ISSUER PURCHASES OF EQUITY SECURITIES
Market Information
Our common shares are currently listed and traded on the New York Stock Exchange (“NYSE”) under the symbol “KRG”. On February 28, 2011, the last reported sales price of our common shares on the NYSE was $5.61.
The following table sets forth, for the periods indicated, the high and low sales prices and the closing prices for our common shares:
|
High
|
Low
|
Closing
|
||||||||||
|
Quarter Ended December 31, 2010
|
$ | 5.65 | $ | 4.32 | $ | 5.41 | ||||||
|
Quarter Ended September 30, 2010
|
$ | 5.04 | $ | 3.75 | $ | 4.44 | ||||||
|
Quarter Ended June 30, 2010
|
$ | 5.97 | $ | 4.01 | $ | 4.18 | ||||||
|
Quarter Ended March 31, 2010
|
$ | 5.23 | $ | 3.24 | $ | 4.73 | ||||||
|
Quarter Ended December 31, 2009
|
$ | 4.40 | $ | 2.95 | $ | 4.07 | ||||||
|
Quarter Ended September 30, 2009
|
$ | 4.28 | $ | 2.60 | $ | 4.17 | ||||||
|
Quarter Ended June 30, 2009
|
$ | 4.77 | $ | 2.25 | $ | 2.92 | ||||||
|
Quarter Ended March 31, 2009
|
$ | 6.46 | $ | 2.03 | $ | 2.45 | ||||||
Holders
The number of registered holders of record of our common shares was 88 as of February 28, 2011. This total excludes beneficial or non-registered holders that held their shares through various brokerage firms.
Distributions
Our Board of Trustees declared the following cash distributions per share to our common shareholders for the periods indicated:
|
Quarter
|
Record Date
|
Distribution
Per Share
|
Payment Date
|
||||||
|
4th 2010
|
January 6, 2011
|
$
|
0.0600
|
January 13, 2011
|
|||||
|
3rd 2010
|
October 6, 2010
|
$
|
0.0600
|
October 13, 2010
|
|||||
|
2nd 2010
|
July 7, 2010
|
$
|
0.0600
|
July 14, 2010
|
|||||
|
1st 2010
|
April 7, 2010
|
$
|
0.0600
|
April 16, 2010
|
|||||
|
4th 2009
|
January 7, 2010
|
$
|
0.0600
|
January 18, 2010
|
|||||
|
3rd 2009
|
October 7, 2009
|
$
|
0.0600
|
October 16, 2009
|
|||||
|
2nd 2009
|
July 7, 2009
|
$
|
0.0600
|
July 17, 2009
|
|||||
|
1st 2009
|
April 7, 2009
|
$
|
0.1525
|
April 17, 2009
|
|||||
Our management and Board of Trustees will continue to evaluate our distribution policy on a quarterly basis as they monitor the capital markets and the impact of the economy on our operations. Future distributions will be declared and paid at the discretion of our Board of Trustees, and will depend upon a number of factors, including cash generated by operating activities, our financial condition, capital requirements, annual distribution requirements under the REIT provisions of the Internal Revenue Code of 1986, as amended, and such other factors as our Board of Trustees deem relevant.
Distributions by us to the extent of our current and accumulated earnings and profits for federal income tax purposes will be taxable to shareholders as either ordinary dividend income or capital gain income if so declared by us. Distributions in excess of earnings and profits generally will be treated as a non-taxable return of capital. These distributions, to the extent that they do not exceed the shareholder’s adjusted tax basis in its common shares, have the effect of deferring taxation until the sale of a shareholder’s common shares. To the extent that distributions are both in excess of earnings and profits and in excess of the shareholder’s adjusted tax basis in its common shares, the distribution will be treated as gain from the sale of common shares. In order to maintain our qualification as a REIT, we must make annual distributions to shareholders of at least 90% of our REIT taxable income and we must make distributions to shareholders equal to 100% of our net taxable income to eliminate federal income tax liability. Under certain circumstances, we could be required to make distributions in excess of cash available for distributions in order to meet such requirements. For the taxable year ended December 31, 2010, approximately 98% of our distributions to shareholders constituted a return of capital, and 2% constituted capital gains.
33
Under our unsecured revolving credit facility, we are permitted to make distributions to our shareholders that do not exceed 95% of our Funds From Operations (“FFO”) provided that no event of default exists. If an event of default exists, we may only make distributions sufficient to maintain our REIT status. However, we may not make any distributions if any event of default resulting from nonpayment or bankruptcy exists, or if our obligations under the unsecured revolving credit facility are accelerated.
Issuer Repurchases; Unregistered Sales of Securities
We did not repurchase any of our common shares or sell any unregistered securities during the period covered by this report.
Performance Graph
Notwithstanding anything to the contrary set forth in any of our filings under the Securities Act of 1933, as amended, or the Securities Exchange Act of 1934, as amended, that might incorporate Securities and Exchange Commission filings, in whole or in part, the following performance graph will not be incorporated by reference into any such filings.
The following graph compares the cumulative total shareholder return of our common shares for the period from December 31, 2005 to December 31, 2010, to the S&P 500 Index and to the published NAREIT All Equity REIT Index over the same period. The graph assumes that the value of the investment in our common shares and each index was $100 at December 31, 2005 and that all cash distributions were reinvested. The shareholder return shown on the graph below is not indicative of future performance.
34
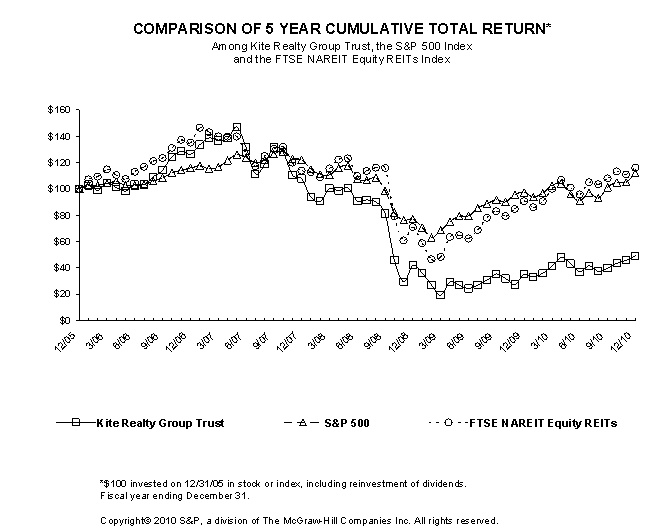
| 12/05 | 6/06 | 12/06 | 6/07 | 12/07 | 6/08 | 12/08 | 6/09 | 12/09 | 6/10 | 12/10 | ||||||||||||||||||||||||||||||||||
|
Kite Realty Group Trust
|
100.00 | 103.26 | 126.27 | 131.58 | 107.86 | 90.75 | 41.86 | 24.19 | 34.99 | 36.90 | 49.13 | |||||||||||||||||||||||||||||||||
|
S&P 500
|
100.00 | 102.71 | 115.80 | 123.85 | 122.16 | 107.60 | 76.96 | 79.40 | 97.33 | 90.85 | 111.99 | |||||||||||||||||||||||||||||||||
|
FTSE NAREIT Equity REITs
|
100.00 | 112.92 | 135.06 | 127.11 | 113.87 | 109.77 | 70.91 | 62.25 | 90.76 | 95.80 | 116.12 |
35
ITEM 6. SELECTED FINANCIAL DATA
The following tables set forth, on a historical basis, selected financial and operating information. The financial information has been derived from our consolidated balance sheets and statements of operations. This information should be read in conjunction with our audited consolidated financial statements and Item 7, “Management’s Discussion and Analysis of Financial Condition and Results of Operations” appearing elsewhere in this Annual Report on Form 10-K.
|
Year Ended December 31
|
||||||||||||||||
|
2010
|
20091
|
20081,2
|
20071,2,3
|
20061,2,3
|
||||||||||||
|
($ in thousands, except share and per share data)
|
||||||||||||||||
|
Operating Data:
|
||||||||||||||||
|
Revenues:
|
||||||||||||||||
|
Rental related revenue
|
$
|
94,568
|
$
|
95,841
|
$
|
102,960
|
$
|
95,604
|
$
|
85,651
|
||||||
|
Construction and service fee revenue
|
6,848
|
19,451
|
39,103
|
37,260
|
41,447
|
|||||||||||
|
Total revenue
|
101,416
|
115,292
|
142,063
|
132,864
|
127,098
|
|||||||||||
|
Expenses:
|
||||||||||||||||
|
Property operating
|
17,692
|
18,189
|
16,388
|
14,171
|
12,687
|
|||||||||||
|
Real estate taxes
|
12,045
|
12,069
|
11,865
|
11,066
|
10,687
|
|||||||||||
|
Cost of construction and services
|
6,142
|
17,192
|
33,788
|
32,077
|
35,901
|
|||||||||||
|
General, administrative, and other
|
5,372
|
5,712
|
5,880
|
6,285
|
5,323
|
|||||||||||
|
Depreciation and amortization
|
40,732
|
32,148
|
34,893
|
29,731
|
28,578
|
|||||||||||
|
Total expenses
|
81,983
|
85,310
|
102,814
|
93,330
|
93,176
|
|||||||||||
|
Operating income
|
19,433
|
29,982
|
39,249
|
39,534
|
33,922
|
|||||||||||
|
Interest expense
|
(28,532
|
)
|
(27,151
|
)
|
(29,372
|
)
|
(25,965
|
)
|
(21,222
|
)
|
||||||
|
Income tax (expense) benefit of taxable REIT subsidiary
|
(266
|
)
|
22
|
(1,928
|
)
|
(762
|
)
|
(965
|
)
|
|||||||
|
(Loss) income from unconsolidated entities
|
(52
|
)
|
226
|
843
|
291
|
286
|
||||||||||
|
Non-cash gain from consolidation of subsidiary
|
—
|
1,635
|
—
|
—
|
—
|
|||||||||||
|
Gain on sale of unconsolidated property
|
—
|
—
|
1,233
|
—
|
—
|
|||||||||||
|
Loss on sale of asset
|
—
|
—
|
—
|
—
|
(764
|
)
|
||||||||||
|
Other income, net
|
231
|
225
|
158
|
778
|
345
|
|||||||||||
|
(Loss) income from continuing operations
|
(9,186
|
) )
|
4,939
|
10,183
|
13,876
|
11,602
|
||||||||||
|
Discontinued operations:
|
||||||||||||||||
|
Discontinued operations
|
—
|
(732
|
)
|
331
|
2,079
|
1,685
|
||||||||||
|
Non-cash loss on impairment of discontinued operation
|
—
|
(5,385
|
)
|
—
|
—
|
—
|
||||||||||
|
(Loss) gain on sale of operating property
|
—
|
—
|
(2,690
|
)
|
2,036
|
—
|
||||||||||
|
(Loss) income from discontinued operations
|
—
|
(6,117
|
)
|
(2,359
|
)
|
4,115
|
1,685
|
|||||||||
|
Consolidated net (loss) income
|
(9,186
|
)
|
(1,178
|
)
|
7,824
|
17,991
|
13,287
|
|||||||||
|
Net (loss) income attributable to noncontrolling interests
|
915
|
(604
|
)
|
(1,731
|
)
|
(4,468
|
)
|
(3,107
|
)
|
|||||||
|
Net (loss) income attributable to Kite Realty Group Trust
|
(8,271
|
)
|
(1,782
|
)
|
6,093
|
13,523
|
10,180
|
|||||||||
|
Dividends on preferred shares
|
(377
|
)
|
—
|
—
|
—
|
—
|
||||||||||
|
Net (loss) income attributable to common shareholders
|
$
|
(8,648
|
)
|
$
|
(1,782
|
)
|
$
|
6,093
|
$
|
13,523
|
$
|
10,180
|
||||
|
(Loss) income per common share – basic:
|
||||||||||||||||
|
(Loss) income from continuing operations attributable to Kite Realty Group Trust common shareholders
|
$
|
(0.14
|
)
|
$
|
0.07
|
$
|
0.26
|
$
|
0.36
|
$
|
0.31
|
|||||
|
(Loss) income from discontinued operations attributable to Kite Realty Group Trust common shareholders
|
—
|
(0.10
|
)
|
(0.06
|
)
|
0.11
|
0.04
|
|||||||||
|
Net (loss) income attributable to Kite Realty Group Trust common shareholders
|
$
|
(0.14
|
)
|
$
|
(0.03
|
)
|
$
|
0.20
|
$
|
0.47
|
$
|
0.35
|
||||
|
(Loss) income per common share – diluted:
|
||||||||||||||||
|
(Loss) income from continuing operations attributable to Kite Realty Group Trust common shareholders
|
$
|
(0.14
|
)
|
$
|
0.07
|
$
|
0.26
|
$
|
0.35
|
$
|
0.31
|
|||||
|
(Loss) income from discontinued operations attributable to Kite Realty Group Trust common shareholders
|
—
|
(0.10
|
)
|
(0.06
|
)
|
0.11
|
0.04
|
|||||||||
|
Net (loss) income attributable to Kite Realty Group Trust common shareholders
|
$
|
(0.14
|
)
|
$
|
(0.03
|
)
|
$
|
0.20
|
$
|
0.46
|
$
|
0.35
|
||||
|
Weighted average Common Shares outstanding – basic
|
63,240,474
|
52,146,454
|
30,328,408
|
28,908,274
|
28,733,228
|
|||||||||||
|
Weighted average Common Shares outstanding – diluted
|
63,240,474
|
52,146,454
|
30,340,449
|
29,180,987
|
28,903,114
|
|||||||||||
|
Distributions declared per Common Share
|
$
|
0.2400
|
$
|
0.3325
|
$
|
0.8200
|
$
|
0.8000
|
$
|
0.7650
|
||||||
|
Net income attributable to Kite Realty Group Trust common shareholders:
|
||||||||||||||||
|
(Loss) income from continuing operations
|
$
|
(8,648
|
)
|
$
|
3,516
|
$
|
7,945
|
$
|
10,325
|
$
|
8,878
|
|||||
|
Discontinued operations
|
—
|
(5,298
|
)
|
(1,852
|
)
|
3,198
|
1,302
|
|||||||||
|
Net (loss) income attributable to Kite Realty Group Trust common shareholders
|
$
|
(8,648
|
)
|
$
|
(1,782
|
)
|
$
|
6,093
|
$
|
13,523
|
$
|
10,180
|
||||
36
|
1
|
In December 2009, we conveyed the title to our Galleria Plaza operating property to the ground lessor. We had determined during the third quarter of 2009 that there was no value to the improvements and intangibles related to Galleria Plaza and recognized a non-cash impairment charge of $5.4 million to write off the net book value of the property. Since we ceased operating this property during the fourth quarter of 2009, it was appropriate to reclassify the non-cash impairment loss and the operating results related to this property to discontinued operations for each of the fiscal years presented above.
|
|
2
|
In December 2008, we sold our Silver Glen Crossing operating property for net proceeds of $17.2 million and recognized a loss on the sale of $2.7 million. The loss on sale and operating results for this property have been reflected as discontinued operations for each of the fiscal years presented above. Amounts related to this particular property had not previously been reclassified for fiscal years 2007 or prior as they were not considered material to the financial statements. However, when considered together with the results of the Galleria Plaza property, it was determined that collectively the results of the properties which qualify as discontinued operations are material. Thus, all fiscal years reflect the presentation of discontinued operations.
|
|
3
|
In November 2007, we sold our 176th & Meridian property for net proceeds of $7.0 million and a gain of $2.0 million. 176th & Meridian was a development property that was added to the operating portfolio in the third quarter of 2004. The gain and the operating results related to this property have been reflected as discontinued operations for fiscal years ended December 31, 2007 and 2006.
|
|
Year Ended December 31
|
||||||||||||||||||||
|
2010
|
2009
|
2008
|
2007
|
2006
|
||||||||||||||||
|
($ in thousands)
|
||||||||||||||||||||
|
Balance Sheet Data:
|
||||||||||||||||||||
|
Investment properties, net
|
$ | 1,047,849 | $ | 1,044,799 | $ | 1,035,454 | $ | 965,583 | $ | 892,625 | ||||||||||
|
Cash and cash equivalents
|
$ | 15,395 | $ | 19,958 | $ | 9,918 | $ | 19,002 | $ | 23,953 | ||||||||||
|
Total assets
|
$ | 1,132,783 | $ | 1,140,685 | $ | 1,112,052 | $ | 1,048,235 | $ | 983,161 | ||||||||||
|
Mortgage and other indebtedness
|
$ | 610,927 | $ | 658,295 | $ | 677,661 | $ | 646,834 | $ | 566,976 | ||||||||||
|
Total liabilities
|
$ | 658,689 | $ | 710,929 | $ | 755,400 | $ | 709,369 | $ | 630,139 | ||||||||||
|
Redeemable noncontrolling interests in the Operating Partnership
|
$ | 44,115 | $ | 47,307 | $ | 67,277 | $ | 127,325 | $ | 156,457 | ||||||||||
|
Kite Realty Group Trust shareholders’ equity
|
$ | 423,065 | $ | 375,078 | $ | 284,958 | $ | 206,810 | $ | 192,269 | ||||||||||
|
Noncontrolling interests
|
$ | 6,914 | $ | 7,371 | $ | 4,417 | $ | 4,731 | $ | 4,296 | ||||||||||
|
Total liabilities and equity
|
$ | 1,132,783 | $ | 1,140,685 | $ | 1,112,052 | $ | 1,048,235 | $ | 983,161 | ||||||||||
ITEM 7. MANAGEMENT’S DISCUSSION AND ANALYSIS OF FINANCIAL CONDITION AND RESULTS OF OPERATIONS
The following discussion should be read in conjunction with the accompanying audited consolidated financial statements and related notes thereto and Item 1A, “Risk Factors,” appearing elsewhere in this Annual Report on Form 10-K. In this discussion, unless the context suggests otherwise, references to the “Company,” “we,” “us” and “our” mean Kite Realty Group Trust and its subsidiaries.
Overview
In the following overview, we discuss, among other things, the status of our business and properties, the effect that current United States economic conditions is having on our retail tenants and us, and the current state of the financial markets as pertaining to our debt maturities and our ability to secure financing.
Our Business and Properties
Kite Realty Group Trust, through its majority-owned subsidiary, Kite Realty Group, L.P., is engaged in the ownership, operation, management, leasing, acquisition, redevelopment, and development of neighborhood and community shopping centers and certain commercial real estate properties in selected markets in the United States. We derive revenues primarily from rents and reimbursement payments received from tenants under existing leases at each of our properties. We also derive revenues from providing management, leasing, real estate development, construction management and real estate advisory services through our taxable REIT subsidiary. Our operating results therefore depend materially on the ability of our tenants to make required rental payments, our ability to provide such services to third parties, conditions in the United States retail sector and overall real estate market conditions.
As of December 31, 2010, we owned interests in a portfolio of 53 operating retail properties totaling 8.0 million square feet of gross leasable area (including non-owned anchor space) and also owned interests in four operating commercial properties totaling 0.6 million square feet of net rentable area. Also, as of December 31, 2010, we had an interest in six properties in our development and redevelopment pipelines. Upon completion, we anticipate our development and redevelopment properties will have 0.9 million square feet of total gross leasable area (including non-owned anchor space).
37
Finally, as of December 31, 2010, we also owned interests in other land parcels comprising 93 acres that we expect to be used for future expansion of existing properties, development of new retail or commercial properties or we may elect to sell such parcels under certain circumstances. These land parcels are classified as “Land held for development” in the accompanying consolidated balance sheets.
Current Economic Conditions and Impact on Our Retail Tenants
The difficult economic conditions for the United States economy, businesses, consumers, housing and credit markets continued throughout 2010. These difficult conditions had a negative impact on consumer spending during 2010. Factors contributing to a decline in consumer spending at stores owned and/or operated by our retail tenants include, among others:
|
·
|
Shortage or Unavailability of Financing: In the U.S., economic and market conditions have begun to stabilize. Credit conditions have continued to improve from the prior year with increased access and availability to secured mortgage debt and the unsecured bond and equity markets. Lending institutions continue to maintain tight credit standards for individual and small business lending, making it difficult for individuals and local retailers (including our tenants) to obtain financing. The shortage of financing has caused, among other things, consumers to have less disposable income available for retail spending. The shortage of financing has also made it difficult for some of our tenants to obtain capital to operate their businesses.
|
|
·
|
Decreased Home Values and Increased Home Foreclosures: U.S. home values have decreased sharply over the last few years, and difficult economic conditions have also contributed to a record number of home foreclosures. The U.S. continues to experience historically high levels of delinquencies and foreclosures.
|
|
·
|
Continued High Unemployment Rates: The U.S. unemployment rate was 9.4% in December 2010 and continues to be higher than historical levels. Continued high unemployment rates could cause further decreases in consumer spending, thereby negatively affecting the businesses of our retail tenants. We continue to focus on markets where household income within a 5 mile radius of our properties is higher than statewide levels. As an example, the average household income within a 5 mile radius of our Indiana properties is approximately $92,000 compared to a statewide average of approximately $63,000.
|
|
·
|
Lower Consumer Confidence: Since 2008, consumer confidence continues to be at low levels, leading to consumers spending less money on discretionary purchases. The continued high level in both personal and business bankruptcies during 2009 and 2010 reflect an economy that continues to be challenged, with financially over-extended consumers less likely to purchase goods and/or services from our retail tenants.
|
During most of 2010, job growth and consumer spending continued to remain at low levels. Consumer spending and job growth improved during the fourth quarter of 2010; however, it is unclear if these improvements will continue, level off or reverse themselves. Lower consumer spending has a negative impact on the businesses of our retail tenants. As discussed below, these conditions in turn had a negative impact on our business. While we did experience an increase in leasing activity in the 2010 as compared to 2009, to the extent these conditions persist or deteriorate further, our tenants may be required to curtail or cease their operations, which could materially and negatively affect our business in general and our cash flow in particular.
Impact of Economy on REITs, Including Us
As an owner and developer of community and neighborhood shopping centers, our operating and financial performance is directly affected by economic conditions in the retail sector of those markets in which our operating centers and development properties are located, including the states of Indiana, Florida and Texas, where the majority of our operating properties are located, and in North Carolina, where a significant portion of our development projects are located. As discussed above, due to the challenges facing U.S. consumers, the operations of many of our retail tenants were negatively affected in 2010. In turn, this has a negative impact on our business, including the following:
|
·
|
Difficulty in Collecting Rent; Rent Adjustments. When consumers spend less, our tenants typically experience decreased revenues and cash flows. This makes it more difficult for some of our tenants to pay their rent obligations, which is the primary source of our revenues. Our tenants’ decreased cash flows may be even more pronounced if, given the tight credit markets, they are unable to obtain financing to operate their businesses. The number of tenants requesting decreases or deferrals in their rent obligations declined in 2010 in comparison to 2009; however, there can be no assurance that this trend will continue. If granted, such decreases or deferrals negatively affect our cash flows.
|
38
|
·
|
Termination of Leases. If our tenants continue to struggle to meet their rental obligations, they may be forced to terminate their leases with us. During 2010, tenants at some of our properties terminated their leases with us. In some cases, we were able to secure replacement tenants at rental rates comparable to the rates of the terminated tenants. Also, in some cases we were able to negotiate lease termination fees from these tenants, but in most cases our negotiations were unsuccessful.
|
|
·
|
Tenant Bankruptcies. The number of bankruptcies by U.S. businesses has decreased from the historically high levels experienced during 2009. While, we have seen a decrease over the past year in tenant bankruptcies, we have continued to experience bankruptcy levels higher than our historically normal levels, a trend which may continue into the foreseeable future. A&P, which leases 59,000 square feet at Ridge Plaza in New Jersey and accounts for 1.0% of annualized base rent, has filed for bankruptcy. As of February 28, 2011, the tenant was current on its rent payments and is currently not on the list of stores slated for closure.
|
|
·
|
Decrease in Demand for Retail Space. Demand for retail space at our shopping centers improved somewhat in 2010, most notably from national and regional retailers. Demand from local, small shop merchants has remained soft, reflecting the difficulty such potential tenants have securing financing for working capital and expansion plans. While our leasing activity and overall leased percentage of our retail shopping centers increased in 2010, overall demand for retail space may not continue and may decline in the future until financial markets, consumer confidence, and the economy stabilize for an extended period of time.
|
The factors discussed above, among others, had a negative impact on our business during 2010. We believe it is possible that some of these conditions may continue into the foreseeable future.
Financing Strategy; 2011 and 2012 Debt Maturities
Our ability to obtain financing on satisfactory terms and to refinance borrowings as they mature has also been affected by the condition of the economy in general and by the ongoing instability of the financial markets in particular. As of March 1, 2011, we had refinanced or extended the maturity dates for $17 million of the $92 million of debt maturing in 2011. The remaining $75 million of our 2011 debt maturities consists of property-level debt, of which $46 million has maturity date extensions of one year, subject to certain customary conditions. With respect to the remaining $30 million, we are pursuing financing alternatives to enable us to repay, refinance, or extend the maturity dates of these loans.
Based on our experience with property level debt over the last couple of years, we believe we will be able to satisfactorily address all of our 2011 debt maturities; however, we cannot provide assurances about our ability to do so. Failure to comply with our obligations under these various property-level loan agreements could cause an event of default, which, among other things, could result in the loss of title to assets securing such loans, the acceleration of principal and interest payments, termination of the debt facilities, or exposure to the risk of foreclosure.
Currently, $191 million of our consolidated indebtedness is scheduled to mature in 2012. In particular, our unsecured revolving credit facility, which had a balance of $122 million as of December 31, 2010, will mature on February 20, 2012. We have entered into a non-binding term sheet for an amended and restated unsecured revolving credit facility with a three year term and anticipate closing on this transaction in the first half of 2011.
We believe we have good relationships with a number of banks and other financial institutions that will allow us to continue our strategy of refinancing our borrowings with the existing lenders or replacement lenders. However, in this current environment, it is imperative that we identify alternative sources of financing and other capital in the event we are not able to refinance these loans on satisfactory terms, or at all. If we are not able to refinance or extend these loans, particularly our unsecured revolving credit facility, our financial condition and liquidity could be adversely impacted. It is also important for us to obtain additional financing in order to complete our development and redevelopment projects.
In 2010, we strengthened our balance sheet by completing an offering of 2,800,000 shares of Series A Cumulative Redeemable Perpetual Preferred Shares at an offering price of $25.00 per share for aggregate gross and net proceeds of $70.0 million and $67.5 million, respectively. A portion of the net proceeds was used to retire our $55 million unsecured term loan, which had a maturity date of July 2011. The remaining net proceeds and borrowings on our unsecured revolving line of credit were used to retire the $18.3 million loan encumbering International Speedway Square in Daytona, Florida, which had a maturity date of March 11, 2011. In addition, we have available an Equity Distribution Agreement pursuant to which we may sell, from time to time, up to an aggregate amount of $25 million of our common shares. To date, we have not utilized this program. As of December 31, 2010, we had a combined $62 million of available liquidity in the form of cash and cash equivalents ($15 million) and availability under our unsecured revolving credit facility ($46 million).
39
In addition to raising new capital, we were also successful in extending the maturity dates or refinancing all of our loans originally maturing in 2010 and some of our loans maturing in 2011. For example in 2010, we extended the maturity date or refinanced the debt at three of our properties (South Elgin Commons, to September 2013; Cobblestone Plaza, to February 2013; and Rivers Edge, to January 2016). Further, in the first quarter of 2011, we extended the maturity dates on the debt at two other properties (Indiana State Motor Pool, to January 2014; and Parkside Town Commons, to February 2013). A schedule of our consolidated maturities (excluding regular principal payments) as of December 31, 2010 is set forth below:
|
Amount
|
||||
|
2010
|
$ | 81,565,647 | ||
|
2011
|
191,470,222 | |||
|
2012
|
75,308,320 | |||
|
2013
|
35,188,821 | |||
|
2014
|
41,841,534 | |||
|
Thereafter
|
185,005,157 | |||
| $ | 610,379,701 | |||
|
Unamortized Premiums
|
546,912 | |||
|
Total
|
$ | 610,926,613 | ||
We will continue to assess and engage in negotiations with existing and alternative lenders for our near-term maturing indebtedness, with a view toward extending, refinancing or repaying debt to strengthen our balance sheet.
Obtaining new financing is also important to our business due to the capital needs of our existing development and redevelopment projects. As of December 31, 2010, our unfunded share of the total estimated cost of the properties in our in-process development and redevelopment pipelines was approximately $36 million. While we believe we will have access to sufficient funding to be able to fund our investments in these projects through a combination of new and existing construction loans and draws on our unsecured revolving credit facility (which, as noted above, has $46 million of availability as of December 31, 2010), adverse market conditions may make it more costly and difficult to raise additional capital, if necessary.
Summary of Critical Accounting Policies and Estimates
Our significant accounting policies are more fully described in Note 2 to the accompanying consolidated financial statements. As disclosed in Note 2, the preparation of financial statements in accordance with U.S. generally accepted accounting principles requires management to make estimates and assumptions about future events that affect the amounts reported in the financial statements and accompanying notes. Actual results could differ from those estimates. We believe that the following discussion addresses our most critical accounting policies, which are those that are most important to the compilation of our financial condition and results of operations and require management’s most difficult, subjective, and complex judgments.
Capitalization of Certain Pre-Development and Development Costs
We incur costs prior to land acquisition and for certain land held for development, including acquisition contract deposits as well as legal, engineering and other external professional fees related to evaluating the feasibility of developing a shopping center or other project. These pre-development costs are capitalized and included in construction in progress in the accompanying consolidated balance sheets. If we determine that the completion of a development project is no longer probable, all previously incurred pre-development costs are immediately expensed.
We also capitalize costs such as construction, interest, real estate taxes, and salaries and related costs of personnel directly involved with the development of our properties. As a portion of the development property becomes operational, we expense appropriate costs on a pro rata basis.
Impairment of Investment Properties and Joint Ventures
Management reviews both operational and development projects, land parcels and intangible assets for impairment on at least a quarterly basis or whenever events or changes in circumstances indicate that the carrying value of investment properties may not be recoverable. The review for possible impairment requires management to make certain assumptions and estimates and requires significant judgment. Impairment losses for investment properties are measured when the undiscounted cash flows estimated to be generated by the investment properties during the expected holding period are less than the carrying amounts of those assets. Impairment losses are recorded as the excess of the carrying value over the estimated fair value of the asset. Our impairment review for land and development properties assumes we have the intent and the ability to complete the developments or projected uses for the land parcels. If we determine those plans will not be completed, an impairment loss may be appropriate. Management does not believe any investment properties or development assets were impaired as of December 31, 2010.
40
Operating properties held for sale include only those properties available for immediate sale in their present condition and for which management believes it is probable that a sale of the property will be completed within one year, amongst other factors. Operating properties are carried at the lower of cost or fair value less costs to sell. Depreciation and amortization are suspended during the held-for-sale period. The Company had no investment properties or development assets held for sale as of December 31, 2010.
Our operating properties have operations and cash flows that can be clearly distinguished from the rest of our activities. The operations reported in discontinued operations include those operating properties that were sold or were considered held-for-sale and for which operations and cash flows can be clearly distinguished. The operations from these properties are eliminated from ongoing operations, and we will not have a continuing involvement after disposition. When material, prior periods are reclassified to reflect the operations of these properties as discontinued operations.
We also review our investments in unconsolidated entities. When circumstances indicate there may have been a loss in value of an equity method investment, we evaluate the investment for impairment by estimating our ability to recover our investments from future expected cash flows. If we determine the loss in value is other than temporary, we will recognize an impairment charge to reflect the investment at fair value. The use of projected future cash flows and other estimates of fair value and the determination of when a loss is other than temporary are complex and subjective. Use of other estimates and assumptions may results in different conclusions. Changes in economic and operating conditions that occur subsequent to our review could impact these assumptions and result in future impairment charges of our equity investments.
Revenue Recognition
As lessor, we retain substantially all of the risks and benefits of ownership of the investment properties and account for our leases as operating leases.
Base minimum rents are recognized on a straight-line basis over the terms of the respective leases. Certain lease agreements contain provisions that grant additional rents based on a tenant’s sales volume (contingent percentage rent). Percentage rent is recognized when tenants achieve the specified targets as defined in their lease agreements. Percentage rent is included in other property related revenue in the accompanying statements of operations.
Reimbursements from tenants for real estate taxes and other operating expenses are recognized as revenue in the period the applicable expense is incurred.
Gains from sales of real estate are not recognized unless a sale has been consummated, the buyer’s initial and continuing investment is adequate to demonstrate a commitment to pay for the property, we have transferred to the buyer the usual risks and rewards of ownership, and we do not have a substantial continuing financial involvement in the property. As part of the Company’s ongoing business strategy, it will, from time to time, sell land parcels and outlots, some of which are ground leased to tenants.
Revenues from construction contracts are recognized on the percentage-of-completion method, measured by the percentage of cost incurred to date to the estimated total cost for each contract. Project costs include all direct labor, subcontract, and material costs and those indirect costs related to contract performance incurred to date. Project costs do not include uninstalled materials. Provisions for estimated losses on uncompleted contracts are made in the period in which such losses are determined. Changes in job performance, job conditions, and estimated profitability may result in revisions to costs and income, which are recognized in the period in which the revisions are determined.
Development fees and fees from advisory services are recognized as revenue in the period in which the services are rendered. Performance-based incentive fees are recorded when the fees are earned.
Fair Value Measurements
Fair value is a market-based measurement, not an entity-specific measurement. Therefore, a fair value measurement should be determined based on the assumptions that market participants would use in pricing the asset or liability. The fair value hierarchy distinguishes between market participant assumptions based on market data obtained from sources independent of the reporting entity (observable inputs for identical instruments that are classified within Level 1 and observable inputs for similar instruments that are classified within Level 2) and the reporting entity’s own assumptions about market participant assumptions (unobservable inputs classified within Level 3).
As further discussed in Note 10 to the accompanying consolidated financial statements, the only assets or liabilities that we record at fair value on a recurring basis are interest rate hedge agreements. The valuation is determined using widely accepted techniques including discounted cash flow analysis, which considers the contractual terms of the derivatives (including the period to maturity) and uses observable market-based inputs such as interest rate curves and implied volatilities. We also incorporate credit valuation adjustments to appropriately reflect both our own nonperformance risk and the respective counterparty’s nonperformance risk in the fair value measurements.
41
Income Taxes and REIT Compliance
We are considered a corporation for federal income tax purposes and qualify as a REIT. As such, we generally will not be subject to federal income tax to the extent we distribute our REIT taxable income to our shareholders and meet certain other requirements on a recurring basis. REITs are subject to a number of organizational and operational requirements. If we fail to qualify as a REIT in any taxable year, we will be subject to federal income tax on our taxable income at regular corporate rates. We may also be subject to certain federal, state and local taxes on our income and property and to federal income and excise taxes on our undistributed income even if we do qualify as a REIT. For example, we will be subject to income tax to the extent we distribute less than 90% of our REIT taxable income (including capital gains).
Results of Operations
At December 31, 2010, we owned interests in 57 operating properties (consisting of 53 retail properties and four operating commercial (office/industrial) properties) and six entities that held development or redevelopment properties in which we have an interest. These redevelopment properties included Bolton Plaza, Courthouse Shadows, Rivers Edge and Four Corner Square, all of which are undergoing redevelopment. Of the 63 total properties held at December 31, 2010, only a limited service hotel component of an operating property was owned through an unconsolidated joint venture and was accounted for under the equity method.
At December 31, 2009, we owned interests in 55 operating properties (consisting of 51 retail properties and four operating commercial properties) and seven entities that held development or redevelopment properties in which we have an interest. These redevelopment properties included Bolton Plaza, Coral Springs Plaza, Courthouse Shadows, Rivers Edge and Four Corner Square, all of which are undergoing redevelopment. Of the 62 total properties held at December 31, 2009, only a limited service hotel component of a development parcel was owned through an unconsolidated joint venture and was accounted for under the equity method.
At December 31, 2008, we owned interests in 56 operating properties (consisting of 52 retail properties and four operating commercial properties) and had eight entities that held development or redevelopment properties in which we have an interest. Of the 64 total properties held at December 31, 2008, one operating property was owned through an unconsolidated joint venture and was accounted for under the equity method.
The comparability of results of operations is affected by our development, redevelopment, and operating property acquisition and disposition activities in 2008 through 2010. Therefore, we believe it is most useful to review the comparisons of our results of operations for these years (as set forth below under “Comparison of Operating Results for the Years Ended December 31, 2010 and 2009” and “Comparison of Operating Results for the Years Ended December 31, 2009 and 2008”) in conjunction with the discussion of our development, redevelopment, and operating property acquisition and disposition activities during those periods, which is set forth directly below.
Development Activities
During the years ended December 31, 2010, 2009 and 2008, the following development properties became operational or partially operational:
|
Property Name
|
MSA
|
Economic Occupancy Date1
|
Owned GLA
|
||||
|
Eddy Street Commons, Phase I2
|
South Bend, IN
|
September 2009
|
169,921
|
||||
|
South Elgin Commons, Phase I2
|
Chicago, IL
|
June 2009
|
45,000
|
||||
|
Cobblestone Plaza2
|
Ft. Lauderdale, FL
|
March 2009
|
132,743
|
||||
|
54th & College
|
Indianapolis, IN
|
June 2008
|
N/A
|
3
|
|
1
|
Represents the date in which we started receiving rental payments under tenant leases or ground leases at the property or the tenant took possession of the property, whichever was sooner.
|
|
2
|
Construction of these properties was completed in phases. The Economic Occupancy Dates indicated for these properties refers to its initial phase.
|
|
3
|
Property is ground leased to a single tenant.
|
42
Property Acquisition Activities
During the year ended December 31, 2008, we acquired the property below. We did not acquire any properties during the years ending December 31, 2010 and 2009.
|
Property Name
|
MSA
|
Acquisition Date
|
Acquisition Cost
(Millions)
|
Financing
Method
|
Owned GLA
|
||||||
|
Rivers Edge1, 2
|
Indianapolis, IN
|
February 2008
|
$
|
18.3
|
Primarily Debt
|
110,875
|
|
1
|
This property was purchased with the intent to redevelop; therefore, it is included in our redevelopment pipeline, as discussed below. However, for purposes of the comparison of operating results, this property is classified as property acquired during 2008 in the comparison of operating results tables below.
|
|
2
|
Upon completion of redevelopment activities, the owned GLA is expected to be 152,285 square feet.
|
Operating Property Disposition Activities
During the year ended December 31, 2008, we sold the operating properties listed in the table below. We did not sell any operating properties in the years ended December 31, 2010 and 2009. However, in 2009, we determined that it was appropriate to write off the net book value on the Galleria Plaza operating property in Dallas, Texas and recognize a non-cash impairment charge of $5.4 million. The operating results of Galleria Plaza are reflected as discontinued operations in the accompanying consolidated statements of operations.
|
Property Name
|
MSA
|
Disposition Date
|
Owned GLA
|
|||
|
Spring Mill Medical, Phase I1
|
Indianapolis, IN
|
December 2008
|
63,431
|
|||
|
Silver Glen Crossing2
|
Chicago, IL
|
December 2008
|
132,716
|
|
____________________
|
|
|
1
|
We held a 50% interest in this unconsolidated joint venture. In December 2008, the joint venture sold this property for $17.5 million, resulting in a total gain on sale of $3.5 million. Net proceeds of $14.4 million from the sale of this property were utilized to defease the related mortgage loan. Our share of the gain on sale was $1.2 million, net of our excess investment. We used the majority of our share of the net proceeds to pay down borrowings under our unsecured revolving credit facility. Prior to the sale of this property, the joint venture sold a parcel of land for net proceeds of $1.1 million, of which our share was $0.6 million.
|
|
2
|
We realized net proceeds of $17.2 million from the sale of this property and recognized a loss on the sale of $2.7 million. The majority of the net proceeds from the sale of this property were used to pay down borrowings under our unsecured revolving credit facility. The sale of this property and the property’s operating results are reflected as discontinued operations in the accompanying consolidated statements of operations.
|
Redevelopment Activities
During the years ended December 31, 2010, 2009 and 2008, we transitioned the following properties from our operating portfolio to our redevelopment pipeline:
|
Property Name
|
MSA
|
Transition Date1
|
Owned GLA
|
|||
|
Coral Springs Plaza2
|
Boca Raton, FL
|
March 2009
|
45,906
|
|||
|
Courthouse Shadows3
|
Naples, FL
|
September 2008
|
134,867
|
|||
|
Four Corner Square4
|
Seattle, WA
|
September 2008
|
44,000
|
|||
|
Bolton Plaza5
|
Jacksonville, FL
|
June 2008
|
172,938
|
|||
|
Rivers Edge6
|
Indianapolis, IN
|
June 2008
|
152,285
|
|
1
|
Transition date represents the date the property was transitioned from our operating portfolio to our redevelopment pipeline.
|
|
2
|
In December 2009, we executed a lease with a combined Toys “R” Us/Babies “R” Us for 100% of the available square feet of this center. This tenant opened in the second half of 2010 and the property was transitioned back to the operating portfolio in November 2010.
|
|
3
|
In 2009, Publix purchased the lease of the former anchor tenant and made certain improvements on the space and we anticipate updating the existing façade, signage, landscaping and lighting.
|
|
4
|
In addition to the existing center, we also own approximately ten acres of adjacent land which may be utilized in the redevelopment. We anticipate a portion of the existing center will remain open during the redevelopment.
|
|
5
|
We executed a 66,500 square foot lease with Academy Sports & Outdoors to anchor this center and this tenant opened during the second half of 2010.
|
|
6
|
We purchased this property in February 2008 with the intent to redevelop. The existing anchor tenant’s lease at this property expired in March 2010. We executed leases with Nordstrom Rack, Buy Buy Baby, The Container Store, Arhaus Furniture and BGI Fitness to anchor this center and we expect these tenants to open during the second half of 2011 and first half of 2012.
|
43
Comparison of Operating Results for the Years Ended December 31, 2010 and 2009
The following table reflects income statement line items from our consolidated statements of operations for the years ended December 31, 2010 and 2009:
|
Year Ended December 31,
|
||||||||||||
|
2010
|
2009
|
Increase (Decrease) 2010 to 2009
|
||||||||||
|
Revenue:
|
||||||||||||
|
Rental income (including tenant reimbursements)
|
$ | 89,502,860 | $ | 89,775,606 | $ | (272,746 | ) | |||||
|
Other property related revenue
|
5,065,169 | 6,065,708 | (1,000,539 | ) | ||||||||
|
Construction and service fee revenue
|
6,848,073 | 19,450,789 | (12,602,716 | ) | ||||||||
|
Total revenue
|
101,416,102 | 115,292,103 | (13,876,001 | ) | ||||||||
|
Expenses:
|
||||||||||||
|
Property operating
|
17,691,738 | 18,188,710 | (496,972 | ) | ||||||||
|
Real estate taxes
|
12,044,966 | 12,068,903 | (23,937 | ) | ||||||||
|
Cost of construction and services
|
6,142,042 | 17,192,267 | (11,050,225 | ) | ||||||||
|
General, administrative, and other
|
5,372,056 | 5,711,623 | (339,567 | ) | ||||||||
|
Depreciation and amortization
|
40,732,228 | 32,148,318 | 8,583,910 | |||||||||
|
Total expenses
|
81,983,030 | 85,309,821 | (3,326,791 | ) | ||||||||
|
Operating income
|
19,433,072 | 29,982,282 | (10,549,210 | ) | ||||||||
|
Interest expense
|
(28,532,440 | ) | (27,151,054 | ) | (1,381,386 | ) | ||||||
|
Income tax (expense) benefit of taxable REIT subsidiary
|
(265,986 | ) | 22,293 | (288,279 | ) | |||||||
|
(Loss) income from unconsolidated entities
|
(51,964 | ) | 226,041 | (278,005 | ) | |||||||
|
Non-cash gain from consolidation of subsidiary
|
— | 1,634,876 | (1,634,876 | ) | ||||||||
|
Other income, net
|
231,178 | 224,927 | 6,251 | |||||||||
|
(Loss) income from continuing operations
|
(9,186,140 | ) | 4,939,365 | (14,125,505 | ) | |||||||
|
Discontinued operations:
|
||||||||||||
|
Discontinued operations
|
— | (732,621 | ) | 732,621 | ||||||||
|
Non-cash loss on impairment of discontinued operation
|
— | (5,384,747 | ) | 5,384,747 | ||||||||
|
Loss from discontinued operations
|
— | (6,117,368 | ) | 6,117,368 | ||||||||
|
Consolidated net loss
|
(9,186,140 | ) | (1,178,003 | ) | (8,008,137 | ) | ||||||
|
Net (loss) income attributable to noncontrolling interests
|
915,310 | (603,763 | ) | 1,519,073 | ||||||||
| Net Loss attributable to Kite Realty Group Trust | (8,270,830 | ) | (1,781,766 | ) | (6,489,064 | ) | ||||||
| Dividends on preferred shares | (376,979 | ) | — | (376,979 | ) | |||||||
|
Net loss attributable to common shareholders
|
$ | (8,647,809 | ) | $ | (1,781,766 | ) | $ | (6,866,043 | ) | |||
Rental income (including tenant reimbursements) decreased between years by $0.3 million, or 0.3%, due to the following:
44
|
Increase (Decrease) 2010 to 2009
|
||||
|
Development properties that became operational or were partially operational in 2009 and/or 2010
|
$ | 2,736,718 | ||
|
Consolidation of The Centre
|
916,490 | |||
|
Properties under redevelopment during 2009 and/or 2010
|
(610,082 | ) | ||
|
Properties fully operational during 2009 and 2010 & other
|
(3,315,872 | ) | ||
|
Total
|
$ | (272,746 | ) | |
Excluding the changes due to the consolidation of The Centre, transitioned development properties, and properties under redevelopment, the net $3.3 million decrease in rental income was primarily related to the following:
|
·
|
$1.6 million net decrease in real estate tax recoveries from tenants primarily due to decreased assessments at a number of our operating properties;
|
|
·
|
$0.8 million related to the net decrease in tenancy at these properties between periods.
|
|
·
|
$0.5 million decrease at two of our properties due to the bankruptcy of Circuit City; and
|
|
·
|
$0.4 million decrease from the 2009 sale of our Eagle Creek II asset.
|
For the overall portfolio, gross recovery ratio improved from 69.8% in 2009 to 71.8% in 2010, primarily because a portion of refunds received pursuant to real estate tax appeals were not refundable to tenants. Gross recovery ratio is computed by dividing tenant reimbursements by the sum of recoverable property operating expense and real estate tax expense.
Other property related revenue primarily consists of parking revenues, percentage rent, lease settlement income and gains from land sales. This revenue decreased $1.0 million, or 16%, primarily as a result of the following:
|
·
|
$0.8 million decrease in gains on land sales in 2010 compared to 2009; and
|
|
·
|
2009 reversal of a $0.4 million liability for which we are no longer obligated.
|
Offsetting these decreases was a $0.1 million increase in parking revenue primarily from our Eddy Street Commons property.
Construction and service fee revenue decreased between years by $12.6 million, or 65%, primarily as a result of a decline in third party construction contracts and construction management fees due to the economic downturn and our strategic decision to reduce third party construction activity.
Property operating expenses decreased between years by $0.5 million, or 2.7%, due to the following:
|
Increase (Decrease) 2010 to 2009
|
||||
|
Development properties that became operational or were partially operational in 2009 and/or 2010
|
$ | 1,177,328 | ||
|
Consolidation of The Centre
|
210,036 | |||
|
Properties under redevelopment during 2009 and/or 2010
|
(254,992 | ) | ||
|
Properties fully operational during 2009 and 2010 & other
|
(1,629,345 | ) | ||
|
Total
|
$ | (496,973 | ) | |
Excluding the changes due to the consolidation of The Centre, transitioned development properties, and properties under redevelopment, the net $1.6 million decrease in property operating expenses was primarily due to the following:
45
|
·
|
$0.5 million net decrease in bad debt expense at a number of our operating properties reflecting a general recovery in the economic condition of our tenants; and
|
|
·
|
Cost containment efforts producing a $1.3 million decrease in landscaping, repairs, maintenance, and insurance expenses, a portion of which is refundable to tenants and reflected as a reduction to tenant reimbursement revenue; offset by a $0.2 million net increase in various other operating expenses.
|
Real estate taxes decreased $24,000, or 0.2%, due to the following:
|
Increase (Decrease) 2010 to 2009
|
||||
|
Development properties that became operational or were partially operational in 2009 and/or 2010
|
$ | 1,103,785 | ||
|
Consolidation of The Centre
|
113,694 | |||
|
Properties under redevelopment during 2009 and/or 2010
|
(154,433 | ) | ||
|
Properties fully operational during 2009 and 2010 & other
|
(1,086,983 | ) | ||
|
Total
|
$ | (23,937 | ) | |
Excluding the changes due to the consolidation of the Centre, transitioned development properties, and properties under redevelopment, the net $1.1 million decrease in real estate taxes was primarily due to the timing of the reassessments of the taxable value of certain of our operating properties and the effects of successful appeals of these assessments. The majority of the increases and decreases in our real estate tax expense from increased assessments and subsequent appeals is recoverable from (or reimbursable to) tenants and, therefore, reflected in tenant reimbursement revenue.
Cost of construction and services decreased $11.1 million, or 64%, primarily as a result of a decline in third party construction contracts and construction management fees due to the economic downturn and our strategic decision to reduce third party construction activity, as discussed above.
General, administrative and other expenses decreased $0.3 million, or 6%, due to declines in personnel-related expenses and various costs of operating as a public company, consistent with our strategy to reduce overhead.
Depreciation and amortization expense increased $8.6 million, or 27%, due to the following:
|
Increase (Decrease) 2010 to 2009
|
||||
|
Development properties that became operational or were partially operational in 2009 and/or 2010
|
$ | 1,114,109 | ||
|
Consolidation of The Centre
|
432,964 | |||
|
Properties under redevelopment during 2009 and/or 2010
|
5,664,991 | |||
|
Properties fully operational during 2009 and 2010 & other
|
1,371,847 | |||
|
Total
|
$ | 8,583,911 | ||
Of the $8.6 million total increase in depreciation and amortization expense, $5.7 million was due to additional depreciation on the Coral Springs Plaza and Rivers Edge redevelopment properties. Redevelopment plans for these properties were finalized during the second quarter of 2010, resulting in a reduction to the useful lives of certain assets that were subsequently demolished to prepare for the properties’ renovation. Excluding the changes due to the consolidation of The Centre, transitioned development properties, and properties under redevelopment, the net $1.4 million increase in depreciation and amortization expense was primarily due to the higher amounts of accelerated depreciation and amortization of vacated tenant costs related to tenants, which terminated at our operating properties in 2010 as compared to the prior year.
46
Interest expense increased $1.4 million, or 5%, with $1.1 million of the increase primarily due to the cessation of interest capitalization as we delayed our plans at one of our development properties in 2010 and also transitioned other properties to operating status. The remainder of the increase was due to higher borrowing costs for new borrowings and debt refinanced since 2009 partially offset by debt repayments during the same period.
Income tax (expense) benefit of our taxable REIT subsidiary changed from a benefit of $22,000 in 2009 to an expense of $266,000 in 2010. The 2009 benefit resulted from low construction volume in our taxable REIT subsidiary, and the 2010 expense is due to income to our taxable REIT subsidiary related to the sale of residential assets at the Eddy Street Commons development in 2010.
(Loss) income from unconsolidated entities changed from income of $226,000 in 2009 to a loss of $52,000 in 2010. The $226,000 of income in 2009 relates to The Centre operating property, which was consolidated in September 2009. The loss of $52,000 in 2010 includes our share of pre-operating expenses related to the limited service hotel at our Eddy Street Commons property, which opened in June 2010. Our other equity method joint venture is under development and is not yet generating operating results.
The $1.6 million non-cash gain from consolidation of subsidiary in 2009 was recognized upon the consolidation of The Centre joint venture as of September 30, 2009. Our share of the gain was $1.0 million.
The $6.1 million loss from discontinued operations in 2009 relates to the impairment and subsequent transfer of our Galleria Plaza property to the ground lessor.
Net loss (income) attributable to noncontrolling interests changed from income of $0.6 million in 2009 to a loss of $0.9 million in 2010. Net loss (income) attributable to noncontrolling interests generally reflects the percentage of the Operating Partnership owned by the limited partners. Due to the May 2009 common share offering, the limited partners weighted average diluted ownership percentage declined from 13.4% in 2009 to 11.1% in 2010. In 2009, noncontrolling interests includes the noncontrolling interest in the non-cash gain from the consolidation of the Centre of $0.7 million and the noncontrolling interest from the sale of an outlot parcel of $0.2 million.
Comparison of Operating Results for the Years Ended December 31, 2009 and 2008
The following table reflects income statement line items from our consolidated statements of operations for the years ended December 31, 2009 and 2008:
47
|
Years Ended December 31,
|
||||||||||||
|
2009
|
2008
|
Increase (Decrease) 2009 to 2008
|
||||||||||
|
Revenue:
|
||||||||||||
|
Rental income (including tenant reimbursements)
|
$ | 89,775,606 | $ | 89,043,270 | $ | 732,336 | ||||||
|
Other property related revenue
|
6,065,708 | 13,916,680 | (7,850,972 | ) | ||||||||
|
Construction and service fee revenue
|
19,450,789 | 39,103,151 | (19,652,362 | ) | ||||||||
|
Total revenue
|
115,292,103 | 142,063,101 | (26,770,998 | ) | ||||||||
|
Expenses:
|
||||||||||||
|
Property operating
|
18,188,710 | 16,388,515 | 1,800,195 | |||||||||
|
Real estate taxes
|
12,068,903 | 11,864,552 | 204,351 | |||||||||
|
Cost of construction and services
|
17,192,267 | 33,788,008 | (16,595,741 | ) | ||||||||
|
General, administrative, and other
|
5,711,623 | 5,879,702 | (168,079 | ) | ||||||||
|
Depreciation and amortization
|
32,148,318 | 34,892,975 | (2,744,657 | ) | ||||||||
|
Total expenses
|
85,309,821 | 102,813,752 | (17,503,931 | ) | ||||||||
|
Operating income
|
29,982,282 | 39,249,349 | (9,267,067 | ) | ||||||||
|
Interest expense
|
(27,151,054 | ) | (29,372,181 | ) | 2,221,127 | |||||||
|
Income tax benefit (expense) of taxable REIT
subsidiary
|
22,293 | (1,927,830 | ) | 1,950,123 | ||||||||
|
Income from unconsolidated entities
|
226,041 | 842,425 | (616,384 | ) | ||||||||
|
Gain on sale of unconsolidated property
|
— | 1,233,338 | (1,233,338 | ) | ||||||||
|
Non-cash gain from consolidation of subsidiary
|
1,634,876 | — | 1,634,876 | |||||||||
|
Other income, net
|
224,927 | 157,955 | 66,972 | |||||||||
|
Income from continuing operations
|
4,939,365 | 10,183,056 | (5,243,691 | ) | ||||||||
|
Discontinued operations:
|
||||||||||||
|
Discontinued operations
|
(732,621 | ) | 330,482 | (1,063,103 | ) | |||||||
|
Non-cash loss on impairment of discontinued operation
|
(5,384,747 | ) | — | (5,384,747 | ) | |||||||
|
Loss on sale of operating property
|
— | (2,689,888 | ) | 2,689,888 | ||||||||
|
(Loss) income from discontinued operations
|
(6,117,368 | ) | (2,359,406 | ) | (3,757,962 | ) | ||||||
|
Consolidated net (loss) income
|
(1,178,003 | ) | 7,823,650 | (9,001,653 | ) | |||||||
|
Less: Net (loss) income attributable to noncontrolling interests
|
(603,763 | ) | (1,730,524 | ) | 1,126,761 | |||||||
|
Net (loss) income attributable to Kite Realty
Group Trust
|
$ | (1,781,766 | ) | $ | 6,093,126 | $ | (7,874,892 | ) | ||||
Rental income (including tenant reimbursements) increased $0.7 million, or 1%, due to the following:
|
Increase (Decrease) 2009 to 2008
|
||||
|
Property acquired during 2008
|
$ | 90,910 | ||
|
Development properties that became operational or were partially
operational in 2008 and/or 2009
|
4,086,790 | |||
|
Properties under redevelopment during 2008 and/or 2009
|
(1,209,450 | ) | ||
|
Properties fully operational during 2008 and 2009 & other
|
(2,235,914 | ) | ||
|
Total
|
$ | 732,336 | ||
The $2.2 million decrease in rental income for properties fully operational in 2009 and 2008 was primarily related to the following:
|
·
|
$0.8 million reduction in base rent from the 2008 bankruptcy of Circuit City, offset by increases of $1.2 million from the 2008 write off to rental income of straight-line rent receivables and in-place lease liabilities;
|
48
|
·
|
$2.3 million net reduction in minimum rent at a number of our properties due to the termination of other leases with tenants in 2009 and 2008, which includes the write off to rental income of straight-line rent receivables and in-place lease liabilities;
|
|
·
|
$0.4 million reduction as a result of the 2009 sale of a parcel of land adjacent to our Shops at Eagle Creek operating property; and
|
|
·
|
$0.2 million net decrease in reimbursements due to a decline in recoverable operating expenses.
|
Offsetting these decreases is $0.3 million of rental income from the consolidation of The Centre operating property as of September 30, 2009.
Other property related revenue primarily consists of parking revenues, percentage rent, lease settlement income and gains on land sales. This revenue decreased $7.9 million, or 57%, primarily as a result of lower gains on land sales of $7.0 million and lease settlement income of $1.3 million. This revenue decrease was partially offset by a $0.4 million reversal of an estimated liability for which we are no longer obligated.
Construction and service fee revenue decreased $19.7 million, or 50%. This decrease reflects 2008 proceeds of $10.6 million from the sale of our Spring Mill Medical, Phase II build-to-suit commercial development asset and net declines in the level of third-party construction and services activity of $9.1 million.
Property operating expenses increased $1.8 million, or 11%, due to the following:
|
Increase (Decrease) 2009 to 2008
|
||||
|
Property acquired during 2008
|
$ | 148,210 | ||
|
Development properties that became operational or were partially
operational in 2008 and/or 2009
|
688,617 | |||
|
Properties under redevelopment during 2008 and/or 2009
|
(232,616 | ) | ||
|
Properties fully operational during 2008 and 2009 & other
|
1,195,984 | |||
|
Total
|
$ | 1,800,195 | ||
The $1.2 million increase in property operating expense for properties fully operational in 2009 and 2008 was primarily related to the following:
|
·
|
$1.0 million net increase in bad debt expense at a number of our operating properties which was reflective of financial difficulties (including bankruptcies) experienced by a number of our tenants; and
|
|
·
|
$0.5 million net increase in landscaping and parking lot expense, the majority of which is recoverable from tenants.
|
These increases in property operating expenses were partially offset by a $0.3 million decrease in repairs and maintenance expense.
Real estate taxes increased $0.2 million, or 0.2%, due to the following:
|
Increase (Decrease) 2009 to 2008
|
||||
|
Property acquired during 2008
|
$ | (22,689 | ) | |
|
Development properties that became operational or were partially
operational in 2008 and/or 2009
|
608,602 | |||
|
Properties under redevelopment during 2008 and/or 2009
|
(172,830 | ) | ||
|
Properties fully operational during 2008 and 2009 & other
|
(208,732 | ) | ||
|
Total
|
$ | 204,351 | ||
49
The $0.2 million decrease in real estate tax expense for properties fully operational in 2009 and 2008 was primarily related to the timing of property reassessments by the taxing authorities and our related appeals of these assessments. The appeals process can last many months, resulting in the assessments and appeals settlements occurring in different periods. Typically, the majority of any increase (decrease) in our real estate tax expense is recoverable from (refundable to) our tenants.
Cost of construction and services decreased $16.6 million, or 49%. This decrease is due to 2008 cost of $9.4 million associated with the sale of our Spring Mill Medical, Phase II build-to-suit commercial development asset and net declines in the level of third-party construction and services activity of $7.2 million.
General, administrative and other expenses decreased $0.2 million, or 3% due to small declines in personnel-related expenses and various costs of operating as a public company.
Depreciation and amortization expense decreased $2.7 million, or 8%, due to the following:
|
Increase (Decrease) 2009 to 2008
|
||||
|
Property acquired during 2008
|
$ | (107,604 | ) | |
|
Development properties that became operational or were partially
operational in 2008 and/or 2009
|
1,078,122 | |||
|
Properties under redevelopment during 2008 and/or 2009
|
(2,593,484 | ) | ||
|
Properties fully operational during 2008 and 2009 & other
|
(1,121,691 | ) | ||
|
Total
|
$ | (2,744,657 | ) | |
The $1.1 million decrease in depreciation and amortization expense for properties fully operational in 2009 and 2008 was primarily related to the following:
|
·
|
$1.5 million decline from accelerated depreciation and amortization on tangible and intangible assets associated with the 2008 bankruptcy of Circuit City involving three of our properties; and
|
|
·
|
$0.4 million decrease in accelerated depreciation and amortization on tangible and intangible assets at a number of our other properties resulting from the termination of other tenant leases with us.
|
These decreases in depreciation and amortization expenses were partially offset by the following increases:
|
·
|
$0.4 million from the consolidation of The Centre operating property as of September 30, 2009; and
|
|
·
|
$0.3 million as a result of the 2009 sale of a parcel of land adjacent to our Shops at Eagle Creek operating property.
|
Interest expense decreased $2.2 million, or 8%, primarily as a result of lower average borrowings (proceeds from our October 2008 and May 2009 common equity offerings were used to pay down borrowings), and an average decrease in the LIBOR interest rate of 230 basis points.
Income taxes on our taxable REIT subsidiary changed from an expense of $1.9 million in 2008 to a minor benefit (credit) in 2009. This change is primarily caused by taxable gains on the sales of a land parcel and our Spring Mill Medical, Phase II build-to-suit commercial development asset in 2008 and lower taxable third-party construction and services activity in 2009.
Income from unconsolidated entities decreased $0.6 million due to the 2008 sale of a land parcel, our share of which was $0.6 million.
Gain on sale of unconsolidated property in 2008 of $1.2 million represents the gain from the sale of our interest in Spring Mill Medical, Phase I, one of our unconsolidated commercial operating properties.
The $1.6 million non-cash gain from consolidation of subsidiary in 2009 represents a gain that was recognized upon the consolidation of The Centre operating property which is owned in a joint venture. We paid off a third-party loan on this previously unconsolidated entity and contributed $2.1 million of capital to the entity. In accordance with the provisions of Topic 810 – “Consolidation” of the Accounting Standards Codification (“ASC”), the financial statements of The Centre were consolidated as of September 30, 2009, and its assets and liabilities were recorded at fair value, resulting in a non-cash gain of $1.6 million, of which our share was $1.0 million.
50
Discontinued operations changed from income of $0.3 million in 2008 to a loss of $0.7 million in 2009. Discontinued operations result from the 2008 sale of our Silver Glen Crossings operating property and the 2009 transfer of our Galleria Plaza property to the ground lessor. Galleria Plaza had a net loss in both 2009 and 2008 while Silver Glen Crossings had net income in 2008.
The $5.4 million non-cash loss on impairment of a real estate asset in 2009 relates to the write-off of the net book value of our Galleria Plaza property in Dallas, Texas, which was transferred to the ground lessor.
The 2008 loss on sale of operating property of $2.7 million results from the sale of our Silver Glen Crossings property, located in Chicago, Illinois.
Net income attributable to noncontrolling interests decreased $1.1 million from $1.7 million in 2008 to $0.6 million in 2009. In 2009, noncontrolling interests includes the noncontrolling interest in the non-cash gain from consolidation of The Centre of $0.7 million and the noncontrolling interest from the sale of an outlot parcel of $0.2 million, offset by our operating partnership limited partners’ share of the consolidated net loss of $0.3 million.
Liquidity and Capital Resources
Current State of Capital Markets and Our Financing Strategy
Our primary finance and capital strategy is to maintain a strong balance sheet with sufficient flexibility to fund our operating and investment activities in a cost-effective manner. We consider a number of factors when evaluating our level of indebtedness and when making decisions regarding additional borrowings or equity offerings, including the purchase price of properties to be developed or acquired, the estimated market value of our properties and the Company as a whole upon consummation of the borrowing or offering, and the ability of particular properties to generate cash flow to cover debt service. As discussed in more detail above in “Overview,” the recent market conditions have heightened the need for most REITs, including us, to continue to place a significant amount of emphasis on financing and capital strategies. We will continue to monitor the capital markets and may consider raising additional capital through the issuance of our common shares, preferred shares or other securities.
In 2008 and 2009, we received aggregate net proceeds of $135.3 million from offerings of our common shares. In December 2010, we received net proceeds of $67.5 million from an offering of our Series A Cumulative Redeemable Perpetual Preferred Shares. We used a portion of the proceeds from this offering to retire our $55 million unsecured term loan. The remaining net proceeds and borrowings on the line of credit were used to retire the $18.3 million loan encumbering International Speedway Square in Daytona, Florida. As a result of these transactions, our consolidated debt was $611 million as of December 31, 2010 as compared to $658 million as of the end of the prior year.
In addition to raising new capital, we have also been successful in refinancing or extending the maturities of our debt that were originally scheduled to mature in 2010 and 2011. As of March 1, 2011, we had refinanced or extended the maturity dates for $17 million of the $92 million of debt maturing in 2011. The remaining $75 million of our 2011 debt maturities consists of property-level debt, of which $46 million has maturity extensions of one year, subject to certain customary conditions. With respect to the remaining $30 million, we are pursuing financing alternatives to enable us to repay, refinance, or extend the maturity date of these loans. Our unsecured revolving credit facility is scheduled to mature in 2012. The aggregate amount of outstanding indebtedness on our facility is $122.3 million as of December 31, 2010. We have entered into a non-binding term sheet for an amended and restated unsecured revolving credit facility with a three-year term and expect to close on this transaction during the first half of 2011.
51
We were also able to effectively recycle capital by selling outlots and unoccupied land parcels. During 2010, we generated gross proceeds of $6.3 million from such sales, the majority of which was used to pay down outstanding indebtedness.
In the future, we may raise additional capital by pursuing joint venture capital partners and/or disposing of additional properties, land parcels or other assets that are no longer core components of our growth strategy. We will continue to monitor the capital markets and may consider raising additional capital through the issuance of our common shares, preferred shares or other securities.
As of December 31, 2010, we had cash and cash equivalents on hand of $15.4 million. We may be subject to concentrations of credit risk with regards to our cash and cash equivalents. We place our cash and short-term cash investments with high-credit-quality financial institutions. As of December 31, 2010, the majority of our cash and cash equivalents were held in deposit accounts that are 100% insured by the federal government’s Temporary Liquidity Guarantee Program. From time to time, such investments may temporarily be held in accounts that are not insured under this program and which are in excess of FDIC and SIPC insurance limits; however we attempt to limit our exposure at any one time. We also maintain certain compensating balances in several financial institutions in support of borrowings from those institutions. Such compensating balances were not material to the consolidated balance sheets.
Our Principal Capital Resources
Our Unsecured Revolving Credit Facility
Our Operating Partnership is a party to an amended and restated four-year $200 million unsecured revolving credit facility with a group of lenders and Key Bank National Association, as agent (the “unsecured facility”). We and several of the Operating Partnership’s subsidiaries are guarantors of the Operating Partnership’s obligations under the unsecured facility. The amended unsecured facility has a maturity date of February 20, 2012 after considering the one year extension that was exercised in the fourth quarter of 2010. We have entered into a non-binding term sheet for an amended and restated unsecured revolving credit facility with a three-year term and expect to close on this transaction during the first half of 2011.
Borrowings under the unsecured facility bear interest at a variable interest rate of LIBOR + 115 to 135 basis points, depending on our leverage ratio. The unsecured facility has a 0.125% to 0.200% commitment fee applicable to the average daily unused amount. Subject to certain conditions, including the prior consent of the lenders, we have the option to increase our borrowings under the unsecured facility to a maximum of $400 million if there are sufficient unencumbered assets to support the additional borrowings. The unsecured facility also includes a short-term borrowing line of $25 million with a variable interest rate. Borrowings under the short-term line may not be outstanding for more than five days.
As of December 31, 2010, our outstanding indebtedness under the unsecured facility was $122.3 million, bearing interest at a rate of LIBOR + 125 basis points. In addition, we have outstanding letters of credit totaling $7.2 million. As of December 31, 2010, the amount available to us for future draws was $46 million.
The amount that we may borrow under the unsecured facility is based on the value of assets in the unencumbered property pool. We currently have 51 unencumbered properties and other assets, 47 of which are wholly owned and used to calculate the amount available for borrowing under the unsecured credit facility and three of which are owned through joint ventures. The major unencumbered assets include: Boulevard Crossing, Broadstone Station, Coral Springs Plaza, Courthouse Shadows, Four Corner Square, Hamilton Crossing, International Speedway Square, King’s Lake Square, Market Street Village, Naperville Marketplace, PEN Products, Publix at Acworth, Red Bank Commons, Shops at Eagle Creek, Traders Point II, Union Station Parking Garage, Wal-Mart Plaza, and Waterford Lakes.
Our ability to borrow under the unsecured facility is subject to ongoing compliance with various restrictive covenants, including with respect to liens, indebtedness, investments, dividends, mergers and asset sales. In addition, the unsecured facility requires us to satisfy certain financial covenants, including:
|
·
|
a maximum leverage ratio of 65% (or up to 70% in certain circumstances);
|
|
·
|
Adjusted EBITDA (as defined in the unsecured facility) to fixed charges coverage ratio of at least 1.50 to 1;
|
52
|
·
|
minimum tangible net worth (defined as Total Asset Value less Total Indebtedness, as defined in the unsecured facility) of $300 million (plus 75% of the net proceeds of any future equity issuances);
|
|
·
|
ratio of net operating income of unencumbered property to debt service under the unsecured facility of at least 1.50 to 1;
|
|
·
|
minimum unencumbered property pool occupancy rate of 80%;
|
|
·
|
ratio of variable rate indebtedness to total asset value of no more than 0.35 to 1; and
|
|
·
|
ratio of recourse indebtedness to total asset value of no more than 0.30 to 1.
|
We were in compliance with all applicable covenants under the unsecured facility as of December 31, 2010.
Under the terms of the unsecured facility, we are permitted to make distributions to our shareholders of up to 95% of our funds from operations provided that no event of default exists. If an event of default exists, we may only make distributions sufficient to maintain our REIT status. However, we may not make any distributions if an event of default resulting from nonpayment or bankruptcy exists, or if our obligations under the credit facility are accelerated.
Capital Markets
We have filed a registration statement, and subsequent prospectus supplements related thereto, with the Securities and Exchange Commission allowing us to offer, from time to time, common shares or preferred shares for an aggregate initial public offering price of up to $500 million.
In May 2009, we issued 28,750,000 common shares for net proceeds of $87.5 million. In addition, in December 2009, we entered into an Equity Distribution Agreement pursuant to which we may sell, from time to time, up to an aggregate amount of $25 million of our common shares. We will continue to monitor the capital markets and may consider raising additional capital through the issuance of our common shares, preferred shares or other securities.
In December 2010, the Company completed an equity offering of 2,800,000 shares of 8.25% Series A Cumulative Redeemable Perpetual Preferred Shares at an offering price of $25.00 per share for aggregate gross and net proceeds of $70.0 million and $67.5 million, respectively. A portion of the net proceeds were used to retire our $55 million unsecured term loan, which had a maturity date of July 2011. The remaining net proceeds and borrowings on the line of credit were used to retire the $18.3 million loan encumbering International Speedway Square. Our Series A cumulative redeemable preferred shares have no stated maturity date although they may be redeemed, at our option, beginning in December 2015.
Sale of Real Estate Asset
We may pursue opportunities to sell non-strategic real estate assets in order to generate additional liquidity. Our ability to dispose of such properties is dependent on the availability of credit to potential buyers to purchase properties at prices that we consider acceptable. The sales price may be less than our carrying value.
Short and Long-Term Liquidity Needs
Overview
We derive the majority of our revenue from tenants who lease space from us at our properties. Therefore, our ability to generate cash from operations is dependent on the rents that we are able to charge and collect from our tenants. While we believe that the nature of the properties in which we typically invest—primarily neighborhood and community shopping centers—provides a relatively stable revenue flow in uncertain economic times, the recent economic downturn adversely affected the ability of some of our tenants to meet their lease obligations, as discussed in more detail above in “Overview” on page 41. These conditions, in turn, had a negative impact on our business.
53
Short-Term Liquidity Needs
The nature of our business, coupled with the requirements to qualify for REIT status and in order to receive a tax deduction for some or all of the dividends paid to shareholders, necessitate that we distribute 90% of our taxable income on an annual basis, which will cause us to have substantial liquidity needs over both the short term and the long term. Our short-term liquidity needs consist primarily of funds necessary to pay operating expenses associated with our operating properties, interest expense and scheduled principal payments on our debt, expected dividend payments (including distributions to persons who hold units in our Operating Partnership) and recurring capital expenditures. In May 2009, our Board of Trustees (the “Board”) reduced our quarterly cash distribution to $0.06 per common share. The reduced distribution of $0.06 has been maintained in each subsequent quarter including the quarter ended December 31, 2010. The lowering of our distribution has allowed us to conserve cash to fund working capital and for other general corporate purposes. Each quarter we discuss with our Board our liquidity requirements along with other relevant factors before the Board decides whether and in what amount to declare a cash distribution.
When we lease space to new tenants, or renew leases for existing tenants, we also incur expenditures for tenant improvements and external leasing commissions. This amount, as well as the amount of recurring capital expenditures that we incur, will vary from year to year. During the year ended December 31, 2010, we incurred $0.8 million of costs for recurring capital expenditures on operating properties and also incurred $1.9 million of costs for tenant improvements and external leasing commissions (excluding first generation space and development and redevelopment properties). We currently anticipate incurring approximately $1.0 million in recurring capital expenditures at our operating properties and approximately $15.4 million of additional major tenant improvements and renovation costs within the next twelve months at several properties in our operating portfolio and redevelopment pipeline. We believe we currently have sufficient financing in place to fund our investment in these projects through borrowings on our unsecured credit facility and construction loans. In certain circumstances, we may seek to place specific construction financing on these redevelopment projects.
We expect to meet our short-term liquidity needs through borrowings under the unsecured facility, new construction loans, cash generated from operations and, to the extent necessary, accessing the public equity and debt markets to the extent that we are able to do so.
2011 Debt Maturities
As of December 31, 2010, $92 million of our outstanding indebtedness was scheduled to mature in 2011, excluding scheduled monthly principal payments. As of March 1, 2011, we had refinanced or extended the maturity dates for $17 million of these maturities. The remaining $75 million of our 2011 debt maturities consists of property-level debt, of which $46 million has maturity extensions of one year, subject to certain customary conditions. With respect to the remaining $30 million, we are pursuing financing alternatives to enable us to repay, refinance, or extend the maturity date of these loans.
Long-Term Liquidity Needs
Our long-term liquidity needs consist primarily of funds necessary to pay for the development of new properties, redevelopment of existing properties, non-recurring capital expenditures, acquisitions of properties, and payment of indebtedness at maturity.
Unsecured Facility. As discussed above, our unsecured facility, which had a balance of $122 million as of December 31, 2010, will mature on February 20, 2012 after considering the one year extension that was exercised in the fourth quarter of 2010. Subsequent to December 31, 2010, we entered into a non-binding term sheet for an amended and restated unsecured revolving credit facility with a three year term and expect to close on this transaction in the first half of 2011.
Redevelopment Properties. As of December 31, 2010, four of our properties (Bolton Plaza, Rivers Edge, Courthouse Shadows and Four Corner Square) were undergoing redevelopment activities. We currently anticipate our total investment in these redevelopment projects will be approximately $30.2 million, of which $4.9 million has already been incurred. The Company has entered into a five-year construction loan to fund the redevelopment of the Rivers Edge property. We believe we currently have sufficient financing in place to fund our investment in the remaining projects through borrowings on our unsecured revolving credit facility. In certain circumstances, we may seek to place specific construction financing on these redevelopment projects.
54
Development Properties. As of December 31, 2010, we had two projects in our in-process development pipeline. The total estimated cost, including our share and our joint venture partners’ share, for these projects is approximately $68 million, of which $56 million had been incurred as of December 31, 2010. Our share of the total estimated cost of these projects is approximately $42 million, of which we have incurred $31 million as of December 31, 2010. We believe we currently have sufficient financing in place to fund these projects and expect to do so primarily through existing construction loans.
Future Development Pipeline. In addition to our in-process development pipeline, we have a future development pipeline which includes land parcels that are in various stages of preparation for construction to commence, including pre-leasing activity and negotiations for third-party financing. As of December 31, 2010, this future development pipeline consisted of five projects that are expected to contain approximately 2.5 million square feet of total leasable area. We currently anticipate the total estimated cost of these projects will be approximately $298 million, of which our share is currently expected to be approximately $180 million. Although we intend to develop these properties, we are generally not contractually obligated to complete any developments in our future development pipeline. With respect to each asset in the future development pipeline, our policy is to not commence vertical construction until pre-established leasing thresholds are achieved and the requisite third-party financing is in place. Once these projects are transferred to the in-process development pipeline, we intend to fund our investment in these developments primarily through new construction loans and joint ventures, as well as borrowings on our unsecured revolving credit facility, if necessary.
Selective Acquisitions, Developments and Joint Ventures. We may selectively pursue the acquisition and development of other properties, which would require additional capital. It is unlikely we would have sufficient funds on hand to meet these long-term capital requirements. We would have to satisfy these needs through participation in joint venture arrangements, additional borrowings, sales of common or preferred shares and/or cash generated through property dispositions. We cannot be certain that we would have access to these sources of capital on satisfactory terms, if at all, to fund our long-term liquidity requirements. We evaluate all future opportunities against pre-established criteria including, but not limited to, location, demographics, tenant relationships, and amount of existing retail space. Our ability to access the capital markets will be dependent on a number of factors, including general capital market conditions, which is discussed in more detail above in “Overview” on page 41.
We have entered into an agreement (the “Venture”) with Prudential Real Estate Investors (“PREI”) to pursue joint venture opportunities for the development and selected acquisition of community shopping centers in the United States. The agreement allows for the Venture to develop or acquire up to $1.25 billion of well-positioned community shopping centers in strategic markets in the United States. Under the terms of the agreement, we have agreed to present to PREI opportunities to develop or acquire community shopping centers, each with estimated project costs in excess of $50 million. We have the option to present to PREI additional opportunities with estimated project costs under $50 million. The agreement allows for equity capital contributions of up to $500 million to be made to the Venture for qualifying projects. We expect contributions would be made on a project-by-project basis with PREI contributing 80% and us contributing 20% of the equity required. Our only active project with PREI is Parkside Town Commons, which is currently in our future development pipeline. As of December 31, 2010, we owned a 40% interest in this joint venture which, under the terms of this joint venture, will be reduced to 20% upon the placement of construction financing.
Cash Flows
Comparison of the Year Ended December 31, 2010 to the Year Ended December 31, 2009
Cash provided by operating activities was $30.3 million for the year ended December 31, 2010, an increase of $9.3 million from 2009. The increase was primarily due to higher cash outflows for accounts payable and accrued expenses in 2009, the majority of which reflects third-party construction activity completed in the first half of 2009.
Cash used in our investing activities totaled $36.4 million in 2010, a decrease of $18.4 million from 2009. The decrease in cash used in investing activities was primarily a result of a decline of $11.6 million in contributions to joint ventures. In 2009, we contributed $12.0 million to our Parkside Town Commons development property and The Centre operating property; while, in 2010, we contributed $450,000 to our Eddy Street Commons limited service hotel property. Additionally, in 2009, we advanced $1.4 million to our joint venture partner in The Centre, and in 2010, $0.7 million of this note was repaid. The remainder is a decrease of $5.2 million in cash outflows for capital expenditures as part of our cash conservation strategy, we significantly reduced our acquisition, development and construction activities.
Cash provided by financing activities totaled $1.6 million during 2010, a decrease of $42.3 million from 2009. In 2010, we had a net reduction in debt of $46.9 million due to ongoing efforts to continue to strengthen our balance sheet. The following items highlight additional significant capital transactions:
55
|
·
|
In December 2010, we issued 2.8 million shares of Series A Cumulative Redeemable Perpetual Preferred Shares for net proceeds of $67.5 million. A portion of the net proceeds were utilized to retire our $55 million unsecured term loan.
|
|
·
|
In order to retain additional cash to meet our capital needs, we reduced our quarterly dividend beginning in the second quarter of 2009. We paid cash dividends of $0.24 per share in 2010, compared to cash dividends of $0.3325 per share in 2009.
|
Comparison of the Year Ended December 31, 2009 to the Year Ended December 31, 2008
Cash provided by operating activities was $21.0 million for the year ended December 31, 2009, a decrease of $20.0 million from 2008. The decrease was primarily due to higher cash outflows for accounts payable and accrued expenses in 2009, the majority of which reflects declining third-party construction activity.
Cash used in our investing activities totaled $54.8 million in 2009, a decrease of $40.9 million from 2008. The decrease in cash used in investing activities was primarily a result of a decline of $81.0 million in acquisitions of interests in properties and capital expenditures. As part of our cash conservation strategy, we significantly reduced our acquisition, development and construction activities. Offsetting this decrease were $17.2 million of 2008 net proceeds from the sale of our Silver Glen Crossings operating property, $12.0 million of 2009 contributions to our Parkside Town Commons development property and The Centre operating property and a $5.0 million change in construction payables.
Cash provided by financing activities totaled $43.9 million during 2009, a decrease of $1.6 million from 2008. In 2009, we had lower borrowings of $26.2 million due to a decline in our construction activity. Among the more significant changes in financing activities between years are the following: In 2008, we had borrowings totaling $41.8 million in connection with the 2008 acquisition of our Rivers Edge redevelopment property and New Hill Place development property, offset by proceeds totaling $32.3 million from the sales of our Silver Glen Crossings and Spring Mill operating properties and outlot and land parcels. Net loan paydowns were $20.5 million higher in 2009 compared to 2008 as a result of the use of common share offering proceeds to reduce our levels of indebtedness. These net changes were partially offset by $39.2 million higher proceeds from our 2009 common share offering compared to our 2008 offerings and $8.1 million lower cash distribution payments to common shareholders and operating partnership unitholders as a result of lowering our quarterly distribution to equity holders.
56
Off-Balance Sheet Arrangements
We do not currently have any off-balance sheet arrangements that have, or are reasonably likely to have, a material current or future effect on our financial condition, changes in financial condition, revenues or expenses, results of operations, liquidity, capital expenditures or capital resources. We do, however, have certain obligations to some of the projects in our in-process development pipeline, as discussed below in “Contractual Obligations”, as well as our joint venture with PREI with respect to our Parkside Town Commons development, as discussed above. As of December 31, 2010, we owned a 40% interest in this joint venture which, under the terms of this joint venture, will be reduced to 20% upon the placement of construction financing.
As of December 31, 2010, our share of unconsolidated joint venture indebtedness was $18.3 million. Unconsolidated joint venture debt is the liability of the joint venture and is typically secured by the assets of the joint venture. The Operating Partnership had guaranteed its $13.5 million share of the unconsolidated joint venture debt related to the Parkside Town Commons development in the event the joint venture partnership defaults under the terms of the underlying arrangement. Mortgages which are guaranteed by the Operating Partnership are secured by the property of the joint venture and the joint venture could sell the property in order to satisfy the outstanding obligation. See Note 6 to the accompanying consolidated financial statements for information on our unconsolidated joint ventures for the years ended December 31, 2010, 2009 and 2008.
As of December 31, 2010, we have outstanding letters of credit totaling $7.2 million and no amounts were advanced against these instruments.
With respect to our Eddy Street Commons development, we have jointly guaranteed the apartment developer’s construction loan, which had an outstanding balance of $30.3 million as of December 31, 2010. The apartments are substantially complete and the owner intends to secure nonrecourse financing in 2011. We have not been required to satisfy any portion of this guarantee.
Contractual Obligations
The following table summarizes our contractual obligations to third parties based on contracts executed as of December 31, 2010.
|
Development and Construction
Contracts
|
Tenant
Allowances1
|
Operating
Leases
|
Consolidated
Long-term
Debt and Interest2
|
Pro Rata Share
of Joint Venture
Debt
|
Employment
Contracts3
|
Total
|
||||||||||||||||||||||
|
2011
|
$ | 8,346,376 | $ | 7,851,361 | $ | 416,800 | $ | 127,950,601 | $ | 13,783,328 | $ | 1,127,000 | $ | 159,475,466 | ||||||||||||||
|
2012
|
— | — | 416,800 | 225,070,605 | 160,511 | — | 225,647,916 | |||||||||||||||||||||
|
2013
|
— | — | 302,500 | 89,870,853 | 160,511 | — | 90,333,864 | |||||||||||||||||||||
|
2014
|
— | — | 310,000 | 47,917,618 | 4,814,078 | — | 53,041,696 | |||||||||||||||||||||
|
2015
|
— | — | 310,000 | 52,944,440 | — | — | 53,254,440 | |||||||||||||||||||||
|
Thereafter
|
— | — | 1,747,500 | 196,492,500 | — | — | 198,240,000 | |||||||||||||||||||||
|
Total
|
$ | 8,346,376 | $ | 7,851,361 | $ | 3,503,600 | $ | 740,246,617 | $ | 18,918,428 | $ | 1,127,000 | $ | 779,993,382 | ||||||||||||||
|
____________________
|
|
|
1
|
Tenant allowances include commitments made to tenants at our operating, development and redevelopment properties.
|
|
2
|
Our consolidated long-term debt consists of both variable and fixed-rate debt and includes both principal and interest. Interest expense for variable-rate debt was calculated using the interest rates as of December 31, 2010.
|
|
3
|
We have entered into employment agreements with certain members of senior management. Under these agreements, each individual received a stipulated annual base salary through December 31, 2010. Each agreement has an automatic one-year renewal unless we or the individual elects not to renew the agreement. The contracts have been extended through December 31, 2011.
|
In 2010, we incurred $28.5 million of interest expense, net of amounts capitalized of $8.8 million.
57
In connection with the construction of the Eddy Street Commons parking garage and certain infrastructure improvements, we are obligated to fund payments under Tax Increment Financing (TIF) Bonds issued by the City of South Bend, Indiana. The majority of the bonds will be funded by real estate tax payments made by us and subject to reimbursement from the tenants of the property. If there are delays in the development, we are obligated to pay certain delay fees. However, we have an agreement with the City of South Bend to limit our exposure to a maximum of $1 million as to such fees. In addition, we will not be in default concerning other obligations under the agreement with the City of South Bend so long as we commence and diligently pursue the completion of our obligations under that agreement.
In connection with our formation at the time of our IPO, we entered into an agreement that restricts our ability, prior to December 31, 2016, to dispose of six of our properties in taxable transactions and limits the amount of gain we can trigger with respect to certain other properties without incurring reimbursement obligations owed to certain limited partners. We have agreed that if we dispose of any interest in six specified properties in a taxable transaction before December 31, 2016, then we will indemnify the contributors of those properties for their tax liabilities attributable to their built-in gain that exists with respect to such property interest as of the time of our IPO (and tax liabilities incurred as a result of the reimbursement payment).
The six properties to which our tax indemnity obligations relate represented 17.6% of our annualized base rent in the aggregate as of December 31, 2010. These six properties are International Speedway Square, Shops at Eagle Creek, Whitehall Pike, Ridge Plaza Shopping Center, Thirty South, and Market Street Village.
Construction Contracts
Construction contracts in the table above represent commitments for contracts executed as of December 31, 2010 related to new developments, redevelopments and third-party construction.
Obligations in Connection with Our In-Process Development, Redevelopment and Future Development Pipeline
We are obligated under various completion guarantees with lenders and lease agreements with tenants to complete two projects in our in-process development pipeline. We currently anticipate our share of the total cost of these projects will be approximately $42 million, of which approximately $10.7 million of our share was unfunded as of December 31, 2010. We believe we currently have sufficient financing in place to fund these projects and expect to do so primarily through existing construction loans. In addition, if necessary, we may make draws on our unsecured facility.
In addition to our in-process development pipeline, we also have a redevelopment pipeline and a future development pipeline, the latter of which includes land parcels that are undergoing pre-development activity and are in various stages of preparation for construction to commence, including pre-leasing activity and negotiations for third-party financings. Although we currently intend to develop the future development pipeline, we are not contractually obligated to complete any projects in our redevelopment or future development pipelines, as these consist of land parcels on which we have not yet commenced construction. With respect to each asset in the future development pipeline, our policy is to not commence vertical construction until appropriate pre-leasing thresholds are met and the requisite third-party financing is in place. Once these projects are transferred to the in-process development pipeline, we intend to fund our investment in these developments primarily through new construction loans and joint ventures, as well as borrowings on our unsecured revolving credit facility, if necessary.
58
Outstanding Indebtedness
The following table presents details of outstanding indebtedness as of December 31, 2010:
|
Property
|
Balance
Outstanding
|
Interest
Rate
|
Maturity
|
||||||
|
Fixed Rate Debt - Mortgage:
|
|||||||||
|
50th & 12th
|
$
|
4,293,034
|
5.67
|
%
|
11/11/2014
|
||||
|
The Centre at Panola, Phase I
|
3,464,489
|
6.78
|
%
|
1/1/2022
|
|||||
|
Cool Creek Commons
|
17,643,234
|
5.88
|
%
|
4/11/2016
|
|||||
|
The Corner
|
1,486,488
|
7.65
|
%
|
7/1/2011
|
|||||
|
Fox Lake Crossing
|
11,050,412
|
5.16
|
%
|
7/1/2012
|
|||||
|
Geist Pavilion
|
11,125,000
|
5.78
|
%
|
1/1/2017
|
|||||
|
Indian River Square
|
13,040,043
|
5.42
|
%
|
6/11/2015
|
|||||
|
Kedron Village
|
29,700,000
|
5.70
|
%
|
1/11/2017
|
|||||
|
Pine Ridge Crossing
|
17,500,000
|
6.34
|
%
|
10/11/2016
|
|||||
|
Plaza at Cedar Hill
|
25,175,721
|
7.38
|
%
|
2/1/2012
|
|||||
|
Plaza Volente
|
28,119,431
|
5.42
|
%
|
6/11/2015
|
|||||
|
Preston Commons
|
4,223,200
|
5.90
|
%
|
3/11/2013
|
|||||
|
Riverchase Plaza
|
10,500,000
|
6.34
|
%
|
10/11/2016
|
|||||
|
Sunland Towne Centre
|
25,000,000
|
6.01
|
%
|
7/1/2016
|
|||||
|
30 South
|
21,303,984
|
6.09
|
%
|
1/11/2014
|
|||||
|
Traders Point
|
45,895,436
|
5.86
|
%
|
10/11/2016
|
|||||
|
Whitehall Pike
|
8,039,656
|
6.71
|
%
|
7/5/2018
|
|||||
|
277,560,128
|
|||||||||
|
Floating Rate Debt - Hedged:
|
|||||||||
|
KeyBank (Admin. Agent)
|
50,000,000
|
5.07
|
%
|
2/20/2011
|
|||||
|
KeyBank (Admin Agent)
|
25,000,000
|
4.92
|
%
|
2/18/2011
|
|||||
|
KeyBank (Admin Agent)
|
55,000,000
|
3.27
|
%
|
7/15/2011
|
|||||
|
Bank of America
|
19,700,000
|
1.73
|
%
|
12/27/2011
|
|||||
|
PNC Bank
|
14,856,200
|
1.89
|
%
|
4/30/2012
|
|||||
|
Charter One Bank
|
20,000,000
|
2.98
|
%
|
10/31/2011
|
|||||
|
M&I Bank
|
20,000,000
|
1.65
|
%
|
12/19/2011
|
|||||
|
TD Bank
|
14,754,726
|
3.31
|
%
|
1/3/2017
|
|||||
|
219,310,926
|
|||||||||
|
Net unamortized premium on assumed debt of acquired properties
|
546,912
|
||||||||
|
Total Fixed Rate Indebtedness
|
$
|
497,417,966
|
|||||||
59
|
Property
|
Balance
Outstanding
|
Interest
Rate
|
Maturity
|
Interest Rate
at 12/31/10
|
|||||
|
Variable Rate Debt - Mortgage:
|
|||||||||
|
Bayport Commons3
|
$
|
14,923,016
|
LIBOR + 3.50%
|
1/6/2012
|
3.76
|
%
|
|||
|
Beacon Hill
|
7,401,750
|
LIBOR + 1.25%
|
3/30/2014
|
1.51
|
%
|
||||
|
Eastgate Pavilion3
|
14,883,390
|
LIBOR + 2.95%
|
4/30/2012
|
3.21
|
%
|
||||
|
Estero Town Commons
|
10,500,000
|
LIBOR + 3.25%
|
1/15/2013
|
3.51
|
%
|
||||
|
Fishers Station
|
3,656,493
|
LIBOR + 3.50%
|
6/6/2011
|
3.76
|
%
|
||||
|
Gateway Shopping Center3
|
20,712,866
|
LIBOR + 1.90%
|
10/31/2011
|
2.16
|
%
|
||||
|
Glendale Town Center3
|
19,615,000
|
LIBOR + 2.75%
|
12/19/2011
|
3.01
|
%
|
||||
|
Indiana State Motor Pool
|
3,467,910
|
LIBOR + 1.35%
|
2/4/2011
|
1.61
|
%
|
||||
|
Ridge Plaza3
|
14,746,436
|
LIBOR + 3.25%
|
1/3/2017
|
3.51
|
%
|
||||
|
Tarpon Springs Plaza
|
12,187,942
|
LIBOR + 3.25%
|
1/15/2013
|
3.51
|
%
|
||||
|
Subtotal Mortgage Notes
|
122,094,803
|
||||||||
|
Variable Rate Debt - Secured by Properties under Construction:
|
|||||||||
|
Bridgewater Marketplace1
|
7,000,000
|
LIBOR + 1.85%
|
6/29/2013
|
5.00
|
%
|
||||
|
Cobblestone Plaza
|
28,347,102
|
LIBOR + 3.50%
|
2/12/2013
|
3.76
|
%
|
||||
|
Delray Marketplace
|
4,725,000
|
LIBOR + 3.00%
|
6/30/2011
|
3.26
|
%
|
||||
|
Eddy Street Commons
|
24,871,142
|
LIBOR + 2.30%
|
12/30/2011
|
2.56
|
%
|
||||
|
Rivers Edge
|
14,311,526
|
LIBOR + 3.25%
|
1/15/2016
|
3.51
|
%
|
||||
|
South Elgin Commons2
|
9,170,000
|
LIBOR + 3.25%
|
9/30/2013
|
5.25
|
%
|
||||
|
Subtotal Construction Notes
|
88,424,770
|
||||||||
|
Unsecured Credit Facility3
|
122,300,000
|
LIBOR + 1.25%4
|
2/20/2012
|
1.51
|
%
|
||||
|
Floating Rate Debt - Hedged:
|
(219,310,926
|
)
|
LIBOR
|
Various
|
|||||
|
Total Variable Rate Indebtedness
|
113,508,647
|
||||||||
|
Total Indebtedness
|
$
|
610,926,613
|
|||||||
|
____________________
|
|
|
1
|
This loan has a LIBOR floor of 3.15%.
|
|
2
|
This loan has a LIBOR floor of 2.00%
|
|
3
|
We entered into a cash flow hedge agreement on this debt instrument to fix the interest rate. See fixed rate within the fixed rate hedged details in the table above.
|
|
4
|
The rate on the Company’s unsecured credit facility varied at certain parts of the year due to provisions in the agreement.
|
Funds From Operations
Funds From Operations (“FFO”), is a widely used performance measure for real estate companies and is provided here as a supplemental measure of operating performance. We calculate FFO in accordance with the best practices described in the April 2002 National Policy Bulletin of the National Association of Real Estate Investment Trusts (NAREIT), which we refer to as the White Paper. The White Paper defines FFO as consolidated net income (computed in accordance with GAAP), excluding gains (or losses) from sales of depreciated property, plus depreciation and amortization, and after adjustments for third-party shares of appropriate items. We have further adjusted FFO for certain additional items that are not in NAREIT’s definition of FFO, such as impairment losses.
Given the nature of our business as a real estate owner and operator, we believe that FFO is helpful to investors as a starting point in measuring our operational performance because it excludes various items included in consolidated net income that do not relate to or are not indicative of our operating performance, such as gains (or losses) from sales of depreciated property and depreciation and amortization, which can make periodic and peer analyses of operating performance more difficult. We believe that our presentation of adjusted FFO provides investors with another financial measure that may facilitate comparison of operating performance between periods and compared to our peers. FFO and adjusted FFO should not be considered as alternatives to consolidated net income (determined in accordance with GAAP) as an indicator of our financial performance, are not alternatives to cash flow from operating activities (determined in accordance with GAAP) as a measure of our liquidity, and are not indicative of funds available to satisfy our cash needs, including our ability to make distributions. Our computations of FFO and adjusted FFO may not be comparable to FFO and adjusted FFO reported by other REITs.
60
Our calculation of FFO (and reconciliation to consolidated net (loss) income) and adjusted FFO is as follows:
|
Year Ended
December 31, 2010
|
Year Ended
December 31, 2009
|
Year Ended
December 31, 2008
|
||||||||||
|
Consolidated net (loss) income
|
$ | (9,186,140 | ) | $ | (1,178,003 | ) | $ | 7,823,650 | ||||
| Less preferred stock dividend | (376,979 | ) | — | — | ||||||||
|
Add loss (deduct gain) on sale of operating property
|
— | — | 2,689,888 | |||||||||
|
Less non-cash gain from consolidation of subsidiary, net of noncontrolling interests
|
— | (980,926 | ) | — | ||||||||
|
Less gain on sale of unconsolidated property
|
— | — | (1,233,338 | ) | ||||||||
|
Less net income attributable to noncontrolling interests in properties
|
(117,155 | ) | (879,463 | ) | (61,707 | ) | ||||||
|
Add depreciation and amortization of consolidated entities, net of noncontrolling interests
|
39,756,493 | 31,601,550 | 35,438,229 | |||||||||
|
Add depreciation and amortization of unconsolidated entities
|
194,131 | 157,623 | 406,623 | |||||||||
|
Funds From Operations of the Kite Portfolio
|
30,270,350 | 28,720,781 | 45,063,345 | |||||||||
|
Less redeemable noncontrolling interests in Funds From Operations
|
(3,359,076 | ) | (3,848,585 | ) | (9,688,619 | ) | ||||||
|
Funds From Operations allocable to the Company
|
$ | 26,911,274 | $ | 24,872,196 | $ | 35,374,726 | ||||||
|
Funds From Operations of the Kite Portfolio
|
$ | 30,270,350 | $ | 28,720,781 | $ | 45,063,345 | ||||||
|
Add back: Non-cash loss on impairment of real estate asset
|
— | 5,384,747 | — | |||||||||
|
Adjusted Funds From Operations of the Kite Portfolio
|
$ | 30,270,350 | $ | 34,105,528 | $ | 45,063,345 | ||||||
|
____________________
|
|
|
1
|
“Funds From Operations of the Kite Portfolio” measures 100% of the operating performance of the Operating Partnership’s real estate properties and construction and service subsidiaries in which the Company owns an interest. “Funds From Operations allocable to the Company” reflects a reduction for the noncontrolling weighted average diluted interest in the Operating Partnership.
|
Forward-Looking Statements
This Annual Report on Form 10-K, together with other statements and information publicly disseminated by Kite Realty Group Trust (the “Company”), contains certain forward-looking statements within the meaning of Section 27A of the Securities Act of 1933 and Section 21E of the Securities Exchange Act of 1934. Such statements are based on assumptions and expectations that may not be realized and are inherently subject to risks, uncertainties and other factors, many of which cannot be predicted with accuracy and some of which might not even be anticipated. Future events and actual results, performance, transactions or achievements, financial or otherwise, may differ materially from the results, performance, transactions or achievements expressed or implied by the forward-looking statements. Risks, uncertainties and other factors that might cause such differences, some of which could be material, include, but are not limited to:
|
·
|
national and local economic, business, real estate and other market conditions, particularly in light of the recent recession;
|
|
·
|
financing risks, including the availability of and costs associated with sources of liquidity;
|
|
·
|
the Company’s ability to refinance, or extend the maturity dates of, its indebtedness;
|
|
·
|
the level and volatility of interest rates;
|
|
·
|
the financial stability of tenants, including their ability to pay rent and the risk of tenant bankruptcies;
|
|
·
|
the competitive environment in which the Company operates;
|
|
·
|
acquisition, disposition, development and joint venture risks;
|
|
·
|
property ownership and management risks;
|
|
·
|
the Company’s ability to maintain its status as a real estate investment trust (“REIT”) for federal income tax purposes;
|
61
|
·
|
potential environmental and other liabilities;
|
|
·
|
impairment in the value of real estate property the Company owns;
|
|
·
|
risks related to the geographical concentration of our properties in Indiana, Florida and Texas;
|
|
·
|
other factors affecting the real estate industry generally; and
|
|
·
|
other risks identified in this Annual Report on Form 10-K and, from time to time, in other reports we file with the Securities and Exchange Commission (the “SEC”) or in other documents that we publicly disseminate.
|
The Company undertakes no obligation to publicly update or revise these forward-looking statements, whether as a result of new information, future events or otherwise.
ITEM 7A. QUANTITATIVE AND QUALITATIVE DISCLOSURES ABOUT MARKET RISK
Our future income, cash flows and fair values relevant to financial instruments depend upon prevailing interest rates. Market risk refers to the risk of loss from adverse changes in interest rates of debt instruments of similar maturities and terms.
Market Risk Related to Fixed and Variable Rate Debt
We had $610.9 million of outstanding consolidated indebtedness as of December 31, 2010 (inclusive of net premiums on acquired debt of $0.6 million). As of December 31, 2010, we were party to various consolidated interest rate hedge agreements for a total of $219.3 million, with maturities over various terms ranging from 2011 through 2017. Including the effects of these hedge agreements, our fixed and variable rate debt would have been $496.9 million (81%) and $113.5 million (19%), respectively, of our total consolidated indebtedness at December 31, 2010. Including our $18.3 million share of unconsolidated variable rate debt and the effect of related hedge agreements, our fixed and variable rate debt is 79% and 21%, respectively, of the total of consolidated and our share of unconsolidated indebtedness at December 31, 2010.
Our future earnings, cash flows and fair values related to financial instruments are dependent upon prevalent market market rates of interest, primarily LIBOR. LIBOR was at historically low levels during 2010. Based on the amount of our fixed rate debt at December 31, 2010, a 100 basis point increase in market interest rates would result in a decrease in the fair value of our fixed rate debt of approximately $10.4 million. A 100 basis point increase in interest rates on our variable rate debt as of December 31, 2010 would decrease our annual cash flow by approximately $1.3 million. Based upon the terms of our variable rate debt, we are most vulnerable to change in short-term LIBOR interest rates. The sensitivity analysis was estimated using cash flows discounted at current borrowing rates adjusted by 100 basis points.
As a matter of policy, we do not utilize financial instruments for trading or speculative transactions.
Inflation
Most of our leases contain provisions designed to mitigate the adverse impact of inflation by requiring the tenant to pay its share of operating expenses, including common area maintenance, real estate taxes and insurance to the extent we are able to recover such costs from our tenants. However, increased inflation could have a more pronounced negative impact on our mortgage and debt interest and general and administrative expenses, as these costs could increase at a rate higher than our rents. Also, inflation may adversely affect tenant leases with stated rent increases or limits on such tenant’s obligation to pay its share of operating expenses, which could be lower than the increase in inflation at any given time, and limit our ability to recover all of our operating expenses.
ITEM 8. FINANCIAL STATEMENTS AND SUPPLEMENTARY DATA
The consolidated financial statements of the Company included in this Report are listed in Part IV, Item 15(a) of this report.
62
ITEM 9. CHANGES IN AND DISAGREEMENTS WITH ACCOUNTANTS ON ACCOUNTING AND FINANCIAL DISCLOSURE
None.
ITEM 9A. CONTROLS AND PROCEDURES
Evaluation of Disclosure Controls and Procedures
An evaluation was performed under the supervision and with the participation of the Company’s management, including its Chief Executive Officer and Chief Financial Officer, of the effectiveness of the Company’s disclosure controls and procedures (as defined in Rules 13a-15(e) and 15d-15(e) under the Securities and Exchange Act of 1934, as amended (the “Exchange Act”)) as of the end of the period covered by this report. Based on that evaluation, the Company’s Chief Executive Officer and Chief Financial Officer have concluded that, as of the end of such period, the Company’s disclosure controls and procedures are effective in recording, processing, summarizing and reporting, on a timely basis, information required to be disclosed by the Company in the reports that it files or submits under the Exchange Act.
Changes in Internal Control Over Financial Reporting
There has been no change in the Company’s internal control over financial reporting (as defined in Rule 13a-15(f) under the Securities Exchange Act of 1934) identified in connection with the evaluation required by Rule 13a-15(b) under the Securities Exchange Act of 1934 of the effectiveness of our disclosure controls and procedures (as defined in Rule 13a-15(e) under the Securities Exchange Act of 1934) as of December 31, 2010 that has materially affected, or is reasonably likely to materially affect, our internal control over financial reporting.
Management Report on Internal Control Over Financial Reporting
The Company’s management is responsible for establishing and maintaining adequate internal control over financial reporting for the Company, as that term is defined in Rule 13a-15(f) of the Exchange Act. Under the supervision of and with the participation of our management, including our Chief Executive Officer and Chief Financial Officer, the Company conducted an evaluation of the effectiveness of the Company’s internal control over financial reporting based on the framework in Internal Control – Integrated Framework issued by the Committee of Sponsoring Organizations of the Treadway Commission. Based on the Company’s evaluation under the framework in Internal Control – Integrated Framework, the Company’s management has concluded that the Company’s internal control over financial reporting was effective as of December 31, 2010.
The Company’s independent auditors, Ernst & Young LLP, an independent registered public accounting firm, have issued a report on the Company’s internal control over financial reporting as stated in their report which is included herein.
The Company’s internal control system was designed to provide reasonable assurance to the Company’s management and Board of Trustees regarding the preparation and fair presentation of published financial statements. All internal control systems, no matter how well designed, have inherent limitations. Therefore, even those systems determined to be effective can provide only reasonable assurance with respect to financial statement preparation and presentation.
63
The Board of Trustees and Shareholders of Kite Realty Group Trust:
We have audited Kite Realty Group Trust and subsidiaries’ internal control over financial reporting as of December 31, 2010, based on criteria established in Internal Control—Integrated Framework issued by the Committee of Sponsoring Organizations of the Treadway Commission (the COSO criteria). Kite Realty Group Trust and subsidiaries’ management is responsible for maintaining effective internal control over financial reporting, and for its assessment of the effectiveness of internal control over financial reporting included in the accompanying Management Report on Internal Control over Financial Reporting. Our responsibility is to express an opinion on the company’s internal control over financial reporting based on our audit.
We conducted our audit in accordance with the standards of the Public Company Accounting Oversight Board (United States). Those standards require that we plan and perform the audit to obtain reasonable assurance about whether effective internal control over financial reporting was maintained in all material respects. Our audit included obtaining an understanding of internal control over financial reporting, assessing the risk that a material weakness exists, testing and evaluating the design and operating effectiveness of internal control based on the assessed risk, and performing such other procedures as we considered necessary in the circumstances. We believe that our audit provides a reasonable basis for our opinion.
A company’s internal control over financial reporting is a process designed to provide reasonable assurance regarding the reliability of financial reporting and the preparation of financial statements for external purposes in accordance with generally accepted accounting principles. A company’s internal control over financial reporting includes those policies and procedures that (1) pertain to the maintenance of records that, in reasonable detail, accurately and fairly reflect the transactions and dispositions of the assets of the company; (2) provide reasonable assurance that transactions are recorded as necessary to permit preparation of financial statements in accordance with generally accepted accounting principles, and that receipts and expenditures of the company are being made only in accordance with authorizations of management and directors of the company; and (3) provide reasonable assurance regarding prevention or timely detection of unauthorized acquisition, use or disposition of the company’s assets that could have a material effect on the financial statements.
Because of its inherent limitations, internal control over financial reporting may not prevent or detect misstatements. Also, projections of any evaluation of effectiveness to future periods are subject to the risk that controls may become inadequate because of changes in conditions, or that the degree of compliance with the policies or procedures may deteriorate.
In our opinion, Kite Realty Group Trust and subsidiaries maintained, in all material respects, effective internal control over financial reporting as of December 31, 2010, based on the COSO criteria.
We also have audited, in accordance with the standards of the Public Company Accounting Oversight Board (United States), the consolidated balance sheets of Kite Realty Group Trust and subsidiaries as of December 31, 2010 and 2009, and the related consolidated statements of operations, shareholders’ equity and cash flows for each of the three years in the period ended December 31, 2010 and the related financial statement schedule listed in the index at Item 15(a) as of December 31, 2010 of Kite Realty Group Trust and subsidiaries and our report dated March 15, 2011 expressed an unqualified opinion thereon.
/s/ Ernst & Young LLP
Indianapolis, Indiana
March 15, 2011
64
ITEM 9B. OTHER INFORMATION
None.
ITEM 10. DIRECTORS, EXECUTIVE OFFICERS AND CORPORATE GOVERNANCE
We have adopted a code of ethics that applies to our principal executive officer and senior financial officers, which is available on our Internet website at: www.kiterealty.com. Any amendment to, or waiver from, a provision of this code of ethics will be posted on our Internet website.
The remaining information required by this Item is hereby incorporated by reference to the material appearing in our 2011 Annual Meeting Proxy Statement (the “Proxy Statement”), which we intend to file within 120 days after our fiscal year-end, under the captions “Proposal 1: Election of Trustees Nominees for Election for a One-Year Term Expiring at the 2011 Annual Meeting”, “Executive Officers”, “Information Regarding Governance and Board and Committee Meetings – Committee Charters and Corporate Governance”, “Information Regarding Corporate Governance and Board and Committee Meetings – Board Committees” and “Other Matters – Section 16(a) Beneficial Ownership Reporting Compliance”.
ITEM 11. EXECUTIVE COMPENSATION
The information required by this Item is hereby incorporated by reference to the material appearing in our Proxy Statement, under the captions “Compensation Discussion and Analysis”, “Compensation of Executive Officers and Trustees”, “Compensation Committee Interlocks and Insider Participation”, and “Compensation Committee Report”.
ITEM 12. SECURITY OWNERSHIP OF CERTAIN BENEFICIAL OWNERS AND MANAGEMENT AND RELATED SHAREHOLDER MATTERS
The information required by this Item is hereby incorporated by reference to the material appearing in our Proxy Statement, under the captions “Equity Compensation Plan Information” and “Principal Shareholders”.
ITEM 13. CERTAIN RELATIONSHIPS AND RELATED TRANSACTIONS AND DIRECTOR INDEPENDENCE
The information required by this Item is hereby incorporated by reference to the material appearing in our Proxy Statement, under the captions “Certain Relationships and Related Transactions” and “Information Regarding Corporate Governance and Board Committee Meetings – Independence of Trustees”.
ITEM 14. PRINCIPAL ACCOUNTANT FEES AND SERVICES
The information required by this Item is hereby incorporated by reference to the material appearing in our Proxy Statement, under the caption “Proposal 2: Ratification of Appointment of Independent Registered Accounting Firm - Relationship with Independent Registered Public Accounting Firm”.
65
ITEM 15. EXHIBITS, FINANCIAL STATEMENT SCHEDULE
|
(a)
|
Documents filed as part of this report:
|
|
|
(1)
|
Financial Statements:
|
|
|
Consolidated financial statements for the Company listed on the index immediately preceding the financial statements at the end of this report.
|
||
|
(2)
|
Financial Statement Schedule:
|
|
|
Financial statement schedule for the Company listed on the index immediately preceding the financial statements at the end of this report.
|
||
|
(3)
|
Exhibits:
|
|
|
The Company files as part of this report the exhibits listed on the Exhibit Index.
|
||
|
(b)
|
Exhibits:
|
|
|
The Company files as part of this report the exhibits listed on the Exhibit Index.
|
||
|
(c)
|
Financial Statement Schedule:
|
|
|
The Company files as part of this report the financial statement schedule listed on the index immediately preceding the financial statements at the end of this report.
|
||
66
Pursuant to the requirements of Section 13 or 15(d) of the Securities Exchange Act of 1934, the Registrant has duly caused this report to be signed on its behalf by the undersigned thereunto duly authorized.
|
KITE REALTY GROUP TRUST
|
||
|
(Registrant)
|
||
|
/s/ JOHN A. KITE
|
||
|
John A. Kite
|
||
|
March 15, 2011
|
Chairman and Chief Executive Officer
|
|
|
(Date)
|
(Principal Executive Officer)
|
|
|
/s/ DANIEL R. SINK
|
||
|
Daniel R. Sink
|
||
|
March 15, 2011
|
Executive Vice President and Chief Financial Officer
|
|
|
(Date)
|
(Principal Financial and
Accounting Officer)
|
|
Pursuant to the requirements of the Securities Exchange Act of 1934, this report has been signed below by persons on behalf of the Registrant and in the capacities and on the dates indicated.
|
Signature
|
Title
|
Date
|
||
|
/s/ JOHN A. KITE
|
Chairman, Chief Executive Officer, and Trustee
(Principal Executive Officer)
|
March 15, 2011
|
||
|
(John A. Kite)
|
||||
|
/s/ WILLIAM E. BINDLEY
|
Trustee
|
March 15, 2011
|
||
|
(William E. Bindley)
|
||||
|
/s/ RICHARD A. COSIER
|
Trustee
|
March 15, 2011
|
||
|
(Richard A. Cosier)
|
||||
|
/s/ EUGENE GOLUB
|
Trustee
|
March 15, 2011
|
||
|
(Eugene Golub)
|
||||
|
/s/ GERALD L. MOSS
|
Trustee
|
March 15, 2011
|
||
|
(Gerald L. Moss)
|
||||
|
/s/ MICHAEL L. SMITH
|
Trustee
|
March 15, 2011
|
||
|
(Michael L. Smith)
|
||||
|
/s/ DARELL E. ZINK, JR.
|
Trustee
|
March 15, 2011
|
||
|
(Darell E. Zink, Jr.)
|
||||
|
/s/ DANIEL R. SINK
|
Executive Vice President and Chief Financial Officer (Principal Financial and Accounting Officer)
|
March 15, 2011
|
||
|
(Daniel R. Sink)
|
67
Kite Realty Group Trust
Index to Financial Statements
|
Page
|
||
|
Consolidated Financial Statements:
|
||
|
Report of Independent Registered Public Accounting Firm
|
F-1
|
|
|
Balance Sheets as of December 31, 2010 and 2009
|
F-2
|
|
|
Statements of Operations for the Years Ended December 31, 2010, 2009, and 2008
|
F-3
|
|
|
Statements of Shareholders’ Equity for the Years Ended December 31, 2010, 2009, and 2008
|
F-4
|
|
|
Statements of Cash Flows for the Years Ended December 31, 2010, 2009, and 2008
|
F-5
|
|
|
Notes to Consolidated Financial Statements
|
F-6
|
|
|
Financial Statement Schedule:
|
||
|
Schedule III – Real Estate and Accumulated Depreciation
|
F-34
|
|
|
Notes to Schedule III
|
F-37
|
|
The Board of Trustees and Shareholders of Kite Realty Group Trust:
We have audited the accompanying consolidated balance sheets of Kite Realty Group Trust and subsidiaries as of December 31, 2010 and 2009, and the related consolidated statements of operations, shareholders’ equity, and cash flows for each of the three years in the period ended December 31, 2010. Our audit also included the financial statement schedule listed in the index at item 15(a). These financial statements and schedule are the responsibility of the Company’s management. Our responsibility is to express an opinion on these financial statements and schedule based on our audits.
We conducted our audits in accordance with auditing standards of the Public Company Accounting Oversight Board (United States). Those standards require that we plan and perform the audit to obtain reasonable assurance about whether the financial statements are free of material misstatement. An audit includes examining, on a test basis, evidence supporting the amounts and disclosures in the financial statements. An audit also includes assessing the accounting principles used and significant estimates made by management, as well as evaluating the overall financial statement presentation. We believe that our audits provide a reasonable basis for our opinion.
In our opinion, the financial statements referred to above present fairly, in all material respects, the consolidated financial position of Kite Realty Group Trust and subsidiaries at December 31, 2010 and 2009, and the consolidated results of their operations and their cash flows for each of the three years in the period ended December 31, 2010, in conformity with U.S. generally accepted accounting principles. Also, in our opinion, the related financial statement schedule, when considered in relation to the basic financial statements taken as a whole, presents fairly in all material respects the information set forth therein.
We also have audited, in accordance with the standards of the Public Company Accounting Oversight Board (United States), the effectiveness of Kite Realty Group Trust and subsidiaries’ internal control over financial reporting as of December 31, 2010, based on criteria established in Internal Control – Integrated Framework issued by the Committee of Sponsoring Organizations of the Treadway Commission and our report dated March 15, 2011 expressed an unqualified opinion thereon.
/s/ Ernst & Young LLP
Indianapolis, Indiana
March 15, 2011
F-1
Consolidated Balance Sheets
|
December 31,
2010
|
December 31,
2009
|
|||||||
|
Assets:
|
||||||||
|
Investment properties, at cost:
|
||||||||
|
Land
|
$ | 228,707,073 | $ | 226,506,781 | ||||
|
Land held for development
|
27,384,631 | 27,546,315 | ||||||
|
Buildings and improvements
|
780,038,034 | 736,027,845 | ||||||
|
Furniture, equipment and other
|
5,166,303 | 5,060,233 | ||||||
|
Construction in progress
|
158,636,747 | 176,689,227 | ||||||
| 1,199,932,788 | 1,171,830,401 | |||||||
|
Less: accumulated depreciation
|
(152,083,936 | ) | (127,031,144 | ) | ||||
| 1,047,848,852 | 1,044,799,257 | |||||||
|
Cash and cash equivalents
|
15,394,528 | 19,958,376 | ||||||
|
Tenant receivables, including accrued straight-line rent of $9,113,712 and $8,570,069, respectively, net of allowance for uncollectible accounts
|
18,204,215 | 18,537,031 | ||||||
|
Other receivables
|
5,484,277 | 9,326,475 | ||||||
|
Investments in unconsolidated entities, at equity
|
11,193,113 | 10,799,782 | ||||||
|
Escrow deposits
|
8,793,968 | 11,377,408 | ||||||
|
Deferred costs, net
|
24,207,046 | 23,703,901 | ||||||
|
Prepaid and other assets
|
1,656,746 | 2,183,214 | ||||||
|
Total Assets
|
$ | 1,132,782,745 | $ | 1,140,685,444 | ||||
|
Liabilities and Equity:
|
||||||||
|
Mortgage and other indebtedness
|
$ | 610,926,613 | $ | 658,294,513 | ||||
|
Accounts payable and accrued expenses
|
32,362,917 | 32,799,351 | ||||||
|
Deferred revenue and other liabilities
|
15,399,002 | 19,835,438 | ||||||
|
Total Liabilities
|
658,688,532 | 710,929,302 | ||||||
|
Commitments and contingencies
|
||||||||
|
Redeemable noncontrolling interests in Operating Partnership
|
44,115,028 | 47,307,115 | ||||||
|
Equity:
|
||||||||
|
Kite Realty Group Trust Shareholders’ Equity
|
||||||||
|
Preferred Shares, $.01 par value, 40,000,000 shares authorized, 2,800,000 and no shares issued and outstanding at December 31, 2010 and 2009, respectively
|
70,000,000 | — | ||||||
|
Common Shares, $.01 par value, 200,000,000 shares authorized, 63,342,219 shares and 63,062,083 shares issued and outstanding at December 31, 2010 and 2009, respectively
|
633,422 | 630,621 | ||||||
|
Additional paid in capital
|
448,779,180 | 449,863,390 | ||||||
|
Accumulated other comprehensive loss
|
(2,900,100 | ) | (5,802,406 | ) | ||||
|
Accumulated deficit
|
(93,447,581 | ) | (69,613,763 | ) | ||||
|
Total Kite Realty Group Trust Shareholders’ Equity
|
423,064,921 | 375,077,842 | ||||||
|
Noncontrolling Interests
|
6,914,264 | 7,371,185 | ||||||
|
Total Equity
|
429,979,185 | 382,449,027 | ||||||
|
Total Liabilities and Equity
|
$ | 1,132,782,745 | $ | 1,140,685,444 | ||||
The accompanying notes are an integral part of these consolidated financial statements.
F-2
Consolidated Statements of Operations
|
Year Ended December 31,
|
||||||||||||
|
2010
|
2009
|
2008
|
||||||||||
|
Revenue:
|
||||||||||||
|
Minimum rent
|
$ | 71,836,417 | $ | 71,612,415 | $ | 71,313,482 | ||||||
|
Tenant reimbursements
|
17,666,443 | 18,163,191 | 17,729,788 | |||||||||
|
Other property related revenue
|
5,065,169 | 6,065,708 | 13,916,680 | |||||||||
|
Construction and service fee revenue
|
6,848,073 | 19,450,789 | 39,103,151 | |||||||||
|
Total revenue
|
101,416,102 | 115,292,103 | 142,063,101 | |||||||||
|
Expenses:
|
||||||||||||
|
Property operating
|
17,691,738 | 18,188,710 | 16,388,515 | |||||||||
|
Real estate taxes
|
12,044,966 | 12,068,903 | 11,864,552 | |||||||||
|
Cost of construction and services
|
6,142,042 | 17,192,267 | 33,788,008 | |||||||||
|
General, administrative, and other
|
5,372,056 | 5,711,623 | 5,879,702 | |||||||||
|
Depreciation and amortization
|
40,732,228 | 32,148,318 | 34,892,975 | |||||||||
|
Total expenses
|
81,983,030 | 85,309,821 | 102,813,752 | |||||||||
|
Operating income
|
19,433,072 | 29,982,282 | 39,249,349 | |||||||||
|
Interest expense
|
(28,532,440 | ) | (27,151,054 | ) | (29,372,181 | ) | ||||||
|
Income tax (expense) benefit of taxable REIT subsidiary
|
(265,986 | ) | 22,293 | (1,927,830 | ) | |||||||
|
(Loss) income from unconsolidated entities
|
(51,964 | ) | 226,041 | 842,425 | ||||||||
|
Gain on sale of unconsolidated property
|
— | — | 1,233,338 | |||||||||
|
Non-cash gain from consolidation of subsidiary
|
— | 1,634,876 | — | |||||||||
|
Other income, net
|
231,178 | 224,927 | 157,955 | |||||||||
|
(Loss) income from continuing operations
|
(9,186,140 | ) | 4,939,365 | 10,183,056 | ||||||||
|
Discontinued operations:
|
||||||||||||
|
Discontinued operations
|
— | (732,621 | ) | 330,482 | ||||||||
|
Non-cash loss on impairment of discontinued operation
|
— | (5,384,747 | ) | — | ||||||||
|
(Loss) gain on sale of operating properties
|
— | — | (2,689,888 | ) | ||||||||
|
(Loss) income from discontinued operations
|
— | (6,117,368 | ) | (2,359,406 | ) | |||||||
|
Consolidated net (loss) income
|
(9,186,140 | ) | (1,178,003 | ) | 7,823,650 | |||||||
|
Net loss (income) attributable to noncontrolling interests
|
915,310 | (603,763 | ) | (1,730,524 | ) | |||||||
|
Net (loss)/income attributable to Kite Realty Group Trust
|
(8,270,830 | ) | (1,781,766 | ) | 6,093,126 | |||||||
|
Dividends on preferred shares
|
(376,979 | ) | — | — | ||||||||
|
Net (loss) income attributable to common shareholders
|
$ | (8,647,809 | ) | $ | (1,781,766 | ) | $ | 6,093,126 | ||||
|
(Loss) income per common share – basic:
|
||||||||||||
|
Income from continuing operations attributable to Kite Realty Group Trust common shareholders
|
$ | (0.14 | ) | $ | 0.07 | $ | 0.26 | |||||
|
(Loss) income from discontinued operations attributable to Kite Realty Group Trust common shareholders
|
— | (0.10 | ) | (0.06 | ) | |||||||
|
Net (loss) income attributable to Kite Realty Group Trust common shareholders
|
$ | (0.14 | ) | $ | (0.03 | ) | $ | 0.20 | ||||
|
(Loss) income per common share - diluted:
|
||||||||||||
|
Income from continuing operations attributable to Kite Realty Group Trust common shareholders
|
$ | (0.14 | ) | $ | 0.07 | $ | 0.26 | |||||
|
(Loss) income from discontinued operations attributable to Kite Realty Group Trust common shareholders
|
— | (0.10 | ) | (0.06 | ) | |||||||
|
Net (loss) income attributable to Kite Realty Group Trust common shareholders
|
$ | (0.14 | ) | $ | (0.03 | ) | $ | 0.20 | ||||
|
Weighted average Common Shares outstanding – basic
|
63,240,474 | 52,146,454 | 30,328,408 | |||||||||
|
Weighted average Common Shares outstanding – diluted
|
63,240,474 | 52,146,454 | 30,340,449 | |||||||||
|
Dividends declared per Common Share
|
$ | 0.2400 | $ | 0.3325 | $ | 0.8200 | ||||||
|
Net (loss) income attributable to Kite Realty Group Trust common shareholders:
|
||||||||||||
|
(Loss) income from continuing operations
|
$ | (8,647,809 | ) | $ | 3,515,875 | $ | 7,945,260 | |||||
|
Discontinued operations
|
— | (5,297,641 | ) | (1,852,134 | ) | |||||||
|
Net (loss) income attributable to Kite Realty Group Trust common shareholders
|
$ | (8,647,809 | ) | $ | (1,781,766 | ) | $ | 6,093,126 | ||||
|
Consolidated net (loss) income
|
$ | (9,186,140 | ) | $ | (1,178,003 | ) | $ | 7,823,650 | ||||
|
Other comprehensive income (loss)
|
3,274,373 | 3,032,080 | (6,443,839 | ) | ||||||||
|
Comprehensive (loss) income
|
(5,911,767 | ) | 1,854,077 | 1,379,811 | ||||||||
|
Comprehensive (income) loss attributable to noncontrolling interests
|
543,243 | (1,699,095 | ) | 96,643 | ||||||||
|
Comprehensive (loss) income attributable to Kite Realty Group Trust
|
$ | (5,368,524 | ) | $ | 154,982 | $ | 1,476,454 | |||||
The accompanying notes are an integral part of these consolidated financial statements.
F-3
Kite Realty Group Trust
Consolidated Statements of Shareholders’ Equity
|
Preferred Shares
|
Common Shares
|
Additional
Paid-in Capital
|
Accumulated Other
Comprehensive
Income (Loss)
|
Accumulated
Deficit
|
Total
|
|||||||||||||||
|
Shares
|
Amount
|
Shares
|
Amount
|
|||||||||||||||||
|
Balances, December 31, 2007
|
—
|
$
|
—
|
28,981,594
|
$
|
289,816
|
$
|
241,084,719
|
$
|
(3,122,482
|
)
|
$
|
(31,442,156
|
)
|
$
|
206,809,897
|
||||
|
Stock compensation activity
|
—
|
—
|
98,619
|
986
|
1,134,747
|
—
|
—
|
1,135,733
|
||||||||||||
|
Proceeds of common share offering, net of costs
|
—
|
—
|
4,810,000
|
48,100
|
48,257,025
|
—
|
—
|
48,305,125
|
||||||||||||
|
Proceeds from employee share purchase plan
|
—
|
—
|
5,197
|
52
|
29,956
|
—
|
—
|
30,008
|
||||||||||||
|
Other comprehensive loss attributable to Kite Realty Group Trust
|
—
|
—
|
—
|
—
|
—
|
(4,616,672
|
)
|
(4,616,672
|
)
|
|||||||||||
|
Distributions declared
|
—
|
—
|
—
|
—
|
—
|
—
|
(25,927,029
|
)
|
(25,927,029
|
)
|
||||||||||
|
Net income attributable to Kite Realty Group Trust
|
—
|
—
|
—
|
—
|
—
|
—
|
6,093,126
|
6,093,126
|
||||||||||||
|
Exchange of redeemable noncontrolling interest for common stock
|
—
|
—
|
285,769
|
2,858
|
632,140
|
—
|
—
|
634,998
|
||||||||||||
|
Adjustment to redeemable noncontrolling interests - Operating Partnership
|
—
|
—
|
—
|
—
|
52,493,008
|
—
|
—
|
52,493,008
|
||||||||||||
|
Balances, December 31, 2008
|
—
|
$
|
—
|
34,181,179
|
$
|
341,812
|
$
|
343,631,595
|
$
|
(7,739,154
|
)
|
$
|
(51,276,059
|
)
|
$
|
284,958,194
|
||||
|
Stock compensation activity
|
—
|
—
|
40,984
|
410
|
865,597
|
—
|
—
|
866,007
|
||||||||||||
|
Proceeds of common share offering, net of costs
|
—
|
—
|
28,750,000
|
287,500
|
87,199,059
|
—
|
—
|
87,486,559
|
||||||||||||
|
Proceeds from employee share purchase plan
|
—
|
—
|
15,939
|
159
|
51,012
|
—
|
—
|
51,171
|
||||||||||||
|
Other comprehensive income attributable to Kite Realty Group Trust
|
—
|
—
|
—
|
—
|
—
|
1,936,748
|
—
|
1,936,748
|
|
|||||||||||
|
Distributions declared
|
—
|
—
|
—
|
—
|
—
|
—
|
(16,555,938
|
)
|
(16,555,938
|
)
|
||||||||||
|
Net loss attributable to Kite Realty Group Trust
|
—
|
—
|
—
|
—
|
—
|
—
|
(1,781,766
|
)
|
(1,781,766
|
)
|
||||||||||
|
Exchange of redeemable noncontrolling interest for common stock
|
—
|
—
|
73,981
|
740
|
1,124,247
|
—
|
—
|
1,124,987
|
||||||||||||
|
Adjustment to redeemable noncontrolling interests - Operating Partnership
|
—
|
—
|
—
|
—
|
16,991,880
|
—
|
—
|
16,991,880
|
||||||||||||
|
Balances, December 31, 2009
|
—
|
$
|
—
|
63,062,083
|
$
|
630,621
|
$
|
449,863,390
|
$
|
(5,802,406
|
)
|
$
|
(69,613,763
|
)
|
$
|
375,077,842
|
||||
|
Stock compensation activity
|
—
|
—
|
150,825
|
1,508
|
763,369
|
764,877
|
||||||||||||||
|
Proceeds of preferred share offering, net
|
2,800,000
|
70,000,000
|
(2,517,500
|
)
|
67,482,500
|
|||||||||||||||
|
Proceeds from employee share purchase plan
|
—
|
—
|
9,311
|
93
|
39,301
|
39,394
|
||||||||||||||
|
Other comprehensive income attributable to Kite Realty Group Trust
|
—
|
—
|
2,902,306
|
2,902,306
|
||||||||||||||||
|
Distributions declared to common shareholders
|
—
|
(15,186,009
|
)
|
(15,186,009
|
)
|
|||||||||||||||
|
Distributions to preferred shareholders
|
—
|
(376,979
|
)
|
(376,979
|
)
|
|||||||||||||||
|
Net loss attributable to Kite Realty Group Trust
|
—
|
—
|
(8,270,830
|
)
|
(8,270,830
|
)
|
||||||||||||||
|
Exchange of redeemable noncontrolling interest for common stock
|
—
|
—
|
120,000
|
1,200
|
1,558,800
|
1,560,000
|
||||||||||||||
|
Adjustments to redeemable noncontrolling interests – Operating Partnership
|
—
|
—
|
(928,180
|
)
|
(928,180
|
)
|
||||||||||||||
|
Balances, December 31, 2010
|
2,800,000
|
$
|
70,000,000
|
63,342,219
|
$
|
633,422
|
$
|
448,779,180
|
$
|
(2,900,100
|
)
|
$
|
(93,447,581
|
)
|
$
|
423,064,921
|
||||
The accompanying notes are an integral part of these consolidated financial statements.
F-4
Kite Realty Group Trust
Consolidated Statements of Cash Flows
|
Year Ended December 31,
|
||||||||||||
|
2010
|
2009
|
2008
|
||||||||||
|
Cash flow from operating activities:
|
||||||||||||
|
Consolidated net (loss) income
|
$ | (9,186,140 | ) | $ | (1,178,003 | ) | $ | 7,823,650 | ||||
|
Adjustments to reconcile consolidated net (loss) income to net cash provided by operating activities:
|
||||||||||||
|
Non-cash loss on impairment of real estate asset
|
— | 5,384,747 | — | |||||||||
|
Non-cash gain from consolidation of subsidiary
|
— | (1,634,876 | ) | — | ||||||||
|
Net loss (gain) on sale of operating property
|
— | — | 2,689,888 | |||||||||
|
Gain on sale of unconsolidated property
|
— | — | (1,233,338 | ) | ||||||||
|
Loss (income) from unconsolidated entities
|
51,964 | (226,041 | ) | (842,425 | ) | |||||||
|
Straight-line rent
|
(547,063 | ) | (1,591,209 | ) | (1,040,456 | ) | ||||||
|
Depreciation and amortization
|
42,564,646 | 34,003,017 | 37,256,010 | |||||||||
|
Provision for credit losses, net of recoveries
|
1,443,675 | 2,104,841 | 1,212,604 | |||||||||
|
Compensation expense for equity awards
|
488,557 | 526,795 | 803,687 | |||||||||
|
Amortization of debt fair value adjustment
|
(430,858 | ) | (430,858 | ) | (430,858 | ) | ||||||
|
Amortization of in-place lease liabilities
|
(2,822,305 | ) | (3,120,359 | ) | (2,769,256 | ) | ||||||
|
Distributions of income from unconsolidated entities
|
— | 145,701 | 428,910 | |||||||||
|
Changes in assets and liabilities:
|
||||||||||||
|
Tenant receivables
|
(539,800 | ) | (566,121 | ) | (1,217,894 | ) | ||||||
|
Deferred costs and other assets
|
421,494 | (2,309,437 | ) | (6,095,991 | ) | |||||||
|
Accounts payable, accrued expenses, deferred revenue, and other liabilities
|
(1,178,564 | ) | (10,116,910 | ) | 4,477,867 | |||||||
|
Net cash provided by operating activities
|
30,265,606 | 20,991,287 | 41,062,398 | |||||||||
|
Cash flow from investing activities:
|
||||||||||||
|
Acquisitions of interests in properties and capital expenditures, net
|
(39,032,155 | ) | (36,806,704 | ) | (117,851,086 | ) | ||||||
|
Net proceeds from sales of operating properties
|
— | — | 19,659,695 | |||||||||
|
Change in construction payables
|
2,392,632 | (5,036,410 | ) | 579,721 | ||||||||
|
Cash receipts on notes receivable
|
— | — | 729,167 | |||||||||
|
Note receivable from joint venture partner
|
687,648 | (1,375,298 | ) | — | ||||||||
|
Contributions to unconsolidated entities
|
(445,295 | ) | (12,044,052 | ) | (818,472 | ) | ||||||
|
Cash from consolidation of subsidiary
|
— | 247,969 | — | |||||||||
|
Distributions of capital from unconsolidated entities
|
— | 167,361 | 2,012,430 | |||||||||
|
Net cash used in investing activities
|
(36,397,170 | ) | (54,847,134 | ) | (95,688,545 | ) | ||||||
|
Cash flow from financing activities:
|
||||||||||||
|
Common share issuance proceeds, net of costs
|
39,394 | 87,537,730 | 48,335,133 | |||||||||
|
Preferred share issuance proceeds, net of costs
|
67,482,500 | — | — | |||||||||
|
Loan proceeds
|
58,726,952 | 93,536,599 | 249,453,785 | |||||||||
|
Loan transaction costs
|
(989,943 | ) | (981,163 | ) | (1,882,360 | ) | ||||||
|
Loan payments
|
(105,663,994 | ) | (112,472,694 | ) | (218,194,446 | ) | ||||||
|
Distributions paid – common shareholders
|
(15,546,044 | ) | (19,746,716 | ) | (24,859,003 | ) | ||||||
|
Distributions paid – redeemable noncontrolling interests
|
(1,907,073 | ) | (3,877,243 | ) | (6,817,069 | ) | ||||||
|
Distributions to noncontrolling interests
|
(574,076 | ) | (100,165 | ) | (494,286 | ) | ||||||
|
Net cash provided by financing activities
|
1,567,716 | 43,896,348 | 45,541,754 | |||||||||
|
(Decrease) increase in cash and cash equivalents
|
(4,563,848 | ) | 10,040,501 | (9,084,393 | ) | |||||||
|
Cash and cash equivalents, beginning of year
|
19,958,376 | 9,917,875 | 19,002,268 | |||||||||
|
Cash and cash equivalents, end of year
|
$ | 15,394,528 | $ | 19,958,376 | $ | 9,917,875 | ||||||
|
Supplemental disclosures
|
||||||||||||
|
Cash paid for interest, net of capitalized interest
|
$ | 26,661,839 | $ | 25,830,213 | $ | 28,439,879 | ||||||
|
Cash paid for taxes
|
$ | 298,493 | $ | 110,225 | $ | 2,601,000 | ||||||
The accompanying notes are an integral part of these consolidated financial statements.
F-5
Kite Realty Group Trust
Notes to Consolidated Financial Statements
December 31, 2010
Note 1. Organization
Kite Realty Group Trust (the “Company” or “REIT”) was organized in Maryland in 2004 to succeed the development, acquisition, construction and real estate businesses of Kite Property Group (the “Predecessor”). The Predecessor was owned by Al Kite, John Kite and Paul Kite (the “Principals”) and certain executives and other family members and consisted of the properties, entities and interests contributed to the Company or its subsidiaries by its founders. The Company began operations in 2004 when it completed its initial public offering of common shares and concurrently consummated certain other formation transactions.
The Company, through Kite Realty Group, L.P. (“the Operating Partnership”), is engaged in the ownership, operation, management, leasing, acquisition, construction management, redevelopment and development of neighborhood and community shopping centers and certain commercial real estate properties in selected markets in the United States. The Company also provides real estate facilities management, construction management, development and other advisory services to third parties through its taxable REIT subsidiaries.
At December 31, 2010, the Company owned interests in 57 operating properties (consisting of 53 retail properties and four commercial operating properties) and six properties under development or redevelopment. The Company also owned parcels in a future development pipeline which includes land parcels that are undergoing pre-development activities and are in various stages of preparation for construction to commence, including pre-leasing activity and negotiations for third-party financings. As of December 31, 2010, this future development pipeline consisted of five projects that are expected to contain approximately 2.5 million square feet of total gross leasable area (including non-owned anchor space) upon completion. Finally, as of December 31, 2010, the Company also owned interests in other land parcels comprising 93 acres that are expected to be used for future expansion of existing properties, development of new retail or commercial properties. We may elect to sell such land to third parties under certain circumstances. These land parcels are classified as “Land held for development” in the accompanying consolidated balance sheets.
At December 31, 2009, the Company owned interests in 55 operating properties (consisting of 51 retail properties, four commercial operating properties), seven properties under development or redevelopment and 95 acres of land held for development.
Note 2. Basis of Presentation and Summary of Significant Accounting Policies
The accompanying financial statements have been prepared in accordance with accounting principles generally accepted in the United States (“GAAP”). GAAP requires management to make estimates and assumptions that affect the reported amounts of assets and liabilities, disclosure of contingent assets and liabilities at the date of the financial statements, and revenues and expenses during the reported period. Actual results could differ from these estimates.
Consolidation and Investments in Joint Ventures
The accompanying financial statements of the Company are presented on a consolidated basis and include all accounts of the Company, the Operating Partnership, the taxable REIT subsidiary of the Operating Partnership, subsidiaries of the Company or the Operating Partnership that are controlled and any variable interest entities (“VIEs”) in which the Company is the primary beneficiary. In general, a VIE is a corporation, partnership, trust or any other legal structure used for business purposes that either (a) has equity investors that do not provide sufficient financial resources for the entity to support its activities, (b) does not have equity investors with voting rights or (c) has equity investors whose votes are disproportionate from their economics and substantially all of the activities are conducted on behalf of the investor with disproportionately fewer voting rights. The Company consolidates properties that are wholly owned as well as properties it controls but in which it owns less than a 100% interest. Control of a property is demonstrated by, among other factors:
|
|
·
|
the Company’s ability to refinance debt and sell the property without the consent of any other partner or owner;
|
|
|
·
|
the inability of any other partner or owner to replace the Company as manager of the property; or
|
|
|
·
|
being the primary beneficiary of a VIE. The primary beneficiary is defined as the entity that has (i) the power to direct the activities of the VIE that most significantly impact the VIE’s economic performance, and (ii) the obligation to absorb losses or the right to receive benefits that could potentially be significant to the VIE.
|
F-6
As of December 31, 2010, the Company had investments in seven joint ventures that are VIEs in which the Company is the primary beneficiary. As of this date, these VIEs had total debt of $86.6 million which is secured by assets of the VIEs totaling $177.4 million. The Operating Partnership guarantees the debt of these VIEs.
The Company accounts for its investments in unconsolidated joint ventures under the equity method of accounting as it exercises significant influence over, but does not control, operating and financial policies. These investments are recorded initially at cost and subsequently adjusted for equity in earnings and cash contributions and distributions.
The Company considers all relationships between itself and the VIE, including development agreements, management agreements and other contractual arrangements, in determining whether it has the power to direct the activities of the VIE that most significantly affect the VIE’s performance. The Company also continuously reassesses primary beneficiary status. Other than with regard to The Centre, as described below, there were no changes during the years ended December 31, 2010, 2009 or 2008 to the Company’s conclusions regarding whether an entity qualifies as a VIE or whether the Company is the primary beneficiary of any previously identified VIE.
The Company reviews its investments in unconsolidated entities for impairment. When circumstances indicate there may have been a loss in value of an equity method investment, the Company evaluates the investment for impairment by estimating its ability to recover its investments from future expected cash flows. If it determines the loss in value is other than temporary, the Company will recognize an impairment charge to reflect the investment at fair value. The use of projected future cash flows and other estimates of fair value and the determination of when a loss is other than temporary are complex and subjective. Use of other estimates and assumptions may results in different conclusions. Changes in economic and operating conditions that occur subsequent to the Company’s review could impact these assumptions and result in future impairment charges of the equity investments.
The Centre
The Centre is a retail operating property located in Carmel, Indiana. In 2009, the third-party loan secured by the assets of The Centre, a previously unconsolidated operating property in which the Company owned a 60% interest, matured. In order to pay off this loan, the Company made a capital contribution of $2.1 million and simultaneously extended a loan of $1.4 million to the partnership. The Company’s extension of a loan to the partnership caused the Company to reevaluate whether The Centre qualifies as a VIE and whether the Company is its primary beneficiary. The analysis concluded that The Centre qualified as a VIE and the Company was its primary beneficiary. As a result, the financial statements of The Centre were consolidated as of September 30, 2009, the assets and liabilities were recorded at fair value, and a non-cash gain of $1.6 million was recorded, of which the Company’s share was $1.0 million. The fair values recognized from the real estate and related assets acquired were primarily determined using the income approach. The most significant assumptions in the fair value estimates were the discount rates, market leasing rates, and exit capitalization rates using Level 2 and Level 3 inputs.
In February 2011, the Company acquired the remaining 40% interest in The Centre from its joint venture partners for $2.3 million and assumed all leasing and management responsibilities.
Purchase Accounting
In accordance with Topic 805—“Business Combinations” in the ASC, the Company measures identifiable assets acquired, liabilities assumed, and any non-controlling interests in an acquiree at fair value on the acquisition date, with goodwill being the excess value over the net identifiable assets acquired. In making estimates of fair values for the purpose of allocating purchase price, a number of sources are utilized, including information obtained as a result of pre-acquisition due diligence, marketing and leasing activities.
A portion of the purchase price is allocated to tangible assets and intangibles, including:
|
·
|
the fair value of the building on an as-if-vacant basis and to land determined either by real estate tax assessments, independent appraisals or other relevant data;
|
F-7
|
·
|
above-market and below-market in-place lease values for acquired properties are based on the present value (using an interest rate which reflects the risks associated with the leases acquired) of the difference between (i) the contractual amounts to be paid pursuant to the in-place leases and (ii) management’s estimate of fair market lease rates for the corresponding in-place leases, measured over the remaining non-cancelable term of the leases. The capitalized above-market and below-market lease values are amortized as a reduction of or addition to rental income over the remaining non-cancelable terms of the respective leases. Should a tenant vacate, terminate its lease, or otherwise notify the Company of its intent to do so, the unamortized portion of the lease intangibles would be charged or credited to income; and
|
|
·
|
the value of leases acquired. The Company utilizes independent sources for its estimates to determine the respective in-place lease values. The Company’s estimates of value are made using methods similar to those used by independent appraisers. Factors the Company considers in their analysis include an estimate of costs to execute similar leases including tenant improvements, leasing commissions and foregone costs and rent received during the estimated lease-up period as if the space was vacant. The value of in-place leases is amortized to expense over the remaining initial terms of the respective leases.
|
The Company also considers whether a portion of the purchase price should be allocated to in-place leases that have a related customer relationship intangible value. Characteristics the Company considers in allocating these values include the nature and extent of existing business relationships with the tenant, growth prospects for developing new business with the tenant, the tenant’s credit quality, and expectations of lease renewals, among other factors. To date, a tenant relationship has not been developed that is considered to have a current intangible value.
Due to the January 1, 2009 adoption of new accounting guidance regarding business combinations, the costs of an acquisition are expensed in the period incurred.
Investment Properties
Capitalization and Depreciation
Investment properties are recorded at cost and include costs of acquisitions, development, pre-development, construction, certain allocated overhead, tenant allowances and improvements, and interest and real estate taxes incurred during construction. Significant renovations and improvements are capitalized when they extend the useful life, increase capacity, or improve the efficiency of the asset. If a tenant vacates a space prior to the lease expiration, terminates its lease, or otherwise notifies the Company of its intent to do so, any related unamortized tenant allowances are immediately expensed. Maintenance and repairs that do not extend the useful lives of the respective assets are reflected in property operating expense.
The Company incurs costs prior to land acquisition and for certain land held for development including acquisition contract deposits, as well as legal, engineering and other external professional fees related to evaluating the feasibility of developing a shopping center or other project. These pre-development costs are included in construction in progress in the accompanying consolidated balance sheets. If the Company determines that the development of a property is no longer probable, any pre-development costs previously incurred are immediately expensed. Once construction commences on the land, it is transferred to construction in progress.
The Company also capitalizes costs such as construction, interest, real estate taxes, and salaries and related costs of personnel directly involved with the development of our properties. As portions of the development property become operational, the Company expenses appropriate costs on a pro rata basis.
Depreciation on buildings and improvements is provided utilizing the straight-line method over estimated original useful lives ranging from 10 to 35 years. Depreciation on tenant allowances and improvements is provided utilizing the straight-line method over the term of the related lease. Depreciation on equipment and fixtures is provided utilizing the straight-line method over 5 to 10 years.
Impairment
Management reviews both operational and development properties, land parcels and intangible assets within the real estate operation and development segment for impairment on at least a quarterly basis or whenever events or changes in circumstances indicate that the carrying value of investment properties may not be recoverable. The review for possible impairment requires management to make certain assumptions and estimates and requires significant judgment. Impairment losses for investment properties are measured when the undiscounted cash flows estimated to be generated by the investment properties during the expected holding period are less than the carrying amounts of those assets. Impairment losses are recorded as the excess of the carrying value over the estimated fair value of the asset.
F-8
In the third quarter of 2009, as part of its regular quarterly review, the Company determined that it was appropriate to write off the net book value on the Galleria Plaza operating property in Dallas, Texas and recognize a non-cash impairment charge of $5.4 million.
Held for Sale and Discontinued Operations
Operating properties held for sale include only those properties available for immediate sale in their present condition and for which management believes it is probable that a sale of the property will be completed within one year among other factors. Operating properties are carried at the lower of cost or fair value less costs to sell. Depreciation and amortization are suspended during the period during which the asset is held-for-sale. There were no assets classified as held for sale as of December 31, 2010 or 2009.
The Company’s properties generally have operations and cash flows that can be clearly distinguished from the rest of the Company. The operations reported in discontinued operations include those operating properties that were sold, disposed of or considered held-for-sale and for which operations and cash flows can be clearly distinguished. The operations from these properties are eliminated from ongoing operations and the Company will not have a continuing involvement after disposition. Prior periods have been reclassified to reflect the operations of these properties as discontinued operations to the extent they are material to the results of operations.
Escrow Deposits
Escrow deposits consist of cash held for real estate taxes, property maintenance, insurance and other requirements at specific properties as required by lending institutions.
Cash and Cash Equivalents
The Company considers all highly liquid investments purchased with an original maturity of 90 days or less to be cash and cash equivalents. As of December 31, 2010, the majority of the Company’s cash and cash equivalents were held in deposit accounts that are 100% insured by the federal government’s Temporary Liquidity Guarantee Program. From time to time, such investments may temporarily be held in accounts that are not insured under this program and which are in excess of FDIC and SIPC insurance limits; however the Company attempts to limit its exposure at any one time.
The Company maintains certain compensating balances in several financial institutions in support of borrowings from those institutions. Such compensating balances were not material to the consolidated balance sheets.
Fair Value Measurements
Cash and cash equivalents, accounts receivable, escrows and deposits, and other working capital balances approximate fair value.
As discussed below under “Derivative Financial Instruments,” the Company accounts for its derivative financial instruments at fair value calculated in accordance with Topic 820—“Fair Value Measurements and Disclosures” in the ASC. Fair value is a market-based measurement, not an entity-specific measurement. Therefore, a fair value measurement should be determined based on the assumptions that market participants would use in pricing the asset or liability. The fair value hierarchy distinguishes between market participant assumptions based on market data obtained from sources independent of the reporting entity (observable inputs for identical instruments that are classified within Level 1 and observable inputs for similar instruments that are classified within Level 2) and the reporting entity’s own assumptions about market participant assumptions (unobservable inputs classified within Level 3). As further discussed in Note 10, the Company has determined that its derivative valuations in their entirety are classified in Level 2 of the fair value hierarchy.
Derivative Financial Instruments
All derivative instruments are recorded on the consolidated balance sheets at fair value. Gains or losses resulting from changes in the fair values of those derivatives are accounted for depending on the use of the derivative and whether it qualifies for hedge accounting. The Company uses derivative instruments such as interest rate swaps or rate locks to mitigate interest rate risk on related financial instruments.
F-9
Changes in the fair values of derivatives that qualify as cash flow hedges are recognized in other comprehensive income (“OCI”) while any ineffective portion of a derivative’s change in fair value is recognized immediately in earnings. Upon settlement of the hedge, gains and losses associated with the transaction are recorded in OCI and amortized over the underlying term of the hedge transaction. All of the Company’s derivative instruments qualify for hedge accounting.
Revenue Recognition
As lessor, the Company retains substantially all of the risks and benefits of ownership of the investment properties and accounts for its leases as operating leases.
Base minimum rents are recognized on a straight-line basis over the terms of the respective leases. Certain lease agreements contain provisions that grant additional rents based on tenants’ sales volume (contingent percentage rent). Percentage rents are recognized when tenants achieve the specified targets as defined in their lease agreements. Percentage rents are included in other property related revenue in the accompanying consolidated statements of operations.
Reimbursements from tenants for real estate taxes and other recoverable operating expenses are estimated and recognized as revenues in the period the applicable expense is incurred.
Gains from sales of real estate are not recognized unless a sale has been consummated, the buyer’s initial and continuing investment is adequate to demonstrate a commitment to pay for the property, the Company has transferred to the buyer the usual risks and rewards of ownership, and the Company does not have a substantial continuing financial involvement in the property. As part of the Company’s ongoing business strategy, it will, from time to time, sell land parcels and outlots, some of which are ground leased to tenants. Net gains realized on such sales were $2.6 million, $2.9 million, and $10.0 million for the years ended December 31, 2010, 2009, and 2008, respectively, and are classified as other property related revenue in the accompanying consolidated statements of operations.
Revenues from construction contracts are recognized on the percentage-of-completion method, measured by the percentage of cost incurred to date to the estimated total cost for each contract. Project costs include all direct labor, subcontract, and material costs and those indirect costs related to contract performance incurred to date. Project costs do not include uninstalled materials. Provisions for estimated losses on uncompleted contracts are made in the period in which such losses are determined. Changes in job performance, job conditions, and estimated profitability may result in revisions to costs and income, which are recognized in the period in which the revisions are determined.
From time to time, the Company will construct and sell build-to-suit merchant assets to third parties. Proceeds from the sale of build-to-suit merchant assets are included in construction and service fee revenue, and the related costs of the sale of these assets are included in cost of construction and services in the accompanying consolidated financial statements. There were no proceeds from the sale of build-to-suit assets or associated construction costs for the years ended December 31, 2010 and 2009. Revenue from such sales was $10.6 million for the year ended December 31, 2008, and the associated construction costs were $9.4 million.
Development and other advisory services fees are recognized as revenues in the period in which the services are rendered. Performance-based incentive fees are recorded when the fees are earned.
Tenant Receivables and Allowance for Doubtful Accounts
Tenant receivables consist primarily of billed minimum rent, accrued and billed tenant reimbursements, and accrued straight-line rent. The Company generally does not require specific collateral other than corporate or personal guarantees from its tenants.
An allowance for doubtful accounts is maintained for estimated losses resulting from the inability of certain tenants or others to meet contractual obligations under their lease or other agreements. Accounts are written off when, in the opinion of management, the balance is uncollectible.
|
2010
|
2009
|
2008
|
||||||||||
|
Balance, beginning of year
|
$ | 1,913,584 | $ | 808,024 | $ | 745,479 | ||||||
|
Provision for credit losses, net of recoveries
|
1,443,675 | 2,104,841 | 1,212,604 | |||||||||
|
Accounts written off
|
(1,727,376 | ) | (999,281 | ) | (1,150,059 | ) | ||||||
|
Balance, end of year
|
$ | 1,629,883 | $ | 1,913,584 | $ | 808,024 | ||||||
F-10
Other Receivables
Other receivables consist primarily of receivables due in the ordinary course of the Company’s construction and advisory services business.
Concentration of Credit Risk
The Company may be subject to concentrations of credit risk with regards to its cash and cash equivalents. The Company places its cash and temporary cash investments with high-credit-quality financial institutions. From time to time, such cash and investments may temporarily be in excess of FDIC and SIPC insurance limits. In addition, the Company’s accounts receivable from and leases with tenants potentially subjects it to a concentration of credit risk related to its accounts receivable and revenue. At December 31, 2010, 44%, 16% and 11% of total billed receivable were due from tenants leasing space in the states of Indiana, Florida, and Texas, respectively. For the year ended December 31, 2010, 39%, 24% and 15% of the Company’s revenue recognized was from tenants leasing space in the states of Indiana, Florida, and Texas, respectively.
Earnings Per Share
Basic earnings per share is calculated based on the weighted average number of shares outstanding during the period. Diluted earnings per share is determined based on the weighted average number of shares outstanding combined with the incremental average shares that would have been outstanding assuming all potentially dilutive shares were converted into common shares as of the earliest date possible.
Potentially dilutive securities include outstanding share options, units in the Operating Partnership, which may be exchanged for either cash or common shares, at our option, under certain circumstances, and deferred share units, which may be credited to the accounts of non-employee trustees in lieu of the payment of cash compensation or the issuance of common shares to such trustees. Due to the Company’s net loss for the years ended December 31, 2010 and 2009, the potentially dilutive securities were not dilutive for these periods. For the year ended December 31, 2008, 12,041 outstanding deferred share units had a potentially dilutive effect.
For each of the years ended December 31, 2010, 2009 and 2008, 1.7 million, 1.4 million, and 1.4 million of the Company’s outstanding common share options were excluded from the computation of diluted earnings per share because their impact was not dilutive.
The effect of conversion of units of the Operating Partnership is not reflected in diluted common shares, as they are exchangeable for common shares on a one-for-one basis. The income allocable to such units is allocated on the same basis and reflected as redeemable noncontrolling interests in the Operating Partnership in the accompanying consolidated statements of operations. Therefore, the assumed conversion of these units would have no effect on the determination of income per common share.
Income Taxes and REIT Compliance
The Company, which is considered a corporation for federal income tax purposes, qualifies as a REIT and generally will not be subject to federal income tax to the extent it distributes its REIT taxable income to its shareholders and meets certain other requirements on a recurring basis. REITs are subject to a number of organizational and operational requirements. If the Company fails to qualify as a REIT in any taxable year, the Company will be subject to federal income tax on its taxable income at regular corporate rates. The Company may also be subject to certain state and local taxes on its income and property and to federal income and excise taxes on its undistributed taxable income even if it does qualify as a REIT. For example, the Company will be subject to income tax to the extent it distributes less than 90% of its REIT taxable income (including capital gains).
The Company has elected taxable REIT subsidiary (“TRS”) status for some of its subsidiaries as permitted by the Code. This enables the Company to receive income and provide services that would otherwise be impermissible for REITs. Deferred tax assets and liabilities are established for temporary differences between the financial reporting bases and the tax bases of assets and liabilities at the enacted rates expected to be in effect when the temporary differences reverse. Deferred tax assets are reduced by a valuation allowance if it is more likely than not that some portion or all of the deferred tax asset will not be realized.
Income tax provision for the years ended December 31, 2010 and 2008 was $266,000 and $1.9 million, respectively. Income tax provision for the year ended December 31, 2008 included $1.2 million incurred in connection with the Company’s taxable REIT subsidiary’s sale of land in the first quarter of 2008 as well as $0.5 million incurred in connection with the taxable REIT subsidiary’s sale of Spring Mill Medical, Phase II, a consolidated joint venture property that owned a build-to-suit commercial asset. For the year ended December 31, 2009, there was an insignificant income tax benefit recorded.
Franchise and other taxes were not significant in any of the periods presented.
F-11
Noncontrolling Interests
The Company reports its noncontrolling interest in a subsidiary as equity and the amount of consolidated net income specifically attributable to the noncontrolling interest is identified in the consolidated financial statements.
The noncontrolling interests in the properties for the years ended December 31, 2010, 2009, and 2008 were as follows:
|
2010
|
2009
|
2008
|
||||||||||
|
Noncontrolling interests balance January 1
|
$ | 7,371,185 | $ | 4,416,533 | $ | 4,731,211 | ||||||
|
Net income allocable to noncontrolling interests, excluding redeemable noncontrolling interests
|
117,155 | 879,463 | 61,707 | |||||||||
|
Distributions to noncontrolling interests
|
(574,076 | ) | (100,165 | ) | (398,899 | ) | ||||||
|
Recognition of noncontrolling interests upon consolidation of subsidiary and other
|
— | 2,175,354 | 22,514 | |||||||||
|
Noncontrolling interests balance at December 31
|
$ | 6,914,264 | $ | 7,371,185 | $ | 4,416,533 | ||||||
The Company classifies redeemable noncontrolling interests in the Operating Partnership in the accompanying consolidated balance sheets outside of permanent equity because the Company may be required to pay cash to unitholders upon redemption of their interests in the limited partnership under certain circumstances.
The redeemable noncontrolling interests in the Operating Partnership for the years ended December 31, 2010, 2009, and 2008 were as follows:
|
2010
|
2009
|
2008
|
||||||||||
|
Redeemable noncontrolling interests balance January 1
|
$ | 47,307,115 | $ | 67,276,904 | $ | 127,325,047 | ||||||
|
Net (loss) income allocable to redeemable noncontrolling interests
|
(1,032,465 | ) | (275,700 | ) | 1,668,817 | |||||||
|
Accrued distributions to redeemable noncontrolling interests
|
(1,899,839 | ) | (2,672,554 | ) | (6,761,787 | ) | ||||||
|
Other comprehensive loss allocable to redeemable noncontrolling interests 1
|
372,037 | 1,095,332 | (1,827,167 | ) | ||||||||
|
Exchange of redeemable noncontrolling interest for common stock
|
(1,560,000 | ) | (1,124,987 | ) | (634,998 | ) | ||||||
|
Adjustment to redeemable noncontrolling interests - Operating Partnership2
|
928,180 | (16,991,880 | ) | (52,493,008 | ) | |||||||
|
Redeemable noncontrolling interests balance at December 31
|
$ | 44,115,028 | $ | 47,307,115 | $ | 67,276,904 | ||||||
|
____________________
|
|
|
1
|
Represents the noncontrolling interests’ share of the changes in the fair value of derivative instruments accounted for as cash flow hedges (see Note 11).
|
|
2
|
Includes adjustments to reflect amounts at the greater of historical book value or redemption value.
|
F-12
The following sets forth accumulated other comprehensive loss allocable to noncontrolling interests for the years ended December 31, 2010, 2009, and 2008:
|
2010
|
2009
|
2008
|
||||||||||
|
Accumulated comprehensive loss balance at January 1
|
$ | (731,835 | ) | $ | (1,827,167 | ) | $ | — | ||||
|
Other comprehensive income (loss) allocable to noncontrolling interests 1
|
372,037 | 1,095,332 | (1,827,167 | ) | ||||||||
|
Accumulated comprehensive loss balance at December 31
|
$ | (359,798 | ) | $ | (731,835 | ) | $ | (1,827,167 | ) | |||
|
____________________
|
|
|
1
|
Represents the noncontrolling interests’ share of the changes in the fair value of derivative instruments accounted for as cash flow hedges (see Note 11).
|
The carrying amount of the redeemable noncontrolling interests in the Operating Partnership is required to be reflected at the greater of historical book value or redemption value with a corresponding adjustment to additional paid in capital. As of December 31, 2010, 2009 and 2008, the historic book value of the redeemable noncontrolling interests exceeded the redemption value, so no adjustment was necessary.
The Company allocates net operating results of the Operating Partnership based on the partners’ respective weighted average ownership interest. The Company adjusts the redeemable noncontrolling interests in the Operating Partnership at the end of each period to reflect their interests in the Operating Partnership. This adjustment is reflected in the Company’s shareholders’ equity. The Company’s and the redeemable noncontrolling weighted average interests in the Operating Partnership for the years ended December 31, 2010, 2009, and 2008 were as follows:
|
Year Ended December 31,
|
||||||||||||
|
2010
|
2009
|
2008
|
||||||||||
|
Company’s weighted average diluted interest in Operating Partnership
|
88.9 | % | 86.6 | % | 78.5 | % | ||||||
|
Redeemable noncontrolling weighted average diluted interests in Operating Partnership
|
11.1 | % | 13.4 | % | 21.5 | % | ||||||
The Company’s and the redeemable noncontrolling ownership interests in the Operating Partnership at December 31, 2010 and 2009 were as follows:
|
Balance at December 31,
|
||||||
|
2010
|
2009
|
|||||
|
Company’s interest in Operating Partnership
|
89.0
|
%
|
88.8
|
%
|
||
|
Redeemable noncontrolling interests in Operating Partnership
|
11.0
|
%
|
11.2
|
%
|
||
Reclassifications
Certain prior year amounts have been reclassified to conform to the current year presentation. Such reclassifications had no effect on net income previously reported.
F-13
Note 3. Share-Based Compensation
Overview
The Company's 2004 Equity Incentive Plan (the "Plan") authorized options and other share-based compensation awards to be granted to employees and trustees for up to 2,000,000 common shares of the Company. The Plan was amended in May 2009 to authorize an additional 1,000,000 shares of the Company’s common stock for future issuance. The Company accounts for its share-based compensation in accordance with the fair value recognition provisions provided under Topic 718—“Stock Compensation” in the ASC.
The total share-based compensation expense, net of amounts capitalized, included in general and administrative expenses for the years ended December 31, 2010, 2009, and 2008 was $0.7 million, $0.5 million, and $0.8 million, respectively. Total share-based compensation cost capitalized for the years ended December 31, 2010, 2009, and 2008 was $0.3 million, $0.3 million, and $0.3 million, respectively, related to development and leasing activities.
As of December 31, 2010, there were 730,669 shares available for grant under the 2004 Equity Incentive Plan.
Share Options
Pursuant to the Plan, the Company periodically grants options to purchase common shares at an exercise price equal to the grant date per-share fair value of the Company's common shares. Granted options typically vest over a five year period and expire ten years from the grant date. The Company issues new common shares upon the exercise of options.
For the Company's share option plan, the grant date fair value of each grant was estimated using the Black-Scholes option pricing model. The Black-Scholes model utilizes assumptions related to the dividend yield, expected life and volatility of the Company’s common shares, and the risk-free interest rate. The dividend yield is based on the Company's historical dividend rate. The expected life of the grants is derived from expected employee duration, which is based on Company history, industry information, and other factors. The risk-free interest rate is derived from the U.S. Treasury yield curve in effect at the time of grant. Expected volatilities utilized in the model are based on the historical volatility of the Company's share price and other factors.
The following summarizes the weighted average assumptions used for grants in fiscal periods 2010, 2009, and 2008:
|
2010
|
2009
|
2008
|
||||||||||
|
Expected dividend yield
|
10.00 | % | 10.00 | % | 5.00 | % | ||||||
|
Expected term of option
|
8 years
|
6 years
|
8 years
|
|||||||||
|
Risk-free interest rate
|
3.00 | % | 1.96 | % | 3.40 | % | ||||||
|
Expected share price volatility
|
52.71 | % | 55.51 | % | 21.74 | % | ||||||
A summary of option activity under the Plan as of December 31, 2010, and changes during the year then ended, is presented below:
|
Options
|
Weighted-Average
Exercise Price
|
|||||||
|
Outstanding at January 1, 2010
|
1,676,260 | $ | 10.06 | |||||
|
Granted
|
161,500 | 4.21 | ||||||
|
Exercised
|
(6,000 | ) | 2.64 | |||||
|
Forfeited
|
(89,900 | ) | 11.34 | |||||
|
Outstanding at December 31, 2010
|
1,741,860 | $ | 9.49 | |||||
|
Exercisable at December 31, 2010
|
1,072,799 | $ | 11.45 | |||||
|
Exercisable at December 31, 2009
|
863,684 | 13.08 | ||||||
F-14
The fair value on the respective grant dates of the 161,500, 526,730, and 523,173 options granted during the periods ended December 31, 2010, 2009, and 2008 was $0.65, $0.55, and $1.43 per option, respectively.
The aggregate intrinsic value of the 6,000 options exercised during the year ended December 31, 2010 was $6,180. No options were exercised during the years ended December 31, 2009 and 2008.
The aggregate intrinsic value and weighted average remaining contractual term of the outstanding and exercisable options at December 31, 2010 were as follows:
|
Options
|
Aggregative Intrinsic Value
|
Weighted-Average Remaining
Contractual Term (in years)
|
||||
|
Outstanding at December 31, 2010
|
1,741,860
|
$
|
1,268,171
|
6.36
|
||
|
Exercisable at December 31, 2010
|
1,072,799
|
394,738
|
5.33
|
|||
As of December 31, 2010, there was $0.6 million of total unrecognized compensation cost related to outstanding unvested share option awards, which is expected to be recognized over a weighted-average period of 1.45 years. We expect to incur $0.2 million of this expense in fiscal year 2011, $0.2 million in fiscal year 2012, $0.1 million in fiscal year 2013, and the remainder in 2014.
Restricted Shares
In addition to share option grants, the Plan also authorizes the grant of share-based compensation awards in the form of restricted common shares. Under the terms of the Plan, these restricted shares, which are considered to be outstanding shares from the date of grant, typically vest over a period ranging from one to five years. In addition, the Company pays dividends on restricted shares that are charged directly to shareholders’ equity.
The following table summarizes all restricted share activity to employees and non-employee members of the Board of Trustees as of December 31, 2010 and changes during the year then ended:
|
Restricted
Shares
|
Weighted Average
Grant Date Fair
Value per share
|
|||||||
|
Restricted shares outstanding at January 1, 2010
|
91,568 | $ | 10.02 | |||||
|
Shares granted
|
136,324 | 4.20 | ||||||
|
Shares forfeited
|
(931 | ) | 12.80 | |||||
|
Shares vested
|
(49,884 | ) | 10.24 | |||||
|
Restricted shares outstanding at December 31, 2010
|
177,077 | $ | 5.58 | |||||
During the years ended December 31, 2010, 2009 and 2008, the Company granted 136,324, 31,692 and 99,126 restricted shares to employees and non-employee members of the Board of Trustees with weighted average grant date fair values of $4.20, $2.84 and $12.74, respectively. The total fair value of shares vested during the years ended December 31, 2010, 2009, and 2008 was $0.2 million, $0.2 million, and $0.5 million.
As of December 31, 2010, there was $0.6 million of total unrecognized compensation cost related to restricted shares granted under the Plan, which is expected to be recognized over a weighted-average period of 1.1 years. We expect to incur $0.3 million of this expense in fiscal year 2011, $0.2 million in fiscal year 2012, and the remainder in fiscal year 2013.
Deferred Share Units Granted to Trustees
In addition, the Plan allows for the deferral of certain equity grants into the Trustee Deferred Compensation Plan. The Trustee Deferred Compensation Plan authorizes the issuance of “deferred share units” to the Company’s non-employee trustees. Each deferred share unit is equivalent to one common share of the Company. Non-employee trustees receive an annual retainer, fees for Board meetings attended, Board committee chair retainers and fees for Board committee meetings attended. Except as described below, these fees are typically paid in cash or common shares of the Company.
F-15
Under the Plan, deferred share units may be credited to non-employee trustees in lieu of the payment of cash compensation or the issuance of common shares. In addition, beginning on the date on which deferred share units are credited to a non-employee trustee, the number of deferred share units credited is increased by additional deferred share units in an amount equal to the relationship of dividends declared to the value of the Company’s common shares. The deferred share units credited to a non-employee trustee are not settled until he or she ceases to be a member of the Board of Trustees, at which time an equivalent number of common shares will be issued.
During the years ended December 31, 2010, 2009, and 2008, three trustees elected to receive at least a portion of their compensation in deferred share units and an aggregate of 32,639, 42,739, and 11,270 deferred share units, respectively, including dividends that were reinvested for additional share units, were credited to those non-employee trustees based on a weighted-average grant date fair value of $4.55, $3.42, and $9.28, respectively. During each of the years ended December 31, 2010, 2009, and 2008, the Company incurred $0.2 million of expense related to deferred share units credited to non-employee trustees.
Other Equity Grants
During the years ended 2010, 2009, and 2008, the Company issued 8,631, 10,968, and 3,006 unrestricted common shares, respectively, with weighted average grant date fair values of $4.34, $3.42, and $12.47 per share, respectively, to non-employee members of our Board of Trustees in lieu of 50% of their annual retainer compensation.
Note 4. Deferred Costs
Deferred costs consist primarily of financing fees incurred to obtain long-term financing, acquired lease intangible assets, and broker fees and capitalized salaries and related benefits incurred in connection with lease originations. Deferred financing costs are amortized on a straight-line basis over the terms of the respective loan agreements. Deferred leasing costs, lease intangibles and similar costs are amortized on a straight-line basis over the terms of the related leases. At December 31, 2010 and 2009, deferred costs consisted of the following:
|
2010
|
2009
|
|||||||
|
Deferred financing costs
|
$ | 7,325,325 | $ | 7,705,679 | ||||
|
Acquired lease intangible assets
|
5,404,889 | 5,830,089 | ||||||
|
Deferred leasing costs and other
|
27,446,067 | 23,643,156 | ||||||
| 40,176,281 | 37,178,924 | |||||||
|
Less—accumulated amortization
|
(15,969,235 | ) | (13,475,023 | ) | ||||
|
Total
|
$ | 24,207,046 | $ | 23,703,901 | ||||
The estimated aggregate amortization amounts from net unamortized acquired lease intangible assets for each of the next five years and thereafter are as follows:
|
2011
|
$ | 485,025 | ||
|
2012
|
405,503 | |||
|
2013
|
333,560 | |||
|
2014
|
284,014 | |||
|
2015
|
182,070 | |||
|
Thereafter
|
517,134 | |||
|
Total
|
$ | 2,207,306 |
The accompanying consolidated statements of operations include amortization expense as follows:
|
For the year ended December 31,
|
||||||||||||
|
2010
|
2009
|
2008
|
||||||||||
|
Amortization of deferred financing costs
|
$ | 1,832,418 | $ | 1,602,161 | $ | 1,272,333 | ||||||
|
Amortization of deferred leasing costs, lease intangibles and other
|
$ | 4,473,346 | $ | 4,108,855 | $ | 4,293,540 | ||||||
Amortization of deferred leasing costs, leasing intangibles and other is included in depreciation and amortization expense, while the amortization of deferred financing costs is included in interest expense.
F-16
Note 5. Deferred Revenue and Other Liabilities
Deferred revenue and other liabilities consist of unamortized fair value of in-place lease liabilities recorded in connection with purchase accounting, construction billings in excess of costs, construction retainages payable, and tenant rents received in advance. The amortization of in-place lease liabilities is recognized as revenue over the remaining life of the leases through 2027. Construction contracts are recognized as revenue using the percentage of completion method. Tenant rents received in advance are recognized as revenue in the period to which they apply, usually the month following their receipt.
At December 31, 2010 and 2009, deferred revenue and other liabilities consisted of the following:
|
2010
|
2009
|
|||||||
|
Unamortized in-place lease liabilities
|
$ | 9,867,906 | $ | 12,690,211 | ||||
|
Construction billings in excess of cost
|
1,504,757 | 2,561,073 | ||||||
|
Construction retainages payable
|
1,378,808 | 2,018,288 | ||||||
|
Tenant rents received in advance
|
2,647,531 | 2,565,866 | ||||||
|
Total
|
$ | 15,399,002 | $ | 19,835,438 | ||||
The estimated aggregate amortization of acquired lease intangibles (unamortized fair value of in-place lease liabilities) for each of the next five years and thereafter is as follows:
|
2011
|
$ | 2,190,818 | ||
|
2012
|
1,668,936 | |||
|
2013
|
1,566,791 | |||
|
2014
|
1,208,390 | |||
|
2015
|
795,972 | |||
|
Thereafter
|
2,436,999 | |||
|
Total
|
$ | 9,867,906 |
Note 6. Investments in Unconsolidated Joint Ventures
The Centre is a retail operating property in which the Company owned a 60% equity interest through December 31, 2010. During the first nine months of 2009, this entity was unconsolidated. In 2009, the Company made a capital contribution of $2.1 million and simultaneously extended a loan of $1.4 million to the partnership in order to pay off a third party loan secured by the assets of The Centre. The Company’s extension of a loan to the partnership caused the Company to conclude that The Centre qualified as a VIE and the Company was its primary beneficiary. As a result, the financial statements of The Centre were consolidated as of September 30, 2009, the assets and liabilities were recorded at fair value, and a non-cash gain of $1.6 million was recorded, of which the Company’s share was $1.0 million. In the summarized financial information below, the 2009 income reflects the first nine months of activity from The Centre. As discussed in Note 20, subsequent to year-end, the Company acquired the remaining 40% interest and assumed all leasing and management responsibilities.
During the second quarter of 2010, a limited service hotel at the Eddy Street Commons property, in which the Company holds a 50% noncontrolling interest, commenced operations.
In addition, as of December 31, 2010, the Company owned a non-controlling interest in one development land parcel (Parkside Town Commons), which was also accounted for under the equity method. The Company has determined that Parkside Town Commons is a VIE and that the Company is not the primary beneficiary. The Company’s investment in Parkside Town Commons was $10.9 million and $10.4 million as of December 31, 2010 and 2009, respectively. Parkside Town Commons is owned through an agreement (the “Venture”) with Prudential Real Estate Investors (“PREI”). The Venture was established to pursue joint venture opportunities for the development and selected acquisition of community shopping centers in the United States. In 2006, the Company contributed 100 acres of development land located in Cary, North Carolina to the Venture at its cost of $38.5 million, including the Venture’s assumption of $35.6 million of variable rate debt. In 2007, the Venture purchased 17 acres of additional land in Cary, North Carolina for a purchase price of $3.4 million, including assignment costs, which was funded through draws from the Venture's variable rate construction loan. The Venture is in the process of developing this land, along with the adjacent 100 acres contributed in 2006, into an approximately 1.5 million total square foot mixed-use shopping center. As of December 31, 2010, the Company owned a 40% interest in the Venture which, under the terms of the Venture, will be reduced to 20% upon project specific construction financing.
F-17
In December 2008, the Company’s 50% owned unconsolidated joint venture sold Spring Mill Medical, Phase I. This property is located in Indianapolis, Indiana and was sold for $17.5 million, resulting in a gain on the sale of $3.5 million, of which the Company’s share was $1.2 million, net of the Company’s excess investment. Net proceeds of $14.4 million from the sale of this property were utilized to purchase securities which were used to defease the related mortgage loan. In connection with this defeasance the joint venture incurred $2.7 million of expense, which is reflected as a reduction to the gain on sale of the property. Prior to the Company’s sale of its interest in this property, the joint venture sold a parcel of land for net proceeds of $1.1 million, of which the Company’s share was $0.6 million.
Combined summary financial information of entities accounted for using the equity method of accounting and a summary of the Company’s investment in and share of income from these entities follows:
|
December 31, 2010
|
December 31, 2009
|
|||||||
|
Assets:
|
||||||||
|
Investment properties at cost:
|
||||||||
|
Building and improvements
|
$ | 9,438,204 | $ | — | ||||
|
Construction in progress
|
60,852,416 | 62,204,124 | ||||||
| 70,290,620 | 62,204,124 | |||||||
|
Less: Accumulated depreciation
|
(388,260 | ) | — | |||||
|
Investment properties, at cost, net
|
69,902,360 | 62,204,124 | ||||||
|
Cash and cash equivalents
|
1,146,354 | 540,264 | ||||||
|
Escrow deposits
|
600,000 | 600,000 | ||||||
|
Deferred costs and other assets
|
265,248 | 243,236 | ||||||
|
Total assets
|
$ | 71,913,962 | $ | 63,587,624 | ||||
|
Liabilities and Owners’ Equity:
|
||||||||
|
Mortgage and other indebtedness
|
$ | 43,287,141 | $ | 35,836,186 | ||||
|
Accounts payable and accrued expenses
|
839,607 | 980,677 | ||||||
|
Total liabilities
|
44,126,748 | 38,816,863 | ||||||
|
Owners’ equity
|
27,787,214 | 26,770,761 | ||||||
|
Total liabilities and Owners’ equity
|
$ | 71,913,962 | $ | 63,587,624 | ||||
|
Company share of total assets
|
$ | 29,789,769 | $ | 25,729,647 | ||||
|
Company investment in joint ventures
|
$ | 11,193,113 | $ | 10,799,782 | ||||
|
Company share of mortgage and other indebtedness
|
$ | 18,256,271 | $ | 14,530,793 | ||||
F-18
|
Year ended December 31,
|
||||||||||||
|
2010
|
2009
|
2008
|
||||||||||
|
Revenue:
|
||||||||||||
|
Minimum rent
|
$ | — | $ | 691,739 | $ | 965,498 | ||||||
|
Tenant reimbursements
|
— | 256,426 | 297,653 | |||||||||
|
Other property related revenue
|
2,002,761 | 20,916 | — | |||||||||
|
Total revenue
|
2,002,761 | 969,081 | 1,263,151 | |||||||||
|
Expenses:
|
||||||||||||
|
Property operating
|
1,459,059 | 195,656 | 237,892 | |||||||||
|
Real estate taxes
|
70,000 | 142,198 | 143,438 | |||||||||
|
Depreciation and amortization
|
388,262 | 102,626 | 130,162 | |||||||||
|
Total expenses
|
1,917,321 | 440,480 | 511,492 | |||||||||
|
Operating income
|
85,440 | 528,601 | 751,659 | |||||||||
|
Interest expense
|
(189,368 | ) | (179,177 | ) | (261,044 | ) | ||||||
|
Other income
|
— | 32,090 | — | |||||||||
|
(Loss) income from continuing operations
|
(103,928 | ) | 381,514 | 490,615 | ||||||||
|
Discontinued operations:
|
||||||||||||
|
Operating income from discontinued operations
|
— | 147,402 | 1,352,237 | |||||||||
|
Gain on sale of operating property
|
— | — | 3,544,524 | |||||||||
|
Income from discontinued operations
|
— | 147,402 | 4,896,761 | |||||||||
|
Net (loss) income
|
(103,928 | ) | 528,916 | 5,387,376 | ||||||||
|
Third-party investors’ share of net (loss) income
|
51,964 | (226,306 | ) | (2,644,627 | ) | |||||||
|
Company share of net (loss) income
|
51,964 | 302,610 | 2,742,749 | |||||||||
|
Amortization of excess investment
|
— | (96,047 | ) | (128,042 | ) | |||||||
|
Interest on intercompany indebtedness
|
— | 19,478 | — | |||||||||
|
Excess investment in sale of discontinued operations
|
— | — | (538,944 | ) | ||||||||
|
(Loss) income from unconsolidated entities and gain on sale of unconsolidated property
|
$ | (51,964 | ) | $ | 226,041 | $ | 2,075,763 | |||||
“Excess investment” represented the unamortized difference of the Company’s investment over its share of the equity in the underlying net assets of the joint ventures acquired. The Company amortized the excess investment over the life of the related property of no more than 35 years and the amortization is included in equity in earnings from unconsolidated entities. The excess investment related to The Centre and was eliminated upon the September 30, 2009 consolidation of this property. The Company periodically reviews its ability to recover the carrying values of its investments in joint venture properties. If the Company were to determine that any portion of its investment is not recoverable, the Company would record an adjustment to write off the unrecoverable amounts.
As of December 31, 2010, the Company’s share of unconsolidated joint venture indebtedness was $18.3 million, $13.5 million of which was related to the Parkside Town Commons development. The remaining $4.8 million represents the Company’s share of the $9.4 million drawn on the Eddy Street Commons limited service hotel construction loan. The loan, obtained in 2009, has a total commitment of $10.9 million, bears interest at the greater of LIBOR + 315 basis points or 4.00% and matures in August 2014. Unconsolidated joint venture debt is the liability of the joint venture and is typically secured by the assets of the joint venture. As of December 31, 2010, the Operating Partnership had guaranteed its share of unconsolidated joint venture debt of $13.5 million in the event the joint venture partnership defaults under the terms of the underlying arrangement, all of which was related to the Parkside Town Commons development. Mortgages which are guaranteed by the Operating Partnership are secured by the property of the joint venture and the joint venture could sell the property in order to satisfy the outstanding obligation.
F-19
Note 7. Development and Redevelopment Activities
During the second quarter of 2010, the Company completed plans for its redevelopment projects at Rivers Edge and Coral Springs Plaza. As part of finalizing its plans, the Company reduced the estimated useful lives of certain assets that are scheduled to be or have been demolished. As a result of this change in estimate, a total of $5.8 million of additional depreciation was recognized in 2010.
2010 Development Activities
Cobblestone Plaza
The Company has partially completed the construction of Cobblestone Plaza, a neighborhood shopping center located in Ft. Lauderdale, Florida. This project is owned through a consolidated joint venture in which we hold a 50% interest and was added to the development pipeline in 2006. The Company has contributed all of the current equity capital and is required to make all future equity contributions. The Company currently anticipates the total cost of this project (including the joint venture partner’s share) will be approximately $52.0 million, of which $48.1 million had been incurred as of December 31, 2010.
Eddy Street Commons, Phase I
In 2010, the Company substantially completed the construction of the retail and office components of Eddy Street Commons, Phase I, located in South Bend, Indiana that includes a non-owned multi-family component. The Company currently anticipates its total investment in this project, which is owned 100%, will be approximately $35.0 million, of which $34.6 million had been incurred as of December 31, 2010.
2010 Redevelopment Activities
Rivers Edge
The Company is in the process of redeveloping its wholly-owned Rivers Edge property in Indianapolis, Indiana. This property was acquired in 2008 with the intent to redevelop the property. The Company secured Nordstrom Rack, the Container Store, Buy Buy Baby, Arhaus Furniture and BGI Fitness as anchors for this property. The renovations to accommodate these new tenants began in the third quarter of 2010 with expected delivery in the first half of 2011. The Company currently estimates the cost of this redevelopment to be approximately $21.5 million, of which $2.9 million had been incurred as of December 31, 2010. The Company recognized $4.8 million of additional depreciation related to this property in the 2nd and 3rd quarters of 2010.
Bolton Plaza
The Company is in the process of redeveloping its wholly-owned Bolton Plaza Shopping Center in Jacksonville, Florida. In 2009, a new anchor executed a lease for approximately half of the anchor tenant space and opened its store in the second half of 2010. The Company currently anticipates its total investment in the redevelopment at Bolton Plaza will be approximately $5.7 million, of which $1.5 million had been incurred as of December 31, 2010.
Courthouse Shadows
The Company is in the process of redeveloping its wholly-owned Courthouse Shadows Shopping Center in Naples, Florida. The Company intends to modify the existing façade and pylon signage and upgrade the landscaping and lighting. In 2009, an anchor tenant purchased the lease of the former anchor tenant and made certain improvements to the space. The Company currently anticipates its total investment in the redevelopment at Courthouse Shadows will be approximately $2.5 million, of which $0.4 million had been incurred as of December 31, 2010.
F-20
Four Corner Square
The Company is currently redeveloping its wholly-owned Four Corner Square Shopping Center in Seattle, Washington. In addition to the existing center, the Company also owns approximately ten acres of adjacent land in the future development pipeline which is expected to be utilized in the redevelopment. The Company anticipates the majority of the existing center will remain open during the redevelopment. The Company currently anticipates its total investment in the redevelopment at Four Corner Square will be approximately $0.5 million, of which $0.1 million had been incurred as of December 31, 2010.
Note 8. Discontinued Operations
In 2009, the Company conveyed the title to its Galleria Plaza operating property in Dallas, Texas to the ground lessor upon determining there was no value to the improvements and intangibles related to the property and recognized a non-cash impairment charge of $5.4 million to write off its net book value. The operating results related to this property were reclassified to discontinued operations for each of the fiscal years presented.
In December 2008, the Company sold its Silver Glen Crossings property, located in Chicago, Illinois, for net proceeds of $17.2 million and recognized a loss on sale of $2.7 million. The majority of the net proceeds from this sale were used to pay down borrowings under the Company’s unsecured revolving credit facility. The loss on sale and operating results for this property have been reflected as discontinued operations for each of the fiscal years presented.
The results of the discontinued operations related to these properties were comprised of the following for the years ended December 31, 2009 and 2008:
|
Year ended December 31,
|
||||||||
|
2009
|
2008
|
|||||||
|
Rental income
|
$ | 554,934 | $ | 3,202,193 | ||||
|
Expenses:
|
||||||||
|
Property operations
|
802,500 | 1,185,704 | ||||||
|
Real estate taxes and other
|
193,639 | 595,374 | ||||||
|
Depreciation and amortization
|
256,172 | 1,090,702 | ||||||
|
Non-cash loss on impairment of discontinued operation
|
5,384,747 | — | ||||||
|
Total expenses
|
6,637,058 | 2,871,780 | ||||||
|
Operating (loss) income
|
(6,082,124 | ) | 330,413 | |||||
|
Interest expense and other income, net
|
(35,244 | ) | 69 | |||||
|
(Loss) income from discontinued operations
|
(6,117,368 | ) | 330,482 | |||||
|
Loss on sale of operating property
|
— | (2,689,888 | ) | |||||
|
Total loss from discontinued operations
|
$ | (6,117,368 | ) | $ | (2,359,406 | ) | ||
|
Loss from discontinued operations attributable to Kite Realty Group Trust common shareholders
|
$ | (5,297,641 | ) | $ | (1,852,134 | ) | ||
|
Loss from discontinued operations attributable to noncontrolling interests
|
(819,727 | ) | (507,272 | ) | ||||
|
Total loss from discontinued operations
|
$ | (6,117,368 | ) | $ | (2,359,406 | ) | ||
F-21
Note 9. Mortgage Loans and Other Indebtedness
Mortgage and other indebtedness consist of the following at December 31, 2010 and 2009:
|
Balance at December 31,
|
||||||||
|
Description
|
2010
|
2009
|
||||||
|
Unsecured Revolving Credit Facility1
|
||||||||
|
Matures February 2012; maximum borrowing level of $175.8 million and $150.2 million available at December 31, 2010 and 2009, respectively; interest at LIBOR + 1.25%5 (1.51%) at December 31, 2010 and interest at LIBOR + 1.25% (1.48%) at December 31, 2009
|
$ | 122,300,000 | $ | 77,800,000 | ||||
|
Unsecured Term Loan2
|
||||||||
|
Retired December 2010 and bore interest at LIBOR + 2.65% (2.88%) at December 31, 2009
|
— | 55,000,000 | ||||||
|
Notes Payable Secured by Properties under Construction—Variable Rate
|
||||||||
|
Generally due in monthly installments of interest; maturing at various dates through 2016; interest at LIBOR+1.85%-3.50%, ranging from 2.56% to 5.25%3,4 at December 31, 2010 and interest at LIBOR+1.85%-3.00%, ranging from 2.13% to 5.00%3 at December 31, 2009
|
88,424,770 | 77,143,865 | ||||||
|
Mortgage Notes Payable—Fixed Rate
|
||||||||
|
Generally due in monthly installments of principal and interest; maturing at various dates through 2022; interest rates ranging from 5.16% to 7.65% at both December 31, 2010 and 2009, respectively
|
277,560,128 | 300,893,193 | ||||||
|
Mortgage Notes Payable—Variable Rate2
|
||||||||
|
Due in monthly installments of principal and interest; maturing at various dates through 2017; interest at LIBOR + 1.25%-3.50%, ranging from 1.51% to 3.76% at December 31, 2010 and interest at LIBOR + 1.25%-3.50%, ranging from 1.48% to 3.73% at December 31, 2009
|
122,094,803 | 146,479,685 | ||||||
|
Net premium on acquired indebtedness
|
546,912 | 977,770 | ||||||
|
Total mortgage and other indebtedness
|
$ | 610,926,613 | $ | 658,294,513 | ||||
|
____________________
|
|
|
1
|
The Company entered into two cash flow hedge agreements that fix interest on portions of its unsecured revolving credit facility. These hedges expire in February 2011.
|
|
2
|
The Company entered into a cash flow hedge for $55 million of outstanding variable rate debt that fixed the LIBOR rate at 3.27%, which the Company initially associated with the variable-rate term loan. After repayment of the term loan, the hedge is associated with other variable-rate mortgage notes. This hedge expires in July 2011.
|
|
3
|
The Bridgewater Marketplace construction loan has a LIBOR floor of 3.15%.
|
|
4
|
The South Elgin Commons construction loan has a LIBOR floor of 2.00%.
|
|
5
|
The rate on the Company’s unsecured revolving credit facility varied at certain parts of the year due to provisions in the agreement.
|
The one month LIBOR interest rate was 0.26% and 0.23% as of December 31, 2010 and 2009, respectively.
For the year ended December 31, 2010, the Company had loan borrowing proceeds of $58.7 million and loan repayments of $105.7 million. The major components of this activity are as follows:
|
·
|
Draws of $6.1 million were made on the variable rate construction loan at the Eddy Street Commons development project;
|
|
·
|
The Company made scheduled paydowns totaling $4.7 million on the Delray Marketplace construction loan. After the paydowns, the total loan commitment as of December 31, 2010 was $4.7 million;
|
|
·
|
Upon release of funds from escrow, the Company made a paydown of $2.1 million on the Traders Point fixed rate loan;
|
F-22
|
·
|
The Company made a paydown of $0.9 million on the Glendale Town Center variable rate loan;
|
|
·
|
The Company made a paydown of $5.1 million on the Bayport Commons variable rate loan and received release of outlot parcels;
|
|
·
|
The Company made a paydown of $1.8 million on the Tarpon Springs Plaza variable rate loan utilizing proceeds from the sale of an outlot;
|
|
·
|
The maturity date of the construction loan on the South Elgin Commons property was extended to September 2013 at an interest rate of LIBOR + 325 basis points. The Company funded a $1.6 million paydown with cash and borrowings on the unsecured revolving credit facility;
|
|
·
|
The variable rate loan on the Rivers Edge property was converted to a construction loan for the redevelopment of the asset. The interest rate on the loan is LIBOR + 325 basis points until January 2013 when it converts to LIBOR + 300 basis points. The maturity date of the loan is January 2016. The Company funded a $0.6 million paydown with cash;
|
|
·
|
The maturity date of the construction loan on the Cobblestone Plaza property was extended to February 2013 at an interest rate of LIBOR + 350 basis points. The Company funded a $2.9 million paydown with cash and borrowings on the unsecured revolving credit facility;
|
|
·
|
In December 2010, the $55 million Term Loan was repaid in full utilizing proceeds from the Company’s Series A perpetual preferred share offering.
|
|
·
|
The $18.3 million fixed rate mortgage loan on the International Speedway Square property was retired prior to its March 2011 maturity utilizing proceeds from the Series A perpetual preferred share offering and a draw under the Company’s revolving credit facility. The Company intends to secure long term financing for this asset in the first half of 2011;
|
|
·
|
In addition to the preceding activity, during the year ended December 31, 2010, the Company used proceeds from its unsecured revolving credit facility and other borrowings (exclusive of repayments) totaling $36.6 million for development, redevelopment, and general working capital purposes; and
|
|
·
|
The Company made scheduled principal payments totaling $4.8 million.
|
Unsecured Revolving Credit Facility
The Operating Partnership is a party to an amended and restated four-year $200 million unsecured revolving credit facility (the “unsecured facility”) along with a group of financial institutions led by Key Bank National Association, as agent. The Company and several of the Operating Partnership’s subsidiaries are guarantors of the Operating Partnership’s obligations under the unsecured facility. The unsecured facility has a maturity date of February 20, 2012 after taking into account a one year extension option that was exercised in the fourth quarter of 2010. Borrowings under the unsecured facility bear interest at a floating interest rate of LIBOR + 115 to 135 basis points, depending on the Company’s leverage ratio. The unsecured facility has a commitment fee ranging from 0.125% to 0.20% applicable to the average daily unused amount. Subject to certain conditions, including the prior consent of the lenders, the Company has the option to increase its borrowings under the unsecured facility to a maximum of $400 million if there are sufficient unencumbered assets to support the additional borrowings. The unsecured facility also includes a short-term borrowing line of $25 million with a variable interest rate. Borrowings under the short-term line may not be outstanding for more than five days.
The amount that the Company may borrow under the unsecured facility is based on the value of assets in its unencumbered property pool. As of December 31, 2010, the Company had 51 unencumbered properties and other assets used to calculate the value of the unencumbered property pool, of which 47 were wholly owned and four of which were owned through joint ventures. The major unencumbered assets include: Boulevard Crossing, Broadstone Station, Coral Springs Plaza, Courthouse Shadows, Four Corner Square, Hamilton Crossing Centre, International Speedway Square King's Lake Square, Market Street Village, Naperville Marketplace, PEN Products, Publix at Acworth, Red Bank Commons, Shops at Eagle Creek, Traders Point II, Union Station Parking Garage, Wal-Mart Plaza, and Waterford Lakes Village. As of December 31, 2010, the total amount available for borrowing under the unsecured credit facility was $46.3 million.
The Company’s ability to borrow under the unsecured facility is subject to ongoing compliance with various restrictive covenants, including with respect to liens, indebtedness, investments, dividends, mergers and asset sales. In addition, the unsecured facility requires that the Company satisfy certain financial covenants, including:
|
·
|
a maximum leverage ratio of 65% (or up to 70% in certain circumstances);
|
|
·
|
Adjusted EBITDA (as defined in the unsecured facility) to fixed charges coverage ratio of at least 1.50 to 1;
|
F-23
|
·
|
minimum tangible net worth (defined as Total Asset Value less Total Indebtedness) of $300 million (plus 75% of the net proceeds of any equity issuances from the date of the agreement);
|
|
·
|
ratio of net operating income of unencumbered property to debt service under the unsecured facility of at least 1.50 to 1;
|
|
·
|
minimum unencumbered property pool occupancy rate of 80%;
|
|
·
|
ratio of variable rate indebtedness to total asset value of no more than 0.35 to 1; and
|
|
·
|
ratio of recourse indebtedness to total asset value of no more than 0.30 to 1.
|
The Company was in compliance with all applicable covenants under the unsecured facility as of December 31, 2010.
Under the terms of the unsecured facility, the Company is permitted to make distributions to its shareholders of up to 95% of its funds from operations provided that no event of default exists. If an event of default exists, the Company may only make distributions sufficient to maintain its REIT status. However, the Company may not make any distributions if an event of default resulting from nonpayment or bankruptcy exists, or if its obligations under the credit facility are accelerated.
Unsecured Term Loan
The Operating Partnership had a $55 million unsecured term loan agreement (the “Term Loan”) that was originally scheduled to mature on July 15, 2011 and bore interest at LIBOR + 265 basis points. In connection with obtaining the Term Loan, the Company entered into a cash flow hedge for $55 million, which the Company initially associated with the variable rate Term Loan and effectively fixed the interest rate at 5.92%. In December 2010, the Term Loan was retired utilizing a portion of the proceeds from the Company’s Series A Cumulative Redeemable Perpetual Preferred Share Offering.
Mortgage and Construction Loans
Mortgage and construction loans are secured by certain real estate, are generally due in monthly installments of interest and principal and mature over various terms through 2022.
The following table presents maturities of mortgage debt, corporate debt, and construction loans as of December 31, 2010:
| Year |
Amount
|
|||
|
2011
|
$ | 81,565,647 | ||
|
2012
|
191,470,222 | |||
|
2013
|
75,308,320 | |||
|
2014
|
35,188,821 | |||
|
2015
|
41,841,534 | |||
|
Thereafter
|
185,005,157 | |||
| $ | 610,379,701 | |||
|
Unamortized Premiums
|
546,912 | |||
|
Total
|
$ | 610,926,613 | ||
See Note 20 for refinancing activity subsequent to December 31, 2010.
The amount of interest capitalized in 2010, 2009, and 2008 was $8.8 million, $8.9 million, and $10.1 million, respectively.
F-24
Fair Value of Fixed and Variable Rate Debt
As of December 31, 2010, the fair value of fixed rate debt was approximately $287.0 million compared to the book value of $277.6 million. The fair value was estimated using Level 2 and 3 inputs with cash flows discounted at current borrowing rates for similar instruments which ranged from 3.76% to 5.91%. As of December 31, 2010, the fair value of variable rate debt was approximately $320.8 million compared to the book value of $332.8 million. The fair value was estimated using cash flows discounted at current borrowing rates for similar instruments which ranged from 3.42% to 5.25%.
As of December 31, 2009, the fair value of fixed rate debt was approximately $304.3 million compared to the book value of $300.9 million. The fair value was estimated using Level 2 and 3 inputs with cash flows discounted at current borrowing rates for similar instruments which ranged from 3.96% to 6.51%. As of December 31, 2009, the $356.4 million book value of variable rate debt approximates its fair value. The fair value was estimated using cash flows discounted at current borrowing rates for similar instruments which ranged from 3.23% to 6.56%.
Note 10. Derivative Instruments, Hedging Activities and Other Comprehensive Income
The Company is exposed to capital market risk, including changes in interest rates. In order to manage volatility relating to variable interest rate risk, the Company enters into interest rate hedging transactions from time to time. The Company does not use derivatives for trading or speculative purposes nor does the Company currently have any derivatives that are not designated as cash flow hedges. The Company has agreements with each of its derivative counterparties that contain a provision that if the Company defaults on any of its indebtedness, including a default where repayment of the indebtedness has not been accelerated by the lender, then the Company could also be declared in default on its derivative obligations. As of December 31, 2010, the Company was party to various consolidated cash flow hedge agreements totaling $220 million, which effectively fix certain variable rate debt over various terms through 2017. Utilizing a weighted average spread over LIBOR on all variable rate debt resulted in a weighted average interest rate of 5.76%.
These interest rate hedge agreements are the only assets or liabilities that the Company records at fair value on a recurring basis. The valuation is determined using widely accepted techniques including discounted cash flow analysis, which considers the contractual terms of the derivatives (including the period to maturity) and uses observable market-based inputs such as interest rate curves and implied volatilities. The Company also incorporates credit valuation adjustments to appropriately reflect both its own nonperformance risk and the respective counterparty’s nonperformance risk in the fair value measurements.
As a basis for considering market participant assumptions in fair value measurements, FASB guidance establishes a fair value hierarchy that distinguishes between market participant assumptions based on market data obtained from sources independent of the reporting entity (observable inputs for identical instruments that are classified within Level 1 and observable inputs for similar instruments that are classified within Level 2) and the reporting entity’s own assumptions about market participant assumptions (unobservable inputs classified within Level 3). In instances where the determination of the fair value measurement is based on inputs from different levels of the fair value hierarchy, the level in the fair value hierarchy within which the entire fair value measurement falls is based on the lowest level input that is significant to the fair value measurement in its entirety. The Company’s assessment of the significance of a particular input to the fair value measurement in its entirety requires judgment, and considers factors specific to the asset or liability.
Although the Company has determined that the majority of the inputs used to value its derivatives fall within Level 2 of the fair value hierarchy, the credit valuation adjustments associated with its derivatives utilize Level 3 inputs, such as estimates of current credit spreads to evaluate the likelihood of default by itself and its counterparties. However, as of December 31, 2010 and 2009, the Company has assessed the significance of the impact of the credit valuation adjustments on the overall valuation of its derivative positions and has determined that the credit valuation adjustments are not significant to the overall valuation of its derivatives. As a result, the Company has determined that its derivative valuations are classified in Level 2 of the fair value hierarchy.
As discussed in Note 9, in connection with obtaining the Term Loan, the Company entered into a cash flow hedge for $55 million, which the Company initially associated with the variable rate Term Loan and effectively fixed the interest rate at 5.92%. When the Term Loan was retired, the Company associated the cash flow hedge with other unhedged variable rate notes. At that time, an immaterial amount was reclassified to interest expense, as a result of partial ineffectiveness.
The fair values of the Company’s interest rate hedge liabilities as of December 31, 2010 and 2009 were $3.8 million and $7.0 million, respectively, including accrued interest of $0.5 million for both periods, and is recorded in accounts payable and accrued expenses on the accompanying consolidated balance sheets.
F-25
The Company currently expects an increase to interest expense of approximately $3.0 million as the hedged forecasted interest payments occur. Amounts reported in accumulated other comprehensive income related to derivatives will be reclassified to earnings over time as the hedged items are recognized in earnings during 2011. During the years ended December 31, 2010, 2009 and 2008 $7.1 million, $6.4 million and $2.3 million, respectively, was reclassified as a reduction to earnings.
The Company’s share of net unrealized gains (losses) on its interest rate hedge agreements are the only components of its accumulated comprehensive income (loss). The following sets forth comprehensive income allocable to the Company for the years ended December 31, 2010, 2009, and 2008:
|
Year ended December 31,
|
||||||||||||
|
2010
|
2009
|
2008
|
||||||||||
|
Net (loss) income attributable to Kite Realty Group Trust
|
$ | (8,270,830 | ) | $ | (1,781,766 | ) | $ | 6,093,126 | ||||
|
Other comprehensive income (loss) allocable to Kite Realty Group Trust1
|
2,902,306 | 1,936,748 | (4,616,672 | ) | ||||||||
|
Comprehensive income attributable to Kite Realty Group Trust
|
$ | (5,368,524 | ) | $ | 154,982 | $ | 1,476,454 | |||||
|
____________________
|
|
|
1
|
Reflects the Company’s share of the net change in the fair value of derivative instruments accounted for as cash flow hedges.
|
Note 11. Lease Information
Tenant Leases
The Company receives rental income from the leasing of retail and commercial space under operating leases. The leases generally provide for certain increases in base rent, reimbursement for certain operating expenses and may require tenants to pay contingent rentals to the extent their sales exceed a defined threshold. The weighted average initial term of the lease agreements is approximately 16 years. During the periods ended December 31, 2010, 2009, and 2008, the Company earned percentage rent of $0.3 million, $0.3 million, and $0.4 million, respectively.
As of December 31, 2010, future minimum rentals to be received under non-cancelable operating leases for each of the next five years and thereafter, excluding tenant reimbursements of operating expenses and percentage rent based on sales volume, are as follows:
|
2011
|
$
|
70,335,008
|
|
2012
|
66,003,882
|
|
|
2013
|
60,224,092
|
|
|
2014
|
54,067,741
|
|
|
2015
|
44,601,492
|
|
|
Thereafter
|
216,405,432
|
|
|
Total
|
$
|
511,637,647
|
Lease Commitments
As of December 31, 2010, the Company was obligated under seven ground leases for approximately 35 acres of land with four landowners which require fixed annual rent. The expiration dates of the initial terms of these ground leases range from 2012 to 2083. These leases have five to ten year extension options ranging in total from 20 to 30 years.
During 2009 and 2008, the Company was also obligated under a ground lease for its Galleria Plaza operating property in Dallas, Texas. The lease had been for 4.1 acres of land, required fixed annual rent of $594,000, and was scheduled to expire in 2027. As previously discussed, during the third quarter of 2009, the Company recognized a non-cash impairment charge of $5.4 million to write off the property’s net book value. In December 2009, the Company conveyed the title to Galleria Plaza to the ground lessor. In connection with the transfer, the Company was released from the original ground lease and holds no future obligations related to this property.
F-26
Ground lease expense incurred by the Company on these operating leases (including Galleria Plaza) for the years ended December 31, 2010, 2009, and 2008 was $0.6 million, $1.1 million, and $1.0 million, respectively.
As further discussed in Note 15, the Company was obligated under a ground lease for one of its operating properties, Eddy Street Commons at the University of Notre Dame. Beginning in June 2008, in accordance with the operating agreement in place, the Company began making ground lease payments to the University of Notre Dame for the land beneath the initial phase of the development. This lease agreement is for a 75-year term at a fixed rate for the first two years, after which payments are based on a percentage of certain gross revenues. Contingent amounts are not reflected in the table below for fiscal years 2011 and beyond.
Future minimum lease payments due under such leases for the next five years ending December 31 and thereafter are as follows:
|
2011
|
$ | 416,800 | ||
|
2012
|
416,800 | |||
|
2013
|
302,500 | |||
|
2014
|
310,000 | |||
|
2015
|
310,000 | |||
|
Thereafter
|
1,747,500 | |||
|
Total
|
$ | 3,503,600 |
Note 12. Shareholders’ Equity and Redeemable Noncontrolling Interests
Common Equity
In May 2009, the Company completed an equity offering of 28,750,000 common shares at an offering price of $3.20 per share for net offering proceeds of $87.5 million, of which $57 million was used to repay borrowings under the Company’s unsecured revolving credit facility and the remainder was retained as cash.
In October 2008, the Company completed an equity offering of 4,750,000 common shares at an offering price of $10.55 per share for net offering proceeds of $47.8 million, all of which was used to repay borrowings under the Company’s unsecured revolving credit facility.
In April 2008, the Company issued 60,000 common shares at a weighted-average offering price of $15.19 under a previously filed registration statement, for net offering proceeds of $0.9 million.
Accrued but unpaid distributions on common equity were $4.3 million as of December 31, 2010 and 2009, respectively, and are included in accounts payable and accrued expenses in the accompanying consolidated balance sheets.
Preferred Equity
In December 2010, the Company completed an equity offering of 2,800,000 shares of 8.25% Series A Cumulative Redeemable Perpetual Preferred Shares at an offering price of $25.00 per share for net offering proceeds of $67.5 million. A portion of the net proceeds were used to retire the Company’s $55 million Term Loan. The remaining net proceeds, along with borrowings on the Company’s revolving line of credit, were used to retire the $18.3 million loan encumbering the International Speedway Square property in Daytona, Florida. The Series A preferred shares have no stated maturity date although they may be redeemed, at the Company’s option, beginning in December 2015.
Accrued but unpaid distributions on the Series A preferred shares were $376,979 as of December 31, 2010 and are included in Accounts payable and accrued expenses in the accompanying consolidated balance sheets.
Dividend Reinvestment and Share Purchase Plan
The Company maintains a Dividend Reinvestment and Share Purchase Plan (the “Dividend Reinvestment Plan”) which offers investors a dividend reinvestment component to invest all or a portion of the dividends on their common shares, or cash distributions on their units in the Operating Partnership, in additional common shares. In addition, the direct share purchase component permits Dividend Reinvestment Plan participants and new investors to purchase common shares by making optional cash investments with certain restrictions.
F-27
Equity Distribution Agreement
In 2009 the Company entered into an Equity Distribution Agreement pursuant to which it may sell, from time to time, up to an aggregate amount of $25 million of its common shares. To date, the Company has not sold shares under this program.
Redeemable Noncontrolling Interests
Concurrent with the Company’s IPO and related formation transactions, certain individuals received units of the Operating Partnership in exchange for their interests in certain properties. Limited Partners were granted the right to redeem Operating Partnership units on or after August 16, 2005 for cash in an amount equal to the market value of an equivalent number of common shares at the time of redemption. The Company also has the right to redeem the Operating Partnership units directly from the limited partner in exchange for either cash in the amount specified above or a number of common shares equal to the number of units being redeemed. For the years ended December 31, 2010, 2009, and 2008, respectively, 120,000, 73,981, and 285,769 Operating Partnership units were exchanged for the same number of common shares.
Note 13. Segment Information
The Company’s operations are aligned into two business segments: (i) real estate operations and development and (ii) construction and advisory services. The Company’s segments operate only in the United States. Combined segment data of the Company for the years ended December 31, 2010, 2009, and 2008 are presented below.
| Year ended December 31, 2010 |
Real Estate Operations and Development
|
Construction and Advisory Services
|
Subtotal
|
Intersegment Eliminations
|
Total
|
|||||||||||||||
|
Revenues
|
$ | 95,619,569 | $ | 11,980,263 | $ | 107,599,832 | $ | (6,183,730 | ) | $ | 101,416,102 | |||||||||
|
Operating expenses, cost of construction and
services, general, administrative and other
|
35,553,324 | 11,819,328 | 47,372,652 | (6,121,850 | ) | 41,250,802 | ||||||||||||||
|
Depreciation and amortization
|
40,549,406 | 182,822 | 40,732,228 | — | 40,732,228 | |||||||||||||||
|
Operating income (loss)
|
19,516,839 | (21,887 | ) | 19,494,952 | (61,880 | ) | 19,433,072 | |||||||||||||
|
Interest expense
|
(28,956,953 | ) | (156,834 | ) | (29,113,787 | ) | 581,347 | (28,532,440 | ) | |||||||||||
|
Income tax expense of taxable REIT subsidiary
|
— | (265,986 | ) | (265,986 | ) | — | (265,986 | ) | ||||||||||||
|
Other income, net
|
897,050 | (136,489 | ) | 760,561 | (581,347 | ) | 179,214 | |||||||||||||
|
Loss from continuing operations
|
(8,543,064 | ) | (581,196 | ) | (9,124,260 | ) | (61,880 | ) | (9,186,140 | ) | ||||||||||
|
Consolidated net loss
|
(8,543,064 | ) | (581,196 | ) | (9,124,260 | ) | (61,880 | ) | (9,186,140 | ) | ||||||||||
|
Less: Net loss attributable to noncontrolling interests
|
851,131 | 57,312 | 908,443 | 6,867 | 915,310 | |||||||||||||||
|
Net loss attributable to Kite Realty Group Trust
|
$ | (7,691,933 | ) | $ | (523,884 | ) | $ | (8,215,817 | ) | $ | (55,013 | ) | $ | (8,270,830 | ) | |||||
|
Total assets at December 31, 2010
|
$ | 1,135,512,416 | $ | 15,738,344 | $ | 1,151,250,760 | $ | (18,468,015 | ) | $ | 1,132,782,745 | |||||||||
F-28
| Year ended December 31, 2009 |
Real Estate Operations and Development
|
Construction and Advisory Services
|
Subtotal
|
Intersegment Eliminations
|
Total
|
|||||||||||||||
|
Revenues
|
$ | 97,061,070 | $ | 42,759,584 | $ | 139,820,654 | $ | (24,528,551 | ) | $ | 115,292,103 | |||||||||
|
Operating expenses, cost of construction and
services, general, administrative and other
|
33,787,084 | 43,683,182 | 77,470,266 | (24,308,763 | ) | 53,161,503 | ||||||||||||||
|
Depreciation and amortization
|
31,971,118 | 177,200 | 32,148,318 | — | 32,148,318 | |||||||||||||||
|
Operating income (loss)
|
31,302,868 | (1,100,798 | ) | 30,202,070 | (219,788 | ) | 29,982,282 | |||||||||||||
|
Interest expense
|
(27,506,702 | ) | (150,046 | ) | (27,656,748 | ) | 505,694 | (27,151,054 | ) | |||||||||||
|
Income tax benefit of taxable REIT subsidiary
|
— | 22,293 | 22,293 | — | 22,293 | |||||||||||||||
|
Income from unconsolidated entities
|
206,564 | — | 206,564 | 19,477 | 226,041 | |||||||||||||||
|
Non-cash gain from consolidation of subsidiary
|
1,634,876 | — | 1,634,876 | — | 1,634,876 | |||||||||||||||
|
Other income, net
|
750,098 | — | 750,098 | (525,171 | ) | 224,927 | ||||||||||||||
|
Income (loss) from continuing operations
|
6,387,704 | (1,228,551 | ) | 5,159,153 | (219,788 | ) | 4,939,365 | |||||||||||||
|
Discontinued operations:
|
||||||||||||||||||||
|
Discontinued operations
|
(732,621 | ) | — | (732,621 | ) | — | (732,621 | ) | ||||||||||||
|
Non-cash loss on impairment of discontinued operation
|
(5,384,747 | ) | — | (5,384,747 | ) | — | (5,384,747 | ) | ||||||||||||
|
Loss from discontinued operations
|
(6,117,368 | ) | — | (6,117,368 | ) | — | (6,117,368 | ) | ||||||||||||
|
Consolidated net income (loss)
|
270,336 | (1,228,551 | ) | (958,215 | ) | (219,788 | ) | (1,178,003 | ) | |||||||||||
|
Less: Net income attributable to noncontrolling interests
|
(797,841 | ) | 164,626 | (633,215 | ) | 29,452 | (603,763 | ) | ||||||||||||
|
Net loss attributable to Kite Realty Group Trust
|
$ | (527,505 | ) | $ | (1,063,925 | ) | $ | (1,591,430 | ) | $ | (190,336 | ) | $ | (1,781,766 | ) | |||||
|
Total assets at December 31, 2009
|
$ | 1,138,963,146 | $ | 23,925,090 | $ | 1,162,888,236 | $ | (22,202,792 | ) | $ | 1,140,685,444 | |||||||||
|
Year Ended December 31, 2008
|
Real Estate Operations and Development
|
Construction and Advisory Services1
|
Subtotal
|
Intersegment Eliminations
|
Total
|
|||||||||||||||
|
Revenues
|
$ | 101,152,298 | $ | 89,973,444 | $ | 191,125,742 | $ | (49,062,641 | ) | $ | 142,063,101 | |||||||||
|
Operating expenses, cost of construction and
services, general, administrative and other
|
31,186,332 | 85,172,529 | 116,358,861 | (48,438,084 | ) | 67,920,777 | ||||||||||||||
|
Depreciation and amortization
|
34,770,426 | 122,549 | 34,892,975 | — | 34,892,975 | |||||||||||||||
|
Operating income (loss)
|
35,195,540 | 4,678,366 | 39,873,906 | (624,557 | ) | 39,249,349 | ||||||||||||||
|
Interest expense
|
(29,721,587 | ) | (355,467 | ) | (30,077,054 | ) | 704,873 | (29,372,181 | ) | |||||||||||
|
Income tax expense of taxable REIT subsidiary
|
— | (1,927,830 | ) | (1,927,830 | ) | — | (1,927,830 | ) | ||||||||||||
|
Income from unconsolidated entities
|
842,425 | — | 842,425 | — | 842,425 | |||||||||||||||
|
Gain on sale of unconsolidated property
|
1,233,338 | — | 1,233,338 | — | 1,233,338 | |||||||||||||||
|
Other income, net
|
862,828 | — | 862,828 | (704,873 | ) | 157,955 | ||||||||||||||
|
Income from continuing operations
|
8,412,544 | 2,395,069 | 10,807,613 | (624,557 | ) | 10,183,056 | ||||||||||||||
|
Discontinued operations:
|
||||||||||||||||||||
|
Discontinued operations
|
330,482 | — | 330,482 | — | 330,482 | |||||||||||||||
|
Loss on sale of operating property
|
(2,689,888 | ) | — | (2,689,888 | ) | — | (2,689,888 | ) | ||||||||||||
|
Loss from discontinued operations
|
(2,359,406 | ) | — | (2,359,406 | ) | — | (2,359,406 | ) | ||||||||||||
|
Consolidated net income
|
6,053,138 | 2,395,069 | 8,448,207 | (624,557 | ) | 7,823,650 | ||||||||||||||
|
Less: Net income attributable to noncontrolling interests
|
(1,453,898 | ) | (374,074 | ) | (1,827,972 | ) | 97,448 | (1,730,524 | ) | |||||||||||
|
Net income attributable to Kite Realty Group Trust
|
$ | 4,599,240 | $ | 2,020,995 | $ | 6,620,235 | $ | (527,109 | ) | $ | 6,093,126 | |||||||||
|
Total assets at December 31, 2008
|
$ | 1,097,996,338 | $ | 51,344,334 | $ | 1,149,340,672 | $ | (37,288,766 | ) | $ | 1,112,051,906 | |||||||||
|
____________________
|
|
|
1
|
This segment includes revenue and expense resulting in a net pre-tax gain of $3.0 million from the sale of land within the Company’s taxable REIT subsidiary. Income tax expense related to this sale was $1.1 million.
|
F-29
Note 14. Quarterly Financial Data (Unaudited)
Presented below is a summary of the consolidated quarterly financial data for the years ended December 31, 2010 and 2009.
|
Quarter Ended
March 31,
2010
|
Quarter Ended
June 30,
2010
|
Quarter Ended
September 30,
2010
|
Quarter Ended
December 31,
2010
|
|||||||||||||
|
Total revenue
|
$ | 25,555,634 | $ | 24,801,116 | $ | 25,155,856 | $ | 25,903,496 | ||||||||
|
Operating income
|
$ | 5,925,825 | $ | 2,846,614 | $ | 4,362,960 | $ | 6,297,674 | ||||||||
|
Consolidated net loss
|
$ | (1,131,124 | ) | $ | (4,550,173 | ) | $ | (2,644,975 | ) | $ | (859,868 | ) | ||||
|
Net loss attributable to Kite Realty Group Trust common shareholders
|
$ | (1,074,680 | ) | $ | (4,020,555 | ) | $ | (2,389,954 | ) | $ | (1,162,620 | ) | ||||
|
Loss per common share – basic and diluted:
|
||||||||||||||||
|
Net loss attributable to Kite Realty Group Trust common shareholders
|
$ | (0.02 | ) | $ | (0.06 | ) | $ | (0.04 | ) | $ | (0.02 | ) | ||||
|
Weighted average Common Shares outstanding
- basic
|
63,121,498 | 63,209,194 | 63,288,181 | 63,340,098 | ||||||||||||
|
- diluted
|
63,121,498 | 63,209,194 | 63,288,181 | 63,340,098 | ||||||||||||
|
Quarter Ended
March 31,
2009
|
Quarter Ended
June 30,
2009
|
Quarter Ended
September 30,
2009
|
Quarter Ended
December 31,
2009
|
|||||||||||||
|
Total revenue
|
$ | 30,211,586 | $ | 30,087,083 | $ | 25,708,597 | $ | 29,284,837 | ||||||||
|
Operating income
|
$ | 7,836,765 | $ | 7,419,641 | $ | 7,324,825 | $ | 7,401,053 | ||||||||
|
Income from continuing operations
|
$ | 1,102,689 | $ | 571,423 | $ | 2,340,380 | $ | 924,873 | ||||||||
|
Income (loss) from discontinued operations
|
$ | (216,711 | ) | $ | (266,036 | ) | $ | (5,616,007 | ) | $ | (18,614 | ) | ||||
|
Consolidated net income (loss)
|
$ | 885,978 | $ | 305,387 | $ | (3,275,627 | ) | $ | 906,259 | |||||||
|
Income from continuing operations attributable to Kite Realty Group Trust common shareholders
|
$ | 876,778 | $ | 485,607 | $ | 1,488,381 | $ | 665,109 | ||||||||
|
Net income (loss) attributable to Kite Realty Group Trust common shareholders
|
$ | 701,242 | $ | 257,085 | $ | (3,383,370 | ) | $ | 643,277 | |||||||
|
Income (loss) per common share – basic and diluted:
|
||||||||||||||||
|
Income from continuing operations attributable to Kite Realty Group Trust common shareholders
|
$ | 0.03 | $ | 0.01 | $ | 0.03 | $ | 0.01 | ||||||||
|
Net income (loss) attributable to Kite Realty Group Trust common shareholders
|
$ | 0.02 | $ | 0.01 | $ | (0.05 | ) | $ | 0.01 | |||||||
|
Weighted average Common Shares outstanding
- basic
|
34,184,305 | 47,988,205 | 62,980,447 | 62,997,180 | ||||||||||||
|
- diluted
|
34,220,160 | 48,081,453 | 62,980,447 | 63,132,990 | ||||||||||||
Note 15. Commitments and Contingencies
Eddy Street Commons at Notre Dame
Phase I of Eddy Street Commons at the University of Notre Dame, located adjacent to the university in South Bend, Indiana, was substantially completed and moved to the operating portfolio in the fourth quarter of 2010. This multi-phase project includes retail, office, a limited service hotel, a parking garage, apartments, and residential units and is expected to include a full service hotel. The Company wholly owns the retail and office components while other components are or are expected to be owned by third parties or through joint ventures. The ground beneath the initial phase of the development is leased from the University of Notre Dame over a 75 year lease term at a fixed rate for the first two years and based on a percentage of certain gross revenues thereafter.
F-30
The City of South Bend has contributed $35 million to the development, funded by tax increment financing (TIF) bonds issued by the City and a cash commitment from the City, both of which were used for the construction of the parking garage and infrastructure improvements to this project. The majority of the bonds will be funded by real estate tax payments made by the Company and subject to reimbursement from the tenants of the property; however, the Company has no obligations to repay or guarantee the bonds. If there are delays in the development, the Company is obligated to pay certain fees. However, it has an agreement with the City of South Bend to limit its exposure to a maximum of $1 million as to such fees. In addition, the Company will not be in default concerning other obligations under the agreement with the City of South Bend so long as it commences and diligently pursues the completion of its obligations under that agreement.
Although the Company does not expect to own either the residential or the apartment complex components of the project, the Company has jointly guaranteed the apartment developer’s construction loan, which at December 31, 2010, had an outstanding balance of $30.3 million. As of December 31, 2010, the construction of the apartments is substantially complete. The Company also has a contractual obligation in the form of a completion guarantee to the University of Notre Dame and a similar agreement in favor of the City of South Bend to complete all phases of the $200 million project (the Company’s portion of which is approximately $64 million), with the exception of certain of the residential units, consistent with commitments the Company typically makes in connection with other bank-funded development projects. If the Company fails to fulfill its contractual obligations in connection with the project, but is timely commencing and pursuing a cure, it will not be in default to either the University of Notre Dame and the City of South Bend.
Joint Venture Indebtedness
Joint venture debt is the liability of the joint venture and is typically secured by the assets of the joint venture under circumstances where the lender has limited recourse to the Company. As of December 31, 2010, the Company’s share of unconsolidated joint venture indebtedness was $18.3 million, $13.5 million of which was related to the Parkside Town Commons development. The remaining $4.8 million represents the Company’s share of the $9.4 million drawn on the Eddy Street Commons limited service hotel construction loan. The loan, obtained in the third quarter of 2009, has a total commitment of $10.9 million, bears interest at the greater of LIBOR + 315 basis points or 4.00%, and matures in August 2014.
As of December 31, 2010, the Operating Partnership had guaranteed its $13.5 million share of the unconsolidated joint venture debt related to the Parkside Town Commons development in the event the joint venture partnership defaults under the terms of the underlying arrangement. Mortgages which are guaranteed by the Operating Partnership are secured by the property of the joint venture and the joint venture could sell the property in order to satisfy the outstanding obligation.
Other Commitments and Contingencies
The Company is not subject to any material litigation nor, to management’s knowledge, is any material litigation currently threatened against the Company other than routine litigation, claims and administrative proceedings arising in the ordinary course of business. Management believes that such routine litigation, claims and administrative proceedings will not have a material adverse impact on the Company’s consolidated financial statements.
The Company is obligated under various completion guarantees with lenders and lease agreements with tenants to complete two projects in its in-process development pipeline. The Company currently anticipates its share of the total cost of these projects will be approximately $42 million, of which approximately $10.7 million was unfunded as of December 31, 2010. The Company believes it currently has sufficient financing in place to fund these projects and expect to do so primarily through existing construction loans. In addition, if necessary, it may make draws on its unsecured facility.
As of December 31, 2010, the Company had outstanding letters of credit totaling $7.2 million. At that date, there were no amounts advanced against these instruments.
F-31
Note 16. Employee 401(k) Plan
The Company maintains a 401(k) plan for employees under which it matches 100% of the employee’s contribution up to 3% of the employee’s salary and 50% of the employee’s contribution over 3% and up to 5% of the employee’s salary, not to exceed an annual maximum of $15,000, except in certain limited circumstances. The Company contributed $0.2 million, $0.3 million, and $0.3 million to this plan for the years ended December 31, 2010, 2009, and 2008, respectively.
Note 17. Recent Accounting Pronouncements
In June 2009, the FASB issued SFAS No. 167, “Amendments to FASB Interpretation No. 46(R),” which is effective for fiscal years beginning after November 15, 2009 and introduces a more qualitative approach to evaluating VIEs for consolidation. This provision was primarily codified into Topic 810 – “Consolidation” in the ASC and requires a company to perform an analysis to determine whether its variable interest gives it a controlling financial interest in a VIE. This analysis identifies the primary beneficiary of a VIE as the entity that has (i) the power to direct the activities of the VIE that most significantly impact the VIE’s economic performance, and (ii) the obligation to absorb losses or the right to receive benefits that could potentially be significant to the VIE. In determining whether it has the power to direct the activities of the VIE that most significantly affect the VIE’s performance, the provision requires a company to assess whether it has an implicit financial responsibility to ensure that a VIE operates as designed. It also requires continuous reassessment of primary beneficiary status rather than periodic, event-driven assessments as previously required, and incorporates expanded disclosure requirements. The adoption of this provision on January 1, 2010 had no impact on the Company’s determination of the primary beneficiary of its VIEs. Thus, the adoption did not impact the Company’s consolidated financial statements.
Note 18. Supplemental Schedule of Non-Cash Investing/Financing Activities
The following schedule summarizes the non-cash investing and financing activities of the Company for the years ended December 31, 2010, 2009 and 2008:
|
Year Ended December 31,
|
||||||||||||
|
2010
|
2009
|
2008
|
||||||||||
|
Recognition of noncontrolling interests upon consolidation of subsidiary
|
$ | — | $ | 2,175,354 | $ | — | ||||||
|
Imputed value of common area development land at Eddy Street Commons
|
$ | — | $ | — | $ | 1,900,000 | ||||||
|
Accrued distribution to preferred shareholders
|
$ | 376,979 | $ | — | $ | — | ||||||
Note 19. Related Parties
Subsidiaries of the Company provide certain management, construction management and other services to certain unconsolidated entities and to entities owned by certain members of the Company’s management. During the years ended December 31, 2010, 2009 and 2008, the Company earned $0.1 million, $0.1 million and $0.1 million, respectively from unconsolidated entities and $40,000, $0.1 million and $0.3 million, respectively from entities owned by certain members of management.
The Company reimburses an entity owned by certain members of the Company’s management for travel and related services. During the years ended December 31, 2010, 2009 and 2008, amounts paid by the Company to this related entity were $0.2 million, $0.3 million and $0.3 million, respectively.
F-32
Note 20. Subsequent Events
2011 Debt Refinancings
In January 2011, the Company extended the maturity date of the $3.5 million variable rate loan on the Indiana State Motor Pool property to February 2014 at an interest rate of LIBOR + 325 basis points.
In February 2011, the Company extended the maturity date of the $33.9 million construction loan on the Parkside Town Commons property to August 2013 at an interest rate of LIBOR + 300 basis points and funded a $5.5 million paydown with cash. This property is owned by an unconsolidated joint venture.
Acquisitions
In February 2011, the Company completed the acquisition of the remaining 40% interest in The Centre from its joint venture partners and assumed all leasing and management responsibilities. The purchase price of the 40% interest was approximately $2.3 million, including the repayment of a $700,000 loan made by the Company.
In February 2011, the Company acquired a retail shopping center in Wilmington, North Carolina. This center was acquired in an off-market transaction for a purchase price of $3.5 million. This center is anchored by Lowe’s Foods. This asset was acquired as a redevelopment opportunity.
Dividend Declaration
On February 15, 2011, the Board of Trustees declared a quarterly preferred share cash distribution of $0.48697917 per preferred share covering the distribution period from December 7, 2010 to March 1, 2011 payable to shareholders of record as of February 22, 2011. This distribution was paid on March 1, 2011.
F-33
Kite Realty Group Trust
Schedule III
Consolidated Real Estate and Accumulated Depreciation
|
Initial Cost
|
Cost Capitalized Subsequent to Acquisition/
Development
|
Gross Carry Amount Close of Period
|
||||||||||||||||||||||||||||||||||||||||||
|
Building &
|
Building &
|
Building &
|
Accumulated
|
Year Built/
|
Year
|
|||||||||||||||||||||||||||||||||||||||
|
Name, Location
|
Encumbrances
|
Land
|
Improvements
|
Land
|
Improvements
|
Land
|
Improvements
|
Total
|
Depreciation
|
Renovated
|
Acquired
|
|||||||||||||||||||||||||||||||||
|
Shopping Centers
|
||||||||||||||||||||||||||||||||||||||||||||
|
50th & 12th
|
$ | 4,293,034 | $ | 2,995,931 | $ | 2,810,145 | $ | - | $ | - | $ | 2,995,931 | $ | 2,810,145 | $ | 5,806,076 | $ | 513,884 | 2004 |
NA
|
||||||||||||||||||||||||
|
The Shops at Otty *
|
- | 26,000 | 2,150,737 | - | 193,192 | 26,000 | 2,343,929 | $ | 2,369,929 | 494,625 | 2004 |
NA
|
||||||||||||||||||||||||||||||||
|
Burlington Coat *
|
- | 29,000 | 3,333,311 | - | - | 29,000 | 3,333,311 | $ | 3,362,311 | 1,186,030 | 1992/2000 | 2000 | ||||||||||||||||||||||||||||||||
|
Cedar Hill Village *
|
- | 1,352,645 | 5,721,843 | - | 1,450,968 | 1,352,645 | 7,172,811 | $ | 8,525,456 | 1,423,824 | 2002 | 2004 | ||||||||||||||||||||||||||||||||
|
Coral Springs Plaza *
|
- | 2,033,000 | 7,370,526 | - | 3,488 | 2,033,000 | 7,374,014 | $ | 9,407,014 | 682,294 | 2004/2010 |
NA
|
||||||||||||||||||||||||||||||||
|
The Corner
|
1,486,487 | 303,916 | 4,078,159 | - | 487,835 | 303,916 | 4,565,994 | $ | 4,869,910 | 2,588,902 | 1984/2003 | 1984 | ||||||||||||||||||||||||||||||||
|
Eastgate Pavilion
|
14,883,390 | 8,482,803 | 21,634,620 | - | 97,661 | 8,482,803 | 21,732,281 | $ | 30,215,084 | 5,889,757 | 1995 | 2004 | ||||||||||||||||||||||||||||||||
|
Glendale Town Center
|
19,615,000 | 1,510,643 | 45,926,876 | - | 26,810 | 1,510,643 | 45,953,686 | $ | 47,464,329 | 15,172,542 | 1958/2008 | 1999 | ||||||||||||||||||||||||||||||||
|
Publix at Acworth *
|
- | 1,395,379 | 8,303,544 | - | 30,441 | 1,395,379 | 8,333,985 | $ | 9,729,364 | 1,649,565 | 1996 | 2004 | ||||||||||||||||||||||||||||||||
|
Shops at Eagle Creek *
|
- | 2,877,727 | 8,163,340 | 200,087 | 2,702,513 | 3,077,814 | 10,865,853 | $ | 13,943,667 | 1,821,687 | 1998 | 2003 | ||||||||||||||||||||||||||||||||
|
King's Lake Square *
|
- | 4,519,000 | 7,612,393 | - | 1,022,937 | 4,519,000 | 8,635,331 | $ | 13,154,331 | 1,960,376 | 1986 | 2003 | ||||||||||||||||||||||||||||||||
|
Boulevard Crossing *
|
- | 4,385,525 | 10,498,226 | - | 880,417 | 4,385,525 | 11,378,643 | $ | 15,764,168 | 2,493,135 | 2004 |
NA
|
||||||||||||||||||||||||||||||||
|
Ridge Plaza
|
14,746,436 | 4,664,000 | 17,669,004 | - | 772,218 | 4,664,000 | 18,441,222 | $ | 23,105,222 | 4,645,223 | 2002 | 2003 | ||||||||||||||||||||||||||||||||
|
Fishers Station *
|
3,656,493 | 3,735,807 | 9,250,106 | - | 1,744,167 | 3,735,807 | 10,994,272 | $ | 14,730,079 | 3,787,809 | 1989 | 2004 | ||||||||||||||||||||||||||||||||
|
Plaza at Cedar Hill
|
25,175,721 | 5,782,304 | 38,823,704 | - | 4,056,709 | 5,782,304 | 42,880,413 | $ | 48,662,717 | 8,429,852 | 2000 | 2004 | ||||||||||||||||||||||||||||||||
|
Four Corner Square *
|
- | 4,756,990 | 5,631,388 | - | 292,465 | 4,756,990 | 5,923,853 | $ | 10,680,843 | 1,057,664 | 1985 | 2004 | ||||||||||||||||||||||||||||||||
|
Wal-Mart Plaza *
|
- | 5,437,373 | 10,119,351 | - | - | 5,437,373 | 10,119,351 | $ | 15,556,724 | 1,754,707 | 1970 | 2004 | ||||||||||||||||||||||||||||||||
|
Hamilton Crossing *
|
- | 5,672,477 | 10,174,505 | - | 275,936 | 5,672,477 | 10,450,441 | $ | 16,122,918 | 2,530,040 | 1999 | 2004 | ||||||||||||||||||||||||||||||||
|
Centre at Panola *
|
3,464,489 | 1,985,975 | 8,248,562 | - | 18,685 | 1,985,975 | 8,267,247 | $ | 10,253,222 | 1,753,217 | 2001 | 2004 | ||||||||||||||||||||||||||||||||
|
Sunland Towne Centre *
|
25,000,000 | 14,773,536 | 23,693,811 | - | 1,560,576 | 14,773,536 | 25,254,387 | $ | 40,027,923 | 4,987,404 | 1996 | 2004 | ||||||||||||||||||||||||||||||||
|
Waterford Lakes *
|
- | 2,316,674 | 7,571,584 | - | 72,215 | 2,316,674 | 7,643,799 | $ | 9,960,473 | 1,844,096 | 1997 | 2004 | ||||||||||||||||||||||||||||||||
|
International Speedway Square *
|
- | 6,646,000 | 19,892,637 | - | 5,751,638 | 6,646,000 | 25,644,275 | $ | 32,290,275 | 7,177,878 | 1999 |
NA
|
||||||||||||||||||||||||||||||||
|
50 South Morton *
|
- | 110,212 | 919,705 | - | - | 110,212 | 919,705 | $ | 1,029,917 | 396,782 | 1999 |
NA
|
||||||||||||||||||||||||||||||||
|
Preston Commons
|
4,223,200 | 1,102,000 | 3,294,103 | - | 500,326 | 1,102,000 | 3,794,429 | $ | 4,896,429 | 1,557,205 | 2002 |
NA
|
||||||||||||||||||||||||||||||||
|
Whitehall Pike
|
8,039,656 | 3,688,857 | 6,405,940 | - | 120,742 | 3,688,857 | 6,526,682 | $ | 10,215,539 | 3,437,734 | 1999 |
NA
|
||||||||||||||||||||||||||||||||
|
Stoney Creek Commons *
|
- | 627,964 | 4,599,185 | - | - | 627,964 | 4,599,185 | $ | 5,227,149 | 726,480 | 2000 |
NA
|
||||||||||||||||||||||||||||||||
|
Bolton Plaza *
|
- | 3,560,389 | 9,820,353 | 173,037 | 600,195 | 3,733,426 | 10,420,547 | $ | 14,153,973 | 1,211,290 | 1986 | 2005 | ||||||||||||||||||||||||||||||||
|
Indian River Square
|
13,040,043 | 5,180,000 | 10,610,278 | - | 25,800 | 5,180,000 | 10,636,078 | $ | 15,816,078 | 3,722,751 | 1997/2004 | 2005 | ||||||||||||||||||||||||||||||||
|
Fox Lake Crossing
|
11,050,412 | 5,289,306 | 9,336,901 | - | 19,644 | 5,289,306 | 9,356,545 | $ | 14,645,851 | 1,738,225 | 2002 | 2005 | ||||||||||||||||||||||||||||||||
|
Plaza Volente
|
28,119,431 | 4,600,000 | 29,436,262 | - | 12,000 | 4,600,000 | 29,448,262 | $ | 34,048,262 | 5,147,283 | 2004 | 2005 | ||||||||||||||||||||||||||||||||
|
Market Street Village *
|
- | 9,764,381 | 19,088,974 | - | 380,476 | 9,764,381 | 19,469,449 | $ | 29,233,830 | 3,875,551 | 1970/2004 | 2005 | ||||||||||||||||||||||||||||||||
|
Cool Creek Commons *
|
17,643,234 | 6,062,351 | 15,638,093 | - | 64,618 | 6,062,351 | 15,702,711 | $ | 21,765,062 | 3,526,407 | 2005 |
NA
|
||||||||||||||||||||||||||||||||
|
Traders Point
|
45,895,436 | 9,443,449 | 37,292,805 | - | 83,440 | 9,443,449 | 37,376,245 | $ | 46,819,694 | 6,958,766 | 2005 |
NA
|
||||||||||||||||||||||||||||||||
|
Traders Point II *
|
- | 2,375,797 | 7,070,270 | - | 6,736 | 2,375,797 | 7,077,006 | $ | 9,452,803 | 1,242,648 | 2005 |
NA
|
||||||||||||||||||||||||||||||||
|
Greyhound Commons *
|
- | 2,647,561 | 866,993 | - | - | 2,647,561 | 866,993 | $ | 3,514,554 | 249,200 | 2005 |
NA
|
||||||||||||||||||||||||||||||||
|
Martinsville Shops *
|
- | 636,692 | 1,042,570 | - | 10,678 | 636,692 | 1,053,248 | $ | 1,689,940 | 167,992 | 2005 |
NA
|
||||||||||||||||||||||||||||||||
F-34
|
Initial Cost
|
Cost Capitalized Subsequent to Acquisition/
Development
|
Gross Carry Amount Close of Period
|
||||||||||||||||||||||||||||||||||||||||||
|
Building &
|
Building &
|
Building &
|
Accumulated
|
Year Built/
|
Year
|
|||||||||||||||||||||||||||||||||||||||
|
Name, Location
|
Encumbrances
|
Land
|
Improvements
|
Land
|
Improvements
|
Land
|
Improvements
|
Total
|
Depreciation
|
Renovated
|
Acquired
|
|||||||||||||||||||||||||||||||||
|
Shopping Centers (continued)
|
||||||||||||||||||||||||||||||||||||||||||||
|
Geist Pavilion
|
11,125,000 | 1,367,816 | 9,789,360 | - | 545,157 | 1,367,816 | 10,334,517 | 11,702,333 | 1,932,494 | 2006 |
NA
|
|||||||||||||||||||||||||||||||||
|
Red Bank Commons *
|
- | 1,408,328 | 4,751,370 | - | - | 1,408,328 | 4,751,370 | 6,159,698 | 907,145 | 2005 |
NA
|
|||||||||||||||||||||||||||||||||
|
Zionsville Place *
|
- | 640,332 | 2,481,662 | - | 243,264 | 640,332 | 2,724,926 | 3,365,258 | 427,614 | 2006 |
NA
|
|||||||||||||||||||||||||||||||||
|
Pine Ridge Crossing
|
17,500,000 | 5,639,675 | 18,723,939 | - | 393,556 | 5,639,675 | 19,117,494 | 24,757,169 | 3,098,951 | 1993 | 2006 | |||||||||||||||||||||||||||||||||
|
Riverchase
|
10,500,000 | 3,888,945 | 12,892,988 | - | 70,645 | 3,888,945 | 12,963,633 | 16,852,578 | 2,440,928 | 1991/2001 | 2006 | |||||||||||||||||||||||||||||||||
|
Courthouse Shadows *
|
- | 4,998,974 | 16,783,307 | - | 12,031 | 4,998,974 | 16,795,338 | 21,794,312 | 3,173,152 | 1987/1999 | 2006 | |||||||||||||||||||||||||||||||||
|
Kedron Village
|
29,700,000 | 3,750,000 | 33,232,839 | - | 106,750 | 3,750,000 | 33,339,589 | 37,089,589 | 4,395,671 | 2006 |
NA
|
|||||||||||||||||||||||||||||||||
|
Tarpon Springs Plaza
|
12,187,942 | 5,370,399 | 24,600,892 | - | - | 5,370,399 | 24,600,892 | 29,971,291 | 2,437,087 | 2007 |
NA
|
|||||||||||||||||||||||||||||||||
|
Estero Town Commons
|
10,500,000 | 8,973,290 | 10,141,224 | - | - | 8,973,290 | 10,141,224 | 19,114,514 | 999,049 | 2006 |
NA
|
|||||||||||||||||||||||||||||||||
|
Beacon Hill Shopping Center
|
7,401,750 | 3,408,144 | 13,041,081 | - | 13,160 | 3,408,144 | 13,054,241 | 16,462,385 | 1,345,755 | 2006 |
NA
|
|||||||||||||||||||||||||||||||||
|
Cornelius Gateway
|
- | 1,249,447 | 3,649,537 | - | - | 1,249,447 | 3,649,537 | 4,898,984 | 369,037 | 2006 |
NA
|
|||||||||||||||||||||||||||||||||
|
Naperville Marketplace *
|
- | 5,364,101 | 12,116,364 | - | - | 5,364,101 | 12,116,364 | 17,480,465 | 1,044,595 | 2008 |
NA
|
|||||||||||||||||||||||||||||||||
|
Gateway Shopping Center
|
20,712,866 | 6,095,738 | 20,193,842 | - | - | 6,095,738 | 20,193,842 | 26,289,580 | 1,700,868 | 2008 |
NA
|
|||||||||||||||||||||||||||||||||
|
Bridgewater Marketplace
|
7,000,000 | 3,406,641 | 8,257,358 | - | - | 3,406,641 | 8,257,358 | 11,663,999 | 686,140 | 2008 |
NA
|
|||||||||||||||||||||||||||||||||
|
Sandifur Plaza
|
- | 834,034 | 2,071,015 | - | - | 834,034 | 2,071,015 | 2,905,049 | 237,134 | 2008 |
NA
|
|||||||||||||||||||||||||||||||||
|
Bayport Commons
|
14,923,016 | 7,868,354 | 22,355,115 | - | - | 7,868,354 | 22,355,115 | 30,223,469 | 1,785,229 | 2008 |
NA
|
|||||||||||||||||||||||||||||||||
|
54th & College *
|
- | 2,671,501 | - | - | - | 2,671,501 | - | 2,671,501 | - | 2008 |
NA
|
|||||||||||||||||||||||||||||||||
|
KRG ISS *
|
- | 1,123,277 | 190,031 | - | - | 1,123,277 | 190,031 | 1,313,308 | 39,219 | 2007 |
NA
|
|||||||||||||||||||||||||||||||||
|
Eddy Street Commons
|
24,871,142 | 1,900,000 | 34,618,192 | - | 1,900,000 | 34,618,192 | 36,518,192 | 816,735 | 2009 |
NA
|
||||||||||||||||||||||||||||||||||
|
South Elgin
|
- | 2,458,707 | 6,217,017 | - | 2,458,707 | 6,217,017 | 8,675,724 | 585,375 | 2009 |
NA
|
||||||||||||||||||||||||||||||||||
|
The Centre
|
- | 2,042,885 | 4,800,440 | - | 2,129 | 2,042,885 | 4,802,569 | 6,845,454 | 1,056,947 | 1986 |
NA
|
|||||||||||||||||||||||||||||||||
|
Total Shopping Centers
|
406,754,180 | 215,232,252 | 695,008,376 | 373,124 | 24,652,219 | 215,605,376 | 719,660,594 | 935,265,970 | 137,281,950 | |||||||||||||||||||||||||||||||||||
|
Commercial Properties
|
||||||||||||||||||||||||||||||||||||||||||||
|
Indiana State Motor Pool
|
3,467,910 | 54,000 | 4,600,406 | - | 14,018 | 54,000 | 4,614,424 | 4,668,424 | 810,572 | 2004 |
NA
|
|||||||||||||||||||||||||||||||||
|
PEN Products *
|
- | 126,000 | 5,966,519 | - | 127,784 | 126,000 | 6,094,303 | 6,220,303 | 1,720,732 | 2003 |
NA
|
|||||||||||||||||||||||||||||||||
|
Thirty South
|
21,303,984 | 1,643,415 | 9,544,868 | - | 13,372,396 | 1,643,415 | 22,917,264 | 24,560,679 | 5,876,848 | 1905/2002 | 2001 | |||||||||||||||||||||||||||||||||
|
Union Station Parking Garage *
|
- | 903,627 | 2,642,598 | - | 446,406 | 903,627 | 3,089,004 | 3,992,631 | 836,730 | 1986 | 2001 | |||||||||||||||||||||||||||||||||
|
Total Commercial Properties
|
24,771,894 | 2,727,042 | 22,754,391 | - | 13,960,604 | 2,727,042 | 36,714,995 | 39,442,037 | 9,244,882 | |||||||||||||||||||||||||||||||||||
|
Development Properties
|
||||||||||||||||||||||||||||||||||||||||||||
|
Cobblestone Plaza
|
28,347,102 | 11,596,016 | 35,010,052 | - | - | 11,596,016 | 35,010,052 | 44,269,708 | 90,464 | |||||||||||||||||||||||||||||||||||
|
Delray Beach
|
4,725,000 | 18,505,126 | 27,472,766 | - | - | 18,505,126 | 27,472,766 | 43,405,086 | - | |||||||||||||||||||||||||||||||||||
|
Eddy Street Commons
|
- | - | 809,881 | - | - | - | 809,881 | 31,845,801 | 42,462 | |||||||||||||||||||||||||||||||||||
|
South Elgin
|
9,170,000 | 3,524,517 | 3,964,211 | - | - | 3,524,517 | 3,964,211 | 15,009,956 | 212,720 | |||||||||||||||||||||||||||||||||||
|
Courthouse Shadows
|
328,324 | - | 328,324 | |||||||||||||||||||||||||||||||||||||||||
|
Four Corner Square *
|
- | - | 5,626,952 | - | - | 5,170,991 | 5,626,952 | 10,082,442 | - | |||||||||||||||||||||||||||||||||||
|
Rivers Edge Shopping Center
|
14,311,525 | 5,453,170 | 10,572,372 | 5,453,170 | 10,572,372 | |||||||||||||||||||||||||||||||||||||||
|
KRG Development
|
- | - | 1,451,302 | - | - | - | 1,451,302 | 615,620 | - | |||||||||||||||||||||||||||||||||||
|
Total Development Properties
|
56,553,627 | 44,249,820 | 85,235,860 | - | - | 44,249,820 | 85,235,860 | 129,485,680 | 1,362,539 | |||||||||||||||||||||||||||||||||||
F-35
|
Initial Cost
|
Cost Capitalized Subsequent to Acquisition/
Development
|
Gross Carry Amount Close of Period
|
||||||||||||||||||||||||||||||||||||||||||
| Name, |
Building &
|
Building &
|
Building &
|
Accumulated
|
Year Built/
|
Year
|
||||||||||||||||||||||||||||||||||||||
|
Location
|
Encumbrances
|
Land
|
Improvements
|
Land
|
Improvements
|
Land
|
Improvements
|
Total
|
Depreciation
|
Renovated
|
Acquired
|
|||||||||||||||||||||||||||||||||
|
Other
|
||||||||||||||||||||||||||||||||||||||||||||
|
Frisco Bridges
|
- | 1,101,558 | - | - | - | 1,101,558 | - | 1,101,558 | - | |||||||||||||||||||||||||||||||||||
|
Bridgewater Marketplace
|
- | 1,974,311 | - | - | - | 1,974,311 | - | 1,974,311 | - | |||||||||||||||||||||||||||||||||||
|
Eagle Creek IV *
|
- | 1,647,336 | - | - | - | 1,647,336 | - | 1,647,336 | - | |||||||||||||||||||||||||||||||||||
|
50 South Morton *
|
- | 186,000 | - | - | - | 186,000 | - | 186,000 | - | |||||||||||||||||||||||||||||||||||
|
Zionsville Place *
|
- | 674,392 | - | - | - | 674,392 | - | 674,392 | - | |||||||||||||||||||||||||||||||||||
|
Fox Lake Crossing II
|
- | 3,853,747 | - | - | - | 3,853,747 | - | 3,853,747 | - | |||||||||||||||||||||||||||||||||||
|
KR Peakway *
|
- | 5,357,290 | - | - | - | 5,357,290 | - | 5,357,290 | - | |||||||||||||||||||||||||||||||||||
|
KRG Peakway *
|
- | 5,301,902 | 10,756,823 | - | - | 5,301,902 | 10,756,823 | 16,058,725 | - | |||||||||||||||||||||||||||||||||||
|
Beacon Hill Shopping Center
|
- | 3,799,138 | - | - | - | 3,799,138 | - | 3,799,138 | - | |||||||||||||||||||||||||||||||||||
|
Pan Am Plaza *
|
- | 5,108,932 | - | - | - | 5,108,932 | - | 5,108,932 | - | |||||||||||||||||||||||||||||||||||
|
New Hill Place *
|
- | 30,358,159 | - | - | - | 30,358,159 | - | 30,358,159 | - | |||||||||||||||||||||||||||||||||||
|
KR New Hill *
|
- | 4,304,586 | - | - | - | 4,304,586 | - | 4,304,586 | - | |||||||||||||||||||||||||||||||||||
|
951 & 41 *
|
- | 16,148,624 | - | - | - | 16,148,624 | - | 16,148,624 | - | |||||||||||||||||||||||||||||||||||
|
Total Other
|
406,754,180 | 79,815,975 | 10,756,823 | - | - | 79,815,975 | 10,756,823 | 90,572,798 | - | |||||||||||||||||||||||||||||||||||
| Line of credit - see * | 122,300,000 | - | - | - | - | - | - | - | - | |||||||||||||||||||||||||||||||||||
| Grand Total | $ | 610,379,701 | $ | 342,025,089 | $ | 813,755,449 | $ | 373,124 | $ | 38,612,823 | $ | 342,398,213 | $ | 852,368,272 | $ | 1,194,766,485 | $ | 147,889,371 | ||||||||||||||||||||||||||
|
____________________
|
|
|
*
|
This property or a portion of the property is included as an Unencumbered Pool Property used in calculating the Company’s line of credit borrowing base.
|
|
**
|
This category generally includes land held for development. The Company also has certain additional land parcels at its development and operating properties, which amounts are included elsewhere in this table.
|
F-36
Kite Realty Group Trust
Notes to Schedule III
Consolidated Real Estate and Accumulated Depreciation
Note 1. Reconciliation of Investment Properties
The changes in investment properties of the Company for the years ended December 31, 2010, 2009, and 2008 are as follows:
|
2010
|
2009
|
2008
|
||||||||||
|
Balance, beginning of year
|
$ | 1,166,770,168 | $ | 1,134,480,942 | $ | 1,045,615,844 | ||||||
|
Acquisitions
|
— | — | 18,499,248 | |||||||||
|
Consolidation of subsidiary
|
— | 6,925,022 | — | |||||||||
|
Improvements
|
41,900,543 | 49,375,257 | 119,026,069 | |||||||||
|
Disposals
|
(13,904,226 | ) | (24,011,053 | ) | (48,660,219 | ) | ||||||
|
Balance, end of year
|
$ | 1,194,766,485 | $ | 1,166,770,168 | $ | 1,134,480,942 | ||||||
The unaudited aggregate cost of investment properties for federal tax purposes as of December 31, 2010 was $1.1 billion.
Note 2. Reconciliation of Accumulated Depreciation
The changes in accumulated depreciation of the Company for the years ended December 31, 2010, 2009, and 2008 are as follows:
|
2010
|
2009
|
2008
|
||||||||||
|
Balance, beginning of year
|
$ | 123,313,411 | $ | 100,762,741 | $ | 81,868,605 | ||||||
|
Depreciation and amortization expense
|
35,767,040 | 27,714,495 | 31,057,810 | |||||||||
|
Disposals
|
(11,191,080 | ) | (5,163,825 | ) | (12,163,674 | ) | ||||||
|
Balance, end of year
|
$ | 147,889,371 | $ | 123,313,411 | $ | 100,762,741 | ||||||
Depreciation of investment properties reflected in the statements of operations is calculated over the estimated original lives of the assets as follows:
|
Buildings
|
35 years
|
|
Building improvements
|
10-35 years
|
|
Tenant improvements
|
Term of related lease
|
|
Furniture and Fixtures
|
5-10 years
|
F-37
EXHIBIT INDEX
|
Exhibit No.
|
Description
|
Location
|
||
|
3.1
|
Articles of Amendment and Restatement of Declaration of Trust of the Company
|
Incorporated by reference to Exhibit 3.1 to the Current Report on Form 8-K of Kite Realty Group Trust filed with the SEC on August 20, 2004
|
||
|
3.2
|
Articles Supplementary designating Kite Realty Group Trust’s 8.250% Series A Cumulative Redeemable Perpetual Preferred Shares, liquidation preference $25.00 per share, par value $0.01 per share
|
Incorporate by reference to Exhibit 3.2 to Kite Realty Group Trust’s registration statement of Form 8-A filed on December 7, 2010
|
||
|
3.3
|
Amended and Restated Bylaws of the Company, as amended
|
Incorporated by reference to Exhibit 3.2 of the Annual Report on Form 10-K of Kite Realty Group Trust for the period ended December 31, 2004
|
||
|
4.1
|
Form of Common Share Certificate
|
Incorporated by reference to Exhibit 4.1 to Kite Realty Group Trust’s registration statement on Form S-11 (File No. 333-114224) declared effective by the SEC on August 10, 2004
|
||
|
4.2
|
Form of share certificate evidencing the 8.250% Series A Cumulative Redeemable Perpetual Preferred Shares, liquidation preference $25.00 per share, per value $0.01 per share
|
Incorporate by reference to Exhibit 4.1 to Kite Realty Group Trust’s registration statement on Form 8-A filed on December 7, 2010
|
||
|
10.1
|
Amended and Restated Agreement of Limited Partnership of Kite Realty Group, L.P., dated as of August 16, 2004
|
Incorporated by reference to Exhibit 10.1 to the Current Report on Form 8-K of Kite Realty Group Trust filed with the SEC on August 20, 2004
|
||
|
10.2
|
Amendment No. 1 to Amended and Restated Agreement of Limited Partnership of Kite Realty Group, L.P., dated as of December 7, 2010
|
Incorporate by reference to Exhibit 10.1 to the Current Report on Form 8-K of Kite Realty Group Trust filed with the SEC on December 13, 2010
|
||
|
10.3
|
Employment Agreement, dated as of August 16, 2004, by and between the Company and John A. Kite*
|
Incorporated by reference to Exhibit 10.9 to the Current Report on Form 8-K of Kite Realty Group Trust filed with the SEC on August 20, 2004
|
||
|
10.4
|
Employment Agreement, dated as of August 16, 2004, by and between the Company and Thomas K. McGowan*
|
Incorporated by reference to Exhibit 10.10 to the Current Report on Form 8-K of Kite Realty Group Trust filed with the SEC on August 20, 2004
|
||
|
10.5
|
Employment Agreement, dated as of August 16, 2004, by and between the Company and Daniel R. Sink*
|
Incorporated by reference to Exhibit 10.11 to the Current Report on Form 8-K of Kite Realty Group Trust filed with the SEC on August 20, 2004
|
||
|
10.5
|
Noncompetition Agreement, dated as of August 16, 2004, by and between the Company and Alvin E. Kite, Jr.*
|
Incorporated by reference to Exhibit 10.12 to the Current Report on Form 8-K of Kite Realty Group Trust filed with the SEC on August 20, 2004
|
||
|
10.6
|
Noncompetition Agreement, dated as of August 16, 2004, by and between the Company and John A. Kite*
|
Incorporated by reference to Exhibit 10.13 to the Current Report on Form 8-K of Kite Realty Group Trust filed with the SEC on August 20, 2004
|
||
|
10.7
|
Noncompetition Agreement, dated as of August 16, 2004, by and between the Company and Thomas K. McGowan*
|
Incorporated by reference to Exhibit 10.14 to the Current Report on Form 8-K of Kite Realty Group Trust filed with the SEC on August 20, 2004
|
||
|
10.8
|
Noncompetition Agreement, dated as of August 16, 2004, by and between the Company and Daniel R. Sink*
|
Incorporated by reference to Exhibit 10.15 to the Current Report on Form 8-K of Kite Realty Group Trust filed with the SEC on August 20, 2004
|
||
|
10.9
|
Indemnification Agreement, dated as of August 16, 2004, by and between Kite Realty Group, L.P. and Alvin E. Kite*
|
Incorporated by reference to Exhibit 10.16 to the Current Report on Form 8-K of Kite Realty Group Trust filed with the SEC on August 20, 2004
|
||
|
10.10
|
Indemnification Agreement, dated as of August 16, 2004, by and between Kite Realty Group, L.P. and John A. Kite*
|
Incorporated by reference to Exhibit 10.17 to the Current Report on Form 8-K of Kite Realty Group Trust filed with the SEC on August 20, 2004
|
|
10.11
|
Indemnification Agreement, dated as of August 16, 2004, by and between Kite Realty Group, L.P. and Thomas K. McGowan*
|
Incorporated by reference to Exhibit 10.18 to the Current Report on Form 8-K of Kite Realty Group Trust filed with the SEC on August 20, 2004
|
||
|
10.12
|
Indemnification Agreement, dated as of August 16, 2004, by and between Kite Realty Group, L.P. and Daniel R. Sink*
|
Incorporated by reference to Exhibit 10.19 to the Current Report on Form 8-K of Kite Realty Group Trust filed with the SEC on August 20, 2004
|
||
|
10.13
|
Indemnification Agreement, dated as of August 16, 2004, by and between Kite Realty Group, L.P. and William E. Bindley*
|
Incorporated by reference to Exhibit 10.20 to the Current Report on Form 8-K of Kite Realty Group Trust filed with the SEC on August 20, 2004
|
||
|
10.14
|
Indemnification Agreement, dated as of August 16, 2004, by and between Kite Realty Group, L.P. and Michael L. Smith*
|
Incorporated by reference to Exhibit 10.21 to the Current Report on Form 8-K of Kite Realty Group Trust filed with the SEC on August 20, 2004
|
||
|
10.15
|
Indemnification Agreement, dated as of August 16, 2004, by and between Kite Realty Group, L.P. and Eugene Golub*
|
Incorporated by reference to Exhibit 10.22 to the Current Report on Form 8-K of Kite Realty Group Trust filed with the SEC on August 20, 2004
|
||
|
10.16
|
Indemnification Agreement, dated as of August 16, 2004, by and between Kite Realty Group, L.P. and Richard A. Cosier*
|
Incorporated by reference to Exhibit 10.23 to the Current Report on Form 8-K of Kite Realty Group Trust filed with the SEC on August 20, 2004
|
||
|
10.17
|
Indemnification Agreement, dated as of August 16, 2004, by and between Kite Realty Group, L.P. and Gerald L. Moss*
|
Incorporated by reference to Exhibit 10.24 to the Current Report on Form 8-K of Kite Realty Group Trust filed with the SEC on August 20, 2004
|
||
|
10.18
|
Indemnification Agreement, dated as of November 3, 2008, by and between Kite Realty Group, L.P. and Darell E. Zink, Jr.*
|
Incorporated by reference to Exhibit 10.4 to the Quarterly Report on Form 10-Q of Kite Realty Group Trust for the period ended September 30, 2008
|
||
|
10.19
|
Contributor Indemnity Agreement, dated August 16, 2004, by and among Kite Realty Group, L.P., Alvin E. Kite, Jr., John A. Kite, Paul W. Kite, Thomas K. McGowan, Daniel R. Sink, George F. McMannis, IV, and Mark Jenkins*
|
Incorporated by reference to Exhibit 10.25 to the Current Report on Form 8-K of Kite Realty Group Trust filed with the SEC on August 20, 2004
|
||
|
10.20
|
Kite Realty Group Trust Equity Incentive Plan, as amended*
|
Incorporated by reference to the Kite Realty Group Trust definitive Proxy Statement, filed with the SEC on April 10, 2009
|
||
|
10.21
|
Kite Realty Group Trust Executive Bonus Plan*
|
Incorporated by reference to Exhibit 10.27 to the Current Report on Form 8-K of Kite Realty Group Trust filed with the SEC on August 20, 2004
|
||
|
10.22
|
Kite Realty Group Trust 2008 Employee Share Purchase Plan*
|
Incorporated by reference to Exhibit 10.1 to the Current Report on Form 8-K of Kite Realty Group Trust filed with the SEC on May 12, 2008
|
||
|
10.23
|
Registration Rights Agreement, dated as of August 16, 2004, by and among the Company, Alvin E. Kite, Jr., John A. Kite, Paul W. Kite, Thomas K. McGowan, Daniel R. Sink, George F. McMannis, Mark Jenkins, Ken Kite, David Grieve and KMI Holdings, LLC
|
Incorporated by reference to Exhibit 10.32 to the Current Report on Form 8-K of Kite Realty Group Trust filed with the SEC on August 20, 2004
|
|
10.24
|
Amendment No. 1 to Registration Rights Agreement, dated August 29, 2005, by and among the Company and the other parties listed on the signature page thereto
|
Incorporated by reference to Exhibit 10.2 to the Quarterly Report on Form 10-Q of Kite Realty Group Trust for the period ended September 30, 2005
|
||
|
10.25
|
Tax Protection Agreement, dated August 16, 2004, by and among the Company, Kite Realty Group, L.P., Alvin E. Kite, Jr., John A. Kite, Paul W. Kite, Thomas K. McGowan and C. Kenneth Kite
|
Incorporated by reference to Exhibit 10.33 to the Current Report on Form 8-K of Kite Realty Group Trust filed with the SEC on August 20, 2004
|
||
|
10.26
|
Form of Share Option Agreement under 2004 Equity Incentive Plan*
|
Incorporated by reference to Exhibit 10.39 to the Annual Report on Form 10-K of Kite Realty Group Trust for the period ended December 31, 2004
|
||
|
10.27
|
Form of Restricted Share Agreement under 2004 Equity Incentive Plan*
|
Incorporated by reference to Exhibit 10.40 of the Annual Report on Form 10-K of Kite Realty Group Trust for the period ended December 31, 2004
|
||
|
10.28
|
Schedule of Non-Employee Trustee Fees and Other Compensation*
|
Filed herewith
|
||
|
10.29
|
Kite Realty Group Trust Trustee Deferred Compensation Plan*
|
Incorporated by reference to Exhibit 10.1 to the Quarterly Report on Form 10-Q of Kite Realty Group Trust for the period ended June 30, 2006
|
||
|
10.30
|
Credit Agreement, dated as of February 20, 2007, by and among Kite Realty Group, L.P., the Company, KeyBank National Association, as Administrative Agent, Wachovia Bank, National Association as Syndication Agent, LaSalle Bank National Association and Bank of America, N.A. as Co-Documentation Agents and the other lenders party thereto
|
Incorporated by reference to Exhibit 10.1 to the Quarterly Report on Form 10-Q of Kite Realty Group Trust filed for the period ended September 30, 2010
|
||
|
10.31
|
Guaranty, dated as of February 20, 2007, by the Company and certain subsidiaries of Kite Realty Group, L.P. party thereto
|
Incorporated by reference to Exhibit 10.2 to the Current Report on Form 8-K of Kite Realty Group Trust filed with the SEC on February 23, 2007
|
||
|
10.32
|
Consulting Agreement, dated as of March 31, 2009, by and between the Company and Alvin E. Kite, Jr.
|
Incorporated by reference to Exhibit 10.1 to the Current Report on Form 8-K of Kite Realty Group Trust filed with the SEC on April 6, 2009
|
||
|
12.1
|
Statement of Computation of Ratio of Earnings to Combined Fixed Charges and Preferred Dividends.
|
Filed herewith
|
||
|
21.1
|
List of Subsidiaries
|
Filed herewith
|
||
|
23.1
|
Consent of Ernst & Young LLP
|
Filed herewith
|
||
|
31.1
|
Certification of principal executive officer required by Rule 13a-14(a)/15d-14(a) under the Exchange Act, as adopted pursuant to Section 302 of the Sarbanes-Oxley Act of 2002
|
Filed herewith
|
||
|
31.2
|
Certification of principal financial officer required by Rule 13a-14(a)/15d-14(a) under the Exchange Act, as adopted pursuant to Section 302 of the Sarbanes-Oxley Act of 2002
|
Filed herewith
|
||
|
32.1
|
Certification of Chief Executive Officer and Chief Financial Officer pursuant to 18 U.S.C. Section 1350, as adopted pursuant to Section 906 of the Sarbanes-Oxley Act of 2002
|
Filed herewith
|
|
____________________
|
|
* Denotes a management contract or compensatory, plan contract or arrangement.
|