Attached files
| file | filename |
|---|---|
| 8-K - FORM 8-K - BURLINGTON NORTHERN SANTA FE, LLC | d8k.htm |

Investor
Contact: Linda
Hurt
(817) 352-6452
Media
Contact: John
Ambler
(817)
867-6407
Burlington
Northern Santa Fe Reports
Fourth
Quarter/Full Year 2009 Results
|
·
|
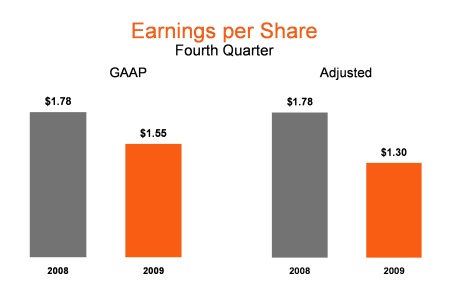
Quarterly
earnings were $1.55 per diluted share, which included a tax benefit of
$0.25 per share related to a fourth-quarter
donation.
|
|
·
|
Compared to
fourth-quarter 2008 earnings of $1.78 per diluted
share
|
|
·
|
Quarterly
freight revenues were $3.57 billion, which included a decrease in fuel
surcharges of $388 million.
|
|
·
|
Compared to
fourth-quarter 2008 freight revenues of $4.25
billion
|
|
·
|
Loads handled
decreased 12 percent
|
|
·
|
Quarterly
operating expenses were $2.79 billion, which included a decrease of $138
million related to lower fuel
prices.
|
|
·
|
Compared to
fourth-quarter 2008 operating expenses of $3.26
billion
|
|
·
|
Strong cost
controls
|
|
·
|
Decreased
unit volumes
|
|
·
|
Full-year
2009 earnings per diluted share were
$5.01.
|
|
·
|
Compared to
full-year 2008 earnings of $6.06 per diluted
share
|
FORT WORTH,
Texas, January 21, 2010 - Burlington
Northern Santa Fe Corporation (BNSF) (NYSE: BNI) today reported quarterly
earnings of $1.55 per diluted share, which included a tax benefit of $0.25 per
share related to the fourth-quarter donation of a portion of a line segment
located in Washington State. This compared to fourth-quarter 2008
earnings of $1.78 per diluted share, which included a fuel surcharge lag benefit
of about $200 million.
“We have seen some improvement in
volumes during the second half of 2009 and expect this gradual improvement to
continue,” said Matthew K. Rose, BNSF Chairman, President and Chief Executive
Officer. “BNSF will continue to position itself to meet demand
consistent with the pace of the economic recovery. And as we look
forward into 2010, we are preparing to become part of the Berkshire Hathaway
family, pending shareholder approval in February.”
1
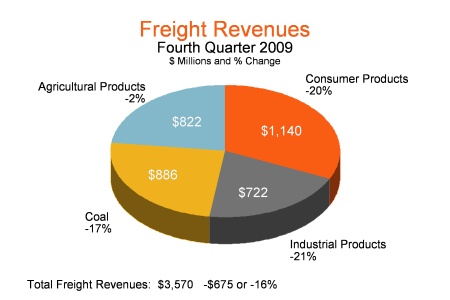
Fourth-quarter 2009 freight
revenues decreased $675 million, or 16 percent, to $3.57 billion compared with
$4.25 billion in the prior year. The 16-percent decrease in revenues included a
decrease in fuel surcharges of $388 million primarily driven by the unfavorable
change in the fuel surcharge lag effect. The remaining variance was due to unit
volumes, which were 12 percent lower as a result of the economic downturn,
partially offset by improved yields.
Coal revenues decreased $181
million, or 17 percent, to $886 million on lower unit volumes driven by soft
demand primarily due to economic conditions, low seasonal burn and
weather-related challenges, partially offset by approximately $30 million for
contract settlements and adjustments with specific customers. Agricultural
Products revenues of $822 million were down $16 million, or 2 percent. Improved
unit volumes, primarily driven by strong soybean exports, and improved yields
were more than offset by a decrease in fuel surcharges. Industrial Products
revenues fell $197 million, or 21 percent, to $722 million, which included a
decline in unit volumes driven primarily by lower demand for construction and
building products, partially offset by improved yields. Consumer Products
revenues declined $281 million, or 20 percent, to $1.14 billion, on lower
volumes due to economic conditions, partially offset by improved
yields. Lower fuel surcharges impacted revenues in each of the
business units.
Operating expenses for the
fourth quarter of 2009 were $2.79 billion, a 14-percent reduction compared with
fourth-quarter 2008 operating expenses of $3.26 billion. The $471 million
decrease in operating expenses was principally due to strong cost controls,
decreased unit volumes and lower fuel prices.
Full-year 2009 operating
revenues were $14.0 billion compared to $18.0 billion for 2008. The
decrease in operating revenues included lower fuel surcharges of $2.0
billion. Operating expenses for 2009 declined $3.4 billion, or 24
percent, over the prior year to $10.8 billion. Approximately half of
the $3.4 billion reduction was due to lower fuel prices. The
remaining decrease was due to strong cost controls and lower unit
volumes.
Subsequent
Event
On January 11, 2010, BNSF
transferred operations which completed the sale of a line segment in the State
of Washington, which will result in a gain of $74 million, or
$0.13 per diluted share in the first quarter of
2010.
2
Burlington Northern Santa
Fe Corporation’s subsidiary BNSF Railway Company operates one of the largest
North American rail networks, with about 32,000 route miles in 28 states and two
Canadian provinces. BNSF Railway Company is among the world's top transporters
of intermodal traffic, moves more grain than any other American railroad,
carries the components of many of the products we depend on daily, and hauls
enough low-sulfur coal to generate about ten percent of the electricity produced
in the United States. BNSF Railway Company is an industry leader in Web-enabling
a variety of customer transactions at www.bnsf.com.
BNSF will not be conducting
a fourth quarter earnings conference call.
Financial
information follows:
3
 |
Quarterly
earnings were $1.55 per diluted share, which included a tax benefit of
$0.25 per share related to a donation.
· Compared to
fourth-quarter 2008 earnings of $1.78 per
diluted share, which
included a fuel surcharge lag benefit of
about $200
million.
|
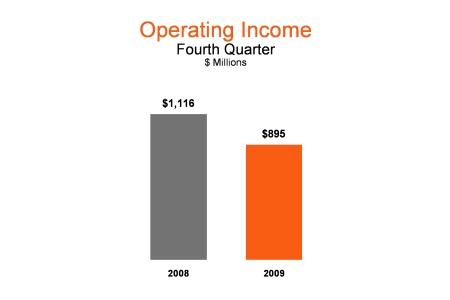 |
Fourth-quarter
operating income for 2009 was $895 million.
· Compared to
fourth-quarter 2008 operating income of $1.12 billion.
|
 |
Freight
revenues decreased $675 million, or 16 percent, to $3.57 billion compared
with the fourth quarter of 2008.
· Loads handled
decreased 12 percent.
· Fuel
surcharges declined by $388 million primarily driven
by the
unfavorable
change in the fuel surcharge lag effect.
|
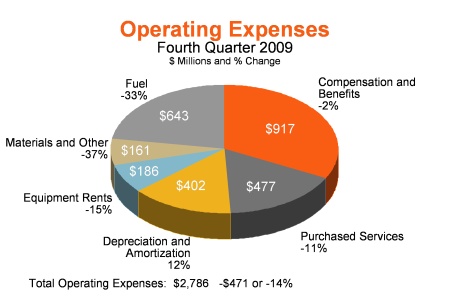 |
Operating
expenses of $2.79 billion were $471 million, or 14 percent, lower than
fourth quarter 2008.
· Strong cost
controls.
· Decreased
unit volumes.
· Lower fuel
prices decreased fuel expense by $138 million.
|
4
|
Burlington
Northern Santa Fe Corporation
|
|||||||||||||||||||||
|
Consolidated
Income Information *
|
|||||||||||||||||||||
|
(Dollars in
millions, except per share data)
|
|||||||||||||||||||||
| Three Months | |||||||||||||||||||||
| Ended December 31, | Year Ended December 31, | ||||||||||||||||||||
|
2009
|
2008 | 2009 | 2008 |
|
2007 |
|
|||||||||||||||
|
Operating
revenues
|
|||||||||||||||||||||
| Freight revenues | $ | 3,570 | $ | 4,245 | $ | 13,588 | (a) | $ | 17,503 | $ | 15,349 | ||||||||||
|
Other
revenues
|
111 | 128 | 428 | 515 | 453 | ||||||||||||||||
|
Total
operating revenues
|
3,681 | 4,373 | 14,016 | 18,018 | 15,802 | ||||||||||||||||
|
Operating
expenses
|
|||||||||||||||||||||
| Compensation and benefits | 917 | 937 | 3,481 | 3,884 | 3,773 | ||||||||||||||||
| Fuel | 643 | 955 | 2,372 | 4,640 | 3,327 | ||||||||||||||||
| Purchased services | 477 | 533 | 1,873 | 2,133 | 2,023 | ||||||||||||||||
| Depreciation and amortization | 402 | 358 | 1,537 | 1,397 | 1,293 | ||||||||||||||||
| Equipment rents | 186 | 219 | 777 | 901 | 942 | ||||||||||||||||
| Materials and other | 161 | 255 | 714 | 1,151 | (b) | 958 | (c) |
|
|||||||||||||
|
Total
operating expenses
|
2,786 | 3,257 | 10,754 | 14,106 | 12,316 | ||||||||||||||||
|
Operating
income
|
895 | 1,116 | 3,262 | 3,912 | 3,486 | ||||||||||||||||
|
Interest
expense
|
151 | 137 | 613 | (d) | 533 | 511 | |||||||||||||||
|
Other expense,
net
|
3 | - | 8 | 11 | 18 | ||||||||||||||||
|
Income before
income taxes
|
741 | 979 | 2,641 | 3,368 | 2,957 | ||||||||||||||||
|
Income tax
expense (e)
|
205 | 364 | 920 | 1,253 | 1,128 | ||||||||||||||||
|
Net
income
|
$ | 536 | $ | 615 | $ | 1,721 | $ | 2,115 | $ | 1,829 | |||||||||||
|
Diluted
earnings per share
|
$ | 1.55 | $ | 1.78 | $ | 5.01 | $ | 6.06 | $ | 5.06 | |||||||||||
|
Operating
ratio (f)
|
74.9 | % | 73.7 | % | 76.0 | % | 77.6 | % | 77.3 | % | |||||||||||
|
*
|
Certain
comparative prior period amounts have been adjusted to conform to the
current period presentation.
|
|
(a)
|
2009
includes a $66 million charge related to an unfavorable coal rate case
decision.
|
|
(b)
|
Second
quarter 2008 includes a $175 million increase in expense related to
environmental matters in Montana.
|
|
(c)
|
2007
includes a first-quarter charge of $81 million for additional
environmental expenses and a technology system
write-off.
|
|
(d)
|
2009
includes a net $32 million loss on interest rate hedges and $8 million
related to an unfavorable coal rate case decision.
|
|
(e)
|
Fourth
quarter 2009 includes a $0.25 per diluted share tax benefit related to a
donation.
|
|
(f)
|
Calculated
as total operating expenses less other revenues divided by freight
revenues.
|
5
|
Burlington Northern
Santa Fe Corporation
|
||||||||||||||||||||
|
Consolidated
Income Information 2009 *
|
||||||||||||||||||||
|
(Dollars in
millions, except per share data)
|
||||||||||||||||||||
|
2009
|
||||||||||||||||||||
|
1st
|
2nd
|
3rd
|
4th
|
Full
|
||||||||||||||||
|
Quarter
|
Quarter
|
Quarter
|
Quarter
|
Year
|
||||||||||||||||
|
Operating
revenues
|
||||||||||||||||||||
| Freight revenues (a) | $ | 3,312 | $ | 3,217 | $ | 3,489 | $ | 3,570 | $ | 13,588 | ||||||||||
|
Other
revenues
|
112 | 99 | 106 | 111 | 428 | |||||||||||||||
|
Total
operating revenues
|
3,424 | 3,316 | 3,595 | 3,681 | 14,016 | |||||||||||||||
|
Operating
expenses
|
||||||||||||||||||||
| Compensation and benefits | 868 | 824 | 872 | 917 | 3,481 | |||||||||||||||
| Fuel | 614 | 509 | 606 | 643 | 2,372 | |||||||||||||||
| Purchased services | 477 | 466 | 453 | 477 | 1,873 | |||||||||||||||
| Depreciation and amortization | 370 | 379 | 386 | 402 | 1,537 | |||||||||||||||
| Equipment rents | 201 | 196 | 194 | 186 | 777 | |||||||||||||||
| Materials and other | 225 | 145 | 183 | 161 | 714 | |||||||||||||||
|
Total
operating expenses
|
2,755 | 2,519 | 2,694 | 2,786 | 10,754 | |||||||||||||||
|
Operating
income
|
669 | 797 | 901 | 895 | 3,262 | |||||||||||||||
|
Interest
expense (b)
|
198 | 137 | 127 | 151 | 613 | |||||||||||||||
|
Other expense,
net
|
3 | 1 | 1 | 3 | 8 | |||||||||||||||
|
Income before
income taxes
|
468 | 659 | 773 | 741 | 2,641 | |||||||||||||||
|
Income tax
expense (c)
|
175 | 255 | 285 | 205 | 920 | |||||||||||||||
|
Net
income
|
$ | 293 | $ | 404 | $ | 488 | $ | 536 | $ | 1,721 | ||||||||||
|
Diluted
earnings per share
|
$ | 0.86 | $ | 1.18 | $ | 1.42 | $ | 1.55 | $ | 5.01 | ||||||||||
|
Operating
ratio (d)
|
79.8 | % | 75.2 | % | 74.2 | % | 74.9 | % | 76.0 | % | ||||||||||
|
*
|
Certain
interim period amounts have been reclassified to conform to the current
period presentation.
|
|
(a)
|
First
quarter includes a $96 million charge related to an unfavorable coal rate
case decision. Third quarter includes a $30 million favorable
adjustment to the charge taken in the first quarter related to the
unfavorable coal rate case decision.
|
|
(b)
|
First
quarter includes a $42 million loss on interest rate hedges and $9 million
related to an unfavorable coal rate case decision. Second
quarter includes a $10 million gain on interest rate hedges and third
quarter includes a $1 million favorable adjustment related to the charge
taken in the first quarter related to the unfavorable coal rate case
decision.
|
|
(c)
|
Fourth
quarter 2009 includes a $0.25 per diluted share tax benefit related to a
donation.
|
|
(d)
|
Calculated
as total operating expenses less other revenues divided by freight
revenues.
|
6
|
Burlington Northern
Santa Fe Corporation
|
||||||||||||||||||||
|
Consolidated
Income Information 2008 *
|
||||||||||||||||||||
|
(Dollars in
millions, except per share data)
|
||||||||||||||||||||
|
2008
|
||||||||||||||||||||
|
1st
|
2nd
|
3rd
|
4th
|
Full
|
||||||||||||||||
|
Quarter
|
Quarter
|
Quarter
|
Quarter
|
Year
|
||||||||||||||||
|
Operating
revenues
|
||||||||||||||||||||
| Freight revenues | $ | 4,143 | $ | 4,349 | $ | 4,766 | $ | 4,245 | $ | 17,503 | ||||||||||
|
Other
revenues
|
118 | 129 | 140 | 128 | 515 | |||||||||||||||
|
Total
operating revenues
|
4,261 | 4,478 | 4,906 | 4,373 | 18,018 | |||||||||||||||
|
Operating
expenses
|
||||||||||||||||||||
| Compensation and benefits | 983 | 951 | 1,013 | 937 | 3,884 | |||||||||||||||
| Fuel | 1,045 | 1,291 | 1,349 | 955 | 4,640 | |||||||||||||||
| Purchased services | 524 | 539 | 537 | 533 | 2,133 | |||||||||||||||
| Depreciation and amortization | 341 | 349 | 349 | 358 | 1,397 | |||||||||||||||
| Equipment rents | 230 | 223 | 229 | 219 | 901 | |||||||||||||||
| Materials and other (a) | 263 | 411 | 222 | 255 | 1,151 | |||||||||||||||
|
Total
operating expenses
|
3,386 | 3,764 | 3,699 | 3,257 | 14,106 | |||||||||||||||
|
Operating
income
|
875 | 714 | 1,207 | 1,116 | 3,912 | |||||||||||||||
|
Interest
expense
|
134 | 140 | 122 | 137 | 533 | |||||||||||||||
|
Other expense,
net
|
− | 5 | 6 | − | 11 | |||||||||||||||
|
Income before
income taxes
|
741 | 569 | 1,079 | 979 | 3,368 | |||||||||||||||
|
Income tax
expense
|
286 | 219 | 384 | 364 | 1,253 | |||||||||||||||
|
Net
income
|
$ | 455 | $ | 350 | $ | 695 | $ | 615 | $ | 2,115 | ||||||||||
|
Diluted
earnings per share
|
$ | 1.29 | $ | 1.00 | $ | 1.99 | $ | 1.78 | $ | 6.06 | ||||||||||
|
Operating
ratio (b)
|
78.9 | % | 83.6 | % | 74.7 | % | 73.7 | % | 77.6 | % | ||||||||||
|
*
|
Certain
comparative prior period amounts have been adjusted to conform to the
current period presentation.
|
|
(a)
|
Second
quarter includes a $175 million increase in expense related to
environmental matters in Montana.
|
|
(b)
|
Calculated
as total operating expenses less other revenues divided by freight
revenues.
|
7
|
Burlington
Northern Santa Fe Corporation
|
||||||||
|
Consolidated
Balance Sheet Information *
|
||||||||
|
(Dollars in
millions, except per share amounts)
|
||||||||
| December 31, |
|
|||||||
|
2009
|
2008
|
|
||||||
|
Assets
|
||||||||
| Current assets: | ||||||||
| Cash and cash equivalents | $ | 1,269 | $ | 633 | ||||
| Accounts receivable, net | 787 | 847 | ||||||
| Materials and supplies | 633 | 525 | ||||||
| Current portion of deferred income taxes | 290 | 442 | ||||||
| Other current assets | 277 | 218 | ||||||
| Total current assets | 3,256 | 2,665 | ||||||
|
Property and
equipment, net
|
32,294 | 30,847 | ||||||
|
Other
assets
|
3,125 | 2,891 | ||||||
|
Total
assets
|
$ | 38,675 | $ | 36,403 | ||||
|
Liabilities
and stockholders' equity
|
||||||||
| Current liabilities: | ||||||||
| Accounts payable and other current liabilities | $ | 2,695 | $ | 3,190 | ||||
| Long-term debt due within one year | 644 | 456 | ||||||
|
Total current
liabilities
|
3,339 | 3,646 | ||||||
|
Long-term
debt
|
9,691 | 9,099 | ||||||
|
Deferred
income taxes
|
9,322 | 8,590 | ||||||
|
Casualty and
environmental liabilities
|
899 | 959 | ||||||
|
Pension and
retiree health and welfare liability
|
783 | 1,047 | ||||||
|
Other
liabilities
|
1,843 | 1,931 | ||||||
|
Total
liabilities
|
25,877 | 25,272 | ||||||
|
Stockholders'
equity:
|
||||||||
| Common stock and additional paid-in capital | 7,781 | 7,636 | ||||||
| Retained earnings | 13,941 | 12,764 | ||||||
| Treasury stock and other | (8,924 | ) | (9,269 | ) | ||||
|
Total
stockholders' equity
|
12,798 | 11,131 | ||||||
|
Total
liabilities and stockholders' equity
|
$ | 38,675 | $ | 36,403 | ||||
|
Book value per
share
|
$ | 37.56 | $ | 32.82 | ||||
|
Common shares
outstanding (in millions)
|
340.7 | 339.2 | ||||||
|
*
|
Certain
comparative prior period amounts have been adjusted to conform to the
current period presentation.
|
8
|
Burlington Northern
Santa Fe Corporation
|
||||||||||||||||||||
|
Consolidated
Cash Flow Information *
|
||||||||||||||||||||
|
(in
millions)
|
||||||||||||||||||||
| Three Months | ||||||||||||||||||||
| Ended December 31, | Year Ended December 31, | |||||||||||||||||||
|
2009
|
2008
|
2009
|
2008
|
2007
|
||||||||||||||||
|
Operating
activities
|
|
|||||||||||||||||||
|
Net
income
|
$ | 536 | $ | 615 | $ | 1,721 | $ | 2,115 | $ | 1,829 | ||||||||||
|
Adjustments to
reconcile net income to net cash
provided by
operating activities:
|
||||||||||||||||||||
|
Depreciation
and amortization
|
402 | 358 | 1,537 | 1,397 | 1,293 | |||||||||||||||
|
Deferred
income taxes
|
154 | 169 | 612 | 417 | 280 | |||||||||||||||
|
Long-term
casualty and environmental
liabilities,
net
|
(59 | ) | (31 | ) | (90 | ) | 150 | 26 | ||||||||||||
|
Other,
net
|
(226 | ) | 27 | (210 | ) | 66 | 162 | |||||||||||||
|
Changes in
accounts receivable sales program
|
− | (528 | ) | (50 | ) | (250 | ) | − | ||||||||||||
|
Other changes
in working capital
|
(32 | ) | 64 | (107 | ) | 82 | (98 | ) | ||||||||||||
|
Net cash
provided by operating activities
|
775 | 674 | 3,413 | 3,977 | 3,492 | |||||||||||||||
|
Investing
activities
|
||||||||||||||||||||
|
Capital
expenditures excluding equipment
|
(322 | ) | (463 | ) | (1,991 | ) | (2,167 | ) | (2,248 | ) | ||||||||||
|
Acquisition of
equipment
|
(118 | ) | (273 | ) | (733 | ) | (949 | ) | (745 | ) | ||||||||||
|
Proceeds from
sale of equipment financed
|
− | 158 | 368 | 348 | 778 | |||||||||||||||
|
Construction
costs for facility financing obligation
|
(1 | ) | (26 | ) | (37 | ) | (64 | ) | (37 | ) | ||||||||||
|
Other,
net
|
(77 | ) | (88 | ) | (244 | ) | (241 | ) | (163 | ) | ||||||||||
|
Net cash used
for investing activities
|
(518 | ) | (692 | ) | (2,637 | ) | (3,073 | ) | (2,415 | ) | ||||||||||
|
Financing
activities
|
||||||||||||||||||||
|
Net (payments)
borrowings
|
(56 | ) | 557 | 296 | 772 | 234 | ||||||||||||||
|
Dividends
paid
|
(137 | ) | (137 | ) | (546 | ) | (471 | ) | (380 | ) | ||||||||||
|
Purchase of
BNSF common stock
|
(1 | ) | (269 | ) | (16 | ) | (1,147 | ) | (1,265 | ) | ||||||||||
|
Proceeds from
stock options exercised
|
33 | 4 | 59 | 91 | 142 | |||||||||||||||
|
Proceeds from
facility financing obligation
|
− | 18 | 51 | 68 | 41 | |||||||||||||||
|
Other,
net
|
12 | 2 | 16 | 86 | 106 | |||||||||||||||
|
Net cash (used
for) provided by financing activities
|
(149 | ) | 175 | (140 | ) | (601 | ) | (1,122 | ) | |||||||||||
|
Increase
(decrease) in cash and cash equivalents
|
108 | 157 | 636 | 303 | (45 | ) | ||||||||||||||
|
Cash and cash
equivalents:
|
||||||||||||||||||||
|
Beginning of
period
|
1,161 | 476 | 633 | 330 | 375 | |||||||||||||||
|
End of
period
|
$ | 1,269 | $ | 633 | $ | 1,269 | $ | 633 | $ | 330 | ||||||||||
|
*
|
Certain
comparative prior period amounts have been adjusted to conform to the
current period presentation.
|
9
|
Burlington Northern Santa Fe
Corporation
|
||||||||||||||||||||
|
Consolidated
Cash Flow Information
|
||||||||||||||||||||
|
(in
millions)
|
||||||||||||||||||||
|
2009
|
||||||||||||||||||||
|
1st
|
2nd
|
3rd
|
4th
|
Full
|
||||||||||||||||
|
Quarter
|
Quarter
|
Quarter
|
Quarter
|
Year
|
||||||||||||||||
|
Operating
activities
|
||||||||||||||||||||
|
Net
income
|
$ | 293 | $ | 404 | $ | 488 | $ | 536 | $ | 1,721 | ||||||||||
|
Adjustments to
reconcile net income to net cash
provided by
operating activities:
|
||||||||||||||||||||
|
Depreciation
and amortization
|
370 | 379 | 386 | 402 | 1,537 | |||||||||||||||
|
Deferred
income taxes
|
90 | 168 | 200 | 154 | 612 | |||||||||||||||
|
Long-term
casualty and environmental
liabilities,
net
|
(1 | ) | (29 | ) | (1 | ) | (59 | ) | (90 | ) | ||||||||||
|
Other,
net
|
49 | (34 | ) | 1 | (226 | ) | (210 | ) | ||||||||||||
|
Changes in
accounts receivable sales program
|
(50 | ) | − | − | − | (50 | ) | |||||||||||||
|
Other changes
in working capital
|
(17 | ) | (100 | ) | 42 | (32 | ) | (107 | ) | |||||||||||
|
Net cash
provided by operating activities
|
734 | 788 | 1,116 | 775 | 3,413 | |||||||||||||||
|
|
||||||||||||||||||||
|
Investing
activities
|
||||||||||||||||||||
|
Capital
expenditures excluding equipment
|
(462 | ) | (620 | ) | (587 | ) | (322 | ) | (1,991 | ) | ||||||||||
|
Acquisition of
equipment
|
(286 | ) | (170 | ) | (159 | ) | (118 | ) | (733 | ) | ||||||||||
|
Proceeds from
sale of equipment financed
|
368 | − | − | − | 368 | |||||||||||||||
|
Construction
costs for facility financing obligation
|
(13 | ) | (18 | ) | (5 | ) | (1 | ) | (37 | ) | ||||||||||
|
Other,
net
|
2 | (98 | ) | (71 | ) | (77 | ) | (244 | ) | |||||||||||
|
Net cash used
for investing activities
|
(391 | ) | (906 | ) | (822 | ) | (518 | ) | (2,637 | ) | ||||||||||
|
Financing
activities
|
||||||||||||||||||||
| Net (payments) borrowings | (251 | ) | 96 | 507 | (56 | ) | 296 | |||||||||||||
|
Dividends
paid
|
(136 | ) | (137 | ) | (136 | ) | (137 | ) | (546 | ) | ||||||||||
|
Purchase of
BNSF common stock
|
(4 | ) | (8 | ) | (3 | ) | (1 | ) | (16 | ) | ||||||||||
|
Proceeds from
stock options exercised
|
8 | 4 | 14 | 33 | 59 | |||||||||||||||
|
Proceeds from
facility financing obligation
|
15 | 36 | − | − | 51 | |||||||||||||||
|
Other,
net
|
2 | 1 | 1 | 12 | 16 | |||||||||||||||
|
Net cash (used
for) provided by financing activities
|
(366 | ) | (8 | ) | 383 | (149 | ) | (140 | ) | |||||||||||
|
(Decrease)
increase in cash and cash equivalents
|
(23 | ) | (126 | ) | 677 | 108 | 636 | |||||||||||||
|
Cash and cash
equivalents:
|
||||||||||||||||||||
|
Beginning of
period
|
633 | 610 | 484 | 1,161 | 633 | |||||||||||||||
|
End of
period
|
$ | 610 | $ | 484 | $ | 1,161 | $ | 1,269 | $ | 1,269 | ||||||||||
10
|
Burlington
Northern Santa Fe Corporation
|
|||||||||||||||||||||||
|
Operating
Statistics *
|
|||||||||||||||||||||||
| Three Months | |||||||||||||||||||||||
| Ended December 31, | Year Ended December 31, | ||||||||||||||||||||||
|
2009
|
2008
|
2009 |
|
2008 |
|
2007 |
|
||||||||||||||||
|
Revenue
Statistics
|
|||||||||||||||||||||||
|
Cars
/ units (in thousands)
|
2,112 | 2,409 | 8,418 | 9,994 | 10,318 | ||||||||||||||||||
|
Average revenue per car / unit
|
$ | 1,690 | $ | 1,762 | $ | 1,622 | (a) |
|
$ | 1,751 | $ | 1,488 | |||||||||||
|
Average length of haul (miles)
|
1,128 | 1,097 | 1,108 | 1,090 | 1,079 | ||||||||||||||||||
|
Revenue ton miles (in millions)
|
150,047 | 161,941 | 593,573 | 664,384 | 657,572 | ||||||||||||||||||
|
Freight revenue / thousand GTM
|
$ | 14.31 | $ | 15.65 | $ | 13.87 | (a) |
|
$ | 15.63 | $ | 13.69 | |||||||||||
|
Freight revenue / thousand RTM
|
$ | 23.79 | $ | 26.21 | $ | 23.00 | (a) |
|
$ | 26.34 | $ | 23.34 | |||||||||||
|
Operating
/ Productivity Statistics
|
|||||||||||||||||||||||
|
Operating Expense
|
|||||||||||||||||||||||
|
Gross ton miles (in millions)
|
249,476 | 271,252 | 984,120 | 1,119,616 | 1,121,255 | ||||||||||||||||||
|
Operating expense / thousand GTM
|
$ | 11.17 | $ | 12.01 | $ | 10.93 | $ | 12.60 | (b) |
|
$ | 10.98 | (c) |
|
|||||||||
|
Thousand GTM / average employee
|
6,948 | 6,660 | 26,339 | 27,360 | 27,058 | ||||||||||||||||||
|
Compensation
|
|||||||||||||||||||||||
|
Average
employees
|
35,908 | 40,729 | 37,363 | 40,922 | 41,439 | ||||||||||||||||||
|
Compensation and benefits / average employee
|
$ | 25,542 | $ | 23,025 | $ | 93,153 | $ | 94,923 | $ | 91,054 | |||||||||||||
|
Compensation and benefits / thousand
GTM
|
$ | 3.68 | $ | 3.45 | $ | 3.54 | $ | 3.47 | $ | 3.36 | |||||||||||||
|
Fuel
(d)
|
|||||||||||||||||||||||
|
GTM / gallon of fuel
|
837 | 782 | 821 | 791 | 778 | ||||||||||||||||||
|
Gallons of fuel used (in millions)
|
298 | 347 | 1,198 | 1,415 | 1,442 | ||||||||||||||||||
|
Average price per gallon of fuel (e)
|
$ | 2.07 | $ | 2.63 | $ | 1.89 | $ | 3.16 | $ | 2.22 | |||||||||||||
|
Velocity
|
|||||||||||||||||||||||
|
Locomotive miles per day
|
311.1 | 292.6 | 307.9 | 296.6 | 299.5 | ||||||||||||||||||
|
Car miles per day
|
231.3 | 219.7 | 230.0 | 207.1 | 198.2 | ||||||||||||||||||
|
*
|
Certain
comparative prior period amounts have been adjusted to conform to the
current period presentation.
|
||||||||||||||||||||||
|
(a)
|
Coal
revenues on a GAAP basis were $3,564 million for the year ended December
31, 2009. However, for comparative purposes the table above excludes (from
coal revenues and from the computation of amounts derived therefrom) a $66
million unfavorable impact related to a coal rate case decision for the
year ended December 31, 2009.
|
||||||||||||||||||||||
|
(b)
|
Second
quarter 2008 includes a $175 million increase in expense related to
environmental matters in Montana.
|
||||||||||||||||||||||
|
(c)
|
2007
includes a first-quarter charge of $81 million for additional
environmental expenses and a technology system write-off.
|
||||||||||||||||||||||
|
(d)
|
Fuel
statistics are based on locomotive diesel fuel.
|
||||||||||||||||||||||
|
(e)
|
Includes
handling, taxes and hedge effect.
|
||||||||||||||||||||||
11
|
Burlington Northern
Santa Fe Corporation
|
||||||||||||||||||||
|
Operating
Statistics
|
||||||||||||||||||||
| 2009 |
|
|||||||||||||||||||
|
1st
|
2nd
|
3rd
|
4th
|
Full |
|
|||||||||||||||
|
Quarter
|
Quarter
|
Quarter
|
Quarter
|
Year |
|
|||||||||||||||
|
Revenue
Statistics
|
|
|||||||||||||||||||
|
Cars
/ units (in thousands)
|
2,128 | 2,041 | 2,137 | 2,112 | 8,418 | |||||||||||||||
|
Average
revenue per car / unit (a)
|
$ | 1,602 | $ | 1,576 | $ | 1,619 | $ | 1,690 | $ | 1,622 | ||||||||||
|
Average
length of haul (miles)
|
1,099 | 1,110 | 1,096 | 1,128 | 1,108 | |||||||||||||||
|
Revenue
ton miles (in millions)
|
149,148 | 143,703 | 150,675 | 150,047 | 593,573 | |||||||||||||||
|
Freight
revenue / thousand GTM (a)
|
$ | 13.80 | $ | 13.50 | $ | 13.88 | $ | 14.31 | $ | 13.87 | ||||||||||
|
Freight
revenue / thousand RTM (a)
|
$ | 22.85 | $ | 22.39 | $ | 22.96 | $ | 23.79 | $ | 23.00 | ||||||||||
|
Operating
/ Productivity Statistics
|
||||||||||||||||||||
|
Operating
Expense
|
||||||||||||||||||||
|
Gross
ton miles (in millions)
|
247,008 | 238,376 | 249,260 | 249,476 | 984,120 | |||||||||||||||
|
Operating
expense / thousand GTM
|
$ | 11.15 | $ | 10.57 | $ | 10.81 | $ | 11.17 | $ | 10.93 | ||||||||||
|
Thousand
GTM / average employee
|
6,421 | 6,320 | 6,672 | 6,948 | 26,339 | |||||||||||||||
|
Compensation
|
||||||||||||||||||||
|
Average
employees
|
38,468 | 37,715 | 37,359 | 35,908 | 37,363 | |||||||||||||||
|
Compensation
and benefits / average employee
|
$ | 22,561 | $ | 21,848 | $ | 23,326 | $ | 25,542 | $ | 93,153 | ||||||||||
|
Compensation
and benefits / thousand
GTM
|
$ | 3.51 | $ | 3.46 | $ | 3.49 | $ | 3.68 | $ | 3.54 | ||||||||||
|
Fuel (b)
|
||||||||||||||||||||
|
GTM
/ gallon of fuel
|
777 | 816 | 860 | 837 | 821 | |||||||||||||||
|
Gallons
of fuel used (in millions)
|
318 | 292 | 290 | 298 | 1,198 | |||||||||||||||
|
Average
price per gallon of fuel (c)
|
$ | 1.85 | $ | 1.65 | $ | 1.99 | $ | 2.07 | $ | 1.89 | ||||||||||
|
Velocity
|
||||||||||||||||||||
|
Locomotive
miles per day
|
298.6 | 310.9 | 312.1 | 311.1 | 307.9 | |||||||||||||||
|
Car
miles per day
|
224.0 | 236.1 | 229.2 | 231.3 | 230.0 | |||||||||||||||
|
(a)
|
Coal
revenues on a GAAP basis were $863 million and $940 million for the three
month periods ended March 31, 2009 and September 30, 2009, respectively.
However, for comparative purposes the table above excludes (from coal
revenues and from the computation of amounts derived therefrom) a $96
million unfavorable and $30 million favorable impact related to a coal
rate case decision for the three month periods ended March 31, 2009 and
September 30, 2009, respectively.
|
||||||||||||||||||||||||||||||||||||||||||||||||||||||||||
|
(b)
|
Fuel
statistics are based on locomotive diesel fuel.
|
||||||||||||||||||||||||||||||||||||||||||||||||||||||||||
|
(c)
|
Includes
handling, taxes and hedge effect.
|
||||||||||||||||||||||||||||||||||||||||||||||||||||||||||
12
|
Burlington
Northern Santa Fe Corporation
|
|||||||||||||||||||||||
|
Revenue
Statistics by Commodity
|
|||||||||||||||||||||||
| Three Months | 08-09 | ||||||||||||||||||||||
| Ended December 31, |
Percent
|
Year Ended December 31, | Percent | ||||||||||||||||||||
|
Revenues (in
millions)
|
2009
|
2008
|
Change
|
2009
|
2008
|
2007
|
Change
|
|
|||||||||||||||
|
Domestic
Intermodal
|
$ | 557 | $ | 681 | (18.2 | ) % | $ | 2,110 | $ | 2,830 | $ | 2,541 | (25.4 | ) % |
|
||||||||
|
International
Intermodal
|
486 | 626 | (22.4 | ) | 1,869 | 2,721 | 2,627 | (31.3 | ) | ||||||||||||||
|
Automotive
|
97 | 114 | (14.9 | ) | 337 | 513 | 496 | (34.3 | ) | ||||||||||||||
|
Total Consumer
Products
|
1,140 | 1,421 | (19.8 | ) | 4,316 | 6,064 | 5,664 | (28.8 | ) | ||||||||||||||
|
Coal
(a)
|
886 | 1,067 | (17.0 | ) | 3,630 | 3,970 | 3,279 | (8.6 | ) | ||||||||||||||
|
Industrial
Products
|
722 | 919 | (21.4 | ) | 2,874 | 4,028 | 3,684 | (28.6 | ) | ||||||||||||||
|
Agricultural
Products
|
822 | 838 | (1.9 | ) | 2,834 | 3,441 | 2,722 | (17.6 | ) | ||||||||||||||
|
Total freight
revenue
|
3,570 | 4,245 | (15.9 | ) | 13,654 | 17,503 | 15,349 | (22.0 | ) | ||||||||||||||
|
Other
revenue
|
111 | 128 | (13.3 | ) | 428 | 515 | 453 | (16.9 | ) | ||||||||||||||
|
Total
revenues
|
$ | 3,681 | $ | 4,373 | (15.8 | ) % | $ | 14,082 | $ | 18,018 | $ | 15,802 | (21.8 | ) % |
|
||||||||
|
Cars/units (in
thousands)
|
|||||||||||||||||||||||
|
Domestic
Intermodal
|
478 | 534 | (10.5 | ) % | 1,859 | 2,132 | 2,097 | (12.8 | ) % |
|
|||||||||||||
|
International
Intermodal
|
493 | 599 | (17.7 | ) | 1,954 | 2,542 | 2,886 | (23.1 | ) | ||||||||||||||
|
Automotive
|
28 | 30 | (6.7 | ) | 98 | 144 | 166 | (31.9 | ) | ||||||||||||||
|
Total Consumer
Products
|
999 | 1,163 | (14.1 | ) | 3,911 | 4,818 | 5,149 | (18.8 | ) | ||||||||||||||
|
Coal
|
570 | 648 | (12.0 | ) | 2,390 | 2,516 | 2,472 | (5.0 | ) | ||||||||||||||
|
Industrial
Products
|
284 | 353 | (19.5 | ) | 1,172 | 1,598 | 1,664 | (26.7 | ) | ||||||||||||||
|
Agricultural
Products
|
259 | 245 | 5.7 | 945 | 1,062 | 1,033 | (11.0 | ) | |||||||||||||||
|
Total
cars/units
|
2,112 | 2,409 | (12.3 | ) % | 8,418 | 9,994 | 10,318 | (15.8 | ) % |
|
|||||||||||||
|
Average
revenue per car/unit
|
|||||||||||||||||||||||
|
Domestic
Intermodal
|
$ | 1,165 | $ | 1,275 | (8.6 | ) % | $ | 1,135 | $ | 1,327 | $ | 1,212 | (14.5 | ) % |
|
||||||||
|
International
Intermodal
|
986 | 1,045 | (5.6 | ) | 956 | 1,070 | 910 | (10.7 | ) | ||||||||||||||
|
Automotive
|
3,464 | 3,800 | (8.8 | ) | 3,439 | 3,563 | 2,988 | (3.5 | ) | ||||||||||||||
|
Total Consumer
Products
|
1,141 | 1,222 | (6.6 | ) | 1,104 | 1,259 | 1,100 | (12.3 | ) | ||||||||||||||
|
Coal
(a)
|
1,554 | 1,647 | (5.6 | ) | 1,519 | 1,578 | 1,326 | (3.7 | ) | ||||||||||||||
|
Industrial
Products
|
2,542 | 2,603 | (2.3 | ) | 2,452 | 2,521 | 2,214 | (2.7 | ) | ||||||||||||||
|
Agricultural
Products
|
3,174 | 3,420 | (7.2 | ) | 2,999 | 3,240 | 2,635 | (7.4 | ) | ||||||||||||||
|
Average
revenue per car/unit
|
$ | 1,690 | $ | 1,762 | (4.1 | ) % | $ | 1,622 | $ | 1,751 | $ | 1,488 | (7.4 | ) % |
|
||||||||
|
Revenue
ton miles (in millions)
|
|||||||||||||||||||||||
|
Domestic
Intermodal
|
12,374 | 13,604 | (9.0 | ) % | 48,520 | 54,555 | 52,492 | (11.1 | ) % |
|
|||||||||||||
|
International
Intermodal
|
15,665 | 16,748 | (6.5 | ) | 60,489 | 74,942 | 82,526 | (19.3 | ) | ||||||||||||||
|
Automotive
|
1,040 | 1,068 | (2.6 | ) | 3,733 | 5,304 | 6,123 | (29.6 | ) | ||||||||||||||
|
Total Consumer
Products
|
29,079 | 31,420 | (7.5 | ) | 112,742 | 134,801 | 141,141 | (16.4 | ) | ||||||||||||||
|
Coal
|
66,314 | 75,943 | (12.7 | ) | 280,287 | 291,513 | 280,365 | (3.9 | ) | ||||||||||||||
|
Industrial
Products
|
21,893 | 25,069 | (12.7 | ) | 87,206 | 113,125 | 117,338 | (22.9 | ) | ||||||||||||||
|
Agricultural
Products
|
32,761 | 29,509 | 11.0 | 113,338 | 124,945 | 118,728 | (9.3 | ) | |||||||||||||||
|
Total
revenue ton miles
|
150,047 | 161,941 | (7.3 | ) % | 593,573 | 664,384 | 657,572 | (10.7 | ) % |
|
|||||||||||||
|
Freight
revenue per thousand ton miles
|
|||||||||||||||||||||||
|
Domestic
Intermodal
|
$ | 45.01 | $ | 50.06 | (10.1 | ) % | $ | 43.49 | $ | 51.87 | $ | 48.41 | (16.2 | ) % |
|
||||||||
|
International
Intermodal
|
31.02 | 37.38 | (17.0 | ) | 30.90 | 36.31 | 31.83 | (14.9 | ) | ||||||||||||||
|
Automotive
|
93.27 | 106.74 | (12.6 | ) | 90.28 | 96.72 | 81.01 | (6.7 | ) | ||||||||||||||
|
Total Consumer
Products
|
39.20 | 45.23 | (13.3 | ) | 38.28 | 44.98 | 40.13 | (14.9 | ) | ||||||||||||||
|
Coal
(a)
|
13.36 | 14.05 | (4.9 | ) | 12.95 | 13.62 | 11.70 | (4.9 | ) | ||||||||||||||
|
Industrial
Products
|
32.98 | 36.66 | (10.0 | ) | 32.96 | 35.61 | 31.40 | (7.4 | ) | ||||||||||||||
|
Agricultural
Products
|
25.09 | 28.40 | (11.7 | ) | 25.00 | 27.54 | 22.93 | (9.2 | ) | ||||||||||||||
|
Freight
revenue per thousand ton miles
|
$ | 23.79 | $ | 26.21 | (9.2 | ) % | $ | 23.00 | $ | 26.34 | $ | 23.34 | (12.7 | ) % |
|
||||||||
|
|
|
(a)
Coal revenues on a GAAP basis were $3,564 million for the year
ended December 31, 2009. For comparative purposes, the table above
excludes the impact related to the coal rate decision (see note (a) on
page
11).
|
13
|
Burlington
Northern Santa Fe Corporation
|
||||||||||||||||||||
| Revenue Statistics by Commodity | ||||||||||||||||||||
|
|
2009
|
|||||||||||||||||||
|
1st
|
2nd
|
3rd
|
4th
|
Full
|
||||||||||||||||
|
Revenues (in
millions)
|
Quarter
|
Quarter
|
Quarter
|
Quarter
|
Year
|
|||||||||||||||
|
Domestic
Intermodal
|
$ | 515 | $ | 512 | $ | 526 | $ | 557 | $ | 2,110 | ||||||||||
|
International
Intermodal
|
462 | 444 | 477 | 486 | 1,869 | |||||||||||||||
|
Automotive
|
74 | 82 | 84 | 97 | 337 | |||||||||||||||
|
Total Consumer
Products
|
1,051 | 1,038 | 1,087 | 1,140 | 4,316 | |||||||||||||||
|
Coal
(a)
|
959 | 875 | 910 | 886 | 3,630 | |||||||||||||||
|
Industrial
Products
|
719 | 686 | 747 | 722 | 2,874 | |||||||||||||||
|
Agricultural
Products
|
679 | 618 | 715 | 822 | 2,834 | |||||||||||||||
|
Total freight
revenue
|
3,408 | 3,217 | 3,459 | 3,570 | 13,654 | |||||||||||||||
|
Other
revenue
|
112 | 99 | 106 | 111 | 428 | |||||||||||||||
|
Total
revenues
|
$ | 3,520 | $ | 3,316 | $ | 3,565 | $ | 3,681 | $ | 14,082 | ||||||||||
|
Cars/units (in
thousands)
|
||||||||||||||||||||
|
Domestic
Intermodal
|
458 | 460 | 463 | 478 | 1,859 | |||||||||||||||
|
International
Intermodal
|
497 | 474 | 490 | 493 | 1,954 | |||||||||||||||
|
Automotive
|
21 | 24 | 25 | 28 | 98 | |||||||||||||||
|
Total Consumer
Products
|
976 | 958 | 978 | 999 | 3,911 | |||||||||||||||
|
Coal
|
627 | 589 | 604 | 570 | 2,390 | |||||||||||||||
|
Industrial
Products
|
298 | 282 | 308 | 284 | 1,172 | |||||||||||||||
|
Agricultural
Products
|
227 | 212 | 247 | 259 | 945 | |||||||||||||||
|
Total
cars/units
|
2,128 | 2,041 | 2,137 | 2,112 | 8,418 | |||||||||||||||
|
Average
revenue per car/unit
|
||||||||||||||||||||
|
Domestic
Intermodal
|
$ | 1,124 | $ | 1,113 | $ | 1,136 | $ | 1,165 | $ | 1,135 | ||||||||||
|
International
Intermodal
|
930 | 937 | 973 | 986 | 956 | |||||||||||||||
|
Automotive
|
3,524 | 3,417 | 3,360 | 3,464 | 3,439 | |||||||||||||||
|
Total Consumer
Products
|
1,077 | 1,084 | 1,111 | 1,141 | 1,104 | |||||||||||||||
|
Coal
(a)
|
1,530 | 1,486 | 1,507 | 1,554 | 1,519 | |||||||||||||||
|
Industrial
Products
|
2,413 | 2,433 | 2,425 | 2,542 | 2,452 | |||||||||||||||
|
Agricultural
Products
|
2,991 | 2,915 | 2,895 | 3,174 | 2,999 | |||||||||||||||
|
Average
revenue per car/unit
|
$ | 1,602 | $ | 1,576 | $ | 1,619 | $ | 1,690 | $ | 1,622 | ||||||||||
|
Revenue
ton miles (in millions)
|
||||||||||||||||||||
|
Domestic
Intermodal
|
11,867 | 12,125 | 12,154 | 12,374 | 48,520 | |||||||||||||||
|
International
Intermodal
|
14,700 | 14,959 | 15,165 | 15,665 | 60,489 | |||||||||||||||
|
Automotive
|
793 | 940 | 960 | 1,040 | 3,733 | |||||||||||||||
|
Total Consumer
Products
|
27,360 | 28,024 | 28,279 | 29,079 | 112,742 | |||||||||||||||
|
Coal
|
73,245 | 69,475 | 71,253 | 66,314 | 280,287 | |||||||||||||||
|
Industrial
Products
|
21,301 | 21,060 | 22,952 | 21,893 | 87,206 | |||||||||||||||
|
Agricultural
Products
|
27,242 | 25,144 | 28,191 | 32,761 | 113,338 | |||||||||||||||
|
Total
revenue ton miles
|
149,148 | 143,703 | 150,675 | 150,047 | 593,573 | |||||||||||||||
|
Freight
revenue per thousand ton miles
|
||||||||||||||||||||
|
Domestic
Intermodal
|
$ | 43.40 | $ | 42.23 | $ | 43.28 | $ | 45.01 | $ | 43.49 | ||||||||||
|
International
Intermodal
|
31.43 | 29.68 | 31.45 | 31.02 | 30.90 | |||||||||||||||
|
Automotive
|
93.32 | 87.23 | 87.50 | 93.27 | 90.28 | |||||||||||||||
|
Total Consumer
Products
|
38.41 | 37.04 | 38.44 | 39.20 | 38.28 | |||||||||||||||
|
Coal
(a)
|
13.09 | 12.59 | 12.77 | 13.36 | 12.95 | |||||||||||||||
|
Industrial
Products
|
33.75 | 32.57 | 32.55 | 32.98 | 32.96 | |||||||||||||||
|
Agricultural
Products
|
24.92 | 24.58 | 25.36 | 25.09 | 25.00 | |||||||||||||||
|
Freight
revenue per thousand ton miles
|
$ | 22.85 | $ | 22.39 | $ | 22.96 | $ | 23.79 | $ | 23.00 | ||||||||||
|
|
||||||||||||||||||||
|
(a)
Coal revenues on a GAAP basis
were $863 million and $940 million for the three month periods ended March
31, 2009 and September 30, 2009, respectively. However, for comparative
purposes the table above excludes (from coal revenues and from the
computation of amounts derived therefrom) a $96 million unfavorable and
$30 million favorable impact related to a coal rate case decision for the
three month periods ended March 31, 2009 and September 30, 2009,
respectively.
|
14
|
Burlington
Northern Santa Fe Corporation
|
||||||||||||||||||||
|
Capital
Expenditures *
|
||||||||||||||||||||
| Three Months | ||||||||||||||||||||
| Ended December 31, | Year Ended December 31, | |||||||||||||||||||
|
2009
|
2008
|
2009
|
2008
|
2007 |
|
|||||||||||||||
|
Capital
expenditures excluding equipment (in
millions)
|
||||||||||||||||||||
|
Engineering
|
|
|||||||||||||||||||
|
Rail
|
$ | 34 | $ | 89 | $ | 416 | $ | 429 | $ | 376 | ||||||||||
|
Ties
|
36 | 69 | 391 | 358 | 316 | |||||||||||||||
|
Surfacing
|
50 | 45 | 252 | 230 | 235 | |||||||||||||||
|
Other
|
127 | 138 | 546 | 544 | 432 | |||||||||||||||
|
Total
engineering
|
247 | 341 | 1,605 | 1,561 | 1,359 | |||||||||||||||
|
Mechanical
|
21 | 52 | 107 | 168 | 141 | |||||||||||||||
|
Other
|
22 | 46 | 110 | 133 | 105 | |||||||||||||||
|
Total
replacement capital
|
290 | 439 | 1,822 | 1,862 | 1,605 | |||||||||||||||
|
Information
services
|
24 | 12 | 83 | 83 | 75 | |||||||||||||||
|
Terminal and
line expansion
|
8 | 12 | 86 | 222 | 568 | |||||||||||||||
|
Total capital
expenditures excluding equipment
|
$ | 322 | $ | 463 | $ | 1,991 | $ | 2,167 | $ | 2,248 | ||||||||||
|
Acquisition
of equipment
|
$ | 118 | $ | 273 | $ | 733 | $ | 949 | $ | 745 | ||||||||||
|
Track miles of
rail laid
|
||||||||||||||||||||
|
Replacement
capital
|
54 | 186 | 904 | 885 | 773 | |||||||||||||||
|
Expansion
projects
|
2 | 5 | 19 | 48 | 183 | |||||||||||||||
|
Total
|
56 | 191 | 923 | 933 | 956 | |||||||||||||||
|
Cross ties
inserted (thousands)
|
||||||||||||||||||||
|
Replacement
capital
|
182 | 651 | 3,284 | 3,038 | 2,708 | |||||||||||||||
|
Expansion
projects
|
4 | 9 | 26 | 129 | 418 | |||||||||||||||
|
Total
|
186 | 660 | 3,310 | 3,167 | 3,126 | |||||||||||||||
|
Track
resurfaced (miles)
|
2,833 | 2,397 | 15,456 | 13,005 | 11,687 | |||||||||||||||
|
*
|
Certain comparative prior period amounts have been adjusted to conform to the current period presentation. | |
15
|
Burlington Northern
Santa Fe Corporation
|
||||||||||||||||||||
|
Capital
Expenditures *
|
||||||||||||||||||||
| 2009 |
|
|||||||||||||||||||
|
1st
|
2nd
|
3rd
|
4th
|
Full |
|
|||||||||||||||
|
Quarter
|
Quarter
|
Quarter
|
Quarter
|
Year |
|
|||||||||||||||
|
Capital
expenditures excluding equipment (in
millions)
|
|
|||||||||||||||||||
|
Engineering
|
||||||||||||||||||||
|
Rail
|
$ | 110 | $ | 138 | $ | 134 | $ | 34 | $ | 416 | ||||||||||
|
Ties
|
87 | 144 | 124 | 36 | 391 | |||||||||||||||
|
Surfacing
|
42 | 78 | 82 | 50 | 252 | |||||||||||||||
|
Other
|
108 | 157 | 154 | 127 | 546 | |||||||||||||||
|
Total
engineering
|
347 | 517 | 494 | 247 | 1,605 | |||||||||||||||
|
Mechanical
|
37 | 25 | 24 | 21 | 107 | |||||||||||||||
|
Other
|
28 | 30 | 30 | 22 | 110 | |||||||||||||||
|
Total
replacement capital
|
412 | 572 | 548 | 290 | 1,822 | |||||||||||||||
|
Information
services
|
19 | 24 | 16 | 24 | 83 | |||||||||||||||
|
Terminal and
line expansion
|
31 | 24 | 23 | 8 | 86 | |||||||||||||||
|
Total capital
expenditures excluding equipment
|
$ | 462 | $ | 620 | $ | 587 | $ | 322 | $ | 1,991 | ||||||||||
|
Acquisition
of equipment
|
$ | 286 | $ | 170 | $ | 159 | $ | 118 | $ | 733 | ||||||||||
|
Track miles of
rail laid
|
||||||||||||||||||||
|
Replacement
capital
|
205 | 318 | 327 | 54 | 904 | |||||||||||||||
|
Expansion
projects
|
12 | - | 5 | 2 | 19 | |||||||||||||||
|
Total
|
217 | 318 | 332 | 56 | 923 | |||||||||||||||
|
Cross ties
inserted (thousands)
|
||||||||||||||||||||
|
Replacement
capital
|
769 | 1,223 | 1,110 | 182 | 3,284 | |||||||||||||||
|
Expansion
projects
|
10 | 3 | 9 | 4 | 26 | |||||||||||||||
|
Total
|
779 | 1,226 | 1,119 | 186 | 3,310 | |||||||||||||||
|
Track
resurfaced (miles)
|
2,351 | 5,015 | 5,257 | 2,833 | 15,456 | |||||||||||||||
|
*
|
Certain
interim period amounts have been reclassified to conform to the current
period presentation.
|
|||||||||||||||||||
16
|
Burlington
Northern Santa Fe Corporation
|
||||||
|
Outstanding
Debt
|
||||||
|
(Dollars in
millions)
|
||||||
| December 31, | ||||||
| 2009 |
|
2008 | ||||
|
Notes and
debentures, weighted average rate of 6.0 percent, due 2010 to 2097
*
|
$
|
8,095
|
$
|
7,593
|
||
|
Equipment
obligations, weighted average rate of 6.2 percent, due 2010 to
2027
|
271
|
244
|
||||
|
Capitalized
lease obligations, weighted average rate of 5.5 percent, due 2010 to
2028
|
1,589
|
1,281
|
||||
|
Mortgage
bonds, weighted average rate of 5.9 percent, due 2010 to
2047
|
94
|
97
|
||||
|
Financing
obligations, weighted average rate of 6.2 percent, due 2010 to
2028
|
323
|
278
|
||||
|
Commercial
paper
|
-
|
100
|
||||
|
Unamortized
discount and other, net
|
(37)
|
(38)
|
||||
| Total outstanding debt |
10,335
|
9,555
|
||||
|
Less: current
portion of long-term debt
|
(644)
|
(456)
|
||||
|
Long-term
debt
|
$
|
9,691
|
$
|
9,099
|
||
|
*
|
Notes
and debentures include a fair value adjustment increase for hedges of $26
million and $73 million at December 31, 2009 and 2008,
respectively.
|
||||||||
17