Attached files
| file | filename |
|---|---|
| 8-K - FORM 8-K - CYS Investments, Inc. | d8k.htm |
 FBR Capital Markets 2009 Fall Investor Conference December 2, 2009 Kevin E. Grant, CFA President & CEO EXHIBIT 99.1 |
 1
Forward Looking Statements This presentation contains forward-looking statements, within the meaning of Section 27A of the Securities Act of 1933, as amended, and Section 21E of the Securities Exchange Act of 1934, as amended, that are based on management’s beliefs and assumptions, current expectations, estimates and projections. Such statements, including information relating to the Company’s expectations for future financial performance and distributions to stockholders, are not considered historical facts and are considered forward-looking information under the federal securities laws. This information may contain words such as “believes,” “plans,” “expects,” “intends,” “estimates” or similar expressions. This information is not a guarantee of the Company’s future performance and is subject to risks, uncertainties and other important factors that could cause the Company’s actual performance or achievements to differ materially from those expressed or implied by this forward-looking information and include, without limitation, changes in the market value and yield of our assets, changes in interest rates and the yield curve, net interest margin, return on equity, availability and terms of financing and hedging and various other risks and uncertainties related to our business and the economy. Given these uncertainties, you should not rely on forward-looking information. The Company undertakes no obligations to update any forward-looking information, whether as a result of new information, future events or otherwise. |
 2
CYS Overview Agency Residential Mortgage Backed Securities Kevin Grant, CEO, President, Chairman Bill Shean, MD of Investments Pay dividends and achieve capital appreciation throughout changing interest rate
and credit cycles Be the most efficient Agency REIT in the market Currently financing lines with 25 lenders (6 lines added since IPO) Swap agreements with 5 counterparties Company intends to distribute all or substantially all of its REIT taxable income Scaled Management Fee: 1.0% to 1.5% No Incentive Fee A Real Estate Investment Trust formed in January 2006 Target Assets Objective Senior Investment Management Focus on Cost Efficiency Ample Financing Sources Dividend Policy |
 3
Superior Investment Team Kevin Grant 12-year track record at Fidelity Investments as a Senior Portfolio Manager (1993 - 2005) Top decile performance for entire period Conceived and implemented new MBS strategy (1993) Managed 19 Fidelity portfolios totaling over $25 billion • Bond funds: Mortgage Securities, Spartan Bond, Strategic Income,
Total Bond • Balanced (equity and debt): Balanced, Puritan • Aggregate bond team managed over $45 billion Funds achieved and by Morningstar Chief Mortgage Strategist, Morgan Stanley (1991 - 1993) Institutional Investor All-America Research Team Bill Shean 25-year track record including State Street Research & Management (BlackRock),
Citizens Bank, Fidelity Investments, Shawmut Bank Managed investments in all fixed income sectors and mortgage-only strategies
Portfolio size: $5 to $8+ billion Began career in 1984 |
 4
The Mortgage Supply Chain: Survival of the Fittest Residential mortgage origination going forward: two business models survive Originate to keep Originate to obtain GNMA/FNMA/FHLMC wrap & sell MBS investors: one survivor (other than depositories) Agency RMBS REITs FNMA/FHLMC mandated to begin selling in 2010 The existing non-Agency securities: Pre-2008 securities, defective underwriting environment Vulture environment / un-analyzable risks ARMs Good relative value in agency market Prepayments very low Little new supply 5/1 Hybrid ARMs Secondary supply Some new issuance Efficient financing creates attractive NIM Attractive hedged yield Fixed Rate Deepest agency market Highest yields Premiums currently reasonable in 15yr CYS Target Investment Markets (Agency Only) |
 5
FNMA and Freddie Mac mandated to sell down portfolios commencing in 2010 FNMA Portfolio = $793 billion FreddieMac Portfolio = $720 billion GNMA outstanding expected to be near $1 trillion GNMA now 36% of origination The Fed’s Agency MBS portfolio now $1.023 trillion Purchases of FNMA/Freddie Mac running at $22.2 billion per week Exit strategy yet to be defined Global financial system still delevering $11 Trillion Market Massive Redistribution Coming Sellers FNMA + FreddieMac + GNMA + The Fed + Global Banks New Origination Conforming Refi Nonconforming into Conforming New Purchases CYS Investment Opportunity Set: + = Our Market: Agency MBS Source: Federal Reserve Bank of New York, Barclays, JP Morgan, Fannie Mae, Freddie
Mac |
 6
Rigorous Investment Criteria Target: Best Risk Adjusted ROE Adjusted for hedging costs Adjusted for prepayments Adjusted for volatility Size of Company is Entering the Optimal Range Able to be selective and nimble in asset selection Beginning to achieve economies of scale in expenses Attractive as a counterparty to lenders |
 7
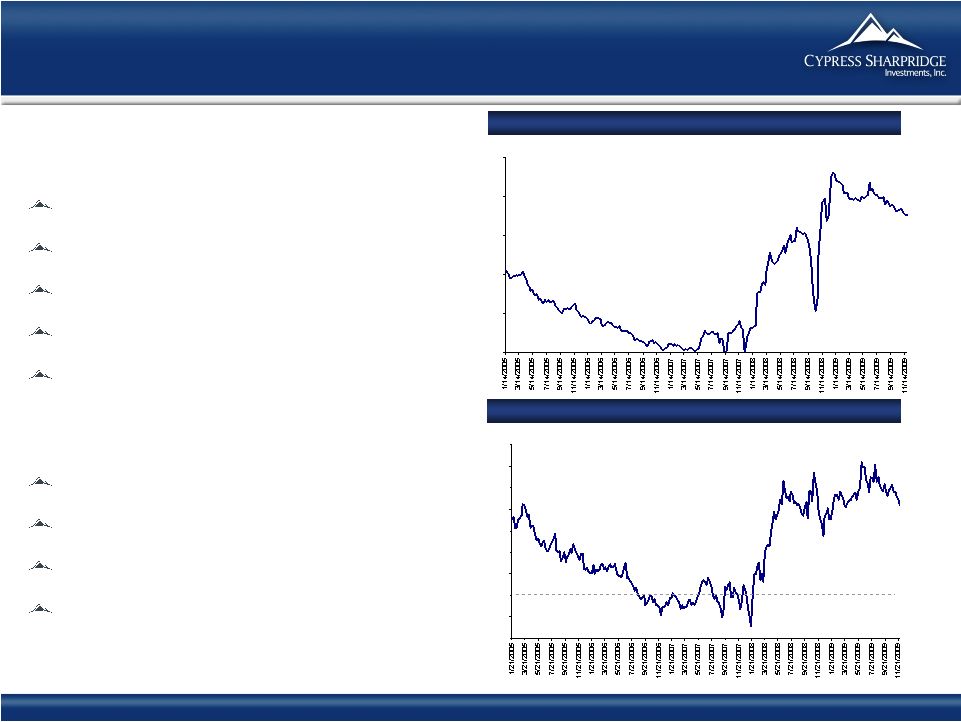
-1.00 -0.50 0.00 0.50 1.00 1.50 2.00 2.50 3.00 3.50 0.00 1.00 2.00 3.00 4.00 5.00 Attractive Yield Curve Environment Creates Investment Opportunities Mortgage Yields Currently Attractive Par-Priced 5/1 hybrid rates now 3.60% (1) 30 Year fixed rates now 4.20% (1) 15 Year fixed rates now 3.70% (1) Hedging costs remain reasonable Low home equity levels reduce prepayment risks Steep Curve Creates significant positive carry Significant ROE Hedge flexibility very important No signs of inflation Source: Bloomberg. (1) As of November 20, 2009. 5/1 Hybrid Net Interest Margin: 1/05 – 11/09 11/27/09 5 Year Swap vs 1 Month LIBOR: 1/05 – 11/09 11/27/09 |
 8
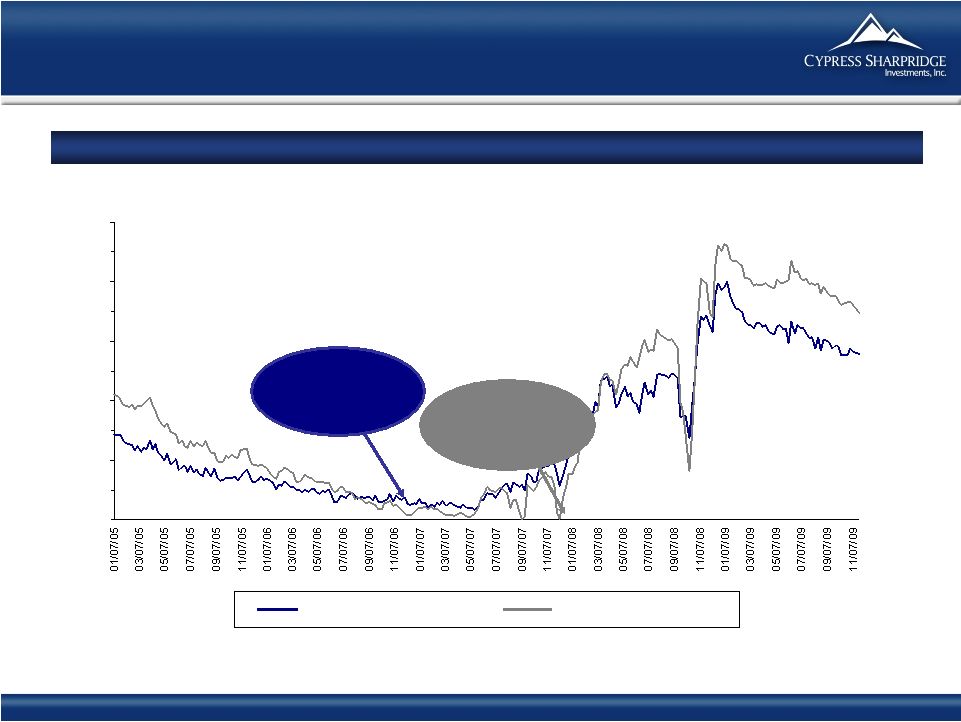
0.000 0.500 1.000 1.500 2.000 2.500 3.000 3.500 4.000 4.500 5.000 Wide Spreads Create Attractive Entry Point Source: Bloomberg. Note: Spreads calculated as: (i) 5/1 Hybrids Index – 50/50 3-Year Swaps/LIBOR, and (ii) 5/1 Hybrids Index – 1-Month LIBOR Index. 5/1 Hybrids Hedged with Swaps: 1/05 – 11/09 CYS Investment Strategy Simple “Carry Trade” Borrow Short/ Lend Long Hedged Hybrids (i) Unhedged Hybrids (ii) 11/24/09 |
 9
Forward Purchases help drive NAV Forward Prices lower due to Backwardation CYS can specify Pool Characteristics Reduces Prepayment Vulnerability ROE commences on Trade Date Price appreciation comes through NAV Ordinary Income is temporarily lower Forward Markets are easy to monitor Bloomberg: TBA5 <go> |
 10
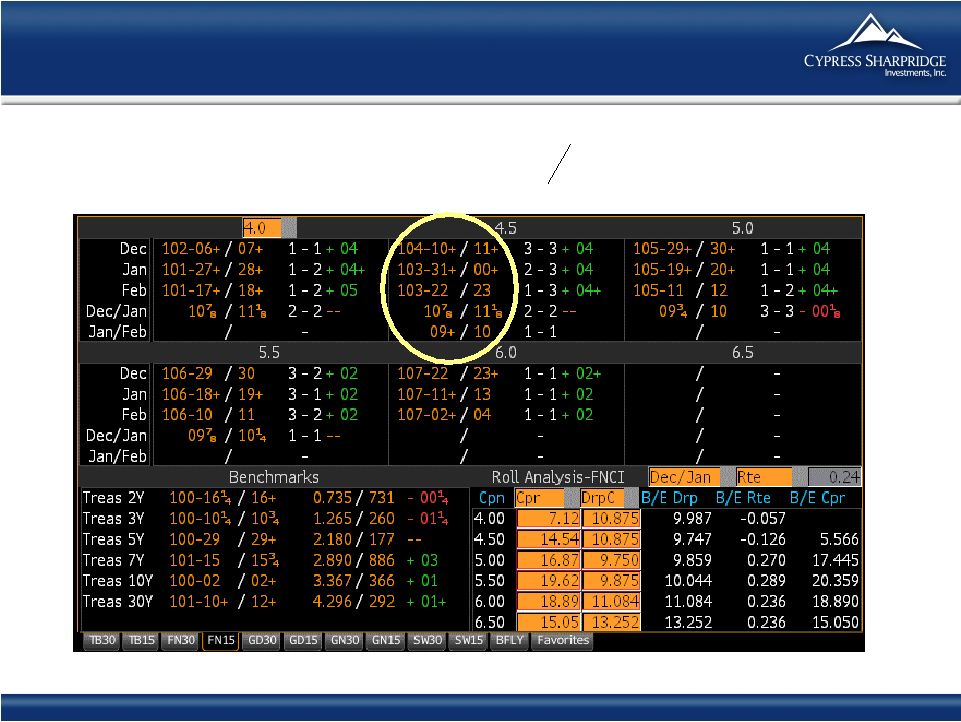
Economics of Forward Purchase Example: 15 yr 4 ½% drop =
pt per month Source : Bloomberg as of 11/23/09 11 32 11 32 |
 11
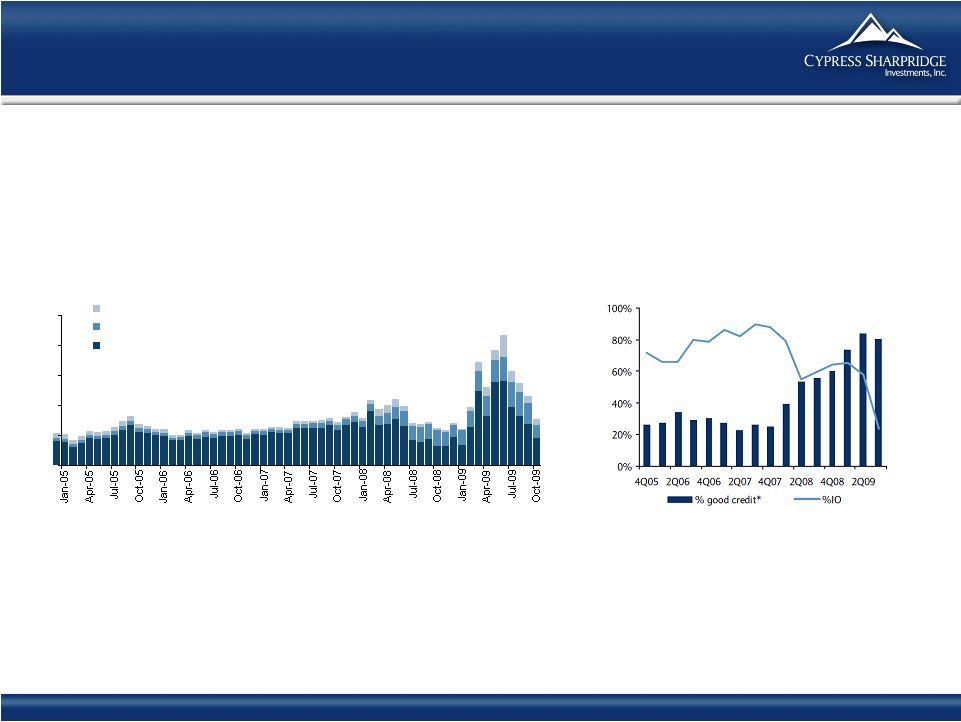
Agency MBS Supply Dynamics Source: Freddie Mac, Barclays Capital I/O Market Share Falling in Hybrids 4Q05 – 2Q09 (%) Gross Supply of 15 and 30 Year Conventional, 30 Year GNMA 1/05 – 10/09 ($bn) Note: * Full-doc, no piggyback, less than 80% original CLTV, 680+ FICO. 0 50 100 150 200 250 Conventional 15yr gross supply ($bn) GNMA 30yr gross supply ($bn) Conventional 30yr gross supply ($bn) |
 12
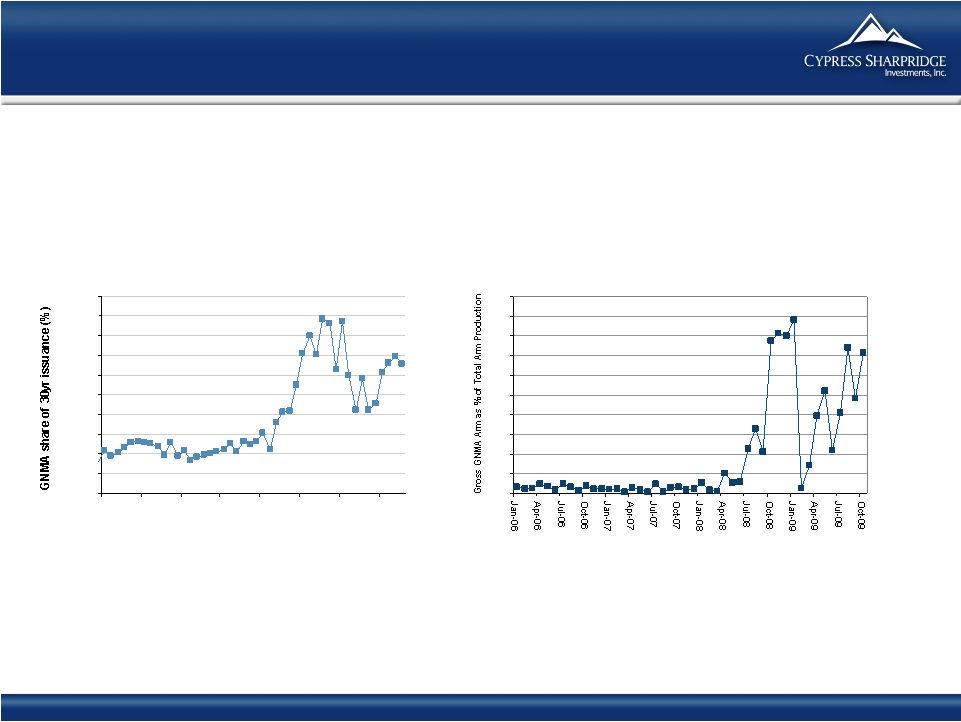
The Changing Composition of Supply 0% 5% 10% 15% 20% 25% 30% 35% 40% 45% 50% Source: Barclays GNMA Share of 30 Year Issuance 1/06 – 10/09 (%) Gross GNMA ARM as % of Total ARM Production 1/06 – 10/09 (%) 0% 5% 10% 15% 20% 25% 30% 35% 40% 45% 50% Jan-06 Jul-06 Jan-07 Jul-07 Jan-08 Jul-08 Jan-09 Jul-09 |
 13
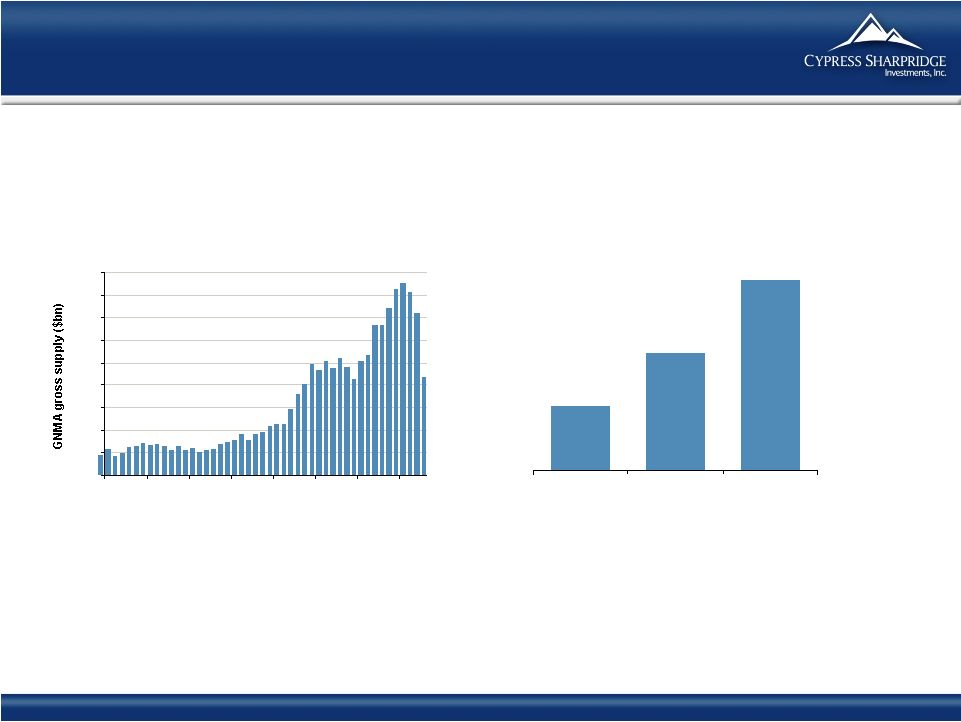
The Next 12 Months Source: Barclays, JP Morgan Total Agency Securitized = $5.666 GNMA Gross Supply ($bn) GNMA FHLMC FNMA Projected December 2010 Fixed and Floating Agency Outstanding ($ in Trillions) 1.793 2.886 0.987 0 5 10 15 20 25 30 35 40 45 Jan-06 Jul-06 Jan-07 Jul-07 Jan-08 Jul-08 Jan-09 Jul-09 |
 14
Portfolio Characteristics Source: Company data as of September 30, 2009; Bloomberg (1) Months to reset (2) Q3 2009 (3) Interest Only loans CYS Portfolio Characteristics $ Asset Type Face Value Cost Price MTR Coupon CPR 2 MTA 145,436 $ $103.65 $102.60 1 3.4 % 13.5 % 100 % Short Reset ARMs 170,593 101.57 103.06 6.1 4.2 22.1 33.0 Hybrid ARMs 693,218 101.02 104.65 47.7 4.7 21.5 59.0 Fixed Rate 557,055 100.90 103.91 NA 4.7 12.8 3.0 Total/Weighted-Average 1,566,302 $ $101.28 $104.02 33.9 4.6 % 18.2 % 40.0 % Interest Rate Swaps 640mm 3 Year 2.0% % IO Loans 3 (Face Value in 000’s) 1 |
 15
Prepayment Risk: The Reality Risk: government created non-economic prepayments $5.6 trillion Agency RMBS vs. $75 billion allocated TARP money Impact: less than 2% CPR Risk: very low mortgage rates Closing / application ratio running very low “Floor” mortgage rate seems to be 4.75 – 5.00% Homeowners are equity constrained Rising unemployment = low housing turnover |
 16
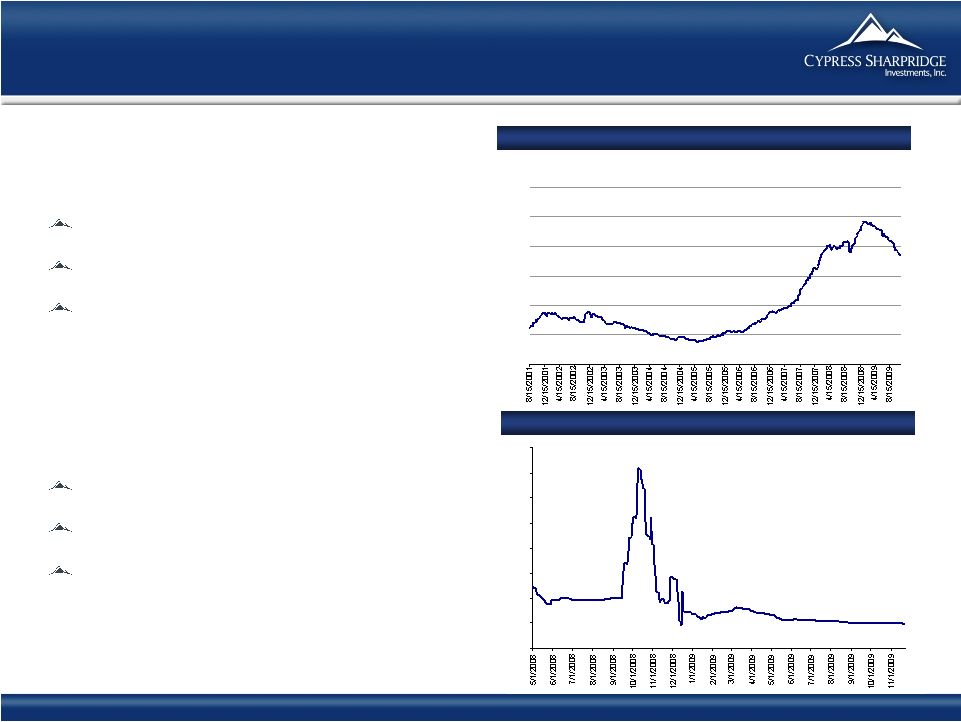
Attractive Repo Market Dynamics Money Market Funds Awash in Cash Assets remain very high Flight to quality on asset mix Agency RMBS a major beneficiary Source: Bloomberg. Market data as of November 23, 2009. LIBOR vs Fed Funds: 10/07 – 11/09 Money Market Fund Assets: 1/01 - 11/09 Lower Spreads Reduce Funding Costs and Improved Availability TARP TSLF and TALF Fed funds target rate: 0 to 0.25% 11/23/09 11/25/09 ($ in billions) 1,500 2,000 2,500 3,000 3,500 4,000 4,500 -0.500 0.000 0.500 1.000 1.500 2.000 2.500 3.000 3.500 |
 17
Poised to Realize Upside on Non-Agency Legacy Assets CLO Market has improved Non-Agency assets represent approximately 36 cents of Book Value Q3 Market appreciation of $3.7mm or 20 cents to Book Value Source: Company data as of September 30, 2009. CYS’ CLO & RESIX Securities Market Value NAV at Market (per share) NAV at Face Value (per share) Remaining Life CLO $6.3 MM $0.35 $1.81 8.6 years RESIX $0.3 MM $0.01 $0.69 28.1 years Total $6.6 MM $0.36 $2.50 |
 18
Fully Built Out Management Team CYS Management Team Foley & Lardner Epstein Becker & Green Thomson Financial Schooner Capital Donaldson, Lufkin & Jenrette Citizens Bank (Portfolio Manager) State Street Research (Portfolio Manager) Fidelity Investments Fidelity Investments (Portfolio Manager) Morgan Stanley Aetna Bond Investors Kevin Grant, CFA Chief Executive Officer Frances Spark, ACA Chief Financial Officer Bill Shean, CFA Managing Director of Investments Rick Cleary Chief Operating Officer Thomas Rosenbloom General Counsel MVC Capital (Chief Financial Officer) Hyperion Capital (Chief Financial Officer) KPMG Years of Experience Career History Name/Position 24 25 21 21 28 |
 19
History of Transparent and Consistent Financial Reporting CYS uses Financial Reporting for Investment Companies CYS financial reporting – Best in Class Schedule of investments NAVs have reflected mark-to-market accounting since inception No OCI account on balance sheet Realized and unrealized losses taken through income statement Losses expensed in period incurred Competitors likely to move closer to CYS’ financial reporting standards when FASB declares SOP 07-1 effective Potential to create meaningful adjustments for the other companies
|
 20
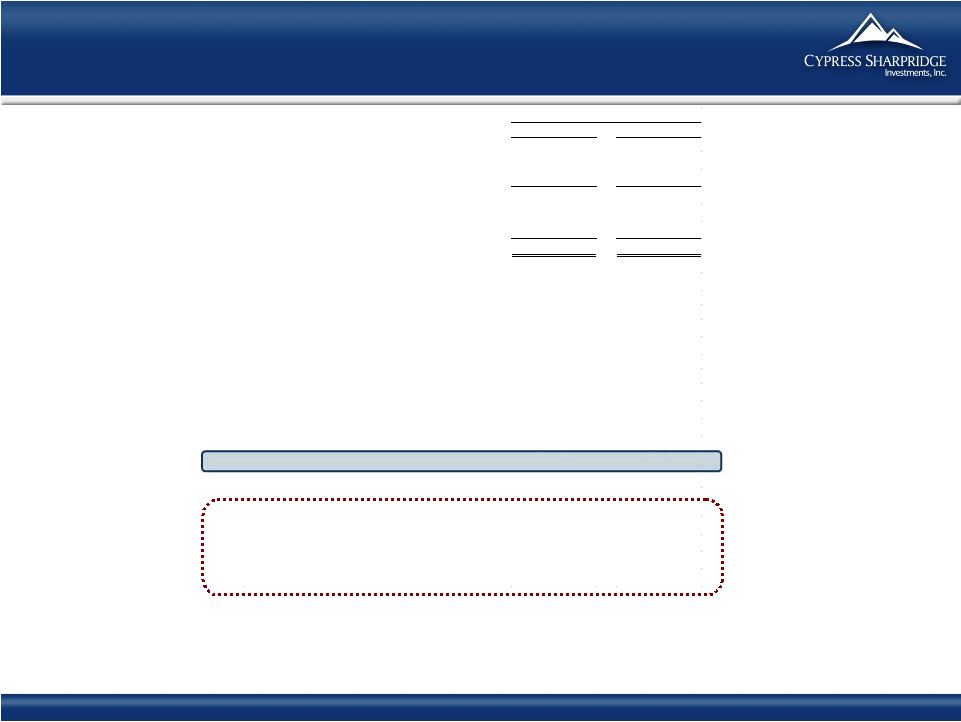
Historical Financials (1) Includes interest income on Agency RMBS and non-Agency securities. (2) Net income excluding net realized gain (loss) on investments and swap contracts and net unrealized appreciation (depreciation) on investments and swap contracts. (3) Calculated by dividing total interest income from Agency RMBS by average Agency RMBS. (4) Calculated by dividing total interest expense, including net swap interest income
(expense) by average securities sold under agreement to repurchase. (5)
Calculated by subtracting average cost of funds & hedge from average yield on
Agency RMBS. (6) Calculated by dividing total liabilities by net assets. 9/30/2009 6/30/2009 Income Statement Data Investment Income – Interest Income (1) $10,709.9 $9,727.4 Total expenses 2,895.3 2,525.4 Net Investment Income 7,814.6 7,202.0 Net gain (loss) from investments 24,410.9 12,443.4 Net gain (loss) from swap contracts (9,007.1) 930.9 Net Income (Loss) $23,218.4 $20,576.3 Net Income (Loss) Per Common Share (diluted) $1.28 $2.22 Distributions per Common Share $0.35 $1.20 Non-GAAP Measure Core Earnings (2) $5,588.9 $6,809.9 Balance Sheet Data Cash and Cash Equivalents $0.7 $44,644.5 Total Assets $1,646,591.5 $1,575,080.7 Securities sold under agreement to repurchase $1,237,057.9 $699,004.7 Net assets $247,386.8 $229,558.4 Key Portfolio Statistics Average Yield on Agency RMBS (3) 4.28% 4.75% Average Cost of Funds & Hedge (4) 1.61% 0.87% Interest Rate Spread Net of Hedge (5) 2.67% 3.88% Leverage Ratio (at period end) (6) 5.7:1 5.9:1 Quarter Ended Net assets per common share $13.58 $12.66 |
 21
Financial Highlights Steep yield curve and attractive spreads in target assets Core earnings consistently in mid-teens as percent of net assets Non-Agency assets written down to near zero Opportunistic hedging with swaps going forward Investment company accounting understates net income relative to peers in declining mark-to-market environment Approximately $38 million of swap losses can be utilized to reduce taxable income in current and future years for all shareholders
|
 FBR Capital Markets 2009 Fall Investor Conference December 2, 2009 Kevin E. Grant, CFA President & CEO |