Attached files
| file | filename |
|---|---|
| EX-14 - EX-14 - ZALE CORP | a2195130zex-14.htm |
| EX-31.2 - EXHIBIT 31.2 - ZALE CORP | a2195130zex-31_2.htm |
| EX-23.1 - EXHIBIT 23.1 - ZALE CORP | a2195130zex-23_1.htm |
| EX-32.1 - EXHIBIT 32.1 - ZALE CORP | a2195130zex-32_1.htm |
| EX-32.2 - EXHIBIT 32.2 - ZALE CORP | a2195130zex-32_2.htm |
| EX-10.2 - EXHIBIT 10.2 - ZALE CORP | a2195130zex-10_2.htm |
| EX-31.1 - EXHIBIT 31.1 - ZALE CORP | a2195130zex-31_1.htm |
| EX-10.13 - EXHIBIT 10.13 - ZALE CORP | a2195130zex-10_13.htm |
QuickLinks -- Click here to rapidly navigate through this document
UNITED STATES
SECURITIES AND EXCHANGE COMMISSION
Washington, D.C. 20549
Form 10-K
For the fiscal year ended July 31, 2009
Zale Corporation
A Delaware Corporation
IRS Employer Identification No. 75-0675400
SEC File Number 1-04129
901 W. Walnut Hill Lane
Irving, Texas 75038-1003
(972) 580-4000
Zale Corporation's common stock, par value $.01 per share, is registered pursuant to Section 12 (b) of the Securities Exchange Act of 1934 (the "Act") and is listed on the New York Stock Exchange. Zale Corporation does not have any securities registered under Section 12(g) of the Act. Zale Corporation is required to file reports pursuant to Section 13 of the Act. Zale Corporation (1) has filed all reports required to be filed by Section 13 or 15(d) of the Act during the preceding 12 months, and (2) has been subject to such filing requirements for the past 90 days.
Zale Corporation was not required to submit electronically and post on the Company's website Interactive Data Files required to be submitted and posted pursuant to Rule 405 of Regulation S-T during the preceding 12 months due to the Rule not being applicable to the Company for the current and previous periods.
Disclosure of the delinquent filers pursuant to Item 405 of Regulation S-K will not be contained in our definitive Proxy Statement, portions of which are incorporated by reference in Part III of this Form 10-K.
The aggregate market value of Zale Corporation's common stock (based upon the closing sales price quoted on the New York Stock Exchange) held by non-affiliates as of January 31, 2009 was $28,002,164. For this purpose, directors and officers have been assumed to be affiliates. As of October 19, 2009, 31,980,529 shares of Zale Corporation's common stock were outstanding.
Zale Corporation is a smaller reporting company filer and is not a well-known seasoned issuer.
Zale Corporation is not a shell company.
DOCUMENTS INCORPORATED BY REFERENCE.
Portions of Zale Corporation's definitive Proxy Statement for the 2009 Annual Meeting of Stockholders to be held on December 7, 2009 are incorporated by reference into Part III.
General
We are, through our wholly owned subsidiaries, a leading specialty retailer of fine jewelry. At July 31, 2009, we operated 1,247 specialty retail jewelry stores and 684 kiosks located mainly in shopping malls throughout the United States of America, Canada and Puerto Rico.
We were incorporated in Delaware in 1993. Our principal executive offices are located at 901 W. Walnut Hill Lane, Irving, Texas 75038-1003. Our telephone number at that address is (972) 580-4000, and our internet address is www.zalecorp.com.
During the fiscal year ended July 31, 2009, we generated $1.8 billion of revenues. We believe we are well-positioned to compete in the approximately $63 billion U.S. and Canadian retail jewelry industry, leveraging our established brand names, economies of scale and geographic and demographic diversity. We have significant brand name recognition as a result of each of our brands' long-standing presence in the industry and our national and regional advertising campaigns. We believe that brand name recognition is an important advantage in jewelry retailing as jewelry products are generally unbranded and consumers must trust in a retailer's reliability, credibility and commitment to customer service.
Our business has changed significantly over the past few years. In November 2007 we sold our Bailey Banks & Biddle brand to Finlay Enterprises, Inc. This enabled us to better deploy our capital and to focus on our core brands. We have closed a total of 191 underperforming locations during calendar year 2009, of which 160 were fine jewelry stores and 31 were kiosks. Finally, throughout fiscal 2008 and fiscal 2009 we implemented various inventory and cost reduction initiatives designed to better position us going forward. See Part II, Item 7, "Management's Discussion and Analysis of Financial Condition and Results of Operations" for more details related to these items.
Business Segments
We report our operations under three business segments: Fine Jewelry, Kiosk Jewelry and All Other. An overview of each business segment follows below. During fiscal year 2009, our Fine Jewelry segment generated $1.5 billion, or approximately 86 percent of our revenues. During fiscal year 2009, the Kiosk Jewelry segment revenues represented approximately $233 million, or approximately 13 percent of our revenues.
Fine Jewelry
Our Fine Jewelry segment is comprised of five brands focused on the value-oriented consumer. Each brand specializes in fine jewelry and watches, with merchandise and marketing emphasis focused on diamond products. Additionally, each brand differentiates itself through a selection of exclusive product, marketing, store design and customer experience. Our centralized merchandising and sourcing organizations create significant synergies. The merchant team is focused on building compelling merchandise assortments and the sourcing team is focused on partnering with vendors that provide reliable delivery of quality merchandise at a reasonable cost. Zales Jewelers® is our national brand in the U.S., providing jewelry to its value-oriented customers. We have further leveraged the brand strength through Zales Outlet®, which focuses on a slightly higher-income female customer in outlet malls and neighborhood power centers. Gordon's Jewelers® is a value-oriented regional jeweler that caters to local fashion styles within each market and emphasizes customer relationships. Peoples Jewellers® is Canada's largest fine jewelry retailer that offers customers an extensive assortment of affordable fine jewelry and a comfortable, accessible shopping experience. Mappins Jewellers®, which is positioned as a regional jeweler similar to Gordon's in the U.S., offers Canadian customers a broad selection of merchandise in a range of price points from engagement rings to fashionable and contemporary fine jewelry. In addition, we have
1
made a strategic decision to expand our business for the Zales and Gordon's brands through the e-commerce sites, zales.com and gordonsjewelers.com.
Zales Jewelers and Gordon's Jewelers
Zales, our U.S. based flagship, is a leading brand name in jewelry retailing in the U.S., operating 693 stores in 50 states and Puerto Rico with an average store size of 1,687 square feet. Gordon's operates 202 stores in 31 states and Puerto Rico with an average store size of 1,524 square feet.
Zales is positioned as "The Diamond Store Since 1924" given its emphasis on diamond jewelry especially in the bridal and fashion segments. The Zales brand complements its merchandise assortments with promotional strategies to increase sales during traditional gift-giving periods and throughout the year. We believe that the prominence of diamond jewelry in our product selection and Zales' reputation for customer service for over 85 years fosters an image of product expertise, quality and trust among consumers.
Gordon's was founded in 1905 and its customer shares similar demographic characteristics with the Zales customer. Accordingly, we have taken steps to position the brand to leverage our corporate strengths. By centralizing the organizational structure, we have eliminated redundancies between Zales and Gordon's resulting in increased communication and consistency which will further strengthen the performance in both brands.
Zales Jewelers' and Gordon's Jewelers' combined revenues accounted for approximately 63 percent of our total revenues, with an average transaction value of $403 in fiscal year 2009. Additionally, both brands operate as multi-channel retailers and serve internet customers through e-commerce sites zales.com and gordonsjewelers.com, which accounted for approximately three percent of our total revenues in fiscal year 2009. Internet sales totaled $56.2 million in fiscal year 2009 compared to $55.7 million in fiscal year 2008.
Peoples Jewellers and Mappins Jewellers
In Canada, we operate 212 stores in nine provinces and enjoy the largest market share of any specialty jewelry retailer in Canada. Canadian operations consist of two brands, Peoples Jewellers and Mappins Jewellers, and accounted for approximately 14 percent of our total revenues in fiscal year 2009. The average store size is 1,603 square feet with an average transaction value of $268 in fiscal year 2009.
Peoples Jewellers and Mappins Jewellers are two of the most recognized brand names in Canada. Peoples was founded in 1919 and offers jewelry at affordable prices, attracting a wide variety of Canadian customers. Using the trademark "Peoples, the Diamond Store" in Canada, Peoples emphasizes its diamond business while also offering a wide selection of gold jewelry, gemstone jewelry and watches. Since 2000, the Peoples brand has built recognition through an aggressive television campaign. Over the past five years, Peoples had the largest television campaign of any Canadian jewelry retailer. Mappins Jewellers differentiates itself by offering exclusive merchandise primarily in its bridal assortments.
Zales Outlet
We operate Zales Outlet with stores in 36 states and Puerto Rico, sales from which accounted for approximately nine percent of our total revenues in fiscal year 2009. The average store size is 2,337 square feet, with an average transaction value of $464 in fiscal year 2009.
The outlet concept has evolved into three differentiated formats: power strip centers, traditional outlet malls and destination centers. Our stores feature items in every major jewelry category including branded watches, gemstones, gold merchandise, and diamond fashion and solitaire products. The merchandise assortment in a typical Zales Outlet store caters to the higher-income, female customer, offering 20 to 70 percent off traditional retail prices. We have grown our Zales Outlet concept over the past ten years from four stores in 1998 to the 140 stores in operation at the end of fiscal year 2009.
2
Although Zales Outlet was established as an extension of the Zales brand and capitalizes on Zales' national advertising and brand recognition, Zales Outlet offers its own unique product assortments and augments this with promotional efforts that are geared specifically to the outlet consumer and are consistent with the "off-mall" location.
Kiosk Jewelry
The Kiosk Jewelry segment operates under the brand names Piercing Pagoda®, Plumb Gold™, and Silver and Gold Connection® (collectively, "Piercing Pagoda") through mall-based kiosks, and targets the opening price point jewelry customer. At July 31, 2009, Piercing Pagoda operated 684 locations in 41 states and Puerto Rico. The Kiosk Jewelry segment specializes in gold and silver products, including entry level diamond merchandise, that capitalize on the latest fashion trends.
At the entry-level price point, the Kiosk Jewelry segment targets a young, fashion forward customer. The Kiosk segment offers an extensive collection of bracelets, earrings, charms, rings, and 14 karat and 10 karat gold chains, as well as a selection of silver and diamond jewelry, all in basic styles at moderate prices. In addition, trained associates perform ear-piercing services on site.
Kiosks are generally located in high traffic areas that are easily accessible and visible within regional shopping malls. The kiosk locations average 188 square feet in size, with an average transaction value of $39 in fiscal year 2009.
All Other
We provide insurance and reinsurance facilities for various types of insurance coverage, which are marketed primarily to our private label credit card customers, through Zale Indemnity Company, Zale Life Insurance Company and Jewel Re-Insurance Ltd. These three companies are the insurers (either through direct written or reinsurance contracts) of our customer credit insurance coverage. In addition to providing merchandise replacement coverage for certain perils, credit insurance coverage provides protection to the creditor and cardholder for losses associated with the disability, involuntary unemployment, leave of absence or death of the cardholder. Zale Life Insurance Company also provides group life insurance coverage for our eligible employees. Zale Indemnity Company, in addition to writing direct credit insurance contracts, has certain discontinued lines of insurance that it continues to service. Credit insurance operations are dependent on our retail sales through our private label credit cards. In fiscal year 2009, approximately 36 percent of our private label credit card purchasers purchased some form of credit insurance. Under the current private label arrangements with Citibank, N.A. and one of its subsidiaries (collectively, "Citibank"), our insurance affiliates continue to provide insurance to holders of our private label credit cards and receive payments for such insurance products. In fiscal year 2009, the All Other segment accounted for approximately one percent of our total revenues.
Industry and Competition
Jewelry retailing is highly fragmented and competitive. We compete with a large number of independent regional and local jewelry retailers, as well as with other national jewelry chains. We also compete with other types of retailers who sell jewelry and gift items such as department stores, discounters, direct mail suppliers, online retailers and television home shopping programs. Certain of our competitors are non-specialty retailers, which are larger and have greater financial resources than we do. The malls where most of our stores are located typically contain competing national chains, independent jewelry stores and/or department store jewelry departments. We believe that we also are competing for consumers' discretionary spending dollars and, therefore, compete with retailers who offer merchandise other than jewelry or giftware. Therefore, we compete primarily on the basis of our reputation for high quality products, brand recognition, store location, distinctive and value-oriented merchandise, personalized customer service and ability to offer private label credit card programs to customers wishing to finance
3
their purchases. Our success also is dependent on our ability to both create and react to customer demand for specific merchandise categories.
The U.S. and Canadian retail jewelry industry accounted for approximately $63 billion of sales in 2008, according to publicly available data. We have a three percent market share in the combined U.S. and Canadian markets. The largest jewelry retailer in the combined U.S. and Canadian markets is believed to be Wal-Mart Stores, Inc. Other significant segments of the fine jewelry industry include national chain department stores (such as J.C. Penney Company, Inc.), mass merchant discount stores (such as Wal-Mart Stores, Inc.), other general merchandise stores, specialty retail jewelers (such as Signet Jewelers Limited) and apparel and accessory stores. The remainder of the retail jewelry industry is comprised primarily of catalog and mail order houses, direct-selling establishments, TV shopping networks (such as QVC, Inc.) and online jewelers.
We hold no material patents, licenses, franchises or concessions; however, our established trademarks and trade names are essential to maintaining our competitive position in the retail jewelry industry.
Operations by Brand
The following table presents revenues, average sales per location and the number of locations for each of our brands for the periods indicated.
| |
Year Ended July 31, | ||||||
|---|---|---|---|---|---|---|---|
Revenues (in thousands)
|
2009 | 2008 | |||||
Zales and Gordon's (including zales.com and gordonsjewelers.com) |
$ | 1,110,419 | $ | 1,362,672 | |||
Zales Outlet |
168,497 | 191,526 | |||||
Peoples(a) |
256,710 | 321,972 | |||||
Piercing Pagoda |
232,809 | 249,489 | |||||
Insurance revenues |
11,309 | 12,382 | |||||
|
$ | 1,779,744 | $ | 2,138,041 | |||
Average Sales Per Location(b):
|
|||||||
Zales and Gordon's |
$ | 1,061,000 | $ | 1,251,000 | |||
Zales Outlet |
1,149,000 | 1,350,000 | |||||
Peoples |
1,213,000 | 1,622,000 | |||||
Piercing Pagoda |
330,000 | 328,000 | |||||
4
| |
Locations by Brand | |||||||||
|---|---|---|---|---|---|---|---|---|---|---|
Year Ended July 31, 2009
|
Locations Opened During Period |
Locations Closed During Period |
Locations at End of Period |
|||||||
Zales and Gordon's |
3 | 153 | 895 | |||||||
Zales Outlet |
6 | 9 | 140 | |||||||
Peoples |
5 | 1 | 212 | |||||||
Piercing Pagoda |
— | 55 | 684 | |||||||
|
14 | 218 | 1,931 | |||||||
Year Ended July 31, 2008 |
||||||||||
Zales and Gordon's |
19 | 45 | 1,045 | |||||||
Zales Outlet |
8 | 2 | 143 | |||||||
Peoples |
16 | 1 | 208 | |||||||
Piercing Pagoda |
4 | 58 | 739 | |||||||
|
47 | 106 | 2,135 | |||||||
- (a)
- Peoples
(including Mappins) reflects all revenue from Canadian operations, which constitutes all our foreign operations. Long-lived assets from
foreign operations totaled approximately $40.6 million and $47.0 million at July 31, 2009 and 2008, respectively.
- (b)
- Based on merchandise sales for locations open a full 12 months during the applicable year.
Business Segment Data
Information concerning sales and segment income attributable to each of our business segments is set forth below in Item 6, "Selected Financial Data," Item 7, "Management's Discussion and Analysis of Financial Condition and Results of Operations," and in the "Notes to Consolidated Financial Statements," all of which are incorporated herein by reference.
Store Operations
Our stores are designed to differentiate our brands, create an attractive environment, make shopping convenient and enjoyable, and maximize operating efficiencies, all of which enhance the customer experience. We focus on store layout, with particular focus on arrangement of display cases, lighting, and choice of materials to optimize merchandise presentation. Promotional displays are changed periodically to provide variety or to reflect seasonal events.
Each of our stores is led by a store manager who is responsible for store-level operations, including overall store sales and personnel matters. Administrative matters, including purchasing, distribution and payroll, are consolidated at the corporate level to maintain efficiency and lower operating costs. In addition to selling jewelry, watches and gift items, each store also offers standard warranties and return policies, and provides extended warranty coverage that may be purchased at the customer's option. In order to facilitate sales, stores will hold merchandise in layaway, generally requiring a deposit of not less than 20 percent of the purchase price at the inception of the layaway transaction.
We have implemented inventory control systems, extensive security systems and loss prevention procedures to maintain low inventory losses. We screen employment applicants and provide our store personnel with training in loss prevention. Despite such precautions, we experience theft losses from time to time, and maintain insurance to cover such external losses.
We believe it is important to provide knowledgeable and responsive customer service and we maintain a strong focus on connecting with the customer, both through advertising and in-store communications and service. Our goal is to form and sustain an effective relationship with the customer from the first sale by
5
maintaining a customer connection. We have a centralized customer service call center to effectively address customer service issues at lower aggregate cost.
We continue to focus on the level and frequency of our employee training programs, particularly with store managers and key jewelry consultants. We provide sales and merchandise product training for all store personnel. In addition, we provide management training for store managers. Under the banner of Zale Corporation University, we offer training to employees at every level of the organization.
Purchasing and Inventory
We purchase the majority of our merchandise in finished form from a network of established suppliers and manufacturers located primarily in the United States, India, Southeast Asia and Italy. We procure approximately 56 percent of our merchandise from wholesalers, 28 percent directly from manufacturers and 16 percent from our internal assembly organization. All purchasing is done through buying offices at our Store Support Center. Consignment inventory has historically consisted of test programs, merchandise at higher price points or merchandise that otherwise does not warrant the risk of ownership. Consignment merchandise can be returned to the vendor at any time or converted to owned inventory if it meets certain sales thresholds. We had $71.5 million and $114.3 million of consignment inventory on hand at July 31, 2009 and 2008, respectively. During fiscal years 2009 and 2008, we purchased approximately 12 percent and 14 percent, respectively, of our finished merchandise from our top five vendors with no single vendor exceeding three percent in 2009. If our supply with these top vendors were disrupted, particularly at certain critical times during the year, our sales could be adversely affected in the short term until alternative supply arrangements could be established.
As a specialty retail jeweler, we could be affected by industry-wide fluctuations in the prices of diamonds, gold and other metals and stones. The supply and prices of diamonds in the principal world markets are significantly influenced by a single entity, Diamond Trading Company, which has traditionally controlled the sale of a substantial majority of the world's supply of diamonds and sells rough diamonds to worldwide diamond cutters at prices determined in its sole discretion. The availability of diamonds to Diamond Trading Company and our suppliers is to some extent dependent on the political environment in diamond-producing countries and on continuation of prevailing supply and marketing arrangements for raw diamonds. Until alternate sources are developed, any sustained interruption in the supply of diamonds could adversely affect us and the retail jewelry industry as a whole. The inverse is true with respect to any oversupply from diamond-producing countries, which could cause diamond prices to fall.
Proprietary Credit
Our private label credit card program helps facilitate the sale of merchandise to customers who wish to finance their purchases rather than use cash or other payment sources. We offer revolving and interest free credit plans under our private label credit card program. Approximately 40 percent of our U.S. sales, excluding Piercing Pagoda which does not offer proprietary credit, were financed by proprietary credit in fiscal years 2009 and 2008. Our Canadian propriety credit card sales represented approximately 30 percent and 25 percent of Canadian total sales for fiscal years 2009 and 2008, respectively.
In fiscal year 2009, our proprietary credit offerings included same-as-cash, revolving and interest free programs, all of which allowed our sales personnel to provide the customer a variety of financing options.
In March 2001, we entered into a 10-year agreement with Citibank under which Citibank issues private label credit cards branded with appropriate trademarks, and provides financing for our customers to purchase merchandise in exchange for payment by us of a merchant fee based on a percentage of each credit card sale. The merchant fee varies according to the credit plan that is chosen by the customer (i.e., revolving, interest free, same-as-cash).
6
Employees
As of July 31, 2009, we had approximately 14,500 employees, of whom approximately 13 percent were Canadian employees and less than one percent of whom were represented by unions. Additionally, we usually hire temporary employees during November and December of each year, the Holiday season.
Seasonality
As a specialty retailer of fine jewelry, our business is seasonal in nature, with our second quarter, which includes the months of November through January, accounting for a proportionally greater percentage of annual sales, earnings from operations and cash flow than the other three quarters. Other important periods include Valentine's Day and Mother's Day. We expect such seasonality to continue.
Information Technology
Our technology systems provide information necessary for (i) store operations; (ii) inventory control; (iii) profitability monitoring by many measures (merchandise category, buyer, store); (iv) customer care; (v) expense control programs; and (vi) overall management decision support. Significant data processing systems include point-of-sale reporting, purchase order management, replenishment, warehouse management, merchandise planning and control, payroll, general ledger, sales audit, and accounts payable. Bar code ticketing and scanning are used at all point-of-sale terminals to ensure accurate sales and margin data compilation and to provide for inventory control monitoring. Information is made available online to merchandising staff on a timely basis, thereby increasing the merchants' ability to be responsive to changes in customer behavior. We are also improving the connectivity between stores and our Store Support Center to enhance operating effectiveness.
Our information technology systems and processes allow management to monitor, review and control operational performance on a daily, monthly, quarterly and annual basis for each store and each transaction. Senior management can review and analyze activity by store, amount of sale, terms of sale or employees who sell the merchandise.
We have a data center operations services agreement with a third party for the management of our client server systems, Local Area Network operations, Wide Area Network management and e-commerce hosting. The agreement began in 2005 and requires fixed payments totaling $30.0 million over an 84-month period plus a variable amount based on usage, and extends through 2012. We believe that by outsourcing our data center operations, we are better able to focus our resources on developing and executing the strategic initiatives discussed in the Business section.
We have historically upgraded, and expect to continue to upgrade, our information systems to improve operations and support future growth. We estimate we will make capital expenditures of approximately $6 million in fiscal year 2010 for enhancements to our information systems and infrastructure.
Regulation
Our operations are affected by numerous federal and state laws that impose disclosure and other requirements upon the origination, servicing and enforcement of credit accounts and limitations on the maximum amount of finance charges that may be charged by a credit provider. In addition to our private label credit cards, credit to our customers is provided primarily through bank cards such as Visa®, MasterCard®, and Discover®. Any change in the regulation of credit which would materially limit the availability of credit to our traditional customer base could adversely affect our results of operations or financial condition.
We are subject to the jurisdiction of various state and other taxing authorities. From time to time, these taxing authorities conduct reviews or audits of the Company.
7
The sale of insurance products also is regulated. Our three wholly owned insurance companies are required to file reports with various insurance commissions, and are also subject to regulations relating to capital adequacy, the payment of dividends and the operation of their businesses generally. State laws also impose registration and disclosure obligations with respect to the credit and other insurance products that we sell to our customers. In addition, the providers of our private label credit programs are subject to disclosure and other requirements under state and federal law and are subject to review by the Federal Trade Commission and the state and federal banking regulators.
Merchandise in the retail jewelry industry is frequently sold at a discount off the "regular" or "original" price. We are subject to federal and state regulations requiring retailers offering merchandise at promotional prices to offer the merchandise at regular or original prices for stated periods of time. Additionally, we are subject to certain truth-in-advertising and various other laws, including consumer protection regulations that regulate retailers generally and/or the promotion and sale of jewelry in particular.
Available Information
We provide links to our filings with the Securities and Exchange Commission ("SEC") and to the SEC filings (Forms 3, 4 and 5) of our directors and executive officers under Section 16 of the Securities Exchange Act of 1934, as amended (the "Exchange Act"), free of charge, on our website at www.zalecorp.com, under the heading "SEC Filings" in the "Shareholder Information" section. These links are automatically updated, so the filings are available immediately after they are made publicly available by the SEC. These filings also are available through the SEC's EDGAR system at www.sec.gov.
Our certificate of incorporation and bylaws as well as the charters for the compensation, audit, nominating and corporate governance committees of our Board of Directors and the corporate governance guidelines are available on our website at www.zalecorp.com, under the heading "Corporate and Social Responsibility."
We have a Code of Business Conduct and Ethics (the "Code"). All of our directors, executive officers and employees are subject to the Code. The Code is available on our web site at www.zalecorp.com, under the heading "Corporate and Social Responsibility-Code of Business Conduct and Ethics." Waivers of the Code, if any, for directors and executive officers would be disclosed in a SEC filing on Form 8-K or, to the extent permitted by law, on our website.
8
We make forward-looking statements in this Annual Report on Form 10-K, in other reports we file with the SEC and in presentations to investors and others. In addition, members of our senior management make forward-looking statements orally in presentations to analysts, investors, the media and others. Forward-looking statements include statements regarding our objectives and expectations with respect to our financial plan, sales and earnings, merchandising and marketing strategies, acquisitions and dispositions, share repurchases, store opening, renovation, remodeling and expansion, inventory management and performance, liquidity and cash flows, capital structure, capital expenditures, development of our information technology and telecommunications plans and related management information systems, e-commerce initiatives, human resource initiatives and other statements regarding our plans and objectives. In addition, the words "plans to," "anticipate," "estimate," "project," "intend," "expect," "believe," "forecast," "can," "could," "should," "will," "may," or similar expressions may identify forward-looking statements, but some of these statements may use other phrasing. These forward-looking statements are intended to relay our expectations about the future, and speak only as of the date they are made. We disclaim any obligation to update or revise publicly or otherwise any forward-looking statements to reflect subsequent events, new information or future circumstances, except as required by law.
Forward-looking statements are not guarantees of future performance and a variety of factors could cause our actual results to differ materially from the anticipated or expected results expressed in or suggested by these forward-looking statements.
If the general economy performs poorly, discretionary spending on goods that are, or are perceived to be, "luxuries" may not grow and may decrease.
Jewelry purchases are discretionary and may be affected by adverse trends in the general economy (and consumer perceptions of those trends). In addition, a number of other factors affecting consumers such as employment, wages and salaries, business conditions, energy costs, credit availability and taxation policies, for the economy as a whole and in regional and local markets where we operate, can impact sales and earnings. The economic downturn in 2008 and 2009 has significantly impacted our sales and the continuation of this downturn, and particularly its worsening, would have a material adverse impact on our business and financial condition.
The concentration of a substantial portion of our sales in three relatively brief selling periods means that our performance is more susceptible to disruptions.
A substantial portion of our sales are derived from three selling periods—Holiday (Christmas), Valentine's Day and Mother's Day. Because of the briefness of these three selling periods, the opportunity for sales to recover in the event of a disruption or other difficulty is limited, and the impact of disruptions and difficulties can be significant. For instance, adverse weather (such as a blizzard or hurricane), a significant interruption in the receipt of products (whether because of vendor or other product problems), or a sharp decline in mall traffic occurring during one of these selling periods could materially impact sales for the affected period and, because of the importance of each of these selling periods, commensurately impact overall sales and earnings.
Most of our sales are of products that include diamonds, precious metals and other commodities. A substantial portion of our purchases and sales occur outside the United States. Fluctuations in the availability and pricing of commodities or exchange rates could impact our ability to obtain, produce and sell products at favorable prices.
The supply and price of diamonds in the principal world market are significantly influenced by a single entity, which has traditionally controlled the marketing of a substantial majority of the world's supply of diamonds and sells rough diamonds to worldwide diamond cutters at prices determined in its sole discretion. The availability of diamonds also is somewhat dependent on the political conditions in
9
diamond-producing countries and on the continuing supply of raw diamonds. Any sustained interruption in this supply could have an adverse affect on our business.
We also are affected by fluctuations in the price of diamonds, gold and other commodities. A significant change in prices of key commodities could adversely affect our business by reducing operating margins or decreasing consumer demand if retail prices are increased significantly. In addition, foreign currency exchange rates and fluctuations impact costs and cash flows associated with our Canadian operations and the acquisition of inventory from international vendors.
In addition, a substantial portion of our raw materials and finished goods are sourced in countries generally described as having developing economies. Any instability in these economies could result in an interruption of our supplies, increases in costs, legal challenges and other difficulties.
Our sales are dependent upon mall traffic.
Our stores and kiosks are located primarily in shopping malls throughout the U.S., Canada and Puerto Rico. Our success is in part dependent upon the continued popularity of malls as a shopping destination and the ability of malls, their tenants and other mall attractions to generate customer traffic. Accordingly, a significant decline in this popularity, especially if it is sustained, would substantially harm our sales and earnings. In addition, even assuming this popularity continues, mall traffic can be negatively impacted by weather, gas prices and similar factors.
We operate in a highly competitive and fragmented industry.
The retail jewelry business is highly competitive and fragmented, and we compete with nationally recognized jewelry chains as well as a large number of independent regional and local jewelry retailers and other types of retailers who sell jewelry and gift items, such as department stores and mass merchandisers. We also compete with internet sellers of jewelry. Because of the breadth and depth of this competition, we are constantly under competitive pressure that both constrains pricing and requires extensive merchandising efforts in order for us to remain competitive.
Any failure by us to manage our inventory effectively will negatively impact sales and earnings.
We purchase much of our inventory well in advance of each selling period. In the event we misjudge consumer preferences or demand, we will experience lower sales than expected and will have excessive inventory that may need to be written down in value or sold at prices that are less than expected, which could have a material adverse impact on our business and financial condition.
Any failure of our pricing and promotional strategies to be as effective as desired will negatively impact our sales and earnings.
We set the prices for our products and establish product specific and store-wide promotions in order to generate store traffic and sales. While these decisions are intended to maximize our sales and earnings, in some instances they do not. For instance, promotions, which can require substantial lead time, may not be as effective as desired or may prove unnecessary in certain economic circumstances. Where we have implemented a pricing or promotional strategy that does not work as expected, our sales and earnings will be adversely impacted.
Because of our dependence upon a small concentrated number of landlords for a substantial number of our locations, any significant erosion of our relationships with those landlords or their financial condition would negatively impact our ability to obtain and retain store locations.
We are significantly dependent on our ability to operate stores in desirable locations with capital investment and lease costs that allow us to earn a reasonable return on our locations. We depend on the leasing market and our landlords to determine supply, demand, lease cost and operating costs and conditions. We cannot be certain as to when or whether desirable store locations will become or remain available to us at reasonable lease and operating costs. Several large landlords dominate the ownership of
10
prime malls, and we are dependent upon maintaining good relations with those landlords in order to obtain and retain store locations on optimal terms. From time to time, we do have disagreements with our landlords and a significant disagreement, if not resolved, could have an adverse impact on our business. In addition, any financial weakness on the part of our landlords could adversely impact us in a number of ways, including decreased marketing by the landlords and the loss of other tenants that generate mall traffic.
Changes in regulatory requirements relating to the extension of credit may increase the cost of or adversely affect our operations.
Our operations are affected by numerous U.S. and Canadian federal and state or provincial laws that impose disclosure and other requirements upon the origination, servicing and enforcement of credit accounts and limitations on the maximum aggregate amount of finance charges that may be charged by a credit provider. Any change in the regulation of credit (including changes in the application of current laws) which would materially limit the availability of credit to our customer base could adversely affect our sales and earnings.
Any disruption in, or changes to, our private label credit card arrangement with Citibank, N.A. may adversely affect our ability to provide consumer credit and write credit insurance.
Under arrangements with Citibank, N.A. and one of its subsidiaries (collectively, "Citibank"), Citibank provides financing for our customers to purchase merchandise through private label credit cards. The arrangement also enables us to write credit insurance. Customers use our Citibank arrangements to pay for approximately 40 percent of purchases in the U.S. and approximately 30 percent of purchases in Canada. Under the agreements governing our arrangement, our Canadian and U.S. subsidiaries must satisfy various financial and other covenants. We recently amended these arrangements in order to obtain relief from certain covenants that we did not meet. Any disruption in our arrangement with Citibank, particularly in the current credit market in which replacing Citibank might be difficult, would have an adverse effect on our business, especially to the extent that it materially limits credit availability to our customer base. See Part II, Item 7, "Management's Discussion and Analysis of Financial Condition and Results of Operations" for more detailed information related to the Citibank agreement.
We are dependent upon our revolving credit agreement for our liquidity needs.
We have a revolving credit facility with a syndicate of banks led by Bank of America that contains various financial and other covenants. See Part II, Item 7, "Management's Discussion and Analysis of Financial Condition and Results of Operations." Should we be unable to fulfill the covenants contained in the facility, or should the facility not be renewed or replaced when it matures in August 2011, we would be unable to fund our operations without a significant restructuring of our business.
If the credit markets continue to deteriorate, our ability to obtain the financing needed to operate our business could be adversely impacted.
We utilize a revolving credit facility to finance our working capital requirements, including the purchase of inventory, among other things. If our ability to obtain the financing needed to meet these requirements was adversely impacted as a result of continued deterioration in the credit markets, our business could be significantly impacted. In addition, the amount of available borrowings under our credit facility is based, in part, on the appraised liquidation value of our inventory. Any declines in the appraised value of our inventory could impact our ability to obtain the financing necessary to operate our business.
Acquisitions and dispositions involve special risk, including the risk that we may not be able to complete proposed acquisitions or dispositions or that such transactions may not be beneficial to us.
We have made significant acquisitions and dispositions in the past and may in the future make additional acquisitions and dispositions. Difficulty integrating an acquisition into our existing infrastructure and operations may cause us to fail to realize expected return on investment through revenue increases,
11
cost savings, increases in geographic or product presence and customer reach, and/or other projected benefits from the acquisition. In addition, we may not achieve anticipated cost savings or may be unable to find attractive investment opportunities for funds received in connection with a disposition. Additionally, attractive acquisition or disposition opportunities may not be available at the time or pursuant to terms acceptable to us and we may be unable to complete acquisitions or dispositions.
Ineffective accounting controls can have adverse impacts on the Company.
We recently identified two material weaknesses in our internal control over financial reporting. See "Management's Report on Internal Control Over Financial Reporting." While we are in the process of remediating these weaknesses, and while we concluded that the financial statements contained in this report fairly presented in all material respects our financial condition, results of operations and cash flows under generally accepted accounting principles, material weaknesses can result in a range of adverse impacts to us, including increased audit and compliance costs and the loss of investor confidence in our financial reports.
Changes in estimates, assumptions and judgments made by management related to our evaluation of goodwill and store impairments could significantly affect our financial results.
Evaluating the need for goodwill and store impairments is highly complex and involves many subjective estimates, assumptions and judgments by our management. For instance, management makes estimates and assumptions with respect to future cash flow projections, terminal growth rates, discount rates and long-term business plans. If our actual results are not consistent with our estimates, assumptions and judgments by our management, we may be required to recognize additional impairments.
Additional factors that may adversely affect our financial performance.
Increases in expenses that are beyond our control including items such as increases in interest rates, inflation, fluctuations in foreign currency rates, higher tax rates and changes in laws and regulations, may negatively impact our operating results.
ITEM 1B. UNRESOLVED STAFF COMMENTS
Not applicable.
We lease a 430,000 square foot facility, which serves as our corporate headquarters ("Store Support Center") and primary distribution facility. The lease for this facility extends through March 2018. The facility is located in Las Colinas, a planned business development in Irving, Texas, near the Dallas/Fort Worth International Airport. Our Canadian distribution and production operations are conducted in a leased 26,280 square foot facility in Toronto, Ontario with a lease term through November 2014. We also lease a 20,000 square foot distribution and warehousing facility in Irving, Texas, with a lease term through June 2010, that serves as the Piercing Pagoda distribution center.
We rent our store retail space under leases that generally range in terms from 5 to 10 years and may contain minimum rent escalation clauses, while kiosk leases generally range from three to five years. Most of the store leases provide for the payment of base rentals plus real estate taxes, insurance, common area maintenance fees and merchants association dues, as well as percentage rents based on the store's gross sales.
We lease 18 percent of our store and kiosk locations from Simon Property Group and 14 percent of our store and kiosk locations from General Growth Management, Inc. Otherwise, we have no relationship with any lessor amounting to 10 percent or more of our store and kiosk locations.
12
The following table indicates the expiration dates of the current terms of our leases as of July 31, 2009:
Term Expires
|
Stores | Kiosks | Other(a) | Total | Percentage of Total | |||||||||||
|---|---|---|---|---|---|---|---|---|---|---|---|---|---|---|---|---|
2010 |
215 | 339 | 2 | 556 | 28.8 | % | ||||||||||
2011 |
185 | 142 | — | 327 | 16.9 | % | ||||||||||
2012 |
133 | 116 | 1 | 250 | 12.9 | % | ||||||||||
2013 |
87 | 63 | — | 150 | 7.7 | % | ||||||||||
2014 and thereafter |
627 | 24 | 2 | 653 | 33.7 | % | ||||||||||
|
1,247 | 684 | 5 | 1,936 | 100.0 | % | ||||||||||
- (a)
- Other includes the Store Support Center, warehouses, distribution centers and storage facilities.
During fiscal 2009 we closed a substantial number of stores. For additional discussion regarding these closures, see Part II, Item 7, "Management's Discussion and Analysis of Financial Condition and Results of Operations."
Management believes substantially all of the store leases expiring in fiscal year 2010 that it wishes to renew (including leases which expired earlier and are currently being operated under month-to-month extensions) will be renewed. Generally, although rents continue to increase, we otherwise expect leases will be renewed on terms not materially less favorable to us than the terms of the expiring or expired leases. Management believes our facilities are suitable and adequate for our business as presently conducted.
ITEM 3. LEGAL PROCEEDINGS AND OTHER MATTERS
As a result of the discovery of the matters disclosed in the Company's Form 8-K filed on September 18, 2009, the Audit Committee of the Board of Directors retained outside counsel to review those matters. The review has been concluded and resulted in the restatement of the Company's financial statements, as reported herein. The Audit Committee is monitoring the remediation of the material weaknesses in internal control over financial reporting, as discussed in Exhibit F-1 to this report.
Subsequent to the Company's disclosure in its Form 8-K filed on September 18, 2009 that it would restate certain financial statements, the Staff of the Fort Worth, Texas office of the Securities and Exchange Commission notified the Company that it had begun an investigation and requested certain information relating to the matters disclosed in the Company's Form 8-K. The Company is cooperating with the Staff's investigation. The Company cannot predict the outcome or duration of the SEC investigation, but at this time, the Company does not believe that the investigation will have a material effect on the Company's financial condition or results of operations.
Additional information regarding legal proceedings is incorporated by reference from Note 18 to our consolidated financial statements set forth, under the heading, "Contingencies," in Part IV of this report.
ITEM 4. SUBMISSION OF MATTERS TO A VOTE OF SECURITY HOLDERS
Not applicable.
13
ITEM 5. MARKET FOR THE REGISTRANT'S COMMON EQUITY, RELATED STOCKHOLDER MATTERS AND ISSUER PURCHASES OF EQUITY SECURITIES
Our common stock is listed on the New York Stock Exchange under the symbol "ZLC." The following table sets forth the high and low sale prices as reported on the NYSE for our common stock for each fiscal quarter during the two most recent fiscal years.
| |
2009 | 2008 | |||||||||||
|---|---|---|---|---|---|---|---|---|---|---|---|---|---|
| |
High | Low | High | Low | |||||||||
First |
$ | 30.89 | $ | 14.03 | $ | 25.89 | $ | 20.36 | |||||
Second |
$ | 15.99 | $ | 1.17 | $ | 21.66 | $ | 12.81 | |||||
Third |
$ | 5.25 | $ | 0.92 | $ | 22.20 | $ | 15.72 | |||||
Fourth |
$ | 5.92 | $ | 3.04 | $ | 22.18 | $ | 16.72 | |||||
As of October 19, 2009, the Company's outstanding shares of common stock were held by approximately 504 holders of record. We have not paid dividends on the common stock since its initial issuance on July 30, 1993, and do not anticipate paying dividends on the common stock in the foreseeable future. In addition, our long-term debt limits our ability to pay dividends or repurchase our common stock if borrowing availability under our $500 million revolving credit facility is less than $75 million. At July 31, 2009, we had borrowing availability under the revolving credit agreement of approximately $136 million. See "Management's Discussion and Analysis of Financial Condition and Results of Operations—Liquidity and Capital Resources" and "Notes to the Consolidated Financial Statements—Debt."
14
Corporate Performance Graph
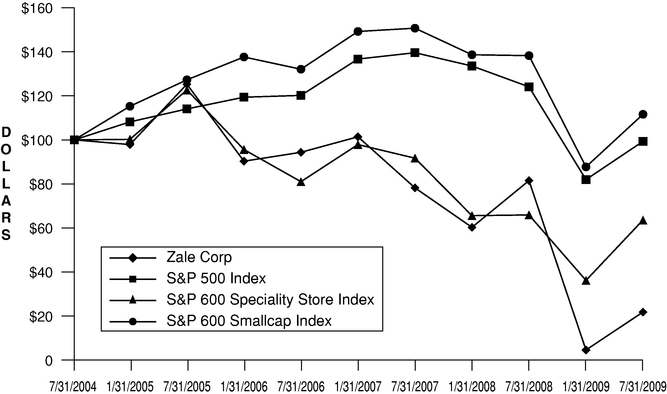
The following graph shows a comparison of cumulative total returns for the Company, the S&P 500 Index, the S&P 600 Specialty Store Index and the S&P 600 Smallcap Index for the period from August 1, 2004 to July 31, 2009. The comparison assumes $100 was invested on August 1, 2004 in the Company's common stock and in each of the three indices and, for the S&P 500 Index, the S&P 600 Specialty Store Index and the S&P 600 Smallcap Index, assumes reinvestment of dividends. The Company has not paid any dividends during this period.
| |
7/31/04 | 1/31/05 | 7/31/05 | 1/31/06 | 7/31/06 | 1/31/07 | 7/31/07 | 1/31/08 | 7/31/08 | 1/31/09 | 7/31/09 | |||||||||||||||||||||||
|---|---|---|---|---|---|---|---|---|---|---|---|---|---|---|---|---|---|---|---|---|---|---|---|---|---|---|---|---|---|---|---|---|---|---|
Zale Corporation |
$ | 100.00 | $ | 97.86 | $ | 125.28 | $ | 90.31 | $ | 94.36 | $ | 101.40 | $ | 78.22 | $ | 60.28 | $ | 81.50 | $ | 4.57 | $ | 21.81 | ||||||||||||
S&P 500 |
100.00 | 108.16 | 114.05 | 119.38 | 120.19 | 136.71 | 139.58 | 133.55 | 124.09 | 81.96 | 99.32 | |||||||||||||||||||||||
S&P Smallcap Spec |
100.00 | 100.24 | 122.65 | 95.61 | 81.02 | 97.87 | 91.68 | 65.58 | 65.91 | 36.18 | 63.59 | |||||||||||||||||||||||
S&P 600 Smallcap |
100.00 | 115.25 | 127.27 | 137.64 | 132.09 | 149.23 | 150.72 | 138.66 | 138.25 | 87.73 | 111.61 | |||||||||||||||||||||||
The stock price performance depicted in the above graph is not necessarily indicative of future price performance. The Corporate Performance Graph shall not be deemed "soliciting material" or to be "filed" with the SEC, nor shall such information be incorporated by reference into any future filing by the Company under the Securities Act or the Exchange Act, except to the extent that the Company specifically incorporates the graph by reference in such filing.
15
ITEM 6. SELECTED FINANCIAL DATA
The following selected financial data is qualified in its entirety by our consolidated financial statements (and the related notes thereto) contained elsewhere in this Annual Report on Form 10-K and should be read in conjunction with "Management's Discussion and Analysis of Financial Condition and Results of Operations." The statement of operations and balance sheet data for each of the fiscal years ended July 31, 2009 and 2008 has been derived from our audited consolidated financial statements. The statement of operations and balance sheet data for each of the fiscal years ended July 31, 2007, 2006 and 2005 has been derived from our unaudited consolidated financial statements (see Note 2 to our consolidated financial statements for more detailed information related to the restatement). During fiscal year 2008, we sold Bailey Banks & Biddle. As a result, their operations are reflected as discontinued operations in the following consolidated statements of operations. All amounts in the following table are in thousands, except per share amounts.
| |
Year Ended July 31, | |||||||||||||||||
|---|---|---|---|---|---|---|---|---|---|---|---|---|---|---|---|---|---|---|
| |
2009 | 2008 | 2007 | 2006 | 2005 | |||||||||||||
| |
|
As Restated |
As Restated |
As Restated |
As Restated |
|||||||||||||
Revenues |
$ | 1,779,744 | $ | 2,138,041 | $ | 2,152,785 | $ | 2,153,955 | $ | 2,062,196 | ||||||||
Costs and expenses: |
||||||||||||||||||
Cost of sales(a) |
948,572 | 1,089,553 | 1,029,553 | 1,044,876 | 978,557 | |||||||||||||
Selling, general and administrative(b) |
927,249 | 985,028 | 967,906 | 967,406 | 860,268 | |||||||||||||
Cost of insurance operations |
7,000 | 6,744 | 6,949 | 6,878 | 6,196 | |||||||||||||
Depreciation and amortization |
58,947 | 60,244 | 56,595 | 54,670 | 52,676 | |||||||||||||
Other charges and gains(c) |
70,095 | (10,700 | ) | 9,658 | (1,900 | ) | 1,067 | |||||||||||
Operating (loss) earnings |
(232,119 | ) | 7,172 | 82,124 | 82,025 | 163,432 | ||||||||||||
Interest expense |
10,399 | 12,364 | 18,969 | 11,185 | 7,725 | |||||||||||||
Other income |
— | (3,500 | ) | — | — | — | ||||||||||||
(Loss) earnings before income taxes |
(242,518 | ) | (1,692 | ) | 63,155 | 70,840 | 155,707 | |||||||||||
Income tax (benefit) expense |
(53,015 | ) | 4,761 | 16,812 | 16,725 | 57,913 | ||||||||||||
(Loss) earnings from continuing operations |
(189,503 | ) | (6,453 | ) | 46,343 | 54,115 | 97,794 | |||||||||||
Earnings (loss) from discontinued operations, net of taxes |
— | 7,084 | 11,143 | (6,061 | ) | 8,431 | ||||||||||||
Net (loss) earnings |
$ | (189,503 | ) | $ | 631 | $ | 57,486 | $ | 48,054 | $ | 106,225 | |||||||
Basic net (loss) earnings per common share: |
||||||||||||||||||
(Loss) earnings from continuing operations |
$ | (5.94 | ) | $ | (0.15 | ) | $ | 0.95 | $ | 1.11 | $ | 1.91 | ||||||
Earnings (loss) from discontinued operations |
— | 0.16 | 0.23 | (0.13 | ) | 0.16 | ||||||||||||
Basic net (loss) earnings per share |
$ | (5.94 | ) | $ | 0.01 | $ | 1.18 | $ | 0.98 | $ | 2.07 | |||||||
Diluted net (loss) earnings per common share: |
||||||||||||||||||
(Loss) earnings from continuing operations |
$ | (5.94 | ) | $ | (0.15 | ) | $ | 0.95 | $ | 1.10 | $ | 1.88 | ||||||
Earnings (loss) from discontinued operations |
— | 0.16 | 0.22 | (0.12 | ) | 0.16 | ||||||||||||
Diluted net (loss) earnings per share |
$ | (5.94 | ) | $ | 0.01 | $ | 1.17 | $ | 0.98 | $ | 2.04 | |||||||
Weighted average number of common shares outstanding: |
||||||||||||||||||
Basic |
31,899 | 42,361 | 48,694 | 48,808 | 51,280 | |||||||||||||
Diluted |
31,899 | 42,476 | 48,995 | 49,211 | 51,975 | |||||||||||||
Balance Sheet Data |
||||||||||||||||||
Working capital |
$ | 460,885 | $ | 613,665 | $ | 774,778 | $ | 628,743 | $ | 596,736 | ||||||||
Total assets |
1,230,972 | 1,415,260 | 1,600,144 | 1,449,639 | 1,371,878 | |||||||||||||
Long-term debt |
310,500 | 326,306 | 227,306 | 202,813 | 129,800 | |||||||||||||
Total stockholders investment |
373,793 | 566,471 | 880,414 | 783,960 | 802,763 | |||||||||||||
- (a)
- In
fiscal years 2009 and 2006, cost of sales includes charges of $13.5 and $18.7 million, respectively, related to inventory impairments.
- (b)
- Fiscal year 2006 amount includes $12.1 million in executive severance costs.
16
- (c)
- Fiscal year 2009 includes $70.1 million related to costs associated with store closures, store impairments, goodwill impairments and reserves related to the Bailey Banks & Biddle contingent lease obligations. Fiscal year 2008 includes a $12.6 million benefit associated with a change in our vacation policy and a $1.9 million store impairment charge. Fiscal year 2007 includes a $7.2 million derivative loss and a $2.5 million charge related to store impairments. Fiscal years 2006 and 2005 include asset impairment charges.
Segment Data
We report our business under three segments: Fine Jewelry, Kiosk Jewelry and All Other. The All Other segment includes insurance and reinsurance operations. Operating earnings by segment are calculated before unallocated corporate overhead, interest and taxes but include an internal charge for inventory carrying cost to evaluate segment profitability. Unallocated costs are before income taxes and include corporate employee related costs, administrative costs, information technology costs, corporate facilities costs and depreciation and amortization. All amounts in the following table are in thousands.
| |
Year Ended July 31, | |||||||||||||||||
|---|---|---|---|---|---|---|---|---|---|---|---|---|---|---|---|---|---|---|
Selected Financial Data by Segment
|
2009 | 2008 | 2007 | 2006 | 2005 | |||||||||||||
| |
|
As Restated |
As Restated |
As Restated |
As Restated |
|||||||||||||
Revenues: |
||||||||||||||||||
Fine Jewelry(a) |
$ | 1,535,626 | $ | 1,876,170 | $ | 1,876,580 | $ | 1,864,195 | $ | 1,768,391 | ||||||||
Kiosk(b) |
232,809 | 249,489 | 262,627 | 276,619 | 280,897 | |||||||||||||
All Other |
11,309 | 12,382 | 13,578 | 13,141 | 12,908 | |||||||||||||
Total revenues |
$ | 1,779,744 | $ | 2,138,041 | $ | 2,152,785 | $ | 2,153,955 | $ | 2,062,196 | ||||||||
Depreciation and amortization: |
||||||||||||||||||
Fine Jewelry |
$ | 42,407 | $ | 42,832 | $ | 39,933 | $ | 38,172 | $ | 37,246 | ||||||||
Kiosk |
4,899 | 5,296 | 5,625 | 5,571 | 4,708 | |||||||||||||
All Other |
— | — | — | — | — | |||||||||||||
Unallocated |
11,641 | 12,116 | 11,037 | 10,927 | 10,722 | |||||||||||||
Total depreciation and amortization |
$ | 58,947 | $ | 60,244 | $ | 56,595 | $ | 54,670 | $ | 52,676 | ||||||||
Operating (loss) earnings: |
||||||||||||||||||
Fine Jewelry(c) |
$ | (192,683 | ) | $ | 18,909 | $ | 100,531 | $ | 87,450 | $ | 144,059 | |||||||
Kiosk(d) |
2,465 | 9,905 | 6,170 | 19,212 | 29,030 | |||||||||||||
All Other |
5,706 | 5,641 | 6,780 | 6,443 | 6,824 | |||||||||||||
Unallocated(e) |
(47,607 | ) | (27,283 | ) | (31,357 | ) | (31,080 | ) | (16,481 | ) | ||||||||
Total operating (loss) earnings |
$ | (232,119 | ) | $ | 7,172 | $ | 82,124 | $ | 82,025 | $ | 163,432 | |||||||
Assets(f): |
||||||||||||||||||
Fine Jewelry(g) |
$ | 868,227 | $ | 987,369 | $ | 1,250,967 | $ | 1,108,569 | $ | 1,099,062 | ||||||||
Kiosk(h) |
107,457 | 118,601 | 120,660 | 119,395 | 112,105 | |||||||||||||
All Other |
24,842 | 27,234 | 25,406 | 22,228 | 23,505 | |||||||||||||
Unallocated |
230,446 | 282,056 | 203,111 | 199,447 | 137,206 | |||||||||||||
Total assets |
$ | 1,230,972 | $ | 1,415,260 | $ | 1,600,144 | $ | 1,449,639 | $ | 1,371,878 | ||||||||
Capital expenditures: |
||||||||||||||||||
Fine Jewelry |
$ | 18,702 | $ | 59,289 | $ | 47,433 | $ | 48,644 | $ | 54,855 | ||||||||
Kiosk |
420 | 3,266 | 3,036 | 7,750 | 8,650 | |||||||||||||
All Other |
— | — | — | — | — | |||||||||||||
Unallocated |
9,235 | 22,582 | 28,791 | 20,026 | 14,887 | |||||||||||||
Total capital expenditures |
$ | 28,357 | $ | 85,137 | $ | 79,260 | $ | 76,420 | $ | 78,392 | ||||||||
- (a)
- Includes
$256.7, $321.9, $272.0, $229.6 and $198.3 million in fiscal years 2009, 2008, 2007, 2006 and 2005, respectively, related to foreign
operations.
- (b)
- Includes $2.8, $7.7 and $6.6 million in fiscal years 2007, 2006 and 2005, respectively, related to foreign operations. All foreign locations were closed in fiscal year 2007.
17
- (c)
- Fiscal
year 2009 includes $46.5 million related to charges associated with store closures, store impairments and goodwill impairments. Fiscal year
2009 also includes $13.5 million related to an inventory impairment charge. Fiscal year 2008 includes a $1.9 million store impairment charge. Fiscal year 2007 includes a
$2.0 million store impairment charge. Fiscal year 2006 includes $22.1 million related to inventory impairment and asset impairment charges.
- (d)
- Fiscal
year 2009 includes $0.4 million related to costs associated with store closures. Fiscal year 2007 includes a $0.5 million charge
related to store impairments. Fiscal year 2006 includes $1.2 million related to inventory impairment and asset impairment charges.
- (e)
- Fiscal
year 2009 includes a $23.2 million charge related to the Bailey Banks & Biddle contingent lease obligations. Fiscal year 2008 includes
a $12.6 million benefit associated with a change in our vacation policy. Fiscal year 2007 includes a $7.2 million derivative loss. Fiscal year 2006 includes $5.3 million related
to asset impairment charges, a $13.4 million benefit related to the settlement of certain retirement plan obligations, $12.1 million for executive severance, $2.4 million related
to accrued percentage rent and a $1.7 million derivative loss. Also includes credits of $60.1, $66.8, $66.7, $57.0 and $56.1 million in fiscal years 2009, 2008, 2007, 2006, and 2005,
respectively, to offset internal carrying costs charged to the segments.
- (f)
- Assets
allocated to segments include fixed assets, inventories, goodwill and investments held by our insurance operations. Unallocated assets include cash,
prepaid assets such as rent, corporate office improvements and technology infrastructure.
- (g)
- Includes
$40.6, $47.0, $37.5, $28.8, and $27.2 million of fixed assets in fiscal years 2009, 2008, 2007, 2006 and 2005, respectively, related to
foreign operations.
- (h)
- Includes $0.5 and $0.4 million of fixed assets in fiscal years 2006 and 2005, respectively, related to foreign operations. All foreign locations were closed in fiscal year 2007.
ITEM 7. MANAGEMENT'S DISCUSSION AND ANALYSIS OF FINANCIAL CONDITION AND RESULTS OF OPERATIONS
For important information regarding forward-looking statements made in this Management's Discussion and Analysis of Financial Condition and Results of Operations see "Item 1A—Risk Factors."
On September 17, 2009, management of Zale Corporation (the "Company") and the Audit Committee of the Company's Board of Directors concluded that the Company's previously issued consolidated financial statements for fiscal years 2008 and prior periods required restatement as a result of adjustments associated with advertising costs, intercompany accounts receivable, depository bank accounts, federal income taxes and personal property tax reserves. The cumulative impact of the adjustments totaled $35.4 million, $32.2 million after taxes, as of July 31, 2008 and consisted of the following items:
- •
- A $23.7 million charge, $20.4 million after taxes, related primarily to prepaid advertising costs.
Previously, certain advertising costs were recorded as prepaid advertising subsequent to the period in which the advertisement ran. The charge includes $21.7 million related to fiscal year 2007
and prior periods.
- •
- A $5.9 million charge, $5.1 million after taxes, related to an intercompany accounts receivable associated
with our wholly owned insurance subsidiaries. The Company pays certain expenses on behalf of its insurance subsidiaries and is subsequently reimbursed by those subsidiaries. The charge was the result
of the Company recording accounts receivable in excess of the actual expenses incurred and included $5.9 million related to fiscal year 2007 and prior periods.
- •
- A $4.2 million charge, $4.6 million after taxes, to correct amounts previously recorded with respect to the
reconciliation of certain depository bank accounts. The charge corrected the recording of cash receipts from Bailey Banks & Biddle subsequent to disposition of the brand in fiscal year 2008 and
certain other errors associated with our cash reconciliation system. The charge includes $1.5 million related to fiscal year 2007 and prior periods.
- •
- A $3.9 million charge for federal income taxes resulting primarily from an incorrect determination made during fiscal year 2008 related to whether earnings from our Puerto Rican based operations could be utilized to offset U.S. operating losses that were expiring.
18
- •
- A $2.3 million benefit, $1.8 million after taxes, related to personal property tax reserves. The benefit was the result of excess reserves that were not adjusted on a timely basis following final payments and includes $2.1 million related to fiscal year 2007 and prior periods.
The table below provides a summary of certain line items from our consolidated statements of operations and balance sheets for fiscal years 2005 through 2008 that were affected by this restatement. The consolidated statements of operations summary and consolidated balance sheet data for the fiscal year ended July 31, 2008 have been derived from our audited consolidated financial statements. The consolidated statements of operations summary and consolidated balance sheet data for each of the fiscal years ended July 31, 2007, 2006 and 2005 have been derived from our unaudited consolidated financial statements (see Note 2 to our consolidated financial statements for more detailed information related to the restatement of certain previously issued consolidated financial statements).
| |
Consolidated Statements of Operations Summary (in thousands) |
|||||||||||||
|---|---|---|---|---|---|---|---|---|---|---|---|---|---|---|
| |
Year Ended July 31, | |||||||||||||
| |
2008 | 2007 | 2006 | 2005 | ||||||||||
As previously reported: |
||||||||||||||
Earnings before income taxes |
$ | 2,867 | $ | 65,892 | $ | 79,889 | $ | 156,257 | ||||||
Income tax (benefit) expense |
(850 | ) | 17,783 | 20,206 | 57,913 | |||||||||
Earnings from continuing operations |
$ | 3,717 | $ | 48,109 | $ | 59,683 | $ | 98,344 | ||||||
Adjustments: |
||||||||||||||
(Loss) earnings before income taxes |
$ | (4,559 | ) | $ | (2,737 | ) | $ | (9,049 | ) | $ | (550 | ) | ||
Income tax expense |
5,611 | (971 | ) | (3,481 | ) | — | ||||||||
(Loss) earnings from continuing operations |
$ | (10,170 | ) | $ | (1,766 | ) | $ | (5,568 | ) | $ | (550 | ) | ||
As restated: |
||||||||||||||
(Loss) earnings before income taxes |
$ | (1,692 | ) | $ | 63,155 | $ | 70,840 | $ | 155,707 | |||||
Income tax expense |
4,761 | 16,812 | 16,725 | 57,913 | ||||||||||
(Loss) earnings from continuing operations |
$ | (6,453 | ) | $ | 46,343 | $ | 54,115 | $ | 97,794 | |||||
| |
Consolidated Balance Sheet Data (in thousands) |
|||||||||||||
|---|---|---|---|---|---|---|---|---|---|---|---|---|---|---|
| |
As of July 31, | |||||||||||||
| |
2008 | 2007 | 2006 | 2005 | ||||||||||
As previously reported: |
||||||||||||||
Total current assets |
$ | 990,206 | $ | 1,172,318 | $ | 1,049,244 | $ | 973,068 | ||||||
Total assets |
1,442,238 | 1,613,946 | 1,462,568 | 1,380,900 | ||||||||||
Total current liabilities |
347,847 | 374,458 | 400,025 | 361,507 | ||||||||||
Total stockholders' investment |
598,800 | 902,573 | 804,353 | 817,588 | ||||||||||
Adjustments: |
||||||||||||||
Total current assets |
$ | (23,343 | ) | $ | (14,725 | ) | $ | (12,929 | ) | $ | (9,022 | ) | ||
Total assets |
(26,978 | ) | (13,802 | ) | (12,929 | ) | (9,022 | ) | ||||||
Total current liabilities |
5,351 | 8,357 | 7,547 | 5,803 | ||||||||||
Total stockholders' investment |
(32,329 | ) | (22,159 | ) | (20,393 | ) | (14,825 | ) | ||||||
As restated: |
||||||||||||||
Total current assets |
$ | 966,863 | $ | 1,157,593 | $ | 1,036,315 | $ | 964,046 | ||||||
Total assets |
1,415,260 | 1,600,144 | 1,449,639 | 1,371,878 | ||||||||||
Total current liabilities |
353,198 | 382,815 | 407,572 | 367,310 | ||||||||||
Total stockholders' investment |
566,471 | 880,414 | 783,960 | 802,763 | ||||||||||
19
Overview
We are a leading specialty retailer of fine jewelry in North America. At July 31, 2009, we operated 1,247 fine jewelry stores and 684 kiosks located primarily in shopping malls throughout the United States of America, Canada and Puerto Rico. Our operations are divided into three business segments: Fine Jewelry, Kiosk Jewelry and All Other.
The Fine Jewelry segment focuses on diamond product, but differentiates its brands through merchandise assortments and marketing. The Kiosk Jewelry segment reaches the opening price point of fine jewelry customers primarily through mall-based kiosks in the United States of America operating primarily under the name Piercing Pagoda®. The All Other segment consists of our insurance operations, which provide insurance and reinsurance facilities for various types of insurance coverage offered primarily to our private label credit card customers.
Our results for fiscal year 2009 were significantly below expectations. Comparable store sales decreased by approximately 17 percent reflecting the extremely challenging economic environment and gross margins decreased by 150 basis points to approximately 48 percent due primarily to an increase in store-wide discounts during the 2008 Holiday season. The 150 basis point decline in gross margins excludes the 80 basis point impact of the inventory impairment charge recorded in fiscal year 2009. After the 2008 Holiday season, we returned to a more disciplined promotional strategy resulting in gross margins of approximately 50 percent during the third and fourth quarters of fiscal year 2009 excluding the inventory impairment charge, as compared with approximately 45 percent during the Holiday season. In addition, during fiscal year 2009 we made significant progress in achieving the initiatives we began in the second half of fiscal year 2008 to reduce inventory and costs. As a result, we generated approximately $32 million of cash flows from operating activities and reduced debt by $22 million during the fourth quarter of fiscal year 2009. We expect to continue to realize the benefits from these initiatives during fiscal year 2010.
We believe that the three initiatives we introduced in fiscal year 2008 remain critical to our long-term success. The initiatives include (1) focusing on our core customer by providing clarity and value through compelling merchandise assortments, cleaner in-store presentation and an improved marketing message, (2) enhancing our operational effectiveness to ensure that our people and processes are aligned and focused on providing outstanding products and customer service and (3) maintaining financial discipline with a continued focus on free cash flow generation and prudent use of capital. We believe that the most important of these initiatives under the current economic environment is maintaining financial discipline. Accordingly, over the last two fiscal years we have accomplished the following under this initiative:
- •
- In February 2009, we announced inventory and cost reduction programs expected to be realized through fiscal 2010 totaling
approximately $75 million and $65 million, respectively.
- –
- The inventory reductions are to be achieved by selling and not replenishing inventory in closed stores and improved
productivity through more efficient store level allocation at existing stores. The reductions achieved as of July 31, 2009 totaled approximately $54 million.
- –
- As of July 31, 2009, the cost savings realized since inception of the initiative totaled approximately
$26 million and consist primarily of selling, general and administrative expenses.
- •
- In February 2008, we announced plans to permanently reduce inventory by $100 million and to achieve cost savings
totaling in excess of $65 million.
- –
- The permanent inventory reductions of approximately $100 million were achieved as of July 2008.
- –
- As of July 31, 2009, the cost savings realized since inception of the initiative totaled approximately $62 million and consist primarily of selling, general and administrative expenses. The remaining cost savings will be realized during fiscal 2010.
During the third quarter of fiscal 2009, we began a review of our lease portfolio to accelerate the closure of underperforming locations and to identify opportunities to renegotiate rents under existing leases. The evaluation of our lease portfolio resulted in the closure of 109 fine jewelry stores and 10 kiosks in the fourth quarter of fiscal 2009. We recorded a charge during the fourth quarter associated with the
20
closures totaling $27.0 million consisting, primarily of lease termination costs of $16.1 million, impairments related to long-lived assets of $8.9 million and severance costs of $1.1 million. We closed a total of 191 underperforming locations during calendar year 2009, of which 160 were fine jewelry stores and 31 were kiosks. The 191 closed locations had a negative contribution of approximately $14 million for the twelve months preceding closure and carried approximately $53 million of inventory. We have also finalized agreements or entered into agreements in principle on certain existing stores that will result in a reduction in aggregate rental obligations commencing in fiscal year 2010.
In connection with the sale of the Bailey Banks & Biddle brand in November 2007, the buyer, Finlay Fine Jewelry Corporation ("Finlay"), assumed the obligations for the store operating leases. As a condition of this assignment, we remained contingently liable for the leases for the remainder of the respective current lease terms, which generally ranged from fiscal 2009 through fiscal 2017. The maximum potential liability for base rent payments under the leases totaled approximately $62 million as of July 31, 2009. As of October 29, 2009, we finalized agreements or reached agreements in principle with the landlords to settle the contingent lease obligations for 38 of 45 leases. Settlement discussion with respect to the contingent obligations for the remaining 7 locations are still under negotiation. Base rents for the remaining 7 stores totaled approximately $28 million as of July 31, 2009. On August 5, 2009, Finlay filed for Chapter 11 bankruptcy protection and subsequently decided to liquidate. We recorded a $23.2 million charge during the fourth quarter of fiscal 2009 associated with all 45 Bailey Banks & Biddle locations. The charge was based on the preliminary agreements reached with the landlords and expectations of future payments required to settle the contingent obligations for the remaining 7 leases.
During the fiscal year ended July 31, 2009, the average Canadian currency rate depreciated by approximately 10 percent relative to the U.S. dollar. Due to our Canadian operations being reported at the average U.S. dollar equivalent, the depreciation in the Canadian dollar resulted in a $35.0 million decrease in reported revenues, substantially offset by a decrease in reported cost of sales and selling, general and administrative expenses of $17.2 million and $12.9 million, respectively. In addition, as a result of the depreciation in the Canadian dollar we recorded losses associated with the settlement of Canadian accounts payable totaling $8.6 million during the fiscal year ended July 31, 2009 compared to gains of $1.0 million during the same period in the prior year.
Comparable store sales include internet sales and exclude revenue recognized from warranties and insurance premiums related to credit insurance policies sold to customers who purchase merchandise under our proprietary credit programs. The sales results of new stores are included beginning with their thirteenth full month of operation. The results of stores that have been relocated, renovated or refurbished are included in the calculation of comparable store sales on the same basis as other stores. However, stores closed for more than 90 days due to unforeseen events (e.g., hurricanes, etc.) are excluded from the calculation of comparable store sales.
From time to time, we include non-GAAP measurements of financial information in Management's Discussion and Analysis of Financial Condition and Results of Operations. We use these measurements as part of our evaluation of the performance of the Company. In addition, we believe these measures provide useful information to investors, particularly in evaluating the performance of the Company in the current fiscal year as compared to prior periods.
21
Results of Operations
The following table sets forth certain financial information from our audited consolidated statements of operations expressed as a percentage of revenues and should be read in conjunction with our consolidated financial statements and notes thereto included elsewhere in this Form 10-K. Certain fiscal year 2008 amounts have been restated as a result of the adjustments previously described in Management's Discussion and Analysis of Financial Condition and Results of Operations.
| |
Year Ended July 31, |
||||||||
|---|---|---|---|---|---|---|---|---|---|
| |
2009 | 2008 | |||||||
Revenues |
100.0 | % | 100.0 | % | |||||
Costs and expenses: |
|||||||||
Cost of sales |
53.3 | 51.0 | |||||||
Selling, general and administrative |
52.1 | 46.1 | |||||||
Cost of insurance operations |
0.4 | 0.3 | |||||||
Depreciation and amortization |
3.3 | 2.8 | |||||||
Other charges and gains |
3.9 | (0.5 | ) | ||||||
Operating (loss) earnings |
(13.0 | ) | 0.3 | ||||||
Interest expense |
0.6 | 0.6 | |||||||
Other income |
— | (0.2 | ) | ||||||
Loss before income taxes |
(13.6 | ) | (0.1 | ) | |||||
Income tax (benefit) expense |
(3.0 | ) | 0.2 | ||||||
Loss from continuing operations |
(10.6 | ) | (0.3 | ) | |||||
Earnings from discontinued operations, net of taxes |
— | 0.3 | |||||||
Net (loss) earnings |
(10.6 | )% | — | % | |||||
Year Ended July 31, 2009 Compared to Year Ended July 31, 2008
Revenues. Revenues for fiscal year 2009 were $1,779.7 million, a decrease of 16.8 percent compared to revenues of $2,138.0 million for the same period in the prior fiscal year. Comparable store sales decreased 16.6 percent as compared to the same period in the prior year. The decrease in comparable store sales was driven by a 20.8 percent decrease in the number of customer transactions in our fine jewelry stores, partially offset by an increase in the average transaction price. We attribute the decline in the number of customer transactions primarily to the general decline in the overall retail environment. The decline was also due to a $35.0 million impact associated with the depreciation of the Canadian dollar and a decrease in the number of open stores, partially offset by a $10.6 million increase in revenues recognized related to lifetime warranties.
The Fine Jewelry segment contributed $1,535.6 million of revenues in the fiscal year ended July 31, 2009, a decrease of 18.2 percent as compared to $1,876.2 million for the same period in the prior year.
Revenues include $232.8 million for the Kiosk Jewelry segment compared to $249.5 million in the prior year, representing a decrease of 6.7 percent. The decrease relates primarily to a decline in the number of kiosks to 684 from 739 as of July 31, 2009 and 2008, respectively.
The All Other segment contributed $11.3 million in revenues for the fiscal year ended July 31, 2009 as compared to $12.4 million for the same period in the prior year, representing a decrease of 8.7 percent.
During the fiscal year ended July 31, 2009, we opened 14 stores in the Fine Jewelry segment. In addition, we closed 163 stores in the Fine Jewelry segment and 55 kiosks in the Kiosk Jewelry segment.
22
Cost of Sales. Cost of sales includes cost of merchandise and services sold, as well as receiving and distribution costs. Cost of sales as a percentage of revenues was 53.3 percent for the year ended July 31, 2009, compared to 51.0 percent for the same period in the prior year. The increase is primarily due to an increase in store-wide discounts during the Holiday season and an inventory impairment charge recorded during the fourth quarter of fiscal 2009 totaling approximately 80 basis points associated with our decision to accelerate the sale of certain clearance merchandise. The increase was partially offset by an increase in revenues recognized associated with lifetime warranties.
Our last-in, first-out ("LIFO") inventory charges were $1.0 million and $2.4 million for the fiscal years ended July 31, 2009 and 2008, respectively.
Selling, General and Administrative. Included in selling, general and administrative ("SG&A") are store operating, advertising, buying and general corporate overhead expenses. SG&A was 52.1 percent of revenues for the year ended July 31, 2009, compared to 46.1 percent for the same period in the prior year. On a dollar basis, SG&A decreased by $57.8 million to $927.2 million for the year ended July 31, 2009. The percentage increase is due to lower total revenues during the current year compared to the prior year. The dollar decrease is the result of expense reductions totaling $64.1 million and a $15.1 million decrease in incentive based compensation due to lower sales. The decrease was partially offset by a $6.7 million increase in legal settlement and severance costs and a $9.6 million increase in foreign currency losses.
Depreciation and Amortization. Depreciation and amortization as a percent of revenues for the year ended July 31, 2009 and 2008 was 3.3 percent and 2.8 percent, respectively. The increase is due to lower total revenues during the current year compared to the prior year, partially offset by store closures.
Other Charges and Gains. Other charges and gains for the year ended July 31, 2009 includes a $27.0 million charge associated with store closures, a $23.2 million charge related to the Bailey Banks & Biddle contingent lease obligation, a $14.9 million charge related to the impairment of long-lived assets associated with underperforming stores and a $5.0 million goodwill impairment charge related to a reporting unit in the Fine Jewelry segment. Other charges and gains for the year ended July 31, 2008 includes a $12.6 million benefit related to a change in our vacation policy and a $1.9 million charge related to the impairment of long-lived assets associated with underperforming stores.
Interest Expense. Interest expense as a percent of revenues for the year ended July 31, 2009 and 2008 was flat at 0.6 percent. Interest expense decreased by $2.0 million to $10.4 million for the year ended July 31, 2009. The weighted average effective interest rate decreased from 5.1 percent last year to 2.6 percent this year. The decrease in the weighted average effective interest rate was offset by an increase in average borrowings compared to the same period in the prior year and a decrease in total revenues.
Other Income. During the year ended July 31, 2008, we sold our interest in a diamond known as the "Incomparable Diamond" and recognized a gain of $3.5 million.
Income Tax (Benefit) Expense. The income tax benefit totaled $53.0 million for the year ended July 31, 2009, compared to a $4.8 million income tax expense for the year ended July 31, 2008. The income tax benefit for the year ended July 31, 2009 includes a net charge totaling $13.9 million related to our decision to revoke our election under Accounting Principles Board No. 23, "Accounting for Income Taxes-Special Areas" ("APB 23") and a $21.5 million charge related to uncertainties surrounding the utilization of net operating loss carryforwards. Income tax expense for the year ended July 31, 2008 includes a $4.3 million charge related to the expiration of certain net operating loss carryforwards.
Liquidity and Capital Resources
Our cash requirements consist primarily of funding ongoing operations, including inventory requirements, capital expenditures for new stores, renovations of existing stores, upgrades to our
23
information technology systems and distribution facilities and debt service. In addition, from time to time we have repurchased shares of our common stock.
Net cash provided by operating activities decreased from $134.5 million for the year ended July 31, 2008 to $2.7 million for the year ended July 31, 2009. The decrease in cash provided by operating activities is primarily the result of operating losses generated during fiscal year 2009 compared to operating earnings for the same period in the prior year. The operating losses in the current year are primarily due to the general decline in the overall retail environment and an increase in store-wide discounts during the Holiday season. The decrease is also the result of a decrease in net cash received related to lifetime warranties of approximately $38 million. The decrease was partially offset by an approximately $38 million decrease in amounts due from vendors for returned merchandise and vendor deposits and an approximately $7 million increase in federal and state income tax refunds net of taxes paid.
Our business is highly seasonal, with a disproportionate amount of sales (approximately 35 percent) occurring in November and December of each year, the Holiday season. Other important periods include Valentine's Day and Mother's Day. We purchase inventory in anticipation of these periods and, as a result, have higher inventory and inventory financing needs immediately prior to these periods. Owned inventory at July 31, 2009 was $740.3 million, a decrease of $58.9 million compared to July 31, 2008.
Our cash requirements are funded through cash flows from operations, funds available under our U.S. revolving credit facility with a syndicate of lenders led by Bank of America, and vendor payment terms. As of July 31, 2009, our U.S. revolving credit facility provided for borrowings up to $500 million. Borrowings under the U.S. facility are capped at the lesser of (1) 73 percent of the cost of eligible inventory during October through December and 69 percent for the remainder of the year (minus certain reserves that may be established under the credit facility), plus 85 percent of credit card receivables or (2) 90 percent of the appraised liquidation value of eligible inventory (minus certain reserves that may be established under the credit facility), plus 85 percent of credit card receivables. The U.S. facility also provides for increased seasonal borrowing capabilities of up to $100 million and contains an accordion feature that allows us to permanently increase the facility size in $25 million increments up to an additional $100 million. Under the terms of the U.S. credit facility, we are required to maintain $50 million of borrowing availability or satisfy a minimum fixed charge coverage ratio of 1.1:1.0 for an applicable 12 month reference period. We do not currently meet the minimum fixed charge coverage ratio. Due to the seasonal nature of our business, borrowings under our credit facility during the Holiday season increase significantly and our borrowing availability must be closely managed. Based on our cash flow projections for the remainder of fiscal 2010, we believe our borrowing availability will remain above $50 million, which will not trigger the fixed charge coverage ratio. However, if we do not meet our cash flow projections, our borrowing availability threshold may not remain above $50 million. These cash flow projections are based on revenue and expenditure estimates for the remainder of fiscal 2010. We also manage availability under the credit facility by monitoring the timing of merchandise receipts and vendor payments. Our vendor terms are generally 30 to 60 days, but have decreased slightly during the year due to conditions in the credit markets.
Based on an inventory appraisal performed as of June 30, 2009, the available borrowings under the U.S. credit facility are currently determined under item (2) described above. For the period of September 2009 through August 2010 monthly borrowing rates calculated from the cost of eligible inventory are as follows: 66 percent for September 2009, 73 percent for October 2009 through December 2009, and are projected to range from 60 percent to 63 percent for January 2010 through August 2010. These rates are subject to periodic adjustment under the provisions of the U.S. Agreement. In February 2009, we terminated our Canadian credit facility and entered into certain Joinder Agreements under which we utilize our Canadian and Puerto Rican subsidiaries' inventory, credit card receivables and certain other assets as collateral under the U.S. facility. The increase in collateral under the U.S. facility offset the decline in available borrowings that would have occurred as a result of the decrease in the appraised liquidation value. There were no borrowings outstanding under the Canadian facility at the time of termination.
24
Our credit facility expires in August 2011. Conditions in the credit markets are volatile and it is unclear under what terms we will be able to extend or replace the facility.
As of July 31, 2009, we had cash and cash equivalents of $25.0 million and had approximately $136.1 million available under our revolving credit facilities. We believe that we have sufficient capacity under our revolving credit facilities to meet our financing needs during fiscal 2010.
In February 2009, we announced inventory and cost savings initiatives expected to be realized through fiscal 2010 totaling approximately $75 million and $65 million, respectively. The inventory reductions are to be achieved by selling and not replenishing inventory in closed stores and improved productivity through more efficient store level allocation at existing stores. The inventory reductions achieved as of July 31, 2009 totaled approximately $54 million. As of July 31, 2009, the cost savings realized since inception of the initiative totaled approximately $26 million and consist primarily of selling, general and administrative expenses.
In February 2008, we announced plans to permanently reduce inventory by $100 million and to achieve cost savings totaling in excess of $65 million. The inventory reductions were achieved as of July 2008. As of July 31, 2009, the cost savings realized since inception of the initiative totaled approximately $62 million and consist primarily of selling, general and administrative expenses. The remaining cost savings will be realized during fiscal 2010.
During the third quarter of fiscal 2009, we began a review of our lease portfolio to accelerate the closure of underperforming locations and to identify opportunities to renegotiate rents under existing leases. The evaluation of our lease portfolio resulted in the closure of 109 fine jewelry stores and 10 kiosks in the fourth quarter of fiscal 2009. We recorded a charge during the fourth quarter associated with the closures totaling $27.0 million consisting primarily of lease termination costs of $16.1 million, impairments related to long-lived assets of $8.9 million and severance costs of $1.1 million. We have closed a total of 191 underperforming locations during calendar year 2009, of which 160 were fine jewelry stores and 31 were kiosks. The 191 closed locations had a negative contribution of approximately $14 million for the twelve months preceding closure and carried approximately $53 million of inventory. We have also finalized agreements or entered into agreements in principle on certain existing stores which will result in a reduction in aggregate rental obligations commencing in fiscal year 2010.
In connection with the sale of the Bailey Banks & Biddle brand in November 2007, the buyer, Finlay Fine Jewelry Corporation, assumed the obligations for the store operating leases. As a condition of this assignment, we remained contingently liable for the leases for the remainder of the respective current lease terms, which generally ranged from fiscal 2009 through fiscal 2017. The maximum potential liability for base rent payments under the leases totaled approximately $62 million as of July 31, 2009. As of October 29, 2009, we finalized agreements or reached agreements in principle with the landlords to settle the contingent lease obligations for 38 of 45 lease guarantees. Settlement discussions with respect to the contingent obligations for the remaining 7 locations are still under negotiation. Base rents for the remaining 7 stores totaled approximately $28 million as of July 31, 2009. On August 5, 2009, Finlay filed for Chapter 11 bankruptcy protection and subsequently decided to liquidated. We recorded a $23.2 million charge during the fourth quarter of fiscal 2009 associated with all 45 Bailey Banks & Biddle locations. The charge was based on the preliminary agreements reached with the landlords and expectations of future payments required to settle the remaining 7 lease guarantees.
Under arrangements with Citibank, N.A. and one of its subsidiaries (collectively, "Citibank"), Citibank provides financing for our customers to purchase merchandise through private label credit cards. The arrangements also enable us to write credit insurance. Customers use our Citibank arrangements to pay for approximately 40 percent of purchases in the U.S. and approximately 30 percent of purchases in Canada. Under the agreements governing our arrangements, our Canadian and U.S. subsidiaries must satisfy various financial and other covenants. As of May 2009, our Canadian subsidiary did not satisfy a fixed charge coverage covenant, which could allow Citibank to terminate the Canadian agreement upon
25
30 days written notice, and our U.S. subsidiary did not satisfy a minimum sales threshold, which could allow Citibank to terminate the U.S. agreement upon 180 days written notice if certain cure provisions were not met by us. In June 2009, we amended the agreements with Citibank as follows: (1) Citibank waived its right to terminate both agreements for the covenant violations described above prior to March 2010, (2) we will provide Citibank a $5 million letter of credit and, for the period November 15 through February 14 of each year, an additional $10 million seasonal letter of credit in connection with our U.S. agreement, (3) the minimum sales threshold was lowered related to our U.S. subsidiary and (4) Citibank released its right to require us to purchase the U.S. receivable portfolio upon termination of the agreement as a result of our failure to meet the minimum sales threshold.
During fiscal 2008, the Board of Directors authorized share repurchases of $350 million. As part of the stock repurchase program, we repurchased a total of 17.6 million shares of our common stock, or $326.7 million, in fiscal 2008. As of July 31, 2009, we have approximately $23.3 million in remaining authorization under our repurchase program.
Capital Growth
During fiscal 2009, we invested approximately $7.0 million in capital expenditures to open 14 new stores in the Fine Jewelry segment. We invested approximately $17.4 million to remodel, relocate and refurbish 34 stores in our Fine Jewelry segment, and seven stores in our Kiosk Jewelry segment. We also invested $4.0 million in infrastructure, primarily related to our information technology and our distribution centers. We anticipate investing approximately $20 million in capital expenditures in fiscal year 2010, including eight new stores, primarily in the Peoples brand, and approximately $6 million in capital investments related to information technology infrastructure and support operations.
Contractual Obligations
Aggregate information about our contractual obligations as of July 31, 2009 is presented in the following table (in millions):
| |
Payments Due by Period | |||||||||||||||||||
|---|---|---|---|---|---|---|---|---|---|---|---|---|---|---|---|---|---|---|---|---|
| |
Total | Less than 1 Year |
1 - 3 Years | 4 - 5 Years | More than 5 Years |
Other | ||||||||||||||
Long-term debt(a) |
$ | 311 | $ | — | $ | 311 | $ | — | $ | — | $ | — | ||||||||
Operating leases(b) |
862 | 174 | 271 | 202 | 215 | — | ||||||||||||||
Operation services agreement(c) |
14 | 5 | 9 | — | — | — | ||||||||||||||
Other long-term liabilities(d) |
6 | — | — | — | — | 6 | ||||||||||||||
Total |
$ | 1,193 | $ | 179 | $ | 591 | $ | 202 | $ | 215 | $ | 6 | ||||||||
- (a)
- Long-term
debt relates to principal payments due under our revolving credit agreement. This amount does not reflect any interest, which would be
based on the current effective rate, which was 2.6 percent for fiscal 2009, and assumes no prepayments.
- (b)
- Operating
lease obligations relate to minimum payments due under store lease agreements. Most of the store operating leases provide for the payment of base
rentals plus real estate taxes, insurance, common area maintenance fees and merchant association dues. Real estate taxes, insurance, common area maintenance fees and merchant association dues were
approximately 25 percent of base rentals for the year ended July 31, 2009.
- (c)
- We
have an operations services agreement with a third party for the management of our client server systems, Local Area Network operations, Wide Area
Network management and e-commerce hosting.
- (d)
- Other long-term liabilities reflect loss reserves related to credit insurance. We have reflected these payments under "Other," as the timing of these future payments is dependent on the actual processing of the claims.
26
Not included in the table above as contractual obligations are our obligations under employment agreements and ordinary course purchase orders for merchandise, including certain merchandise on consignment.
Recent Accounting Pronouncement
In September 2006, the Financial Accounting Standards Board ("FASB") issued Statement of Financial Accounting Standards ("SFAS") No. 157, "Fair Value Measurements," ("SFAS 157"). SFAS 157 clarifies the definition of fair value, describes methods used to appropriately measure fair value, and expands fair value disclosure requirements, but does not change existing guidance as to whether or not an instrument is carried at fair value. For financial assets and liabilities, SFAS 157 is effective for fiscal years beginning after November 15, 2007 and for non-financial assets and liabilities, SFAS 157 is effective for fiscal years beginning after November 15, 2008. The Company adopted SFAS 157 for financial assets and liabilities on August 1, 2008, as required. The adoption of SFAS 157 did not have a material impact on our consolidated financial statements.
In May 2009, the FASB issued SFAS No. 165, "Subsequent Events," ("SFAS 165"). SFAS 165 establishes general standards of accounting for and disclosure of events that occur after the balance sheet date but before financial statements are issued or available to be issued. SFAS 165 is effective for interim or annual reporting periods ending after June 15, 2009. The Company adopted SFAS 165 for the fiscal year ended July 31, 2009, as required. The adoption of SFAS 165 did not have a material impact on our consolidated financial statements.
In June 2009, the FASB issued SFAS No. 168, "The FASB Accounting Standards Codification and the Hierarchy of Generally Accepted Accounting Principles, a replacement of FASB Statement No. 162." ("SFAS 168"). SFAS 168 identifies the sources of accounting principles and the framework for selecting the principles to be used in the preparation of financial statements of nongovernmental entities that are presented in conformity with generally accepted accounting principles in the United States ("GAAP"). Rules and interpretive releases of the Securities and Exchange Commission ("SEC") are also sources of authoritative GAAP for SEC registrants. SFAS 168 is effective for financial statements issued for interim and annual periods ending after September 15, 2009. We do not expect the adoption of SFAS 168 to have a material effect on the consolidated financial statements.
Off-Balance Sheet Arrangements
In connection with the sale of the Bailey Banks & Biddle brand in November 2007, the buyer, Finlay Fine Jewelry Corporation, assumed the obligations for the store operating leases. As a condition of this assignment, we remained contingently liable for the leases for the remainder of the respective current lease terms, which generally ranged from fiscal 2009 through fiscal 2017. The maximum potential liability for base rent payments under the leases totaled approximately $62 million as of July 31, 2009. As of October 29, 2009, we finalized agreements or reached agreements in principle with the landlords to settle the contingent lease obligations for 38 of 45 leases. Settlement discussions with respect to the contingent obligations for the remaining 7 locations are still under negotiation. Base rents for the remaining 7 stores totaled approximately $28 million as of July 31, 2009. On August 5, 2009, Finlay filed for Chapter 11 bankruptcy protection and subsequently decided to liquidate. We recorded a $23.2 million charge during the fourth quarter of fiscal 2009 associated with all 45 Bailey Banks & Biddle locations. The charge was based on the preliminary agreements reached with the landlords and expectations of future payments required to settle the contingent lease obligations for the remaining 7 leases.
Inflation
In management's opinion, changes in revenues, net earnings, and inventory valuation that have resulted from inflation and changing prices have not been material during the periods presented. Although currently not material, recent increases in gold prices have negatively affected the cost of merchandise
27
inventory. The inflation rates pertaining to merchandise inventories, especially as they relate to gold and diamond costs, are primary components in determining our last-in, first-out inventory and was approximately eight percent during fiscal year 2009. There is no assurance that inflation will not materially affect us in the future.
Critical Accounting Policies and Estimates
Our significant accounting policies are disclosed in Note 1 of our consolidated financial statements. The following discussion addresses our most critical accounting policies, which are those that are both important to the portrayal of our financial condition and results of operations and that require significant judgment or use of complex estimates.
Merchandise Inventories. Merchandise inventories are stated at the lower of cost or market. Substantially all U.S. inventories represent finished goods which are valued using the LIFO retail inventory method. Merchandise inventory of Peoples Jewellers and Mappins Jewellers of Canada is valued using the first-in, first-out ("FIFO") retail inventory method. Under the retail method, inventory is segregated into categories of merchandise with similar characteristics at its current average retail selling value. The determination of inventory at cost and the resulting gross margins are calculated by applying an average cost-to-retail ratio to the retail value of inventory. At the end of fiscal year 2009, approximately four percent of our total inventory represented raw materials and other inventory associated with internally sourced product. This inventory is valued at the weighted average cost of the items.
We are required to determine the LIFO cost on an interim basis by estimating annual inflation trends, annual purchases and ending inventory levels for the fiscal year. Actual annual inflation rates and inventory balances as of the end of any fiscal year may differ from interim estimates. We apply internally developed indices that we believe accurately and consistently measure inflation or deflation in the components of our merchandise (i.e., diamonds, gold and other metals and precious stones) and our overall merchandise mix. We believe our internally developed indices more accurately reflect inflation or deflation in our own prices than the U.S. Bureau of Labor Statistics ("BLS") producer price indices or other published indices.
We also reduce our inventory valuation for discontinued, slow-moving and damaged inventory. This write-down of inventory is equal to the difference between the cost of inventory and its estimated market value based upon assumptions of targeted inventory turn rates, future demand, management strategy and market conditions. If actual market conditions are less favorable than those projected by management or management strategy changes, additional inventory write-downs may be required and, in the case of a major change in strategy or downturn in market conditions, such write-downs could be significant.
Shrinkage is estimated for the period from the last inventory date to the end of the fiscal year on a store-by-store basis. Such estimates are based on experience and the shrinkage results from the last physical inventory. Physical inventories are taken at least once annually for all store locations and for the distribution centers. The shrinkage rate from the most recent physical inventory, in combination with historical experience and significant changes in physical inventory results could impact our shrinkage reserve.
Impairment of Long-Lived Assets. Long-lived assets are periodically reviewed for impairment by comparing the carrying value of the assets with their estimated undiscounted future cash flows. If the evaluation indicates that the carrying amount of the asset may not be recoverable, the potential impairment is measured based on a projected discounted cash flow method using a discount rate that is considered to be commensurate with the risk inherent in our current business model. Assumptions are made with respect to cash flows expected to be generated by the related assets based upon updated projections. Any changes in key assumptions, particularly store performance or market conditions, could result in an unanticipated impairment charge. For instance, in the event of a major market downturn or adverse developments within a particular market or portion of our business, individual stores may become unprofitable, which could result in a write-down of the carrying value of the assets located in those stores. Any impairment would be recognized in operating results.
28
Goodwill. In accordance with Statement of Financial Accounting Standards No. 142, "Goodwill and Other Intangible Assets," we test goodwill for impairment annually, at the end of our second quarter, or more frequently if events occur which indicate a potential reduction in the fair value of a reporting unit's net assets below its carrying value. We calculate estimated fair value using the present value of future cash flows expected to be generated using weighted average cost of capital, terminal values and updated financial projections. If our actual results are not consistent with estimates and assumptions used to calculate fair value, we may be required to recognize additional goodwill impairments.
Revenue Recognition. We recognize revenue in accordance with the Securities and Exchange Commission's Staff Accounting Bulletin No. 104 "Revenue Recognition." Revenue related to merchandise sales, which is approximately 95 percent of total revenues, is recognized at the time of the sale, reduced by a provision for sales returns. The provision for sales returns is based on historical evidence of our return rate. Repair revenues are recognized when the service is complete and the merchandise is delivered to the customers. We offer our customers lifetime warranties on certain products that cover sizing and breakage, with an option to purchase theft protection for a two-year period. The revenue from the lifetime warranty is recognized on a straight-line basis over a five-year period. Revenues also include premiums from our insurance businesses, principally related to credit insurance policies sold to customers who purchase our merchandise under the proprietary credit program. Insurance premiums are recognized over the coverage period.
Self-Insurance. We are self-insured for certain losses related to general liability, workers' compensation and medical claims. Our liability represents an estimate of the ultimate cost of claims incurred as of the balance sheet dates. The estimated liability is not discounted and is established based upon analysis of historical data and actuarial estimates. While we believe these estimates are reasonable based on the information currently available, if actual trends, including the severity or frequency of claims, medical cost inflation, or fluctuations in premiums differ from our estimates, our results of operations could be impacted.
Other Reserves. We are involved in a number of legal and governmental proceedings as part of the normal course of business. Reserves are established based on management's best estimates of our potential liability in these matters. These estimates have been developed in consultation with in-house and outside counsel and are based on a combination of litigation and settlement strategies. In addition, from time to time we close stores prior to the expiration of the lease term which requires us to record reserves associated with the leases. Certain assumptions are used in estimating lease reserves including the period of time that is required to finalize agreements with the landlords and the amounts that are required to terminate the leases. If our estimates and assumptions used to record these charges change, we may be required to record additional charges.
Income taxes are estimated for each jurisdiction in which we operate. This involves assessing the current tax exposure together with temporary differences resulting from differing treatment of items for tax and financial statement accounting purposes. Any resulting deferred tax assets are evaluated for recoverability based on estimated future taxable income. To the extent that recovery is deemed not likely, a valuation allowance is recorded.
ITEM 7A. QUANTITATIVE AND QUALITATIVE DISCLOSURES ABOUT MARKET RISK
We are exposed to market risk from changes in interest rates, which may adversely affect our financial position, results of operations and cash flows. We do not use derivative financial instruments for trading or other speculative purposes and are not party to any leveraged financial instruments.
The investments of our insurance subsidiaries, primarily stocks and bonds, had an approximate market value at July 31, 2009 of $25 million.
29
Based on our market risk-sensitive instruments (including variable rate debt) outstanding at July 31, 2009, we have determined that there was no material market risk exposure to our consolidated financial position, results of operations or cash flows as of such date.
Commodity Risk. We principally address commodity risk through retail price point adjustments and have, from time to time, purchased forward contracts for gold and silver.
Foreign Currency Risk. We are not subject to substantial currency fluctuations because most of our purchases are U.S. dollar-denominated. However, as a result of our Canadian operations, we are exposed to market risk from currency rate exposures which may adversely affect our financial position, results of operations and cash flows. During the fiscal year ended July 31, 2009, the average Canadian currency rate depreciated by approximately 10 percent relative to the U.S. dollar. Due to our Canadian operations being reported at the average U.S. dollar equivalent, the depreciation in the Canadian dollar resulted in a $35.0 million decrease in reported revenues, substantially offset by a decrease in reported cost of sales and selling, general and administrative expenses of $17.2 million and $12.9 million, respectively. In addition, as a result of the depreciation of the Canadian dollar we recorded losses associated with the settlement of Canadian accounts payable totaling $8.6 million during the fiscal year ended July 31, 2009 compared to gains of $1.0 million during the same period in the prior year.
ITEM 8. FINANCIAL STATEMENTS AND SUPPLEMENTARY DATA
We refer you to the Index to Consolidated Financial Statements attached hereto on page 37 for a listing of all financial statements. The consolidated financial statements are included on pages F-1 through F-33. We incorporate these consolidated financial statements in this document by reference.
ITEM 9. CHANGES IN AND DISAGREEMENTS WITH ACCOUNTANTS AND FINANCIAL DISCLOSURE
Not applicable.
ITEM 9A. CONTROLS AND PROCEDURES
Disclosure Controls and Procedures
At the end of the period covered by this Annual Report on Form 10-K, the Company conducted an evaluation, under the supervision and with the participation of our Chief Executive Officer and Chief Financial Officer, of the effectiveness of the design and operation of our disclosure controls and procedures. Based on that evaluation, the Chief Executive Officer and Chief Financial Officer have concluded that the Company's disclosure controls and procedures were not effective for the purpose of recording, processing, summarizing and timely reporting of material information required to be included in its periodic reports. Notwithstanding the material weaknesses discussed in Management's Report on Internal Control Over Financial Reporting referenced below, we concluded that the consolidated financial statements included in this Annual Report on Form 10-K fairly present, in all material respects, the Company's financial condition, results of operations and cash flows in conformity with generally accepted accounting principles.
Management's Report on Internal Control Over Financial Reporting
Our Management's Report on Internal Control Over Financial Reporting is included on page F-1 of this Annual Report on Form 10-K. The report of Ernst & Young LLP, our independent registered public accounting firm, regarding the effectiveness of our internal control over financial reporting is included on page F-3 of this Annual Report on Form 10-K.
There has been no change in our internal control over financial reporting that occurred during our most recent fiscal quarter that has materially affected, or is reasonably likely to materially affect, our
30
internal control over financial reporting, although subsequent to the end of the quarter we have made various changes as a result of the ineffectiveness of controls.
Not applicable.
ITEM 10. DIRECTORS, EXECUTIVE OFFICERS AND CORPORATE GOVERNANCE
The following individuals serve as our executive officers of the Company. Officers are elected by the Board of Directors annually, each to serve until his or her successor is elected and qualified, or until his or her earlier resignation, removal from office or death.
Name
|
Age | Position | |||
|---|---|---|---|---|---|
| Neal Goldberg | 50 | Chief Executive Officer and Director | |||
| Theo Killion | 58 | President | |||
| Matthew W. Appel | 53 | Executive Vice President and Chief Financial Officer | |||
| William Acevedo | 43 | Executive Vice President, Chief Stores Officer | |||
| Gilbert P. Hollander | 56 | Executive Vice President and Chief Sourcing and Supply Chain Officer | |||
| Mary P. Kwan | 56 | Executive Vice President, Chief Merchandising Officer | |||
| Richard A. Lennox | 44 | Executive Vice President, Chief Marketing and E-Commerce Officer | |||
| James E. Sullivan | 45 | Vice President, Controller and Chief Accounting Officer | |||
Executive Officers
The following is a brief description of the business experience of the Company's executive officers for at least the past five years.
Mr. Neal Goldberg has served as a director of the Company and as Chief Executive Officer of the Company since December 20, 2007. Mr. Goldberg also served as President of the Company from December 20, 2007 until August 5, 2008. From January 2004 until December 2007, Mr. Goldberg was the President of The Children's Place Retail Stores, Inc., a leading specialty retailer of children's merchandise marketed under "The Children's Place" and "Disney Store" brands. From April 10, 2005 until December 8, 2006, Mr. Goldberg also was an Executive Vice President of Hoop Holdings, LLC, a subsidiary of the Children's Place Retail Stores, Inc., which in March 2008, subsequent to Mr. Goldberg ending his affiliation, filed a bankruptcy petition. From September 2001 to October 2003 he was the President of The Gap Inc.'s Outlet Division, a distributor of clothing.
Mr. Theo Killion has served as President of the Company since August 5, 2008. From January 23, 2008 to August 5, 2008, Mr. Killion served as Executive Vice President of Human Resources, Legal and Corporate Strategy. From May 2006 to January 2008, Mr. Killion was employed with the executive recruiting firm Berglass+Associates, focusing on companies in the retail, consumer goods and fashion industries. From April 2004 through April 2006, Mr. Killion served as Executive Vice President of Human Resources at Tommy Hilfiger. From 1996 to 2004, Mr. Killion served in various management positions with Limited Brands.
Mr. Matthew W. Appel was named Executive Vice President of the Company effective May 2009 and appointed Chief Financial Officer of the Company on June 15, 2009. From March 2007 to May 2009, Mr. Appel served as Vice President and Chief Financial Officer of ExlService Holdings, Inc. Prior to ExlService Holdings, Inc, Mr. Appel was Vice President, BPO Product Management from 2006 to 2007 and Vice President, Finance and Administration BPO from 2003 through 2005 at Electronic Data Systems
31
Corporation. From 2001 to 2003, Mr. Appel was the Senior Vice President, Finance and Accounting BPO at Affiliated Computer Services, Inc. Mr. Appel began his career with Arthur Andersen, where he spent seven years in their audit practice. Mr. Appel is a certified public accountant and certified management accountant.
Mr. William Acevedo was appointed Executive Vice President, Chief Stores Officer of the Company effective April 11, 2008. Prior to joining the Company, Mr. Acevedo served as a Vice President of Banana Republic from 2002 to 2008. From April 1996 to May 2002, Mr. Acevedo served in various management positions with Macy's East.
Mr. Gilbert P. Hollander was appointed Executive Vice President and Chief Sourcing and Supply Chain Officer in September 2007. Prior to that appointment, Mr. Hollander served as President, Corporate Sourcing/Piercing Pagoda beginning in May 2006, and was given the additional title of Group Senior Vice President in August 2006. From January 2005 to August 2006, he served as President, Piercing Pagoda. Prior to and up until that appointment, Mr. Hollander served as Vice President of Divisional Merchandise for Piercing Pagoda, to which he was appointed in August 2003. Mr. Hollander served as Senior Vice President of Merchandising for Piercing Pagoda from February 2000 to August 2003. Prior to February 2000, Mr. Hollander held various management positions within Piercing Pagoda beginning in May of 1997.
Ms. Mary P. Kwan was appointed Executive Vice President, Chief Merchandising Officer of the Company on August 5, 2008. From 2006 to August 2008, Ms. Kwan served as President and Chief Merchandising Officer of Goody's Family Clothing. Ms. Kwan served as Senior Vice President, Merchandising and Design, Roxy Brand of Quicksilver Incorporated from 2004 to 2006. From 2002 to 2004, Ms. Kwan served as Vice President Merchandising, Marketing and Licensing, Value Channel of Levis Strauss & Company.
Mr. Richard A. Lennox was named Executive Vice President, Chief Marketing Officer of the Company effective August 2009. Prior to joining the Company, Mr. Lennox served as Executive Vice President, Marketing Director at J. Walter Thompson—New York. Mr. Lennox started at J. Walter Thompson in 1989 and held various senior level marketing positions. He began his career in 1987 with AGB—London.
Mr. James E. Sullivan was appointed Vice President, Controller and Chief Accounting Officer in July 2009. Mr. Sullivan served as Vice President, Financial Reporting and Compliance since joining the Company in January 2007. Prior to joining the Company, Mr. Sullivan served as Assistant Controller of Affiliated Computer Services, Inc. from October 2006 to January 2007. Mr. Sullivan was Senior Director, Financial Reporting for Brinker International, Inc. from July 2001 to September 2006 and previously served as a Senior Audit Manager for PricewaterhouseCoopers, LLP. Mr. Sullivan is a certified public accountant.
The information set forth under the headings "Proposal No. 1: Election of Directors," "Corporate Governance," Executive Compensation and "Section 16(a) Beneficial Ownership Reporting Compliance" in our definitive Proxy Statement for the 2009 Annual Meeting of Stockholders is incorporated herein by reference.
ITEM 11. EXECUTIVE COMPENSATION
The information set forth under the headings "Compensation Discussion and Analysis," "Compensation Committee Report," "Compensation Committee Interlocks and Insider Participation" and "Director Compensation" in our definitive Proxy Statement for the 2009 Annual Meeting of Stockholders is incorporated herein by reference.
32
ITEM 12. SECURITY OWNERSHIP OF CERTAIN BENEFICIAL OWNERS AND MANAGEMENT AND RELATED STOCKHOLDER MATTERS
The information set forth under the headings "Outstanding Voting Securities of the Company and Principal Holders Thereof" and "Equity Compensation Plan Information" in our definitive Proxy Statement for the 2009 Annual Meeting of Stockholders is incorporated herein by reference.
ITEM 13. CERTAIN RELATIONSHIPS AND RELATED TRANSACTIONS, AND DIRECTOR INDEPENDENCE
The information set forth under the headings "Independence of Board of Directors" and "Related Party Transactions" in our definitive Proxy Statement for the 2009 Annual Meeting of Stockholders is incorporated herein by reference.
ITEM 14. PRINCIPAL ACCOUNTANT FEES AND SERVICES
The information set forth under the heading "Independent Auditor Fee Information" in our definitive Proxy Statement for the 2009 Annual Meeting of Stockholders is incorporated herein by reference.
ITEM 15. EXHIBITS AND FINANCIAL STATEMENTS SCHEDULES
The following documents are filed as part of this report.
- 1.
- Financial Statements
We make reference to the Index to Consolidated Financial Statements attached to this document on page 37 for a listing of all financial statement documents included on pages F-1 through F-33.
- 2.
- Financial Statement Schedules
All other financial statements and financial statement schedules for which provision is made in the applicable accounting regulation of the SEC are not required under the related instructions, are not material or are not applicable and, therefore, have been omitted or are included in the consolidated financial statements or notes thereto.
- 3.
- Exhibits
Each management contract or compensation plan required to be filed as an exhibit is identified by an asterisk (*).
| |
Exhibit Number | Description of Exhibit | The filings referenced for incorporation by reference are Zale Corporation filings (File No. 1-04129) unless otherwise noted |
||||
|---|---|---|---|---|---|---|---|
| 3.1a | Restated Certificate of Incorporation of Zale Corporation | October 31, 2001 Form 10-Q, Exhibit 3.1 | |||||
3.1b |
Certificate of Amendment to Restated Certificate of Incorporation of Zale Corporation |
October 31, 2004 Form 10-Q, Exhibit 3.1 |
|||||
3.2 |
Bylaws of Zale Corporation |
June 20, 2008 Form 8-K, Exhibit 3.1 |
|||||
4.1a |
Revolving Credit Agreement, dated as of July 23, 2003 |
July 31, 2003 Form 10-K, Exhibit 4.1 |
|||||
4.1b |
Amendment to Revolving Credit Agreement, dated as of December 10, 2004 |
December 10, 2004 Form 8-K, Exhibit 99.1 |
|||||
33
| |
Exhibit Number | Description of Exhibit | The filings referenced for incorporation by reference are Zale Corporation filings (File No. 1-04129) unless otherwise noted |
||||
|---|---|---|---|---|---|---|---|
| 4.1c | Amendment to Revolving Credit Agreement dated as of January 17, 2006 | July 31, 2006 Form 10-K, Exhibit 4.1c | |||||
4.1d |
Amendment to Revolving Credit Agreement dated as of April 6, 2007 |
April 11, 2007 Form 8-K, Exhibit 99.1 |
|||||
4.1e |
Joinder Agreement of Zale Canada Co. to Credit Agreement |
February 18, 2009 Form 8-K, Exhibit 4.1 |
|||||
4.1f |
Joinder Agreement of Zale Canada Co. to Security Agreement |
February 18, 2009 Form 8-K, Exhibit 4.2 |
|||||
4.1g |
Joinder Agreement of Zale Puerto Rico, Inc. to Credit Agreement |
February 18, 2009 Form 8-K, Exhibit 4.3 |
|||||
4.1h |
Joinder Agreement of Zale Puerto Rico, Inc. to Security Agreement |
February 18, 2009 Form 8-K, Exhibit 4.4 |
|||||
4.1i |
Security Agreement of Zale Canada Co. |
February 18, 2009 Form 8-K, Exhibit 4.5 |
|||||
10.1* |
Zale Corporation Savings and Investment Plan, as amended |
July 31, 2006 Form 10-K, Exhibit 10.1 |
|||||
10.2* |
Form of Indemnification Agreement |
Filed herewith |
|||||
10.3* |
Zale Corporation Omnibus Stock Incentive Plan |
July 31, 2000 Form 10-K, Exhibit 10.3a |
|||||
10.4a* |
Zale Corporation 2003 Stock Incentive Plan, as amended |
July 31, 2006 Form 10-K, Exhibit 10.4a |
|||||
10.4b* |
Form of Incentive Stock Option Award Agreement |
July 31, 2008 Form 10-K, Exhibit 10.4b |
|||||
10.4c* |
Form of Non-qualified Stock Option Award Agreement |
July 31, 2008 Form 10-K, Exhibit 10.4c |
|||||
10.4d* |
Form of Restricted Stock Award Agreement |
July 31, 2008 Form 10-K, Exhibit 10.4d |
|||||
10.4e* |
Form of Time-Vesting Restricted Stock Unit Award Agreement |
July 31, 2008 Form 10-K, Exhibit 10.4e |
|||||
10.4f* |
Form of Performance-Based Restricted Stock Unit Award Agreement |
July 31, 2008 Form 10-K, Exhibit 10.4f |
|||||
10.5* |
Outside Directors' 1995 Stock Option Plan |
July 31, 2001 Form 10-K, Exhibit 10.3c |
|||||
10.6a* |
Zale Corporation Outside Directors' 2005 Stock Incentive Plan, as amended |
July 31, 2006 Form 10-K, Exhibit 10.6a |
|||||
10.6b* |
Form of Stock Option Award Agreement |
November 17, 2005 Form 8-K, Exhibit 10.2 |
|||||
10.6c* |
Form of Restricted Stock Award Agreement |
November 17, 2005 Form 8-K, Exhibit 10.3 |
|||||
10.7a |
Lease Agreement for Corporate Headquarters |
July 31, 1996 Form 10-K, Exhibit 10.11 |
|||||
10.7b |
First Amendment to Lease Agreement for Corporate Headquarters |
July 31, 1996 Form 10-K, Exhibit 10.11a |
|||||
34
| |
Exhibit Number | Description of Exhibit | The filings referenced for incorporation by reference are Zale Corporation filings (File No. 1-04129) unless otherwise noted |
||||
|---|---|---|---|---|---|---|---|
| 10.7c | Second Amendment to Lease Agreement for Corporate Headquarters | July 31, 2004 Form 10-K, Exhibit 10.7c | |||||
10.8* |
Zale Corporation Bonus Plan |
July 31, 2008 Form 10-K, Exhibit 10.8 |
|||||
10.9* |
Offer Letter to Theo Killion |
January 29, 2008 Form 8-K, Exhibit 10.1 |
|||||
10.10* |
Form of Employment Security Agreement for Corporate Senior Vice Presidents |
April 30, 2008 Form 10-Q, Exhibit 10.7 |
|||||
10.11* |
Form of Employment Security Agreement for Brand Senior Vice Presidents |
April 30, 2008 Form 10-Q, Exhibit 10.7 |
|||||
10.12 |
Amendment to Citibank USA, N.A. Agreement, dated as of April 4, 2003 |
April 30, 2003 Form 10-Q, Exhibit 99.2 |
|||||
10.13* |
Base Salaries and Target Bonus for the Named Executive Officers |
Filed herewith |
|||||
10.14 |
Master Agreement for Information Technology Services between Zale Delaware, Inc. and ACS Commercial Solutions, Inc., dated as of August 1, 2005 |
July 31, 2006 Form 10-K, Exhibit 10.18 |
|||||
10.15* |
Non-Employee Director Equity Compensation Plan |
November 24, 2008 Form 8-K, Exhibit 10.1 |
|||||
10.16* |
Form of Restricted Stock Unit Agreement |
November 24, 2008 Form 8-K, Exhibit 10.2 |
|||||
10.17* |
Form of Deferred Stock Unit Agreement |
November 24, 2008 Form 8-K, Exhibit 10.3 |
|||||
10.18* |
Amended and Restated Employment Agreement with Neal Goldberg |
December 24, 2008 Form 8-K, Exhibit 10.1 |
|||||
10.19* |
Form of Amended and Restated Employment Security Agreement with Executive Vice Presidents |
December 24, 2008 Form 8-K, Exhibit 10.2 |
|||||
10.20* |
Separation and Release Agreement with Rodney Carter |
February 18, 2009 Form 8-K, Exhibit 10.1 |
|||||
10.21 |
Merchant Services Agreement |
January 31, 2009 Form 10-Q, Exhibit 10.6 |
|||||
10.22 |
Private Label Credit Card Program Agreement |
January 31, 2009 Form 10-Q, Exhibit 10.6 |
|||||
10.23* |
Employment Security Agreement with Matthew W. Appel |
April 30, 2009 Form 10-Q, Exhibit 10.2 |
|||||
10.24 |
Amendment to Merchant Services Agreement with Citibank (South Dakota), N.A. |
April 30, 2009 Form 10-Q, Exhibit 10.3 |
|||||
10.25** |
Amendment No. One to Private Label Credit Card Program Agreement with Citi Commerce Solutions of Canada Ltd. |
April 30, 2009 Form 10-Q, Exhibit 10.4 |
|||||
35
| |
Exhibit Number | Description of Exhibit | The filings referenced for incorporation by reference are Zale Corporation filings (File No. 1-04129) unless otherwise noted |
||||
|---|---|---|---|---|---|---|---|
| 10.26* | Separation and Release Agreement with Steve Larkin | June 30, 2009 Form 8-K, Exhibit 10.1 | |||||
14 |
Code of Business Conduct and Ethics |
Filed herewith |
|||||
21 |
Subsidiaries of the Registrant |
July 31, 2007 Form 10-K, Exhibit 21 |
|||||
23.1 |
Consent of Ernst & Young LLP |
Filed herewith |
|||||
31.1 |
Rule 13a-14(a) Certification of Chief Executive Officer |
Filed herewith |
|||||
31.2 |
Rule 13a-14(a) Certification of Chief Financial Officer |
Filed herewith |
|||||
32.1 |
Section 1350 Certification of Chief Executive Officer |
Filed herewith |
|||||
32.2 |
Section 1350 Certification of Chief Financial Officer |
Filed herewith |
|||||
99.1 |
Audit Committee Charter |
July 31, 2004 Form 10-K, Exhibit 99.1 |
|||||
99.2 |
Compensation Committee Charter |
July 31, 2006 Form 10-K, Exhibit 99.2 |
|||||
99.3 |
Nominating/Corporate Governance Committee Charter |
July 31, 2004 Form 10-K, Exhibit 99.3 |
|||||
- **
- Confidential treatment has been requested with respect to Exhibit 10.27. Portions of Exhibit 10.27 have been redacted. The redacted portions have been filed separately with the Securities and Exchange Commission.
36
INDEX TO CONSOLIDATED FINANCIAL STATEMENTS
| |
Page | |
|---|---|---|
Management's Report on Internal Control Over Financial Reporting |
F-1 | |
Reports of Independent Registered Public Accounting Firm |
F-2 | |
Consolidated Statements of Operations |
F-5 | |
Consolidated Balance Sheets |
F-6 | |
Consolidated Statements of Cash Flows |
F-7 | |
Consolidated Statements of Stockholders' Investments |
F-8 | |
Notes to Consolidated Financial Statements |
F-9 |
37
MANAGEMENT'S REPORT ON INTERNAL CONTROL OVER FINANCIAL REPORTING
Management is responsible for establishing and maintaining adequate internal control over financial reporting, as such term is defined in Rule 13a-15(f) promulgated under Securities Exchange Act of 1934, as amended. The Company conducted an evaluation, under the supervision and with the participation of our Chief Executive Officer and Chief Financial Officer, of the effectiveness of our internal control over financial reporting as of July 31, 2009 using the criteria established in Internal Control—Integrated Framework issued by the Committee of Sponsoring Organizations of the Treadway Commission. A material weakness is a deficiency, or combination of deficiencies, in internal control over financial reporting, such that there is a reasonable possibility that a material misstatement of the Company's annual or interim financial statements will not be prevented or detected on a timely basis. In its assessment of the effectiveness of internal control over financial reporting as of July 31, 2009, the Company determined that there were control deficiencies that constituted material weaknesses in the following areas:
- •
- The Company did not maintain effective controls over certain account reconciliations. Specifically, account
reconciliations associated with advertising, depository bank accounts and intercompany accounts receivable lacked appropriate supporting documentation and were not reviewed in a satisfactory manner.
This material weakness contributed to the restatement of the financial statements as of and for the year ended July 31, 2008 included in this Annual Report on Form 10-K.
- •
- The Company did not maintain effective segregation of duties and oversight with respect to its advertising programs. The responsibility to initiate and approve transactions was maintained by the same individual who determined the timing of when advertising transactions were recorded and expensed. In addition, the appropriate level of oversight did not exist to ensure that advertising transactions were recorded in the appropriate period. This material weakness contributed to the restatement of the financial statements as of and for the year ended July 31, 2008 included in this Annual Report on Form 10-K.
As a result of these material weaknesses, management concluded that the Company did not maintain effective internal control over financial reporting as of July 31, 2009.
The Company's management has taken, or is in the process of taking, various actions that are intended to remediate these material weaknesses. The Company's new Chief Financial Officer, appointed in June 2009, and its new Controller, appointed in July 2009, are overseeing the implementation of these remediation efforts, including:
- •
- The hiring of an Internal Audit leader and the addition of third party internal audit resources.
- •
- A review of the Company's internal controls, policies and procedures and organization structure relating to the areas
where material weaknesses were identified.
- •
- The hiring of additional personnel and the retraining of existing personnel within its finance organization.
The effectiveness of our internal control over financial reporting was audited by Ernst & Young LLP, an independent registered public accounting firm, as stated in their report on page F-3.
| /s/ NEAL L. GOLDBERG Neal L. Goldberg Chief Executive Officer October 29, 2009 |
/s/ MATTHEW W. APPEL Matthew W. Appel Executive Vice President and Chief Financial Officer October 29, 2009 |
F-1
REPORT OF INDEPENDENT REGISTERED PUBLIC ACCOUNTING FIRM
The
Board of Directors and Stockholders of
Zale Corporation:
We have audited the accompanying consolidated balance sheet of Zale Corporation and subsidiaries as of July 31, 2009 and 2008, and the related consolidated statements of operations, stockholders' investment, and cash flows for the two years in the period ended July 31, 2009. These financial statements are the responsibility of the Company's management. Our responsibility is to express an opinion on these financial statements based on our audits.
We conducted our audits in accordance with the standards of the Public Company Accounting Oversight Board (United States). Those standards require that we plan and perform the audit to obtain reasonable assurance about whether the financial statements are free of material misstatement. An audit includes examining, on a test basis, evidence supporting the amounts and disclosures in the financial statements. An audit also includes assessing the accounting principles used and significant estimates made by management, as well as evaluating the overall financial statement presentation. We believe that our audits provide a reasonable basis for our opinion.
In our opinion, the financial statements referred to above present fairly, in all material respects, the consolidated financial position of Zale Corporation and subsidiaries at July 31, 2009 and 2008, and the consolidated results of their operations and their cash flows for each of the two years in the period ended July 31, 2009, in conformity with U.S. generally accepted accounting principles.
As discussed in Note 2 to the financial statements, the accompanying fiscal 2008 financial statements have been restated.
We also have audited, in accordance with the standards of the Public Company Accounting Oversight Board (United States), Zale Corporation's internal control over financial reporting as of July 31, 2009, based on criteria established in Internal Control—Integrated Framework issued by the Committee of Sponsoring Organizations of the Treadway Commission and our report dated October 29, 2009 expressed an adverse opinion thereon.
/s/ ERNST & YOUNG LLP
Dallas,
Texas
October 29, 2009
F-2
REPORT OF INDEPENDENT REGISTERED PUBLIC ACCOUNTING FIRM
The
Board of Directors and Stockholders of
Zale Corporation:
We have audited Zale Corporation's internal control over financial reporting as of July 31, 2009, based on criteria established in Internal Control—Integrated Framework issued by the Committee of Sponsoring Organizations of the Treadway Commission (the COSO criteria). Zale Corporation's management is responsible for maintaining effective internal control over financial reporting, and for its assessment of the effectiveness of internal control over financial reporting included in the accompanying Management's Report on Internal Control over Financial Reporting. Our responsibility is to express an opinion on the company's internal control over financial reporting based on our audit.
We conducted our audit in accordance with the standards of the Public Company Accounting Oversight Board (United States). Those standards require that we plan and perform the audit to obtain reasonable assurance about whether effective internal control over financial reporting was maintained in all material respects. Our audit included obtaining an understanding of internal control over financial reporting, assessing the risk that a material weakness exists, testing and evaluating the design and operating effectiveness of internal control based on the assessed risk, and performing such other procedures as we considered necessary in the circumstances. We believe that our audit provides a reasonable basis for our opinion.
A company's internal control over financial reporting is a process designed to provide reasonable assurance regarding the reliability of financial reporting and the preparation of financial statements for external purposes in accordance with generally accepted accounting principles. A company's internal control over financial reporting includes those policies and procedures that (1) pertain to the maintenance of records that, in reasonable detail, accurately and fairly reflect the transactions and dispositions of the assets of the company; (2) provide reasonable assurance that transactions are recorded as necessary to permit preparation of financial statements in accordance with generally accepted accounting principles, and that receipts and expenditures of the company are being made only in accordance with authorizations of management and directors of the company; and (3) provide reasonable assurance regarding prevention or timely detection of unauthorized acquisition, use, or disposition of the company's assets that could have a material effect on the financial statements.
Because of its inherent limitations, internal control over financial reporting may not prevent or detect misstatements. Also, projections of any evaluation of effectiveness to future periods are subject to the risk that controls may become inadequate because of changes in conditions, or that the degree of compliance with the policies or procedures may deteriorate.
A material weakness is a deficiency, or combination of deficiencies, in internal control over financial reporting, such that there is a reasonable possibility that a material misstatement of the company's annual or interim financial statements will not be prevented or detected on a timely basis. The following material weaknesses have been identified and included in management's assessment:
- •
- The Company did not maintain effective controls over certain account reconciliations. Specifically, account
reconciliations associated with advertising, depository bank accounts and intercompany accounts receivable lacked appropriate supporting documentation and were not reviewed in a satisfactory manner.
This material weakness contributed to the restatement of the financial statements as of and for the year ended July 31, 2008.
- •
- The Company did not maintain effective segregation of duties and oversight with respect to its advertising programs. The responsibility to initiate and approve transactions was maintained by the same individual that determined the timing of when advertising transactions were recorded and expensed. In addition, the appropriate level of oversight did not exist to ensure that advertising
F-3
transactions were recorded in the appropriate period. This material weakness contributed to the restatement of the financial statements as of and for the year ended July 31, 2008.
These material weaknesses were considered in determining the nature, timing, and extent of audit tests applied in our audit of the 2009 financial statements, and this report does not affect our report dated October 29, 2009 on those financial statements.
In our opinion, because of the effect of the material weaknesses described above on the achievement of the objectives of the control criteria, Zale Corporation has not maintained effective internal control over financial reporting as of July 31, 2009, based on the COSO criteria.
/s/ ERNST & YOUNG LLP
Dallas,
Texas
October 29, 2009
F-4
ZALE CORPORATION AND SUBSIDIARIES
CONSOLIDATED STATEMENTS OF OPERATIONS
(in thousands, except per share amounts)
| |
Year Ended July 31, | ||||||||
|---|---|---|---|---|---|---|---|---|---|
| |
2009 | 2008 | |||||||
| |
|
As Restated |
|||||||
Revenues |
$ | 1,779,744 | $ | 2,138,041 | |||||
Cost and expenses: |
|||||||||
Cost of sales |
948,572 | 1,089,553 | |||||||
Selling, general and administrative |
927,249 | 985,028 | |||||||
Cost of insurance operations |
7,000 | 6,744 | |||||||
Depreciation and amortization |
58,947 | 60,244 | |||||||
Other charges and gains |
70,095 | (10,700 | ) | ||||||
Operating (loss) earnings |
(232,119 | ) | 7,172 | ||||||
Interest expense |
10,399 | 12,364 | |||||||
Other income |
— | (3,500 | ) | ||||||
Loss before income taxes |
(242,518 | ) | (1,692 | ) | |||||
Income tax (benefit) expense |
(53,015 | ) | 4,761 | ||||||
Loss from continuing operations |
(189,503 | ) | (6,453 | ) | |||||
Earnings from discontinued operations, net of taxes |
— | 7,084 | |||||||
Net (loss) earnings |
$ | (189,503 | ) | $ | 631 | ||||
Basic net (loss) earnings per common share: |
|||||||||
Loss from continuing operations |
$ | (5.94 | ) | $ | (0.15 | ) | |||
Earnings from discontinued operations |
— | 0.16 | |||||||
Net (loss) earnings per share |
$ | (5.94 | ) | $ | 0.01 | ||||
Diluted net (loss) earnings per common share: |
|||||||||
Loss from continuing operations |
$ | (5.94 | ) | $ | (0.15 | ) | |||
Earnings from discontinued operations |
— | 0.16 | |||||||
Net (loss) earnings per share |
$ | (5.94 | ) | $ | 0.01 | ||||
Weighted average number of common shares outstanding: |
|||||||||
Basic |
31,899 | 42,361 | |||||||
Diluted |
31,899 | 42,476 | |||||||
See notes to the consolidated financial statements.
F-5
ZALE CORPORATION AND SUBSIDIARIES
CONSOLIDATED BALANCE SHEETS
(in thousands, except per share amounts)
| |
July 31, 2009 | July 31, 2008 | ||||||||
|---|---|---|---|---|---|---|---|---|---|---|
| |
|
As Restated |
||||||||
ASSETS |
||||||||||
Current Assets: |
||||||||||
Cash and cash equivalents |
$ | 24,987 | $ | 61,342 | ||||||
Merchandise inventories |
740,257 | 799,181 | ||||||||
Other current assets |
51,973 | 106,340 | ||||||||
Total current assets |
817,217 | 966,863 | ||||||||
Property and equipment, net |
238,138 | 297,887 | ||||||||
Goodwill |
94,605 | 103,685 | ||||||||
Other assets |
29,480 | 35,946 | ||||||||
Deferred tax asset |
51,532 | 10,879 | ||||||||
Total assets |
$ | 1,230,972 | $ | 1,415,260 | ||||||
LIABILITIES AND STOCKHOLDERS' INVESTMENT |
||||||||||
Current liabilities: |
||||||||||
Accounts payable and accrued liabilities |
$ | 309,949 | $ | 287,452 | ||||||
Deferred tax liability |
46,383 | 65,746 | ||||||||
Total current liabilities |
356,332 | 353,198 | ||||||||
Long-term debt |
310,500 | 326,306 | ||||||||
Other liabilities |
190,347 | 169,285 | ||||||||
Commitments and contingencies (see Notes 12 and 18) |
||||||||||
Stockholders' Investment: |
||||||||||
Common stock, par value $0.01, 150,000 shares authorized; 54,732 shares issued; 31,969 and 31,612 shares outstanding at July 31, 2009 and 2008, respectively |
488 | 488 | ||||||||
Additional paid-in capital |
147,348 | 144,456 | ||||||||
Accumulated other comprehensive income |
37,307 | 51,036 | ||||||||
Accumulated earnings |
657,682 | 847,185 | ||||||||
|
842,825 | 1,043,165 | ||||||||
Treasury stock, at cost, 22,763 and 23,109 shares at July 31, 2009 and 2008, respectively |
(469,032 | ) | (476,694 | ) | ||||||
Total stockholders' investment |
373,793 | 566,471 | ||||||||
Total liabilities and stockholders' investment |
$ | 1,230,972 | $ | 1,415,260 | ||||||
See notes to the consolidated financial statements.
F-6
ZALE CORPORATION AND SUBSIDIARIES
CONSOLIDATED STATEMENTS OF CASH FLOWS
(in thousands)
| |
Year Ended July 31, | |||||||
|---|---|---|---|---|---|---|---|---|
| |
2009 | 2008 | ||||||
| |
|
As Restated |
||||||
Cash Flows From Operating Activities: |
||||||||
Net (loss) earnings |
$ | (189,503 | ) | $ | 631 | |||
Adjustments to reconcile net (loss) earnings to net cash provided by operating activities: |
||||||||
Depreciation and amortization |
59,631 | 60,927 | ||||||
Deferred taxes |
(61,014 | ) | (14,573 | ) | ||||
Loss on retirements of property and equipment |
2,663 | 3,477 | ||||||
Impairment of property and equipment |
23,786 | 1,902 | ||||||
Goodwill impairment |
5,020 | — | ||||||
Stock-based compensation |
5,713 | 4,406 | ||||||
Change in vacation policy |
— | (12,609 | ) | |||||
Earnings from discontinued operations |
— | (7,084 | ) | |||||
Changes in assets and liabilities: |
||||||||
Merchandise inventories |
53,184 | 71,137 | ||||||
Other current assets |
53,759 | (1,298 | ) | |||||
Other assets |
2,807 | 2,505 | ||||||
Accounts payable and accrued liabilities |
24,738 | (34,496 | ) | |||||
Other liabilities |
21,911 | 59,623 | ||||||
Net cash provided by operating activities |
2,695 | 134,548 | ||||||
Cash Flows From Investing Activities: |
||||||||
Payments for property and equipment |
(28,357 | ) | (85,137 | ) | ||||
Purchase of available-for-sale investments |
(22,721 | ) | (10,448 | ) | ||||
Proceeds from sales of available-for-sale investments |
25,779 | 8,251 | ||||||
Net cash used in investing activities |
(25,299 | ) | (87,334 | ) | ||||
Cash Flows From Financing Activities: |
||||||||
Borrowings under revolving credit agreement |
5,107,150 | 3,630,800 | ||||||
Payments on revolving credit agreement |
(5,122,955 | ) | (3,531,801 | ) | ||||
Proceeds from exercise of stock options |
6,211 | 1,992 | ||||||
Excess tax benefit on stock options exercised |
158 | 53 | ||||||
Purchase of common stock |
— | (326,694 | ) | |||||
Net cash used in financing activities |
(9,436 | ) | (225,650 | ) | ||||
Cash Flows from Discontinued Operations: |
||||||||
Net cash used in operating activities of discontinued operations |
— | (21,593 | ) | |||||
Net cash provided by investing activities of discontinued operations |
— | 225,052 | ||||||
Net cash provided by discontinued operations |
— | 203,459 | ||||||
Effect of exchange rate changes on cash |
(4,315 |
) |
161 |
|||||
Net change in cash and cash equivalents |
(36,355 |
) |
25,184 |
|||||
Cash and cash equivalents at beginning of period |
61,342 | 36,158 | ||||||
Cash and cash equivalents at end of period |
$ | 24,987 | $ | 61,342 | ||||
See notes to the consolidated financial statements.
F-7
ZALE CORPORATION AND SUBSIDIARIES
CONSOLIDATED STATEMENTS OF STOCKHOLDERS' INVESTMENT
(in thousands)
| |
Common Stock | |
Accumulated Other Comprehensive Income |
|
|
|
|||||||||||||||||
|---|---|---|---|---|---|---|---|---|---|---|---|---|---|---|---|---|---|---|---|---|---|---|---|
| |
Additional Paid-In Capital |
Accumulated Earnings |
Treasury Stock |
|
|||||||||||||||||||
| |
Shares | Amount | Total | ||||||||||||||||||||
Balances at July 31, 2007—As previously reported (unaudited) |
49,053 | $ | 487 | $ | 138,036 | $ | 45,939 | $ | 868,111 | $ | (150,000 | ) | $ | 902,573 | |||||||||
Cummulative effect of restatement (see Note 2) |
— | — | — | — | (22,159 | ) | — | (22,159 | ) | ||||||||||||||
Balances at July 31, 2007—As restated |
49,053 | 487 | 138,036 | 45,939 | 845,952 | (150,000 | ) | 880,414 | |||||||||||||||
Net earnings |
— |
— |
— |
— |
631 |
— |
631 |
||||||||||||||||
Unrealized gain on securities |
— | — | — | 741 | — | — | 741 | ||||||||||||||||
Cumulative translation adjustment |
— | — | — | 4,356 | — | — | 4,356 | ||||||||||||||||
Comprehensive income |
5,728 | ||||||||||||||||||||||
Adjustment to initially apply FIN 48 |
— | — | — | — | 602 | — | 602 | ||||||||||||||||
Issuance of common stock |
101 | 1 | 1,991 | — | — | — | 1,992 | ||||||||||||||||
Tax benefit from exercise of stock options |
— | — | 23 | — | — | — | 23 | ||||||||||||||||
Purchase of common stock |
(17,553 | ) | — | — | — | — | (326,694 | ) | (326,694 | ) | |||||||||||||
Stock-based compensation |
11 | — | 4,406 | — | — | — | 4,406 | ||||||||||||||||
Balances at July 31, 2008—As restated |
31,612 | 488 | 144,456 | 51,036 | 847,185 | (476,694 | ) | 566,471 | |||||||||||||||
Net loss |
— |
— |
— |
— |
(189,503 |
) |
— |
(189,503 |
) |
||||||||||||||
Unrealized gain on securities |
— | — | — | 81 | — | — | 81 | ||||||||||||||||
Cumulative translation adjustment |
— | — | — | (13,810 | ) | — | — | (13,810 | ) | ||||||||||||||
Comprehensive loss |
(203,232 | ) | |||||||||||||||||||||
Issuance of common stock |
357 | — | (1,604 | ) | — | — | 7,662 | 6,058 | |||||||||||||||
Tax benefit from exercise of stock options |
— | — | (1,217 | ) | — | — | — | (1,217 | ) | ||||||||||||||
Stock-based compensation |
— | — | 5,713 | — | — | — | 5,713 | ||||||||||||||||
Balances at July 31, 2009 |
31,969 | $ | 488 | $ | 147,348 | $ | 37,307 | $ | 657,682 | $ | (469,032 | ) | $ | 373,793 | |||||||||
See notes to the consolidated financial statements.
F-8
ZALE CORPORATION AND SUBSIDIARIES
NOTES TO CONSOLIDATED FINANCIAL STATEMENTS
1. SUMMARY OF SIGNIFICANT ACCOUNTING POLICIES
Basis of Presentation. We are, through our wholly owned subsidiaries, a leading specialty retailer of fine jewelry in North America. At July 31, 2009, we operated 1,247 specialty retail jewelry stores and 684 kiosks located mainly in shopping malls throughout the United States of America, Canada and Puerto Rico. We report our operations under three segments: Fine Jewelry, Kiosk Jewelry and All Other.
Our Fine Jewelry segment is comprised of five brands, predominantly focused on the value-oriented consumer as our core customer target. Each brand specializes in fine jewelry and watches, with merchandise and marketing emphasis focused on diamond products. Additionally, each brand differentiates itself through a customer experience with different points of emphasis. Our brands have a centralized merchandising function that creates significant synergies and allows for teaming across brands. Zales Jewelers® is our national brand in the U.S. providing moderately priced jewelry to a broad range of customers. Zales Outlet® focuses on a slightly higher-income female self purchaser in outlet malls and neighborhood power centers. Gordon's Jewelers® is a value-oriented regional jeweler that caters to local fashions and emphasizes customer relationships. Peoples Jewellers®, our national brand in Canada, provides customers with an affordable assortment and an accessible shopping experience. Mappins Jewellers® offers Canadian customers a broad selection of merchandise from engagement rings to fashionable and contemporary fine jewelry. The brands in the Fine Jewelry segment have expanded their presence in the retail market through their e-commerce sites, zales.com and gordonsjewelers.com. During fiscal year 2009, our Fine Jewelry segment generated $1.5 billion of revenues.
The Kiosk Jewelry segment operates under the brand names Piercing Pagoda®, Plumb Gold™, and Silver and Gold Connection® through mall-based kiosks and reaches the opening price point select jewelry customer. The Kiosk Jewelry segment specializes in gold and silver products that capitalize on the latest fashion trends. During fiscal year 2009, our Kiosk Jewelry segment generated $232.8 million of revenues.
The accompanying consolidated financial statements and related notes are for the twelve month fiscal periods ended July 31, 2009 and 2008. Certain information included in the notes to the consolidated financial statements as of and for the year ended July 31, 2008 has been restated. We consolidate substantially all of our U.S. operations into Zale Delaware, Inc. ("ZDel"), a wholly owned subsidiary of Zale Corporation. ZDel is the parent company for several subsidiaries, including three that are engaged primarily in providing credit insurance to our credit customers. We consolidate our Canadian retail operations into Zale International, Inc., which is a wholly owned subsidiary of Zale Corporation. All significant intercompany transactions have been eliminated.
See Note 2 for information related to the restatement of our previously issued financial statements.
Cash and Cash Equivalents. Cash and cash equivalents include cash on hand, deposits in banks and short-term marketable securities at varying interest rates with original maturities of three months or less. Also included in cash equivalents are proceeds due from credit card transactions with settlement terms of less than five days. The carrying amount approximates fair value due to the short-term maturity of those instruments.
Merchandise Inventories. Merchandise inventories are stated at the lower of cost or market. Substantially all U.S. inventories represent finished goods which are valued using the last-in, first-out ("LIFO") retail inventory method. Merchandise inventory of Peoples Jewellers and Mappins Jewellers of Canada is valued using the first-in, first-out ("FIFO") retail inventory method. Under the retail method, inventory is segregated into categories of merchandise with similar characteristics at its current average retail selling value. The determination of inventory at cost and the resulting gross margins are calculated by applying an average cost-to-retail ratio to the retail value of inventory. At the end of fiscal year 2009,
F-9
approximately four percent of our total inventory represented raw materials and other inventory associated with internally sourced product. This inventory is valued at the weighted average cost of the items. The LIFO charge was $1.0 million and $2.4 million for the years ended July 31, 2009 and 2008, respectively. The cumulative LIFO provision reflected in the accompanying consolidated balance sheets was $13.2 million and $12.2 million at July 31, 2009 and 2008, respectively. Domestic inventories on a FIFO basis were $652.9 million and $702.1 million at July 31, 2009 and 2008, respectively. Our Canadian inventory accounted for on the FIFO retail method was approximately $100.6 million and $109.3 million at July 31, 2009 and 2008, respectively.
Consignment inventory and related contingent obligations are not reflected in our consolidated financial statements. Consignment inventory has historically consisted of test programs, merchandise at higher price points, or merchandise that otherwise does not warrant the risk of outright ownership. Consignment inventory can be returned to the vendor at any time. At the time consigned inventory is sold, we record the purchase liability in accounts payable and the related cost of merchandise in cost of sales. We had $71.5 million and $114.3 million of consignment inventory on hand at July 31, 2009 and 2008, respectively.
We are required to determine the LIFO cost on an interim basis by estimating annual inflation trends, annual purchases and ending inventory levels for the fiscal year. Actual annual inflation rates and inventory balances as of the end of any fiscal year may differ from interim estimates. We apply internally developed indices that we believe accurately and consistently measure inflation or deflation in the components of our merchandise (i.e., the proper weighting of diamonds, gold and other metals and precious stones) and our overall merchandise mix. We believe our internally developed indices more accurately reflect inflation or deflation in our own prices than the U.S. Bureau of Labor Statistics producer price indices or other published indices.
We also write-down our inventory for discontinued, slow-moving and damaged inventory. This write-down is equal to the difference between the cost of inventory and its estimated market value based upon assumptions of targeted inventory turn rates, future demand, management strategy and market conditions. If actual market conditions are less favorable than those projected by management or management strategy changes, additional inventory write-downs may be required and, in the case of a major change in strategy or downturn in market conditions, such write-downs could be significant.
Shrinkage is estimated for the period from the last inventory date to the end of the fiscal year on a store-by-store basis. Such estimates are based on experience and the shrinkage results from the last physical inventory. Physical inventories are taken at least once annually for all store locations and for the distribution centers. The shrinkage rate from the most recent physical inventory, in combination with historical experience and significant changes in physical inventory results, could impact our shrinkage reserve.
Impairment of Long-Lived Assets. Long-lived assets are reviewed for impairment by comparing the carrying value of the assets with their estimated future cash flows. If the evaluation indicates that the carrying amount of the asset may not be recoverable, the potential impairment is measured based on a projected discounted cash flow method, using a discount rate that is commensurate with the risk inherent in our current business model. Assumptions are made with respect to cash flows expected to be generated by the related assets based upon the most recent projections. Any changes in key assumptions, particularly store performance or market conditions, could result in an unanticipated impairment charge. For instance, in the event of a major market downturn or adverse developments within a particular market or portion of our business, individual stores may become unprofitable, which could result in a write-down of the carrying value of the assets located in those stores.
Goodwill. In accordance with Statement of Financial Accounting Standards ("SFAS") No. 142, "Goodwill and Other Intangible Assets," ("SFAS 142") we test goodwill for impairment annually, at the end of our second quarter, or more frequently if events occur which indicate a potential reduction in the
F-10
fair value of a reporting unit's net assets below its carrying value. We calculate estimated fair value using the present value of future cash flows expected to be generated using weighted average cost of capital, terminal values and updated financial projections. If our actual results are not consistent with estimates and assumptions used to calculate fair value, we may be required to recognize additional goodwill impairments. See Note 6 for additional disclosures related to goodwill.
Revenue Recognition. We recognize revenue in accordance with the Securities and Exchange Commission's Staff Accounting Bulletin No. 104 "Revenue Recognition." Revenue related to merchandise sales, which is approximately 95 percent of total revenues, is recognized at the time of the sale, reduced by a provision for sales returns. The provision for sales returns is based on historical evidence of our return rate. Repair revenues are recognized when the service is complete and the merchandise is delivered to the customers. We offer our customers lifetime warranties on certain products that cover sizing and breakage, with an option to purchase theft protection for a two-year period. The revenue from the lifetime warranty is recognized on a straight-line basis over a five-year period. Revenues also include premiums from our insurance businesses, principally related to credit insurance policies sold to customers who purchase our merchandise under the proprietary credit program. Insurance premiums are recognized over the coverage period.
In connection with the sale of our customer receivables in fiscal year 2000, we entered into a 10-year merchant services agreement whereby Citibank, N.A. issues private label credit cards branded with appropriate Company trademarks. We received a $41.8 million incentive for entering into the agreement that is being recognized ratably over 10 years. The deferred revenue related to this incentive as of July 31, 2009 and 2008 totaled $4.2 million and $8.4 million, respectively.
Cost of Sales. Cost of sales includes cost of merchandise sold, as well as receiving and distribution costs.
Selling, General and Administrative. Included in selling, general and administrative ("SG&A") are store operating, advertising, buying and general corporate overhead expenses.
Operating Leases. Rent expense is recognized on a straight-line basis, including consideration of rent holidays, tenant improvement allowances received from the landlords and applicable rent escalations over the term of the lease. The commencement date of the rent expense is the earlier of the date when we become legally obligated for the rent payments or the date when we take possession of the building for construction purposes.
Depreciation and Amortization. Buildings and leasehold improvements are stated at cost and are amortized using the straight-line method over the estimated useful lives of the assets or remaining lease life, whichever is shorter, which generally range from 5 to 10 years. Fixtures and equipment are amortized using the straight-line method over the estimated useful lives of the assets, which range from 3 to 15 years. Original cost and related accumulated depreciation or amortization is removed from the accounts in the year assets are retired. Gains or losses on dispositions of property and equipment are recorded in the year of disposal and are included in SG&A in the accompanying consolidated statements of operations. Repairs and maintenance costs are expensed as incurred.
Stock-Based Compensation. Stock-based compensation is accounted for under SFAS No. 123 (Revised 2004), "Share-Based Payment" ("SFAS 123(R)"), which requires the use of the fair value method of accounting for all stock-based compensation, including stock options. Stock-based compensation expense for fiscal 2009 and 2008 includes compensation expense for new share-based awards and for share-based awards granted prior to, but not yet vested, as of July 31, 2005.
Preferred Stock. At July 31, 2009 and 2008, 5.0 million shares of preferred stock, par value of $0.01, were authorized. None were issued or outstanding.
F-11
Credit Insurance Operations. Insurance premium revenue from credit insurance subsidiaries was $11.3 million and $12.4 million for the fiscal years ended July 31, 2009 and 2008, respectively. These insurance premiums are included in revenues in the accompanying consolidated statements of operations.
Self-Insurance. We are self-insured for certain losses related to general liability, workers' compensation and medical claims. Our liability represents an estimate of the ultimate cost of claims incurred as of the balance sheet dates. The estimated liability is not discounted and is established based upon analysis of historical data and actuarial estimates. While we believe these estimates are reasonable based on the information currently available, if actual trends, including the severity or frequency of claims, medical cost inflation, or fluctuations in premiums differ from our estimates, our results of operations could be impacted.
Advertising Expenses. Advertising is generally expensed when the advertisement is utilized and is a component of SG&A. All related production costs are expensed upon the first occurrence of the advertisement. Advertising expenses were $87.9 million and $96.3 million for the fiscal years ended July 31, 2009 and 2008, respectively, net of amounts contributed by vendors. The amounts of prepaid advertising at July 31, 2009 and 2008 were $0.9 million and $2.2 million, respectively, and are classified as components of other current assets in the accompanying consolidated balance sheets.
Vendor Allowances. We receive cash or allowances from merchandise vendors primarily in connection with cooperative advertising programs and reimbursements for markdowns taken to sell the vendor's products. We have agreements in place with each vendor setting forth the specific conditions for each allowance or payment. The majority of these agreements are entered into or renewed annually at the beginning of each fiscal year. Qualifying vendor reimbursements of costs incurred to specifically advertise vendors' products are recorded as a reduction of advertising expense. All other allowances or cash payments received are recorded as a reduction to the cost of merchandise. Vendor allowances included in advertising expense totaled $5.9 million and $4.3 million for the fiscal years ended July 31, 2009 and 2008, respectively. Vendor allowances included in cost of sales totaled $1.3 million for the year ended July 31, 2009. There were no vendor allowances included in cost of sales for the year ended July 31, 2008.
Income Taxes. Income taxes are accounted for under the asset and liability method prescribed by SFAS No. 109, "Accounting for Income Taxes." Deferred tax assets and liabilities are recognized for the future tax consequences attributable to differences between the financial statement carrying amounts of existing assets and liabilities and their respective tax bases and operating loss and tax credit carryforwards. Deferred tax assets and liabilities are measured using enacted tax rates expected to apply to taxable income in the years in which those temporary differences are expected to be recovered or settled. The effect on deferred tax assets and liabilities of a change in tax rates is recognized in income in the period that includes the enactment date. A valuation allowance is recorded to reduce the carrying amounts of deferred tax assets unless it is more likely than not such assets will be realized.
Effective August 1, 2007, we adopted the provisions of the Financial Accounting Standards Board's Interpretation No. 48, "Accounting for Uncertainty in Income Taxes" ("FIN 48"). As a result of the adoption of FIN 48 in the first quarter of fiscal 2008, we recognized a decrease of $0.6 million in the liability for unrecognized tax benefits, net of the federal deferred tax benefit, with a corresponding increase to accumulated earnings.
We file income tax returns in the U.S. federal jurisdiction, in various states and in certain foreign jurisdictions. We are no longer subject to U.S. federal examinations by tax authorities for fiscal years before July 31, 2005. We are subject to audit by taxing authorities of most states and certain foreign jurisdictions and are subject to examination by these taxing jurisdictions for fiscal years generally after July 31, 2004.
Sales Tax. We present revenues net of taxes collected and record the taxes as a liability in the consolidated balance sheets until the taxes are remitted to the appropriate taxing authority.
F-12
Foreign Currency. Translation adjustments result from translating foreign subsidiaries' financial statements into U.S. dollars. Balance sheet accounts are translated at exchange rates in effect at the balance sheet date. Income statement accounts are translated at average exchange rates during the period. Resulting translation adjustments are included as a component of comprehensive income in the accompanying consolidated statements of stockholders' investment.
Earnings Per Common Share. Basic earnings per common share is computed by dividing income available to common stockholders by the weighted average number of common shares outstanding for the reporting period. Diluted earnings per share reflect the potential dilution that could occur if securities or other contracts to issue common stock were exercised or converted into common stock. For the calculation of diluted earnings per share, the basic weighted average number of shares is increased by the dilutive effect of stock options and restricted share awards determined using the treasury stock method. There were antidilutive stock options of 2.6 million as of July 31, 2009 and 2008.
We incurred a net loss of $189.5 million for the year ended July 31, 2009. A net loss causes all outstanding stock options and restricted share awards to be antidilutive (that is, the potential dilution would decrease the loss per share). As a result, the basic and dilutive losses per common share are the same.
Financial Instruments. In September 2006, the Financial Accounting Standards Board issued SFAS No. 157, "Fair Value Measurements," ("SFAS 157"). SFAS 157 clarifies the definition of fair value, describes methods used to appropriately measure fair value, and expands fair value disclosure requirements, but does not change existing guidance as to whether or not an instrument is carried at fair value. For financial assets and liabilities, SFAS 157 was effective for fiscal years beginning after November 15, 2007 and for non-financial assets and liabilities, SFAS 157 was effective for fiscal years beginning after November 15, 2008. The Company adopted SFAS 157 on August 1, 2008, as required. The adoption of SFAS 157 did not have a material impact on our consolidated financial statements.
SFAS 157 establishes a three-tier fair value hierarchy, which prioritizes the inputs used in measuring fair values. These tiers include:
| Level 1 | — | Quoted prices for identical instruments in active markets; | ||||
| Level 2 | — | Quoted prices for similar instruments in active markets; quoted prices for identical or similar instruments in markets that are not active; and model-derived valuations whose significant inputs are observable; and | ||||
| Level 3 | — | Instruments whose significant inputs are unobservable. |
As cash and short-term cash investments, trade payables and certain other short-term financial instruments are all short-term in nature, their carrying amount approximates fair value.
The fair value of the $310.5 million of borrowings under our revolving credit facility totaled approximately $304 million as of July 31, 2009. The fair value was based on estimates of current interest rates for similar debt.
The investments of our insurance subsidiaries, primarily stocks and bonds, are accounted for as available-for-sale securities and are reflected in other assets in the accompanying consolidated balance sheets. The fair values of these instruments as of July 31, 2009 and 2008 were approximately $25 million and $28 million, respectively, and are based on quoted market prices in an active market, a Level 1 measurement in the fair value hierarchy.
Concentrations of Business and Credit Risk. During fiscal year 2009, we purchased approximately 12 percent of our finished merchandise from five vendors with no single vendor exceeding three percent, compared to approximately 14 percent in the same period of the prior year. In fiscal years 2009 and 2008, approximately 16 percent and 13 percent, respectively, of our merchandise requirements were provided by
F-13
our internal sourcing organization. If purchases from these top vendors were disrupted, particularly at certain critical times during the year, our sales could be adversely affected in the short term until alternative supply arrangements could be established. As of July 31, 2009 and 2008, we had no significant concentrations of credit risk.
Use of Estimates. Our accounting and financial reporting policies are in conformity with U.S. generally accepted accounting principles. The preparation of financial statements in conformity with U.S. generally accepted accounting principles requires management to make estimates and assumptions that affect the reported amounts of assets and liabilities and disclosure of contingent assets and liabilities at the date of the financial statements, and the reported amounts of revenues and expenses during the reporting period. Actual results could differ from those estimates. For example, unexpected changes in market conditions or a downturn in the economy could adversely affect actual results. Estimates are used in accounting for, among other things, inventory valuation, goodwill and long-lived asset valuation, LIFO inventory retail method, legal liability, credit insurance liability, product warranty, depreciation, workers' compensation, tax and contingencies. Estimates and assumptions are reviewed periodically and the effects of revisions are reflected in the consolidated financial statements in the period they are determined to be necessary.
Reclassifications. The classifications in use at July 31, 2009 have been applied to the restated financial statements for July 31, 2008.
Subsequent Events. We have evaluated subsequent events through the issuance of the financial statements, which occurred on October 29, 2009.
2. RESTATEMENT OF PREVIOUSLY ISSUED FINANCIAL STATEMENTS
On September 17, 2009, management of Zale Corporation (the "Company") and the Audit Committee of the Company's Board of Directors, concluded that the Company's previously issued consolidated financial statements for fiscal years 2008 and prior periods required restatement as a result of adjustments associated with advertising costs, intercompany accounts receivable, depository bank accounts, federal income taxes and personal property taxes.
The tables below provide a reconciliation of our consolidated statement of operations and balance sheet for fiscal year 2008 from amounts previously reported to the restated amounts. We also have included a reconciliation of certain line items affected within our consolidated statement of cash flows for fiscal year 2008 from amounts previously reported to the restated amounts. Our consolidated statement of stockholders' investment as of July 31, 2008 reflects the cumulative effect of the restatement as of July 31, 2007 for those items that impacted fiscal year 2007 and prior. Following the tables are additional disclosures surrounding each item affecting the restatements.
F-14
CONSOLIDATED STATEMENT OF OPERATIONS
YEAR ENDED JULY 31, 2008
(in thousands, except per share amounts)
| |
As Reported | Advertising | Depository Bank Accounts |
Federal Income Taxes |
Personal Property Tax Reserve |
Total Adjustments |
As Restated | ||||||||||||||||
|---|---|---|---|---|---|---|---|---|---|---|---|---|---|---|---|---|---|---|---|---|---|---|---|
Revenues |
$ | 2,138,041 | $ | — | $ | — | $ | — | $ | — | $ | — | $ | 2,138,041 | |||||||||
Costs and expenses: |
|||||||||||||||||||||||
Cost of sales |
1,089,553 | — | — | — | — | — | 1,089,553 | ||||||||||||||||
Selling, general and administrative |
980,469 | 2,031 | 2,752 | — | (224 | ) | 4,559 | 985,028 | |||||||||||||||
Cost of insurance operations |
6,744 | — | — | — | — | — | 6,744 | ||||||||||||||||
Depreciation and amortization |
60,244 | — | — | — | — | — | 60,244 | ||||||||||||||||
Other charges and gains |
(10,700 | ) | — | — | — | — | — | (10,700 | ) | ||||||||||||||
Operating earnings |
11,731 | (2,031 | ) | (2,752 | ) | — | 224 | (4,559 | ) | 7,172 | |||||||||||||
Interest expense |
12,364 | — | — | — | — | — | 12,364 | ||||||||||||||||
Other income |
(3,500 | ) | — | — | — | — | — | (3,500 | ) | ||||||||||||||
Earnings (loss) before income taxes |
2,867 | (2,031 | ) | (2,752 | ) | — | 224 | (4,559 | ) | (1,692 | ) | ||||||||||||
Income tax (benefit) expense |
(850 | ) | 710 | 963 | 3,929 | 9 | 5,611 | 4,761 | |||||||||||||||
Earnings (loss) from continuing operations |
3,717 | (2,741 | ) | (3,715 | ) | (3,929 | ) | 215 | (10,170 | ) | (6,453 | ) | |||||||||||
Earnings from discontinued operations, net of taxes |
7,084 | — | — | — | — | — | 7,084 | ||||||||||||||||
Net earnings |
$ | 10,801 | $ | (2,741 | ) | $ | (3,715 | ) | $ | (3,929 | ) | $ | 215 | $ | (10,170 | ) | $ | 631 | |||||
Basic net earnings (loss) per common share: |
|||||||||||||||||||||||
Earnings (loss) from continuing operations |
$ | 0.09 | $ | (0.06 | ) | $ | (0.09 | ) | $ | (0.09 | ) | $ | — | $ | (0.24 | ) | $ | (0.15 | ) | ||||
Earnings from discontinued operations |
0.16 | — | — | — | — | — | 0.16 | ||||||||||||||||
Basic net earnings per share |
$ | 0.25 | $ | (0.06 | ) | $ | (0.09 | ) | $ | (0.09 | ) | $ | — | $ | (0.24 | ) | $ | 0.01 | |||||
Diluted net earnings (loss) per common share: |
|||||||||||||||||||||||
Earnings (loss) from continuing operations |
$ | 0.09 | $ | (0.06 | ) | $ | (0.09 | ) | $ | (0.09 | ) | $ | — | $ | (0.24 | ) | $ | (0.15 | ) | ||||
Earnings from discontinued operations |
0.16 | — | — | — | — | — | 0.16 | ||||||||||||||||
Diluted net earnings per share |
$ | 0.25 | $ | (0.06 | ) | $ | (0.09 | ) | $ | (0.09 | ) | $ | — | $ | (0.24 | ) | $ | 0.01 | |||||
Weighted average number of common shares outstanding: |
|||||||||||||||||||||||
Basic |
42,361 | 42,361 | 42,361 | 42,361 | 42,361 | 42,361 | 42,361 | ||||||||||||||||
Diluted |
42,476 | 42,476 | 42,476 | 42,476 | 42,476 | 42,476 | 42,476 | ||||||||||||||||
F-15
CONSOLIDATED BALANCE SHEET
AS OF JULY 31, 2008
(in thousands)
| |
As Reported |
Advertising | Intercompany Accounts Receivable |
Depository Bank Accounts |
Federal Income Taxes |
Personal Property Tax Reserve |
Total Adjustments |
As Restated |
||||||||||||||||||||
|---|---|---|---|---|---|---|---|---|---|---|---|---|---|---|---|---|---|---|---|---|---|---|---|---|---|---|---|---|
ASSETS |
||||||||||||||||||||||||||||
Current Assets: |
||||||||||||||||||||||||||||
Cash and cash equivalents |
$ | 65,579 | $ | — | $ | — | $ | (4,237 | ) | $ | — | $ | — | $ | (4,237 | ) | $ | 61,342 | ||||||||||
Merchandise inventories(a) |
799,181 | — | — | — | — | — | — | 799,181 | ||||||||||||||||||||
Other current assets |
125,446 | (19,254 | ) | 756 | 569 | — | (1,177 | ) | (19,106 | ) | 106,340 | |||||||||||||||||
Total current assets |
990,206 | (19,254 | ) | 756 | (3,668 | ) | — | (1,177 | ) | (23,343 | ) | 966,863 | ||||||||||||||||
Property and equipment, net |
297,887 |
— |
— |
— |
— |
— |
— |
297,887 |
||||||||||||||||||||
Goodwill |
103,685 | — | — | — | — | — | — | 103,685 | ||||||||||||||||||||
Other assets |
35,946 | — | — | — | — | — | — | 35,946 | ||||||||||||||||||||
Deferred tax asset |
14,514 | (601 | ) | 41 | (1,034 | ) | (2,041 | ) | — | (3,635 | ) | 10,879 | ||||||||||||||||
Total assets |
$ | 1,442,238 | $ | (19,855 | ) | $ | 797 | $ | (4,702 | ) | $ | (2,041 | ) | $ | (1,177 | ) | $ | (26,978 | ) | $ | 1,415,260 | |||||||
LIABILITIES AND STOCKHOLDERS' INVESTMENT |
||||||||||||||||||||||||||||
Current liabilities: |
||||||||||||||||||||||||||||
Accounts payable and accrued liabilities(a) |
$ | 281,891 | $ | 1,037 | $ | 5,925 | $ | (105 | ) | $ | 1,127 | $ | (2,423 | ) | $ | 5,561 | $ | 287,452 | ||||||||||
Deferred tax liability |
65,956 | (449 | ) | — | — | 761 | (522 | ) | (210 | ) | 65,746 | |||||||||||||||||
Total current liabilities |
347,847 | 588 | 5,925 | (105 | ) | 1,888 | (2,945 | ) | 5,351 | 353,198 | ||||||||||||||||||
Long-term debt |
326,306 |
— |
— |
— |
— |
— |
— |
326,306 |
||||||||||||||||||||
Other liabilities |
169,285 | — | — | — | — | — | — | 169,285 | ||||||||||||||||||||
Stockholders' Investment: |
||||||||||||||||||||||||||||
Common stock |
488 | — | — | — | — | — | — | 488 | ||||||||||||||||||||
Additional paid-in capital |
144,456 | — | — | — | — | — | — | 144,456 | ||||||||||||||||||||
Accumulated other comprehensive income |
51,036 |
— |
— |
— |
— |
— |
— |
51,036 |
||||||||||||||||||||
Accumulated earnings |
879,514 | (20,443 | ) | (5,128 | ) | (4,597 | ) | (3,929 | ) | 1,768 | (32,329 | ) | 847,185 | |||||||||||||||
|
1,075,494 | (20,443 | ) | (5,128 | ) | (4,597 | ) | (3,929 | ) | 1,768 | (32,329 | ) | 1,043,165 | |||||||||||||||
Treasury stock |
(476,694 | ) | — | — | — | — | — | — | (476,694 | ) | ||||||||||||||||||
Total stockholders' investment |
598,800 |
(20,443 |
) |
(5,128 |
) |
(4,597 |
) |
(3,929 |
) |
1,768 |
(32,329 |
) |
566,471 |
|||||||||||||||
Total liabilities and stockholders' investment |
$ |
1,442,238 |
$ |
(19,855 |
) |
$ |
797 |
$ |
(4,702 |
) |
$ |
(2,041 |
) |
$ |
(1,177 |
) |
$ |
(26,978 |
) |
$ |
1,415,260 |
|||||||
- (a)
- Additional inventory totaling $19.6 million was included in the "as reported" balances with a corresponding adjustment to accounts payable and accrued liabilities. The adjustment is related to inventory in-transit as of July 31, 2008.
F-16
CONSOLIDATED CASH FLOW DATA
YEAR ENDED JULY 31, 2008
(in thousands)
| |
As Reported | Advertising | Depository Bank Accounts |
Federal Income Taxes |
Personal Property Tax Reserve |
Total Adjustments |
As Restated | |||||||||||||||
|---|---|---|---|---|---|---|---|---|---|---|---|---|---|---|---|---|---|---|---|---|---|---|
Net earnings |
$ | 10,801 | $ | (2,741 | ) | $ | (3,715 | ) | $ | (3,929 | ) | $ | 215 | $ | (10,170 | ) | $ | 631 | ||||
Deferred taxes |
(20,498 | ) | 788 | 1,068 | 3,929 | 140 | 5,925 | (14,573 | ) | |||||||||||||
Other current assets |
(7,164 | ) | 5,866 | — | — | — | 5,866 | (1,298 | ) | |||||||||||||
Accounts payable and accrued liabilities |
(30,123 | ) | (3,913 | ) | (105 | ) | — | (355 | ) | (4,373 | ) | (34,496 | ) | |||||||||
Net cash provided by operating activities |
137,300 | — | (2,752 | ) | — | — | (2,752 | ) | 134,548 | |||||||||||||
Cash and cash equivalents at end of period |
65,579 | — | (4,237 | ) | — | — | (4,237 | ) | 61,342 | |||||||||||||
Advertising
The cumulative impact of the advertising charge totaled $23.7 million, $20.4 million after taxes, as of July 31, 2008 and related primarily to prepaid advertising costs. Previously, certain advertising costs were recorded as prepaid advertising subsequent to the period in which the advertisement ran. The cumulative impact of the advertising charge includes $21.7 million related to fiscal year 2007 and prior periods.
Intercompany Accounts Receivable
The cumulative impact of the intercompany accounts receivable charge totaled $5.9 million, $5.1 million after taxes, as of July 31, 2008. The charge related to an intercompany accounts receivable associated with our wholly owned insurance subsidiaries. The Company pays certain expenses on behalf of its insurance subsidiaries and is subsequently reimbursed by those subsidiaries. The charge was the result of the Company recording accounts receivable in excess of the actual expenses incurred and included $5.9 million related to fiscal year 2007 and prior periods. The intercompany accounts receivable was previously recorded in accounts payable and accrued liabilities.
Depository Bank Accounts
The cumulative impact of the depository bank accounts charge totaled $4.2 million, $4.6 million after taxes, as of July 31, 2008. The charge corrected the recording of cash receipts from Bailey Banks & Biddle subsequent to disposition of the brand in fiscal 2008 and certain other errors associated with our cash reconciliation system. The cumulative impact of the depository bank accounts includes $1.5 million related to fiscal year 2007 and prior periods.
Federal Income Taxes
The cumulative impact of the federal income tax charge totaled $3.9 million as of July 31, 2008. The charge resulted primarily from an incorrect determination made during fiscal year 2008 related to whether earnings from our Puerto Rican based operations could be utilized to offset U.S. operating losses that were expiring.
Personal Property Tax Reserves
The cumulative impact of the personal property tax reserve benefit totaled $2.3 million, $1.8 million after taxes, as of July 31, 2008. The benefit was the result of excess reserves that were not adjusted on a timely basis following payments and includes $2.1 million related to fiscal year 2007 and prior periods.
F-17
3. OTHER CURRENT ASSETS
Our other current assets consist of the following (in thousands):
| |
Year Ended July 31, | ||||||
|---|---|---|---|---|---|---|---|
| |
2009 | 2008 | |||||
| |
|
As Restated |
|||||
Prepaid rent |
$ | 20,824 | $ | 22,459 | |||
Vendor returns and deposits |
9,232 | 34,618 | |||||
Other |
21,917 | 49,263 | |||||
|
$ | 51,973 | $ | 106,340 | |||
4. INVESTMENTS
Investments in debt and equity securities are reported as other assets in the accompanying consolidated balance sheets. Investments are recorded at fair value based on quoted market prices. All long-term debt securities outstanding at July 31, 2009 will contractually mature within 1 to 23 years.
Investments, principally related to our insurance subsidiaries as of July 31, 2009 and 2008, were as follows (in thousands):
| |
July 31, 2009 | July 31, 2008 | |||||||||||
|---|---|---|---|---|---|---|---|---|---|---|---|---|---|
| |
Cost | Fair Value | Cost | Fair Value | |||||||||
U.S. government obligations |
$ | 17,673 | $ | 18,354 | $ | 19,182 | $ | 19,662 | |||||
Corporate bonds and notes |
3,355 | 3,500 | 5,893 | 5,864 | |||||||||
Corporate equity securities |
3,431 | 2,988 | 2,159 | 2,010 | |||||||||
|
$ | 24,459 | $ | 24,842 | $ | 27,234 | $ | 27,536 | |||||
All investments are classified as available-for-sale. At July 31, 2009 and 2008, the carrying value of investments included a net unrealized gain of $0.4 million and $0.3 million, respectively, which are included in accumulated other comprehensive income. The net realized gain on investments totaled $0.4 million and $0.1 million in fiscal years 2009 and 2008, respectively, as determined on the specific identification basis. Investments with a carrying value of $7.7 million and $7.6 million were on deposit with various state insurance departments at July 31, 2009 and 2008, respectively, as required by law.
5. PROPERTY AND EQUIPMENT, NET
Our property and equipment consists of the following (in thousands):
| |
Year Ended July 31, | ||||||
|---|---|---|---|---|---|---|---|
| |
2009 | 2008 | |||||
Building and leasehold improvements |
$ | 237,197 | $ | 256,394 | |||
Furniture and fixtures |
439,240 | 452,619 | |||||
Construction in progress |
14,312 | 25,747 | |||||
|
690,749 | 734,760 | |||||
Less accumulated depreciation and amortization |
(452,611 | ) | (436,873 | ) | |||
|
$ | 238,138 | $ | 297,887 | |||
6. GOODWILL
In accordance with SFAS 142, "Goodwill and Other Intangible Assets," we test goodwill for impairment annually, at the end of our second quarter, or more frequently if events occur which indicate a potential reduction in the fair value of a reporting unit's net assets below its carrying value. We calculate
F-18
estimated fair value using the present value of future cash flows expected to be generated using a weighted average cost of capital, terminal values and updated financial projections. As a result of the decline in the overall retail environment and the significant decline in our market capitalization through the Holiday season, we concluded that an interim impairment test was necessary and performed the test as of December 31, 2008. Based on the test results, we fully impaired goodwill totaling $5.0 million related to a reporting unit in the Fine Jewelry segment. The charge is included in other charges and gains in the consolidated statements of operations. No impairments were recorded for the $75.2 million of goodwill related to the Peoples Jewellers acquisition and the $19.4 million of goodwill related to the Piercing Pagoda acquisition. The fair value of Peoples Jewellers and Piercing Pagoda would have to decline by more than 58 percent and 29 percent, respectively, to be considered for potential impairment. The key assumptions used to determine the fair value of our reporting units include (1) cash flow projections for five years, (2) terminal year growth rates of two percent, and (3) discount rates of 15 percent to 20 percent based on our weighted average cost of capital adjusted for risks associated with the operations of each reporting unit. While we believe we have made reasonable estimates and assumptions to calculate the fair value of the reporting units, it is possible a material change could occur. If our actual results are not consistent with estimates and assumptions used to calculate fair value, we may be required to recognize additional goodwill impairments.
As of July 31, 2009, our market capitalization was below carrying value. While we considered the market capitalization decline in our evaluation of fair value, we determined it did not impact the overall goodwill impairment analysis as we believe the decline to be primarily attributable to negative market conditions as a result of the recession and the deterioration in the retail environment. In addition, we evaluated the potential impact of the store closures described in Note 7 on our calculation of fair value and determined that there was no material impact to the fair value of Peoples Jewellers and Piercing Pagoda. A significant number of the store closures related to Zales Jewelers, which has no remaining goodwill.
The changes in the carrying amount of goodwill are as follows (in thousands):
| |
Year Ended July 31, | |||||||
|---|---|---|---|---|---|---|---|---|
| |
2009 | 2008 | ||||||
Goodwill, beginning of period |
$ | 103,685 | $ | 100,740 | ||||
Impairment charges |
(5,020 | ) | — | |||||
Foreign currency adjustments |
(4,060 | ) | 2,945 | |||||
Goodwill, end of period |
$ | 94,605 | $ | 103,685 | ||||
7. OTHER CHARGES AND GAINS
Our other charges and gains consist of the following (in thousands):
| |
Year Ended July 31, | ||||||
|---|---|---|---|---|---|---|---|
| |
2009 | 2008 | |||||
Store impairments |
$ | 14,873 | $ | 1,909 | |||
Store closure charges |
27,047 | — | |||||
Bailey Banks & Biddle lease charge |
23,155 | — | |||||
Goodwill impairment |
5,020 | — | |||||
Change in vacation policy |
— | (12,609 | ) | ||||
|
$ | 70,095 | $ | (10,700 | ) | ||
In fiscal year 2009, we recorded a $14.9 million charge related to the impairment of long-lived assets associated with underperforming stores and a $27.0 million charge related to 119 store closures. The store closure charge consists primarily of estimated lease termination costs of $16.1 million, impairments related to long-lived assets of $8.9 million and severance costs of $1.1 million. The impairment charges and store
F-19
closures were primarily in our Fine Jewelry segment. The store closures were the result of a strategic decision to close certain underperforming stores not meeting minimum contribution margins. In addition, we recorded a $23.2 million charge associated with the Bailey Banks & Biddle contingent lease obligation and a $5.0 million goodwill impairment charge. In estimating the lease termination costs associated with the store closures and the Bailey Banks & Biddle contingent lease obligations, certain assumptions were used including the period of time that would be required to finalize agreements with the landlords and the amounts that would be required to terminate the leases. While we believe we have made reasonable estimates and assumptions to record these charges, it is possible a material change could occur and we may be required to record additional charges. See Notes 9 and 18 for additional information related to the store closures and the Bailey Banks & Biddle contingent lease obligation and Note 6 for additional information related to the goodwill impairment charge.
In fiscal year 2008, we recorded a $1.9 million charge related to the impairment of long-lived assets associated with underperforming stores. In addition, we recorded a $12.6 million benefit related to a change in our vacation policy from one that required employees to earn vacation in the year prior to the date of grant to a policy where employees earn vacation in the same year it is used. We also eliminated our policy to pay terminated employees for unused vacation, where not prohibited by law.
8. DISPOSITION OF BAILEY BANKS & BIDDLE
In November 2007, we sold substantially all of the assets and certain liabilities related to the Bailey Banks & Biddle brand. The assets consisted primarily of inventory and property and equipment totaling approximately $190 million and $28 million, respectively. The sale resulted in a pre-tax gain of approximately $14 million, which includes a $24.7 million reduction in the last-in, first-out provision resulting from the liquidation of the Bailey Banks & Biddle inventory. The decision to sell was a result of our strategy to focus on our moderately priced business and our continued focus on maximizing return on investments. We have reported the results of operations of Bailey Banks & Biddle as discontinued operations, which consist of the following (in thousands):
| |
Year Ended July 31, 2008 |
||||
|---|---|---|---|---|---|
Revenues |
$ | 56,585 | |||
Loss before income taxes |
$ |
(2,604 |
) |
||
Income tax benefit |
1,016 | ||||
Loss earnings from discontinued operations |
(1,588 | ) | |||
Gain on sale of Bailey Banks & Biddle, net of taxes of $5,544 |
8,672 | ||||
Earnings from discontinued operations |
$ | 7,084 | |||
F-20
9. ACCOUNTS PAYABLE AND ACCRUED LIABILITIES
Our accounts payable and accrued liabilities consist of the following (in thousands):
| |
Year Ended July 31, | ||||||
|---|---|---|---|---|---|---|---|
| |
2009 | 2008 | |||||
| |
|
As Restated |
|||||
Accounts payable |
$ | 124,435 | $ | 154,087 | |||
Accrued payroll |
7,444 | 12,115 | |||||
Accrued taxes |
17,118 | 21,628 | |||||
Warranty deferred revenue |
60,164 | 41,786 | |||||
Accrued rent |
7,577 | 12,763 | |||||
Bailey Banks & Biddle lease reserve |
23,155 | — | |||||
Store closure reserve |
20,309 | — | |||||
Other |
49,747 | 45,073 | |||||
|
$ | 309,949 | $ | 287,452 | |||
10. OTHER LIABILITIES
Our other liabilities consist of the following (in thousands):
| |
Year Ended July 31, | ||||||
|---|---|---|---|---|---|---|---|
| |
2009 | 2008 | |||||
Long-term straight-line rent |
$ | 34,543 | $ | 32,247 | |||
Long-term warranty deferred revenue |
150,016 | 127,025 | |||||
Long-term deferred servicing fee revenue |
— | 4,180 | |||||
Insurance reserves |
5,788 | 5,833 | |||||
|
$ | 190,347 | $ | 169,285 | |||
F-21
11. DEBT
U.S. Revolving Credit Agreement. We have a U.S. revolving credit agreement (the "U.S. Agreement") that provides for up to $500 million in commitments by a group of lenders, including a $20 million sublimit for letters of credit, that is secured by our merchandise inventory, credit card receivables and certain other assets. Borrowings under the U.S. Agreement are capped at the lesser of (1) 73 percent of the cost of eligible inventory during October through December and approximately 69 percent for the remainder of the fiscal year (minus certain reserves that may be established under the credit facility), plus 85 percent of credit card receivables or (2) 90 percent of the appraised liquidation value of eligible inventory (minus certain reserves that may be established under the credit facility), plus 85 percent of credit card receivables. Based on an inventory appraisal performed as of June 30, 2009, the available borrowings under the U.S. credit facility are currently determined under item (2) described above. For the period of September 2009 through August 2010 monthly borrowing rates calculated based on the cost of eligible inventory are as follows: 66 percent for September 2009, 73 percent for October 2009 through December 2009, and are projected to range from 60 percent to 63 percent for January 2010 through August 2010. These rates are subject to periodic adjustment under the provisions of the U.S. Agreement. The U.S. Agreement also provides for seasonal borrowing capabilities of up to $100 million and an accordion feature that allows us to permanently increase the facility size in $25 million increments up to an additional $100 million. At July 31, 2009 and 2008, $310.5 and $326.3 million, respectively, was outstanding under the U.S. Agreement. We had approximately $136.1 million and $129.5 million in available borrowings at July 31, 2009 and 2008, respectively. The maximum amount outstanding under the U.S. Agreement during fiscal years 2009 and 2008 was $499.3 million and $346.8 million, respectively. We may repay the loans at any time without penalty prior to the maturity date of August 2011.
The U.S. Agreement bears interest at a floating rate at either (i) LIBOR plus the applicable margin (as defined in the U.S. Agreement), or (ii) the base rate (as defined in the U.S. Agreement) plus the applicable margin. The margin applicable to LIBOR based loans and standby letter of credit commission rates will be automatically reduced or increased from time to time based upon excess borrowing availability under the U.S. Agreement. We pay a quarterly commitment fee of 0.20 percent to 0.25 percent on the preceding quarter's unused commitment. For the years ended July 31, 2009 and 2008, the weighted average effective interest rate was 2.6 percent and 5.1 percent, respectively. The applicable margin for LIBOR based loans was 1.25 percent at July 31, 2009 and 2008, and the applicable margin for Base Rate loans was zero percent at July 31, 2009 and 2008.
If remaining borrowing availability falls below $75 million, we will be restricted in our ability to repurchase stock or pay dividends. If remaining borrowing availability falls below $50 million, we will be required to meet a minimum fixed charge coverage ratio of 1.1:1.0 for an applicable 12 month reference period. We do not currently meet the minimum fixed charge coverage ratio. Due to the seasonal nature of our business, borrowings under our credit facility during the Holiday season increase significantly and our borrowing availability must be closely managed. Based on our cash flow projections for the remainder of fiscal 2010, we believe our borrowing availability will remain above $50 million, which will not trigger the fixed charge coverage ratio. However, if we do not meet our cash flow projections, our borrowing availability threshold may not remain above $50 million. These cash flow projections are based on revenue and expenditure estimates for the remainder of fiscal 2010. The U.S. Agreement also requires us to comply with certain other restrictive covenants including, among other things, limitations on indebtedness, investments, liens, acquisitions and asset sales.
Canadian Revolving Credit Agreement. The Canadian revolving credit agreement (the "Canadian Agreement") provided us up to CAD $30 million in commitments by Bank of America (acting through its Canadian branch) and was secured by a guaranty from certain U.S. affiliates. The interest rate on the Canadian Agreement was a floating rate of either (i) the BA rate (as defined in the Canadian Agreement) plus the applicable margin (as defined in the U.S. Agreement), or (ii) the Base Rate (as defined in the Canadian Agreement) plus the applicable margin. The margin applicable to BA rate based loans was
F-22
equivalent to the margin for LIBOR based loans as defined in the U.S. Agreement. We paid a quarterly commitment fee under the Canadian Agreement of 0.20 percent to 0.25 percent based on the unused commitment under the U.S. Agreement for the preceding quarter. We were allowed to repay the revolving credit loans outstanding at any time without penalty prior to the maturity date of August 2011.
The weighted average effective interest rate was 6.0 percent for the year ended July 31, 2008. The applicable margin for BA based loans was 1.0 percent at July 31, 2008 and the applicable margin for Base Rate loans was zero percent at July 31, 2008.
In February 2009, we terminated our Canadian Agreement and entered into certain Joinder Agreements under which we will utilize our Canadian and Puerto Rican subsidiaries' inventory, credit card receivables and certain other assets as collateral under the U.S. Agreement. The increase in collateral under the U.S. Agreement offset the decline in available borrowings that would have occurred as a result of the decrease in the appraised liquidation value. There were no borrowings outstanding under the Canadian Agreement at the time of termination.
Interest paid under the U.S. and Canadian Agreements during fiscal years 2009 and 2008 was $11.0 million and $12.9 million, respectively.
12. LEASES
We rent most of our retail space under operating leases that generally range from 5 to 10 years and may contain minimum rent escalations, while kiosk leases generally range from three to five years. Our store support center lease extends to 2018. We recognize the minimum rent payments on a straight-line basis over the term of the lease, including the construction period. Contingent rentals paid to lessors of certain store facilities are determined principally on the basis of a percentage of sales in excess of contractual limits. All existing real estate leases are operating leases. Rent expense from continuing operations is included in SG&A and is as follows for fiscal years 2009 and 2008 (in thousands):
| |
Year Ended July 31, | |||||||
|---|---|---|---|---|---|---|---|---|
| |
2009 | 2008 | ||||||
Retail space: |
||||||||
Minimum rentals |
$ | 202,656 | $ | 204,210 | ||||
Rentals based on sales |
3,297 | 5,490 | ||||||
|
205,953 | 209,700 | ||||||
Equipment and corporate headquarters |
2,166 | 3,431 | ||||||
|
$ | 208,119 | $ | 213,131 | ||||
Future minimum lease payments as of July 31, 2009, for all non-cancelable leases were as follows (in thousands):
Year Ended
|
Minimum Rent Commitments |
||||
|---|---|---|---|---|---|
2010 |
$ | 174,340 | |||
2011 |
147,490 | ||||
2012 |
123,162 | ||||
2013 |
107,490 | ||||
2014 |
94,108 | ||||
Thereafter |
215,143 | ||||
|
$ | 861,733 | |||
F-23
13. INCOME TAXES
Currently, we file a consolidated income tax return. The effective income tax rate from continuing operations varies from the federal statutory rate of 35 percent as follows (in thousands):
| |
Year Ended July 31, | |||||||
|---|---|---|---|---|---|---|---|---|
| |
2009 | 2008 | ||||||
| |
|
As Restated |
||||||
Federal income tax expense at statutory rate |
$ | (84,867 | ) | $ | (592 | ) | ||
State income taxes, net of federal benefit |
(9,942 | ) | 1,345 | |||||
Tax on repatriation of foreign earnings(a) |
13,912 | — | ||||||
Canadian rate changes(b) |
(2,878 | ) | (2,446 | ) | ||||
Foreign & U.S. tax credits |
8,159 | (1,319 | ) | |||||
Goodwill impairment |
1,750 | — | ||||||
Expiration of net operating loss carryforwards |
— | 4,349 | ||||||
Valuation allowance |
21,532 | 1,904 | ||||||
IRC Section 162m limitation |
776 | 674 | ||||||
Other |
(1,457 | ) | 846 | |||||
Income tax (benefit) expense |
$ | (53,015 | ) | $ | 4,761 | |||
Effective income tax rate |
21.9 | % | (281.4 | )% | ||||
- (a)
- During
fiscal year 2009, we revoked our election under APB 23, resulting in $13.9 million in additional tax expense. The additional expense
includes $36.5 million in federal and state income taxes primarily related to the repatriation of Canadian earnings offset by $22.6 million in foreign tax deductions.
- (b)
- For the last two years Canada has reduced both its federal and provincial tax rates.
The provision for income taxes from continuing operations consists of the following (in thousands):
| |
Year Ended July 31, | ||||||||
|---|---|---|---|---|---|---|---|---|---|
| |
2009 | 2008 | |||||||
| |
|
As Restated |
|||||||
Current income tax expense: |
|||||||||
Federal |
$ | 520 | $ | 2,293 | |||||
Foreign |
6,830 | 17,661 | |||||||
State |
869 | 701 | |||||||
Total current income tax expense |
8,219 | 20,655 | |||||||
Deferred income tax benefit: |
|||||||||
Federal |
(60,107 | ) | (11,034 | ) | |||||
Foreign |
1,296 | (5,700 | ) | ||||||
State |
(2,423 | ) | 840 | ||||||
Total deferred income tax benefit |
(61,234 | ) | (15,894 | ) | |||||
|
$ | (53,015 | ) | $ | 4,761 | ||||
Deferred tax assets and liabilities are determined based on estimated future tax effects of the difference between the financial statement and tax basis of asset and liability balances using statutory tax
F-24
rates. Tax effects of temporary differences that give rise to significant components of the deferred tax assets and deferred tax liabilities at July 31, 2009 and 2008, respectively, are as follows (in thousands):
| |
Year Ended July 31, | |||||||||
|---|---|---|---|---|---|---|---|---|---|---|
| |
2009 | 2008 | ||||||||
| |
|
As Restated |
||||||||
Current deferred taxes: |
||||||||||
Assets |
||||||||||
Accrued liabilities |
$ | 44,875 | $ | 36,655 | ||||||
Inventory reserves |
12,088 | 5,983 | ||||||||
Net operating loss carryforward |
5,255 | — | ||||||||
Other |
356 | 900 | ||||||||
Current deferred tax assets |
62,574 | 43,538 | ||||||||
Liabilities |
||||||||||
Merchandise inventories, principally due to LIFO reserve |
(104,295 | ) | (102,485 | ) | ||||||
Accrued liabilities |
(4,662 | ) | (6,799 | ) | ||||||
Current deferred tax liabilities, net |
$ | (46,383 | ) | $ | (65,746 | ) | ||||
Non-current deferred taxes: |
||||||||||
Assets |
||||||||||
Net operating loss carryforward |
$ | 30,906 | $ | 6,968 | ||||||
Stock-based compensation |
3,820 | — | ||||||||
Postretirement benefits |
— | 3,737 | ||||||||
Accrued liabilities |
50,081 | 21,964 | ||||||||
State and local taxes |
(38 | ) | (1,028 | ) | ||||||
Investments in subsidiaries |
1,695 | 9,684 | ||||||||
Other |
4,841 | 4,658 | ||||||||
|
91,305 | 45,983 | ||||||||
Valuation allowances |
(23,436 | ) | (1,904 | ) | ||||||
Non-current deferred tax assets |
67,869 | 44,079 | ||||||||
Liabilities |
||||||||||
Property and equipment |
(1,144 | ) | (8,382 | ) | ||||||
Undistributed earnings |
— | (7,596 | ) | |||||||
Goodwill |
(12,752 | ) | (12,950 | ) | ||||||
Other |
(2,441 | ) | (4,272 | ) | ||||||
Non-current deferred tax assets, net |
$ | 51,532 | $ | 10,879 | ||||||
Deferred tax assets, net of valuation allowances, were $130.4 million and $87.6 million at July 31, 2009 and 2008, respectively. Deferred tax liabilities were $125.3 million and $142.5 million at July 31, 2009 and 2008, respectively.
A valuation allowance must be provided when it is more likely than not that the deferred income tax asset will not be realized. Our valuation allowances totaled $23.4 million and $1.9 million as of July 31, 2009 and 2008, respectively, and relate to deferred tax assets associated with certain federal, state and foreign net operating loss carryforwards. The valuation allowances were established due to the uncertainty of our ability to utilize the net operating loss carryforwards in the future.
F-25
Deferred tax assets associated with net operating loss carryforwards totaled $36.2 million and $7.0 million as of July 31, 2009 and 2008, respectively. Deferred tax assets associated with foreign tax credits totaled $0.4 million and $8.2 million as of July 31, 2009 and 2008, respectively. The net operating loss carryforwards expire from fiscal 2010 to fiscal 2030.
The total amount of unrecognized tax benefits as of July 31, 2009 was $4.7 million, of which $3.3 million would favorably impact the effective tax rate if resolved in our favor. Over the next twelve months, management does not anticipate that the amount of unrecognized tax benefits will be reduced due to our tax position being sustained upon audit or as a result of the expiration of the statute of limitations for specific jurisdictions.
A reconciliation of the fiscal year 2009 beginning and ending balance of unrecognized tax benefits is as follows (in thousands):
| |
Unrecognized Tax Benefits |
|||
|---|---|---|---|---|
Balance at July 31, 2008 |
$ | 6,002 | ||
Additions based on tax positions related to fiscal 2009 |
134 | |||
Additions based on tax positions related to prior years |
280 | |||
Releases based on tax positions related to prior years |
(799 | ) | ||
Settlements with tax authorities |
(597 | ) | ||
Expiration of statute of limitations |
(288 | ) | ||
Balance at July 31, 2009 |
$ | 4,732 | ||
We recognize accrued interest and penalties related to unrecognized tax benefits in our income tax expense. We had $2.7 million and $1.8 million of interest and penalties accrued at July 31, 2009 and July 31, 2008, respectively. During fiscal years 2009 and 2008, we recognized interest expense totaling $0.4 million and $0.6 million, respectively.
Income tax refunds, net of taxes paid, during fiscal year 2009 totaling $6.4 million. Income taxes paid, net of refunds, for fiscal year 2008 was $1.0 million.
14. STOCK-BASED COMPENSATION
We are authorized to provide grants of options to purchase our common stock, restricted stock, restricted stock units and performance-based restricted stock units under the Zale Corporation 2003 Stock Incentive Plan and the Non-Employee Director Equity Compensation Plan (collectively, the "Plans"). We are authorized to issue up to 6.3 million shares of our common stock for stock options and restricted stock to employees and non-employee directors under the Plans. Stock options and restricted share awards are issued from treasury stock. Stock-based compensation expense is included in SG&A in the consolidated statements of operations and totaled $5.7 million and $4.4 million for the fiscal years ended July 31, 2009 and 2008, respectively. As of July 31, 2009, there was $11.6 million of unrecognized compensation cost related to stock-based awards that is expected to be recognized over a weighted-average period of 2.4 years. The income tax benefit recognized in the consolidated statements of operations related to stock-based compensation totaled $0.5 million and $1.3 million during fiscal 2009 and 2008, respectively.
Stock Options. Stock options are granted at an exercise price equal to or greater than the market value of the shares of our common stock at the date of grant, generally vest ratably over a four-year vesting period and generally expire ten years from the date of grant. Expense related to stock options is recognized using a graded-vesting schedule over the vesting period.
F-26
Stock option transactions during fiscal year 2009 are summarized as follows:
| |
Number of Options |
Weighted Average Exercise Price |
Weighted Average Remaining Contractual Life (Years) |
Aggregate Intrinsic Value |
|||||||||
|---|---|---|---|---|---|---|---|---|---|---|---|---|---|
Outstanding, beginning of year |
2,716,237 | $ | 23.69 | ||||||||||
Granted |
929,600 | 23.32 | |||||||||||
Exercised |
(256,670 | ) | 24.43 | ||||||||||
Forfeited |
(461,527 | ) | 24.93 | ||||||||||
Expired |
(178,774 | ) | 25.46 | ||||||||||
Outstanding, end of year |
2,748,866 | $ | 23.18 | 7.35 | $ | 196,970 | |||||||
Options exercisable, end of year |
1,255,804 |
$ |
24.96 |
5.86 |
$ |
— |
|||||||
For the years ended July 31, 2009 and 2008, the total intrinsic value of stock options exercised was $1.2 million and $0.4 million, respectively. The weighted average fair values of option grants were $7.38 and $6.09 during fiscal years 2009 and 2008, respectively. The fair value of stock options that vested during fiscal year 2009 and 2008 was $3.2 million and $3.4 million, respectively.
The fair value of each stock option grant is estimated on the date of grant using the Black-Scholes option pricing model. The following table presents the weighted-average assumptions used in the option pricing model for stock option grants in fiscal years 2009 and 2008:
| |
2009 | 2008 | |||||
|---|---|---|---|---|---|---|---|
Expected volatility |
41.4 | % | 27.7 | % | |||
Risk-free interest rate |
2.7 | % | 3.6 | % | |||
Expected lives in years |
5.0 | 5.0 | |||||
Dividend yield |
0.0 | % | 0.0 | % | |||
Expected volatility and the expected life of the stock options are based on historical experience. The risk-free rate is based on the yield of a five-year Treasury Note.
Restricted Share Awards. Restricted share awards consist of restricted stock, restricted stock units and performance-based restricted stock units. Restricted stock and restricted stock units granted to employees through fiscal 2007 generally vest on the third anniversary of the grant date and are subject to restrictions on sale or transfer. Restricted stock and restricted stock units granted to employees after fiscal 2007 generally vest twenty-five percent on the second and third anniversary of the date of the grant and the remaining fifty percent vest on the fourth anniversary of the date of the grant, subject to restrictions on sale or transfer. Restricted stock granted to non-employee directors vest on the first anniversary of the grant date and are subject to restrictions on sale or transfer. The fair value of restricted stock and restricted stock units is based on our closing stock price on the date of grant. Performance-based restricted stock units entitle the holder to receive a specified number of shares of our common stock based on our achievement of performance targets established by the Compensation Committee. If we fail to meet the specified performance targets, the holder will not receive any shares of common stock, or, if we substantially exceed the targets, the holder may receive up to two hundred percent of the performance-based restricted stock units granted. At the sole discretion of the Compensation Committee, the holder of a restricted stock unit or performance-based restricted stock unit may receive a cash payment in lieu of a payout of shares of common stock equal to the fair market value of the number of shares of common stock the holder otherwise would have received.
F-27
Restricted share award transactions during fiscal year 2009 are summarized as follows:
| |
Number of Restricted Share Awards |
Weighted Average Fair Value Per Award |
|||||
|---|---|---|---|---|---|---|---|
Restricted share awards, beginning of year |
540,430 | $ | 19.25 | ||||
Granted |
307,416 | 19.41 | |||||
Vested |
(135,563 | ) | 15.02 | ||||
Forfeited |
(271,500 | ) | 24.56 | ||||
Restricted share awards, end of year |
440,783 | $ | 17.39 | ||||
15. STOCK REPURCHASE PROGRAM
During fiscal 2008, the Board of Directors authorized share repurchases of $350 million. As part of the stock repurchase program, we entered into an accelerated share repurchase agreement ("ASR") for $100 million and four Rule 10b5-1 plans (the "10b5-1 Plans"). In November 2007, the counterparty under the ASR delivered 4.3 million shares to us. In April 2008, an additional 1.6 million shares were delivered upon final settlement of the ASR. We also repurchased $226.7 million, or 11.7 million shares, of our common stock under the 10b5-1 Plans and through open market purchases. A total of 17.6 million shares were repurchased during fiscal 2008 at an average price of $18.59. As of July 31, 2009, we were authorized to repurchase an additional $23.3 million under our stock repurchase program.
16. COMPREHENSIVE INCOME
Comprehensive income represents the change in equity during a period from transactions and other events, except those resulting from investments by and distributions to stockholders. Income taxes are generally not provided for foreign currency translation adjustments, as such adjustments relate to permanent investments in international subsidiaries.
The following table gives further detail regarding changes in the composition of accumulated other comprehensive income (in thousands):
| |
Cumulative translation adjustment |
Unrealized gain (loss) on securities |
Total accumulated other comprehensive income |
|||||||
|---|---|---|---|---|---|---|---|---|---|---|
Balance at July 31, 2007 |
$ | 46,378 | $ | (439 | ) | $ | 45,939 | |||
Cumulative translation adjustment |
4,356 | — | 4,356 | |||||||
Unrealized gain on securities |
— | 791 | 791 | |||||||
Reclassification to earnings |
— | (50 | ) | (50 | ) | |||||
Balance at July 31, 2008 |
50,734 | 302 | 51,036 | |||||||
Cumulative translation adjustment |
(13,810 |
) |
— |
(13,810 |
) |
|||||
Unrealized gain on securities |
— | 521 | 521 | |||||||
Reclassification to earnings |
— | (440 | ) | (440 | ) | |||||
Balance at July 31, 2009 |
$ | 36,924 | $ | 383 | $ | 37,307 | ||||
F-28
17. SEGMENTS
We report our operations under three business segments: Fine Jewelry, Kiosk Jewelry, and All Other. All corresponding items of segment information in prior periods have been presented consistently.
The Fine Jewelry segment consists of five principal brands, which sell diamonds, gemstone, gold jewelry and watches. These five brands have been aggregated into one reportable segment. The Kiosk Jewelry segment operates under the brand names Piercing Pagoda®, Plumb Gold™, and Silver and Gold Connection® through mall-based kiosks and reaches the opening price point select jewelry customer. The Kiosk Jewelry segment specializes in gold and silver products that capitalize on the latest fashion trends. The All Other segment includes credit insurance operations, which provide offerings of insurance coverage primarily to our private label credit card customers. Management's expectation is that overall economics of each of our major brands within each reportable segment will be similar over time.
We use earnings before unallocated corporate overhead, interest and taxes but include an internal charge for inventory carrying cost to evaluate segment profitability. Unallocated costs before income taxes include corporate employee-related costs, administrative costs, information technology costs, corporate facilities and depreciation expense.
Income tax information by segment has not been included as taxes are calculated at a company-wide level and not allocated to each segment.
| |
Year Ended July 31, | ||||||||
|---|---|---|---|---|---|---|---|---|---|
Selected Financial Data by Segment
|
2009 | 2008 | |||||||
| |
|
As Restated |
|||||||
| |
(amounts in thousands) |
||||||||
Revenues: |
|||||||||
Fine Jewelry(a) |
$ | 1,535,626 | $ | 1,876,170 | |||||
Kiosk |
232,809 | 249,489 | |||||||
All Other |
11,309 | 12,382 | |||||||
Total revenues |
$ | 1,779,744 | $ | 2,138,041 | |||||
Depreciation and amortization: |
|||||||||
Fine Jewelry |
$ | 42,407 | $ | 42,832 | |||||
Kiosk |
4,899 | 5,296 | |||||||
All Other |
— | — | |||||||
Unallocated |
11,641 | 12,116 | |||||||
Total depreciation and amortization |
$ | 58,947 | $ | 60,244 | |||||
Operating (losses) earnings: |
|||||||||
Fine Jewelry(b) |
$ | (192,683 | ) | $ | 18,909 | ||||
Kiosk(c) |
2,465 | 9,905 | |||||||
All Other |
5,706 | 5,641 | |||||||
Unallocated(d) |
(47,607 | ) | (27,283 | ) | |||||
Total operating (losses) earnings |
$ | (232,119 | ) | $ | 7,172 | ||||
Assets(e): |
|||||||||
Fine Jewelry(f) |
$ | 868,227 | $ | 987,369 | |||||
Kiosk |
107,457 | 118,601 | |||||||
All Other |
24,842 | 27,234 | |||||||
Unallocated |
230,446 | 282,056 | |||||||
Total assets |
$ | 1,230,972 | $ | 1,415,260 | |||||
F-29
| |
Year Ended July 31, | ||||||||
|---|---|---|---|---|---|---|---|---|---|
Selected Financial Data by Segment
|
2009 | 2008 | |||||||
| |
|
As Restated |
|||||||
| |
(amounts in thousands) |
||||||||
Capital expenditures: |
|||||||||
Fine Jewelry |
$ | 18,702 | $ | 59,289 | |||||
Kiosk |
420 | 3,266 | |||||||
All Other |
— | — | |||||||
Unallocated |
9,235 | 22,582 | |||||||
Total capital expenditures |
$ | 28,357 | $ | 85,137 | |||||
- (a)
- Includes
$256.7 million and $321.9 million in fiscal years 2009 and 2008, respectively, related to foreign operations.
- (b)
- Fiscal
year 2009 includes $46.5 million related to charges associated with store closures, store impairments and goodwill impairments. Fiscal year
2009 also includes $13.5 million related to an inventory impairment charge. Fiscal year 2008 includes a $1.9 million store impairment charge.
- (c)
- Fiscal
year 2009 includes $0.4 million related to costs associated with store closures.
- (d)
- Fiscal
year 2009 includes a $23.2 million charge related to the Bailey Banks & Biddle contingent lease obligations. Fiscal year 2008 includes
a $12.6 million benefit associated with a change in our vacation policy. Also, includes credits of $60.1 million and $66.8 million in fiscal years 2009 and 2008, respectively, to
offset internal carrying costs charged to the segments.
- (e)
- Assets
allocated to segments include fixed assets, inventories, goodwill and investments held by our insurance operations. Unallocated assets include cash,
prepaid assets such as rent, corporate office improvements and technology infrastructure.
- (f)
- Includes $40.6 million and $47.0 million of fixed assets in fiscal years 2009 and 2008, respectively, related to foreign operations.
18. CONTINGENCIES
In connection with the sale of the Bailey Banks & Biddle brand in November 2007, the buyer, Finlay Fine Jewelry Corporation ("Finlay"), assumed the obligations for the store operating leases. As a condition of this assignment, we remained contingently liable for the leases for the remainder of the respective current lease terms, which generally ranged from fiscal 2009 through fiscal 2017. The maximum potential liability for base rent payments under the leases totaled approximately $62 million as of July 31, 2009. As of October 29, 2009, we finalized agreements or reached agreements in principle with the landlords to settle the contingent lease obligations for 38 of 45 leases. Settlement discussions with respect to the contingent obligations for the remaining 7 locations are still under negotiation. Base rents for the remaining 7 stores totaled approximately $28 million as of July 31, 2009. On August 5, 2009, Finlay filed for Chapter 11 bankruptcy protection and subsequently decided to liquidate. We recorded a $23.2 million charge during the fourth quarter of fiscal 2009 associated with all 45 Bailey Banks & Biddle locations. The charge was based on the preliminary agreements reached with the landlords and expectations of future payments required to settle the remaining 7 leases.
Under arrangements with Citibank, N.A. and one of its subsidiaries (collectively, "Citibank"), Citibank provides financing for our customers to purchase merchandise through private label credit cards. The arrangements also enable us to write credit insurance. Customers use our Citibank arrangements to pay for approximately 40 percent of purchases in the U.S. and approximately 30 percent of purchases in Canada. Under the agreements governing our arrangements, our Canadian and U.S. subsidiaries must satisfy various financial and other covenants. As of May 2009, our Canadian subsidiary did not satisfy a fixed charge coverage covenant, which could allow Citibank to terminate the agreement upon 30 days
F-30
written notice, and our U.S. subsidiary did not satisfy a minimum sales threshold, which could allow Citibank to terminate the U.S. agreement upon 180 days written notice if certain cure provisions were not met by us. In June 2009, we amended the agreements with Citibank as follows: (1) Citibank waived its right to terminate both agreements for the covenant violations described above prior to March 2010, (2) we will provide Citibank a $5 million letter of credit and, for the period November 15 through February 14 of each year, an additional $10 million seasonal letter of credit in connection with our U.S. agreement, (3) the minimum sales threshold was lowered related to our U.S. subsidiary and (4) Citibank released its right to require us to purchase the U.S. receivable portfolio upon termination of the agreement as a result of our failure to meet the minimum sales threshold.
In September 2008, one of our vendors filed for bankruptcy protection. As of July 31, 2009, an affiliate of the vendor held approximately 5,000 ounces of gold, or $4.4 million, belonging to the Company. Although we believe we are entitled to the return of the gold, not all of the gold will be returned. Subsequent to July 31, 2009 we received $1.5 million from the vendor and, as a result, recorded a $2.9 million charge in SG&A during fiscal year 2009.
We were named as a defendant in two lawsuits arising, in general, from matters that were the subject of a Securities and Exchange Commission investigation that was terminated, as we announced on September 24, 2006, with no enforcement action being recommended: In re Zale Corporation Securities Litigation No. 3:06-CV-01470-K, filed January 29, 2007, U.S. District Court for the Northern District of Texas; and Salvato v. Zale Corp., No. 3:06-CV-1124 (SAF), filed March 5, 2007, U.S. District Court for the Northern District of Texas, originally filed June 26, 2006 and consolidated with Connell v. Zale Corp., originally filed August 7, 2006, U.S. District Court for the Southern District of New York and transferred to the U.S. District Court for the Northern District of Texas. These lawsuits were the product of the consolidation of six lawsuits that were initially filed in New York and Texas. Various current and former officers and directors also were defendants.
Both lawsuits were purported class actions. In In re Zale Corporation Securities Litigation, the plaintiffs alleged various violations of securities laws based upon our public disclosures. In Salvato, the plaintiffs alleged various violations of the Employee Retirement Income Security Act of 1974 based upon the investment by the Zale Corporation Savings and Investment Plan in Company stock.
On February 29, 2008, a Stipulation and Settlement Agreement was filed in In re Zale Corporation Securities Litigation that resulted in the dismissal of that litigation on July 10, 2008, without any direct cost to the Company. The time to appeal the dismissal expired on August 11, 2008 and the case is now concluded.
We settled our Salvato v. Zale Corporation, et al disputes during the quarter ended October 31, 2008. The settlement was subject to a fairness hearing that took place on November 21, 2008. The settlement was approved and the case is now concluded.
In June 2007, we agreed to settle a California wage and hour dispute that was filed against us in Sacramento County Superior Court as a purported class action by certain current and former employees. The settlement totaled $3.8 million and requires us to make payments on a claims-made basis, subject to a minimum payout. The charge was recorded in SG&A during fiscal year 2007. The settlement was subject to a fairness hearing that took place on November 21, 2008. The settlement was approved and the case is now concluded.
We are involved in legal and governmental proceedings as part of the normal course of our business. Reserves have been established based on management's best estimates of our potential liability in these matters. These estimates have been developed in consultation with internal and external counsel and are based on a combination of litigation and settlement strategies. Management believes that such litigation and claims will be resolved without material effect on our financial position or results of operations.
F-31
19. DEFERRED REVENUE
We offer our customers lifetime warranties on certain products that cover sizing and breakage with an option to purchase theft protection for a two-year period. The revenue from the lifetime warranties is recognized on a straight-line basis over a five-year period. The change in deferred revenue from continuing operations associated with the sale of warranties is as follows (in thousands):
| |
Year Ended July 31, | |||||||
|---|---|---|---|---|---|---|---|---|
| |
2009 | 2008 | ||||||
Deferred revenue, beginning of period |
$ | 168,811 | $ | 89,574 | ||||
Warranties sold(a) |
93,549 | 120,807 | ||||||
Revenue recognized |
(52,180 | ) | (41,570 | ) | ||||
Deferred revenue, end of period |
$ | 210,180 | $ | 168,811 | ||||
- (a)
- Warranty sales for the year ended July 31, 2009 and 2008 include approximately $0.6 million and $0.1 million, respectively, related to the depreciation of the Canadian dollar based on the deferred revenue balance at the beginning of the period.
20. BENEFIT AND RETIREMENT PLANS
We maintain the Zale Corporation Savings & Investment Plan (the "US Plan") and the Zale Corporation Puerto Rico Employees Savings and Investment Plan (the "PR Plan"). The PR Plan was adopted in fiscal year 2008. As amended in fiscal year 2009, both plans allow all employees who are at least age 21 to participate in the plans, although new employees are required to complete one year of continuous service with us to be eligible to participate. Each employee in the US Plan can contribute from one percent to 60 percent of his or her annual salary subject to Internal Revenue Service ("IRS") limitations, (30 percent for highly-compensated employees). Employees in the PR Plan can contribute from one to 10 percent of his or her annual salary subject to the Puerto Rico Internal Revenue Code ("PR Code"). Employees who have not otherwise elected will be automatically enrolled in their respective plan at a contribution rate of two percent upon satisfying all eligibility requirements. We currently match $0.50 in cash for every dollar an employee of either plan contributes to the plan up to four percent of annual compensation subject to IRS and PR Code limitations. Matching contributions are made on an annual basis, and employees must be employed with us on the last day of the plan year to receive our matching contributions. Beginning in fiscal 2010 matching contributions will be made on a bi-weekly rather than on an annual basis. Employees who began contributing to the plans prior to calendar year 2009 vest in our matched contributions immediately. Employees who began contributing to the plans after calendar year 2008 must complete two years of service prior to vesting in matched contributions. Due to economic conditions, we temporarily suspended matching contributions effective February 27, 2009 with respect to any pre-tax contributions remitted to the plans during that period. We will periodically reevaluate whether business conditions permit the reinstatement of the matching contributions. Our matching contributions were $2.9 million and $2.1 million for fiscal years 2009 and 2008, respectively.
F-32
21. QUARTERLY RESULTS OF CONTINUING OPERATIONS (UNAUDITED)
Unaudited quarterly results of continuing operations for the fiscal years ended July 31, 2009 and 2008 were as follows (in thousands, except per share data):
| |
Fiscal Year 2009 For the Three Months Ended |
||||||||||||
|---|---|---|---|---|---|---|---|---|---|---|---|---|---|
| |
July 31, 2009 | April 30, 2009 | January 31, 2009 | October 31, 2008 | |||||||||
| |
|
As Restated |
As Restated |
As Restated |
|||||||||
Revenues |
$ | 357,114 | $ | 379,110 | $ | 679,391 | $ | 364,130 | |||||
Cost of sales(a) |
191,363 | 189,075 | 380,691 | 187,443 | |||||||||
Net loss(b) |
(89,799 | ) | (19,545 | ) | (31,776 | ) | (48,383 | ) | |||||
Net loss per diluted share |
(2.81 | ) | (0.61 | ) | (1.00 | ) | (1.52 | ) | |||||
| |
Fiscal Year 2009 For the Three Months Ended |
||||||||||||
|---|---|---|---|---|---|---|---|---|---|---|---|---|---|
| |
July 31, 2009 | April 30, 2009 | January 31, 2009 | October 31, 2008 | |||||||||
| |
|
As Reported |
As Reported |
As Reported |
|||||||||
Revenues |
$ | 357,114 | $ | 379,110 | $ | 679,391 | $ | 364,130 | |||||
Cost of sales(a) |
191,363 | 189,075 | 380,691 | 187,443 | |||||||||
Net loss(b) |
(89,799 | ) | (23,195 | ) | (23,575 | ) | (45,349 | ) | |||||
Net loss per diluted share |
(2.81 | ) | (0.73 | ) | (0.74 | ) | (1.43 | ) | |||||
| |
Fiscal Year 2008—As Restated For the Three Months Ended |
||||||||||||
|---|---|---|---|---|---|---|---|---|---|---|---|---|---|
| |
July 31, 2008 | April 30, 2008 | January 31, 2008 | October 31, 2007 | |||||||||
Revenues |
$ | 456,222 | $ | 476,736 | $ | 827,820 | $ | 377,264 | |||||
Cost of sales |
240,471 | 250,196 | 419,810 | 179,076 | |||||||||
Net (loss) earnings(c) |
(9,977 | ) | (20,862 | ) | 60,522 | (29,052 | ) | ||||||
Net (loss) earnings per diluted share |
(0.30 | ) | (0.50 | ) | 1.34 | (0.60 | ) | ||||||
| |
Fiscal Year 2008—As Reported For the Three Months Ended |
||||||||||||
|---|---|---|---|---|---|---|---|---|---|---|---|---|---|
| |
July 31, 2008 | April 30, 2008 | January 31, 2008 | October 31, 2007 | |||||||||
Revenues |
$ | 456,222 | $ | 476,736 | $ | 827,820 | $ | 377,264 | |||||
Cost of sales |
240,471 | 250,196 | 419,810 | 179,076 | |||||||||
Net (loss) earnings(c) |
(4,884 | ) | (17,397 | ) | 52,653 | (26,655 | ) | ||||||
Net (loss) earnings per diluted share |
(0.15 | ) | (0.42 | ) | 1.16 | (0.54 | ) | ||||||
- (a)
- The
fourth quarter includes a $13.5 million inventory impairment charge.
- (b)
- The
net loss for the fourth quarter includes a $50.2 million charge related to costs associated with store closures and reserves related to the
Bailey Banks & Biddle contingent lease obligations. The fourth quarter loss also includes $6.7 million in store impairments and a $13.5 million inventory impairment. The net loss
for the second quarter includes an $8.2 million store impairment and a $5.0 million goodwill impairment.
- (c)
- The net loss for the fourth quarter includes a $12.6 million benefit related to a change in our vacation policy and a $3.5 million gain related to the sale of our interest in a diamond known as the "Incomparable Diamond." The fourth quarter loss includes $0.3 million in store impairments. Net earnings for the second quarter includes a $1.6 million store impairment charge.
Note: Restated amounts reflect adjustments associated with advertising costs, intercompany accounts receivable, depository bank accounts, federal income taxes and personal property taxes. These adjustments are more fully described in Note 2 to these consolidated financial statements.
F-33
Pursuant to the requirements of Section 13 or 15(d) of the Securities Exchange Act of 1934, the registrant has duly caused this report to be signed on its behalf by the undersigned, thereunto duly authorized, as of the 29th day of October, 2009.
| ZALE CORPORATION | ||||
By: |
/s/ NEAL L. GOLDBERG Neal L. Goldberg Chief Executive Officer |
|||
KNOW ALL MEN BY THESE PRESENTS, that each person whose signature appears below constitutes and appoints Neal L. Goldberg and Matthew W. Appel, and each of them, as his true and lawful attorneys-in-fact and agents, with full powers and substitution and resubstitution for him, in his name place and stead, in any and all capacities, to sign any and all amendments to this Annual Report on Form 10-K, and to file the same, with all exhibits thereto, and other documents in connection therewith, with the Securities and Exchange Commission, granting unto said attorneys-in-fact and agents full power and authority to do perform each and every act and thing requisite and necessary to be done in and about the premises as fully and to all intents and purposes as he might or could do in person, hereby ratifying and confirming all that said attorneys-in-fact and agents may lawfully do or cause to be done by virtue hereof.
Pursuant to the requirements of the Securities Exchange Act of 1934, this report has been signed below by the following persons on behalf of the registrant and in the capacities and on the dates indicated.
Signature
|
Title
|
Date
|
||
|---|---|---|---|---|
| /s/ NEAL L. GOLDBERG Neal L. Goldberg |
Chief Executive Officer (principal executive officer of the registrant), Director |
October 29, 2009 | ||
/s/ MATTHEW W. APPEL Matthew W. Appel |
Executive Vice President and Chief Financial Officer (principal financial officer of the registrant) |
October 29, 2009 |
||
/s/ JAMES E. SULLIVAN James E. Sullivan |
Vice President, Controller and Chief Accounting Office (principal accounting officer of the registrant) |
October 29, 2009 |
||
/s/ JOHN B. LOWE, JR. John B. Lowe, Jr. |
Chairman of the Board |
October 29, 2009 |
||
/s/ J. GLEN ADAMS J. Glen Adams |
Director |
October 29, 2009 |
||
/s/ YUVAL BRAVERMAN Yuval Braverman |
Director |
October 29, 2009 |
Signature
|
Title
|
Date
|
||
|---|---|---|---|---|
| /s/ RICHARD C. BREEDEN Richard C. Breeden |
Director | October 29, 2009 | ||
/s/ JAMES M. COTTER James M. Cotter |
Director |
October 29, 2009 |
||
/s/ THOMAS C. SHULL Thomas C. Shull |
Director |
October 29, 2009 |
||
/s/ CHARLES M. SONSTEBY Charles M. Sonsteby |
Director |
October 29, 2009 |
||
/s/ DAVID M. SZYMANSKI David M. Szymanski |
Director |
October 29, 2009 |
| |
Exhibit Number |
Description of Exhibit | |||
|---|---|---|---|---|---|
| 10.2 | Form of Indemnification Agreement | ||||
10.13 |
Base Salaries and Target Bonus for the Named Executive Officers |
||||
14 |
Code of Business Conduct and Ethics |
||||
23.1 |
Consent of Ernst & Young LLP |
||||
31.1 |
Rule 13a-14(a) Certification of Chief Executive Officer |
||||
31.2 |
Rule 13a-14(a) Certification of Chief Financial Officer |
||||
32.1 |
Section 1350 Certification of Chief Executive Officer |
||||
32.2 |
Section 1350 Certification of Chief Financial Officer |
||||
The above list reflects all exhibits filed herewith. See Item 15 for a complete list of our exhibits, including exhibits incorporated by reference from previous filings.
PART I
-
ITEM 1A. RISK FACTORS
ITEM 1B. UNRESOLVED STAFF COMMENTS
ITEM 2. PROPERTIES
ITEM 3. LEGAL PROCEEDINGS AND OTHER MATTERS
ITEM 4. SUBMISSION OF MATTERS TO A VOTE OF SECURITY HOLDERS
-
ITEM 6. SELECTED FINANCIAL DATA
ITEM 7. MANAGEMENT'S DISCUSSION AND ANALYSIS OF FINANCIAL CONDITION AND RESULTS OF OPERATIONS
-
ITEM 7A. QUANTITATIVE AND QUALITATIVE DISCLOSURES ABOUT MARKET RISK
ITEM 8. FINANCIAL STATEMENTS AND SUPPLEMENTARY DATA
ITEM 9. CHANGES IN AND DISAGREEMENTS WITH ACCOUNTANTS AND FINANCIAL DISCLOSURE
ITEM 9A. CONTROLS AND PROCEDURES
ITEM 9B. OTHER INFORMATION
-
ITEM 10. DIRECTORS, EXECUTIVE OFFICERS AND CORPORATE GOVERNANCE
ITEM 11. EXECUTIVE COMPENSATION
ITEM 12. SECURITY OWNERSHIP OF CERTAIN BENEFICIAL OWNERS AND MANAGEMENT AND RELATED STOCKHOLDER MATTERS
ITEM 13. CERTAIN RELATIONSHIPS AND RELATED TRANSACTIONS, AND DIRECTOR INDEPENDENCE
ITEM 14. PRINCIPAL ACCOUNTANT FEES AND SERVICES
INDEX TO CONSOLIDATED FINANCIAL STATEMENTS
MANAGEMENT'S REPORT ON INTERNAL CONTROL OVER FINANCIAL REPORTING
REPORT OF INDEPENDENT REGISTERED PUBLIC ACCOUNTING FIRM
REPORT OF INDEPENDENT REGISTERED PUBLIC ACCOUNTING FIRM
ZALE CORPORATION AND SUBSIDIARIES CONSOLIDATED STATEMENTS OF OPERATIONS (in thousands, except per share amounts)
ZALE CORPORATION AND SUBSIDIARIES CONSOLIDATED BALANCE SHEETS (in thousands, except per share amounts)
ZALE CORPORATION AND SUBSIDIARIES CONSOLIDATED STATEMENTS OF CASH FLOWS (in thousands)
ZALE CORPORATION AND SUBSIDIARIES CONSOLIDATED STATEMENTS OF STOCKHOLDERS' INVESTMENT (in thousands)
ZALE CORPORATION AND SUBSIDIARIES NOTES TO CONSOLIDATED FINANCIAL STATEMENTS
CONSOLIDATED STATEMENT OF OPERATIONS YEAR ENDED JULY 31, 2008 (in thousands, except per share amounts)
CONSOLIDATED BALANCE SHEET AS OF JULY 31, 2008 (in thousands)
CONSOLIDATED CASH FLOW DATA YEAR ENDED JULY 31, 2008 (in thousands)
SIGNATURES