Attached files
| file | filename |
|---|---|
| 8-K - CURRENT REPORT - B. Riley Financial, Inc. | ea145022-8k_brileyfin.htm |
| EX-99.1 - PRESS RELEASE, DATED JULY 30, 2021 - B. Riley Financial, Inc. | ea145022ex99-1_brileyfin.htm |
Exhibit 99.2

1 Investor Presentation July 30, 2021
2 This presentation contains statements that are forward - looking statements within the meaning of Section 27 A of the Securities Act of 1933 , as amended, and Section 21 E of the Securities Exchange Act of 1934 , as amended that are based on management’s current expectations and assumptions and are subject to risks and uncertainties . These forward looking statements can often be identified by their use of words such as “anticipates,” “believes,” “can,” “continue,” “could,” “estimates,” “expects,” “forecast,” “intends,” “may,” “outlook,” “plans,” “potential,” “predicts,” “projects,” “should,” “target,” “will,” “would” or the negative of these terms or other comparable terminology . Such forward looking statements include, but are not limited to, expressed or implied statements regarding future financial performance and future dividends, the effects of our business model, the effects of our balance sheet on our ability to pursue business opportunities, statements regarding the effects and anticipated benefits of our acquisitions and related actions, the strength of our business segments, assessments of future opportunities and performance, expectations regarding future transactions, and the financial impact, size and consistency of returns and timing thereof, expectations regarding market dynamics, as well as statements regarding the effect of investments in our business segments . Because these forward - looking statements involve known and unknown risks and uncertainties, there are important factors that could cause actual results, events or developments to differ materially from those expressed or implied by these forward - looking statements . Factors that could cause actual results to differ from those contained in the forward - looking statements include but are not limited to risks related to : the unpredictable and ongoing impact of the COVID - 19 pandemic ; volatility in our revenues and results of operations ; changing conditions in the financial markets ; our ability to generate sufficient revenues to achieve and maintain profitability ; the short term nature of our engagements ; the accuracy of our estimates and valuations of inventory or assets in “guarantee” based engagements ; competition in the asset management business ; potential losses related to our auction or liquidation engagements ; our dependence on communications, information and other systems and third parties ; potential losses related to purchase transactions in our auctions and liquidations business ; the potential loss of financial institution clients ; potential losses from or illiquidity of our proprietary investments ; changing economic and market conditions ; potential liability and harm to our reputation if we were to provide an inaccurate appraisal or valuation ; failure to successfully compete in any of our segments ; loss of key personnel ; our ability to borrow under our credit facilities or raise additional funds through offerings as necessary ; failure to comply with the terms of our credit agreements ; our ability to meet future capital requirements ; and the diversion of management time on acquisition - related issues ; other risks described from time to time in B . Riley Financial, Inc . 's periodic filings with the SEC, including, without limitation, the risks described in B . Riley Financial, Inc . 's Annual Report on Form 10 - K for the year ended December 31 , 2020 and in our Quarterly Report on Form 10 - Q for the quarter ended March 31 , 2021 under the captions "Risk Factors" and "Management's Discussion and Analysis of Financial Condition and Results of Operations" (as applicable) . Additional information will be set forth in our Quarterly Report on Form 10 - Q for the quarter ended June 30 , 2021 . These factors should be considered carefully and readers are cautioned not to place undue reliance on such forward - looking statements . All information is current as of the date this presentation is issued, and B . Riley Financial, Inc . undertakes no duty to update this information . This presentation includes certain non - GAAP financial measures intended to supplement, not substitute for, comparable GAAP measures . Reconciliation of certain non - GAAP financial measures are provided in the appendix to this presentation . This presentation does not constitute an offer to sell or the solicitation of an offer to buy any securities . Any offers, solicitations or offers to buy, or any sales of securities will be made in accordance with the registration requirements of the Securities Act of 1933 , as amended . A shelf registration statement on Form S - 3 ASR was previously filed by the Company and was automatically effective upon filing with the SEC on January 28 , 2021 and a preliminary prospectus supplement will be filed by the Company . The offering will be made only by means of a prospectus . Copies of the preliminary prospectus relating to these securities may be obtained when available without charge from the offices of B . Riley Securities, Inc . , at 1300 North 17 th Street, Suite 1300 , Arlington, VA 22209 or by calling ( 703 ) 312 - 9580 or by emailing prospectuses@brileyfin . com . Safe Harbor Statement
3 I. Transaction Summary II. B. Riley Financial at a Glance III. Business Overview IV. Investments and Brands Overview V. Financial Overview VI. Appendix Table of Contents

4 I. Transaction Summary

5 Transaction Summary 1. Actual offering size and pricing may differ from the figures shown; offering size and pricing to be determined by negotiation s b etween the Company and the underwriter. Issuer B. Riley Financial, Inc. (Nasdaq: RILY) Security Senior Unsecured Notes Proposed Ticker / Exchange RILYZ / Nasdaq Offering Size $150,000,000 (1) Notes Offered 6,000,000 (1) Overallotment Option 15% Principal Amount per Note $25.00 Price Talk 5.25% area (1) Maturity The Notes will mature on August 31, 2028, unless redeemed prior to maturity. Optional Redemption Prior to August 31, 2023, the Issuer may, at its option, redeem the Notes, in whole at any time or in part from time to time, at a redemption price equal to 100% of the principal amount of the Notes to be redeemed, plus a Make - Whole Amount, plus accrued and unpaid interest to, but excluding, the date of redemption. The Issuer may redeem the Notes for cash in whole or in part at any time at its option (i) on or after August 31, 2023 and prior to August 31, 2024, at a price equal to $25.75 per note, plus accrued and unpaid interest to, but excluding, the date of redemption, (ii) on or after August 31, 2024 and prior to August 31, 2025, at a price equal to $25.50 per note, plus accrued and unpaid interest to, but excluding, the date of redemption, (iii) on or after August 31, 2025 and prior to August 31, 2026, at a price equal to $25.25 per note, plus accrued and unpaid interest to, but excluding, the date of redemption, and (iv) on or after August 31, 2026 and prior to maturity, at a price equal to 100% of their principal amount, plus accrued and unpaid interest to, but excluding, the date of redemption. Use of Proceeds The Issuer anticipates using the net proceeds from the sale of the notes for general corporate purposes, including funding future acquisitions and investments, repaying indebtedness ( which may, at the Issuer’s option, include redeeming all or a portion of its existing 7.375% 2023 Notes), making capital expenditures and funding working capital. Pending such use, the Issuer may invest the net proceeds in short - term interest - bearing accounts, securities or similar investments. Expected Pricing Date 8/3/21 Book - Running Managers B. Riley Securities, Janney Montgomery Scott, Ladenburg Thalmann , William Blair Lead Manager EF Hutton, division of Benchmark Investments, LLC Co - Managers Aegis Capital, Boenning & Scattergood, Huntington Capital Markets, InspereX , Maxim Group, NewBridge Securities, Wedbush Securities

6 Credit Metrics 1. $80M revolver drawdown related to $280M credit facility in July 2021. 2. Represents the principal balance of outstanding RILYG notes as of 6/30/21, which were fully redeemed in July 2021. 3. Includes impact of proposed $150M bond offering net of gross spread and offering expenses. Actual offering size , pricing and fees incurred may differ materially from the figures shown. 4. Includes $1,278.8M in securities and other investments owned minus $272.1M in securities sold not yet purchased. 5. Includes $270.3M Loans Receivables at Fair Value minus $4.4M Loans Participation Sold. 6. Other equity investments reported in prepaid expenses and other assets minus other investments participation sold reported in no ncontrolling interests. 7. Excludes ( i ) operating lease liabilities, and (ii) incremental sales of senior notes under our at - the - market sale program after 6/30/21. 8. Excludes incremental sales of series A and series B preferred stock under our at - the - market sale program after 6/30/21. 9. For a definition of Adjusted EBITDA and a reconciliation to GAAP financial measures, please see the Appendix. 10. Pro forma adjustment to interest expense related to 7.25% Senior Notes due 2027, which were fully redeemed in July 2021. 11. Pro forma adjustment to interest expense related to proposed $150M bond offering at presumed interest rate of 5.25%. 12. Net debt is defined as total debt, net of total cash, net securities and investments, and other. Pro Forma Credit Statistics 6/30/21 B. Riley Pro Forma Adjustments Pro Forma ($ in millions) Financial Revolver Drawdown (1) RILYG Redemption (2) Proposed Offering (3) Total (1)(2)(3) Cash and Cash Equivalents 297.4$ 80.0$ (122.8)$ 145.0$ 399.6$ Due from Clearing Brokers 424.9 - - - 424.9 Securities and Other Investments Owned, net (4) 1,006.7 - - - 1,006.7 Restricted Cash 1.3 - - - 1.3 Loans Receivable, net of Loans Participations Sold (5) 265.9 - - - 265.9 Advances Against Customer Contracts 0.2 - - - 0.2 Other Equity Investments and Other (6) 42.3 - - - 42.3 Total Cash, Net Securities and Investments, and Other 2,038.7 80.0 (122.8) 145.0 2,140.9 Senior Notes Payable - Bonds 1,213.1 - (122.8) - 1,090.3 New Bonds - - - 150.0 150.0 Term Loans 257.1 80.0 - - 337.1 Notes Payable 0.4 - - - 0.4 Total Debt (7) 1,470.6 80.0 (122.8) 150.0 1,577.8 Total Cash, Securities and Other Investments Owned, net of Debt (7) 568.1$ -$ -$ (5.0)$ 563.1$ Series A Preferred Stock (8) 64.5 - - - 64.5 Series B Preferred Stock (8) 39.8 - - - 39.8 Total Preferred Stock 104.3 - - - 104.3 Total Cash, Securities and Other Investments Owned, net of Debt and Preferred Stock (8)(9) 463.8$ -$ -$ (5.0)$ 458.8$ LTM 6/30/2021 Revenue 1,573.4 - - - 1,573.4 LTM 6/30/2021 Adjusted EBITDA (9) 865.0 - - - 865.0 LTM 6/30/2021 Interest Expense 73.7 - (8.9) (10) 7.9 (11) 72.7 LTM 6/30/2021 Preferred Dividends 6.1 - - - 6.1 Net Debt / LTM Adj. EBITDA (7)(9)(12) -0.7x N/A N/A N/A -0.7x Total Debt / LTM Adj. EBITDA (7)(9) 1.7x N/A N/A N/A 1.8x LTM Adj. EBITDA / LTM Interest Expense (9) 11.7x N/A N/A N/A 11.9x LTM Adj. EBITDA / LTM Interest Expense + Preferred Dividends (9) 10.8x N/A N/A N/A 11.0x

7 II. B. Riley Financial at a Glance

8 B. Riley Financial (NASDAQ:RILY) * International operations in Germany, Australia and India Bryant Riley Chairman & Co - CEO Tom Kelleher Co - CEO Phil Ahn CFO & COO Kenny Young President Alan Forman EVP General Counsel Dan Shribman Chief Investment Officer Key Executives Footprint Overview B . Riley Financial, Inc . (B . Riley) is a diversified financial services platform that provides collaborative solutions tailored to fit the capital raising and business advisory needs of its clients and partners . ● Founded in 1997 ● Publicly listed in 2014 ● Headquartered in Los Angeles ● 200 offices across the U.S. (1) ● 2,000 employees (1) ● Long - standing management ● Strong investment acumen ● History of returning capital to stockholders ● Over 20 years of continued growth (1) Figures shown are an approximation and do not reflect actual number of offices and employees.

9 Origin and Historical Timeline Platform enhancements provide diverse revenue streams and a suite of end - to - end, complementary services for clients and partners Meaningful value created, translated into earnings growth

10 Platform Strategy Diversified platform offers downside protection with an ability to deliver strong returns Solid foundation of businesses with stable base of recurring EBITDA Powerful earnings upside through market - driven episodic businesses Balance sheet flexibility to capitalize on high return opportunistic investments

11 Diversification Through Steady and Episodic Opportunities $322M $423M $652M $903M $1.57B FY 2017 FY 2018 FY 2019 FY 2020 Jun 2021 LTM $70M $90M $208M $407M $865M FY 2017 FY 2018 FY 2019 FY 2020 Jun 2021 LTM Consolidated Revenues Consolidated Adj. EBITDA (1) RECURRING EBITDA ● Appraisal, Consulting ● Wealth Management ● magicJack, United Online ● Brands MARKET - DRIVEN UPSIDE ● Investment Banking ● Capital Markets ● Sales and Trading ● Retail Liquidation COUNTERCYCLICAL ● Retail Liquidation ● Restructuring OPPORTUNISTIC ● Leverage Core Services, Expertise ● High Return Investment Opportunities ● Drive Shareholder Return (1) Adjusted EBITDA includes earnings before interest, taxes, depreciation, amortization, restructuring costs, share - based payme nts, gain on extinguishment of loans, impairment of tradenames, and transaction related and other costs. For a definition of adjusted EBITDA and a reconciliation to GAAP financi al measures, please see the Appendix.

12 Strong Balance Sheet Leveraged for Opportunistic Investments (Dollars in thousands) June 30, 2021 Cash and Restricted Cash $ 298,731 Due from Clearing Brokers 424,949 Advances Against Customer Contracts 200 Securities and Other Investments Owned Equity Securities (1) 1,129,217 Corporate Bonds 42,912 Other Fixed Income Securities 3,227 Partnership Interests and Other 103,417 Securities Sold Not Yet Purchased (272,088) Loans Receivable, net of Loan Participations Sold 265,851 Other Equity Investments (2) 53,510 Other Investment Participations Sold (3) (11,254) Total Cash, Net Securities, and Other $ 2,038,672 Cash and Net Investments (Dollars in thousands) June 30, 2021 Market Capitalization (4) $ 1,800,994 Preferred Shares at Fair Market Value (5) 117,715 Total Cash and Investments, Net of Debt (6) 568,106 Enterprise Value (7) $ 1,350,603 Overview ● Strong track record of driving shareholder value through opportunistic investments ● Focused on opportunities in the small cap space ● Approximately $1.3 billion of positions held in equity securities, loans receivable, partnership interests, other investments (1) Includes preferred stock. (2) Other equity investments reported in prepaid expenses and other assets. (3) Other investmen ts participation sold reported in noncontrolling interests. (4) RILY common stock price as of 7/27/2021 for total shares outstanding as of 6/30/2021. (5) Fair market value of RILYP and RIL YL preferred shares as of 7/27/2021 for total shares outstanding as of 6/30/2021. (6) Defined as total cash, net securities, and other minus total debt. (7) Enterprise value is d efi ned as market capitalization, less cash and cash equivalents, restricted cash, due from clearing brokers, advances against customer contracts, the net amount of loans receiva ble and loan participations sold, the net amount of securities and other investments owned and securities sold not yet purchased, and the net amount of other equity investments and investment related deposits reported in prepaid expenses and other assets and other investments participation sold reported in noncontrolling interests, plus notes payable, ter m loans, net, senior notes payable, and fair value of RILYP and RILYL as of 7/27/2021 using outstanding preferred shares as of 6/30/2021. (8) Excludes operating lease liabilities. Capitalization Structure Debt Summary Term Loans, Net $ 257,104 Notes Payable 357 Senior Notes Payable 1,213,105 Total Debt (8) $ 1,470,566

13 Meaningful Growth and Shareholder Value Created (1) Total Shareholder Return is calculated by dividing the sum of ( i ) RILY co mmon share price change from January 3, 2017 to July 26, 2021 and (ii) cumulative dividend paid since January 2017, by (iii) RILY common share price on January 3, 2017. (2) Insider purchase data from March 13, 2018 to June 30, 202 1. (3) B. Riley Financial, Inc. (RILY) Historical Equity Pricing Data supplied by CapIQ from July 17, 2017 through July 1, 2021. Insider Ownership (2) Key Highlights Maintain significant ownership, strong shareholder alignment Historical Share Price Performance (3) $10.00 $20.00 $30.00 $40.00 $50.00 $60.00 $70.00 $80.00 Jul-17 Jan-18 Jul-18 Jan-19 Jul-19 Jan-20 Jul-20 Jan-21 Jul-21 27% total holdings owned by executives and board 219K open market purchases YTD Jun 30 2021 217K open market purchases FY 2020 884K open market purchases since 2018 324% in total shareholder return (1) since Jan 2017 Total Adjusted EBITDA vs. Robust platform delivering strong shareholder returns $865M Jun 2021 LTM $69.8M in FY 2017 Balance Sheet Assets vs. $4.1B as of Jun 30 2021 $1.4B as of Dec 31 2017

14 $152M $195M $270M $333M $304M $47M $67M $127M $123M $92M Q2 2020 Q3 2020 Q4 2020 Q1 2021 Q2 2021 Operating Revenue Operating Adj. EBITDA Financial Summary – Operating Results Operating Results (Annual) Operating Results (Quarter) Operating Revenue is defined as the sum of revenues from (i) Service and Fees, (ii) Interest Income - Loans and Securities Lending and (iii) Sales of Goods. Adjusted EBITDA includes earnings before interest, taxes, depreciation, amortization, restructuring costs, share - based payments, gain on extinguishment o f loans, impairment of tradenames, and transaction related and other costs. Operating Adjusted EBITDA is defined as Adjusted EBITDA excluding ( i ) Trading Income (Losses) and Fair Value Adjustments on Loans and (ii) other investment related expenses. For a reconciliation to GAAP financial measures, please see appendix. $431M $546M $799M $1.1B $98M $114M $312M $409M FY 2018 FY 2019 FY 2020 LTM Jun 2021 Operating Revenue Operating Adj. EBITDA

15 Segment Overview Segment Mix Consistent cash - flow generating and steadier businesses balance episodic banking and liquidation businesses, investments (1) BR Brands investment portfolio is comprised of six brands, including Catherine Malandrino , English Laundry, Joan Vass, Kensie Girl, Limited Too and Nanette Lepore as of October 2019. Acquired interest in Justice on November 30, 2020. Results for Hurley and bebe are recognized outside of the Brands Segment. (2) Operating Revenue is defined as the sum of revenues from (i) Service and Fees, (ii) Interest Income - Loans and Securities Lending and (iii) Sales of Goods. Segment Mix - Operating Revenue (2) (Annual) Segment Mix - Operating Revenue (2) (6/30/21 LTM) Wealth Management 17% Financial Consulting 9% Principal Investments 8% Liquidation 8% Brands 2% Banking Capital Markets 56% 2018 2019 2020 LTM Jun 2021 Banking Cap Markets Liquidation Wealth Management Consulting Principal Investments Brands ● Private Wealth ● Tax Services ● Advisory Services ● Appraisal ● Real Estate ● Operations Management ● United Online (NetZero, Juno) ● magicJack ● Six Brands ● Justice Brands ● Investment Banking ● Sales & Trading ● Fund Management ● Investments, Loans ● Retail Liquidation ● Wholesale & Industrial Wealth Management Financial Consulting Principal Investments Brands (1) Capital Markets Auction and Liquidation

16 III. Business Overview

17 Diversified Platform with Complementary Mix of Businesses (1) Companies covered by B. Riley Securities Equity Research division as of June 30, 2021. (2) B. Riley Securities institutio nal sales & trading clients as of June 30, 2021. (3) Figures shown are approximations and do not reflect actual number of B. Riley Wealth Management and National Holdings Reg ist ered Representatives, Assets under Administration as of June 30, 2021.

18 Investment Banking and Capital Markets B. Riley Securities Full - service investment bank providing comprehensive corporate finance solutions to public and private companies ● Leader in small - and mid - cap debt/equity offerings ● Offers fully - customized creative capital markets solutions ● Established franchise in SPACs, ATMs and private placements ● Go - to source for proprietary equity research ● Leverages broad retail, family office distribution network ● Recognized as leading advisor to distressed companies (3) (1) B. Riley Securities investment banking, sales & trading and research professionals as of June 30, 2021. (2) Source: Dealo gic , Company Filings, PlacementTracker . Apportioned credit to all placement agents. (3) Source: The Deal, Bankruptcy Restructuring Advisers Power Rankings for Q1 2020. (4) B. Riley Sec uri ties institutional sales & trading clients as of June 30, 2021. (5) B. Riley Securities Equity Research coverage as of June 30, 2021. (6) Sources: StarMine rankings as of December 31, 20 20. FactSet, CapIQ , and company websites used for firms not included in StarMine rankings. Overall coverage includes only companies with a rating & domiciled in the U.S. Does not include Closed End Funds. Small - Cap Coverage includes market caps less than $1 billion. Recent Transactions Impactful Research Platform 45 research professionals (1) 400+ companies covered by research (5) #4 most small - cap stocks under coverage (6) Investment Banking 80+ professionals (1) #1 leader in ATM issuances (2) Top 10 bankruptcy adviser (3) Sales and Trading 70+ professionals (1) 1,000+ institutional client relationships (4) June 2021 Common Stock At - the - Market Offering Lead Agent $587,400,000 June 2021 Private Placement Sole Placement Agent $105,000,000 May 2021 Preferred Stock Offering Lead Bookrunner $100,000,000 June 2021 Follow - On and Senior Notes Offerings Sole Bookrunner $235,000,000 June 2021 SPAC IPO Sole Bookrunner $250,000,000 May 2021 SPAC IPO Sole Bookrunner $172,500,000

19 19 Leading Small Cap Investment Bank (1). Source: Dealogic . Pricing Date 1/1/2020 – 12/31/2020, Deal Type = IPO, FO, Rank Eligible. SEC registered. Exchange Nationality = USA. Market Cap . $100m - $1.0bn (Deals <$1.1bn rounded down). Excludes SPAC IPOs and Healthcare transactions. (2) Source: Dealogic . Pricing Date 1/1/2020 – 12/31/2020, Deal Type = FO, Rank Eligible. SEC registered. Exchange Nationality = USA. Market Cap. $10 0m - $1.0bn. Excludes Healthcare transactions. (3) Source: Dealogic . Pricing Date 1/1/2020 – 12/31/2020, Deal Type = SPAC, Rank Eligible, SEC registered. Exchange Nationality = USA. Market Cap. = <$1.0bn. Deal Value $100 - $400m. Weighted on $ raised attributed to respective bank economics on transaction. (4) Source: Dealogic , Company Filings, PlacementTracker . Note: The sum of deals is greater than the actual number completed to account for multiple - agent transactions and “B. Riley Securities” includes transactions completed by FBR/MLV prior to the acq uisition by B. Riley Financial in June 2017. Top Small Cap SPAC Bookrunners (3) 2020 Rank Bookrunner $M No. % Lead 1 Credit Suisse $4,516.1 21 81% 2 Cantor Fitzgerald & Co $3,452.2 18 89% 3 Citi $3,329.0 20 90% 4 Goldman Sachs $2,833.8 15 67% 5 Jefferies LLC $2,827.3 18 83% 6 Deutsche Bank $2,049.8 13 85% 7 UBS $2,047.1 14 50% 8 Barclays $1,312.2 12 25% 9 Cowen & Company $1,298.1 8 75% 10 B. Riley Securities $1,254.6 7 86% Top Small Cap Bookrunners, Ex - Healthcare (1) 2020 Rank Bookrunner $M No. % Lead 1 BofA Securities $931.7 19 47% 2 Morgan Stanley $765.8 16 44% 3 JPMorgan $673.6 13 54% 4 Jefferies LLC $620.2 13 46% 5 B. Riley Securities $606.2 17 71% 6 Goldman Sachs $533.6 10 50% 7 Credit Suisse $507.2 13 54% 8 Citi $479.8 13 46% 9 Stifel $461.5 21 19% 10 BMO Capital Markets $423.2 17 18% Top Small Cap Follow - On Bookrunners, Ex - Healthcare (2) 2020 Rank Bookrunner $M No. % Lead 1 BofA Securities $643.5 11 64% 2 B. Riley Securities $465.0 16 69% 3 Jefferies LLC $447.8 8 63% 4 Credit Suisse $395.1 9 67% 5 Morgan Stanley $302.0 9 44% 6 Barclays $292.5 8 50% 7 JPMorgan $282.9 8 50% 8 Stifel $281.5 16 19% 9 Citi $237.7 5 60% 10 Oppenheimer & Co $209.2 7 86% Leader in At - the - Market (ATM) Issuances (4) 2020 Rank Investment Bank No. $M 1 B. Riley Securities 113 $5,004.0 2 Jefferies LLC 112 $8,179.0 3 Cantor Fitzgerald & Co 66 $4,589.0 4 H.C. Wainwright 55 $1,503.0 5 Bank of America 51 $4,167.0 6 Cowen & Co LLC 40 $4,188.0 7 JPMorgan 39 $3,002.0 8 Goldman Sachs 38 $4,306.0 9 BMO Capital Markets 38 $1,255.0 10 Truist (SunTrust/BB&T) 33 $1,692.0
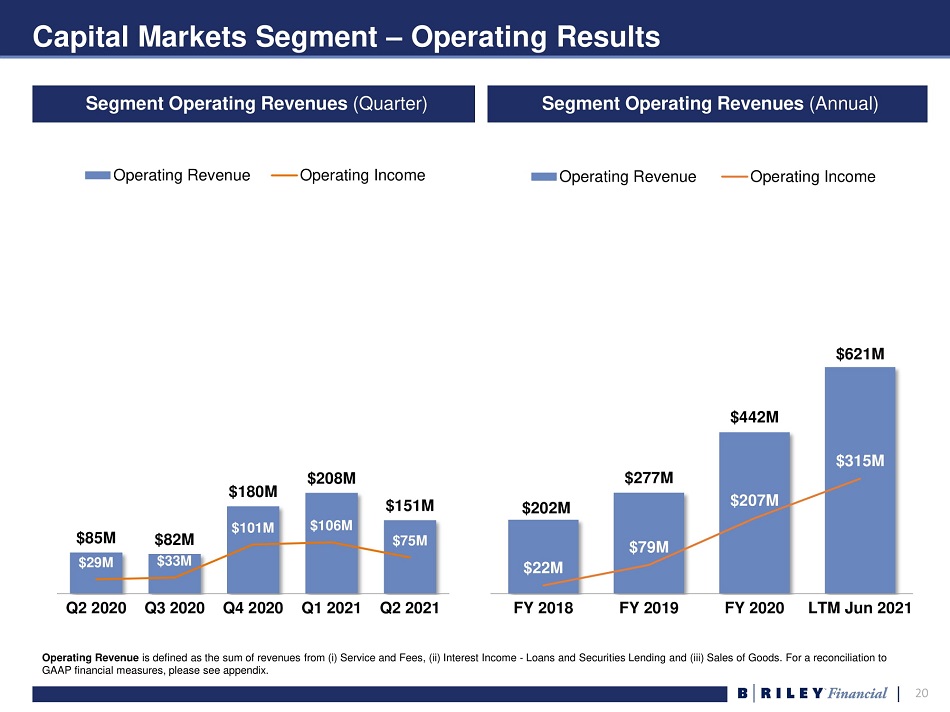
20 $85M $82M $180M $208M $151M $29M $33M $101M $106M $75M Q2 2020 Q3 2020 Q4 2020 Q1 2021 Q2 2021 Operating Revenue Operating Income Capital Markets Segment – Operating Results Segment Operating Revenues (Annual) Segment Operating Revenues (Quarter) Operating Revenue is defined as the sum of revenues from (i) Service and Fees, (ii) Interest Income - Loans and Securities Lending and (iii) Sales of Goods. For a reconciliation to GAAP financial measures, please see appendix. $202M $277M $442M $621M $22M $79M $207M $315M FY 2018 FY 2019 FY 2020 LTM Jun 2021 Operating Revenue Operating Income

21 Wealth Management (1) Acquired Wunderlich Securities in July 2017; renamed B. Riley Wealth Management in 2018. Acquired National Holdings on Fe bru ary 25, 2021. (2) Figures shown are approximations and do not reflect actual number of affiliated personnel. Figures for client assets unde r a dministration as of June 30, 2021. ● Completed acquisition of National Holdings in February 2021 ● Wealth management affiliates (1) provide consultative investment advice, financial planning expertise and retail brokerage services ● Offers investment advisory services, customized portfolio management, financial planning, tax planning & preparation, business accounting services, and insurance & annuities offerings ● Serves individuals and families, corporations and non - profit organizations, qualified retirement plans, trusts, foundations and endowments ● Large private client network with strong demand for new issues offers enhanced distribution and aftermarket benefits ● Benefits from B. Riley infrastructure, deals syndicate and ancillary investment offerings Expanded Wealth Management Platform $32 billion in client assets (2) 700 financial advisors and registered representatives (2) $70M $67M $73M $197M FY 2018 FY 2019 FY 2020 LTM Jun 2021 Wealth Management Segment Revenues

22 Financial Consulting and Valuation (1) Merged with Great American Group in 2014; Acquired GlassRatner in 2018; Renamed to B. Riley Advisory Services in 2020. (2) Figure shown is an approximation and does not reflect actual number of company appraisals conducted annually. (3) Award Sources: Global M&A Network, “Turnaround Atlas Awards” (2021); and ALM’s Daily Report, “Best of 2021.” Nationally recognized mid - market consulting firm with one of the largest appraisal practices in the US (1) ● Valuation & Appraisal supporting asset - based loans (ABLs) and other financial transactions; high rate of recurring engagements ● Transaction Support Services including due diligence, quality of earnings, cash flow analyses, purchase price allocation ● Bankruptcy & Turnaround Management ● Forensic Accounting & Litigation Support contract and valuation disputes, expert witness testimony, fraud investigations Continued enhancement with complementary additions: ● Cybersecurity, Risk & Resilience ● Operations Management Regularly sources business development opportunities for other B. Riley affiliates Advisory Services $51M $76M $92M $97M FY 2018 FY 2019 FY 2020 LTM Jun 2021 1,000+ company appraisals completed per year (2) #1 Litigation Valuation Firm #1 Forensic Accounting Firm #1 in Expert Witness Services Law.com/The Daily Report “Best of 2021” (3) Turnaround Consulting Firm of the Year Global M&A Network, Middle Market, 2021 (3) Financial Consulting Segment Revenues
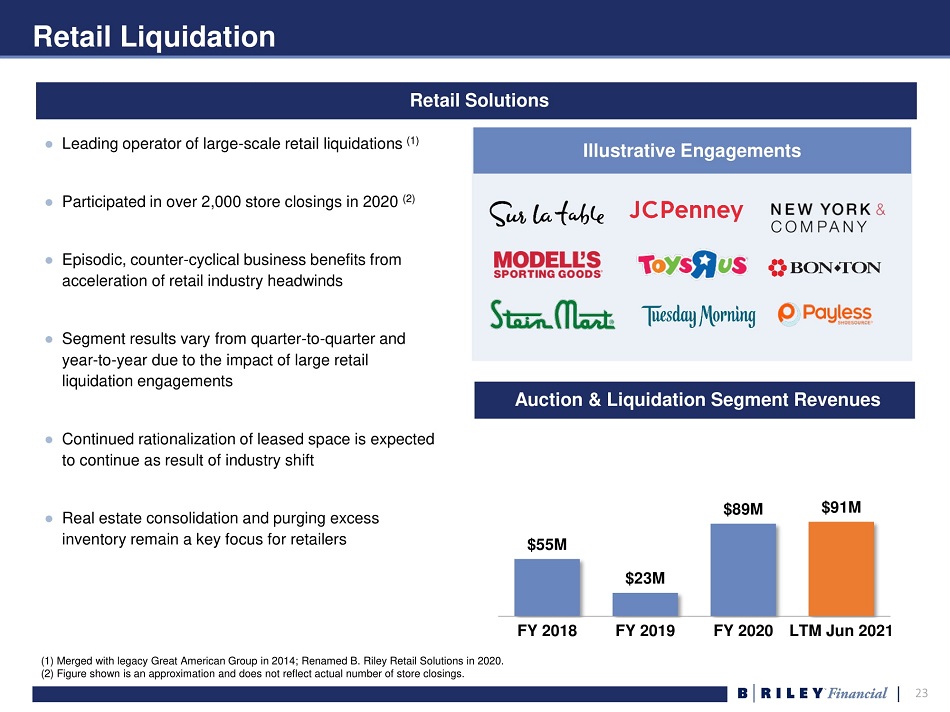
23 Retail Liquidation ● Leading operator of large - scale retail liquidations (1) ● Participated in over 2,000 store closings in 2020 (2) ● Episodic, counter - cyclical business benefits from acceleration of retail industry headwinds ● Segment results vary from quarter - to - quarter and year - to - year due to the impact of large retail liquidation engagements ● Continued rationalization of leased space is expected to continue as result of industry shift ● Real estate consolidation and purging excess inventory remain a key focus for retailers Illustrative Engagements (1) Merged with legacy Great American Group in 2014; Renamed B. Riley Retail Solutions in 2020. (2) Figure shown is an approximation and does not reflect actual number of store closings. Retail Solutions $55M $23M $89M $91M FY 2018 FY 2019 FY 2020 LTM Jun 2021 Auction & Liquidation Segment Revenues

24 IV. Investments and Brands Overview

25 Principal Investments - United Online and magicJack United Online ● Acquired July 2016 ● Internet access and online advertising provider ● Exceeded net initial investment since acquisition magicJack ● Acquired November 2018 ● VoIP technology and services communications provider ● Offers operational synergies with United Online Lingo ● Acquired 40% ownership interest in November 2020 ● B. Riley to acquire additional 40% interest in 2021 pending regulatory approval ● Global cloud/UC and managed service provider Strong cash - flow companies generating attractive returns Segment Income (1) $19M $33M $33M $30M FY 2018 FY 2019 FY 2020 LTM Jun 2021 (1) Includes results from United Online, Inc. since Q3 2016, and results from magicJack VocalTec Ltd. since Q4 2018. ● Operationally focused control investments offer FCF ● High gross margins; predictable subscriber attrition ● Low overhead from successful execution of cost synergies ● Generates steady income for B. Riley Core Attributes

26 Investments Overview Investments Approach Illustrative Investments B . Riley actively co - invests in opportunities that can ● Leverage core business services and industry knowledge ● Create opportunities for our operating business ● Generate yield and drive incremental returns Common investment characteristics ● Utilize firm’s expertise and distribution to underwrite debt/equity financing ● Focus on delivering financial improvements to maximize free cash flow ● Accretive and drive shareholder value
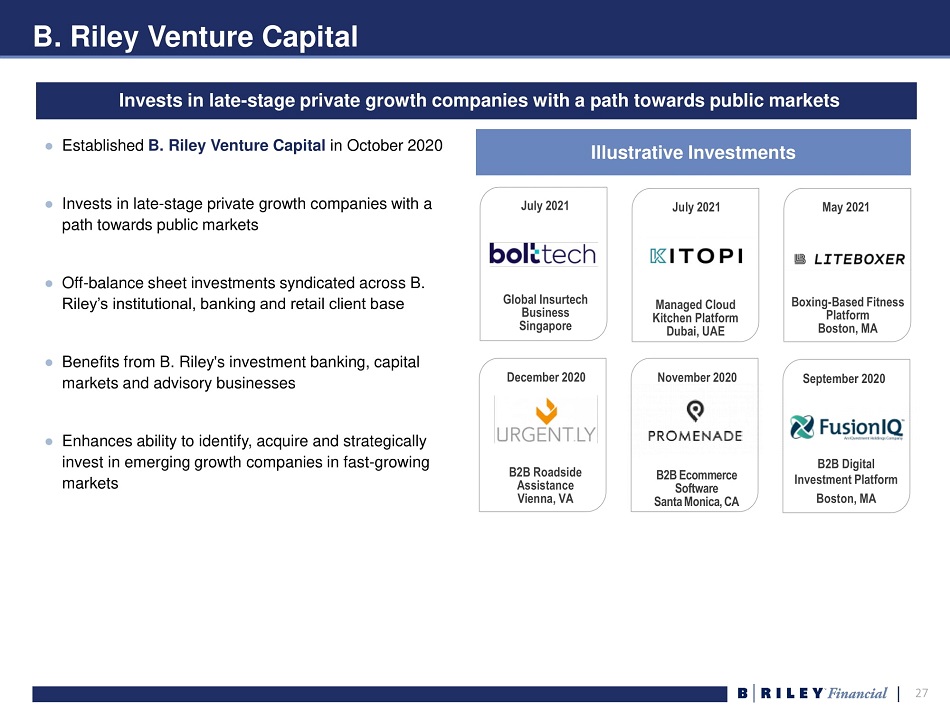
27 B. Riley Venture Capital Invests in late - stage private growth companies with a path towards public markets May 2021 Boxing - Based Fitness Platform Boston, MA December 2020 B2B Roadside Assistance Vienna, VA November 2020 B2B Ecommerce Software Santa Monica, CA July 2021 Managed Cloud Kitchen Platform Dubai, UAE July 2021 Global Insurtech Business Singapore September 2020 B2B Digital Investment Platform Boston, MA ● Established B. Riley Venture Capital in October 2020 ● Invests in late - stage private growth companies with a path towards public markets ● Off - balance sheet investments syndicated across B. Riley’s institutional, banking and retail client base ● Benefits from B. Riley's investment banking, capital markets and advisory businesses ● Enhances ability to identify, acquire and strategically invest in emerging growth companies in fast - growing markets Illustrative Investments

28 Brand Investment Portfolio (1) Brand holdings for Six Brands, Hurley and bebe as of Jun 30, 2021. Acquired interest in Justice brand on Nov 30, 2020. Pe rce ntages represent approximate ownership stakes in these brands. (2) Results for Hurley, bebe and Justice are recognized outside of the Brands Segment. Brands Segment results primarily include interest from Six Brands. 80% 43% Offers recurring revenue and cash flow through licensing of brand trademarks Brand Holdings (1) 41% Catherine Malandrino English Laundry Joan Vass Kensie Girl Limited Too Nanette Lepore (Six Brands) 39% Hurley (2) Justice (2) bebe (2) ● Established brand investment portfolio in October 2019 ● Offers recurring revenue and cash flow through licensing of brand trademarks ● Leverages retail and brand management partnerships ● Trends in traditional brick and mortar retail has created opportunity to acquire intellectual property and brand assets

29 V. Financial Overview

30 Financial Highlights (1) Adjusted EBITDA includes earnings before interest, taxes, depreciation, amortization, restructuring costs, share - based payme nts, impairment of tradenames, and transaction related and other costs. (2) Operating Adjusted EBITDA is defined as Adjusted EBITDA excluding (i) T rading Income(Losses) and F air Value A djustments on L oans and (ii) other investment related expenses. (3) Net income applicable to common shareholders. $148M $94M $260M $385M $125M Q2 2020 Q3 2020 Q4 2020 Q1 2021 Q2 2021 Adjusted EBITDA (1) $83M $47M $170M $253M $74M $3.07 $1.75 $6.55 $8.81 $2.58 Q2 2020 Q3 2020 Q4 2020 Q1 2021 Q2 2021 Net Income Diluted EPS $267M $226M $410M $600M $337M Q2 2020 Q3 2020 Q4 2020 Q1 2021 Q2 2021 Revenues $47M $67M $127M $123M $92M Q2 2020 Q3 2020 Q4 2020 Q1 2021 Q2 2021 Operating Adjusted EBITDA (2) Net Income (3)

31 Financial Highlights (continued) (1) Includes preferred stock. (2) Other equity investments reported in prepaid expenses and other assets. (3) Other investment participations sold reported in noncontrolling interests. (Dollars in thousands) Jun 30, 2020 Sep 30, 2020 Dec 31, 2020 Mar 31, 2021 Jun 30, 2021 Cash and Cash Equivalents $106,253 $169,676 $103,602 $237,590 $297,396 Restricted Cash 471 1,410 1,235 8,532 1,335 Due from Clearing Brokers, Net 29,089 19,589 (6,583) 416,925 424,949 Advances Against Customer Contracts 1,413 900 200 200 200 Securities and Other Investments Owned Equity Securities (1) 341,515 392,674 697,288 1,006,019 1,129,217 Corporate Bonds 5,375 5,956 3,195 41,754 42,912 Other Fixed Income Securities 2,768 3,557 1,913 5,165 3,227 Partnership Interests and Other 49,386 57,293 74,923 113,766 103,417 Securities Sold Not Yet Purchased (9,804) (48,125) (10,105) (288,058) (272,088) Loans Receivable, net of Loan Participation Sold 311,408 330,420 373,373 282,855 265,851 Other Equity Investments and Deposits (2) 61,588 58,389 59,612 48,881 53,510 Other Investment Participations Sold (3) - - - (4,326) (11,254) Total Cash, Net Securities, and Other $899,462 $991,739 $1,298,653 $1,869,303 $2,038,672 (Dollars in thousands) Jun 30, 2020 Sep 30, 2020 Dec 31, 2020 Mar 31, 2021 Jun 30, 2021 Term Loans, Net $57,195 $52,452 $74,213 $69,543 $257,104 Notes Payable 714 714 37,967 6,908 357 Senior Notes Payable 854,037 854,926 870,783 1,139,100 1,213,105 Total Debt $911,946 $908,092 $982,963 $1,215,551 $1,470,566 Total Cash and Investments, Net of Debt $ (12,484) $83,647 $315,690 $653,752 $568,106 Cash and Net Investments Debt Summary

32 VI. Appendix
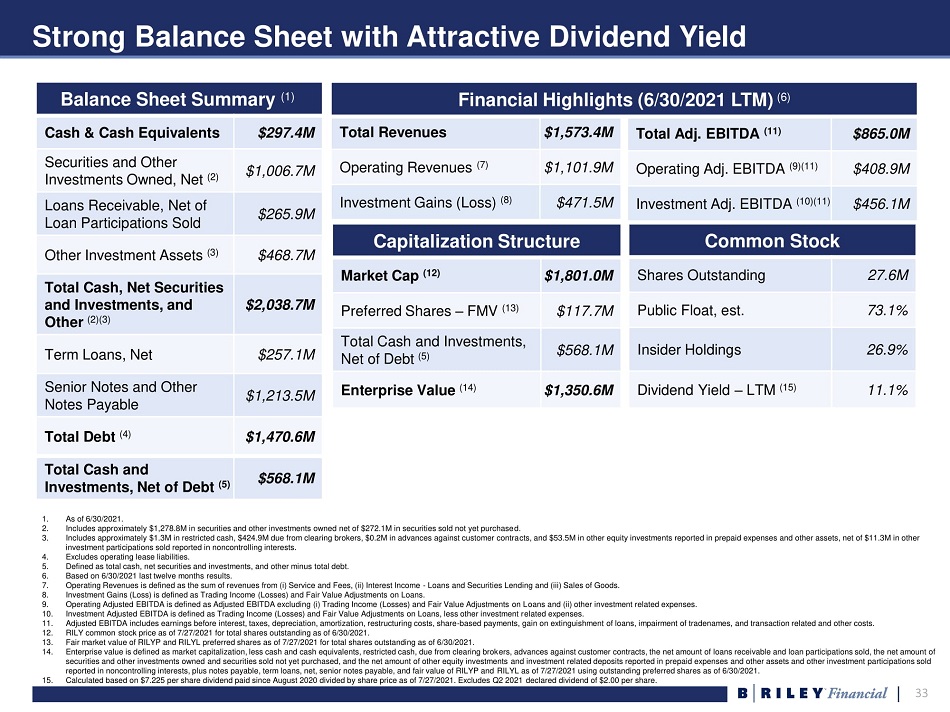
33 Strong Balance Sheet with Attractive Dividend Yield 1. As of 6/30/2021. 2. Includes approximately $1,278.8M in securities and other investments owned net of $272.1M in securities sold not yet purchase d. 3. Includes approximately $1.3M in restricted cash, $424.9M due from clearing brokers, $0.2M in advances against customer contra cts , and $53.5M in other equity investments reported in prepaid expenses and other assets, net of $11.3M in other investment participations sold reported in noncontrolling interests. 4. Excludes operating lease liabilities. 5. Defined as total cash, net securities and investments, and other minus total debt. 6. Based on 6/30/2021 last twelve months results. 7. Operating Revenues is defined as the sum of revenues from (i) Service and Fees, (ii) Interest Income - Loans and Securities Lend ing and (iii) Sales of Goods. 8. Investment Gains (Loss) is defined as Trading Income (Losses) and Fair Value Adjustments on Loans. 9. Operating Adjusted EBITDA is defined as Adjusted EBITDA excluding (i) Trading Income (Losses) and Fair Value Adjustments on L oan s and (ii) other investment related expenses. 10. Investment Adjusted EBITDA is defined as Trading Income (Losses) and Fair Value Adjustments on Loans, less other investment r ela ted expenses. 11. Adjusted EBITDA includes earnings before interest, taxes, depreciation, amortization, restructuring costs, share - based payments, gain on extinguishment of loans, impairment of tradenames, and transaction related and other costs. 12. RILY common stock price as of 7/27/2021 for total shares outstanding as of 6/30/2021. 13. Fair market value of RILYP and RILYL preferred shares as of 7/27/2021 for total shares outstanding as of 6/30/2021. 14. Enterprise value is defined as market capitalization, less cash and cash equivalents, restricted cash, due from clearing brok ers , advances against customer contracts, the net amount of loans receivable and loan participations sold, the net amount of securities and other investments owned and securities sold not yet purchased, and the net amount of other equity investments and investment related deposits reported in prepaid expenses and other assets and other investment participations sold reported in noncontrolling interests, plus notes payable, term loans, net, senior notes payable, and fair value of RILYP and RIL YL as of 7/27/2021 using outstanding preferred shares as of 6/30/2021. 15. Calculated based on $7.225 per share dividend paid since August 2020 divided by share price as of 7/27/2021. Excludes Q2 2021 de clared dividend of $2.00 per share. Common Stock Shares Outstanding 27.6M Public Float, est. 73.1% Insider Holdings 26.9% Dividend Yield – LTM (15) 11.1% Balance Sheet Summary (1) Cash & Cash Equivalents $297.4M Securities and Other Investments Owned, Net (2) $1,006.7M Loans Receivable, Net of Loan Participations Sold $265.9M Other Investment Assets (3) $468.7M Total Cash, Net Securities and Investments, and Other (2)(3) $2,038.7M Term Loans, Net $257.1M Senior Notes and Other Notes Payable $1,213.5M Total Debt (4) $1,470.6M Capitalization Structure Market Cap (12) $1,801.0M Preferred Shares – FMV (13) $117.7M Total Cash and Investments, Net of Debt (5) $568.1M Enterprise Value (14) $1,350.6M Total Adj. EBITDA (11) $865.0M Operating Adj. EBITDA (9)(11) $408.9M Investment Adj. EBITDA (10)(11) $456.1M Total Cash and Investments, Net of Debt (5) $568.1M Total Revenues $1,573.4M Operating Revenues (7) $1,101.9M Investment Gains (Loss) (8) $471.5M Financial Highlights (6/30/2021 LTM) (6)

34 GAAP Income Statement B. Riley Financial Consolidated Statements of Operations FY FY LTM Dec 31, Q1 Q2 Q3 Q4 Dec 31, Q1 Q2 Jun 30, USD in 000's except for share data 2019 2020 2020 2020 2020 2020 2021 2021 2021 Revenues: Services and Fees $460,493 $159,381 $125,595 $144,823 $237,270 $667,069 $289,469 $266,143 $937,705 Trading Income (Loss) and Fair Value Adjustments on Loans 106,463 (182,442) 114,547 31,753 140,160 104,018 266,942 32,679 471,534 Interest Income - Loans and Securities Lending 77,221 21,851 24,506 26,026 30,116 102,499 36,920 25,491 118,553 Sale of Goods 7,935 1,004 1,820 23,651 2,660 29,135 6,828 12,457 45,596 Total Revenues 652,112 (206) 266,468 226,253 410,206 902,721 600,159 336,770 1,573,388 Operating Expenses: Direct Cost of Services 58,824 19,952 7,985 23,264 9,250 60,451 11,322 12,094 55,930 Cost of Goods Sold 7,575 769 860 9,813 1,018 12,460 5,326 3,626 19,783 Selling, General and Administrative Expenses 385,219 87,744 106,562 97,143 137,088 428,537 191,344 199,922 625,497 Restructuring Charge 1,699 - - 1,557 - 1,557 - - 1,557 Impairment of Tradenames - 4,000 8,500 - - 12,500 - - - Interest Expense - Securities Lending and Loan Participations Sold 32,144 8,473 11,221 10,975 11,782 42,451 19,189 10,983 52,929 Total Operating Expenses 485,461 120,938 135,128 142,752 159,138 557,956 227,181 226,625 755,696 Operating Income (Loss) 166,651 (121,144) 131,340 83,501 251,068 344,765 372,978 110,145 817,692 Other Income (Expense): Interest Income 1,577 246 224 67 27 564 49 56 199 Gain on extinguishment of loans - - - - - - - 6,509 6,509 (Loss) Income from Equity Investments (1,431) (236) (318) 409 (478) (623) 875 (852) (46) Interest Expense (50,205) (15,654) (16,509) (16,374) (16,712) (65,249) (19,786) (20,856) (73,728) Income before Income Taxes 116,592 (136,788) 114,737 67,603 233,905 279,457 354,116 95,002 750,626 (Provision) Benefit for Income Taxes (34,644) 37,539 (32,208) (18,711) (62,060) (75,440) (97,518) (19,902) (198,191) Net Income (Loss) 81,948 (99,249) 82,529 48,892 171,845 204,017 256,598 75,100 552,435 Net (Loss) Income Attributable to Noncontrolling Interests 337 (584) (1,311) 513 251 (1,131) 1,942 (576) 2,130 Net Income Attributable to B. Riley Financial, Inc. 81,611 (98,665) 83,840 48,379 171,594 205,148 254,656 75,676 550,305 Preferred Stock Dividends 264 1,055 1,087 1,088 1,480 4,710 1,749 1,789 6,106 Net Income Available to Common Shareholders $81,347 ($99,720) $82,753 $47,291 $170,114 $200,438 $252,907 $73,887 $544,199

35 Historical Financial Results for B. Riley Financial (1) Operating Revenue is defined as the sum of revenues from (i) Service and Fees, (ii) Interest Income - Loans and Securities L ending and (iii) Sales of Goods. (2) Investment Gains (Loss) is defined as Trading Income (Losses) and Fair Value Adjustments on Loans. (3) Segment Operating Income is defined as Seg ment Income excluding (i) Trading Income (Losses) and Fair Value Adjustments on Loans and (ii) other investment related expenses. (4) Investment Income (Loss) is defi ned as Trading Income (Losses) and Fair Value Adjustments on Loans, less other investment related expenses. B. Riley Financial Segment Financial Results FY FY LTM Dec 31, Q1 Q2 Q3 Q4 Dec 31, Q1 Q2 Jun 30, USD in 000's 2019 2020 2020 2020 2020 2020 2021 2021 2021 Operating Revenues (1) : Capital Markets $276,851 $95,451 $84,870 $81,841 $180,214 $442,376 $207,899 $151,488 $621,442 Wealth Management 65,073 18,887 15,318 17,289 20,851 72,345 65,542 87,444 191,126 Auction and Liquidation 22,516 20,661 8,251 44,185 15,667 88,764 13,450 17,277 90,579 Financial Consulting 76,292 20,714 18,845 25,583 26,480 91,622 21,409 23,735 97,207 Principal Investments - UOL and MJ 100,862 22,722 21,431 21,602 21,383 87,138 20,529 19,646 83,160 Brands 4,055 3,801 3,206 4,000 5,451 16,458 4,388 4,501 18,340 Operating Revenues (1) 545,649 182,236 151,921 194,500 270,046 798,703 333,217 304,091 1,101,854 Investment Gain (Loss) (2) 106,463 (182,442) 114,547 31,753 140,160 104,018 266,942 32,679 471,534 Total Revenues 652,112 (206) 266,468 226,253 410,206 902,721 600,159 336,770 1,573,388 Segment Operating Income (3) : Capital Markets 78,709 42,611 29,471 33,197 101,254 206,533 105,983 74,701 315,135 Wealth Management (1,318) 856 (435) 426 1,250 2,097 1,671 (3,598) (251) Auction and Liquidation (25,533) 4,289 2,020 12,000 7,460 25,769 907 3,555 23,922 Financial Consulting 17,814 4,918 3,504 7,249 6,872 22,543 3,322 4,175 21,618 Principal Investments - UOL and MJ 33,157 8,504 9,188 8,368 7,300 33,360 7,531 7,275 30,474 Brands 2,667 (1,817) (6,318) 2,292 4,054 (1,789) 2,998 3,096 12,440 Segment Operating Income (3) 105,496 59,361 37,430 63,532 128,190 288,513 122,412 89,204 403,338 Investment Income (Loss) (4) 94,282 (166,972) 101,507 26,911 133,699 95,145 262,764 32,763 456,137 Total Segment Income (Loss) $199,778 ($107,611) $138,937 $90,443 $261,889 $383,658 $385,176 $121,967 $859,475

36 Non - GAAP Financial Measures B. Riley Financial Adjusted EBITDA and Operating Adjusted EBITDA Reconciliation FY FY LTM Dec 31, Q1 Q2 Q3 Q4 Dec 31, Q1 Q2 Jun 30, USD in 000's 2019 2020 2020 2020 2020 2020 2021 2021 2021 Net Income (Loss) Attributable to B. Riley Financial, Inc. $81,611 ($98,665) $83,840 $48,379 $171,594 $205,148 $254,656 $75,676 $550,305 EBITDA Adjustments Provision (Benefit) for Income Taxes 34,644 (37,539) 32,208 18,711 62,060 75,440 97,518 19,902 198,191 Interest Expense 50,205 15,654 16,509 16,374 16,712 65,249 19,786 20,856 73,728 Interest Income (1,577) (246) (224) (67) (27) (564) (49) (56) (199) Share Based Payments 15,916 5,321 4,168 4,778 4,321 18,588 5,526 8,608 23,233 Depreciation and Amortization 19,048 4,956 4,923 4,886 4,604 19,369 6,759 6,165 22,414 Gain on extinguishment of loans - - - - - - - (6,509) (6,509) Restructuring Costs 1,699 - - 1,557 - 1,557 - - 1,557 Impairment of Tradenames - 4,000 8,500 - - 12,500 - - - Transactions Related Costs and Other 6,339 10,454 (1,660) (485) 1,222 9,531 1,285 245 2,267 Total Adjustments 126,274 2,600 64,424 45,754 88,892 201,670 130,825 49,211 314,682 Adjusted EBITDA $207,885 ($96,065) $148,264 $94,133 $260,486 $406,818 $385,481 $124,887 $864,987 Operating EBITDA Adjustments: Trading (Income) Loss and Fair Value Adjustments on Loans (106,463) 182,442 (114,547) (31,753) (140,160) (104,018) (266,942) (32,679) (471,534) Other Investment Related Expenses 12,181 (15,470) 13,040 4,842 6,461 8,873 4,178 (84) 15,397 Total Operating EBITDA Adjustments (94,282) 166,972 (101,507) (26,911) (133,699) (95,145) (262,764) (32,763) (456,137) Operating Adjusted EBITDA $113,603 $70,907 $46,757 $67,222 $126,787 $311,673 $122,717 $92,124 $408,850

37 Non - GAAP Financial Measures B. Riley Financial Adjusted Net Income Reconciliation FY FY LTM Dec 31, Q1 Q2 Q3 Q4 Dec 31, Q1 Q2 Jun 30, USD in 000's 2019 2020 2020 2020 2020 2020 2021 2021 2021 Net Income (Loss) Attributable to B. Riley Financial, Inc. $81,611 ($98,665) $83,840 $48,379 $171,594 $205,148 $254,656 $75,676 $550,305 Share Based Compensation 15,916 5,321 4,168 4,778 4,321 18,588 5,526 8,608 23,233 Amortization of Intangible Assets 13,846 4,024 4,024 3,919 3,769 15,736 5,886 5,134 18,708 Gain on extinguishment of loans - - - - - - - (6,509) (6,509) Restructuring Costs 1,699 - - 1,557 - 1,557 - - 1,557 Impairment of Tradenames - 4,000 8,500 - - 12,500 - - - Transactions Related Costs and Other 6,339 10,454 (1,660) (485) 1,222 9,531 1,285 245 2,267 Income Tax Effect of Adjusting Entries (11,154) (6,559) (4,172) (2,725) (2,473) (15,929) (3,516) (1,557) (10,271) Total Adjustments 26,646 17,240 10,860 7,044 6,839 41,983 9,181 5,921 28,985 Adjusted Net Income $108,257 ($81,425) $94,700 $55,423 $178,433 $247,131 $263,837 $81,597 $579,290

38 For more information, please visit www.brileyfin.com