Attached files
| file | filename |
|---|---|
| EX-21 - EXHIBIT 21 - B. Riley Financial, Inc. | s102842_ex21.htm |
| EX-32.2 - EXHIBIT 32-2 - B. Riley Financial, Inc. | s102842_ex32-2.htm |
| EX-31.1 - EXHIBIT 31-1 - B. Riley Financial, Inc. | s102842_ex31-1.htm |
| EX-23.1 - EXHIBIT 23-1 - B. Riley Financial, Inc. | s102842_ex23-1.htm |
| EX-32.1 - EXHIBIT 32-1 - B. Riley Financial, Inc. | s102842_ex32-1.htm |
| EX-31.2 - EXHIBIT 31-2 - B. Riley Financial, Inc. | s102842_ex31-2.htm |
UNITED STATES
SECURITIES AND EXCHANGE COMMISSION
Washington, D.C. 20549
FORM 10-K
| (Mark One) | |
| x | ANNUAL REPORT PURSUANT TO SECTION 13 OR 15(d) OF THE SECURITIES EXCHANGE ACT OF 1934 |
| For the fiscal year ended December 31, 2015 | |
| Or | |
| ¨ | TRANSITION REPORT PURSUANT TO SECTION 13 OR 15(d) OF THE SECURITIES EXCHANGE ACT OF 1934 |
| For the transition period from ______________ to _____________ | |
Commission File Number 000-54010
B. RILEY FINANCIAL, INC.
(Exact name of registrant as specified in its charter)
| Delaware | 27-0223495 |
| (State or Other Jurisdiction of Incorporation or Organization) |
(I.R.S. Employer Identification No.) |
| 21860 Burbank Boulevard, Suite 300 South Woodland Hills, CA |
91367 |
| (Address of Principal Executive Offices) | (Zip Code) |
(818) 884-3737
(Registrant’s telephone number, including area code)
Securities registered pursuant to Section 12(b) of the Act: None
Securities registered pursuant to Section 12(g) of the Act:
Common Stock, par value $0.0001 per share
(Title of Class)
Indicate by check mark if the registrant is a well-known seasoned issuer, as defined in Rule 405 of the Securities Act. Yes: ¨ No x
Indicate by check mark if the registrant is not required to file reports pursuant to Section 13 or Section 15(d) of the Act. Yes ¨ No x
Indicate by check mark whether the registrant (1) has filed all reports required to be filed by Section 13 or 15(d) of the Securities Exchange Act of 1934 during the preceding 12 months (or for such shorter period that the registrant was required to file such reports), and (2) has been subject to such filing requirements for the past 90 days. Yes: x No ¨
Indicate by check mark whether the registrant has submitted electronically and posted on its corporate Website, if any, every Interactive Data File required to be submitted and posted pursuant to Rule 405 of Regulation S-T during the preceding 12 months (or such shorter period that the registrant was required to submit and post such files). Yes: x No ¨
Indicate by check mark if disclosure of delinquent filers pursuant to Item 405 of Regulation S-K (§ 229.405 of this chapter) is not contained herein, and will not be contained, to the best of registrant’s knowledge, in definitive proxy or information statements incorporated by reference in Part III of this Form 10-K or any amendment to this Form 10-K. ¨
Indicate by check mark whether the registrant is a large accelerated filer, an accelerated filer, a non-accelerated filer or a smaller reporting company. See definitions of “large accelerated filer,” “accelerated filer” and “smaller reporting company” in Rule 12b-2 of the Exchange Act.
| Large accelerated filer ¨ | Accelerated filer ¨ |
| Non-accelerated filer ¨ (Do not check if a smaller reporting company) | Smaller reporting company x |
Indicate by check mark whether the registrant is a shell company (as defined in Rule 12b-2 of the Exchange Act). Yes: ¨ No x
The aggregate market value of the registrant’s common stock held by non-affiliates, based on the closing price of the registrant’s common stock as reported on the OTC Bulletin Board on June 30, 2015, the last business day of the registrant’s most recently completed second fiscal quarter, was approximately $61.0 million. For purposes of this calculation, it has been assumed that all shares of the registrant's common stock held by directors, executive officers and stockholders beneficially owning ten percent or more of the registrant's common stock are held by affiliates. The treatment of these persons as affiliates for purposes of this calculation is not conclusive as to whether such persons are, in fact, affiliates of the registrant.
The number of shares outstanding of the registrant’s common stock as of March 21, 2016 was 16,614,786.
DOCUMENTS INCORPORATED BY REFERENCE
Portions of the definitive Proxy Statement relating to the registrant’s 2016 Annual Meeting of Stockholders are incorporated by reference into Part III of this Annual Report.
B. RILEY FINANCIAL, INC.
INDEX TO ANNUAL REPORT ON FORM 10-K
FOR THE FISCAL YEAR ENDED DECEMBER 31, 2015
| 2 |
This Annual Report on Form 10-K (this “Annual Report”) contains forward-looking statements regarding our business, financial condition, results of operations and prospects. Words such as “expect,” “anticipate,” “intend,” “plan,” “believe,” “seek,” “may,” “will,” “predict,” “potential,” “continue,” “estimate” and similar expressions are generally intended to identify forward-looking statements, but are not exclusive means of identifying forward-looking statements in this Annual Report. You should not place undue reliance on such forward-looking statements, which are based on the information currently available to us and speak only as of the date on which this Annual Report was filed with the Securities and Exchange Commission (the “SEC”). Because these forward-looking statements involve known and unknown risks and uncertainties, there are important factors that could cause actual results, events or developments to differ materially from those expressed or implied by these forward-looking statements, including our plans, objectives, expectations and intentions and other factors discussed in “Part I—Item 1A. Risk Factors” contained in this Annual Report. Risk factors that could cause actual results to differ from those contained in the forward-looking statements include but are not limited to risks related to: volatility in our revenues and results of operations; changing conditions in the financial markets; our ability to generate sufficient revenues to achieve and maintain profitability; the short term nature of our engagements; the accuracy of our estimates and valuations of inventory or assets in “guarantee” based engagements; competition in the asset management business; potential losses related to our auction or liquidation engagements; our dependence on communications, information and other systems and third parties; potential losses related to purchase transactions in our auction and liquidations business; the potential loss of financial institution clients; potential losses from or illiquidity of our proprietary investments; changing economic and market conditions; potential liability and harm to our reputation if we were to provide an inaccurate appraisal or valuation; potential mark-downs in inventory in connection with purchase transactions; failure to successfully compete in any of our segments; loss of key personnel; our ability to borrow under our credit facilities as necessary; failure to comply with the terms of our credit agreements; and our ability to meet future capital requirements. We undertake no obligation to publicly update or revise any forward-looking statements, whether as a result of new information, future events or otherwise.
Except as otherwise required by the context, references in this Annual Report to “the Company,” “B. Riley,”“we,” “us” or “our” refer to the combined business of B. Riley Financial, Inc. and all of its subsidiaries.
| Item 1. | BUSINESS |
General
B. Riley Financial, Inc. and its subsidiaries provide collaborative financial services and solutions through several subsidiaries, including:
| § | B. Riley & Co., LLC (“BRC”), a mid-sized, full service investment bank providing financial advisory, corporate finance, research, and sales & trading services to corporate, institutional and high net worth individual clients; |
| § | B. Riley Capital Management, LLC, an Securities and Exchange Commission (“SEC”) registered investment advisor, which includes: |
| o | B. Riley Asset Management, an advisor to certain public and private funds and to institutional and high net worth investors; |
| o | B. Riley Wealth Management (formerly MK Capital Advisors), a multi-family office practice and wealth management firm focused on the needs of ultra-high net worth individuals and families; and |
| o | Great American Capital Partners, LLC (“GACP”), the general partner of a private fund, GACP I, L.P. a direct lending fund that provides senior secured loans and second lien secured loan facilities to middle market public and private U.S. companies |
| § | Great American Group, LLC, a leading provider of asset disposition and auction solutions to a wide range of retail and industrial clients; and |
| § | Great American Group Advisory and Valuation Services, LLC, a leading provider of appraisal and valuation services for asset based lenders, private equity firms and corporate clients. |
We are headquartered in Los Angeles with offices in major financial markets throughout the United States and Europe.
| 3 |
For financial reporting purposes we classify our businesses into three segments: (i) capital markets, (ii) auction and liquidation and (iii) valuation and appraisal.
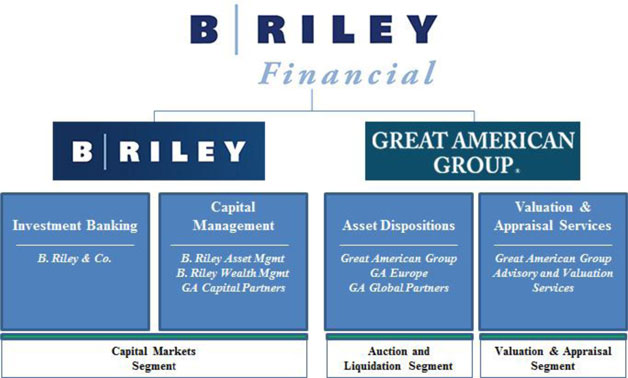
Capital Markets Segment. Our capital markets segment provides a full array of investment banking, corporate finance, research, wealth management, sales and trading services to corporate, institutional and high net worth clients. Our corporate finance and investment banking services include merger and acquisitions advisory services to public and private companies, initial and secondary public offerings, and institutional private placements. In addition, we trade equity securities as a principal for the Company’s account, including investments in funds managed by our subsidiaries. Our capital markets segment also includes our asset management businesses that manage various private and public funds for institutional and individual investors.
Auction and Liquidation Segment. Our auction and liquidation segment utilizes our significant industry experience, a scalable network of independent contractors and industry-specific advisors to tailor our services to the specific needs of a multitude of clients, logistical challenges and distressed circumstances. Furthermore, our scale and pool of resources allow us to offer our services across North American as well as parts of Europe, Asia and Australia. Our auction and liquidation segment operates through two main divisions, retail store liquidations and wholesale and industrial assets dispositions. Our wholesale and industrial assets disposition division operates through limited liability companies that are controlled by us.
Valuation and Appraisal Segment. Our valuation and appraisal segment provides valuation and appraisal services to financial institutions, lenders, private equity firms and other providers of capital. These services primarily include the valuation of assets (i) for purposes of determining and monitoring the value of collateral securing financial transactions and loan arrangements and (ii) in connection with potential business combinations. Our valuation and appraisal segment operates through limited liability companies that are majority owned by us.
Private Placement and Strategic Combination
On June 5, 2014, we completed a private placement of 10,289,300 shares of our common stock at a purchase price of $5.00 per share (the “Private Placement”). Fifty-three accredited investors (the “Investors”) participated in the Private Placement pursuant to the terms and provisions of a securities purchase agreement entered into among us and the Investors on May 19, 2014. At the closing of the Private Placement on June 5, 2014, we received net proceeds of approximately $51.2 million. On June 5, 2014, we used $30.2 million of the net proceeds from the Private Placement to repay long-term debt payable to Andrew Gumaer and Harvey Yellen, both of whom were executive officers and directors of the Company at the time of such repayment. The $30.0 million principal payment and then outstanding accrued interest of $0.2 million retired the entire $48.8 million face amount of the long-term debt at a discount of $18.8 million. The discount of $18.8 million has been recorded as a capital contribution to additional paid in capital in our consolidated financial statements.
| 4 |
On June 18, 2014, we completed the acquisition of B. Riley and Co. Inc. (“BRC Inc.”) pursuant to the terms of the Acquisition Agreement (the Acquisition Agreement”), dated as of May 19, 2014, by and among the Company, Darwin Merger Sub I, Inc., a wholly owned subsidiary of the Company, B. Riley Capital Markets, LLC, a wholly owned subsidiary of the Company (“BCM”), BRC Inc., B. Riley & Co. Holdings, LLC (“BRH”), Riley Investment Management LLC (“RIM”), and collectively with BRC Inc. and BRH, the (“B. Riley Entities”) and Bryant Riley, a director of the Company and principal owner of each of the B. Riley Entities. In connection with the Company’s acquisition of BRC Inc., Darwin Merger Sub I, Inc. merged with and into BRC Inc., and BRC Inc. subsequently merged with and into BCM, with BCM surviving as a wholly owned subsidiary of the Company. We completed the acquisitions of BRH, whose operations include asset management and financial advisory services, and RIM, which provides services to certain pooled investment vehicles, on August 1, 2014.
The total purchase price for the B. Riley Entities was $26.4 million, which was paid at closing on June 18, 2014, or through post-closing adjustments and arrangements, in the form of 4,182,637 newly issued shares of our common stock. The fair value of the newly issued shares of the Company’s common stock for accounting purposes was determined based on the closing market price of the Company’s shares of common stock on the acquisition date, less a 25% discount for lack of marketability as the shares issued are subject to certain restrictions that limit their trade or transfer in the open market.
Effective upon the closing of the acquisition on June 18, 2014, Bryant Riley, the principal owner of BRC Inc., was appointed as our Chief Executive Officer and Chairman. As a result of the acquisition of BRC Inc., Bryant Riley owns approximately 24.1% of our outstanding common stock.
Recent Developments
On January 2, 2015, we entered into a purchase agreement to acquire all of the membership interests of MK Capital Advisors, LLC (“MK Capital”), a wealth management business with operations primarily in New York. On February 2, 2015, the pre-closing conditions were satisfied and we completed the purchase of MK Capital. Upon closing, we paid the members of MK Capital $2.5 million in cash and issued 333,333 shares of our common stock to such members. The purchase agreement also requires the payment of contingent consideration of $1.25 million in cash and 166,667 shares of our common stock on the first anniversary date of the closing (February 2, 2016) and a final payment of $1.25 million in cash and 166,666 of our common stock on the second anniversary date of the closing (February 2, 2017). Such contingent consideration is contingent on MK Capital generating a minimum amount of gross revenues as defined in the purchase agreement for the twelve months ending on the first and second anniversary dates of the closing. MK Capital achieved the minimum amount of revenues for the first anniversary period and the contingent cash consideration and contingent stock consideration for such first anniversary period was paid and issued on February 2, 2016. The acquisition of MK Capital allows the Company to expand into the wealth management business..
In April 2015, we announced the formation of GACP, a wholly owned subsidiary of the Company, and GACP I, L.P., a private direct lending fund of which GACP is the general partner, together with an anchor investment from a business development company advised by a large financial services company. GACP I, L.P. provides asset-based loans to middle market companies. GACP leverages the knowledge and expertise of Great American Group’s liquidation and appraisal business to provide insight into asset collateral values that support the asset-based loans. We believe that this internal expertise in assessing collateral values provides GACP with a competitive advantage over other middle market direct lenders. In connection with the formation of GACP I, L.P., we committed to invest $5.0 million in exchange for an ownership interest of approximately 5% of GACP I, L.P. As of December 31, 2015, we funded $1.7 million of the $5.0 million commitment to invest in GACP I, L.P.
In February 2016, we announced the hiring of a senior managing director to form and head our corporate restructuring practice group. Our new senior managing director brings extensive experience in the retail, healthcare, real estate, energy, and communications sectors and has advised municipalities and other governmental entities. He was named the 2014 "Turnaround Consultant of the Year" by The M&A Advisor and a Top 100 Global Restructuring and Turnaround Professional by Global M&A Network.
| 5 |
B. Riley
Investment Banking and Corporate Finance
B. Riley investment banking professionals provide equity and debt capital raising, merger and acquisition and financial advisory services to both private and publicly traded companies. Those services include: follow-on public offerings, debt and equity private placements, debt refinancings, corporate debt and equity security repurchases, and buy-side and sell-side representation, divestitures/carveouts, leveraged buyouts, management buyouts, strategic alternatives reviews, fairness opinions, valuations, return-of-capital advisory, hostile/activist advisory, and options trading programs.
Sales, Trading and Corporate Services
Our sales and trading professionals distribute B. Riley proprietary research products to our institutional investor clients and high net worth individuals. B. Riley sales and trading also sells the securities of companies in which B. Riley acts as an underwriter and executes equity trades on behalf of clients. We maintain active trading relationships with substantially all major institutional money managers. Our equity and fixed income traders make markets in approximately 150 securities. Our corporate services include retail orders, block trades, Rule 144 transactions, cashless exercise of options, and corporate equity repurchase programs.
Equity Research
Our equity research is focused on fundamentals-based research. Our research focuses on an in-depth analysis of earnings, cash flow trends, balance sheet strength, industry outlook, and strength of management that involves extensive meetings with key management, competitors, channel partners and customers. We provide research on all sizes of firms; however, our research primarily focuses on small and mid-cap stocks that are under-followed by Wall Street. Our analysts regularly communicate their findings through Research Updates and daily Morning Notes.
Our research department includes research analysts maintaining coverage on a variety of companies in a variety of industry sectors. Our research department annually organizes non-deal road shows for issuers in our targeted industries. To provide our institutional clients access to management teams of companies in our coverage universe and others, our research department has held 16 consecutive annual institutional investor conferences.
Capital Management
We provide investment management services under our subsidiary, B. Riley Capital Management, LLC, an SEC registered investment advisor. The registered investment advisor manages one mutual fund and certain other private investment funds, including a fund of funds. All of the funds managed typically invest in both public and private equity and debt. Investors for the various funds include institutional, high net worth, and individual investors. GACP is the general partner of GACP I, L.P., a direct lending fund that provides asset based loans to middle market companies.
Wealth Management
In February 2015, we acquired MK Capital, a wealth management business with operations primarily in New York, and subsequently changed the name to “B. Riley Wealth Management”. Our wealth management business provides comprehensive investment advisory services to ultrahigh net worth families and individuals. We provide traditional asset management, alternative asset management and trust and estate planning to our clients. B. Riley Wealth Management is a division of B. Riley Capital Management, LLC, an SEC registered investment advisor.
Proprietary Trading
We engage in trading activities for strategic investment purposes (i.e proprietary trading) utilizing the firm’s capital. Proprietary trading activities include investments in public and private stock and debt securities. In 2010, the federal government passed the Dodd-Frank Wall Street Reform and Consumer Protection Act (“Dodd-Frank”). Dodd-Frank significantly restructures and intensifies regulation in the financial services industry and includes a section referred to as the “Volcker Rule”. The Volcker Rule provides for a limitation on proprietary trading and investments by certain bank holding companies. We are not a bank holding company and, as a result, the limitations applicable to bank holding companies regarding proprietary trading and investment in the Volcker Rule do not apply to us.
The business described above for B. Riley is reported in our capital markets segment for financial reporting purposes.
| 6 |
Great American Group
Retail Store Liquidations
We enable our clients to quickly and efficiently dispose of under-performing assets and generate cash from excess inventory by conducting or assisting in retail store closings, going out of business sales, bankruptcy sales and fixture sales. With the goal of providing a single-source solution to our retail clients, we also provide merger and acquisition due diligence through our auction and liquidation segment and reverse logistics and appraisal services through our valuation and appraisal segment. Financial institution and other capital providers rely on us to maximize recovery rates in distressed asset sales and in retail bankruptcy situations. Additionally, healthy, mature retailers utilize our proven inventory management and strategic disposition solutions, relying on our extensive network of retail professionals, to close unproductive stores and dispose of surplus inventory and fixtures as existing stores are updated. For example, in a potential bankruptcy engagement, the debtor provides potential disposition firms with a snapshot of inventory and other assets available for sale. The disposition firms must analyze the inventory data and generate an estimate of potential recovery based on their valuation expertise and past liquidation experience. The disposition firms then submit bids that guarantee a minimum recovery based on a percentage of retail value or cost. The successful bidder assumes management of the debtor’s stores on a contract basis and conducts the orderly disposition of the inventory and assets in these stores. Profits are generated by efficiently merchandizing inventory, managing the orderly closing of store locations and pricing remaining products to balance margin with speed of sale and liquidation expenses. Unlike merchandisers who employ a “top down” approach by focusing only on driving total sales (because overhead costs are fixed), disposition firms take a “bottom up” approach by focusing on balancing cost savings with maximizing proceeds. A typical retail disposition process spans eight to twelve weeks from the bankruptcy court’s approval of the successful bid to the final store closure.
We often conduct large retail liquidations that entail significant capital requirements through collaborative arrangements with other liquidators. By entering into an agreement with one or more collaborators, we are able to bid on larger engagements that we couldn’t conduct on our own due to the significant capital outlay involved, number of independent contractors required or financial risk associated with the particular engagement. We act as the lead partner in many of the collaborative arrangements that we enter into, meaning that we have primary responsibility for the due diligence, contract negotiation and execution of the engagement.
Wholesale and Industrial Asset Dispositions
We design and implement customized disposition programs for our clients seeking to convert excess wholesale and industrial inventory and operational assets into capital. We dispose of a wide array of assets including, among others, equipment related to transportation, heavy mobile construction, energy exploration and services, metal fabrication, food processing, semiconductor fabrication, and distribution services. We manage projects of all sizes and scopes across a variety of asset categories. We believe that our databases of information regarding potential buyers that we have collected from past transactions and engagements, our nationwide name recognition and experience with alternative distribution channels allow us to provide superior wholesale and industrial disposition services.
We offer clients various wholesale and industrial disposition strategies including, among others, live auctions, webcast auctions, and online auctions. The live public auction is the most traditional sales technique for wholesale and industrial asset dispositions and one of our most frequently utilized services. In live auctions, bidders gather at a specified date and time to competitively bid against one another, with each item selling to the highest bidder. We believe that our auctioneers are recognized throughout the industry for their auctioneering skills, project experience, engaging personalities and ability to extract top prices. Our live auctions can cover single sites or multiple locations, and we utilize point-of-sale software to generate customized sales reports and invoices and to track assets. Increasingly, we have been webcasting our live auctions over the Internet. This auction format allows online bidders to compete in real time against bidders at the live auction. Bidders can log onto the auction from personal computers, view and bid on lots as they come up for sale, hear the auctioneers as the sale is being conducted and, in some cases, view live streaming video of the auctioneer calling the bids on-site. We believe that this auction format maximizes proceeds by providing access to otherwise unavailable potential bidders, including international participants, thereby increasing competition. In some cases, particularly when assets are located in remote areas that are not easily accessible to bidders, we may determine, in consultation with the client, that a webcast only auction is the most appropriate format. In the online auction format, the sale of assets takes place exclusively online, without a live auctioneer calling the sale. Similar to the timed auctions popularized by online auction sites such as eBay, assets are posted for sale online and buyers can bid on lots and items for a set period of time, usually one week. The online auction format is optimal for clients that have idle assets in quantities insufficient to justify the cost of a live auction. We conduct our wholesale and industrial disposition business throughout parts of North America, Europe, Asia and Australia. Our business is primarily conducted through GA Global Partners, LLC, a 50% owned subsidiary that is controlled by us.
| 7 |
Great American Group provides the foregoing services to clients on a guarantee, fee or outright purchase basis.
Guarantee. When providing services on a guarantee basis, we guarantee the client a specific recovery often expressed as a percentage of retail inventory value or wholesale inventory cost or, in the case of machinery or equipment, a set dollar amount. This guarantee is often required to be supported by a letter of credit, a cash deposit or a combination thereof. Cash deposits are typically funded in part with available cash together with short term borrowings under our credit facilities. Often when we provide auction or liquidation services on a guarantee basis, we do so through a collaborative arrangement with other service providers. In this situation, each collaborator agrees to provide a certain percentage of the guaranteed amount to the client through a combination of letters of credit, cash and financing. If we are engaged individually, we receive 100% of the net profit, less debt financing fees, sale related expenses (if any) and any share of the profits due to the client as a result of any profit sharing arrangement entered into based on a pre-negotiated formula. If the engagement was conducted through a collaborative arrangement, the profits or losses are divided among us and our partner or partners as set forth in the agreement governing the collaborative arrangement. If the net sales proceeds after expenses are less than the guarantee, we, together with our partners if the engagement was conducted through a collaborative arrangement, are responsible for the shortfall and will recognize a loss on the engagement.
Fee. When we provide services on a fee basis, clients pay a pre-negotiated flat fee for the services provided, a percentage of asset sales generated or a combination of both.
Outright Purchase. When providing services on an outright purchase basis, we purchase the assets from the client and typically sell them at auction, orderly liquidation, through a third-party broker or, less frequently, as augmented inventory in conjunction with another liquidation that we are conducting. In an outright purchase, we take, together with any collaboration partners, title to the assets and absorb the profit or loss associated with the asset disposition.
The retail store liquidations and wholesale and industrial asset dispositions business of Great American Group described above is reported in our auction and liquidation segment for financial reporting purposes.
Valuation and Appraisal
Our valuation and appraisal teams provide independent appraisals to financial institutions, lenders, private equity firms and other providers of capital for estimated liquidation values of assets. These teams include experts specializing in particular industry niches and asset classes. We provide valuation and appraisal services across five general categories:
Consumer and Retail Inventory. Representative types of appraisals and valuations include inventory of specialty apparel retailers, department stores, jewelry retailers, sporting goods retailers, mass and discount merchants, home furnishing retailers and footwear retailers.
Wholesale and Industrial Inventory. Representative types of appraisals and valuations include inventory held by manufacturers or distributors of automotive parts, chemicals, food and beverage products, wine and spirits, building and construction products, industrial products, metals, paper and packaging.
Machinery and Equipment. Representative types of asset appraisals and valuations include a broad range of equipment utilized in manufacturing, construction, transportation and healthcare.
Intangible Assets. Representative types of asset appraisals and valuations include intellectual property, goodwill, brands, logos, trademarks and customer lists.
Real Estate. Representative types of asset appraisals and valuations include owned and leased manufacturing and distribution facilities, retail locations and corporate offices. We do not perform appraisals of residential properties.
We provide valuation and appraisal services on a pre-negotiated flat fee basis.
The valuation and appraisal services business of Great American Group described above is reported in our valuation and appraisal segment for financial reporting purposes.
| 8 |
UK Retail Stores
We previously had an additional operating segment relating to UK retail stores. Our UK retail stores segment included the operations of ten retail footwear stores in the United Kingdom as a result of our investment in Shoon Trading Limited (“Shoon”) on May 4, 2012. We ceased to consider this a separate operating segment in August 2013 following the amendment and restatement of a shareholders agreement for Shoon which eliminated our control rights. As a result of this amendment, Shoon’s operating results are not consolidated with the Company’s for any periods after July 31, 2013. Notwithstanding the deconsolidation, our operating results for periods from July 31, 2013 to January 2014 include the income (loss) from our 44.4% equity investment in the common stock of Shoon. In January 2014, Shoon was sold to a third party, and we no longer have a financial interest in the operations of Shoon.
Customers
We serve retail, corporate, capital provider and individual customers across our services lines. Revenues from liquidation service contracts to one retailer represented 12.4% of our total revenues during the year ended December 31, 2015. Revenues from one liquidation service contract and the sale of four oil rigs to one customer represented 10.7% and 12.2% of total revenues during the year ended December 31, 2013. The services provided to these customers were under short-term liquidation contracts that generally do not exceed a period of six months. There were no recurring revenues from year-to-year in connection with the services we performed under these contracts.
B. Riley
We are engaged by corporate customers, including publicly held and privately owned companies, to provide investment banking, corporate finance, research and sales and trading services. We also provide corporate finance, research, wealth management, and sales and trading services to high net worth individuals. We maintain client relationships with companies in the consumer goods, consumer services, defense, industrials and technology industries.
Great American Group
Our retail auction and liquidation clients include financially healthy retailers as well as distressed retailers, bankruptcy professionals, financial institution workout groups and a wide range of professional service providers. Some retail segments in which we specialize include apparel, arts and crafts, department stores, discount stores, drug / health and beauty, electronics, footwear, grocery stores, hardware / home improvement, home goods and linens, jewelry, office / party supplies, specialty stores, and sporting goods. Previous clients include Target, Cache, Orchard Supply Stores, Blockbuster Video, Borders Group, Circuit City, Friedman’s Jewelers, Fortunoff, Office Depot, TJ Hughes, Hancock Fabrics, Movie Gallery, Linens N Things, and Kmart.
We provide wholesale and industrial auction services and customized disposition programs to a wide range of clients. Specifically, we have experience in providing auction and liquidation solutions to the following industries: aircraft / aerospace, casino / hospitality, construction / mining / earthmoving, food and beverage processing, hospital / medical, machine tools / metalworking, material handling, packaging / bottling, plastics and rubber processing, printing / bindery, pulp processing / paper converting, restaurant / bar / bakery, retail / trade fixtures, stadium / arena, textile / apparel, transportation / rolling stock, warehouse / distribution centers, and woodworking / lumber. Representative recent clients include Boeing, Hollywood Park, Stardust Hotel & Casino, Midas International, James River Coal Company, Lillian Vernon, and Saint Vincent Medical Center of New York.
We are engaged by financial institutions, lenders, private equity firms and other capital providers, as well as professional service providers, to provide valuation and advisory services. We have extensive experience in the appraisal and valuation of retail and consumer inventories, wholesale and industrial inventories, machinery and equipment, intellectual property and real estate. We maintain ongoing client relationships with major asset based lenders including Bank of America, Credit Suisse, GE Capital, JPMorgan Chase, Union Bank of California, and Wells Fargo. Our clients also include private equity firms such as Apollo Management, Goldman Sachs Capital Partners, and Sun Capital Partners.
Competition
B. Riley
We face intense competition for our capital markets services. Since the mid-1990s, there has been substantial consolidation among U.S. and global financial institutions. In particular, a number of large commercial banks, insurance companies and other diversified financial services firms have merged with other financial institutions or have established or acquired broker-dealers. During 2008, the failure or near-collapse of a number of very large financial institutions led to the acquisition of several of the most sizeable U.S. investment banking firms, consolidating the financial industry to an even greater extent. Currently, our competitors are other investment banks, bank holding companies, brokerage firms, merchant banks and financial advisory firms. Our focus on our target industries also subjects us to direct competition from a number of specialty securities firms and smaller investment banking boutiques that specialize in providing services to these industries.
| 9 |
The industry trend toward consolidation has significantly increased the capital base and geographic reach of many of our competitors. Our larger and better-capitalized competitors may be better able than we are to respond to changes in the investment banking industry, to recruit and retain skilled professionals, to finance acquisitions, to fund internal growth and to compete for market share generally. Many of these firms have the ability to offer a wider range of products than we do, including loans, deposit-taking and insurance, in addition to brokerage, asset management and investment banking services, all of which may enhance their competitive position relative to us. These firms also have the ability to support investment banking and securities products with commercial banking, insurance and other financial services revenues in an effort to gain market share, which could result in downward pricing pressure in our businesses. In particular, the trend in the equity underwriting business toward multiple book runners and co-managers has increased the competitive pressure in the investment banking industry and has placed downward pressure on average transaction fees.
As we seek to expand our asset management business, we face competition in the pursuit of investors for our investment funds, in the identification and completion of investments in attractive portfolio companies or securities, and in the recruitment and retention of skilled asset management professionals.
Great American Group
We also face intense competition in our other service areas. While some competitors are unique to specific service offerings, some competitors cross multiple service offerings. A number of companies provide services or products to the auction and liquidation and valuation and appraisal markets, and existing and potential clients can, or will be able to, choose from a variety of qualified service providers. Some of our competitors may even be able to offer discounts or other preferred pricing arrangements. In a cost-sensitive environment, such arrangements may prevent us from acquiring new clients or new engagements with existing clients. Some of our competitors may be able to negotiate secure alliances with clients and affiliates on more favorable terms, devote greater resources to marketing and promotional campaigns or to the development of technology systems than us. In addition, new technologies and the expansion of existing technologies with respect to the online auction business may increase the competitive pressures on us. We must also compete for the services of skilled professionals. There can be no assurance that we will be able to compete successfully against current or future competitors, and competitive pressures we face could harm our business, operating results and financial condition.
We face competition for our retail services from traditional liquidators as well as Internet-based liquidators such as overstock.com and eBay. Our wholesale and industrial services competitors include traditional auctioneers and fixed site auction houses that may specialize in particular industries or geographic regions as well as other large, prestigious or well-recognized auctioneers. We also face competition and pricing pressure from the internal remarketing groups of our clients and potential clients and from companies that may choose to liquidate or auction assets and/or excess inventory without assistance from service providers like us. We face competition for our valuation and appraisal services from large accounting, consulting and other professional service firms as well as other valuation, appraisal and advisory firms.
Regulation
We are subject to federal and state consumer protection laws, including regulations prohibiting unfair and deceptive trade practices. In addition, numerous states and municipalities regulate the conduct of auctions and the liability of auctioneers. We and/or our auctioneers are licensed or bonded in the following states where we conduct, or have conducted, retail, wholesale or industrial asset auctions: California, Florida, Georgia, Illinois, Massachusetts, Ohio, South Carolina, Texas, Virginia and Washington. In addition, we are licensed or obtain permits in cities and/or counties where we conduct auctions, as required. If we conduct an auction in a state where we are not licensed or where reciprocity laws do not exist, we will work with an auctioneer of record in such state.
As a participant in the financial services industry, we are subject to complex and extensive regulation of most aspects of our business by U.S. federal and state regulatory agencies, self-regulatory organizations and securities exchanges. The laws, rules and regulations comprising the regulatory framework are constantly changing, as are the interpretation and enforcement of existing laws, rules and regulations. The effect of any such changes cannot be predicted and may direct the manner of our operations and affect our profitability.
BRC, our broker-dealer subsidiary, is subject to regulations governing every aspect of the securities business, including the execution of securities transactions; capital requirements; record-keeping and reporting procedures; relationships with customers, including the handling of cash and margin accounts; the experience of and training requirements for certain employees; and business interactions with firms that are not members of regulatory bodies.
BRC is registered as a securities broker-dealer with the SEC and is a member of FINRA. FINRA is a self-regulatory body composed of members such as our broker-dealer subsidiary that have agreed to abide by the rules and regulations of FINRA. FINRA may expel, fine and otherwise discipline member firms and their employees. BRC is also licensed as a broker-dealer in 18 states in the U.S., requiring us to comply with the laws, rules and regulations of each such state. Each state may revoke the license to conduct securities business, fine and otherwise discipline broker-dealers and their employees. We are also registered with NASDAQ and must comply with its applicable rules.
| 10 |
BRC is also subject to the SEC’s Uniform Net Capital Rule, Rule 15c3-1, which may limit our ability to make withdrawals of capital from our broker-dealer subsidiary. The Uniform Net Capital Rule sets the minimum level of net capital a broker-dealer must maintain and also requires that a portion of its assets be relatively liquid. In addition, BRC is subject to certain notification requirements related to withdrawals of excess net capital.
We are also subject to the USA PATRIOT Act of 2001 (the Patriot Act), which imposes obligations regarding the prevention and detection of money-laundering activities, including the establishment of customer due diligence and customer verification, and other compliance policies and procedures. The conduct of research analysts is also the subject of rule-making by the SEC, FINRA and the federal government through the Sarbanes-Oxley Act. These regulations require certain disclosures by, and restrict the activities of, research analysts and broker-dealers, among others. Failure to comply with these requirements may result in monetary, regulatory and, in the case of the USA Patriot Act, criminal penalties.
Our asset management subsidiary, B. Riley Capital Management, LLC is an SEC-registered investment adviser, and accordingly subject to regulation by the SEC. Requirements under the Investment Advisors Act of 1940 include record-keeping, advertising and operating requirements, and prohibitions on fraudulent activities.
Various regulators, including the SEC, FINRA and state securities regulators and attorneys general, are conducting both targeted and industry-wide investigations of certain practices relating to the financial services industry, including marketing, sales practices, valuation practices, asset managers, and market and compensation arrangements. These investigations, which have been highly publicized, have involved mutual fund companies, broker-dealers, hedge funds, investors and others.
In addition, the SEC staff has conducted studies with respect to soft dollar practices in the brokerage and asset management industries and proposed interpretive guidance regarding the scope of permitted brokerage and research services in connection with soft dollar practices.
In July 2010, Congress enacted Dodd-Frank. Dodd-Frank institutes a wide range of reforms that will impact financial services firms and requires significant rule-making. In addition, the legislation mandates multiple studies, which could result in additional legislative or regulatory action. Many of the provisions of Dodd-Frank are subject to further rulemaking procedures and studies and will take effect over several years. As a result, we cannot assess the impact of these new legislative and regulatory changes on our business at the present time.
Employees
As of December 31, 2015, we had 217 full time employees and three part time employees. We are not a party to any collective bargaining agreements. We have never experienced a work stoppage or strike and believe that relations with our employees are good.
We rely significantly on the expertise of independent contractors whom we engage in connection with specific transactions. As of December 31, 2015, we maintained a network of approximately 160 independent contractors who we engage from time to time to provide services pursuant to the terms of independent contractor agreements.
Other
We were incorporated in Delaware in May 2009 as a subsidiary of Alternative Asset Management Acquisition Corp. (“AAMAC”). On July 31, 2009, we closed a transaction pursuant to which (i) the members of Great American Group, LLC contributed to the Company of all of their membership interests in Great American Group, LLC, and (ii) AAMAC merged with and into our wholly-owned subsidiary. As a result of such transactions, Great American Group, LLC and AAMAC became our wholly-owned subsidiaries. Following the acquisition of BRC Inc., we changed the Company’s name from Great American Group, Inc. to B. Riley Financial, Inc. in November 2014.
Available Information
We maintain a website at www.brileyfin.com. We file reports with the SEC, and make available, free of charge, on or through our website, our annual reports on Form 10-K, quarterly reports on Form 10-Q, current reports on Form 8-K, proxy and information statements and amendments to those reports filed or furnished pursuant to Section 13(a) or 15(d) of the Securities Exchange Act of 1934, as amended (the "Exchange Act"), as soon as reasonably practicable after we electronically file such material with, or furnish it to, the SEC. The information on our website is not a part of, or incorporated in, this Annual Report.
| 11 |
| Item 1A. | RISK FACTORS |
Given the nature of our operations and services we provide, a wide range of factors could materially affect our operations and profitability. Changes in competitive, market and economic conditions also affect our operations. The risks and uncertainties described below are not the only risks and uncertainties facing us. Additional risks and uncertainties not presently known or that are currently considered to be immaterial may also materially and adversely affect our business operations or stock price. If any of the following risks or uncertainties occurs, our business, financial condition or operating results could materially suffer.
Our revenues and results of operations are volatile and difficult to predict.
Our revenues and results of operations fluctuate significantly from quarter to quarter, due to a number of factors. These factors include, but are not limited to, the following:
| • | Our ability to attract new clients and obtain additional business from our existing client base; |
| • | The number, size and timing of mergers and acquisition transactions, capital raising transactions and other strategic advisory services where we act as an adviser on our auction and liquidation and investment banking engagements; |
| • | The extent to which we acquire assets for resale, or guarantee a minimum return thereon, and our ability to resell those assets at favorable prices; |
| • | Variability in the mix of revenues from the auction and liquidation and valuation and appraisal businesses; |
| • | The rate of growth of new service areas; |
| • | The types of fees we charge clients, or other financial arrangements we enter into with clients; and |
| • | Changes in general economic and market conditions. |
We have limited or no control over some of the factors set forth above and, as a result, may be unable to forecast our revenues accurately. For example, our investment banking revenues are typically earned upon the successful completion of a transaction, the timing of which is uncertain and beyond our control. A client’s acquisition transaction may be delayed or terminated because of a failure to agree upon final terms with the counterparty, failure to obtain necessary regulatory consents or board or stockholder approvals, failure to secure necessary financing, adverse market conditions or unexpected financial or other problems in the business of a client or a counterparty. If the parties fail to complete a transaction on which we are advising or an offering in which we are participating, we will earn little or no revenue from the contemplated transaction.
We rely on projections of revenues in developing our operating plans for the future and will base our expectations regarding expenses on these projections and plans. If we inaccurately forecast revenues and/or earnings, or fail to accurately project expenses, we may be unable to adjust our spending in a timely manner to compensate for these inaccuracies and, as a result, may suffer operating losses and such losses could have a negative impact on our financial condition and results of operations. If, for any reason, we fail to meet company, investor or analyst projections of revenue, growth or earnings, the market price of the common stock could decline and you may lose all or part of your investment.
Conditions in the financial markets and general economic conditions have impacted and may continue to impact our ability to generate business and revenues, which may cause significant fluctuations in our stock price.
Our business has in the past, and may in the future, be materially affected by conditions in the financial market and general economic conditions, such as the level and volatility of interest rates, investor sentiment, the availability and the cost of credit, the U.S. mortgage market, the U.S. real estate market, volatile energy prices, consumer confidence, unemployment, and geopolitical issues. Further, certain aspects of our business are cyclical in nature and changes in the current economic environment may require us to adjust our sales and marketing practices and react to different business opportunities and modes of competition. If we are not successful in reacting to changing economic conditions, we may lose business opportunities which could harm our financial condition. For example, we are more likely to conduct auctions and liquidations in connection with insolvencies and store closures during periods of economic downturn relative to periods of economic expansion. Conversely, during an economic downturn, financial institutions that provide asset-based loans typically reduce the number of loans made, which reduces their need for our valuation and appraisal services.
In addition, weakness or disruption in equity markets and diminished trading volume of securities could adversely impact our sales and trading business in the future. Any industry-wide declines in the size and number of underwritings and mergers and acquisitions transactions could also have an adverse effect on our investment banking revenues. Reductions in the trading prices for equity securities tend to reduce the transaction value of investment banking transactions, such as underwriting and mergers and acquisitions transactions, which in turn may reduce the fees we earn from these transactions. Market conditions may also affect the level and volatility of securities prices and the liquidity and value of investments in our funds and proprietary inventory, and we may not be able to manage our business’s exposure to these market conditions. In addition to these factors, deterioration in the financial markets or economic conditions could materially affect our investment banking business in other ways, including the following:
| 12 |
| • | Our opportunity to act as underwriter or placement agent could be adversely affected by a reduction in the number and size of capital raising transactions or by competing government sources of equity. |
| • | The number and size of mergers and acquisitions transactions or other strategic advisory services where we act as adviser could be adversely affected by continued uncertainties in valuations related to asset quality and creditworthiness, volatility in the equity markets, and diminished access to financing. |
| • | Market volatility could lead to a decline in the volume of transactions that we execute for our customers and, therefore, to a decline in the revenue we receive from commissions and spreads. |
| • | We may experience losses in securities trading activities, or as a result of write-downs in the value of securities that we own, as a result of deteriorations in the businesses or creditworthiness of the issuers of such securities. |
| • | We may experience losses or write downs in the realizable value of our proprietary investments due to the inability of companies we invest in to repay their borrowings. |
| • | Our access to liquidity and the capital markets could be limited, preventing us from making proprietary investments and restricting our sales and trading businesses. |
| • | We may incur unexpected costs or losses as a result of the bankruptcy or other failure of companies for which we have performed investment banking services to honor ongoing obligations such as indemnification or expense reimbursement agreements. |
| • | Sudden sharp declines in market values of securities can result in illiquid markets and the failure of counterparties to perform their obligations, which could make it difficult for us to sell securities, hedge securities positions, and invest funds under management. |
| • | As an introducing broker to clearing firms, we are responsible to the clearing firm and could be held liable for the defaults of our customers, including losses incurred as the result of a customer’s failure to meet a margin call. When we allow customers to purchase securities on margin, we are subject to risks inherent in extending credit. This risk increases when a market is rapidly declining and the value of the collateral held falls below the amount of a customer’s indebtedness. If a customer’s account is liquidated as the result of a margin call, we are liable to our clearing firm for any deficiency. |
| • | Competition in our investment banking, sales, and trading businesses could intensify as a result of the increasing pressures on financial services companies and larger firms competing for transactions and business that historically would have been too small for them to consider. |
| • | Market volatility could result in lower prices for securities, which may result in reduced management fees calculated as a percentage of assets under management. |
| • | Market declines could increase claims and litigation, including arbitration claims from customers. |
| • | Our industry could face increased regulation as a result of legislative or regulatory initiatives. Compliance with such regulation may increase our costs and limit our ability to pursue business opportunities. |
| • | Government intervention may not succeed in improving the financial and credit markets and may have negative consequences for our business. |
It is difficult to predict how long current financial market and economic conditions will continue, whether they will deteriorate and if they do, which of our business lines will be adversely affected. If one or more of the foregoing risks occurs, our revenues are likely to decline and, if we were unable to reduce expenses at the same pace, our profit margins could erode.
| 13 |
We focus principally on specific sectors of the economy in our investment banking operations, and deterioration in the business environment in these sectors or a decline in the market for securities of companies within these sectors could harm our business.
We focus principally on five target industries in our investment banking operations: consumer goods, consumer services, defense, industrials and technology. Volatility in the business environment in these industries or in the market for securities of companies within these industries could adversely affect our financial results and the market value of our common stock. The business environment for companies in some of these industries has been subject to high levels of volatility in recent years, and our financial results have consequently been subject to significant variations from year to year. The market for securities in each of our target industries may also be subject to industry-specific risks. For example, we have research, investment banking and principal investments focused in the areas of defense. This sector has been subject to U.S. Department of Defense budget cuts as well as by disruptions in the financial markets and downturns in the general economy. The consumer goods and services sectors are subject to consumer spending trends, which have been volatile, to mall traffic trends, which have been down, to the availability of credit, and to broader trends such as the rise of Internet retailers. Emerging markets have driven the growth of certain consumer companies but emerging market economies are fragile, subject to wide swings in GDP, and subject to changes in foreign currencies. The technology industry has been volatile, driven by evolving technology trends, by technological obsolescence, by enterprise spending, and by changes in the capital spending trends of major corporations and government agencies around the world.
Our investment banking operations focus on various sectors of the economy, and we also depend significantly on private company transactions for sources of revenues and potential business opportunities. Most of these private company clients are initially funded and controlled by private equity firms. To the extent that the pace of these private company transactions slows or the average transaction size declines due to a decrease in private equity financings, difficult market conditions in our target industries or other factors, our business and results of operations may be harmed.
Underwriting and other corporate finance transactions, strategic advisory engagements and related sales and trading activities in our target industries represent a significant portion of our investment banking business. This concentration of activity in our target industries exposes us to the risk of declines in revenues in the event of downturns in these industries.
Our corporate finance and strategic advisory engagements are singular in nature and do not generally provide for subsequent engagements.
Our investment banking clients generally retain us on a short-term, engagement-by-engagement basis in connection with specific corporate finance, merger and acquisition transactions (often as an advisor in company sale transactions) and other strategic advisory services, rather than on a recurring basis under long-term contracts. As these transactions are typically singular in nature and our engagements with these clients may not recur, we must seek new engagements when our current engagements are successfully completed or are terminated. As a result, high activity levels in any period are not necessarily indicative of continued high levels of activity in any subsequent period. If we are unable to generate a substantial number of new engagements that generate fees from new or existing clients, our business, results of operations and financial condition could be adversely affected.
The asset management business is intensely competitive.
Over the past several years, the size and number of asset management funds, including hedge funds and mutual funds, has continued to increase. If this trend continues, it is possible that it will become increasingly difficult for our funds to raise capital. More significantly, the allocation of increasing amounts of capital to alternative investment strategies by institutional and individual investors leads to a reduction in the size and duration of pricing inefficiencies. Many alternative investment strategies seek to exploit these inefficiencies and, in certain industries, this drives prices for investments higher, in either case increasing the difficulty of achieving targeted returns. In addition, if interest rates were to rise or there were to be a prolonged bull market in equities, the attractiveness of our funds relative to investments in other investment products could decrease. Competition is based on a variety of factors, including:
| • | investment performance; |
| • | investor perception of the drive, focus and alignment of interest of an investment manager; |
| • | quality of service provided to and duration of relationship with investors; |
| • | business reputation; and |
| • | level of fees and expenses charged for services. |
| 14 |
We compete in the asset management business with a large number of investment management firms, private equity fund sponsors, hedge fund sponsors and other financial institutions. A number of factors serve to increase our competitive risks, as follows:
| • | investors may develop concerns that we will allow a fund to grow to the detriment of its performance; |
| • | some of our competitors have greater capital, lower targeted returns or greater sector or investment strategy specific expertise than we do, which creates competitive disadvantages with respect to investment opportunities; |
| • | some of our competitors may perceive risk differently than we do which could allow them either to outbid us for investments in particular sectors or, generally, to consider a wider variety of investments; |
| • | there are relatively few barriers to entry impeding new asset management firms, and the successful efforts of new entrants into our various lines of business, including former “star” portfolio managers at large diversified financial institutions as well as such institutions themselves, will continue to result in increased competition; and |
| • | other industry participants in the asset management business continuously seek to recruit our best and brightest investment professionals away from us. |
These and other factors could reduce our earnings and revenues and adversely affect our business. In addition, if we are forced to compete with other alternative asset managers on the basis of price, we may not be able to maintain our current base management and incentive fee structures. We have historically competed primarily on the performance of our funds, and not on the level of our fees relative to those of our competitors. However, there is a risk that fees in the alternative investment management industry will decline, without regard to the historical performance of a manager, including our managers. Fee reductions on our existing or future funds, without corresponding decreases in our cost structure, would adversely affect our revenues and distributable earnings.
Poor investment performance may decrease assets under management and reduce revenues from and the profitability of our asset management business.
Revenues from our asset management business are primarily derived from asset management fees. Asset management fees are generally comprised of management and incentive fees. Management fees are typically based on assets under management, and incentive fees are earned on a quarterly or annual basis only if the return on our managed accounts exceeds a certain threshold return, or “highwater mark,” for each investor. We will not earn incentive fee income during a particular period, even when a fund had positive returns in that period, if we do not generate cumulative performance that surpasses a highwater mark. If a fund experiences losses, we will not earn incentive fees with regard to investors in that fund until its returns exceed the relevant highwater mark.
In addition, investment performance is one of the most important factors in retaining existing investors and competing for new asset management business. Investment performance may be poor as a result of the current or future difficult market or economic conditions, including changes in interest rates or inflation, terrorism or political uncertainty, our investment style, the particular investments that we make, and other factors. Poor investment performance may result in a decline in our revenues and income by causing (i) the net asset value of the assets under our management to decrease, which would result in lower management fees to us, (ii) lower investment returns, resulting in a reduction of incentive fee income to us, and (iii) investor redemptions, which would result in lower fees to us because we would have fewer assets under management.
To the extent our future investment performance is perceived to be poor in either relative or absolute terms, the revenues and profitability of our asset management business will likely be reduced and our ability to grow existing funds and raise new funds in the future will likely be impaired.
The historical returns of our funds may not be indicative of the future results of our funds.
The historical returns of our funds should not be considered indicative of the future results that should be expected from such funds or from any future funds we may raise. Our rates of returns reflect unrealized gains, as of the applicable measurement date, which may never be realized due to changes in market and other conditions not in our control that may adversely affect the ultimate value realized from the investments in a fund. The returns of our funds may have also benefited from investment opportunities and general market conditions that may not repeat themselves, and there can be no assurance that our current or future funds will be able to avail themselves of profitable investment opportunities. Furthermore, the historical and potential future returns of the funds we manage also may not necessarily bear any relationship to potential returns on our common stock.
| 15 |
Our asset management clients may generally redeem their investments, which could reduce our asset management fee revenues.
Our asset management fund agreements generally permit investors to redeem their investments with us after an initial “lockup” period during which redemptions are restricted or penalized. However, any such restrictions may be waived by us. Thereafter, redemptions are permitted at specified intervals. If the return on the assets under our management does not meet investors’ expectations, investors may elect to redeem their investments and invest their assets elsewhere, including with our competitors. Our management fee revenues correlate directly to the amount of assets under our management; therefore, redemptions may cause our fee revenues to decrease. Investors may decide to reallocate their capital away from us and to other asset managers for a number of reasons, including poor relative investment performance, changes in prevailing interest rates which make other investments more attractive, changes in investor perception regarding our focus or alignment of interest, dissatisfaction with changes in or a broadening of a fund’s investment strategy, changes in our reputation, and departures or changes in responsibilities of key investment professionals. For these and other reasons, the pace of redemptions and corresponding reduction in our assets under management could accelerate. In the future, redemptions could require us to liquidate assets under unfavorable circumstances, which would further harm our reputation and results of operations.
We are subject to risks in using custodians.
Our asset management subsidiary and its managed funds depend on the services of custodians to settle and report securities transactions. In the event of the insolvency of a custodian, our funds might not be able to recover equivalent assets in whole or in part as they will rank among the custodian’s unsecured creditors in relation to assets which the custodian borrows, lends or otherwise uses. In addition, cash held by our funds with the custodian will not be segregated from the custodian’s own cash, and the funds will therefore rank as unsecured creditors in relation thereto.
We may suffer losses if our reputation is harmed.
Our ability to attract and retain customers and employees may be diminished to the extent our reputation is damaged. If we fail, or are perceived to fail, to address various issues that may give rise to reputational risk, we could harm our business prospects. These issues include, but are not limited to, appropriately dealing with market dynamics, potential conflicts of interest, legal and regulatory requirements, ethical issues, customer privacy, record-keeping, sales and trading practices, and the proper identification of the legal, reputational, credit, liquidity and market risks inherent in our products and services. Failure to appropriately address these issues could give rise to loss of existing or future business, financial loss, and legal or regulatory liability, including complaints, claims and enforcement proceedings against us, which could, in turn, subject us to fines, judgments and other penalties. In addition, our capital markets operations depend to a large extent on our relationships with our clients and reputation for integrity and high-caliber professional services to attract and retain clients. As a result, if a client is not satisfied with our services, it may be more damaging in our business than in other businesses.
Our capital markets operations are highly dependent on communications, information and other systems and third parties, and any systems failures could significantly disrupt our capital markets business.
Our data and transaction processing, custody, financial, accounting and other technology and operating systems are essential to our capital markets operations. A system malfunction (due to hardware failure, capacity overload, security incident, data corruption, etc.) or mistake made relating to the processing of transactions could result in financial loss, liability to clients, regulatory intervention, reputational damage and constraints on our ability to grow. We outsource a substantial portion of our critical data processing activities, including trade processing and back office data processing. We also contract with third parties for market data and other services. In the event that any of these service providers fails to adequately perform such services or the relationship between that service provider and us is terminated, we may experience a significant disruption in our operations, including our ability to timely and accurately process transactions or maintain complete and accurate records of those transactions.
Adapting or developing our technology systems to meet new regulatory requirements, client needs, expansion and industry demands also is critical for our business. Introduction of new technologies present new challenges on a regular basis. We have an ongoing need to upgrade and improve our various technology systems, including our data and transaction processing, financial, accounting, risk management and trading systems. This need could present operational issues or require significant capital spending. It also may require us to make additional investments in technology systems and may require us to reevaluate the current value and/or expected useful lives of our technology systems, which could negatively impact our results of operations.
Secure processing, storage and transmission of confidential and other information in our internal and outsourced computer systems and networks also is critically important to our business. We take protective measures and endeavor to modify them as circumstances warrant. However, our computer systems, software and networks may be vulnerable to unauthorized access, computer viruses or other malicious code, inadvertent, erroneous or intercepted transmission of information (including by e-mail), and other events that could have an information security impact. If one or more of such events occur, this potentially could jeopardize our or our clients' or counterparties' confidential and other information processed and stored in, and transmitted through, our computer systems and networks, or otherwise cause interruptions or malfunctions in our, our clients', our counterparties' or third parties' operations. We may be required to expend significant additional resources to modify our protective measures or to investigate and remediate vulnerabilities or other exposures, and we may be subject to litigation and financial losses that are either not insured against or not fully covered through any insurance maintained by us.
| 16 |
A disruption in the infrastructure that supports our business due to fire, natural disaster, health emergency (for example, a disease pandemic), power or communication failure, act of terrorism or war may affect our ability to service and interact with our clients. If we are not able to implement contingency plans effectively, any such disruption could harm our results of operations.
The growth of electronic trading and the introduction of new technology in the markets in which our market-making business operates may adversely affect this business and may increase competition.
The continued growth of electronic trading and the introduction of new technologies is changing our market-making business and presenting new challenges. Securities, futures and options transactions are increasingly occurring electronically, through alternative trading systems. It appears that the trend toward alternative trading systems will continue to accelerate. This acceleration could further increase program trading, increase the speed of transactions and decrease our ability to participate in transactions as principal, which would reduce the profitability of our market-making business. Some of these alternative trading systems compete with our market-making business and with our algorithmic trading platform, and we may experience continued competitive pressures in these and other areas. Significant resources have been invested in the development of our electronic trading systems, which includes our ATM business, but there is no assurance that the revenues generated by these systems will yield an adequate return on the investment, particularly given the increased program trading and increased percentage of stocks trading off of the historically manual trading markets.
Pricing and other competitive pressures may impair the revenues of our sales and trading business.
We derive a significant portion of our revenues for our investment banking operations from our sales and trading business. There has been intense price competition and trading volume reduction in this business in recent years. In particular, the ability to execute trades electronically and through alternative trading systems has increased the downward pressure on per share trading commissions and spreads. We expect these trends toward alternative trading systems and downward pricing pressure in the business to continue. We believe we may experience competitive pressures in these and other areas in the future as some of our competitors seek to obtain market share by competing on the basis of price or by using their own capital to facilitate client trading activities. In addition, we face pressure from our larger competitors, which may be better able to offer a broader range of complementary products and services to clients in order to win their trading business. These larger competitors may also be better able to respond to changes in the research, brokerage and investment banking industries, to compete for skilled professionals, to finance acquisitions, to fund internal growth and to compete for market share generally. As we are committed to maintaining and improving our comprehensive research coverage in our target sectors to support our sales and trading business, we may be required to make substantial investments in our research capabilities to remain competitive. If we are unable to compete effectively in these areas, the revenues of our sales and trading business may decline, and our business, results of operations and financial condition may be harmed.
Some of our large institutional sales and trading clients in terms of brokerage revenues have entered into arrangements with us and other investment banking firms under which they separate payments for research products or services from trading commissions for sales and trading services, and pay for research directly in cash, instead of compensating the research providers through trading commissions (referred to as “soft dollar” practices). In addition, we have entered into certain commission sharing arrangements in which institutional clients execute trades with a limited number of brokers and instruct those brokers to allocate a portion of the commission directly to us or other broker-dealers for research or to an independent research provider. If more of such arrangements are reached between our clients and us, or if similar practices are adopted by more firms in the investment banking industry, it may further increase the competitive pressures on trading commissions and spreads and reduce the value our clients place on high quality research. Conversely, if we are unable to make similar arrangements with other investment managers that insist on separating trading commissions from research products, volumes and trading commissions in our sales and trading business also would likely decrease.
Larger and more frequent capital commitments in our trading and underwriting businesses increase the potential for significant losses.
Certain financial services firms make larger and more frequent commitments of capital in many of their activities. For example, in order to win business, some investment banks increasingly commit to purchase large blocks of stock from publicly traded issuers or significant stockholders, instead of the more traditional marketed underwriting process in which marketing is typically completed before an investment bank commits to purchase securities for resale. We may participate in this activity and, as a result, we may be subject to increased risk. Conversely, if we do not have sufficient regulatory capital to so participate, our business may suffer. Furthermore, we may suffer losses as a result of the positions taken in these transactions even when economic and market conditions are generally favorable for others in the industry.
| 17 |
We may increasingly commit our own capital as part of our trading business to facilitate client sales and trading activities. The number and size of these transactions may adversely affect our results of operations in a given period. We may also incur significant losses from our sales and trading activities due to market fluctuations and volatility in our results of operations. To the extent that we own assets, i.e., have long positions, in any of those markets, a downturn in the value of those assets or in those markets could result in losses. Conversely, to the extent that we have sold assets we do not own, i.e., have short positions, in any of those markets, an upturn in those markets could expose us to potentially large losses as we attempt to cover our short positions by acquiring assets in a rising market.
We have made and may make principal investments in relatively high-risk, illiquid assets that often have significantly leveraged capital structures, and we may fail to realize any profits from these activities for a considerable period of time or lose some or all of the principal amount we invest in these activities.
We may purchase equity securities and, to a lesser extent, debt securities, in venture capital, seed and other high risk financings of early-stage, pre-public or “mezzanine stage”, distressed situations and turnaround companies, as well as funds or other collective investment vehicles. We risk the loss of capital we have invested in these activities.
We may use our capital, including on a leveraged basis in proprietary investments in both private company and public company securities that may be illiquid and volatile. The equity securities of a privately-held entity in which we make a proprietary investment are likely to be restricted as to resale and may otherwise be highly illiquid. In the case of fund or similar investments, our investments may be illiquid until such investment vehicles are liquidated. We expect that there will be restrictions on our ability to resell the securities of any such company that we acquire for a period of at least six months after we acquire those securities. Thereafter, a public market sale may be subject to volume limitations or dependent upon securing a registration statement for an initial and potentially secondary public offering of the securities. We may make principal investments that are significant relative to the overall capitalization of the investee company and resales of significant amounts of these securities might be subject to significant limitations and adversely affect the market and the sales price for the securities in which we invest. In addition, our principal investments may involve entities or businesses with capital structures that have significant leverage. The large amount of borrowing in the leveraged capital structure increases the risk of losses due to factors such as rising interest rates, downturns in the economy or deteriorations in the condition of the investment or its industry. In the event of defaults under borrowings, the assets being financed would be at risk of foreclosure, and we could lose our entire investment.
Even if we make an appropriate investment decision based on the intrinsic value of an enterprise, we cannot assure you that general market conditions will not cause the market value of our investments to decline. For example, an increase in interest rates, a general decline in the stock markets, or other market and industry conditions adverse to companies of the type in which we invest and intend to invest could result in a decline in the value of our investments or a total loss of our investment.
In addition, some of these investments are, or may in the future be, in industries or sectors which are unstable, in distress or undergoing some uncertainty. Further, the companies in which we invest may rely on new or developing technologies or novel business models, or concentrate on markets which are or may be disproportionately impacted by pressures in the financial services and/or mortgage and real estate sectors, have not yet developed and which may never develop sufficiently to support successful operations, or their existing business operations may deteriorate or may not expand or perform as projected. Such investments may be subject to rapid changes in value caused by sudden company-specific or industry-wide developments. Contributing capital to these investments is risky, and we may lose some or all of the principal amount of our investments. There are no regularly quoted market prices for a number of the investments that we make. The value of our investments is determined using fair value methodologies described in valuation policies, which may consider, among other things, the nature of the investment, the expected cash flows from the investment, bid or ask prices provided by third parties for the investment and the trading price of recent sales of securities (in the case of publicly-traded securities), restrictions on transfer and other recognized valuation methodologies. The methodologies we use in valuing individual investments are based on estimates and assumptions specific to the particular investments. Therefore, the value of our investments does not necessarily reflect the prices that would actually be obtained by us when such investments are sold. Realizations at values significantly lower than the values at which investments have been reflected in values would result in loses of potential incentive income and principal investments.
We may experience write downs of our investments and other losses related to the valuation of our investments and volatile and illiquid market conditions.
In our proprietary investment activities, our concentrated holdings, illiquidity and market volatility may make it difficult to value certain of our investment securities. Subsequent valuations, in light of factors then prevailing, may result in significant changes in the values of these securities in future periods. In addition, at the time of any sales and settlements of these securities, the price we ultimately realize will depend on the demand and liquidity in the market at that time and may be materially lower than their current fair value. Any of these factors could require us to take write downs in the value of our investment and securities portfolio, which may have an adverse effect on our results of operations in future periods.
| 18 |
Our underwriting and market-making activities may place our capital at risk.
We may incur losses and be subject to reputational harm to the extent that, for any reason, we are unable to sell securities we purchased as an underwriter at the anticipated price levels. As an underwriter, we also are subject to heightened standards regarding liability for material misstatements or omissions in prospectuses and other offering documents relating to offerings we underwrite. Further, even though underwriting agreements with issuing companies typically include a right to indemnification in favor of the underwriter for these offerings to cover potential liability from any material misstatements or omissions, indemnification may be unavailable or insufficient in certain circumstances, for example if the issuing company has become insolvent. As a market maker, we may own large positions in specific securities, and these undiversified holdings concentrate the risk of market fluctuations and may result in greater losses than would be the case if our holdings were more diversified.
Our businesses, profitability and liquidity may be adversely affected by deterioration in the credit quality of, or defaults by, third parties who owe us money, securities or other assets or whose securities or obligations we hold.
The amount and duration of our credit exposures have been increasing over the past year, as have the breadth and size of the entities to which we have credit exposures. We are exposed to the risk that third parties that owe us money, securities or other assets will not perform their obligations. These parties may default on their obligations to us due to bankruptcy, lack of liquidity, operational failure or other reasons. Declines in the market value of securities can result in the failure of buyers and sellers of securities to fulfill their settlement obligations, and in the failure of our clients to fulfill their credit obligations. During market downturns, counterparties to us in securities transactions may be less likely to complete transactions. In addition, particularly during market downturns, we may face additional expenses defending or pursuing claims or litigation related to counterparty or client defaults.
Our businesses may be adversely affected by the disruptions in the credit markets, including reduced access to credit and liquidity and higher costs of obtaining credit.
In the event existing internal and external financial resources do not satisfy our needs, we would have to seek additional outside financing. The availability of outside financing will depend on a variety of factors, such as our financial condition and results of operations, the availability of acceptable collateral, market conditions, the general availability of credit, the volume of trading activities, and the overall availability of credit to the financial services industry.
Widening credit spreads, as well as significant declines in the availability of credit, could adversely affect our ability to borrow on an unsecured basis. Disruptions in the credit markets could make it more difficult and more expensive to obtain funding for our businesses. If our available funding is limited or we are forced to fund our operations at a higher cost, these conditions may require us to curtail our business activities and increase our cost of funding, both of which could reduce our profitability, particularly in our businesses that involve investing and taking principal positions.
Liquidity, or ready access to funds, is essential to financial services firms, including ours. Failures of financial institutions have often been attributable in large part to insufficient liquidity. Liquidity is of particular importance to our sales and trading business, and perceived liquidity issues may affect the willingness of our clients and counterparties to engage in sales and trading transactions with us. Our liquidity could be impaired due to circumstances that we may be unable to control, such as a general market disruption or an operational problem that affects our sales and trading clients, third parties or us. Further, our ability to sell assets may be impaired if other market participants are seeking to sell similar assets at the same time.
Our clients engaging us with respect to mergers and acquisitions often rely on access to the secured and unsecured credit markets to finance their transactions. The lack of available credit and the increased cost of credit could adversely affect the size, volume and timing of our clients’ merger and acquisition transactions—particularly large transactions—and adversely affect our investment banking business and revenues.
We have experienced losses and may not achieve or maintain profitability.
Our profitability in each reporting period is impacted by the number and size of retail liquidation and capital markets engagements we perform on a quarterly or annual basis. It is possible that we will continue to experience losses with respect to our current operations as we continue to expand our operations. In addition, we expect that our operating expenses will increase to the extent that we grow our business. We may not be able to generate sufficient revenues to achieve or maintain profitability.
Because of their significant stock ownership, some of our existing stockholders will be able to exert control over us and our significant corporate decisions.
Our executive officers, directors and their affiliates own or control, in the aggregate, approximately 30.9% of our outstanding common stock as of December 31, 2015. In particular, our Chairman and Chief Executive Officer, Bryant R. Riley, owns or controls, in the aggregate, 3,957,609 shares of our common stock or 24.1% of our outstanding common stock as of December 31, 2015. These stockholders are able to exercise influence over matters requiring stockholder approval, such as the election of directors and the approval of significant corporate transactions, including transactions involving an actual or potential change of control of the company or other transactions that non-controlling stockholders may not deem to be in their best interests. This concentration of ownership may harm the market price of our common stock by, among other things:
| 19 |
| • | delaying, deferring, or preventing a change in control of our company; |
| • | impeding a merger, consolidation, takeover, or other business combination involving our company; |
| • | causing us to enter into transactions or agreements that are not in the best interests of all stockholders; or |
| • | discouraging a potential acquirer from making a tender offer or otherwise attempting to obtain control of our company. |
We may incur losses as a result of “guarantee” based engagements that we enter into in connection with our auction and liquidation solutions business.
In many instances, in order to secure an engagement, we are required to bid for that engagement by guaranteeing to the client a minimum amount that such client will receive from the sale of inventory or assets. Our bid is based on a variety of factors, including: our experience, expertise, perceived value added by engagement, valuation of the inventory or assets and the prices we believe potential buyers would be willing to pay for such inventory or assets. An inaccurate estimate of any of the above or inaccurate valuation of the assets or inventory could result in us submitting a bid that exceeds the realizable proceeds from any engagement. If the liquidation proceeds, net of direct operating expenses, are less than the amount we guaranteed in our bid, we will incur a loss. Therefore, in the event that the proceeds, net of direct operating expenses, from an engagement are less than the bid, the value of the assets or inventory decline in value prior to the disposition or liquidation, or the assets are overvalued for any reason, we may suffer a loss and our financial condition and results of operations could be adversely affected.
Losses due to any auction or liquidation engagement may cause us to become unable to make payments due to our creditors and may cause us to default on our debt obligations.
We have three engagement structures for our auction and liquidation services: (i) a “fee” based structure under which we are compensated for our role in an engagement on a commission basis, (ii) purchase on an outright basis (and take title to) the assets or inventory of the client, and (iii) “guarantee” to the client that a certain amount will be realized by the client upon the sale of the assets or inventory based on contractually defined terms in the auction or liquidation contract. We bear the risk of loss under the purchase and guarantee structures of auction and liquidation contracts. If the amount realized from the sale or disposition of assets, net of direct operating expenses, does not equal or exceed the purchase price (in purchase transaction), we will recognize a loss on the engagement, or should the amount realized, net of direct operating expenses, not equal or exceed the “guarantee,” we are still required to pay the guaranteed amount to the client.
We could incur losses in connection with outright purchase transactions in which we engage as part of our auction and liquidation solutions business.
When we conduct an asset disposition or liquidation on an outright purchase basis, we purchase from the client the assets or inventory to be sold or liquidated and therefore, we hold title to any assets or inventory that we are not able to sell. In other situations, we may acquire assets from our clients if we believe that we can identify a potential buyer and sell the assets at a premium to the price paid. We store these unsold or acquired assets and inventory until they can be sold or, alternatively, transported to the site of a liquidation of comparable assets or inventory that we are conducting. If we are forced to sell these assets for less than we paid, or are required to transport and store assets multiple times, the related expenses could have a material adverse effect on our results of operations.
We depend on financial institutions as primary clients for our valuation and appraisal business. Consequently, the loss of any financial institutions as clients may have an adverse impact on our business.
A majority of the revenue from our valuation and appraisal business is derived from engagements by financial institutions. As a result, any loss of financial institutions as clients of our valuation and advisory services, whether due to changing preferences in service providers, failures of financial institutions or mergers and consolidations within the finance industry, could significantly reduce the number of existing, repeat and potential clients, thereby adversely affecting our revenues. In addition, any larger financial institutions that result from mergers or consolidations in the financial services industry could have greater leverage in negotiating terms of engagements with us, or could decide to internally perform some or all of the valuation and appraisal services which we currently provide to one of the constituent institutions involved in the merger or consolidation or which we could provide in the future. Any of these developments could have a material adverse effect on our valuation and appraisal business.
| 20 |
We may face liability or harm to our reputation as a result of a claim that we provided an inaccurate appraisal or valuation and our insurance coverage may not be sufficient to cover the liability.
We could face liability in connection with a claim by a client that we provided an inaccurate appraisal or valuation on which the client relied. Any claim of this type, whether with or without merit, could result in costly litigation, which could divert management’s attention and company resources and harm our reputation. Furthermore, if we are found to be liable, we may be required to pay damages. While our appraisals and valuations are typically provided only for the benefit of our clients, if a third party relies on an appraisal or valuation and suffers harm as a result, we may become subject to a legal claim, even if the claim is without merit. We carry insurance for liability resulting from errors or omissions in connection with our appraisals and valuations; however, the coverage may not be sufficient if we are found to be liable in connection with a claim by a client or third party.
We could be forced to mark down the value of certain assets acquired in connection with outright purchase transactions.
In most instances, inventory is reported on the balance sheet at its historical cost; however, according to U.S. Generally Accepted Accounting Principles, inventory whose historical cost exceeds its market value should be valued conservatively, which dictates a lower value should apply. Accordingly, should the replacement cost (due to technological obsolescence or otherwise), or the net realizable value of any inventory we hold be less than the cost paid to acquire such inventory (purchase price), we will be required to “mark down” the value of such inventory held. If the value of any inventory held on our balance sheet is required to be written down, such write down could have a material adverse effect on our financial position and results of operations.
We operate in highly competitive industries. Some of our competitors may have certain competitive advantages, which may cause us to be unable to effectively compete with or gain market share from our competitors.
We face competition with respect to all of our service areas. The level of competition depends on the particular service area and category of assets being liquidated or appraised. We compete with other companies and investment banks to help clients with their corporate finance and capital needs. In addition, we compete with companies and online services in the bidding for assets and inventory to be liquidated. The demand for online solutions continues to grow and our online competitors include other e-commerce providers, auction websites such as eBay, as well as government agencies and traditional liquidators and auctioneers that have created websites to further enhance their product offerings and more efficiently liquidate assets. We expect the market to become even more competitive as the demand for such services continues to increase and traditional and online liquidators and auctioneers continue to develop online and offline services for disposition, redeployment and remarketing of wholesale surplus and salvage assets. In addition, manufacturers, retailers and government agencies may decide to create their own websites to sell their own surplus assets and inventory and those of third parties.
We also compete with other providers of valuation and advisory services. Competitive pressures within the valuation and appraisal services market, including a decrease in the number of engagements and/or a decrease in the fees which can be charged for these services, could affect revenues from our valuation and appraisal services as well as our ability to engage new or repeat clients. We believe that given the relatively low barriers to entry in the valuation and appraisal services market, this market may become more competitive as the demand for such services increases.
Some of our competitors may be able to devote greater financial resources to marketing and promotional campaigns, secure merchandise from sellers on more favorable terms, adopt more aggressive pricing or inventory availability policies and devote more resources to website and systems development than we are able to do. Any inability on our part to effectively compete could have a material adverse effect on our financial condition, growth potential and results of operations.
We compete with specialized investment banks to provide financial and investment banking services to small and middle-market companies. Middle-market investment banks provide access to capital and strategic advice to small and middle-market companies in our target industries. We compete with those investment banks on the basis of a number of factors, including client relationships, reputation, the abilities of our professionals, transaction execution, innovation, price, market focus and the relative quality of our products and services. We have experienced intense competition over obtaining advisory mandates in recent years, and we may experience pricing pressures in our investment banking business in the future as some of our competitors seek to obtain increased market share by reducing fees. Competition in the middle-market may further intensify if larger Wall Street investment banks expand their focus to this sector of the market. Increased competition could reduce our market share from investment banking services and our ability to generate fees at historical levels.
We also face increased competition due to a trend toward consolidation. In recent years, there has been substantial consolidation and convergence among companies in the financial services industry. This trend was amplified in connection with the unprecedented disruption and volatility in the financial markets during the past several years, and, as a result, a number of financial services companies have merged, been acquired or have fundamentally changed their respective business models. Many of these firms may have the ability to support investment banking, including financial advisory services, with commercial banking, insurance and other financial services in an effort to gain market share, which could result in pricing pressure in our businesses.
| 21 |
If we are unable to attract and retain qualified personnel, we may not be able to compete successfully in our industry.
Our future success depends to a significant degree upon the continued contributions of senior management and the ability to attract and retain other highly qualified management personnel. We face competition for management from other companies and organizations; therefore, we may not be able to retain our existing personnel or fill new positions or vacancies created by expansion or turnover at existing compensation levels. Although we have entered into employment agreements with key members of the senior management team, there can be no assurances such key individuals will remain with us. The loss of any of our executive officers or other key management personnel would disrupt our operations and divert the time and attention of our remaining officers and management personnel which could have an adverse effect on our results of operations and potential for growth.
We also face competition for highly skilled employees with experience in our industry, which requires a unique knowledge base. We may be unable to recruit or retain other existing technical, sales and client support personnel that are critical to our ability to execute our business plan.
We frequently use borrowings under credit facilities in connection with our guaranty engagements, in which we guarantee a minimum recovery to the client, and outright purchase transactions.
In engagements where we operate on a guaranty or purchase basis, we are typically required to make an upfront payment to the client. If the upfront payment is less than 100% of the guarantee or the purchase price in a “purchase” transaction, we may be required to make successive cash payments until the guarantee is met or we may issue a letter of credit in favor of the client. Depending on the size and structure of the engagement, we may borrow under our credit facilities and may be required to issue a letter of credit in favor of the client for these additional amounts. If we lose any availability under our credit facilities, are unable to borrow under credit facilities and/or issue letters of credit in favor of clients, or borrow under credit facilities and/or issue letters of credit on commercially reasonable terms, we may be unable to pursue large liquidation and disposition engagements, engage in multiple concurrent engagements, pursue new engagements or expand our operations. We are required to obtain approval from the lenders under our existing credit facilities prior to making any borrowings thereunder in connection with a particular engagement. Any inability to borrow under our credit facilities, or enter into one or more other credit facilities on commercially reasonable terms may have a material adverse effect on our financial condition, results of operations and growth.
Defaults under our credit agreements could have an adverse impact on our ability to finance potential engagements.
The terms of our credit agreements contain a number of events of default. Should we default under any of our credit agreements in the future, lenders may take any or all remedial actions set forth in such credit agreement, including, but not limited to, accelerating payment and/or charging us a default rate of interest on all outstanding amounts, refusing to make any further advances or issue letters of credit, or terminating the line of credit. As a result of our reliance on lines of credit and letters of credit, any default under a credit agreement, or remedial actions pursued by lenders following any default under a credit agreement, may require us to immediately repay all outstanding amounts, which may preclude us from pursuing new liquidation and disposition engagements and may increase our cost of capital, each of which may have a material adverse effect on our financial condition and results of operations.
If we cannot meet our future capital requirements, we may be unable to develop and enhance our services, take advantage of business opportunities and respond to competitive pressures.
We may need to raise additional funds in the future to grow our business internally, invest in new businesses, expand through acquisitions, enhance our current services or respond to changes in our target markets. If we raise additional capital through the sale of equity or equity derivative securities, the issuance of these securities could result in dilution to our existing stockholders. If additional funds are raised through the issuance of debt securities, the terms of that debt could impose additional restrictions on our operations or harm our financial condition. Additional financing may be unavailable on acceptable terms.
We are subject to net capital and other regulatory capital requirements; failure to comply with these rules would significantly harm our business.
BRC, our broker-dealer subsidiary, is subject to the net capital requirements of the SEC, FINRA, and various self-regulatory organizations of which it is a member. These requirements typically specify the minimum level of net capital a broker-dealer must maintain and also mandate that a significant part of its assets be kept in relatively liquid form. Failure to maintain the required net capital may subject a firm to limitation of its activities, including suspension or revocation of its registration by the SEC and suspension or expulsion by FINRA and other regulatory bodies, and ultimately may require its liquidation. Failure to comply with the net capital rules could have material and adverse consequences, such as:
| 22 |
| • | limiting our operations that require intensive use of capital, such as underwriting or trading activities; or |
| • | restricting us from withdrawing capital from our subsidiaries, when our broker-dealer subsidiary has more than the minimum amount of required capital. This, in turn, could limit our ability to implement our business and growth strategies, pay interest on and repay the principal of our debt and/or repurchase our shares. |
In addition, a change in the net capital rules or the imposition of new rules affecting the scope, coverage, calculation, or amount of net capital requirements, or a significant operating loss or any large charge against net capital, could have similar adverse effects.
Furthermore, BRC is subject to laws that authorize regulatory bodies to block or reduce the flow of funds from it to B. Riley Financial, Inc. As a holding company, B. Riley Financial, Inc. depends on dividends, distributions and other payments from its subsidiaries to fund dividend payments, if any, and to fund all payments on its obligations, including debt obligations. As a result, regulatory actions could impede access to funds that B. Riley Financial, Inc. needs to make payments on obligations, including debt obligations, or dividend payments. In addition, because B. Riley Financial, Inc. holds equity interests in the firm’s subsidiaries, its rights as an equity holder to the assets of these subsidiaries may not materialize, if at all, until the claims of the creditors of these subsidiaries are first satisfied.
We may incur losses as a result of ineffective risk management processes and strategies.
We seek to monitor and control our risk exposure through operational and compliance reporting systems, internal controls, management review processes and other mechanisms. Our investing and trading processes seek to balance our ability to profit from investment and trading positions with our exposure to potential losses. While we employ limits and other risk mitigation techniques, those techniques and the judgments that accompany their application cannot anticipate economic and financial outcomes or the specifics and timing of such outcomes. Thus, we may, in the course of our investment and trading activities, incur losses, which may be significant.
In addition, we are investing our own capital in our funds and funds of funds as well as principal investing activities, and limitations on our ability to withdraw some or all of our investments in these funds or liquidate our investment positions, whether for legal, reputational, illiquidity or other reasons, may make it more difficult for us to control the risk exposures relating to these investments.
Our risk management policies and procedures may leave us exposed to unidentified or unanticipated risks.
Our risk management strategies and techniques may not be fully effective in mitigating our risk exposure in all market environments or against all types of risk. We seek to manage, monitor and control our operational, legal and regulatory risk through operational and compliance reporting systems, internal controls, management review processes and other mechanisms; however, there can be no assurance that our procedures will be fully effective. Further, our risk management methods may not effectively predict future risk exposures, which could be significantly greater than the historical measures indicate. In addition, some of our risk management methods are based on an evaluation of information regarding markets, clients and other matters that are based on assumptions that may no longer be accurate. A failure to adequately manage our growth, or to effectively manage our risk, could materially and adversely affect our business and financial condition.
We are exposed to the risk that third parties that owe us money, securities or other assets will not perform their obligations. These parties may default on their obligations to us due to bankruptcy, lack of liquidity, operational failure, and breach of contract or other reasons. We are also subject to the risk that our rights against third parties may not be enforceable in all circumstances. As an introducing broker, we could be held responsible for the defaults or misconduct of our customers. These may present credit concerns, and default risks may arise from events or circumstances that are difficult to detect, foresee or reasonably guard against. In addition, concerns about, or a default by, one institution could lead to significant liquidity problems, losses or defaults by other institutions, which in turn could adversely affect us. If any of the variety of instruments, processes and strategies we utilize to manage our exposure to various types of risk are not effective, we may incur losses.
Our common stock price may fluctuate substantially, and your investment could suffer a decline in value.
The market price of our common stock may be volatile and could fluctuate substantially due to many factors, including, among other things:
| • | actual or anticipated fluctuations in our results of operations; |
| • | announcements of significant contracts and transactions by us or our competitors; |
| • | sale of common stock or other securities in the future; |
| 23 |
| • | the trading volume of our common stock; |
| • | changes in our pricing policies or the pricing policies of our competitors; and |
| • | general economic conditions. |
In addition, the stock market in general has experienced extreme price and volume fluctuations that have often been unrelated or disproportionate to the operating performance of those companies. These broad market factors may materially harm the market price of our common stock, regardless of our operating performance.
There is a limited market for our common shares and the trading price of our common shares is subject to volatility.
Our common shares began trading on the over-the-counter bulletin board in August 2009, and we only recently obtained approval to list and trade our shares on The NASDAQ Stock Market LLC’s NASDAQ Capital Market on July 16, 2015. Trading of our common stock has in the past been highly volatile with low trading volume and an active trading market for shares of our common stock may not develop. In such case, selling shares of our common stock may be difficult because the limited trading market for our shares could result in lower prices and larger spreads in the bid and ask prices of our shares, as well as lower trading volume. Further, the market price of shares of our common stock could continue to fluctuate substantially. Additionally, if we are not able to maintain our recently obtained listing on the NASDAQ Capital Market, then our common stock will again be quoted for trading on an over-the-counter quotation system and may be subject to more significant fluctuations in stock price and trading volume.
Our amended and restated certificate of incorporation authorizes our board of directors to issue new series of preferred stock that may have the effect of delaying or preventing a change of control, which could adversely affect the value of your shares.
Our amended and restated certificate of incorporation provides that our board of directors will be authorized to issue from time to time, without further stockholder approval, up to 1,000,000 shares of preferred stock in one or more series and to fix or alter the designations, preferences, rights and any qualifications, limitations or restrictions of the shares of each series, including the dividend rights, dividend rates, conversion rights, voting rights, rights of redemption, including sinking fund provisions, redemption price or prices, liquidation preferences and the number of shares constituting any series or designations of any series. Such shares of preferred stock could have preferences over our common stock with respect to dividends and liquidation rights. We may issue additional preferred stock in ways which may delay, defer or prevent a change of control of our company without further action by our stockholders. Such shares of preferred stock may be issued with voting rights that may adversely affect the voting power of the holders of our common stock by increasing the number of outstanding shares having voting rights, and by the creation of class or series voting rights.
Anti-takeover provisions under our charter documents and Delaware law could delay or prevent a change of control and could also limit the market price of our stock.
Our amended and restated certificate of incorporation and our bylaws, as amended, contain provisions that could delay or prevent a change of control of our company or changes in our board of directors that our stockholders might consider favorable. For example, while such structure is currently in the process of being phased out by 2017 following amendments we adopted in October 2014, our certificate of incorporation and bylaws historically provided that our board of directors is classified into three classes of directors, with each class elected at a separate election. Until such phase-out is complete, the existence of a staggered board could delay or prevent a potential acquirer from obtaining majority control of our board, and thus defer potential acquisitions. We are also governed by the provisions of Section 203 of the Delaware General Corporate Law, which may prohibit certain business combinations with stockholders owning 15% or more of our outstanding voting stock. These and other provisions in our amended and restated certificate of incorporation, our bylaws, as amended, and Delaware law could make it more difficult for stockholders or potential acquirers to obtain control of our board of directors or initiate actions that are opposed by the then-current board of directors, including delaying or impeding a merger, tender offer, or proxy contest or other change of control transaction involving our company. Any delay or prevention of a change of control transaction or changes in our board of directors could prevent the consummation of a transaction in which our stockholders could receive a substantial premium over the then current market price for their shares.
Our ability to use net loss carryovers to reduce our taxable income may be limited.
As a result of the common stock offering that was completed on June 5, 2014, the Company had a more than 50% ownership shift in accordance with Internal Revenue Code Section 382. Accordingly, the Company may be limited to the amount of net operating loss that may be utilized in future taxable years depending on the Company’s actual taxable income. As of December 31, 2014, the Company believes that the net operating loss that existed as of the more than 50% ownership shift will be utilized in future tax periods before the loss carryforwards expire and it is more-likely-than-not that future taxable earnings will be sufficient to realize its deferred tax assets and has not provided an allowance. However, to the extent that the Company is unable to utilize such net operating loss, it may have a material adverse effect on our financial condition and results of operations.
| 24 |
Financial services firms have been subject to increased scrutiny over the last several years, increasing the risk of financial liability and reputational harm resulting from adverse regulatory actions.
Firms in the financial services industry have been operating in a difficult regulatory environment which we expect will become even more stringent in light of recent well-publicized failures of regulators to detect and prevent fraud. The industry has experienced increased scrutiny from a variety of regulators, including the SEC, the NYSE, FINRA and state attorneys general. Penalties and fines sought by regulatory authorities have increased substantially over the last several years. This regulatory and enforcement environment has created uncertainty with respect to a number of transactions that had historically been entered into by financial services firms and that were generally believed to be permissible and appropriate. We may be adversely affected by changes in the interpretation or enforcement of existing laws and rules by these governmental authorities and self-regulatory organizations. Each of the regulatory bodies with jurisdiction over us has regulatory powers dealing with many aspects of financial services, including, but not limited to, the authority to fine us and to grant, cancel, restrict or otherwise impose conditions on the right to carry on particular businesses. For example, a failure to comply with the obligations imposed by the Exchange Act on broker-dealers and the Investment Advisers Act of 1940 on investment advisers, including record-keeping, advertising and operating requirements, disclosure obligations and prohibitions on fraudulent activities, or by the Investment Company Act of 1940, could result in investigations, sanctions and reputational damage. We also may be adversely affected as a result of new or revised legislation or regulations imposed by the SEC, other U.S. or foreign governmental regulatory authorities or FINRA or other self-regulatory organizations that supervise the financial markets. Substantial legal liability or significant regulatory action against us could have adverse financial effects on us or cause reputational harm to us, which could harm our business prospects.
In addition, financial services firms are subject to numerous conflicts of interests or perceived conflicts. The SEC and other federal and state regulators have increased their scrutiny of potential conflicts of interest. We have adopted various policies, controls and procedures to address or limit actual or perceived conflicts and regularly review and update our policies, controls and procedures. However, appropriately addressing conflicts of interest is complex and difficult and our reputation could be damaged if we fail, or appear to fail, to appropriately address conflicts of interest. Our policies and procedures to address or limit actual or perceived conflicts may also result in increased costs and additional operational personnel. Failure to adhere to these policies and procedures may result in regulatory sanctions or litigation against us. For example, the research operations of investment banks have been and remain the subject of heightened regulatory scrutiny which has led to increased restrictions on the interaction between equity research analysts and investment banking professionals at securities firms. Several securities firms in the U.S. reached a global settlement in 2003 and 2004 with certain federal and state securities regulators and self-regulatory organizations to resolve investigations into the alleged conflicts of interest of research analysts, which resulted in rules that have imposed additional costs and limitations on the conduct of our business.
Asset management businesses have experienced a number of highly publicized regulatory inquiries which have resulted in increased scrutiny within the industry and new rules and regulations for mutual funds, investment advisors and broker-dealers. We are registered as an investment advisor with the SEC and the regulatory scrutiny and rulemaking initiatives may result in an increase in operational and compliance costs or the assessment of significant fines or penalties against our asset management business, and may otherwise limit our ability to engage in certain activities. In addition, the SEC staff has conducted studies with respect to soft dollar practices in the brokerage and asset management industries and proposed interpretive guidance regarding the scope of permitted brokerage and research services in connection with soft dollar practices. The SEC staff has indicated that it is considering additional rulemaking in this and other areas, and we cannot predict the effect that additional rulemaking may have on our asset management or brokerage business or whether it will be adverse to us. In addition, Congress is currently considering imposing new requirements on entities that securitize assets, which could affect our credit activities. It is impossible to determine the extent of the impact of any new laws, regulations or initiatives that may be proposed, or whether any of the proposals will become law. Compliance with any new laws or regulations could make compliance more difficult and expensive and affect the manner in which we conduct business.
Recently enacted financial reforms and related regulations may negatively affect our business activities, financial position and profitability.
The Dodd-Frank Wall Street Reform and Consumer Protection Act (the “Dodd-Frank Act”) institutes a wide range of reforms that will impact financial services firms and requires significant rule-making. In addition, the legislation mandates multiple studies, which could result in additional legislative or regulatory action. For example, in January 2011 the SEC released its mandated study on the effectiveness of current legal and regulatory standards for broker-dealers and investment advisers, which may result in the imposition of fiduciary duties on broker-dealers. The legislation and regulation of financial institutions, both domestically and internationally, include calls to increase capital and liquidity requirements; limit the size and types of the activities permitted; and increase taxes on some institutions. FINRA’s oversight over broker-dealers and investment advisors may be expanded, and new regulations on having investment banking and securities analyst functions in the same firm may be created. Many of the provisions of the Dodd-Frank Act are subject to further rule making procedures and studies and will take effect over several years. As a result, we cannot assess the impact of these new legislative and regulatory changes on our business at the present time. However, these legislative and regulatory changes could affect our revenue, limit our ability to pursue business opportunities, impact the value of assets that we hold, require us to change certain of our business practices, impose additional costs on us, or otherwise adversely affect our businesses. If we do not comply with current or future legislation and regulations that apply to our operations, we may be subject to fines, penalties or material restrictions on our businesses in the jurisdiction where the violation occurred. Accordingly, such new legislation or regulation could have an adverse effect on our business, results of operations, cash flows or financial condition.
| 25 |
Our failure to deal appropriately with conflicts of interest could damage our reputation and adversely affect our business.
As we have expanded the number and scope of our businesses, we increasingly confront potential conflicts of interest relating to our and our funds’ and clients’ investment and other activities. Certain of our funds have overlapping investment objectives, including funds which have different fee structures, and potential conflicts may arise with respect to our decisions regarding how to allocate investment opportunities among ourselves and those funds. For example, a decision to acquire material non-public information about a company while pursuing an investment opportunity for a particular fund gives rise to a potential conflict of interest when it results in our having to restrict the ability of the Company or other funds to take any action.
In addition, there may be conflicts of interest regarding investment decisions for funds in which our officers, directors and employees, who have made and may continue to make significant personal investments in a variety of funds, are personally invested. Similarly, conflicts of interest may exist or develop regarding decisions about the allocation of specific investment opportunities between the Company and the funds.
We also have potential conflicts of interest with our investment banking and institutional clients including situations where our services to a particular client or our own proprietary or fund investments or interests conflict or are perceived to conflict with a client. It is possible that potential or perceived conflicts could give rise to investor or client dissatisfaction or litigation or regulatory enforcement actions. Appropriately dealing with conflicts of interest is complex and difficult and our reputation could be damaged if we fail, or appear to fail, to deal appropriately with one or more potential or actual conflicts of interest. Regulatory scrutiny of, or litigation in connection with, conflicts of interest would have a material adverse effect on our reputation, which would materially adversely affect our business in a number of ways, including as a result of redemptions by our investors from our hedge funds, an inability to raise additional funds and a reluctance of counterparties to do business with us.
Our exposure to legal liability is significant, and could lead to substantial damages.
We face significant legal risks in our businesses. These risks include potential liability under securities laws and regulations in connection with our capital markets, asset management and other businesses. The volume and amount of damages claimed in litigation, arbitrations, regulatory enforcement actions and other adversarial proceedings against financial services firms have increased in recent years. We also are subject to claims from disputes with our employees and our former employees under various circumstances. Risks associated with legal liability often are difficult to assess or quantify and their existence and magnitude can remain unknown for significant periods of time, making the amount of legal reserves related to these legal liabilities difficult to determine and subject to future revision. Legal or regulatory matters involving our directors, officers or employees in their individual capacities also may create exposure for us because we may be obligated or may choose to indemnify the affected individuals against liabilities and expenses they incur in connection with such matters to the extent permitted under applicable law. In addition, like other financial services companies, we may face the possibility of employee fraud or misconduct. The precautions we take to prevent and detect this activity may not be effective in all cases and there can be no assurance that we will be able to deter or prevent fraud or misconduct. Exposures from and expenses incurred related to any of the foregoing actions or proceedings could have a negative impact on our results of operations and financial condition. In addition, future results of operations could be adversely affected if reserves relating to these legal liabilities are required to be increased or legal proceedings are resolved in excess of established reserves.
Misconduct by our employees or by the employees of our business partners could harm us and is difficult to detect and prevent.
There have been a number of highly publicized cases involving fraud or other misconduct by employees in the financial services industry in recent years, and we run the risk that employee misconduct could occur at our firm. For example, misconduct could involve the improper use or disclosure of confidential information, which could result in regulatory sanctions and serious reputational or financial harm. It is not always possible to deter misconduct and the precautions we take to detect and prevent this activity may not be effective in all cases. Our ability to detect and prevent misconduct by entities with which we do business may be even more limited. We may suffer reputational harm for any misconduct by our employees or those entities with which we do business.
| 26 |
We may not pay dividends regularly or at all in the future.
Prior to the declaration of a dividend by our Board of Directions on October 29, 2014 and other dividends during 2015, we historically have not paid dividends on shares of our capital stock. From time to time, we may decide to pay dividends which will be dependent upon our financial condition and results of operations. Our Board of Directors may reduce or discontinue dividends at any time for any reason it deems relevant and there can be no assurances that we will continue to generate sufficient cash to pay dividends, or that we will continue to pay dividends with the cash that we do generate. The determination regarding the payment of dividends is subject to the discretion of our Board of Directors, and there can be no assurances that we will continue to generate sufficient cash to pay dividends, or that we will pay dividends in future periods.
Security breaches and other disruptions could compromise our information and expose us to liability, which would cause our business and reputation to suffer.
In the ordinary course of our business, we collect and store sensitive data, including intellectual property, our proprietary business information and that of our customers, clients and business partners, and personally identifiable information of our employees, in our servers and on our networks. The secure processing, maintenance and transmission of this information is critical to our operations and business strategy. Despite our security measures, our information technology and infrastructure may be vulnerable to attacks by hackers or breached due to employee error, malfeasance or other disruptions. Any such breach could compromise our networks and the information stored there could be accessed, publicly disclosed, lost or stolen. Any such access, disclosure or other loss of information could result in legal claims or proceedings, liability under laws that protect the privacy of personal information, and regulatory penalties. In addition, such a breach could disrupt our operations and the services we provide to our clients, damage our reputation, and cause a loss of confidence in our services, which could adversely affect our business and our financial condition.
We may enter into new lines of business, make strategic investments or acquisitions or enter into joint ventures, each of which may result in additional risks and uncertainties for our business.
We may enter into new lines of business, make future strategic investments or acquisitions and enter into joint ventures. As we have in the past, and subject to market conditions, we may grow our business by increasing assets under management in existing investment strategies, pursue new investment strategies, which may be similar or complementary to our existing strategies or be wholly new initiatives, or enter into strategic relationships, or joint ventures. In addition, opportunities may arise to acquire or invest in other businesses that are related or unrelated to our current businesses.
To the extent we make strategic investments or acquisitions, enter into strategic relationships or joint ventures or enter into new lines of business, we will face numerous risks and uncertainties, including risks associated with the required investment of capital and other resources and with combining or integrating operational and management systems and controls and managing potential conflicts. Entry into certain lines of business may subject us to new laws and regulations with which we are not familiar, or from which we are currently exempt, and may lead to increased litigation and regulatory risk. If a new business generates insufficient revenues, or produces investment losses, or if we are unable to efficiently manage our expanded operations, our results of operations will be adversely affected, and our reputation and business may be harmed. In the case of joint ventures, we are subject to additional risks and uncertainties in that we may be dependent upon, and subject to liability, losses or reputational damage relating to, systems, controls and personnel that are not under our control.
We manage debt investments that involve significant risks and potential additional liabilities.
GACP I, L.P., a direct lending fund of which our wholly owned subsidiary GACP is the general partner, may invest in secured debt issued by companies that have or may incur additional debt that is senior to the secured debt owned by the fund. In the event of insolvency, liquidation, dissolution, reorganization or bankruptcy of any such company, the owners of senior secured debt (i.e., the owners of first priority liens) generally will be entitled to receive proceeds from any realization of the secured collateral until they have been reimbursed. At such time, the owners of junior secured debt (including, in certain circumstances, the fund) will be entitled to receive proceeds from the realization of the collateral securing such debt. There can be no assurances that the proceeds, if any, from the sale of such collateral would be sufficient to satisfy the loan obligations secured by subordinate debt instruments. To the extent that the fund owns secured debt that is junior to other secured debt, the fund may lose the value of its entire investment in such secured debt.
| 27 |
In addition, the fund may invest in loans that are secured by a second lien on assets. Second lien loans have been a developed market for a relatively short period of time, and there is limited historical data on the performance of second lien loans in adverse economic circumstances. In addition, second lien loan products are subject to intercreditor arrangements with the holders of first lien indebtedness, pursuant to which the second lien holders have waived many of the rights of a secured creditor, and some rights of unsecured creditors, including rights in bankruptcy, which can materially affect recoveries. While there is broad market acceptance of some second lien intercreditor terms, no clear market standard has developed for certain other material intercreditor terms for second lien loan products. This variation in key intercreditor terms may result in dissimilar recoveries across otherwise similarly situated second lien loans in insolvency or distressed situations. While uncertainty of recovery in an insolvency or distressed situation is inherent in all debt instruments, second lien loan products carry more risks than certain other
debt products.
| Item 1B. | UNRESOLVED STAFF COMMENTS |
None.
| 28 |
| Item 2. | PROPERTIES |
Our headquarters are located in Woodland Hills, California in a leased facility. The following table sets forth the location and use of each of our properties, all of which are leased as of December 31, 2015.
| Location | Use | |
| Woodland Hills, California | Headquarters; Accounting, Information Technology and Human Resources offices; Appraisal and Auction and Liquidation offices | |
| Los Angeles, California | Capital Markets office | |
| Newport Beach, California | Capital Markets office | |
| San Francisco, California | Capital Markets office | |
| Wilton, Connecticut | Capital Markets office | |
| New York, New York | Capital Markets, Appraisal, Wealth Management, and Legal office | |
| Chicago, Illinois | Appraisal office | |
| Dallas, Texas | Appraisal, Auction & Liquidation office | |
| Needham, Massachusetts | Appraisal office | |
| Toledo, Ohio | Appraisal office | |
| Atlanta, Georgia | Appraisal office | |
| Charlotte, North Carolina | Appraisal office | |
| Winston-Salem, North Carolina | Appraisal office | |
| Milwaukee, Wisconsin | Appraisal office |
We believe that our existing facilities are suitable and adequate for the business conducted therein, appropriately used and have sufficient capacity for their intended purpose.
| Item 3. | LEGAL PROCEEDINGS |
From time to time, we are involved in litigation which arises in the normal course of our business operations. Except as set forth below, we believe that we are not currently a party to any proceedings the adverse outcome of which, individually or in the aggregate, would have a material adverse effect on our financial position or results of operations:
On January 19, 2015, a complaint (the “Complaint”) was filed against Great American Group, LLC, in the United States Bankruptcy Court for the District of Delaware (“Court”), adversary proceeding 15-50057 (MFW), by 9586 LLC asserting claims arising out of the Great American Group, LLC’s activities with respect to an auction of equipment in Colorado in October 2012. This proceeding is pending in the bankruptcy cases of Abound Solar Manufacturing, LLC and certain of its affiliates (the “Debtors”), case no. 12-11974. The Complaint asserts claims for breach of contract, negligence, fraud, unjust enrichment, negligent misrepresentation, nuisance, and violations of the Colorado Consumer Protection Act (“CCPA”). In the Complaint, the plaintiff, a former landlord of the Debtors, generally alleges that Great American Group, LLC and a joint venture partner were responsible for contamination while performing services in connection with an auction of solar machinery, and is seeking approximately $9.7 million in damages. In April 2015, Great American Group, LLC filed a Motion to Dismiss the Complaint. On March 1, 2016, the Court issued its Opinion on Great American Group, LLC’s Motion to Dismiss dismissing the unjust enrichment claim and the CCPA claim, but denied the motion with respect to the other claims. We intend to continue to vigorously defend this action which we consider to be meritless. An adverse judgment in this matter could materially and adversely affect the Company and its financial condition.
| Item 4. | MINE SAFETY DISCLOSURES. |
Not applicable.
| 29 |
Item 5. MARKET FOR REGISTRANT’S COMMON EQUITY, RELATED STOCKHOLDER MATTERS AND ISSUER PURCHASES OF EQUITY SECURITIES
Stock Market and Other Information
Our common stock is traded on the NASDAQ Capital Market under the symbol: “RILY”. Prior to July 16, 2015, our common stock was traded on the OTC Bulletin Board under the symbol “RILY” from November 7, 2014 to July 16, 2015. Prior to November 7, 2014, our common stock was traded on the OTC Bulletin Board under the symbol “GAMR”.
The following table sets forth the high and low closing sale prices of a share of our Common Stock as reported by the OTC Bulletin Board or NASDAQ Capital Market (as applicable) on a quarterly basis for the years ended December 31, 2014 and 2015.
The prices during the periods for which our shares were traded on the OTC Bulletin Board reflect inter-dealer prices, without retail mark-up, mark-down or commission and may not represent actual transactions. The liquidity of our shares on the NASDAQ Capital Market is extremely limited, and such liquidity was extremely limited during the periods during which our shares were traded on the OTC Bulletin Board, and prices quoted may not be a reliable indication of the value of our Common Stock.
| High | Low | |||||||
| 2014: | ||||||||
| Quarter ended March 31, 2014 | $ | 6.00 | $ | 5.00 | ||||
| Quarter ended June 30, 2014 | 10.40 | 2.80 | ||||||
| Quarter ended September 30, 2014 | 8.15 | 7.40 | ||||||
| Quarter ended December 31, 2014 | 9.90 | 7.45 | ||||||
| 2015: | ||||||||
| Quarter ended March 31, 2015 | $ | 13.75 | $ | 9.50 | ||||
| Quarter ended June 30, 2015 | 12.50 | 9.45 | ||||||
| Quarter ended September 30, 2015 | 11.00 | 9.50 | ||||||
| Quarter ended December 31, 2015 | 10.16 | 9.50 | ||||||
As of March 15, 2016, there were approximately 102 holders of record of our Common Stock. This number does not include beneficial owners holding shares through nominees or in “street” name.
Dividend Policy
On October 29, 2014, our Board of Directors approved a dividend of $0.03 per share, which was paid on or about December 9, 2014 to stockholders of record on November 18, 2014. On May 4, 2015, the Company’s Board of Directors approved a dividend of $0.06 per share, which was paid on or about June 12, 2015 to stockholders of record on May 22, 2015. On August 10, 2015, the Company’s Board of Directors approved a dividend of $0.20 per share, which was paid on or about September 10, 2015 to stockholders of record on August 25, 2015. On November 9, 2015, our Board of Directors approved a dividend of $0.06 per share, which was paid on or about December 9, 2015 to stockholders of record on November 24, 2015. Our Board of Directors may reduce or discontinue the payment of dividends at any time for any reason it deems relevant. The declaration and payment of any future dividends or repurchases of our common stock will be made at the discretion of our Board of Directors and will be dependent upon our financial condition, results of operations, cash flows, capital expenditures, and other factors that may be deemed relevant by our Board of Directors.
| 30 |
| Item 6. | SELECTED FINANCIAL DATA |
The following table sets forth our selected consolidated financial data as of and for each of the five fiscal years ended December 31, 2015, and is derived from our Consolidated Financial Statements. The Consolidated Financial Statements as of December 31, 2015 and 2014, and for each of the years in the three-year period ended December 31, 2015, are included elsewhere in this report. The following data should be read in conjunction with “Management’s Discussion and Analysis of Financial Condition and Results of Operations” and the Consolidated Financial Statements and Notes thereto included elsewhere in this report.
Consolidated Statement of Operations Data:
(Dollars in thousands)
| Year Ended December 31, | ||||||||||||||||||||
| 2015 | 2014 | 2013 | 2012 | 2011 | ||||||||||||||||
| Revenues: | ||||||||||||||||||||
| Services and fees | $ | 101,929 | $ | 67,257 | $ | 59,967 | $ | 65,624 | $ | 60,627 | ||||||||||
| Sale of goods | 10,596 | 9,859 | 16,165 | 18,312 | 2,899 | |||||||||||||||
| Total revenues | 112,525 | 77,116 | 76,132 | 83,936 | 63,526 | |||||||||||||||
| Operating expenses: | ||||||||||||||||||||
| Direct cost of services | 29,049 | 23,466 | 24,146 | 23,911 | 19,749 | |||||||||||||||
| Cost of goods sold | 3,072 | 14,080 | 11,506 | 12,750 | 3,391 | |||||||||||||||
| Selling, general and administrative | 58,322 | 44,453 | 36,382 | 39,834 | 32,946 | |||||||||||||||
| Restructuring charge | — | 2,548 | — | — | — | |||||||||||||||
| Total operating expenses | 90,443 | 84,547 | 72,034 | 76,495 | 56,086 | |||||||||||||||
| Operating income (loss) | 22,082 | (7,431 | ) | 4,098 | 7,441 | 7,440 | ||||||||||||||
| Other income (expense): | ||||||||||||||||||||
| Interest income | 17 | 12 | 26 | 201 | 476 | |||||||||||||||
| Loss from equity investment in Great American Group Real Estate, LLC and Shoon Trading Limited | — | — | (177 | ) | (120 | ) | (369 | ) | ||||||||||||
| Gain from bargain purchase | — | — | — | 1,366 | — | |||||||||||||||
| Interest expense | (834 | ) | (1,262 | ) | (2,667 | ) | (2,612 | ) | (4,885 | ) | ||||||||||
| Income (loss) from operations before income taxes | 21,265 | (8,681 | ) | 1,280 | 6,276 | 2,662 | ||||||||||||||
| (Provision) benefit for income taxes | (7,688 | ) | 2,886 | (704 | ) | (1,936 | ) | (2,060 | ) | |||||||||||
| Net income (loss) | 13,577 | (5,795 | ) | 576 | 4,340 | 602 | ||||||||||||||
| Net income (loss) attributable to noncontrolling interests | 1,772 | 6 | (482 | ) | 819 | — | ||||||||||||||
| Net income (loss) attributable to B. Riley Financial, Inc. | $ | 11,805 | $ | (5,801 | ) | $ | 1,058 | $ | 3,521 | $ | 602 | |||||||||
| Basic earnings (loss) per share | $ | 0.73 | $ | (0.60 | ) | $ | 0.74 | $ | 2.46 | $ | 0.42 | |||||||||
| Diluted earnings (loss) per share | $ | 0.73 | $ | (0.60 | ) | $ | 0.71 | $ | 2.38 | $ | 0.41 | |||||||||
| Weighted average basic shares outstanding | 16,221,040 | 9,612,154 | 1,434,107 | 1,434,107 | 1,434,107 | |||||||||||||||
| Weighted average diluted shares outstanding | 16,265,915 | 9,612,154 | 1,495,328 | 1,480,671 | 1,477,548 | |||||||||||||||
Consolidated Balance Sheet Data:
(Dollars in thousands)
| Year Ended December 31, | ||||||||||||||||||||
| 2015 | 2014 | 2013 | 2012 | 2011 | ||||||||||||||||
| Cash and cash equivalents | $ | 30,012 | $ | 21,600 | $ | 18,867 | $ | 18,721 | $ | 15,034 | ||||||||||
| Restricted cash | 51 | 7,657 | 325 | 7,923 | — | |||||||||||||||
| Securities owned. At fair value | 25,543 | 17,955 | — | — | — | |||||||||||||||
| Total assets | 132,420 | 138,990 | 73,677 | 80,583 | 76,358 | |||||||||||||||
| Total current liabilities | 21,950 | 41,911 | 29,069 | 34,275 | 32,394 | |||||||||||||||
| Total long-term liabilities | 1,150 | — | 48,759 | 50,483 | 52,220 | |||||||||||||||
| Total equity (deficit) | 109,320 | 97,079 | (4,151 | ) | (4,175 | ) | (8,256 | ) | ||||||||||||
| 31 |
| Item 7. | MANAGEMENT’S DISCUSSION AND ANALYSIS OF FINANCIAL CONDITION AND RESULTS OF OPERATIONS |
This report contains forward-looking statements. These statements relate to future events or our future financial performance. In some cases, you can identify forward-looking statements by terminology such as “may,” “will,” “should,” “expect,” “plan,” “anticipate,” “believe,” “estimate,” “predict,” “potential” or “continue,” the negative of such terms or other comparable terminology. These statements are only predictions. Actual events or results may differ materially.
Although we believe that the expectations reflected in the forward-looking statements are reasonable, we cannot guarantee future results, levels of activity, performance or achievements. Moreover, neither we, nor any other person, assume responsibility for the accuracy and completeness of the forward-looking statements. We are under no obligation to update any of the forward-looking statements after the filing of this Annual Report to conform such statements to actual results or to changes in our expectations.
The following discussion of our financial condition and results of operations should be read in conjunction with our consolidated financial statements and the related notes and other financial information appearing elsewhere in this Annual Report. Readers are also urged to carefully review and consider the various disclosures made by us which attempt to advise interested parties of the factors which affect our business, including without limitation the disclosures made in Item 1A of Part I of this Annual Report under the caption “Risk Factors”.
Risk factors that could cause actual results to differ from those contained in the forward-looking statements include but are not limited to risks related to: volatility in our revenues and results of operations; changing conditions in the financial markets; our ability to generate sufficient revenues to achieve and maintain profitability; the short term nature of our engagements; the accuracy of our estimates and valuations of inventory or assets in “guarantee” based engagements; competition in the asset management business potential losses related to our auction or liquidation engagements; our dependence on communications, information and other systems and third parties; potential losses related to purchase transactions in our auction and liquidations business; the potential loss of financial institution clients; potential losses from or illiquidity of our proprietary investments; changing economic and market conditions; potential liability and harm to our reputation if we were to provide an inaccurate appraisal or valuation; potential mark-downs in inventory in connection with purchase transactions; failure to successfully compete in any of our segments; loss of key personnel; our ability to borrow under our credit facilities as necessary; failure to comply with the terms of our credit agreements; and our ability to meet future capital requirements.
Except as otherwise required by the context, references in this Annual Report to “the “Company,” “B. Riley,” “we,” “us” or “our” refer to the combined business of B. Riley Financial, Inc. and all of its subsidiaries.
Overview
B. Riley Financial, Inc. and its subsidiaries (NASDAQ: RILY) provides collaborative financial services and solutions through several subsidiaries, including:
| § | B. Riley & Co., LLC (“BRC”), a mid-sized, full service investment bank providing financial advisory, corporate finance, research, and sales & trading services to corporate, institutional and high net worth individual clients; |
| § | B. Riley Capital Management, LLC, an Securities and Exchange Commission (“SEC”) registered Investment Advisor, which includes B. Riley Asset Management, a provider of investment products to institutional and high net worth investors; B. Riley Wealth Management (formerly MK Capital Advisors), a multi-family office practice and wealth management firm focused on the needs of ultra-high net worth individuals and families; and Great American Capital Partners, LLC (“GACP”), the general partner of a private fund, GACP I, L.P., a direct lending fund that provides senior secured loans and second lien secured loan facilities to middle market public and private U.S. companies; |
| § | Great American Group, LLC, a leading provider of asset disposition and auction solutions to a wide range of retail and industrial clients; and |
| § | Great American Group Advisory and Valuation Services, LLC, a leading provider of valuation services for asset based lenders and corporate clients. |
| 32 |
For financial reporting purposes we classify our businesses into three segments: (i) capital markets, (ii) auction and liquidation and (iii) valuation and appraisal.
Capital Markets Segment. Our capital markets segment provides a full array of investment banking, corporate finance, research, wealth management, sales and trading services to corporate, institutional and high net worth clients. Our corporate finance and investment banking services include merger and acquisitions advisory services to public and private companies, initial and secondary public offerings, and institutional private placements. In addition, we trade equity securities as a principal for the Company’s account, including investments in funds managed by our subsidiaries. Our capital markets segment also includes our asset management businesses that manage various private and public funds for institutional and individual investors.
Auction and Liquidation Segment. Our auction and liquidation segment utilizes our significant industry experience, a scalable network of independent contractors and industry-specific advisors to tailor our services to the specific needs of a multitude of clients, logistical challenges and distressed circumstances. Furthermore, our scale and pool of resources allow us to offer our services across North American as well as parts of Europe, Asia and Australia.
Valuation and Appraisal Segment. Our valuation and appraisal segment provides valuation and appraisal services to financial institutions, lenders, private equity firms and other providers of capital. These services primarily include the valuation of assets (i) for purposes of determining and monitoring the value of collateral securing financial transactions and loan arrangements and (ii) in connection with potential business combinations. Our valuation and appraisal segment operates through limited liability companies that are majority owned by us.
UK Retail Stores. We previously had an additional operating segment relating to UK retail stores. Our UK retail stores segment included the operations of retail footwear stores in the United Kingdom as a result of our investment in Shoon Trading Limited (“Shoon”) on May 4, 2012. Revenues from the sale of goods in our UK retail stores segment were recognized as revenue upon the sale of product to retail customers. Our net sales represent gross sales invoiced to customers, less certain related charges for discounts, returns, and other promotional allowances and are recorded net of sales or value added tax. Allowances provided for these items are presented in the consolidated financial statements primarily as reductions to sales and cost of sales. We ceased to consider this a separate operating segment in August 2013 following the amendment and restatement of a shareholders agreement for Shoon which eliminated our control rights. As a result of this amendment, Shoon’s operating results are not consolidated with the Company’s for any periods after July 31, 2013. Notwithstanding the deconsolidation, our operating results for periods from July 31, 2013 to January 2014 include the income (loss) from our 44.4% equity investment in the common stock of Shoon. In January 2014, Shoon was sold to a third party, and we no longer have a financial interest in the operations of Shoon.
Historically, revenues from our auction and liquidation segment vary significantly from quarter to quarter and have a significant impact on our operating results from period to period. These revenues have historically comprised a significant amount of our total revenues and operating profits. During the years ended December 31, 2015, 2014 and 2013, revenues from our auction and liquidation segment were 41.1%, 35.0% and 55.7% of total revenues. Our profitability in each reporting period is impacted by the number and size of retail liquidation engagements we perform on a quarterly or annual basis. Revenues from liquidation service contracts to one retailer represented 12.4% of our total revenues during the year ended December 31, 2015. Revenues from liquidation service contracts and financing activities to one retailer and the sale of four oil rigs to one customer represented 10.7% and 12.2% of our total revenues during the year ended December 31, 2013. In addition, revenues from investment banking transactions in our capital markets segment will vary from quarter to quarter and have a material impact on our total revenues and operating profits.
Private Placement and Strategic Combination
On June 5, 2014, we completed a private placement of 10,289,300 shares of our common stock at a purchase price of $5.00 per share (the “Private Placement”). Fifty three accredited investors (the “Investors”) participated in the Private Placement pursuant to the terms and provisions of a securities purchase agreement entered into among us and the Investors on May 19, 2014. At the closing of the Private Placement on June 5, 2014, we received net proceeds of approximately $51.2 million. On June 5, 2014, we used $30.2 million of the net proceeds from the Private Placement to repay long-term debt payable to Andrew Gumaer and Harvey Yellen, both of whom were executive officers and directors of the Company at the time of such repayment. The $30.0 million principal payment and then outstanding accrued interest of $0.2 million retired the entire $48.8 million face amount of the long-term debt at a discount of $18.8 million. The discount of $18.8 million has been recorded as a capital contribution to additional paid in capital in our consolidated financial statements.
On June 18, 2014, we completed the acquisition of B. Riley and Co. Inc. (“BRC Inc.”) pursuant to the terms of the Acquisition Agreement (the “Acquisition Agreement”), dated as of May 19, 2014, by and among the Company, Darwin Merger Sub I, Inc., a wholly owned subsidiary of the Company, B. Riley Capital Markets, LLC, a wholly owned subsidiary of the Company (“BCM”), BRC Inc., B. Riley & Co. Holdings, LLC (“BRH”), Riley Investment Management LLC (“RIM”), and collectively with BRC Inc. and BRH, the (“B. Riley Entities”) and Bryant Riley, a director of the Company and principal owner of each of the B. Riley Entities. In connection with the Company’s acquisition of BRC Inc., Darwin Merger Sub I, Inc. merged with and into BRC Inc., and BRC Inc. subsequently merged with and into BCM, with BCM surviving as a wholly owned subsidiary of the Company. We completed the acquisitions of BRH, whose operations include asset management and financial advisory services, and RIM, which provides services to certain pooled investment vehicles, on August 1, 2014.
| 33 |
The total purchase price for the B. Riley Entities was $26.4 million, which was paid at closing on June 18, 2014 or through post-closing adjustments and arrangements, in the form of 4,182,637 newly issued shares of our common stock. The fair value of the newly issued shares of the Company’s common stock for accounting purposes was determined based on the closing market price of the Company’s shares of common stock on the acquisition date, less a 25% discount for lack of marketability as the shares issued are subject to certain restrictions that limit their trade or transfer in the open market.
Effective upon the closing of the acquisition on June 18, 2014, Bryant Riley, the principal owner of BRC Inc., was appointed as our Chief Executive Officer and Chairman. As a result of the acquisition of BRC Inc., Bryant Riley owns approximately 24.1% of our outstanding common stock.
Recent Developments
During the second quarter of 2014, we initiated a strategic review of our operations taking into account the planned synergies as a result of the acquisition of BRC Inc. As a result of the strategic review, we implemented cost savings measures that resulted in a reduction in corporate overhead and the restructuring of our operations in Europe. In the third quarter of 2014, we implemented a reduction in force for some of our corporate employees and a significant number of our employees in the United Kingdom and we closed our office in Deerfield, Illinois. These initiatives resulted in a restructuring charge of $2.5 million in the third quarter of 2014. As part of the strategic review, we restructured our UK appraisal business whereby we entered into a joint marketing and strategic alliance with an entity owned and controlled by our former UK appraisal senior management. As a result of the restructuring, there has been a shift in our strategic focus from Europe which has resulted in a substantial reduction in revenues from European operations.
On January 2, 2015, we entered into a purchase agreement to acquire all of the membership interests of MK Capital Advisors, LLC (“MK Capital”), a wealth management business with operations primarily in New York. On February 2, 2015, the pre-closing conditions were satisfied and we completed the purchase of MK Capital. Upon closing, we paid the members of MK Capital $2.5 million in cash and issued 333,333 shares of our common stock to such members. The purchase agreement also requires the payment of contingent consideration of $1.25 million in cash and 166,667 shares of our common stock on the first anniversary date of the closing (February 2, 2016) and a final payment of $1.25 million in cash and 166,666 of our common stock on the second anniversary date of the closing (February 2, 2017). Such contingent consideration is contingent on MK Capital generating a minimum amount of gross revenues as defined in the purchase agreement for the twelve months ending on the first and second anniversary dates of the closing. MK Capital achieved the minimum amount of revenues for the first anniversary period and the contingent cash consideration and contingent stock consideration for such first anniversary period was paid and issued on February 2, 2016. The acquisition of MK Capital allows the Company to expand into the wealth management business.
On January 11, 2015, Great American Group Energy Equipment, LLC (“GAGEE”) filed a voluntary petition with the United States Bankruptcy Court for the Northern District of Texas for relief under Chapter 7 of Title 11 of the United States Code. At December 31, 2014, GAGEE had total assets of $6.6 million and total liabilities of $6.6 million. Total assets included $2.5 million of other receivables included in prepaid and other current assets and $4.0 million of goods held for sale which was comprised of five oil rigs. Total liabilities included $6.6 million notes payable that are collateralized by the assets of GAGEE pursuant to a credit agreement GAGEE entered into to finance the purchase of oil rigs and other equipment related to the oil exploration business to be sold at auction or liquidation. As a result of such bankruptcy filing, the assets and liabilities of GAGEE described above are no longer consolidated in our consolidated financial statements for periods subsequent to such bankruptcy filing. The loss on deconsolidation of GAGEE was less than $0.1 million during the year ended December 31, 2015. On June 29, 2015, the trustee handling the bankruptcy case for GAGEE was discharged and the bankruptcy case was closed. As a result of this process, the lenders under the credit agreement described above are proceeding with the disposition of the assets of GAGEE in accordance with their security interest in connection with their loan. At the present time, the Company does not have any remaining investment or any obligations with respect to GAGEE’s liabilities. The Company intends to dissolve GAGEE and wind up its business. If any future expenses or losses are incurred by GAGEE during its wind up, the Company will record its share of losses under the equity method of accounting. Management does not expect these events or any subsequent related actions regarding GAGEE will have a material impact on the consolidated financial position of the Company.
In February 2015, we were engaged to participate in a joint venture involving the liquidation of inventory for the going-out-of-business sale of 133 Target stores located in Canada. The joint venture provided Target Canada with a minimum guarantee of amounts to be realized from the liquidation of inventory. In connection with our portion of the guarantee, we provided a letter of credit to Target Canada in the amount of $14.0 million in February 2015. The liquidation sale of inventory was completed in April 2015 and the amounts realized from the liquidation of inventory exceed the minimum guarantee. In April 2015 the $14.0 million letter of credit provided to Target Canada was returned to us.
| 34 |
In March 2015, we purchased inventory and intellectual property of Schoenenreus from a bankruptcy trustee in the Netherlands for $3.2 million. Schoenenreus is a retailer of men’s, women’s and children’s shoes, clothing and accessories and operates 121 retail locations throughout the Netherlands. We started the going-out-of-business sale of all of Schoenenreus’s inventory in March 2015 and completed the sale of all the inventory in April 2015.
In April 2015, we announced the formation of GACP, a wholly owned subsidiary of the Company, and GACP I, L.P., a private direct lending fund of which GACP is the general partner, together with an anchor investment from a business development company advised by a large financial services company. GACP is the general partner of GACP I, L.P., a direct lending fund that provides asset-based loans to middle market companies. GACP leverages the knowledge and expertise of Great American Group’s liquidation and appraisal business to provide insight into asset collateral values that support the asset-based loans. We believe that this internal expertise in assessing collateral values provides GACP with a competitive advantage over other middle market direct lenders. In connection with the formation of GACP I, L.P., we committed to invest $5.0 million in exchange for an ownership interest of approximately 5% of GACP I, L.P. As of December 31, 2015, we funded $1.7 million of the $5.0 million commitment to invest in GACP I, L.P.
In June 2015, we entered into an auction services agreement to auction approximately $14.7 million of transportation and field services equipment that is used in the oil and gas industry in Canada. In connection with the auction services agreement, we provided a minimum recovery value of the machinery and equipment that is to be sold on behalf of the receiver. The auction of the machinery and equipment was conducted in September 2015 and the proceeds from the auction exceeded the minimum recovery value and the total fees and reimbursed expenses recognized as revenues were $2.7 million.
Results of Operations
The following period to period comparisons of our financial results are not necessarily indicative of future results.
Year Ended December 31, 2015 Compared to Year Ended December 31, 2014
Consolidated Statements of Operations
(Dollars in thousands)
| Year Ended December 31, 2015 | Year Ended December 31, 2014 | |||||||||||||||
| Amount | % | Amount | % | |||||||||||||
| Revenues: | ||||||||||||||||
| Services and fees | $ | 101,929 | 90.6 | % | $ | 67,257 | 87.2 | % | ||||||||
| Sale of goods | 10,596 | 9.4 | % | 9,859 | 12.8 | % | ||||||||||
| Total revenues | 112,525 | 100.0 | % | 77,116 | 100.0 | % | ||||||||||
| Operating expenses: | ||||||||||||||||
| Direct cost of services | 29,049 | 25.8 | % | 23,466 | 30.4 | % | ||||||||||
| Cost of goods sold | 3,072 | 2.7 | % | 14,080 | 18.3 | % | ||||||||||
| Selling, general and administrative expenses | 58,322 | 51.9 | % | 44,453 | 57.6 | % | ||||||||||
| Restructuring charge | - | 0.0 | % | 2,548 | 3.3 | % | ||||||||||
| Total operating expenses | 90,443 | 80.4 | % | 84,547 | 109.6 | % | ||||||||||
| Operating income (loss) | 22,082 | 19.6 | % | (7,431 | ) | -9.6 | % | |||||||||
| Other income (expense): | ||||||||||||||||
| Interest income | 17 | 0.0 | % | 12 | 0.0 | % | ||||||||||
| Interest expense | (834 | ) | -0.7 | % | (1,262 | ) | -1.6 | % | ||||||||
| Income (loss) before income taxes | 21,265 | 18.9 | % | (8,681 | ) | -11.2 | % | |||||||||
| (Provision) benefit for income taxes | (7,688 | ) | -6.8 | % | 2,886 | 3.6 | % | |||||||||
| Net income (loss) | 13,577 | 12.1 | % | (5,795 | ) | -7.6 | % | |||||||||
| Net income (loss) attributable to noncontrolling interests | 1,772 | 1.6 | % | 6 | 0.0 | % | ||||||||||
| Net income (loss) attributable to B. Riley Financial, Inc. | $ | 11,805 | 10.5 | % | $ | (5,801 | ) | -7.6 | % | |||||||
| 35 |
Revenues
The table below and the discussion that follows are based on how we analyze our business.
| Year Ended December 31, 2015 | Year Ended December 31, 2014 | Change | ||||||||||||||||||||||
| Amount | % | Amount | % | Amount | % | |||||||||||||||||||
| Revenues - Services and Fees: | ||||||||||||||||||||||||
| Capital Markets segment | $ | 35,183 | 31.3 | % | $ | 19,420 | 25.2 | % | $ | 15,763 | 81.2 | % | ||||||||||||
| Auction and Liquidation segment | 35,633 | 31.7 | % | 17,166 | 22.3 | % | 18,467 | 107.6 | % | |||||||||||||||
| Valuation and Appraisal segment | 31,113 | 27.6 | % | 30,671 | 39.7 | % | 442 | 1.4 | % | |||||||||||||||
| Subtotal | 101,929 | 90.6 | % | 67,257 | 87.2 | % | 34,672 | 51.6 | % | |||||||||||||||
| Revenues - Sale of goods | ||||||||||||||||||||||||
| Auction and Liquidation segment | 10,596 | 9.4 | % | 9,859 | 12.8 | % | 737 | 7.5 | % | |||||||||||||||
| Total revenues | $ | 112,525 | 100.0 | % | $ | 77,116 | 100.0 | % | $ | 35,409 | 45.9 | % | ||||||||||||
Total revenues increased $35.4 million to $112.5 million during the year ended December 31, 2015 from $77.1 million during the year ended December 31, 2014. The increase in revenues during the year ended December 31, 2015 was primarily due to an increase in revenues from services and fees of $34.7 million and an increase in revenues from the sale of goods of $0.7 million. The increase in revenues from services and fees of $34.7 million in 2015 was primarily due to an increase in revenues of (a) $15.8 million from our capital markets segment which includes the operating results of BRC Inc., which we acquired on June 18, 2014 and the operations of MK Capital which we acquired on February 2, 2015, (b) $18.5 million in the auction and liquidation segment, and (c) $0.4 million in the valuation and appraisal segment.
Revenues from services and fees in the capital markets segment were $35.2 million during the year ended December 31, 2015. Capital markets segment revenues include revenues from BRC Inc. and MK Capital during 2015 related to investment banking fees of $16.7 million, commissions, fees and other income primarily earned from research, sales and trading, and wealth management services of $18.3 million, and trading gains of $0.2 million. Revenues from services and fees in the capital markets segment were $19.4 million during the year ended December 31, 2014. These revenues included revenues for the period from June 18, 2014 to December 31, 2014 as a result of our acquisition of BRC Inc. and revenues for the period February 2, 2015 to December 31, 2015 as a result of our acquisition of MK Capital. Capital markets segment revenues in 2014 include revenues from investment banking fees of $10.3 million, commissions and other income primarily earned from research, sales and trading of $7.8 million, and trading income of $1.3 million.
Revenues from services and fees in the auction and liquidation solutions increased $18.5 million, or 107.6%, to $35.6 million during the year ended December 31, 2015 from $17.2 million during the year ended December 31, 2014. The increase in revenues from services and fees in 2015 was primarily due to our participation in the joint venture involving the liquidation of inventory for the going-out-of-business sale of 133 Target stores located in Canada. The joint venture provided Target Canada with a minimum guarantee of amounts to be realized from the liquidation of inventory. The liquidation sale of inventory was completed in April 2015 and the amounts realized from the liquidation of inventory exceeded the minimum guarantee. Revenues from our participation in the joint venture were $13.9 million during the year ended December 31, 2015. The increase in revenues was also due to an increase in the mix of fee related retail liquidation engagements in 2015 as compared to 2014. In the comparable period in 2014, revenues included a loss accrual $6.1 million for one retail liquidation engagement where we provided a minimum guarantee of amounts to be realized from the liquidation of inventory and we did not have any large retail liquidation engagements that generated a significant amount of revenues from services and fees.
Revenues from services and fees in the valuation and appraisal segment increased $0.4 million, or 1.4%, to $31.1 million during the year ended December 31, 2015 from $30.7 million during the year ended December 31, 2014. The increase in revenues was primarily due to increases of (a) $1.6 million related to appraisal engagements where we perform valuations for the monitoring of collateral for financial institutions, lenders, and private equity investors and (b) $1.3 million for appraisals of machinery and equipment and intellectual property. These increases were offset by a decrease in revenues of (a) $1.6 million related to appraisal engagements where we perform valuations of intellectual property and business valuations, and (b) $0.9 million from our appraisal operations in the United Kingdom which we restructured in the third quarter of 2014.
| 36 |
Sale of Goods, Cost of Goods Sold and Gross Margin
| Year Ended | Year Ended | |||||||
| December 31, | December 31, | |||||||
| 2015 | 2014 | |||||||
| Revenues - Sale of Goods | $ | 10,596 | $ | 9,859 | ||||
| Cost of Goods Sold | 3,072 | 14,080 | ||||||
| Gross margin | $ | 7,524 | $ | (4,221 | ) | |||
| Gross margin percentage | 71.0 | % | -42.8 | % | ||||
Revenues from the sale of goods increased $0.7 million, to $10.6 million during the year ended December 31, 2015 from $9.9 during the year ended December 31, 2014. Revenues from the sale of goods in 2015 was primarily due to the sale of retail goods related to the retail liquidation engagement of Schoenenreus where we took title to the goods and operated the Schoenenreus stores during the liquidation period. Cost of goods sold in 2015 was $3.1 million resulting in a gross margin of $7.5 million or 71.0% during the year ended December 31, 2015. Revenues from the sale of goods in 2014 was primarily due to the sale of goods related to an auction of an industrial plant where we sold machinery and equipment at an auction we held during the first quarter of 2014. Cost of goods sold in 2014 was $14.1 million resulting in a gross margin of $(4.2) million or (42.8)% during the year ended December 31, 2014. The gross margin in 2014 was negatively impacted by $2.9 million of impairment and inventory valuation charges in the fourth quarter of 2014 and $1.7 million of inventory valuation charges during the third quarter of 2014. The impairment and inventory valuation charges in the fourth quarter of 2014 were comprised of a $1.2 million impairment charge we incurred as a result of the expiration of the lease finance receivable on December 15, 2014 and an inventory valuation charge of $2.1 million related to another oil rig and aircraft parts that are included in goods held for sale at December 31, 2014. The $1.7 million impairment charge in the third quarter of 2014 was incurred to write down the carrying value of certain goods held for sale or auction relating to machinery and equipment that we sold at auction in the third quarter of 2014.
Operating Expenses
Direct Costs of Services. Direct cost of services and direct cost of services measured as a percentage of revenues – services and fees by segment during the years ended December 31, 2015 and 2014 are as follows:
| Year Ended December 31, 2015 | Year Ended December 31, 2014 | |||||||||||||||||||||||
| Auction and | Valuation and | Auction and | Valuation and | |||||||||||||||||||||
| Liquidation | Appraisal | Liquidation | Appraisal | |||||||||||||||||||||
| Segment | Segment | Total | Segment | Segment | Total | |||||||||||||||||||
| Revenues - Services and fees | $ | 35,633 | $ | 31,113 | $ | 17,166 | $ | 30,671 | ||||||||||||||||
| Direct cost of services | 15,489 | 13,560 | $ | 29,049 | 10,719 | 12,747 | $ | 23,466 | ||||||||||||||||
| Gross margin on services and fees | $ | 20,144 | $ | 17,553 | $ | 6,447 | $ | 17,924 | ||||||||||||||||
| Gross margin percentage | 56.5 | % | 56.4 | % | 37.6 | % | 58.4 | % | ||||||||||||||||
Total direct costs increased $5.5 million, to $29.0 million during the year ended December 31, 2015 from $23.5 million during the year ended December 31, 2014. Direct costs of services in the auction and liquidation segment increased $4.8 million to $15.5 million during the year ended December 31, 2015 from $10.7 million during the year ended December 31, 2014. The increase in expenses was primarily due to an increase in 2015 in the number of fee and commission type engagements where we contractually bill fees, commissions and reimbursable expenses as compared to the same period in 2014. Direct costs of services in the valuation and appraisal segment increased $0.8 million, to $13.5 million during the year ended December 31, 2015 from $12.7 million during the year ended December 31, 2014. The increase in direct costs of services in the valuation and appraisal segment was primarily due to an increase in payroll and related expenses due to an increase headcount 2015.
Gross margin in the auction and liquidation segment for services and fees increased to 56.5% of revenues during the year ended December 31, 2015, as compared to 37.6% of revenues during the year ended December 31, 2014. The increase in the gross margin during the year ended December 31, 2015 was primarily due to a change in the mix of fee type engagements in 2015 as compared to the same period in 2014 and the impact of the revenues we earned from our participation in the joint venture involving the liquidation of inventory for the going-out-of-business sale of 133 Target stores located in Canada.
Gross margins in the valuation and appraisal segment decreased to 56.4% of revenues during the year ended December 31, 2015 as compared to 58.4% of revenues during the year ended December 31, 2014. The decrease in the gross margin is primarily due to an increase in payroll and related expenses from an increase in headcount during the fourth quarter of 2015 as compared to same period in 2014.
| 37 |
Selling, General and Administrative Expenses. Selling, general and administrative expenses during the years ended December 31, 2015 and 2014 were comprised of the following:
Selling, General and Administrative Expenses by Segment
(Dollars in thousands)
| Year Ended December 31, 2015 | Year Ended December 31, 2014 | Change | ||||||||||||||||||||||
| Amount | % | Amount | % | Amount | % | |||||||||||||||||||
| Capital Markets segment | $ | 30,748 | 52.7 | % | $ | 14,378 | 32.3 | % | $ | 16,370 | 113.9 | % | ||||||||||||
| Auction and Liquidation segment | 8,361 | 14.3 | % | 8,588 | 19.3 | % | (227 | ) | -2.6 | % | ||||||||||||||
| Valuation and Appraisal segment | 9,238 | 15.8 | % | 10,872 | 24.5 | % | (1,634 | ) | -15.0 | % | ||||||||||||||
| Corporate and Other segment | 9,975 | 17.2 | % | 10,615 | 23.9 | % | (640 | ) | -6.0 | % | ||||||||||||||
| Total selling, general & administrative expenses | $ | 58,322 | 100.0 | % | $ | 44,453 | 100.0 | % | $ | 13,869 | 31.2 | % | ||||||||||||
Total selling, general and administrative expenses increased $13.9 million, or 31.2%, to $58.3 million during the year ended December 31, 2015 from $44.4 million for the year ended December 31, 2014. The increase was primarily due to an increase in selling, general and administrative expenses of $16.4 million in the capital markets segment as a result of the acquisition of BRC Inc. on June 18, 2014 and MK Capital on February 2, 2015, offset by decreases in selling, general and administrative expenses of (a) $0.2 million in the auction and liquidation segment, (b) $1.6 million in the valuation and appraisal segment and (c) $0.6 million in corporate and other.
Selling, general and administrative expenses in the capital markets segment were $30.7 million during the year ended December 31, 2015. The operating expenses for the capital markets segment in 2015 reflect the operating expenses of BRC Inc. for the entire year ended December 31, 2015 and the operating expenses of MK Capital for the period from February 2, 2015, the date of our acquisition, through December 31, 2015. In the prior year the operating expenses in our capital markets segment only included the operating expenses of BRC Inc. for the period from June 18, 2014, the date of acquisition, through December 31, 2014.
Selling, general and administrative expenses in the auction and liquidation segment decreased $0.2 million, or 2.6%, to $8.4 million during the year ended December 31, 2015 from $8.6 million for the year ended December 31, 2014. The decrease was primarily due to a decrease in payroll and other operating expenses related to the operations of our former real estate advisory services division.
Selling, general and administrative expenses in the valuation and appraisal segment decreased $1.6 million, or 15.0%, to $9.2 million during year ended December 31, 2015 from $10.8 million for the year ended December 31, 2014. The decrease of $1.6 million was primarily due to a decrease in operating expenses from our valuation and appraisal business in Europe resulting from the restructuring of the operations in the third quarter of 2014.
Selling, general and administrative expenses for corporate and other decreased $0.6 million, or 6.0%, to $10.0 million during the year ended December 31, 2015 from $10.6 million for the year ended December 31, 2014. The decrease was primarily due to a decrease in professional fees that were incurred in 2014 related to transaction expenses for the acquisition of BRC Inc. on June 18, 2014.
Restructuring Charge. During the year ended December 31, 2014, we incurred a restructuring charge of $2.5 million. There was no restructuring charge during the year ended December 31, 2015. The restructuring charge was primarily for the costs we incurred from a reduction in force from some of our corporate employees and a significant number of our employees in the United Kingdom and the closure of one of our offices in Deerfield, Illinois as discussed above.
Other Income (Expense). Other income included interest income of less than $0.1 million during the year ended December 31, 2015 and 2014.
Interest Expense. Interest expense was $0.8 million during the year ended December 31, 2015 as compared to $1.3 million during the year ended December 31, 2014. The decrease in interest expense during the year ended December 31, 2015 was primarily due to a decrease in interest expense of $0.8 million as a result of the early repayment of a portion of the principal balance of the related party notes payable that accrued interest at 12.0% in January 2014, the retirement of $48.8 million of face amount of long-term debt payable to Andrew Gumaer and Harvey Yellen on June 5, 2014 and the repayment of the remaining principal balance of the related party notes payable of $1.0 million on July 31, 2014 as more fully discussed in Note 11 to the consolidated financial statements. The decrease in interest expense was offset by imputed interest expense of $0.2 million related to the contingent consideration for the acquisition of MK Capital in February 2015 and an increase in interest expense on the revolving line of credit.
Income (Loss) Before Income Taxes. Income before income taxes was $21.3 million during the year ended December 31, 2015 as compared to a loss before income taxes of $8.7 million during the year ended December 31, 2014. The increase in income before income taxes of $30.0 million during the year ended December 31, 2015 as compared to the loss in 2014 was primarily due to an increase in operating income of (a) $27.0 million in our auction and liquidation segment, (b) $1.5 million in our valuation and appraisal segment, and (c) a decrease in corporate overhead and interest expense of $2.0 million, offset by a decrease in operating income of $0.6 million in our capital markets segment.
| 38 |
(Provision) Benefit For Income Taxes. Provision for income taxes was $7.7 million during the year ended December 31, 2015 as compared to a benefit for income taxes of $2.9 million during the year ended December 31, 2014. The effective income tax rate was 36.2% during the year ended December 31, 2015 and a benefit of 33.2% during the year ended December 31, 2014.
Net Income Attributable to Noncontrolling Interests. Net income attributable to noncontrolling interests represents the proportionate share of net income generated by Great American Global Partners, LLC that we do not own. The net income attributable to noncontrolling interests was $1.8 million during the year ended December 31, 2015 compared to net income attributable to noncontrolling interests of $0.1 million during the year ended December 31, 2014.
Net Income (Loss) Attributable to the Company. Net income attributable to the Company for the year ended December 31, 2015 was $11.8 million compared to a net loss of $5.8 million during the year ended December 31, 2014. The increase in net income during the year ended December 31, 2015 as compared to the same period in 2014 was primarily due to an increase in operating income in the auction and liquidation segment as discussed above and the impact of the restructuring charge of $2.5 million incurred during 2014 as more fully described above.
Year Ended December 31, 2014 Compared to Year Ended December 31, 2013
Consolidated Statements of Operations
(Dollars in thousands)
| Year Ended December 31, 2014 | Year Ended December 31, 2013 | |||||||||||||||
| Amount | % | Amount | % | |||||||||||||
| Revenues: | ||||||||||||||||
| Services and fees | $ | 67,257 | 87.2 | % | $ | 59,967 | 78.8 | % | ||||||||
| Sale of goods | 9,859 | 12.8 | % | 16,165 | 21.2 | % | ||||||||||
| Total revenues | 77,116 | 100.0 | % | 76,132 | 100.0 | % | ||||||||||
| Operating expenses: | ||||||||||||||||
| Direct cost of services | 23,466 | 30.4 | % | 24,146 | 31.7 | % | ||||||||||
| Cost of goods sold | 14,080 | 18.3 | % | 11,506 | 15.1 | % | ||||||||||
| Selling, general and administrative expenses | 44,453 | 57.6 | % | 36,382 | 47.8 | % | ||||||||||
| Restructuring charge | 2,548 | 3.3 | % | - | 0.0 | % | ||||||||||
| Total operating expenses | 84,547 | 109.6 | % | 72,034 | 94.6 | % | ||||||||||
| Operating (loss) income | (7,431 | ) | -9.6 | % | 4,098 | 5.4 | % | |||||||||
| Other income (expense): | ||||||||||||||||
| Interest income | 12 | 0.0 | % | 26 | 0.0 | % | ||||||||||
| Loss from equity investment in Great American | ||||||||||||||||
| Real Estate, LLC and Shoon Trading Limited | - | 0.0 | % | (177 | ) | -0.2 | % | |||||||||
| Interest expense | (1,262 | ) | -1.6 | % | (2,667 | ) | -3.5 | % | ||||||||
| (Loss) income before income taxes | (8,681 | ) | -11.2 | % | 1,280 | 1.7 | % | |||||||||
| Benefit (provision) for income taxes | 2,886 | 3.6 | % | (704 | ) | -0.9 | % | |||||||||
| Net (loss) income | (5,795 | ) | -7.6 | % | 576 | 0.8 | % | |||||||||
| Net income (loss) attributable to noncontrolling interests | 6 | 0.0 | % | (482 | ) | -0.6 | % | |||||||||
| Net (loss) income attributable to B. Riley Financial, Inc. | $ | (5,801 | ) | -7.6 | % | $ | 1,058 | 1.4 | % | |||||||
| 39 |
Revenues
The table below and the discussion that follows are based on how we analyze our business.
| Year
Ended December 31, 2014 | Year
Ended December 31, 2013 | Change | ||||||||||||||||||||||
| Amount | % | Amount | % | Amount | % | |||||||||||||||||||
| Revenues - Services and Fees: | ||||||||||||||||||||||||
| Capital Markets segment | $ | 19,420 | 25.2 | % | $ | - | 0.0 | % | $ | 19,420 | n/m | |||||||||||||
| Auction and Liquidation segment | 17,166 | 22.3 | % | 32,409 | 42.6 | % | (15,243 | ) | -47.0 | % | ||||||||||||||
| Valuation and Appraisal segment | 30,671 | 39.7 | % | 27,558 | 36.2 | % | 3,113 | 11.3 | % | |||||||||||||||
| Subtotal | 67,257 | 87.2 | % | 59,967 | 78.8 | % | 7,290 | 12.2 | % | |||||||||||||||
| Revenues - Sale of goods | ||||||||||||||||||||||||
| Auction and Liquidation segment | 9,859 | 12.8 | % | 9,963 | 13.1 | % | (104 | ) | -1.0 | % | ||||||||||||||
| UK Retail Stores segment | - | n/m | 6,202 | 8.1 | % | (6,202 | ) | n/m | ||||||||||||||||
| Subtotal | 9,859 | 12.8 | % | 16,165 | 21.2 | % | (6,306 | ) | -39.0 | % | ||||||||||||||
| Total revenues | $ | 77,116 | 100.0 | % | $ | 76,132 | 100.0 | % | $ | 984 | 1.3 | % | ||||||||||||
n/m - Not applicable or not meaningful.
Total revenues increased $1.0 million to $77.1 million during the year ended December 31, 2014 from $76.1 million during the year ended December 31, 2013. The increase in revenues during the year ended December 31, 2014 was primarily due to an increase in revenues from services and fees of $7.3 million; offset by a decrease in revenues from the sale of goods of $6.3 million. The increase in revenues from services and fees of $7.3 million in 2014 was primarily due to an increase in revenues of $19.4 million from our capital markets segment which includes the operating results of the operations acquired from BRC Inc. for the period from June 18, 2014, the date of acquisition, through December 31, 2014 and an increase in revenues of $3.1 million in our valuation and appraisal segment. These increases were offset by a decrease in revenues from services and fees of $15.2 million in the auction and liquidation segment. The decrease in revenues from the sale of goods of $6.3 million in 2014 was comprised of a decrease in revenues of $0.1 million in the auction and liquidation segment and $6.2 million in the UK retail stores segment.
Revenues from services and fees in the capital markets segment were $19.4 million during the year ended December 31, 2014. These revenues included revenues for the period from June 18, 2014 to December 31, 2014 as a result of our acquisition of BRC Inc. Capital markets segment revenues include revenues from investment banking fees of $10.3 million, commissions and other income primarily earned from research, sales and trading of $7.8 million, and trading income of $1.3 million.
Revenues from services and fees in the auction and liquidation segment decreased $15.2 million, or 47.0%, to $17.2 million during the year ended December 31, 2014 from $32.4 million during the year ended December 31, 2013. The decrease in revenues of $15.2 million during the year ended December 31, 2014 was primarily due to (a) a decrease in revenues from services and fees from retail liquidation engagements of $13.7 million, (b) a decrease in revenues of $1.0 million from services and fees in our wholesale and industrial auction division and (c) a decrease in revenues of $0.5 million from real estate services and capital advisory services provided by our GA Capital division. The decrease in revenues from services and fees from retail liquidation engagements was primarily due to a decrease in the services and fees of $5.4 million from our retail liquidation operations in Europe that we restructured in the third quarter of 2014 and the accrual of a loss of $6.1 million for one retail liquidation engagement where we provided a minimum guarantee of amounts to be realized from the liquidation of inventory. In 2013, revenues from services and fees for retail liquidation engagements included revenues of $8.1 million for one retail liquidation engagement where we provided a minimum guarantee of amounts to be realized from the liquidation of inventory. The decrease in revenues from services and fees revenue in the wholesale and industrial auction business was primarily due to a decrease in number of engagements during 2014 as compared to the same period in 2013. The decrease in revenues from real estate services in 2014 was primarily due to a decrease in the number and size of real estate consulting engagements during 2014 as compared to the same period in 2013.
Revenues from services and fees in the valuation and appraisal segment increased $3.1 million, or 11.3%, to $30.7 million during the year ended December 31, 2014 from $27.6 million during the year ended December 31, 2013. The increase in revenues was primarily due increases of (a) $0.8 million related to appraisal engagements where we perform valuations for the monitoring of collateral for financial institutions, lenders, and private equity investors and (b) $2.4 million for appraisals of machinery and equipment and intellectual property. These increases were offset by a decrease in revenues of $0.1 million from our appraisal operations in the United Kingdom.
| 40 |
Sale of Goods, Cost of Goods Sold and Gross Margin
| Year Ended December 31, 2014 | Year Ended December 31, 2013 | |||||||||||||||||||||||
| Auction and | UK Retail | Auction and | UK Retail | |||||||||||||||||||||
| Liquidation | Stores | Liquidation | Stores | |||||||||||||||||||||
| Segment | Segment | Total | Segment | Segment | Total | |||||||||||||||||||
| Revenues - Sale of Goods | $ | 9,859 | $ | - | $ | 9,859 | $ | 9,963 | $ | 6,202 | $ | 16,165 | ||||||||||||
| Cost of Goods Sold | 14,080 | - | 14,080 | 7,940 | 3,566 | 11,506 | ||||||||||||||||||
| Gross margin | $ | (4,221 | ) | $ | - | $ | (4,221 | ) | $ | 2,023 | $ | 2,636 | $ | 4,659 | ||||||||||
| Gross margin percentage | -42.8 | % | n/a | -42.8 | % | 20.3 | % | 42.5 | % | 28.8 | % | |||||||||||||
n/a - Not applicable.
Total revenues from the sale of goods decreased by $6.3 million, or 39.0%, to $9.9 million during the year ended December 31, 2014 from $16.2 million during the year ended December 31, 2013. The decrease in revenues from the sales of goods in 2014 was comprised of a $0.1 million decrease in revenues from the sale of goods in the auction and liquidation segment and $6.2 million decrease in revenues in our former UK retail stores segment. The decrease in revenues from the sale of goods in the auction and liquidation segment was primarily due to a slight decrease in the value of goods sold in 2014 as compared to 2013. The decrease in revenues from the sale of the sale of goods in our former UK retail store segment was due to the fact we did not operate in our former UK retail store segment in 2014 as discussed above.
Revenues from the sale of goods in our wholesale and industrial auction business decreased $0.1 million, to $9.9 million during the year ended December 31, 2014 from $10.0 million during the year ended December 31, 2013. Gross margin from the sales of goods where we held title in the auction and liquidation segment decreased to (42.8%) during the year ended December 31, 2014 as compared to a gross margin of 20.3% during the year ended December 31, 2013. The gross margin in 2014 was negatively impacted by $2.9 million of impairment and inventory valuation charges in the fourth quarter of 2014 and $1.7 million of inventory valuation charges during the third quarter of 2014. The impairment and inventory valuation charges in the fourth quarter of 2014 were comprised of a $1.2 million impairment charge we incurred as a result of the expiration of the lease finance receivable on December 15, 2014 and an inventory valuation charge of $2.1 million related to another oil rig and aircraft parts that are included in goods held for sale at December 31, 2014. The $1.7 million impairment charge in the third quarter of 2014 was incurred to write down the carrying value of certain goods held for sale or auction relating to machinery and equipment that we sold at auction in the third quarter of 2014.
We did not have any revenues or cost of goods sold in our former UK retail stores segment during the year ended December 31, 2014 as the operating results of Shoon are not consolidated for any periods after July 31, 2013 and we no longer operate in the UK retail stores segment. Revenues from the operation of ten retail stores and internet operations of Shoon in the United Kingdom for the year ended December 31, 2013 were $6.2 million and cost of goods sold for such period was $3.6 million. The gross margin for such sales was 42.5% for the year ended December 31, 2013.
Operating Expenses
Direct Costs of Services. Direct cost of services and direct cost of services measured as a percentage of revenues – services and fees by segment during the years ended December 31, 2014 and 2013 are as follows:
| Year Ended December 31, 2014 | Year Ended December 31, 2013 | |||||||||||||||||||||||
| Auction and | Valuation and | Auction and | Valuation and | |||||||||||||||||||||
| Liquidation | Appraisal | Liquidation | Appraisal | |||||||||||||||||||||
| Segment | Segment | Total | Segment | Segment | Total | |||||||||||||||||||
| Revenues - Services and fees | $ | 17,166 | $ | 30,671 | $ | 32,409 | $ | 27,558 | ||||||||||||||||
| Direct cost of services | 10,719 | 12,747 | $ | 23,466 | 11,120 | 13,026 | $ | 24,146 | ||||||||||||||||
| Gross margin on services and fees | $ | 6,447 | $ | 17,924 | $ | 21,289 | $ | 14,532 | ||||||||||||||||
| Gross margin percentage | 37.6 | % | 58.4 | % | 65.7 | % | 52.7 | % | ||||||||||||||||
Total direct costs decreased $0.6 million, to $23.5 million during the year ended December 31, 2014 from $24.1 million during the year ended December 31, 2013. Direct costs of services in the auction and liquidation segment decreased $0.4 million to $10.7 million during the year ended December 31, 2014 from $11.1 million during the year ended December 31, 2013. The decrease in expenses was primarily due to a decrease in 2014 in the number of fee and commission type engagements where we contractually bill fees, commissions and reimbursable expenses as compared to the same period in 2013. Direct costs of services in the valuation and appraisal segment decreased $0.3 million, to $12.7 million during the year ended December 31, 2014 from $13.0 million during the year ended December 31, 2013. The decrease in direct costs of services in the valuation and appraisal segment was primarily due to a slight decrease in headcount from productivity and efficiencies we gained in 2014.
| 41 |
Gross margin in the auction and liquidation segment for services and fees decreased to 37.6% of revenues during the year ended December 31, 2014, as compared to 65.7% of revenues during the year ended December 31, 2013. The decrease in the gross margin during the year ended December 31, 2014 was primarily due to the accrual of a loss of $6.1 million for one retail liquidation engagement where we provided a minimum guarantee of amounts to be realized from the liquidation of inventory. Conversely, the gross margin in the auction and liquidation segment in 2013 was favorably impacted by revenues earned from one retail liquidation engagement where we earned revenues of $8.1 million.
Gross margins in the valuation and appraisal segment increased to 58.4% of revenues during the year ended December 31, 2014 as compared to 52.7% of revenues during the year ended December 31, 2013. The increase in the gross margin is primarily to due to the increased productivity we experienced during the year ended December 31, 2014 from the increase in business and revenues from the appraisals for machinery and equipment as compared to the same period in 2013.
Selling, General and Administrative Expenses. Selling, general and administrative expenses during the years ended December 31, 2014 and 2013 were comprised of the following:
Selling, General and Administrative Expenses by Segment
(Dollars in thousands)
| Year
Ended December 31, 2014 | Year
Ended December 31, 2013 | Change | ||||||||||||||||||||||
| Amount | % | Amount | % | Amount | % | |||||||||||||||||||
| Capital Markets segment | $ | 14,378 | 32.3 | % | $ | - | n/a | $ | 14,378 | n/a | ||||||||||||||
| Auction and Liquidation segment | 8,588 | 19.3 | % | 12,065 | 33.2 | % | (3,477 | ) | -28.8 | % | ||||||||||||||
| Valuation and Appraisal segment | 10,872 | 24.5 | % | 8,861 | 24.4 | % | 2,011 | 22.7 | % | |||||||||||||||
| UK Retail Stores segment | - | n/a | 3,818 | 10.5 | % | (3,818 | ) | -100.0 | % | |||||||||||||||
| Corporate and Other segment | 10,615 | 23.9 | % | 11,638 | 31.9 | % | (1,023 | ) | -8.8 | % | ||||||||||||||
| Total selling, general & administrative expenses | $ | 44,453 | 100.0 | % | $ | 36,382 | 100.0 | % | $ | 8,071 | 22.2 | % | ||||||||||||
Total selling, general and administrative expenses increased $8.1 million, or 22.2%, to $44.5 million during the year ended December 31, 2014 from $36.4 million for the year ended December 31, 2013. The increase was primarily due to an increase in selling, general and administrative expenses of $14.4 million in the capital markets segment as a result of the acquisition of BRC Inc. on June 18, 2014 and an increase in selling, general and administrative expenses of $2.0 million in the valuation and appraisal segment. These increases were offset by decreases of (a) $3.5 million in the auction and liquidation segment, (b) $3.8 million in our former UK retail stores segment as a result of no longer operating Shoon and (c) $1.0 million in corporate and other.
Selling, general and administrative expenses in the capital markets segment were $14.4 million during the year ended December 31, 2014. These operating expenses include the operating expenses of BRC Inc. for the period from June 18, 2014, the date of acquisition, through December 31, 2014. There were no expenses in the prior year comparable period as BRC Inc. was acquired on June 18, 2014.
Selling, general and administrative expenses in the auction and liquidation segment decreased $3.5 million, or 28.8%, to $8.6 million during the year ended December 31, 2014 from $12.1 million for the year ended December 31, 2013. The decrease was primarily due to a decrease in payroll and related expenses of $2.0 million and other operating expenses of $1.0 million from our retail liquidation and wholesale and industrial operations in the United States and a decrease in expenses of $0.4 million from our retail liquidation operations in the United Kingdom that we restructured in 2014 as compared to the same period in 2013.
Selling, general and administrative expenses in the valuation and appraisal segment increased $2.0 million, or 22.7%, to $10.9 million during year ended December 31, 2014 from $8.9 million for the year ended December 31, 2013. The increase was primarily due to an increase in administrative functions in the valuation and appraisal segment and an increase in operating expenses in our valuation and appraisal business in Europe prior to the restructuring of such operations described above.
Selling, general and administrative expenses for our former UK retail stores segment was $3.8 million during the year ended December 31, 2013 which related to the operations of Shoon that was deconsolidated for financial reporting purposes in August 2013.
Selling, general and administrative expenses for corporate and other decreased $1.0 million, or 8.8%, to $10.6 million during the year ended December 31, 2014 from $11.6 million for the year ended December 31, 2013. The decrease was primarily due to a decrease in payroll and related expenses of $1.4 million for contractually required severance costs related to the departure of our former chief financial officer in April 2013 and a decrease of $1.2 million, as a result of the restructuring in the third quarter of 2014 which resulted in a reduction of corporate headcount and the closure of our office in Deerfield, Illinois. These decreases were primarily offset by transaction expenses of $1.0 million for legal and professional fees related to the acquisition of BRC Inc. on June 18, 2014 and an increase in compensation expense of $0.5 million for the redemption of one of the noncontrolling interests related to our appraisal business.
| 42 |
Restructuring Charge. During the year ended December 31, 2014, we incurred a restructuring charge of $2.5 million. The restructuring charge was primarily for the costs we incurred from a reduction in force from some of our corporate employees and a significant number of our employees in the United Kingdom and the closure of one of our offices in Deerfield, Illinois as discussed above.
Other Income (Expense). Other income included interest income of less than $0.1 million during the year ended December 31, 2014 and 2013. In 2013, other income (expense) also included a loss of $0.2 million related to our equity investments in Great American Real Estate, LLC and Shoon.
Interest Expense. Interest expense was $1.3 million during the year ended December 31, 2014 as compared to $2.7 million during the year ended December 31, 2013. The decrease in interest expense during the year ended December 31, 2014 was primarily due to a decrease in interest expense as a result of the early repayment of a portion of the principal balance of the related party notes payable that accrued interest at 12.0% in January 2014, the retirement of $48.8 million of face amount of long-term debt payable to Andrew Gumaer and Harvey Yellen on June 5, 2014 and the repayment of the remaining principal balance of the related party notes payable of $1.0 million on July 31, 2014 as more fully discussed in Note 11 to the consolidated financial statements.
(Loss) Income Before Income Taxes. Loss before income taxes was $8.7 million during the year ended December 31, 2014 as compared to income before income taxes of $1.3 million during the year ended December 31, 2013. The increase in the loss of $10.0 million during the year ended December 31, 2014 was primarily due to the operating loss generated in the auction and liquidation segment of $6.4 million and the $2.5 million restructuring charge we recorded in the third quarter of 2014 discussed above.
Benefit (Provision) For Income Taxes. Benefit for income taxes was $2.9 million during the year ended December 31, 2014 compared to a provision for income taxes of $0.7 million during the year ended December 31, 2013. The effective income tax rate was a benefit of 33.2% during the year ended December 31, 2014 compared to an effective income tax rate of 55.0% during the year ended December 31, 2013. The benefit for income taxes in 2014 was negatively impacted by non-deductible transactions costs incurred in connection with the acquisition of BRC Inc. on June 18, 2014.
Net Income (Loss) Attributable to Noncontrolling Interests. Net income attributable to noncontrolling interests represents the proportionate share of net income generated by Great American Global Partners, LLC in 2014 that we do not own. In 2013, the net loss attributable to noncontrolling interests represents the proportionate share of net loss generated by Shoon and Great American Global Partners, LLC that we do not own. During the year ended December 31, 2014, net income attributable to noncontrolling interests was $0.1 million compared to a net loss attributable to noncontrolling interests of $0.5 million during the year ended December 31, 2013.
Net Income (Loss) Attributable to the Company. Net loss attributable to the Company for the year ended December 31, 2014 was $5.8 million compared to net income of $1.1 million during the year ended December 31, 2013. The increase in net loss during the year ended December 31, 2014 as compared to the same period in 2013 was primarily due to a decrease in operating income in the auction and liquidation segment as discussed above and the impact of the restructuring charge of $2.5 million as more fully described above.
Liquidity and Capital Resources
Our operations are funded through a combination of existing cash on hand, cash generated from operations, proceeds from the private placement of common stock, borrowings under our revolving credit facility and special purposes financing arrangements. On June 5, 2014, we completed the Private Placement and raised net proceeds of $51.2 million. During the year ended December 31, 2015 we generated net income of $11.8 million and during the year ended December 31, 2014 we generated a net loss of $5.8 million. During the year ended December 31, 2013 we generated net income of $1.1 million. Our cash flows and profitability are impacted by the number and size of retail liquidation and capital markets engagements performed on a quarterly and annual basis. Prior to the Private Placement and use of $30.2 million of the proceeds from the Private Placement to repay the long-term debt payable to Andrew Gumaer and Harvey Yellen on June 5, 2014, both of whom were executive officers and directors of the Company at the time of such repayment, our cash flow from operations were impacted by the interest expense and debt service requirements on such debt. The $30.0 million principal payment and then outstanding accrued interest of $0.2 million retired the entire $48.8 million face amount of the long-term debt at a discount of $18.8 million. In 2014, the discount of $18.8 million has been recorded as a capital contribution to additional paid in capital in our consolidated financial statements.
As of December 31, 2015, we had $30.0 million of unrestricted cash, $0.1 million of restricted cash, net investments in securities of $24.8 million, and $0.3 million of borrowings outstanding on our revolving credit facility. We believe that our current cash and cash equivalents, funds available under our asset based credit facility and cash expected to be generated from operating activities will be sufficient to meet our working capital and capital expenditure requirements for at least the next 12 months. We continue to monitor our financial performance to ensure sufficient liquidity to fund operations and execute on our business plan.
| 43 |
From time to time, we may decide to pay dividends which will be dependent upon our financial condition and results of operations. During the year ended December 31, 2015, we paid cash dividends of $5.2 million on our common stock. Our Board of Directors may reduce or discontinue the payment of dividends at any time for any reason it deems relevant. The declaration and payment of any future dividends or repurchases of our common stock will be made at the discretion of our Board of Directors and will be dependent upon our financial condition, results of operations, cash flows, capital expenditures, and other factors that may be deemed relevant by our Board of Directors.
Our principal sources of liquidity to finance our business is our existing cash on hand, cash flows generated from operating activities, funds available under revolving credit facilities and special purpose financing arrangements.
| Year Ended December 31, | ||||||||||||
| 2015 | 2014 | 2013 | ||||||||||
| (Dollars in thousands) | ||||||||||||
| Net cash provided by (used in): | ||||||||||||
| Operating activities | $ | 31,671 | $ | (23,030 | ) | $ | (2,492 | ) | ||||
| Investing activities | 4,918 | (3,667 | ) | 5,482 | ||||||||
| Financing activities | (28,050 | ) | 29,469 | (3,075 | ) | |||||||
| Effect of foreign currecy on cash | (127 | ) | (39 | ) | 231 | |||||||
| Net increase in cash and cash equivalents | $ | 8,412 | $ | 2,733 | $ | 146 | ||||||
Year Ended December 31, 2015 Compared to Year Ended December 31, 2014
Cash provided by operating activities was $31.7 million for the year ended December 31, 2015 compared to cash used in operating activities of $23.0 million in the year ended December 31, 2014. Cash provided by operating activities in the year ended December 31, 2015 includes net income of $13.6 million adjusted for noncash items and changes in operating assets and liabilities. The increase in cash provided by operating activities of $54.7 million in 2015 was primarily due (a) an increase in net income to $13.6 million in 2015 from the net loss of $5.8 million during the year ended December 31, 2014, (b) an increase in non-cash charges and other items of $5.0 million, and (c) changes in operating assets and liabilities that generated an increase of $30.1 million in cash flows from operations in 2015 as compared to 2014.
Cash provided by investing activities was $4.9 million for the year December 31, 2015 compared to cash used by investing activities of $3.7 million for the year ended December 31, 2014. During the year ended December 31, 2015, cash provided by investing activities was primarily comprised of cash provided from a $7.6 million decrease in restricted cash, offset by $0.3 million of cash used to purchase property and equipment and $2.5 million of cash used in connection with the acquisition of MK Capital. During the year ended December 31, 2014, cash used in investing activities was primarily comprised of (a) a $7.3 million increase in restricted cash and (b) $0.3 million of cash used to purchase property and equipment, offset by (i) $2.7 million of cash acquired from the acquisition of BRC Inc. and (ii) $1.2 million of cash collected from the note receivable – related party.
Cash used in financing activities was $28.1 million during the year ended December 31, 2015 compared to cash provided by financing activities of $29.5 million during the year ended December 31, 2014. During the year ended December 31, 2015, cash used in financing activities primarily consisted of (a) $18.5 million used to repay the balance outstanding on our asset based credit facility, (b) $5.2 million of dividends paid on our common stock, (c) $4.0 million of distributions to noncontrolling interests, and (d) $0.5 million of cash used to pay employment taxes on the vesting of restricted stock, offset by $0.2 million of cash proceeds from borrowings under our revolving credit facility. During the year ended December 31, 2014, cash provided by financing activities primarily consisted of proceeds of $51.2 million from the Private Placement, and borrowings of $12.8 million under our asset based credit facility, offset by cash of (a) $0.3 million of repayments under our revolving credit facility, (b) $31.7 million used to repay principal payments on our notes payable to related parties, (c) $0.5 million to pay dividends on our common stock and (d) $2.1 million used to repay other notes payable and make distributions to noncontrolling interests.
Year Ended December 31, 2014 Compared to Year Ended December 31, 2013
Cash used in operating activities was $23.0 million for the year ended December 31, 2014 compared to cash used in operating activities of $2.5 million in the year ended December 31, 2013. Cash used in operating activities in the year ended December 31, 2014 includes our net loss adjusted for noncash items and changes in operating assets and liabilities. The increase in cash used in operating activities in 2014 of $20.5 million was primarily due (a) a decrease in our net income of $6.4 million from $0.6 million during the year ended December 31, 2013 to a net loss of $5.8 million for the year ended December 31, 2014 and (b) the use of $16.0 million of cash to purchase marketable securities for our trading portfolio in our capital markets segment; offset by other changes in operating assets, liabilities and non-cash items of $2.0 million.
| 44 |
Cash used in investing activities was $3.7 million for the year ended December 31, 2014 compared to cash provided by investing activities of $5.5 million in 2013. During the year ended December 31, 2014, cash used in investing activities was primarily comprised of (a) a $7.3 million increase in restricted cash and (b) $0.3 million of cash used to purchase property and equipment, offset by (i) $2.7 million of cash acquired from the acquisition of BRC Inc. and (ii) $1.2 million of cash collected from the note receivable – related party. During the year ended December 31, 2013, cash provided by investing activities was primarily comprised of (a) a $7.6 million decrease in restricted cash and (b) $0.6 million of cash collected from the note receivable – related party, offset by $1.2 million of cash used to purchase property and equipment and $1.6 million from the deconsolidation of Shoon.
Cash provided by financing activities was $29.5 million during the year ended December 31, 2014 compared to cash used in financing activities of $3.1 million in the year ended December 31, 2013. During the year ended December 31, 2014, cash provided by financing activities primarily consisted of proceeds of $51.2 million from the Private Placement, and borrowings of $12.8 million under our asset based credit facility, offset by cash of (a) $0.3 million of repayments under our revolving credit facility, (b) $31.7 million used to repay principal payments on our notes payable to related parties, (c) $0.5 million to pay dividends on our common stock and (d) $2.1 million used to repay other notes payable and make distributions to noncontrolling interests. During the year ended December 31, 2013, cash used in financing activities primarily consisted of $2.8 million for the repayment of borrowings under our notes payable, $2.0 million of repayments on our accounts receivable revolving line of credit, $1.7 million of principal payments on the notes payable to related parties, $1.9 million of distributions to noncontrolling interests, offset by borrowings of $5.7 million on our asset based credit facility that was utilized to purchase goods held for sale or auction in our wholesale and industrial operations.
Contingent Consideration
In connection with the acquisition of MK Capital on February 2, 2015 for a total purchase price of $9.4 million, at closing $2.5 million of the purchase price was paid in cash and 333,333 newly issued shares of the Company’s common stock with a fair value of $2.7 million were issued to the former members of MK Capital. The purchase agreement also requires the payment of contingent consideration in the form of future cash payments with a fair value of $2.2 million and the issuance of shares of common stock with a fair value of $2.0 million. The contingent cash consideration of $2.2 million payable to the former members of MK Capital represents the fair value of the contingent cash consideration of $1.25 million due on the first anniversary date of the closing (February 2, 2016) and a final cash payment of $1.25 million due on the second anniversary date of the closing (February 2, 2017), with imputed interest expense calculated at 8% per annum. The contingent stock consideration of $2.0 million is comprised of the issuance of 166,667 shares of common stock on the first anniversary date of the closing (February 2, 2016) and 166,666 shares of common stock on the second anniversary date of the closing (February 2, 2017). The contingent cash and stock consideration is payable on the first and second anniversary dates of the closing provided that MK Capital generates a minimum amount of gross revenues as defined in the purchase agreement for the twelve months following the first and second anniversary dates of the closing. The contingent cash consideration and contingent stock consideration for the first such installment was paid and issued on February 2, 2016.
Credit Agreements
From time to time, we utilize our asset based credit facility to fund costs and expenses incurred in connection with liquidation engagements. We also utilize this credit facility in order to issue letters of credit in connection with liquidation engagements conducted on a guaranteed basis. Subject to certain limitations and offsets, we are permitted to borrow up to $100.0 million under the credit facility, less the aggregate principal amount borrowed under the UK Credit Agreement (if in effect), and the maturity date has been extended from July 16, 2013 to July 15, 2018. Borrowings under the credit facility are only made at the discretion of the lender and are generally required to be repaid within 180 days. The interest rate for each revolving credit advance under the related credit agreement is, subject to certain terms and conditions, equal to the LIBOR plus a margin of 2.25% to 3.25% depending on the type of advance and the percentage such advance represents of the related transaction for which such advance is provided. On March 19, 2014, the Company entered into a separate credit agreement (a “UK Credit Agreement”) with an affiliate of Wells Fargo Bank, National Association which provides for the financing of transactions in the United Kingdom. The facility allows the Company to borrow up to 50 million British Pounds. Any borrowings on the UK Credit Agreement reduce the availability on the asset based $100,000 credit facility. The UK Credit Agreement is cross collateralized and integrated in certain respects with the Credit Agreement. The credit facility is secured by the proceeds received for services rendered in connection with the liquidation service contracts pursuant to which any outstanding loan or letters of credit are issued and the assets that are sold at liquidation related to such contract, if any. The credit facility also provides for success fees in the amount of 5% to 20% of the net profits, if any, earned on liquidation engagements that are financed under the credit facility as set forth in the related credit agreement. We typically seek borrowings on an engagement-by- engagement basis. The credit agreement governing the credit facility contains certain covenants, including covenants that limit or restrict the Company’s ability to incur liens, incur indebtedness, make investments, dispose of assets, make certain restricted payments, merge or consolidate and enter into certain transactions with affiliates. At December 31, 2015, there were no borrowings or letters of credits outstanding under the credit facility. At December 31, 2014, the outstanding balance under the credit facility for borrowings was $18.5 and there were letters of credit outstanding for two retail liquidation engagements in the amount of $8.6 million.
| 45 |
On May 29, 2008, GAGEE entered into a credit agreement to finance the purchase of oil rigs and other equipment related to the oil exploration business to be sold at auction or liquidation. Under the original credit agreement, the principal amount of the loan was $12.0 million and borrowings bear interest at a rate of 20% per annum. The loan is collateralized by the oil rigs and other equipment related to the oil exploration business that was purchased with the proceeds from the loan. GAGEE is required to make principal and interest payments from proceeds from the sale of the oil rigs and other equipment related to the oil exploration business. GAGEE is a special purpose entity created to purchase the oil rigs and other equipment related to the oil exploration business, whose assets consist only of the oil rigs and other equipment related to the oil exploration business in question and whose liabilities are limited to the lenders’ note and certain operational expenses related to this transaction. Pursuant to further amendments to the credit agreement for which the most recent amendment was effective December 31, 2013 the maturity date of the note payable was extended to June 30, 2015 with an interest rate of 0% through maturity. Such amendments to such credit agreement also provided for the lender to reimburse GAGEE for certain expenses from proceeds of the sale or lease of the assets that collateralize the note payable. During the year ended December 31, 2014, the lease payments collected from the lease of four oil rigs was used to reduce the outstanding note payable balance by $0.3 million, to $6.6 million at December 31, 2014. Great American Group, LLC guaranteed GAGEE’s liabilities to the lenders up to a maximum of $1.2 million. Great American Group, LLC made a payment of $1.2 million on October 9, 2009 in full satisfaction of its guaranty under the credit agreement, which reduced the principal amount of borrowings and interest due under the credit agreement. The credit agreement does not provide for other recourse against us, Great American Group, LLC or any of our other subsidiaries.
On January 11, 2015, GAGEE filed a voluntary petition with the United States Bankruptcy Court for the Northern District of Texas for relief under Chapter 7 of Title 11 of the United States Code (as amended, the “Bankruptcy Code”). At December 31, 2014, GAGEE had total assets of $6.5 million and total liabilities of $6.6 million. Total assets included $2.5 million of other receivables included in prepaid and other current assets and $4.0 million of goods held for sale which was comprised of five oil rigs as of December 31, 2014. Total liabilities at December 31, 2014 included the $6.6 million of notes payable discussed above that was collateralized by the assets of GAGEE. As a result of such bankruptcy filing, the assets and liabilities of GAGEE described are no longer consolidated in our consolidated financial statements for periods subsequent to such bankruptcy filing. The loss on deconsolidation of GAGEE was less than $0.1 million during the year ended December 31, 2015. On June 29, 2015, the trustee handling the bankruptcy case for GAGEE was discharged and the bankruptcy case was closed. As a result of this process, the Lenders are proceeding with the disposition of the assets of GAGEE in accordance with their security interest in connection with their loan. At the present time, the Company does not have any remaining investment or any obligations with respect to GAGEE’s liabilities. The Company intends to dissolve GAGEE and wind up its business. If any future expenses or losses are incurred by GAGEE during its wind up, the Company will record its share of losses under the equity method of accounting. Management does not expect these events or any subsequent related actions regarding GAGEE will have a material impact on the consolidated financial position of the Company.
Accounts Receivable Line of Credit
On May 17, 2011, one of our majority owned subsidiaries entered into an Accounts Receivable Line of Credit with a finance company. Proceeds from the Accounts Receivable Line of Credit were used to pay off borrowings under the factoring agreement. The Accounts Receivable Line of Credit is collateralized by the accounts receivable of our majority owned subsidiary and allows for borrowings in the amount of 85% of the net face amount of prime accounts, as defined in the Accounts Receivable Line of Credit, with maximum borrowings not to exceed $2.0 million. The interest rate under the Accounts Receivable Line of Credit is the prime rate plus 2%, payable monthly in arrears. The Accounts Receivable Line of Credit was amended effective February 3, 2012 and the maximum borrowings allowed increased from $2.0 million to $3.0 million. On December 7, 2015, the Company notified the finance company to terminate the line of credit upon maturity on February 3, 2016. In connection with the Accounts Receivable Line of Credit, Great American Group, LLC entered into a limited continuing guaranty of our majority owned subsidiary’s obligations under the Accounts Receivable Line of Credit. Borrowings outstanding under the Accounts Receivable Line of Credit were $0.3 million and $0.1 million at December 31, 2015 and 2014, respectively.
Promissory Notes and Other Borrowings
As of December 31, 2013, there was $48.8 million in aggregate principal amount outstanding owed to Andrew Gumaer, a member of our Board of Directors and an executive officer, and Harvey Yellen, a former director and executive officer, all of which accrued interest at 3.75%. In addition, there was $1.7 million in aggregate principal amount outstanding payable to other related parties, $1.0 million of which accrued interest at 3.75% and $0.7 million of which accrue interest at 12.0%. On January 31, 2014, the Company paid in full the $0.7 million of principal balance for the notes that had the 12.0% interest rate. The remaining $1.0 million principal amount payable had a maturity date of July 31, 2014. The $48.8 million principal amount payable to Messrs. Gumaer and Yellen had a maturity date of July 31, 2018.
| 46 |
On June 5, 2014, we used $30.2 million of the net proceeds from the Private Placement to repay the principal amount and accrued interest owing to Messrs. Gumaer and Yellen. The $30.0 million principal payment and then outstanding accrued interest of $0.2 million retired the entire $48.8 million face amount of such outstanding notes. The discount of $18.8 million for the repayment of the notes payable was recorded as a capital contribution to additional paid in capital in our consolidated financial statements. On July 31, 2014, the remaining outstanding principal amount of $1.0 million was paid in full to the other related parties. As of August 1, 2014, there is no remaining outstanding principal or interest payable on the notes payable to related parties.
In March 2015, we had capital deployed for three retail liquidation engagements. On March 10, 2015, the Company borrowed $4.5 million from Riley Investment Partners, L.P. (“RIP”) in accordance with RIP Note. The principal amount of $4.5 million for the RIP Note accrued interest at the rate of 10% per annum (or 15% in the event of a default under the RIP Note). The borrowings were for short-term working capital needs and capital for other retail liquidation engagements. RIP was also entitled to the Success Fee of 20% of the net profit, if any, earned by the Company in connection with a designated liquidation transaction. Pursuant to the terms of the RIP Note, under no circumstances was the Company obligated to pay to RIP any portion of the combined amount of interest and the Success Fee which exceeded twelve percent (12%) of the $4.5 million principal amount of the RIP Note. The outstanding principal amount, together with the accrued and unpaid interest and the Success Fee, were due and payable by the Company on March 9, 2016. The RIP Note was subordinated in certain respects to the Company’s guaranty relating to its existing credit facility with Wells Fargo Bank, National Association and, in the event of certain insolvency proceedings, with respect to such credit facility itself, as well as to any other indebtedness of the Company to the extent required by the documents governing the repayment thereof. Interest expense on the RIP Note totaled $194 for the year ended December 31, 2015, which includes success fees of $126. The RIP Note was repaid on May 4, 2015.
Riley Investment Management LLC, a wholly owned subsidiary of the Company, is the general partner of RIP. Bryant Riley, the Chief Executive Officer and Chairman of the Board of Directors of the Company, owns or controls approximately 45% of the equity interests of RIP. In addition, Thomas Kelleher, the President and a director of the Company, and one other employee of the Company, own or control de minimis amounts of the equity interests of RIP. After considering the economic interests of Mr. Riley and Mr. Kelleher in the RIP Note and comparing the terms of the RIP Note to terms that may have been available from unaffiliated third parties, the disinterested members of the Company’s Board of Directors unanimously approved the issuance of the RIP Note.
Off Balance Sheet Arrangements
We have no obligations, assets or liabilities which would be considered off-balance sheet arrangements and do not participate in transactions that create relationships with unconsolidated entities or financial partnerships, often referred to as variable interest entities, established for the purpose of facilitating off-balance sheet arrangements. We have not guaranteed any debt or commitments of other entities or entered into any options on non-financial assets.
Dividends
On October 29, 2014, our Board of Directors approved a dividend of $0.03 per share, which was paid on December 9, 2014 to stockholders of record on November 18, 2014. On May 4, 2015, the Company’s Board of Directors approved a dividend of $0.06 per share, which was paid on or about June 12, 2015 to stockholders of record on May 22, 2015. On August 10, 2015, the Company’s Board of Directors approved a dividend of $0.20 per share, which was paid on or about September 10, 2015 to stockholders of record on August 25, 2015. On November 9, 2015, our Board of Directors approved a dividend of $0.06 per share, which was paid on or about December 9, 2015 to stockholders of record on November 24, 2015. Our Board of Directors may reduce or discontinue the payment of dividends at any time for any reason it deems relevant. The declaration and payment of any future dividends or repurchases of our common stock will be made at the discretion of our Board of Directors and will be dependent upon our financial condition, results of operations, cash flows, capital expenditures, and other factors that may be deemed relevant by our Board of Directors.
Contractual Obligations
The following table sets forth aggregate information about our contractual obligations as of December 31, 2015 and the periods in which payments are due:
| Payments due by period | ||||||||||||||||||||
| Total | Less Than One Year | 1-3 Years | 4-5 Years | More Than 5 years | ||||||||||||||||
| (Dollars in thousands) | ||||||||||||||||||||
| Contractual Obligations | ||||||||||||||||||||
| Revolving credit facility, including interest | $ | 280 | $ | 280 | $ | — | $ | — | $ | — | ||||||||||
| Contingent consideration, including imputed interest | 2,500 | 1,250 | 1,250 | — | — | |||||||||||||||
| Operating lease obligations | 5,781 | 2,470 | 2,851 | 460 | — | |||||||||||||||
| Total | $ | 8,561 | $ | 4,000 | $ | 4,101 | $ | 460 | $ | — | ||||||||||
| 47 |
We anticipate that cash generated from operations and existing borrowing arrangements under our credit facility to fund costs and expenses incurred in connection with liquidation engagements should be sufficient to meet our cash requirements for at least the next twelve months. However, our future capital requirements will depend on many factors, including the success of our businesses in generating cash from operations, continued compliance with financial covenants contained in our credit facility, the timing of principal payments on our long-term debt and the capital markets in general, among other factors.
Critical Accounting Policies
Our financial statements and the notes thereto contain information that is pertinent to management’s discussion and analysis. The preparation of financial statements in conformity with accounting principles generally accepted in the United States of America (“GAAP”) requires management to make estimates and assumptions that affect the reported amounts of assets and liabilities and disclosures of contingent assets and liabilities. Management bases its estimates on historical experience and on various other assumptions that are believed to be reasonable under the circumstances, the results of which form the basis for making judgments about the carrying values of assets and liabilities that are not readily apparent from other sources. On a continual basis, management reviews its estimates utilizing currently available information, changes in facts and circumstances, historical experience and reasonable assumptions. After such reviews, and if deemed appropriate, management’s estimates are adjusted accordingly. Actual results may vary from these estimates and assumptions under different and/or future circumstances. Management considers an accounting estimate to be critical if:
| • | it requires assumptions to be made that were uncertain at the time the estimate was made; and |
| • | changes in the estimate, or the use of different estimating methods that could have been selected, could have a material impact on results of operations or financial condition. |
Use of Estimates. The preparation of financial statements in conformity with GAAP requires management to make estimates and assumptions that affect the reported amounts of assets, liabilities and disclosures of contingent assets and liabilities at the date of the financial statements and the reported amounts of revenues and expenses during the reporting period. Actual results could differ from those estimates. Estimates are used when accounting for certain items such as valuation of securities, reserves for accounts receivable and slow moving goods held for sale or auction, the carrying value of intangible assets and goodwill, the fair value of mandatorily redeemable noncontrolling interests and accounting for income tax valuation allowances. Estimates are based on historical experience, where applicable, and assumptions that management believes are reasonable under the circumstances. Due to the inherent uncertainty involved with estimates, actual results may differ.
Our significant accounting policies are described in Note 2 to the consolidated financial statements included elsewhere in this Annual Report. Management believes that the following critical accounting policies reflect the more significant estimates and assumptions used in the preparation of our financial statements.
Revenue Recognition. Revenues are recognized in accordance with the accounting guidance when persuasive evidence of an arrangement exists, the related services have been provided, the fee is fixed or determinable, and collection is reasonably assured.
Revenues in the capital markets segment are primarily comprised of (i) fees earned from corporate finance and investment banking services and (ii) revenues from sales and trading activities.
Fees earned from corporate finance and investment banking services are derived from debt, equity and convertible securities offerings in which we acted as an underwriter or placement agent and from financial advisory services rendered in connection with client mergers, acquisitions, restructurings, recapitalizations and other strategic transactions. Fees from underwriting activities are recognized in earnings when the services related to the underwriting transaction are completed under the terms of the engagement and when the income was determined and is not subject to any other contingencies.
Revenues from sales and trading includes (i) commissions resulting from equity securities transactions executed as agent or principal and are recorded on a trade date basis, (ii) related net trading gains and losses from market making activities and from the commitment of capital to facilitate customer orders, (iii) fees paid for equity research and (iv) principal transactions which include realized and unrealized net gains and losses resulting from our principal investments in equity and other securities for the Company’s account.
Revenues from wealth management services consist primarily of investment management fees that are recognized over the period the services are provided. Investment management fees are primarily comprised of fees for investment management services and are generally based on the dollar amount of the assets being managed.
Revenues in the valuation and appraisal segment are primarily comprised of fees for valuation and appraisal services. Revenues are recognized upon the delivery of the completed services to the related customers and collection of the fee is reasonably assured. Revenues in the valuation and appraisal segment also include contractual reimbursable.
| 48 |
Revenues in the auction and liquidation segment are comprised of (i) commissions and fees earned on the sale of goods at auctions and liquidations; (ii) revenues from auction and liquidation services contracts where we guarantees a minimum recovery value for goods being sold at auction or liquidation; (iii) revenue from the sale of goods that are purchased by us for sale at auction or liquidation sales events; (iv) fees earned from real estate services and the origination of loans; (v) revenues from financing activities is recorded over the lives of related loans receivable using the interest method; and (vi) revenues from contractual reimbursable expenses incurred in connection with auction and liquidation contracts.
Commission and fees earned on the sale of goods at auction and liquidation sales are recognized when evidence of an arrangement exists, the sales price has been determined, title has passed to the buyer and the buyer has assumed the risks of ownership, and collection is reasonably assured. The commission and fees earned for these services are included in.
Revenues earned from auction and liquidation services contracts where we guarantees a minimum recovery value for goods being sold at auction or liquidation are recognized based on proceeds received. We record proceeds received from these types of engagements first as a reduction of contractual reimbursable expenses, second as a recovery of its guarantee and thereafter as revenue, subject to such revenue meeting the criteria of having been fixed or determinable. Contractual reimbursable expenses and amounts advanced to customers for minimum guarantees are initially recorded as advances against customer contracts in the accompanying consolidated balance sheets. If, during the auction or liquidation sale, we determine that the proceeds from the sale will not meet the minimum guaranteed recovery value as defined in the auction or liquidation services contract, we will accrue a loss on the contract in the period that the loss becomes known.
We also evaluate revenue from auction and liquidation contracts in accordance with the accounting guidance to determine whether to report auction and liquidation segment revenue on a gross or net basis. We have determined that we act as an agent in a substantial majority of our auction and liquidation services contracts and therefore we report auction and liquidation revenues on a net basis.
Revenues from the sale of goods are recorded gross and are recognized in the period in which the sale of goods held for sale or auction are completed, title to the property passes to the purchaser and we have fulfilled our obligations with respect to the transaction. These revenues are primarily the result of us acquiring title to merchandise with the intent of selling the items at auction or for augmenting liquidation sales.
Revenues from sales-type leases are recorded as an asset at lease inception. The asset is recorded at the aggregate future minimum lease payments, estimated residual value of the leased equipment, and deferred incremental direct costs less unearned income. Income is recognized over the life of the lease to approximate a level rate of return on the net investment. During the year ended December 31, 2013, the terms of the lease agreement for four oil rigs was amended to, among other things, eliminate the right of the lessor to return the oil rigs to us. This amendment changed the classification of the lease from an operating lease to a sales-type lease and resulted in the recording of revenues from the sale of the oil during the year ended December 31, 2013.
Revenues from the sale of goods in our former UK retail stores segment are recognized as revenue upon the sale of product to retail customers through July 31, 2013. Our net sales represent gross sales invoiced to customers, less certain related charges for discounts, returns, and other promotional allowances and are recorded net of sales or value added tax. Allowances provided for these items are presented in the consolidated financial statements primarily as reductions to sales and cost of sales.
In the normal course of business, the Company will enter into collaborative arrangements with other merchandise liquidators to collaboratively execute auction and liquidation contracts. The Company’s collaborative arrangements specifically include contractual agreements with other liquidation agents in which the Company and such other liquidation agents actively participate in the performance of the liquidation services and are exposed to the risks and rewards of the liquidation engagement. The Company’s participation in collaborative arrangements including its rights and obligations under each collaborative arrangement can vary. Revenues from collaborative arrangements are recorded net based on the proceeds received from the liquidation engagement. Amounts paid to participants in the collaborative arrangements are reported separately as direct costs of revenues. Revenue from collaborative arrangements in which the Company is not the majority participant is recorded net based on the Company’s share of proceeds received.
Allowance for Doubtful Accounts. We maintain an allowance for doubtful accounts for estimated losses inherent in our accounts receivable portfolio. In establishing the required allowance, management utilizes a specific customer identification methodology. Management also considers historical losses adjusted for current market conditions and the customers’ financial condition, the amount of receivables in dispute, and the current receivables aging and current payment patterns. Account balances are charged off against the allowance after all means of collection have been exhausted and the potential for recovery is considered remote. The bad debt expense is included as a component of selling, general and administrative expenses in the accompanying consolidated statement of operations.
| 49 |
Goods Held for Sale or Auction. Goods held for sale or auction are stated at the lower of cost or market, determined by the specific-identification method. We write down slow-moving and obsolete goods held for sale or auction based on assessments of market conditions, demand for the goods to be sold at auction, comparable industry sales of similar types of goods, and in part on information obtained from appraisal reports prepared by outside specialists. If these factors were to become less favorable than those projected, additional write-downs of goods held for sale or auction could be required.
Goodwill and Other Intangible Assets. We account for goodwill and intangible assets in accordance with the accounting guidance which requires that goodwill and other intangibles with indefinite lives be tested for impairment annually or on an interim basis if events or circumstances indicate that the fair value of an asset has decreased below its carrying value.
Goodwill includes the excess of the purchase price over the fair value of net assets acquired in a business combinations and the acquisition of noncontrolling interests. The Codification requires that goodwill be tested for impairment at the reporting unit level (operating segment or one level below an operating segment). Application of the goodwill impairment test requires judgment, including the identification of reporting units, assigning assets and liabilities to reporting units, assigning goodwill to reporting units, and determining the fair value. The Company operates three reporting units, which are the same as its reporting segments described in Note 20 to the consolidated financial statements. Significant judgment is required to estimate the fair value of reporting units which includes estimating future cash flows, determining appropriate discount rates and other assumptions. Changes in these estimates and assumptions could materially affect the determination of fair value and/or goodwill impairment.
When testing goodwill for impairment, we may assess qualitative factors for some or all of our reporting units to determine whether it is more likely than not (that is, a likelihood of more than 50 percent) that the fair value of a reporting unit is less than its carrying amount, including goodwill. Alternatively, we may bypass this qualitative assessment for some or all of our reporting units and perform a detailed quantitative test of impairment (step 1). If we perform the detailed qualitative impairment test and the carrying amount of the reporting unit exceeds its fair value, we would perform an analysis (step 2) to measure such impairment. In 2015, we performed a qualitative assessment of the recoverability of our goodwill balances for each of our reporting units in performing our annual impairment test and concluded that the fair values of each of our reporting units exceeded their carrying values and no impairments were identified.
In accordance with the Codification, the Company reviews the carrying value of its intangibles, which is comprised of tradenames and customer lists, and other long-lived assets for impairment at least annually or whenever events or changes in circumstances indicate that the carrying amount of an asset may not be recoverable. Recoverability of long-lived assets is measured by comparing the carrying amount of the asset or asset group to the undiscounted cash flows that the asset or asset group is expected to generate. If the undiscounted cash flows of such assets are less than the carrying amount, the impairment to be recognized is measured by the amount by which the carrying amount of the asset or asset group, if any, exceeds its fair market value. No impairment was deemed to exist as of December 31, 2015.
Fair Value Measurements. The Company records securities owned, securities sold not yet purchased, and mandatorily redeemable noncontrolling interests that were issued after November 5, 2003 at fair value with fair value determined in accordance with the Codification. Financial instruments are measured at fair value on a recurring basis and are categorized using the three levels of fair value hierarchy. In general, fair values determined by Level 1 inputs utilize quoted prices (unadjusted) for identical instruments that are highly liquid, observable and actively traded in over-the-counter markets. Fair values determined by Level 2 inputs utilize inputs other than quoted prices included in Level 1 that are observable for the asset or liability, either directly or indirectly. Level 2 inputs include quoted prices for similar instruments in active markets, quoted prices for identical or similar instruments in markets that are not active and model-derived valuations whose inputs are observable and can be corroborated by market data. Level 3 inputs are unobservable inputs that are supported by little or no market activity and that are significant to the fair value of the assets or liabilities. In certain cases, the inputs used to measure fair value may fall into different levels of the fair value hierarchy. In such cases, the level in the fair value hierarchy within which the fair value measurement in its entirety falls has been determined based on the lowest level input that is significant to the fair value measurement in its entirety. Our assessment of the significance of a particular input to the fair value measurement in its entirety requires judgment, and considers factors specific to the asset or liability.
We determined the fair value of mandatorily redeemable noncontrolling interests described above based on the issuance of similar interest for cash, references to industry comparables, and relied, in part, on information obtained from appraisal reports and internal valuation models.
The carrying amounts reported in the consolidated financial statements for cash, restricted cash, accounts receivable, accounts payable and accrued expenses and other current liabilities approximate fair value based on the short-term maturity of these instruments. The carrying amounts of contingent consideration, notes payable (including credit lines used to finance liquidation engagements) and revilving credit facilities approximate fair value because the contractual interest rates or effective yields of such instruments are consistent with current market rates of interest for instruments of comparable credit risk.
| 50 |
Share-Based Compensation. The Company’s share based payment awards principally consist of grants of restricted stock and restricted stock units. Share based payment awards also include grants of membership interests in the Company’s majority owned subsidiaries. The grants of membership interests consist of percentage interests in the Company’s majority owned subsidiaries as determined at the date of grant. In accordance with the accounting guidance share based payment awards are classified as either equity or a liability. For equity-classified awards, the Company measures compensation cost for the grant of membership interests at fair value on the date of grant and recognizes compensation expense in the consolidated statement of operations over the requisite service or performance period the award is expected to vest. The fair value of the liability-classified award will be subsequently remeasured at each reporting date through the settlement date. Change in fair value during the requisite service period will be recognized as compensation cost over that period.
Income Taxes. The Company recognizes deferred tax liabilities and assets for the expected future tax consequences of events that have been included in the financial statements or tax returns. Deferred tax liabilities and assets are determined based on the difference between the financial statement and tax basis of assets and liabilities using enacted tax rates in effect for the year in which the differences are expected to reverse. The Company estimates the degree to which tax assets and credit carryforwards will result in a benefit based on expected profitability by tax jurisdiction, the eligible carryforward period, and other circumstances. A valuation allowance for such tax assets and loss carryforwards is provided when it is determined to be more likely than not that the benefit of such deferred tax asset will not be realized in future periods. Tax benefits of operating loss carryforwards are evaluated on an ongoing basis, including a review of historical and projected future operating results, the eligible carryforward period, and other circumstances. If it becomes more likely than not that a tax asset will be used, the related valuation allowance on such assets would be reduced.
The Company establishes a valuation allowance if, based on the weight of available evidence, it is more likely than not that some portion or all of the deferred tax assets will not be realized. Tax benefits of operating loss and tax credit carryforwards are evaluated on an ongoing basis, including a review of historical and projected future operating results, the eligible carryforward period, and other circumstances. As a result of the common stock offering that was completed on June 5, 2014, the Company had a more than 50% ownership shift in accordance with Internal Revenue Code Section 382. Accordingly, the Company is limited to the amount of net operating loss that may be utilized in future taxable years depending on the Company’s actual taxable income. As of December 31, 2015, the Company believes that the net operating loss that existed as of the more than 50% ownership shift will be utilized in future tax periods and it is more-likely-than-not that future taxable earnings will be sufficient to realize its deferred tax assets and has not provided an allowance.
New Accounting Standards
In February 2016, the Financial Accounting Standards Board (“FASB”) issued Accounting Standards Update (“ASU”) No. 2016-02: Leases (Topic 842) (“ASU 2016-02”). The amendments in this update require lessees, among other things, to recognize lease assets and lease liabilities on the balance sheet for those leases classified as operating leases under previous authoritative guidance. This update also introduces new disclosure requirements for leasing arrangements. ASU 2016-02 will be effective for the Company in fiscal year 2019, but early application is permitted. The Company is currently evaluating the impact of this update on the consolidated financial statements.
In November 2015, the FASB issued ASU 2015-17, Income Taxes (Topic 740): Balance Sheet Classification of Deferred Taxes, which simplifies the presentation of deferred income taxes by requiring deferred tax assets and liabilities be classified as noncurrent on the balance sheet. The updated standard is effective for the Company at the beginning of its first quarter 2017, with early application permitted as of the beginning of any interim or annual reporting period. The Company elected to early adopt this standard as of December 31, 2015, and retrospectively reclassified $6,420 of our current deferred tax assets to noncurrent deferred tax assets as of December 31, 2014.
In February 2015, the FASB issued ASU 2015-2, Consolidation (Topic 810): Amendments to the Consolidation Analysis, that provides guidance which makes targeted amendments to current consolidation guidance. Among other things, the standard changes the manner in which we would assesses one of the characteristics of variable interest entities (VIEs) and introduces a separate analyses specific to limited partnerships and similar entities for assessing if the equity holders at risk lack decision making. Limited partnerships and similar entities will be a VIE unless the limited partners hold substantive kick-out rights or participating rights. A right to liquidate an entity is akin to a kick-out right. Guidance for limited partnerships under the voting model has been eliminated. A limited partner and similar partners with a controlling financial interest obtained through substantive kick out rights would consolidate a limited partnership or similar entity. The guidance is effective for our annual and interim periods beginning in 2016. Early adoption is allowed. The Company does not expect the impact of this update to have a material impact on the consolidated financial statements.
In May 2014, the FASB issued ASU 2014-09, Revenue from Contracts with Customers, which amends revenue recognition requirements for multiple deliverable revenue arrangements. This update provides guidance on how revenue is recognized to depict the transfer of promised goods or services to customers in an amount that reflects the consideration to which the entity expects to be entitled in exchange for the goods or services. This determination is made in five steps: (i) identify the contract with the customer; (ii) identify the performance obligations in the contract; (iii) determine the transaction price; (iv) allocate the transaction price to the performance obligations in the contract; and (v) recognize revenue when (or as) the entity satisfies a performance obligation. The update is effective for annual reporting periods after December 15, 2016 and for interim reporting periods within that reporting period. Early adoption is not permitted. The Company has not yet adopted this update and is currently evaluating the impact it may have on its financial condition and results of operations.
| 51 |
| Item 7A. | QUANTITATIVE AND QUALITATIVE DISCLOSURES ABOUT MARKET RISK |
Not applicable.
| Item 8. | FINANCIAL STATEMENTS AND SUPPLEMENTARY DATA |
The information required by this Item 8 is submitted as a separate section on page F-1 of this Annual Report on Form 10-K.
| Item 9. | CHANGES IN AND DISAGREEMENTS WITH ACCOUNTANTS ON ACCOUNTING AND FINANCIAL DISCLOSURE |
None.
| 52 |
| Item 9A. | CONTROLS AND PROCEDURES |
Evaluation of Disclosure Controls and Procedures
We maintain a system of disclosure controls and procedures (as defined in the Rules 13a-15(e) and 15(d)-15(e) under the Securities Exchange Act of 1934, as amended (the “Exchange Act”)) that is designed to ensure that information required to be disclosed in our Exchange Act reports is recorded, processed, summarized and reported within the time periods specified in the Securities and Exchange Commission’s rules and forms, and that such information is accumulated and communicated to our management, including our Chief Executive Officer and Chief Financial Officer, as appropriate, to allow timely decisions regarding required disclosures.
Under the supervision and with the participation of our management, including our Chief Executive Officer and Chief Financial Officer, we conducted an evaluation of our disclosure controls and procedures. Based upon the foregoing evaluation, our Chief Executive Officer and our Chief Financial Officer concluded that as of December 31, 2015 our disclosure controls and procedures were effective at the reasonable assurance level.
There are inherent limitations to the effectiveness of any system of disclosure controls and procedures. These limitations include the possibility of human error, the circumvention or overriding of the controls and procedures and reasonable resource constraints. In addition, because we have designed our system of controls based on certain assumptions, which we believe are reasonable, about the likelihood of future events, our system of controls may not achieve its desired purpose under all possible future conditions. Accordingly, our disclosure controls and procedures provide reasonable assurance, but not absolute assurance, of achieving their objectives.
Changes in Our Controls
There have not been any changes in our internal control over financial reporting (as such term is defined in Rules 13a-15(f) and 15d-15(f) under the Exchange Act) during the fourth fiscal quarter to which this report relates that materially affected, or are reasonably likely to materially affect, our internal control over financial reporting.
Report of Management on Internal Control over Financial Reporting
Our management is responsible for establishing and maintaining adequate internal control over financial reporting (as such term is defined in Rules 13a-15(f) and 15d-15(f) under the Exchange Act). Under the supervision and with the participation of management, including our Chief Executive Officer and Chief Financial Officer, we conducted an evaluation of the effectiveness of our internal control over financial reporting based on criteria established in Internal Control—Integrated Framework issued by the Committee of Sponsoring Organizations of the Treadway Commission (2013 framework). Based on our evaluation, our management concluded that our internal control over financial reporting was effective as of December 31, 2015.
This Annual Report does not include an attestation report of our independent registered public accounting firm regarding internal control over financial reporting. Management’s report was not subject to attestation by our independent registered public accounting firm pursuant to the rules of the Securities and Exchange Commission that permit us to provide only management’s report in this Annual Report.
| Item 9B. | OTHER INFORMATION |
None.
| 53 |
| Item 10. | DIRECTORS, EXECUTIVE OFFICERS AND CORPORATE GOVERNANCE |
The information called for by this item is hereby incorporated by reference from our definitive Proxy Statement relating to the 2016 Annual Meeting of Stockholders, which Proxy Statement is anticipated to be filed with the Securities and Exchange Commission within 120 days of December 31, 2015.
| Item 11. | EXECUTIVE COMPENSATION |
The information called for by this item is hereby incorporated by reference from our definitive Proxy Statement relating to the 2016 Annual Meeting of Stockholders, which Proxy Statement is anticipated to be filed with the Securities and Exchange Commission within 120 days of December 31, 2015.
| Item 12. | SECURITY OWNERSHIP OF CERTAIN BENEFICIAL OWNERS AND MANAGEMENT AND RELATED STOCKHOLDER MATTERS |
The information called for by this item is hereby incorporated by reference from our definitive Proxy Statement relating to the 2016 Annual Meeting of Stockholders, which Proxy Statement is anticipated to be filed with the Securities and Exchange Commission within 120 days of December 31, 2015.
| Item 13. | CERTAIN RELATIONSHIPS AND RELATED TRANSACTIONS, AND DIRECTOR INDEPENDENCE |
The information called for by this item is hereby incorporated by reference from our definitive Proxy Statement relating to the 2016 Annual Meeting of Stockholders, which Proxy Statement is anticipated to be filed with the Securities and Exchange Commission within 120 days of December 31, 2015.
| Item 14. | PRINCIPAL ACCOUNTING FEES AND SERVICES |
The information called for by this item is hereby incorporated by reference from our definitive Proxy Statement relating to the 2016 Annual Meeting of Stockholders, which Proxy Statement is anticipated to be filed with the Securities and Exchange Commission within 120 days of December 31, 2015.
| 54 |
| Item 15. | EXHIBITS AND FINANCIAL STATEMENT SCHEDULES |
| (a) | The following documents are filed as part of this report: |
| 1. | Financial Statements. The Company’s Consolidated Financial Statements as of December 31, 2015 and 2014 and for each of the three years in the year ended December 31, 2015 and the notes thereto, together with the report of the independent auditors on those Consolidated Financial Statements are hereby filed as part of this report, beginning on page F-1. |
| 2. | Financial Statement Schedules. |
| Financial Statement Schedules other than those listed above have been omitted because they are either not applicable or the information is otherwise included in the consolidated financial statements or the notes thereto. |
| (b) | Exhibits and Index to Exhibits, below. |
Exhibit Index
| Exhibit No. | Description | |
| 2.1(1)+ | Acquisition Agreement, dated May 19, 2014, by and among the registrant, Darwin Merger Sub I, Inc., B. Riley Capital Markets, LLC, B. Riley and Co. Inc., B. Riley & Co. Holding, LLC, Riley Investment Management LLC, and Bryant Riley | |
| 3.1(2) | Amended and Restated Certificate of Incorporation, dated as of August 17, 2015 | |
| 3.2(3) | Amended and Restated Bylaws, dated as of November 6, 2014 | |
| 4.1(4) | Form of common stock certificate | |
| 10.1(5) | Security Agreement, dated as of October 21, 2008, by and between Great American Group WF, LLC and Wells Fargo Bank, National Association (Successor to Wells Fargo Retail Finance, LLC) | |
| 10.2(6) | Escrow Agreement, dated as of July 31, 2009, by and among Alternative Asset Management Acquisition Corp., the registrant, Andrew Gumaer, as the Member Representative, and Continental Stock Transfer & Trust Company | |
| 10.3(6)# | Form of Director and Officer Indemnification Agreement | |
| 10.4(6)# | Employment Agreement, dated July 31, 2009, by and between the registrant and Scott Carpenter | |
| 10.5(7) | Loan and Security Agreement (Accounts Receivable & Inventory Line of Credit), dated as of May 17, 2011, by and between BFI Business Finance and Great American Group Advisory & Valuation Services, LLC | |
| 10.6(8) | Second Amended and Restated Credit Agreement, dated as of July 15, 2013, by and between Great American Group WF, LLC and Wells Fargo Bank, National Association | |
| 10.7(8) | Third Amended and Restated Guaranty, dated as of July 15, 2013, by and between the registrant and Great American Group, LLC, in favor of Wells Fargo Bank, National Association | |
| 10.8(9) | Uncommitted Liquidation Finance Agreement, dated as of March 19, 2014, by and among GA Asset Advisors Limited, each special purpose vehicle affiliated to GA Asset Advisors Limited which accedes to such agreement, and Burdale Financial Limited | |
| 10.9(9) | Master Guarantee and Indemnity, dated as of March 19, 2014, by and among GA Asset Advisors Limited, the Company, Great American Group, LLC, Great American Group WF, LLC, Burdale Financial Limited and Wells Fargo Bank, National Association | |
| 10.10(1) | Securities Purchase Agreement, dated May 19, 2014, by and among the registrant and each purchaser identified on Annex A thereto | |
| 10.11(1) | Form of Registration Rights Agreement |
| 55 |
| 10.12(1) | Letter Agreement, dated May 19, 2014, by and between the registrant and Andrew Gumaer | |
| 10.13(1) | Letter Agreement, dated May 19, 2014, by and between the registrant and Harvey Yellen | |
| 10.14(1)# | Employment Agreement, dated May 19, 2014, by and between the registrant and Bryant Riley | |
| 10.15(1)# | Amended and Restated Employment Agreement, dated May 19, 2014, by and between the registrant and Andrew Gumaer | |
| 10.16(10) | First Amendment to Credit Agreement and Limited Consent and Waiver, dated as of May 28, 2014, by and among Wells Fargo Bank, National Association, Great American Group WF, LLC, Great American Group, Inc. and Great American Group, LLC | |
| 10.17(11) | Escrow Agreement, dated June 18, 2014, by and among the registrant, Bryant Riley and Continental Stock Transfer & Trust Company, Inc. | |
| 10.18(12) | Senior Secured, Super-Priority Debtor-in-Possession Credit Agreement, dated January 15, 2015, by and among the registrant. and The Wet Seal, Inc. and its subsidiaries | |
| 10.19(12) | Plan Sponsorship Agreement, dated January 15, 2015, by and between the registrant and The Wet Seal, Inc. | |
| 10.20(12) | Security Agreement, dated as of January 15, 2015, by and among the registrant and The Wet Seal, Inc., The Wet Seal Retail, Inc., Wet Seal Catalog, Inc., and Wet Seal GC, LLC | |
| 10.21(12) | Subordinated Unsecured Promissory Note, dated March 10, 2015, issued by the registrant to Riley Investment Partners, L.P. | |
| 10.22(12) | Third Amendment to Credit Agreement, dated as of February 5, 2015, by and between Great American Group WF, LLC and Wells Fargo Bank, National Association | |
| 10.23(12) | Fourth Amendment to Credit Agreement, dated as of February 19, 2015, by and between Great American Group WF, LLC, GA Retail, Inc. and Wells Fargo Bank, National Association | |
| 10.24(13)# | Amended and Restated 2009 Stock Incentive Plan. | |
| 10.25(13)# | Amended and Restated 2009 Stock Incentive Plan – Form of Restricted Stock Unit Agreement | |
| 10.26(13)# | Amended and Restated 2009 Stock Incentive Plan – Stock Bonus Program and Form of Stock Bonus Award Agreement | |
| 10.27(13)# | Employment Agreement, dated as of April 13, 2015, by and between the registrant and Alan N. Forman | |
| 10.28(2)# | B. Riley Financial, Inc. Management Bonus Plan | |
| 21.1* | Subsidiary List | |
| 23.1* | Consent of Marcum LLP | |
| 31.1* | Certification of Chief Executive Officer pursuant to Rules 13a-14 and 15d-14 promulgated under the Securities Exchange Act of 1934 | |
| 31.2* | Certification of Chief Financial Officer pursuant to Rules 13a-14 and 15d-14 promulgated under the Securities Exchange Act of 1934 | |
| 32.1* | Certification of Chief Executive Officer pursuant to 18 U.S.C. Section 1350, as adopted pursuant to Section 906 of the Sarbanes-Oxley Act of 2002 | |
| 32.2* | Certification of Chief Financial Officer pursuant to 18 U.S.C. Section 1350, as adopted pursuant to Section 906 of the Sarbanes-Oxley Act of 2002 | |
| 101.INS* | XBRL Instance Document | |
| 101.SCH* | XBRL Taxonomy Extension Schema Document | |
| 101.CAL* | XBRL Taxonomy Extension Calculation Linkbase Document | |
| 101.DEF* | XBRL Taxonomy Extension Definition Linkbase Document | |
| 101.LAB* | XBRL Taxonomy Extension Label Linkbase Document |
| 56 |
| 101.PRE* | XBRL Taxonomy Extension Presentation Linkbase Document |
| * | Filed herewith. | |
| + | Schedules to this exhibit have been omitted pursuant to Item 601(b)(2) of Regulation S-K. The registrant hereby agrees to furnish a copy of any omitted schedules to the Securities and Exchange Commission upon request. | |
| # | Management contract or compensatory plan or arrangement. | |
| (1) | Incorporated by reference to the registrant’s Current Report on Form 8-K filed with the SEC on May 19, 2014. | |
| (2) | Incorporated by reference to the registrant’s Current Report on Form 8-K filed with the SEC on August 18, 2015. | |
| (3) | Incorporated by reference to the registrant’s Quarterly Report on Form 10-Q filed with the SEC on November 6, 2014. | |
| (4) | Incorporated by reference to the registrant’s Annual Report on Form 10-K filed with the SEC on March 30, 2015. | |
| (5) | Incorporated by reference to the registrant’s Quarterly Report on Form 10-Q filed with the SEC on August 31, 2009. | |
| (6) | Incorporated by reference to the registrant’s Current Report on Form 8-K filed with the SEC on August 6, 2009. | |
| (7) | Incorporated by reference to the registrant’s Current Report on Form 8-K filed with the SEC on May 26, 2011. | |
| (8) | Incorporated by reference to the registrant’s Current Report on Form 8-K filed with the SEC on July 19, 2013. | |
| (9) | Incorporated by reference to the registrant’s Current Report on Form 8-K filed with the SEC on March 25, 2014. | |
| (10) | Incorporated by reference to the registrant’s Quarterly Report on Form 10-Q filed with the SEC on August 14, 2014. | |
| (11) | Incorporated by reference to the registrant’s Current Report on Form 8-K filed with the SEC on June 18, 2014. | |
| (12) | Incorporated by reference to the registrant’s Quarterly Report on Form 10-Q filed with the SEC on May 7, 2015. | |
| (13) | Incorporated by reference to the registrant’s Quarterly Report on Form 10-Q filed with the SEC on August 10, 2015. |
| 57 |
Pursuant to the requirements of Section 13 or 15(d) of the Securities Exchange Act of 1934, the registrant has duly caused this report to be signed on its behalf by the undersigned, thereunto duly authorized.
| B. Riley Financial, Inc. | |
| Date: March 28, 2016 | /s/ PHILLIP J. AHN |
| (Phillip J. Ahn, Chief Operating Officer and Chief Financial Officer) |
Pursuant to the requirements of the Securities Exchange Act of 1934, this report has been signed below by the following persons on behalf of the registrant and in the capacities and on the date indicated:
| Signature | Title | Date | ||
| /s/ BRYANT R. RILEY | Chief Executive Officer and Chairman | March 28, 2016 | ||
| (Bryant R. Riley) | of the Board (Principal Executive Officer) | |||
| /s/ PHILLIP J. AHN | Chief Operating Officer and Chief | March 28, 2016 | ||
| (Phillip J. Ahn) | Financial Officer | |||
| (Principal Financial Officer) | ||||
| /s/ HOWARD E. WEITZMAN | Chief Accounting Officer | March 28, 2016 | ||
| (Howard E. Weitzman) | (Principal Accounting Officer) | |||
| /s/ ROBERT D’AGOSTINO | Director | March 28, 2016 | ||
| (Robert D’Agostino) | ||||
| /s/ ANDREW GUMAER | Director | March 28, 2016 | ||
| (Andrew Gumaer) | ||||
| /s/ THOMAS J. KELLEHER | Director | March 28, 2016 | ||
| (Thomas J. Kelleher) | ||||
| /s/ RICHARD L. TODARO | Director | March 28, 2016 | ||
| (Richard L. Todaro) | ||||
| /s/ MIKEL H. WILLIAMS | Director | March 28, 2016 | ||
| (Mikel H. Williams) | ||||
| /s/ KENNETH M. YOUNG | Director | March 28, 2016 | ||
| (Kenneth M. Young) |
| 58 |
B. RILEY FINANCIAL, INC.
INDEX TO CONSOLIDATED FINANCIAL STATEMENTS
| F-1 |
Report of Independent Registered Public Accounting Firm
To the Audit Committee of the
Board of Directors and Shareholders
of B. Riley Financial, Inc.
We have audited the accompanying consolidated balance sheets of B. Riley Financial, Inc. and Subsidiaries (the “Company”) as of December 31, 2015 and 2014, and the related consolidated statements of operations, comprehensive income (loss), equity and cash flows for each of the years in the three year period ended December 31, 2015. These consolidated financial statements are the responsibility of the Company’s management. Our responsibility is to express an opinion on these consolidated financial statements based on our audits.
We conducted our audits in accordance with the standards of the Public Company Accounting Oversight Board (United States). Those standards require that we plan and perform the audits to obtain reasonable assurance about whether the consolidated financial statements are free of material misstatement. The Company is not required to have, nor were we engaged to perform, an audit of its internal control over financial reporting. Our audits included consideration of internal control over financial reporting as a basis for designing audit procedures that are appropriate in the circumstances, but not for the purpose of expressing an opinion on the effectiveness of the Company’s internal control over financial reporting. Accordingly, we express no such opinion. An audit also includes examining, on a test basis, evidence supporting the amounts and disclosures in the financial statements, assessing the accounting principles used and significant estimates made by management, as well as evaluating the overall financial statement presentation. We believe that our audits provide a reasonable basis for our opinion.
In our opinion, the consolidated financial statements referred to above present fairly, in all material respects, the consolidated financial position of B. Riley Financial, Inc. and Subsidiaries as of December 31, 2015 and 2014, and the consolidated results of their operations and their cash flows for each of the years in the three year period ended December 31, 2015 in conformity with accounting principles generally accepted in the United States of America.
| /s/ Marcum LLP |
| Marcum LLP |
| Melville, New York |
| March 28, 2016 |
| F-2 |
B. RILEY FINANCIAL, INC. AND SUBSIDIARIES
CONSOLIDATED BALANCE SHEETS
(Dollars in thousands, except par value)
| December 31, | December 31, | |||||||
| 2015 | 2014 | |||||||
| Assets | ||||||||
| Current assets: | ||||||||
| Cash and cash equivalents | $ | 30,012 | $ | 21,600 | ||||
| Restricted cash | 51 | 7,657 | ||||||
| Securities owned, at fair value | 25,543 | 17,955 | ||||||
| Accounts receivable, net | 9,472 | 10,098 | ||||||
| Due from related parties | 409 | — | ||||||
| Advances against customer contracts | 5,013 | 16,303 | ||||||
| Goods held for sale or auction | 37 | 4,117 | ||||||
| Prepaid expenses and other current assets | 2,415 | 3,795 | ||||||
| Total current assets | 72,952 | 81,525 | ||||||
| Property and equipment, net | 592 | 776 | ||||||
| Goodwill | 34,528 | 27,557 | ||||||
| Other intangible assets, net | 4,768 | 2,799 | ||||||
| Deferred income taxes | 18,992 | 25,601 | ||||||
| Other assets | 588 | 732 | ||||||
| Total assets | $ | 132,420 | $ | 138,990 | ||||
| Liabilities and Equity (Deficit) | ||||||||
| Current liabilities: | ||||||||
| Accounts payable | $ | 1,123 | $ | 1,093 | ||||
| Accrued payroll and related expenses | 7,178 | 6,017 | ||||||
| Accrued value added tax payable | 1,785 | 11 | ||||||
| Accrued expenses and other liabilities | 6,478 | 5,112 | ||||||
| Due to related parties | 166 | 213 | ||||||
| Auction and liquidation proceeds payable | — | 665 | ||||||
| Securities sold not yet purchased | 713 | 746 | ||||||
| Mandatorily redeemable noncontrolling interests | 2,994 | 2,922 | ||||||
| Asset based credit facility | — | 18,506 | ||||||
| Revolving credit facility | 272 | 56 | ||||||
| Notes payable | — | 6,570 | ||||||
| Contingent consideration- current portion | 1,241 | — | ||||||
| Total current liabilities | 21,950 | 41,911 | ||||||
| Contingent consideration, net of current portion | 1,150 | — | ||||||
| Total liabilities | 23,100 | 41,911 | ||||||
| Commitments and contingencies | ||||||||
| B. Riley Financial, Inc. stockholders' equity: | ||||||||
| Preferred stock, $0.0001 par value; 1,000,000 shares authorized; none issued | — | — | ||||||
| Common stock, $0.0001 par value; 40,000,000 shares authorized; 16,448,119 and 15,968,607 issued and outstanding as of December 31, 2015 and 2014, respectively | 2 | 2 | ||||||
| Additional paid-in capital | 116,799 | 110,598 | ||||||
| Retained earnings (deficit) | (6,305 | ) | (12,891 | ) | ||||
| Accumulated other comprehensive loss | (1,058 | ) | (648 | ) | ||||
| Total B. Riley Financial, Inc. stockholders' equity | 109,438 | 97,061 | ||||||
| Noncontrolling interests | (118 | ) | 18 | |||||
| Total equity | 109,320 | 97,079 | ||||||
| Total liabilities and equity | $ | 132,420 | $ | 138,990 | ||||
The accompanying notes are an integral part of these consolidated financial statements.
| F-3 |
B. RILEY FINANCIAL, INC. AND SUBSIDIARIES
CONSOLIDATED STATEMENTS OF OPERATIONS
(Dollars in thousands, except share data)
| Year Ended December 31, | ||||||||||||
| 2015 | 2014 | 2013 | ||||||||||
| Revenues: | ||||||||||||
| Services and fees | $ | 101,929 | $ | 67,257 | $ | 59,967 | ||||||
| Sale of goods | 10,596 | 9,859 | 16,165 | |||||||||
| Total revenues | 112,525 | 77,116 | 76,132 | |||||||||
| Operating expenses: | ||||||||||||
| Direct cost of services | 29,049 | 23,466 | 24,146 | |||||||||
| Cost of goods sold | 3,072 | 14,080 | 11,506 | |||||||||
| Selling, general and administrative | 58,322 | 44,453 | 36,382 | |||||||||
| Restructuring charge | — | 2,548 | — | |||||||||
| Total operating expenses | 90,443 | 84,547 | 72,034 | |||||||||
| Operating income (loss) | 22,082 | (7,431 | ) | 4,098 | ||||||||
| Other income (expense): | ||||||||||||
| Interest income | 17 | 12 | 26 | |||||||||
| Loss from equity investment in Great American Real Estate, LLC | — | — | (21 | ) | ||||||||
| Loss from equity investment in Shoon Trading Limited | — | — | (156 | ) | ||||||||
| Interest expense | (834 | ) | (1,262 | ) | (2,667 | ) | ||||||
| Income (loss) before income taxes | 21,265 | (8,681 | ) | 1,280 | ||||||||
| (Provision) benefit for income taxes | (7,688 | ) | 2,886 | (704 | ) | |||||||
| Net income (loss) | 13,577 | (5,795 | ) | 576 | ||||||||
| Net income (loss) attributable to noncontrolling interests | 1,772 | 6 | (482 | ) | ||||||||
| Net income (loss) attributable to B. Riley Financial, Inc. | $ | 11,805 | $ | (5,801 | ) | $ | 1,058 | |||||
| Basic earnings (loss) per share | $ | 0.73 | $ | (0.60 | ) | $ | 0.74 | |||||
| Diluted earnings (loss) per share | $ | 0.73 | $ | (0.60 | ) | $ | 0.71 | |||||
| Cash dividends per share | $ | 0.32 | $ | 0.03 | $ | 0.00 | ||||||
| Weighted average basic shares outstanding | 16,221,040 | 9,612,154 | 1,434,107 | |||||||||
| Weighted average diluted shares outstanding | 16,265,915 | 9,612,154 | 1,495,328 | |||||||||
The accompanying notes are an integral part of these consolidated financial statements.
| F-4 |
B. RILEY FINANCIAL, INC. AND SUBSIDIARIES
CONSOLIDATED STATEMENTS OF COMPHREHENSIVE INCOME (LOSS)
(Dollars in thousands)
| Year Ended December 31, | ||||||||||||
| 2015 | 2014 | 2013 | ||||||||||
| Net income (loss) | $ | 13,577 | $ | (5,795 | ) | $ | 576 | |||||
| Other comprehensive loss: | ||||||||||||
| Change in cumulative translation adjustment | (410 | ) | (10 | ) | (118 | ) | ||||||
| Other comprehensive loss, net of tax | (410 | ) | (10 | ) | (118 | ) | ||||||
| Total comprehensive income (loss) | 13,167 | (5,805 | ) | 458 | ||||||||
| Comprehensive income (loss) attributable to noncontrolling interests | 1,772 | 6 | (482 | ) | ||||||||
| Comprehensive income (loss) attributable to B. Riley Financial, Inc. | $ | 11,395 | $ | (5,811 | ) | $ | 940 | |||||
The accompanying notes are an integral part of these consolidated financial statements.
| F-5 |
B. RILEY FINANCIAL, INC. AND SUBSIDIARIES
CONSOLIDATED STATEMENTS OF EQUITY
(Dollars in thousands)
| Accumulated | ||||||||||||||||||||||||||||||||||||
| Additional | Retained | Other | Total | |||||||||||||||||||||||||||||||||
| Preferred Stock | Common Stock | Paid-in | Earnings | Comprehensive | Noncontrolling | Equity | ||||||||||||||||||||||||||||||
| Shares | Amount | Shares | Amount | Capital | (Deficit) | Loss | Interests | (Deficit) | ||||||||||||||||||||||||||||
| Balance, December 31, 2012 | — | $ | — | 1,500,107 | $ | — | $ | 3,086 | $ | (7,669 | ) | $ | (520 | ) | $ | 928 | $ | (4,175 | ) | |||||||||||||||||
| Net income | — | — | — | — | — | 1,058 | — | — | 1,058 | |||||||||||||||||||||||||||
| Change in noncontrolling interest from deconsolidation of Shoon Trading Limited | — | — | — | — | — | — | — | (434 | ) | (434 | ) | |||||||||||||||||||||||||
| Foreign currency translation adjustment | — | — | — | — | — | — | (118 | ) | — | (118 | ) | |||||||||||||||||||||||||
| Changes in noncontrolling interests | — | — | — | — | — | — | — | (482 | ) | (482 | ) | |||||||||||||||||||||||||
| Balance, December 31, 2013 | — | — | 1,500,107 | — | 3,086 | (6,611 | ) | (638 | ) | 12 | (4,151 | ) | ||||||||||||||||||||||||
| Issuance of common stock on June 5, 2014 for cash, net of issuance costs of $215 | — | — | 10,289,300 | 1 | 51,232 | — | — | — | 51,233 | |||||||||||||||||||||||||||
| Foregiveness of long-term debt on June 5, 2014 from the former Great American Group Members | — | — | — | — | 18,759 | — | — | — | 18,759 | |||||||||||||||||||||||||||
| Issuance of common stock for acquisition of B. Riley & Co., Inc. | — | — | 4,182,637 | 1 | 26,350 | — | — | — | 26,351 | |||||||||||||||||||||||||||
| B. Riley Financial, Inc. common stock owned by B. Riley & Co., Inc. - cancelled upon acquisition | — | — | (3,437 | ) | — | (29 | ) | — | — | — | (29 | ) | ||||||||||||||||||||||||
| Dividends paid | — | — | — | — | — | (479 | ) | — | — | (479 | ) | |||||||||||||||||||||||||
| Deferred tax asset from principal payment on debt to the former Great American Group Members | — | — | — | — | 11,200 | — | — | — | 11,200 | |||||||||||||||||||||||||||
| Net loss | — | — | — | — | — | (5,801 | ) | — | 6 | (5,795 | ) | |||||||||||||||||||||||||
| Foreign currency translation adjustment | — | — | — | — | — | — | (10 | ) | — | (10 | ) | |||||||||||||||||||||||||
| Balance, December 31, 2014 | — | $ | — | 15,968,607 | $ | 2 | $ | 110,598 | $ | (12,891 | ) | $ | (648 | ) | $ | 18 | $ | 97,079 | ||||||||||||||||||
| Issuance of common stock for acquisition of MK Capital Advisors, LLC and contigent equity consideration on February 2, 2015 | — | — | 333,333 | — | 4,657 | — | — | — | 4,657 | |||||||||||||||||||||||||||
| Vesting of restricted stock, net of shares withheld for employer taxes | — | — | 146,179 | — | (499 | ) | — | — | — | (499 | ) | |||||||||||||||||||||||||
| Share based payments | — | — | — | — | 2,043 | — | — | — | 2,043 | |||||||||||||||||||||||||||
| Dividends paid | — | — | — | — | — | (5,219 | ) | — | — | (5,219 | ) | |||||||||||||||||||||||||
| Net income | — | — | — | — | — | 11,805 | — | 1,772 | 13,577 | |||||||||||||||||||||||||||
| Distributions to non-controlling interests | — | — | — | — | — | — | — | (1,908 | ) | (1,908 | ) | |||||||||||||||||||||||||
| Foreign currency translation adjustment | — | — | — | — | — | — | (410 | ) | — | (410 | ) | |||||||||||||||||||||||||
| Balance, December 31, 2015 | — | $ | — | 16,448,119 | $ | 2 | $ | 116,799 | $ | (6,305 | ) | $ | (1,058 | ) | $ | (118 | ) | $ | 109,320 | |||||||||||||||||
The accompanying notes are an integral part of these consolidated financial statements.
| F-6 |
B. RILEY FINANCIAL, INC. AND SUBSIDIARIES
CONSOLDIATED STATEMENTS OF CASH FLOWS
(Dollars in thousands)
| Year ended December 31, | ||||||||||||
| 2015 | 2014 | 2013 | ||||||||||
| Cash flows from operating activities: | ||||||||||||
| Net income (loss) | $ | 13,577 | $ | (5,795 | ) | $ | 576 | |||||
| Adjustments to reconcile net income (loss) to net cash provided by (used in) operating activities: | ||||||||||||
| Depreciation and amortization | 848 | 646 | 1,863 | |||||||||
| Provision for doubtful accounts | 718 | 532 | (12 | ) | ||||||||
| Share based compensation | 2,043 | — | — | |||||||||
| Impairment of goods held for sale or auction | 33 | 4,675 | 428 | |||||||||
| Non-cash interest | 163 | — | — | |||||||||
| Effect of foreign currency on operations | (375 | ) | 137 | 226 | ||||||||
| Loss from equity investment in Great American Real Estate, LLC and Shoon Trading Limited | — | — | 177 | |||||||||
| Loss on disposal of assets | 7 | 91 | — | |||||||||
| Deferred income taxes | 6,609 | (2,984 | ) | 989 | ||||||||
| Income allocated to mandatorily redeemable noncontrolling interests | 2,207 | 1,892 | 1,897 | |||||||||
| Change in operating assets and liabilities: | ||||||||||||
| Accounts receivable and advances against customer contracts | 11,540 | (15,195 | ) | 5,145 | ||||||||
| Lease finance receivable | — | 107 | (8,099 | ) | ||||||||
| Securities owned | (7,588 | ) | (16,006 | ) | — | |||||||
| Inventory | — | — | 455 | |||||||||
| Goods held for sale or auction | 20 | 9,414 | (1,625 | ) | ||||||||
| Loan receivable | — | — | 156 | |||||||||
| Prepaid expenses and other assets | (1,100 | ) | (59 | ) | 167 | |||||||
| Accounts payable, accrued payroll and related expenses, accrued value added tax payable and other accured expenses | 4,289 | (1,142 | ) | (3,971 | ) | |||||||
| Amounts due to (from) related parties | (622 | ) | 168 | — | ||||||||
| Securities sold not yet purchased | (33 | ) | (176 | ) | — | |||||||
| Auction and liquidation proceeds payable | (665 | ) | 665 | (864 | ) | |||||||
| Net cash provided by (used in) operating activities | 31,671 | (23,030 | ) | (2,492 | ) | |||||||
| Cash flows from investing activities: | ||||||||||||
| Acquisition of MK Capital, net of cash acquired of $49 | (2,451 | ) | — | — | ||||||||
| Cash acquired from acquisition of B. Riley & Co., Inc. | — | 2,667 | — | |||||||||
| Deconsolidation of Shoon Trading Limited | — | — | (1,564 | ) | ||||||||
| Purchases of property and equipment | (239 | ) | (252 | ) | (1,142 | ) | ||||||
| Proceeds from sale of property and equipment and notes receivable - related party | 4 | 1,200 | 611 | |||||||||
| Equity investment in Great American Real Estate, LLC | — | — | (21 | ) | ||||||||
| Decrease (increase) in restricted cash | 7,604 | (7,282 | ) | 7,598 | ||||||||
| Net cash provided by (used in) investing activities | 4,918 | (3,667 | ) | 5,482 | ||||||||
| Cash flows from financing activities: | ||||||||||||
| Proceeds from (repayments of) revolving line of credit | 216 | (277 | ) | (1,971 | ) | |||||||
| (Repayment of) proceeds from asset based credit facility | (18,506 | ) | 12,796 | 5,710 | ||||||||
| Proceeds from note payable - related party | 4,500 | — | — | |||||||||
| Repayment of note payable - related party | (4,500 | ) | — | — | ||||||||
| Payment of employment taxes on vesting of restricted stock | (499 | ) | — | — | ||||||||
| Payment of financing costs | — | — | (375 | ) | ||||||||
| Repayment of notes payable, long-term debt and capital lease obligations | — | (32,010 | ) | (4,509 | ) | |||||||
| Proceeds from issuance of common stock | — | 51,233 | — | |||||||||
| Dividends paid | (5,219 | ) | (479 | ) | — | |||||||
| Distributions to noncontrolling interests | (4,042 | ) | (1,794 | ) | (1,930 | ) | ||||||
| Net cash (used in) provided by financing activities | (28,050 | ) | 29,469 | (3,075 | ) | |||||||
| Effect of foreign currency on cash | (127 | ) | (39 | ) | 231 | |||||||
| Net increase in cash and cash equivalents | 8,412 | 2,733 | 146 | |||||||||
| Cash and cash equivalents, beginning of year | 21,600 | 18,867 | 18,721 | |||||||||
| Cash and cash equivalents, end of year | $ | 30,012 | $ | 21,600 | $ | 18,867 | ||||||
The accompanying notes are an integral part of these consolidated financial statements.
| F-7 |
B. RILEY FINANCIAL, INC. AND SUBSIDIARIES
CONSOLDIATED STATEMENTS OF CASH FLOWS, Continued
(Dollars in thousands)
| Year ended December 31, | ||||||||||||
| 2015 | 2014 | 2013 | ||||||||||
| Supplemental disclosures: | ||||||||||||
| Interest paid | $ | 579 | $ | 1,501 | $ | 2,680 | ||||||
| Income taxes paid | 1,688 | 44 | 175 | |||||||||
The accompanying notes are an integral part of these consolidated financial statements.
| F-8 |
B. RILEY FINANCIAL, INC. AND SUBSIDIARIES
NOTES TO CONSOLIDATED FINANCIAL STATEMENTS
(Dollars in thousands, except share data)
NOTE 1—ORGANIZATION, BUSINESS OPERATIONS AND SIGNIFICANT ACCOUNTING POLICIES
Organization and Nature of Operations
B. Riley Financial, Inc. and its subsidiaries (collectively the “Company”) provide (i) asset disposition, valuation and appraisal and capital advisory services to a wide range of retail, wholesale and industrial clients, as well as lenders, capital providers, private equity investors and professional services firms throughout the United States, Canada, and Europe and (ii) following the Company’s acquisition of B. Riley and Co. Inc. (“BRC Inc.”) on June 18, 2014 and MK Capital Advisors, LLC (“MK Capital”) on February 2, 2015, as more fully described below, investment banking, corporate finance, research, wealth management, sales and trading services to corporate, institutional and high net worth clients.
With the acquisition of BRC Inc. in 2014, the Company now operates in three operating segments: capital markets (“Capital Markets”), auction and liquidation (“Auction and Liquidation”), and valuation and appraisal (“Valuation and Appraisal”). In the Capital Markets segment, the Company provides investment banking, corporate finance, research, sales and trading services to corporate, institutional and high net worth clients. In addition, with the acquisition of MK Capital in 2015, the Company also provides wealth management services in the Capital Markets segment. In the Auction and Liquidation segment, the Company provides auction and liquidation services to help clients dispose of assets and capital advisory services. Such assets include multi-location retail inventory, wholesale inventory, trade fixtures, machinery and equipment, intellectual property and real property. In the Valuation and Appraisal segment, the Company provides valuation and appraisal services to clients with independent appraisals in connection with asset based loans, acquisitions, divestitures and other business needs. The Company’s business in 2013 had an operating segment relating to the operation of UK retail stores (“UK Retail Stores”). The UK Retail Stores segment included the operation of ten retail shoe stores in the United Kingdom as a result of the acquisition of Shoon Trading Limited (“Shoon”) in 2012. In August 2013, the Shoon shareholder agreement was also amended and restated to eliminate the Company’s super majority voting rights which enabled the Company to control the board of directors of Shoon. As a result of this amendment, the Company no longer controlled the board of directors of Shoon, no longer operated in the UK Retail Stores segment, and Shoon’s operating results are not consolidated for any periods after July 31, 2013. In January 2014, Shoon was sold to a third party, and the Company no longer has a financial interest in the operations of Shoon.
Reverse Stock Split
On June 3, 2014, the Company completed a 1 for 20 reverse split of its common stock. The reverse split reduced the Company’s then outstanding shares of 30,002,975 to 1,500,107. Fractional shares from the reverse split were paid in cash based on the closing price of the Company’s common stock on June 2, 2014. The share amounts and earnings per share amounts in the Company’s consolidated financial statement have been adjusted as if the reverse split occurred on January 1, 2013.
Private Placement
On June 5, 2014, the Company completed a private placement of 10,289,300 shares of common stock at a purchase price of $5.00 per share (the “Private Placement”) pursuant to the terms and provisions of a securities purchase agreement entered into among the Company and the accredited investors on May 19, 2014. At the closing of the Private Placement on June 5, 2014, the Company received aggregate gross proceeds of approximately $51,447. On June 5, 2014, the Company used $30,180 of the net proceeds from the Private Placement to repay long-term debt payable to Andrew Gumaer and Harvey Yellen, the two former Great American Members (as described in Note 11), both of whom were executive officers and directors of the Company at the time of such repayment. The $30,000 principal payment and then outstanding accrued interest of $180 retired the entire $48,759 face amount of the long-term debt at a discount of $18,759. The discount of $18,759 was recorded as a capital contribution to additional paid in capital in 2014.
The Company entered into a registration rights agreement (the “Registration Rights Agreement”) with the investors participating in the Private Placement and selling stockholders of BRC Inc.. In accordance with the terms of the Registration Rights Agreement, the Company filed a registration statement on Form S-1 with the Securities and Exchange Commission covering the resale of the common stock issued in the Private Placement and acquisition of BRC Inc. on September 18, 2014 and the registration statement was declared effective on November 7, 2014. The Company filed a post-effective amendment to such registration statement on April 20, 2015 with the Securities and Exchange Commission to convert such Form S-1 registration statement into a registration statement on Form S-3, which registration statement, as amended, was declared effective on July 2, 2015.
| F-9 |
NOTE 2—SUMMARY OF SIGNIFICANT ACCOUNTING POLICIES
(a) Principles of Consolidation and Basis of Presentation
The consolidated financial statements include the accounts of B. Riley Financial, Inc. and its wholly owned and majority-owned subsidiaries. The consolidated financial statements also include the accounts of Great American Global Partners, LLC (“GA Global”) which is controlled by the Company as a result of its ownership of a 50% member interest, appointment of two of the three executive officers and significant influence over the funding of operations. All intercompany accounts and transactions have been eliminated upon consolidation.
The accounting guidance requires an enterprise to perform an analysis to determine whether the enterprise’s variable interest or interests give it a controlling financial interest in a variable interest entity; to require ongoing reassessments of whether an enterprise is the primary beneficiary of a VIE; to eliminate the solely quantitative approach previously required for determining the primary beneficiary of a VIE; to add an additional reconsideration event for determining whether an entity is a VIE when any changes in facts and circumstances occur such that holders of the equity investment at risk, as a group, lose the power from voting rights or similar rights of those investments to direct the activities of the entity that most significantly impact the entity’s economic performance; and to require enhanced disclosures that will provide users of financial statements with more transparent information about an enterprise’s involvement in a VIE.
(b) Use of Estimates
The preparation of the consolidated financial statements in accordance with GAAP requires management to make estimates and assumptions that affect the reported amounts of assets and liabilities at the date of the consolidated financial statements and reported amounts of revenue and expense during the reporting period. Estimates are used when accounting for certain items such as valuation of securities, reserves for accounts receivable and slow moving goods held for sale or auction, the carrying value of intangible assets and goodwill, the fair value of mandatorily redeemable noncontrolling interests, fair value of share based arrangements, fair value of contingent consideration in business combination’s and accounting for income tax valuation allowances. Estimates are based on historical experience, where applicable, and assumptions that management believes are reasonable under the circumstances. Due to the inherent uncertainty involved with estimates, actual results may differ.
(c) Revenue Recognition
Revenues are recognized in accordance with the accounting guidance when persuasive evidence of an arrangement exists, the related services have been provided, the fee is fixed or determinable, and collection is reasonably assured.
Revenues in the Capital Markets segment are primarily comprised of (i) fees earned from corporate finance, investment banking and wealth management services; and (ii) revenues from sales and trading activities.
Fees earned from corporate finance and investment banking services are derived from debt, equity and convertible securities offerings in which the Company acted as an underwriter or placement agent and from financial advisory services rendered in connection with client mergers, acquisitions, restructurings, recapitalizations and other strategic transactions. Fees from underwriting activities are recognized in earnings when the services related to the underwriting transaction are completed under the terms of the engagement and when the income was determined and is not subject to any other contingencies.
Revenues from wealth management services consist primarily of investment management fees that are recognized over the period the services are provided. Investment management fees are primarily comprised of fees for investment management services and are generally based on the dollar amount of the assets being managed.
Revenues from sales and trading includes (i) commissions resulting from equity securities transactions executed as agent or principal and are recorded on a trade date basis, (ii) related net trading gains and losses from market making activities and from the commitment of capital to facilitate customer orders, (iii) fees paid for equity research and (iv) principal transactions which include realized and unrealized net gains and losses resulting from our principal investments in equity and other securities for the Company’s account.
Revenues in the Valuation and Appraisal segment are primarily comprised of fees for valuation and appraisal services. Revenues are recognized upon the delivery of the completed services to the related customers and collection of the fee is reasonably assured. Revenues in the Valuation and Appraisal segment also include contractual reimbursable costs which totaled $3,052, $3,013 and $2,811 for the years ended December 31, 2015, 2014 and 2013, respectively.
Revenues in the Auction and Liquidation segment are comprised of (i) commissions and fees earned on the sale of goods at auctions and liquidations; (ii) revenues from auction and liquidation services contracts where the Company guarantees a minimum recovery value for goods being sold at auction or liquidation; (iii) revenue from the sale of goods that are purchased by the Company for sale at auction or liquidation sales events; (iv) fees earned from real estate services and the origination of loans; (v) revenues from financing activities is recorded over the lives of related loans receivable using the interest method; and (vi) revenues from contractual reimbursable expenses incurred in connection with auction and liquidation contracts.
| F-10 |
Commission and fees earned on the sale of goods at auction and liquidation sales are recognized when evidence of an arrangement exists, the sales price has been determined, title has passed to the buyer and the buyer has assumed the risks of ownership, and collection is reasonably assured. The commission and fees earned for these services are included in revenues in the accompanying consolidated statements of operations. Under these types of arrangements, revenues also include contractual reimbursable costs which totaled $10,641, $6,950 and $5,620 for the years ended December 31, 2015, 2014, and 2013, respectively.
Revenues earned from auction and liquidation services contracts where the Company guarantees a minimum recovery value for goods being sold at auction or liquidation are recognized based on proceeds received. The Company records proceeds received from these types of engagements first as a reduction of contractual reimbursable expenses, second as a recovery of its guarantee and thereafter as revenue, subject to such revenue meeting the criteria of having been fixed or determinable. Contractual reimbursable expenses and amounts advanced to customers for minimum guarantees are initially recorded as advances against customer contracts in the accompanying consolidated balance sheets. If, during the auction or liquidation sale, the Company determines that the proceeds from the sale will not meet the minimum guaranteed recovery value as defined in the auction or liquidation services contract, the Company accrues a loss on the contract in the period that the loss becomes known. During the fourth quarter of 2014, revenues in the Auction and Liquidation segment also included estimated losses of $6,100 that were accrued at December 31, 2014 on the performance of one retail liquidation services engagement where we guaranteed a minimum recovery value for goods sold.
The Company also evaluates revenue from auction and liquidation contracts in accordance with the accounting guidance to determine whether to report Auction and Liquidation segment revenue on a gross or net basis. The Company has determined that it acts as an agent in a substantial majority of its auction and liquidation services contracts and therefore reports the auction and liquidation revenues on a net basis.
Revenues from the sale of goods are recorded gross and are recognized in the period in which the sale of goods held for sale or auction are completed, title to the property passes to the purchaser and the Company has fulfilled its obligations with respect to the transaction. These revenues are primarily the result of the Company acquiring title to merchandise with the intent of selling the items at auction or for augmenting liquidation sales. For liquidation contracts where we take title to retail goods, our net sales represent gross sales invoiced to customers, less certain related charges for discounts, returns, and other promotional allowances and are recorded net of sales or value added tax.
Revenues from sales-type leases are recorded as an asset at lease inception. The asset is recorded at the aggregate future minimum lease payments, estimated residual value of the leased equipment, and deferred incremental direct costs less unearned income. Income is recognized over the life of the lease to approximate a level rate of return on the net investment. During the year ended December 31, 2013, the terms of the lease agreement for four oil rigs that was included in leased equipment at December 31, 2012 was amended to, among other things, eliminate the right of the lessor to return the oil rigs to the Company. This amendment changed the classification of the lease from an operating lease to a sales-type lease and resulted in the Company recording revenues from the sale of the oil rigs of $9,280 and cost of goods sold of $7,447 during the year ended December 31, 2013.
Fees earned from real estate services and the origination of loans where the Company provides capital advisory services are recognized in the period earned, if the fee is fixed and determinable and collection is reasonably assured.
Revenues from the sale of goods in our UK retail stores segment are recognized as revenue upon the sale of product to retail customers through July 31, 2013. Our net sales represent gross sales invoiced to customers, less certain related charges for discounts, returns, and other promotional allowances and are recorded net of sales or value added tax. Allowances provided for these items are presented in the consolidated financial statements primarily as reductions to sales and cost of sales.
In the normal course of business, the Company will enter into collaborative arrangements with other merchandise liquidators to collaboratively execute auction and liquidation contracts. The Company’s collaborative arrangements specifically include contractual agreements with other liquidation agents in which the Company and such other liquidation agents actively participate in the performance of the liquidation services and are exposed to the risks and rewards of the liquidation engagement. The Company’s participation in collaborative arrangements including its rights and obligations under each collaborative arrangement can vary. Revenues from collaborative arrangements are recorded net based on the proceeds received from the liquidation engagement. Amounts paid to participants in the collaborative arrangements are reported separately as direct costs of revenues. Revenue from collaborative arrangements in which the Company is not the majority participant is recorded net based on the Company’s share of proceeds received. There were no revenues and direct cost of services subject to collaborative arrangements during the year ended December 31, 2015 and 2014. There were revenues of $8,094 and direct cost of services of $1,073 subject to collaborative arrangements during the years ended December 31, 2013.
| F-11 |
(d) Direct Cost of Services
Direct cost of services relate to service and fee revenues. The costs consist of employee compensation and related payroll benefits, travel expenses, the cost of consultants assigned to revenue-generating activities and direct expenses billable to clients in the Valuation and Appraisal segment. Direct costs of services include participation in profits under collaborative arrangements in which the Company is a majority participant. Direct costs of services also include the cost of consultants and other direct expenses related to auction and liquidation contracts pursuant to commission and fee based arrangements in the Auction and Liquidation segment. Direct cost of services does not include an allocation of the Company’s overhead costs.
(e) Concentration of Risk
Revenues from one liquidation service contract to a retailer represented 12.4% of total revenues during the year ended December 31, 2015. Revenues from one liquidation service contract to a retailer and the sale of four oil rigs to one customer represented 10.7% and 12.2% of total revenues during the year ended December 31, 2013. Revenues in the Valuation and Appraisal segment and the Auction and Liquidation segment are primarily generated in the United States and Europe.
The Company’s activities in the Auction and Liquidation segment are executed frequently with, and on behalf of, distressed customers and secured creditors. Concentrations of credit risk can be affected by changes in economic, industry, or geographical factors. The Company seeks to control its credit risk and potential risk concentration through risk management activities that limit the Company’s exposure to losses on any one specific liquidation services contract or concentration within any one specific industry. To mitigate the exposure to losses on any one specific liquidation services contract, the Company sometimes conducts operations with third parties through collaborative arrangements.
The Company maintains cash in various federally insured banking institutions. The account balances at each institution periodically exceed the Federal Deposit Insurance Corporation’s (“FDIC”) insurance coverage, and as a result, there is a concentration of credit risk related to amounts in excess of FDIC insurance coverage. The Company has not experienced any losses in such accounts. The Company also has substantial cash balances from proceeds received from auctions and liquidation engagements that are distributed to parties in accordance with the collaborative arrangements.
(f) Advertising Expense
The Company expenses advertising costs, which consist primarily of costs for printed materials, as incurred. Advertising costs totaled $519, $262 and $446 for the years ended December 31, 2015, 2014, and 2013, respectively. Advertising expense is included as a component of selling, general and administrative expenses in the accompanying consolidated statement of operations.
(g) Share-Based Compensation
The Company’s share based payment awards principally consist of grants of restricted stock and restricted stock units. Share based payment awards also includes grants of membership interests in the Company’s majority owned subsidiaries. The grants of membership interests consist of percentage interests in the Company’s majority owned subsidiaries as determined at the date of grant. In accordance with the applicable accounting guidance, share based payment awards are classified as either equity or liabilities. For equity-classified awards, the Company measures compensation cost for the grant of membership interests at fair value on the date of grant and recognizes compensation expense in the consolidated statement of operations over the requisite service or performance period the award is expected to vest. The fair value of the liability-classified award will be subsequently remeasured at each reporting date through the settlement date. Change in fair value during the requisite service period will be recognized as compensation cost over that period.
(h) Income Taxes
The Company recognizes deferred tax liabilities and assets for the expected future tax consequences of events that have been included in the consolidated financial statements or tax returns. Deferred tax liabilities and assets are determined based on the difference between the financial statement basis and tax basis of assets and liabilities using enacted tax rates in effect for the year in which the differences are expected to reverse. The Company estimates the degree to which tax assets and credit carryforwards will result in a benefit based on expected profitability by tax jurisdiction. A valuation allowance for such tax assets and loss carryforwards is provided when it is determined to be more likely than not that the benefit of such deferred tax asset will not be realized in future periods. Tax benefits of operating loss carryforwards are evaluated on an ongoing basis, including a review of historical and projected future operating results, the eligible carryforward period, and other circumstances. If it becomes more likely than not that a tax asset will be used, the related valuation allowance on such assets would be reduced.
| F-12 |
(i) Cash and Cash Equivalents
The Company considers all highly liquid investments with a maturity of three months or less when purchased to be cash equivalents.
(j) Restricted Cash
As of December 31, 2015, restricted cash included $51 of cash segregated in a special reserve bank account for the benefit of customers related to our broker dealer subsidiary. As of December 31, 2014, restricted cash included $7,532 of cash collateral for the letters of credit and the outstanding loan balance under of asset based credit facility, $50 of cash segregated in a special reserve bank account for the benefit of customers related to our broker dealer subsidiary, and $75 of cash collateral for electronic payment processing in Europe.
(k) Accounts Receivable
Accounts receivable represents amounts due from the Company’s auction and liquidation, valuation and appraisal, and capital markets customers. The Company maintains an allowance for doubtful accounts for estimated losses inherent in its accounts receivable portfolio. In establishing the required allowance, management utilizes a specific customer identification methodology. Management also considers historical losses adjusted for current market conditions and the customers’ financial condition and the current receivables aging and current payment patterns. Account balances are charged off against the allowance after all means of collection have been exhausted and the potential for recovery is considered remote. The Company does not have any off-balance sheet credit exposure related to its customers. The Company’s bad debt expense totaled $718, $532 and $18 for the years ended December 31, 2015, 2014 and 2013, respectively. These amounts are included as a component of selling, general and administrative expenses in the accompanying consolidated statement of operations.
(l) Advances Against Customer Contracts
Advances against customer contracts represent advances of contractually reimbursable expenses incurred prior to, and during the term of the auction and liquidation services contract. These advances are charged to expense in the period that revenue is recognized under the contract.
(m) Goods Held for Sale or Auction
Goods held for sale or auction are stated at the lower of cost, determined by the specific-identification method, or market.
(n) Lease Finance Receivable
The Company had a lease finance receivable in the amount of $8,099 that consisted of the Company’s net investment in sales-type leases for four oil rigs as of December 31, 2013. The gross lease payments included a bargain purchase option in the amount of $4,242 that was payable upon the maturity of the lease on December 15, 2014. The lessee was in default and arrears on certain lease payments and did not exercise its right to purchase the four oil rigs in accordance with the bargain purchase option. Upon the expiration of the lease on December 15, 2014, the Company recorded an impairment charge in the amount of $1,142 in cost of goods sold to write-down the four oil rigs to their estimated fair value of $3,100 which was included in goods held for sale at December 31, 2014. In addition, certain lease payments in the amount of $2,363 that were in default and arrears was included in prepaid expenses and other current assets at December 31, 2014. The lease payments were guaranteed by the parent company of the lessee and the Company notified the lessee that it was in default under the lease and demanded payment. On January 11, 2015, the Company’s wholly-owned subsidiary which was a party to the lease agreement filed for voluntary bankruptcy protection as more fully discussed in Note 11.
(o) Securities Owned and Securities Sold Not Yet Purchased
Securities owned consists of marketable securities and investments in partnership interests and other securities recorded at fair value. Securities sold, but not yet purchased represents obligations of the Company to deliver the specified security at the contracted price and thereby create a liability to purchase the security in the market at prevailing prices. Changes in the value of these securities are reflected currently in the results of operations.
| F-13 |
As of December 31, 2015 and 2014, the Company’s securities owned and securities sold not yet purchased at fair value consisted of the following:
| December 31, | December 31, | |||||||
| 2015 | 2014 | |||||||
| Securities owned | ||||||||
| Common stocks | $ | 17,586 | $ | 16,667 | ||||
| Corporate bonds | 941 | 1,188 | ||||||
| Partnership interests | 7,016 | 100 | ||||||
| $ | 25,543 | $ | 17,955 | |||||
| Securities sold not yet purchased | ||||||||
| Corporate bonds | $ | 713 | $ | 746 | ||||
(p) Property and Equipment
Property and equipment are stated at cost. Depreciation and amortization is computed using the straight-line method over the estimated useful lives of the assets. Property and equipment held under capital leases are amortized on a straight-line basis over the shorter of the lease term or estimated useful life of the asset. Property and equipment under capital leases were stated at the present value of minimum lease payments.
(q) Goodwill and Other Intangible Assets
The Company accounts for goodwill and intangible assets in accordance with the accounting guidance which requires that goodwill and other intangibles with indefinite lives be tested for impairment annually or on an interim basis if events or circumstances indicate that the fair value of an asset has decreased below its carrying value.
Goodwill includes (i) the excess of the purchase price over the fair value of net assets acquired in a business combinations and (ii) an increase for the subsequent acquisition of noncontrolling interests during the year ended December 31, 2007 (also see Note 8). The Accounting Standards Codification (“ASC”) requires that goodwill be tested for impairment at the reporting unit level (operating segment or one level below an operating segment). Application of the goodwill impairment test requires judgment, including the identification of reporting units, assigning assets and liabilities to reporting units, assigning goodwill to reporting units, and determining the fair value. The Company operates three reporting units, which are the same as its reporting segments described in Note 20. Significant judgment is required to estimate the fair value of reporting units which includes estimating future cash flows, determining appropriate discount rates and other assumptions. Changes in these estimates and assumptions could materially affect the determination of fair value and/or goodwill impairment.
When testing goodwill for impairment, the Company may assess qualitative factors for some or all of our reporting units to determine whether it is more likely than not (that is, a likelihood of more than 50 percent) that the fair value of a reporting unit is less than its carrying amount, including goodwill. Alternatively, the Company may bypass this qualitative assessment for some or all of our reporting units and perform a detailed quantitative test of impairment (step 1). If the Company performs the detailed quantitative impairment test and the carrying amount of the reporting unit exceeds its fair value, the Company would perform an analysis (step 2) to measure such impairment. In 2015, the Company first performed a qualitative assessment to identify and evaluate events and circumstances to conclude whether it is more likely than not that the fair value of the Company’s reporting units are less than its carrying amounts. Based on the Company’s qualitative assessments, the Company concluded that a positive assertion can be made from the qualitative assessment that it is more likely than not that the fair value of the reporting units exceeded their carrying values and no impairments were identified.
The Company reviews the carrying value of its amortizable intangibles and other long-lived assets for impairment at least annually or whenever events or changes in circumstances indicate that the carrying amount of an asset may not be recoverable. Recoverability of long-lived assets is measured by comparing the carrying amount of the asset or asset group to the undiscounted cash flows that the asset or asset group is expected to generate. If the undiscounted cash flows of such assets are less than the carrying amount, the impairment to be recognized is measured by the amount by which the carrying amount of the asset or asset group, if any, exceeds its fair market value. No impairment was deemed to exist as of December 31, 2015.
| F-14 |
(r) Fair Value Measurements
The Company’s assessment of the significance of a particular input to the fair value measurement in its entirety requires judgment and considers factors specific to the asset or liability. Fair value is the price that would be received to sell an asset or paid to transfer a liability in an orderly transaction between market participants at the measurement date. A fair value measurement assumes that the transaction to sell the asset or transfer the liability occurs in the principal market for the asset or liability or, in the absence of a principal market, the most advantageous market. In general, fair values determined by Level 1 inputs utilize quoted prices (unadjusted) for identical instruments that are highly liquid, observable and actively traded in over-the-counter markets. Fair values determined by Level 2 inputs utilize inputs other than quoted prices included in Level 1 that are observable for the asset or liability, either directly or indirectly. Level 2 inputs include quoted prices for similar instruments in active markets, quoted prices for identical or similar instruments in markets that are not active and model-derived valuations whose inputs are observable and can be corroborated by market data. Level 3 inputs are unobservable inputs that are supported by little or no market activity and that are significant to the fair value of the assets or liabilities. In certain cases, the inputs used to measure fair value may fall into different levels of the fair value hierarchy. In such cases, the level in the fair value hierarchy within which the fair value measurement in its entirety falls has been determined based on the lowest level input that is significant to the fair value measurement in its entirety. The Company’s assessment of the significance of a particular input to the fair value measurement in its entirety requires judgment, and considers factors specific to the asset or liability.
The Company’s securities owned and securities sold and not yet purchased are comprised of common stocks, corporate bonds and investments in partnerships. Investments in common stocks are based on quoted prices in active markets which are included in Level 1 of the fair value hierarchy. The Company also holds nonpublic common stocks and warrants for which there is little or no public market and fair value is determined by management on a consistent basis. For investments where little or no public market exists, management’s determination of fair value is based on the best available information which may incorporate management’s own assumptions and involves a significant degree of judgment, taking into consideration various factors including earnings history, financial condition, recent sales prices of the issuer’s securities and liquidity risks. These investments are included in Level 3 of the fair value hierarchy. Investments in partnership interests include investments in private equity partnerships that primarily investment in equity securities, bonds, and direct lending funds. The Company’s partnership interests are valued based on the Company’s proportionate share of the net assets of the partnership which is derived from the most recent statements received from the general partner which are included in Level 2 of the fair value hierarchy.
The fair value of mandatorily redeemable noncontrolling interests is determined based on the issuance of similar interests for cash, references to industry comparables, and relied, in part, on information obtained from appraisal reports and internal valuation models.
The following tables present information on the financial assets and liabilities measured and recorded at fair value on a recurring basis as of December 31, 2015 and 2014.
| Financial Assets and Liabilities Measured at Fair Value | ||||||||||||||||
| on a Recurring Basis at December 31, 2015, Using | ||||||||||||||||
| Quoted prices in | Other | Significant | ||||||||||||||
| Fair Value at | active markets for | observable | unobservable | |||||||||||||
| December 31, | identical assets | inputs | inputs | |||||||||||||
| 2015 | (Level 1) | (Level 2) | (Level 3) | |||||||||||||
| Assets: | ||||||||||||||||
| Securities owned | ||||||||||||||||
| Common stocks | $ | 17,586 | $ | 17,296 | $ | - | $ | 290 | ||||||||
| Corporate bonds | 941 | - | 941 | - | ||||||||||||
| Partnership interests | 7,016 | - | 5,250 | 1,766 | ||||||||||||
| Total assets measured at fair value | $ | 25,543 | $ | 17,296 | $ | 6,191 | $ | 2,056 | ||||||||
| Liabilities: | ||||||||||||||||
| Securities sold not yet purchased | ||||||||||||||||
| Corporate bonds | $ | 713 | $ | - | $ | 713 | $ | - | ||||||||
| Mandatorily redeemable noncontrolling interests issued after November 5, 2003 | $ | 2,330 | $ | - | $ | - | $ | 2,330 | ||||||||
| Contingent consideration | $ | 2,391 | $ | - | $ | - | $ | 2,391 | ||||||||
| Total liabilities measured at fair value | $ | 5,434 | $ | - | $ | 713 | $ | 4,721 | ||||||||
| Financial Assets and Liabilities Measured at Fair Value | ||||||||||||||||
| on a Recurring Basis at December 31, 2014, Using | ||||||||||||||||
| Quoted prices in | Other | Significant | ||||||||||||||
| Fair Value at | active markets for | observable | unobservable | |||||||||||||
| December 31, | identical assets | inputs | inputs | |||||||||||||
| 2014 | (Level 1) | (Level 2) | (Level 3) | |||||||||||||
| Assets: | ||||||||||||||||
| Securities owned | ||||||||||||||||
| Common stocks | $ | 16,667 | $ | 16,348 | $ | - | $ | 319 | ||||||||
| Corporate bonds | 1,188 | - | 1,188 | - | ||||||||||||
| Partnership interests | 100 | - | 100 | - | ||||||||||||
| Total assets measured at fair value | $ | 17,955 | $ | 16,348 | $ | 1,288 | $ | 319 | ||||||||
| Liabilities: | ||||||||||||||||
| Securities sold not yet purchased | ||||||||||||||||
| Corporate bonds | $ | 746 | $ | - | $ | 746 | $ | - | ||||||||
| Mandatorily redeemable noncontrolling interests issued after November 5, 2003 | $ | 2,285 | $ | - | $ | - | $ | 2,285 | ||||||||
| Total liabilities measured at fair value | $ | 3,031 | $ | - | $ | 746 | $ | 2,285 | ||||||||
| F-15 |
The changes in Level 3 fair value hierarchy during the year ended December 31, 2015 and 2014 is as follows:
| Level 3 | Level 3 Changes During the Year | Level 3 | ||||||||||||||||||||||
| Balance at | Fair | Relating to | Purchases, | Transfer in | Balance at | |||||||||||||||||||
| Beginning of | Value | Undistributed | Sales and | and/or out | End of | |||||||||||||||||||
| Period | Adjustments | Earnings | Settlements | of Level 3 | Period | |||||||||||||||||||
| Year Ended December 31, 2015 | ||||||||||||||||||||||||
| Common stocks | $ | 319 | $ | - | $ | - | $ | (29 | ) | $ | - | $ | 290 | |||||||||||
| Partnership interests | $ | - | $ | 79 | $ | - | $ | 1,687 | $ | - | $ | 1,766 | ||||||||||||
| Mandatorily redeemable noncontrolling interests issued after November 5, 2003 | $ | 2,285 | $ | - | $ | 45 | $ | - | $ | - | $ | 2,330 | ||||||||||||
| Contingent consideration | $ | - | $ | 2,391 | $ | - | $ | - | $ | - | $ | 2,391 | ||||||||||||
| Year Ended December 31, 2014 | ||||||||||||||||||||||||
| Common stocks | $ | - | $ | - | $ | - | $ | 319 | $ | - | $ | 319 | ||||||||||||
| Mandatorily redeemable noncontrolling interests issued after November 5, 2003 | $ | 2,273 | $ | - | $ | 103 | $ | (91 | ) | $ | - | $ | 2,285 | |||||||||||
The amount reported in the table above for the years ended December 31, 2015 and December 31, 2014 includes the amount of undistributed earnings attributable to the noncontrolling interests that is distributed on a quarterly basis. The fair value adjustment for contingent consideration in the table above of $2,391 includes the initial value of contingent consideration of $2,229 and an adjustment for imputed interest of $162 for the year ended December 31, 2015. The amounts reported in the table above for the year ended December 31, 2015 includes $2,687 of partnership interests purchased which is included in securities owned at December 31, 2015. The amounts reported in the table above for the year ended December 31, 2014 includes settlements of $91 related to the repurchase of noncontrolling interests from one of our majority owned limited liability company subsidiaries and $319 of common stock purchased which is included in securities owned at December 31, 2014.
The carrying amounts reported in the consolidated financial statements for cash, restricted cash, accounts receivable, accounts payable and accrued expenses and other current liabilities approximate fair value based on the short-term maturity of these instruments. The carrying amounts of the notes payable (including credit lines used to finance liquidation engagements) and long-term debt approximate fair value because the contractual interest rates or effective yields of such instruments are consistent with current market rates of interest for instruments of comparable credit risk.
(s) Derivative and Foreign Currency Translation
The Company periodically uses derivative instruments, which primarily consist of the purchase of forward exchange contracts, for certain auction and liquidation engagements with operations outside the United States. During 2015, the Company’s use of derivatives consists of forward exchange contract agreements totaling $16,870 Canadian dollars at various times during the year. The forward exchange contracts were entered into to improve the predictability of cash flows related to retail store liquidation and wholesale and industrial auction engagements. The net gains and losses from foreign exchange contracts are reported as a component of selling, general and administrative expenses in the condensed consolidated financial statements. The net gain from forward exchange contracts was $13 during the year ended December 31, 2015.
The Company transacts business in various foreign currencies. In countries where the functional currency of the underlying operations has been determined to be the local country's currency, revenues and expenses of operations outside the United States are translated into United States dollars using average exchange rates while assets and liabilities of operations outside the United States are translated into United States dollars using year-end exchange rates. The effects of foreign currency translation adjustments are included in stockholders' equity as a component of accumulated other comprehensive income in the accompanying consolidated balance sheets. Transaction losses were $271 and $137 during the years ended December 31, 2015 and 2014, respectively, and transaction gains were $257 during the year ended December 31, 2013. These amounts are included in selling, general and administrative expenses in our consolidated statements of operations.
(t) Supplemental Cash Flows Disclosure
During the year ended December 31, 2014, supplemental non-cash activity included a decrease in long term debt of $18,759 related to the discount on the retirement of the long term debt payable to Andrew Gumaer and Harvey Yellen, the two former Great American Members (as more fully described in Notes 1 and 11), both of whom were executive officers and directors of the Company at the time of such retirement. The $48,759 principal amount of long-term debt was repaid in full with a cash payment of $30,000 on June 5, 2014. The discount of $18,759 has been recorded as a capital contribution to additional paid in capital in our consolidated financial statements.
| F-16 |
(u) Recent Accounting Pronouncements
In February 2016, the Financial Accounting Standards Board (“FASB”) issued Accounting Standards Update (“ASU”) No. 2016-02: Leases (Topic 842) (“ASU 2016-02”). The amendments in this update require lessees, among other things, to recognize lease assets and lease liabilities on the balance sheet for those leases classified as operating leases under previous authoritative guidance. This update also introduces new disclosure requirements for leasing arrangements. ASU 2016-02 will be effective for the Company in fiscal year 2019, but early application is permitted. The Company is currently evaluating the impact of this update on the consolidated financial statements.
In November 2015, the FASB issued ASU 2015-17, Income Taxes (Topic 740): Balance Sheet Classification of Deferred Taxes, which simplifies the presentation of deferred income taxes by requiring deferred tax assets and liabilities be classified as noncurrent on the balance sheet. The updated standard is effective for the Company at the beginning of its first quarter 2017, with early application permitted as of the beginning of any interim or annual reporting period. The Company elected to early adopt this standard as of December 31, 2015, and retrospectively reclassified $6,420 of our current deferred tax assets to noncurrent deferred tax assets as of December 31, 2014.
In February 2015, the FASB issued ASU 2015-2, Consolidation (Topic 810): Amendments to the Consolidation Analysis, that provides guidance which makes targeted amendments to current consolidation guidance. Among other things, the standard changes the manner in which we would assesses one of the characteristics of variable interest entities (VIEs) and introduces a separate analyses specific to limited partnerships and similar entities for assessing if the equity holders at risk lack decision making. Limited partnerships and similar entities will be a VIE unless the limited partners hold substantive kick-out rights or participating rights. A right to liquidate an entity is akin to a kick-out right. Guidance for limited partnerships under the voting model has been eliminated. A limited partner and similar partners with a controlling financial interest obtained through substantive kick out rights would consolidate a limited partnership or similar entity. The guidance is effective for our annual and interim periods beginning in 2016. Early adoption is allowed. The Company does not expect the impact of this update to have a material impact on the consolidated financial statements.
In May 2014, the FASB issued ASU 2014-09, Revenue from Contracts with Customers, which amends revenue recognition requirements for multiple deliverable revenue arrangements. This update provides guidance on how revenue is recognized to depict the transfer of promised goods or services to customers in an amount that reflects the consideration to which the entity expects to be entitled in exchange for the goods or services. This determination is made in five steps: (i) identify the contract with the customer; (ii) identify the performance obligations in the contract; (iii) determine the transaction price; (iv) allocate the transaction price to the performance obligations in the contract; and (v) recognize revenue when (or as) the entity satisfies a performance obligation. The update is effective for annual reporting periods after December 15, 2016 and for interim reporting periods within that reporting period. Early adoption is not permitted. The Company has not yet adopted this update and is currently evaluating the impact it may have on its financial condition and results of operations.
NOTE 3— ACQUISITIONS
Acquisition of MK Capital
On January 2, 2015 the Company entered into a purchase agreement to acquire all of the equity interests of MK Capital, a wealth management business with operations primarily in New York. The terms of the purchase agreement required the sellers to meet certain pre-closing conditions. On February 2, 2015, the closing conditions were satisfied and the Company completed the purchase of MK Capital for a total purchase price of $9,386. The purchase price is comprised of a cash payment in the amount of $2,500 and 333,333 newly issued shares of the Company’s common stock at closing which were valued at $2,687 for accounting purposes determined based on the closing market price of the Company’s shares of common stock on the acquisition date on February 2, 2015, less a 19.4% discount for lack of marketability as the shares issued are subject to certain restrictions that limit their trade or transfer. The purchase agreement also requires the payment of contingent consideration in the form of future cash payments with a fair value of $2,229 and the issuance of common stock with a fair value of $1,970. The contingent cash consideration of $2,229 has been recorded based on the payment of the contingent cash consideration of $1,250 on the first anniversary date of the closing (February 2, 2016) and a final cash payment of $1,250 on the second anniversary date of the closing (February 2, 2017) to the former members of MK Capital discounted at 8.0% per annum (initial discount of $271). In accordance with ASC 805, “Business Combination” (“ASC 805”), the contingent consideration liability has been classified as a liability on the acquisition date. Imputed interest expense totaled $162 for the year ended December 31, 2015. The balance of the contingent consideration liability was $2,391 at December 31, 2015 (discount of $109 at December 31, 2015) and has been recorded as contingent consideration liability – current portion in the amount of $1,241 and contingent consideration liability, net of current portion in the amount of $1,150 in the consolidated balance sheet. The fair value of the contingent stock consideration in the amount of $1,970 has been classified as equity in accordance with ASC 805, and is comprised of the issuance of 166,667 shares of common stock on the first anniversary date of the closing (February 2, 2016) and 166,666 shares of common stock on the second anniversary date of the closing (February 2, 2017). The contingent cash and stock consideration is payable on the first and second anniversary dates of the closing provided that MK Capital generates a minimum amount of gross revenues as defined in the purchase agreement for the twelve months ending on the first and second anniversary dates of the closing. MK Capital achieved the minimum amount of revenues for the first anniversary period and the contingent cash consideration and contingent stock consideration for such first anniversary period was paid and issued on February 2, 2016. The MK Capital acquisition has been accounted for under the acquisition method of accounting. The assets and liabilities, both tangible and intangible, were recorded at their estimated fair values as of the February 2, 2015 acquisition date for MK Capital. The application of the acquisition method of accounting resulted in goodwill of $6,971 which is deductible for tax purposes. The acquisition of MK Capital allows the Company to expand into the wealth management business.
| F-17 |
In connection with the issuance of common stock to the members of MK Capital, the Company entered into a registration rights agreement which allows the selling members of MK Capital to register their shares upon the Company filing a prospectus or registration statement at any time subsequent to the acquisition of MK Capital. The Company filed a registration statement with the Securities and Exchange Commission on May 22, 2015 that covers the resale of the common stock issued and potentially issuable in the acquisition of MK Capital, and such registration statement, as amended, was declared effective on July 2, 2015.
The purchase price allocation was as follows:
| Tangible assets acquired and assumed: | ||||
| Cash and cash equivalents | $ | 49 | ||
| Accounts receivable | 8 | |||
| Prepaid expenses and other assets | 30 | |||
| Property and equipment | 15 | |||
| Accounts payable and accrued liabilities | (87 | ) | ||
| Customer relationships | 2,400 | |||
| Goodwill | 6,971 | |||
| Total | $ | 9,386 |
The amount of revenue and earnings attributable to MK Capital in the Company’s consolidated statement of operations during the year ended December 31, 2015 were as follows:
| Period from | ||||
| February 2, 2015 | ||||
| through | ||||
| December 31, 2015 | ||||
| Revenues | $ | 1,772 | ||
| Income before income taxes | 457 | |||
Acquisition of B. Riley and Co. Inc.
On June 18, 2014, the Company completed the acquisition of BRC Inc. pursuant to the terms of the Acquisition Agreement (the “Acquisition Agreement”), dated as of May 19, 2014, by and among the Company, Darwin Merger Sub I, Inc., a wholly owned subsidiary of the Company, B. Riley Capital Markets, LLC, a wholly owned subsidiary of the Company (“BCM”), BRC Inc., B. Riley & Co. Holdings, LLC (“BRH”), Riley Investment Management LLC (“RIM,” and collectively with BRC, Inc. and BRH, the “B. Riley Entities”) and Bryant Riley, a director of the Company and principal owner of each of the B. Riley Entities. In connection with the Company’s acquisition of BRC Inc., Darwin Merger Sub I, Inc. merged with and into BRC Inc., and BRC Inc. subsequently merged with and into BCM, with BCM surviving as a wholly owned subsidiary of the Company. The Company completed the acquisitions of BRH and RIM on August 1, 2014 in accordance with the terms of the Acquisition Agreement.
The Company acquired BRC Inc. in exchange for the issuance of 4,182,637 shares of newly issued for a total purchase price of $26,351. The fair value of the newly issued shares of the Company’s common stock for accounting purposes was determined based on the closing market price of the Company’s shares of common stock on the acquisition date on June 18, 2014, less a 25% discount for lack of marketability as the shares issued are subject to certain restrictions that limit their trade or transfer. The BRC Inc. acquisition has been accounted for under the acquisition method of accounting. The assets and liabilities, both tangible and intangible, were recorded at their estimated fair values as of the June 18, 2014 acquisition date for BRC Inc. and August 1, 2014 for BRH and RIM. The application of the acquisition method of accounting resulted in goodwill of $21,869 which is not deductible for tax purposes. Acquisition related costs, such as legal, accounting, valuation and other professional fees related to the acquisition of BRC Inc. in the amount of $997 were charged against earnings in the second quarter of 2014. All of the recognized goodwill is expected to be non-deductible for tax purposes.
| F-18 |
The purchase price allocation was as follows:
| Tangible assets acquired and assumed: | ||||
| Cash and cash equivalents | $ | 2,667 | ||
| Restricted cash | 50 | |||
| Securities owned | 1,978 | |||
| Accounts receivable | 1,845 | |||
| Prepaid expenses and other assets | 302 | |||
| Property and equipment | 76 | |||
| Accounts payable and accrued liabilities | (3,194 | ) | ||
| Securities sold, not yet purchased | (922 | ) | ||
| Deferred tax liability | (1,120 | ) | ||
| Customer relationships | 1,200 | |||
| Tradename | 1,600 | |||
| Goodwill | 21,869 | |||
| Total | $ | 26,351 |
The amount of revenue and earnings attributable to BRC Inc. in the Company’s consolidated statement of operations during the year ended December 31, 2014 were as follows:
| Period from | ||||
| June 18, 2014 | ||||
| Through | ||||
| December 31, 2014 | ||||
| Revenues | $ | 19,420 | ||
| Income before income taxes | 5,244 | |||
Pro Forma Financial Information
The unaudited financial information in the table below summarizes the combined results of operations of the Company and BRC Inc. as well as the related impact of the new employment agreements with Bryant Riley, Andrew Gumaer and Harvey Yellen that became effective upon the acquisition of BRC Inc. on a pro forma basis, as though they had occurred as of January 1, 2013. The pro forma financial information presented includes the effects of adjustments related to the amortization charges from the acquired intangible assets and the elimination of certain activities excluded from the transaction. The pro forma financial information as presented below is for informational purposes only and is not necessarily indicative of the results of operations that would have been achieved if the acquisition had taken place at the beginning of the earliest period presented, nor does it intend to be a projection of future results .
| Pro Forma Unaudited | ||||||||
| Year Ended | Year Ended | |||||||
| December 31, 2014 | December 31, 2013 | |||||||
| Revenues | $ | 91,656 | $ | 102,965 | ||||
| Net (loss) income attributable to B. Riley Financial, Inc. | $ | (3,938 | ) | $ | 4,594 | |||
| Basic (loss) income per share | $ | (0.34 | ) | $ | 0.82 | |||
| Diluted (loss) income per share | $ | (0.34 | ) | $ | 0.81 | |||
| Weighted average basic shares outstanding | 11,533,178 | 5,613,307 | ||||||
| Weighted average diluted shares outstanding | 11,533,178 | 5,674,528 | ||||||
| F-19 |
2012 Acquisition of Shoon Trading Limited
On May 4, 2012, the Company invested $65 for a 44.4% interest in the common stock of Shoon. Shoon purchased the rights to operate the former Shoon internet business and retail stores that were in administration in the United Kingdom. As part of the investment, the Company also loaned Shoon approximately $1,300 that was collateralized by retail inventory. The loan bore interest at an annual rate of LIBOR plus 6.0% payable monthly and had a maturity date of May 3, 2014. In accordance with the Shoon shareholder agreement, the Company had the right to appoint a Chairman of Shoon. Together with the Company’s 44.4% investment in the common stock of Shoon and control of the majority of the board of directors, the Company had a controlling interest in Shoon. On August 2, 2013, an additional loan in the amount of $847 (net of $40 discount) was extended to Shoon with a maturity date of August 3, 2015. This increased the outstanding principal from both loans to $1,371. Interest on the new loan was payable monthly at 6.5%. Both of the loans were collateralized by the inventory of Shoon. In connection with the new loan in August 2013, the Shoon shareholder agreement was amended and restated to eliminate the Company’s super majority voting rights which enable the Company to control the board of directors of Shoon. As a result of this amendment, the Company no longer controls Shoon and the operating results of Shoon are not consolidated for any periods after July 31, 2013. The operating results in the UK Retail Stores reportable segment in Note 20 are comprised of Shoon’s operating results for the period from January 1, 2013 to July 31, 2013. In January 2014, Shoon was sold to a third party and the two loans in the amount of $1,200 were repaid to the Company. As a result of the sale of Shoon, the Company recorded an impairment charge as of December 31, 2013 of $111 to write-down the investment in Shoon to its estimated net realizable value.
In accordance with the accounting guidance for consolidation of variable interest entities, the Company has determined that the additional financing arrangement in the form of the new note receivable with Shoon and the elimination of the Company’s super majority voting rights in August 2013, as discussed above, changed the status of Shoon to a VIE. The Company, in determining whether or not it is the primary beneficiary of Shoon, considered the voting interests of the shareholders of Shoon and the shareholders ability to direct the activities of Shoon. The Company determined it is not the primary beneficiary of the VIE since the Company does not have the ability to exercise any rights or powers to direct the activities of Shoon that most significantly impact Shoon’s economic performance. Accordingly, Shoon’s operating results are not consolidated for any periods after July 31, 2013. The Company’s loss under the equity method of accounting for Shoon was $156 for the five months ended December 31, 2013.
NOTE 4— RESTRUCTURING CHARGE
During the second quarter of 2014, the Company initiated a strategic review of our operations taking into account the planned synergies as a result of the acquisition of BRC Inc. On August 13, 2014, as a result of the strategic review, our Board of Directors ratified and approved the Company’s implementation of cost savings measures that resulted in a reduction in corporate overhead and the restructuring of our operations in Europe. The Company implemented a reduction in force for some of our corporate employees and a significant number of our employees in the United Kingdom and we closed our offices in Deerfield, Illinois and London, England. These initiatives resulted in a restructuring charge of $2,548 in the third quarter of 2014. The restructuring charge consists of payroll and severance costs of $1,595, office closure costs of $686 and other expenses of $267. As a result of such reductions in force and restructuring, which the Company completed in the third quarter of 2014, the Company anticipates a shift in its strategic focus from Europe which may result in a reduction in revenues from our European operations. The related accruals are included in accounts payable and accrued expenses in the consolidated balance sheet. The following table summarizes the restructuring charge during 2014 and 2015:
| Auction and | Valuation and | Corporate and | ||||||||||||||
| Liquidation | Appraisal | Other | ||||||||||||||
| Segment | Segment | Expenses | Total | |||||||||||||
| Expensed during 2014: | ||||||||||||||||
| Payroll and severance costs | $ | 951 | $ | 131 | $ | 513 | $ | 1,595 | ||||||||
| Office closure | 295 | 8 | 383 | 686 | ||||||||||||
| Other charges | 93 | 64 | 110 | 267 | ||||||||||||
| Total expended during the 2014 | 1,339 | 203 | 1,006 | 2,548 | ||||||||||||
| Paid during 2014 | 1,208 | 203 | 647 | 2,058 | ||||||||||||
| Accrued balance at December 31, 2014 | 131 | - | 359 | 490 | ||||||||||||
| Paid during 2015 | 91 | - | 212 | 303 | ||||||||||||
| Accrued balance at December 31, 2015 | $ | 40 | $ | - | $ | 147 | $ | 187 | ||||||||
| F-20 |
NOTE 5— ACCOUNTS RECEIVABLE
The components of accounts receivable net include the following:
| December 31, | December 31, | |||||||
| 2015 | 2014 | |||||||
| Accounts receivable | $ | 8,417 | $ | 7,797 | ||||
| Investment banking fees, commissions and other receivables | 709 | 1,608 | ||||||
| Unbilled receivables | 435 | 1,421 | ||||||
| Total accounts receivable | 9,561 | 10,826 | ||||||
| Allowance for doubtful accounts | (89 | ) | (728 | ) | ||||
| Accounts receivable, net | $ | 9,472 | $ | 10,098 | ||||
Additions and changes to the allowance for doubtful accounts consist of the following:
| Year Ended December 31, | ||||||||||||
| 2015 | 2014 | 2013 | ||||||||||
| Balance, beginning of year | $ | 728 | $ | 275 | $ | 371 | ||||||
| Add: Additions to reserve | 718 | 532 | 18 | |||||||||
| Less: Write-offs | (1,056 | ) | (79 | ) | (84 | ) | ||||||
| Less: Recoveries | (301 | ) | - | (30 | ) | |||||||
| Balance, end of year | $ | 89 | $ | 728 | $ | 275 | ||||||
Unbilled receivables represent the amount of contractual reimbursable costs and fees for services performed in connection with fee and service based auction and liquidation contracts.
At December 31, 2015 and 2014, accounts receivable in the amount of $3,922 and $2,385, respectively, were collateralized by the new accounts receivable revolving line of credit more fully described in Note 10.
NOTE 6— GOODS HELD FOR SALE OR AUCTION
Goods held for sale or auction consists of the following:
| December 31, | ||||||||
| 2015 | 2014 | |||||||
| Machinery and equipment | $ | - | $ | 4,026 | ||||
| Aircraft parts and other | 37 | 91 | ||||||
| Total | $ | 37 | $ | 4,117 | ||||
Goods held for sale or auction includes machinery and equipment and aircraft parts and other. At December 31, 2014, machinery and equipment consisted of five oils rigs with a carrying value of $4,026 which includes a lower-of-cost or market adjustment of $1,782 for one of the oil rigs. Aircraft parts and other is primarily comprised of aircraft parts with a carrying value of $37 and $91 which includes a lower of cost or market adjustment of $1,330 and $1,297 as of December 31, 2015 and 2014, respectively. The total amount recorded by the Company for a lower-of-cost or market adjustment for goods held for sale or auction was $33, $4,673 and $405 during the years ended December 31, 2015, 2014 and 2013, respectively. During 2013, goods held for sale or auction also included leased equipment for which the Company recorded depreciation of $1,252 during the year ended December 31, 2013.
The machinery and equipment with a carrying value of $4,026 as of December 31, 2014 served as collateral for the related note payable, which had an outstanding principal amount of $6,570 as of December 31, 2014. The machinery and equipment was owned by GAGEE, a wholly-owned special purpose subsidiary of the Company, which filed for bankruptcy in the first quarter of 2015 as more fully described in Note 11. As a result of the bankruptcy filing, the asset and liabilities of GAGEE including the machinery and equipment is no longer consolidated in the Company’s consolidated financial statements.
| F-21 |
NOTE 7— PROPERTY AND EQUIPMENT
Property and equipment consists of the following:
| Estimated | December 31, | |||||||||
| Useful Lives | 2015 | 2014 | ||||||||
| Leasehold improvements | Shorter of lease or estimated useful life | $ | 311 | $ | 244 | |||||
| Machinery, equipment and computer software | 3 years | 2,400 | 2,280 | |||||||
| Furniture and fixtures | 5 years | 1,160 | 1,151 | |||||||
| Capital lease equipment | 3 to 5 years | 388 | 388 | |||||||
| Total | 4,259 | 4,063 | ||||||||
| Less: Accumulated depreciation and amortization | (3,667 | ) | (3,287 | ) | ||||||
| $ | 592 | $ | 776 | |||||||
Depreciation expense was $417, $505 and $611 during the years ended December 31, 2015, 2014, and 2013, respectively.
NOTE 8— GOODWILL AND OTHER INTANGIBLE ASSETS
The changes in the carrying amount of goodwill for the years ended December 31, 2014 and 2014 are as follows:
| Auction and | Valuation and | Capital | ||||||||||||||
| Liquidation | Appraisal | Markets | ||||||||||||||
| Segment | Segment | Segment | Total | |||||||||||||
| Balance as of December 31, 2013 | $ | 1,975 | $ | 3,713 | $ | - | $ | 5,688 | ||||||||
| Goodwill acquired during the period: | ||||||||||||||||
| BRC acquisition on June 18, 2014 | - | - | 21,869 | 21,869 | ||||||||||||
| Balance as of December 31, 2014 | 1,975 | 3,713 | 21,869 | 27,557 | ||||||||||||
| Goodwill acquired during the period: | ||||||||||||||||
| MK Capital acquisition on February 2, 2015 | - | - | 6,971 | 6,971 | ||||||||||||
| Balance as of December 31, 2015 | $ | 1,975 | $ | 3,713 | $ | 28,840 | $ | 34,528 | ||||||||
Intangible assets consisted of the following:
| December 31, 2015 | December 31, 2014 | |||||||||||||||||||||||||
| Gross | Gross | |||||||||||||||||||||||||
| Carrying | Accumulated | Intangibles | Carrying | Accumulated | Intangibles | |||||||||||||||||||||
| Useful Life | Value | Amortization | Net | Value | Amortization | Net | ||||||||||||||||||||
| Amortizable assets: | ||||||||||||||||||||||||||
| Customer relationships | 4 to 13 Years | $ | 3,600 | $ | 572 | $ | 3,028 | $ | 1,200 | $ | 141 | $ | 1,059 | |||||||||||||
| Non-amortizable assets: | ||||||||||||||||||||||||||
| Tradenames | 1,740 | - | 1,740 | 1,740 | - | 1,740 | ||||||||||||||||||||
| Total intangible assets | $ | 5,340 | $ | 572 | $ | 4,768 | $ | 2,940 | $ | 141 | $ | 2,799 | ||||||||||||||
Amortization expense was $431 and $141 for the years ended December 31, 2015 and 2014, respectively. At December 31, 2015, estimated future amortization expense is $447, $447, $326, $222 and $222 for the years ended December 31, 2016, 2017, 2018, 2019 and 2020, respectively. The estimated future amortization expense after December 31, 2020 is $1,364.
| F-22 |
NOTE 9— LEASING ARRANGEMENTS
The Company has several noncancellable operating leases that expire at various dates through 2019. Future minimum lease payments under noncancellable operating leases (with initial or remaining lease terms in excess of one year) as of December 31, 2015 are:
| Operating | ||||
| Leases | ||||
| Year Ending December 31: | ||||
| 2016 | $ | 2,470 | ||
| 2017 | 1,578 | |||
| 2018 | 1,273 | |||
| 2019 | 460 | |||
| Total minimum lease payments | $ | 5,781 | ||
Rent expense under all operating leases was $2,376, $2,107 and $1,717 for the years ended December 31, 2015, 2014, and 2013, respectively. Rent expense is included in selling, general and administrative expenses in the accompanying consolidated statement of operations.
NOTE 10— CREDIT FACILITIES
Credit facilities consist of the following arrangements:
(a) $100,000 Asset Based Credit Facility
On July 15, 2013, the Company entered into a Second Amended and Restated Credit Agreement (“Credit Agreement”) with Wells Fargo Bank, National Association (“Wells Fargo Bank”) that amended and restated that certain First Amended and Restated Credit Agreement dated as of December 31, 2010. The maximum revolving loan amount under the asset based credit facility remains at $100,000, less the aggregate principal amount borrowed under the UK Credit Agreement (if in effect), and the maturity date has been extended from July 16, 2013 to July 15, 2018. The asset based credit facility can be used for borrowings and letter of credit obligations up to the aggregate amount of $100,000, less the aggregate principal amount borrowed under the UK Credit Agreement (if in effect). The interest rate for each revolving credit advance under the Credit Agreement is, subject to certain terms and conditions, equal to the LIBOR plus a margin of 2.25% to 3.25% depending on the type of advance and the percentage such advance represents of the related transaction for which such advance is provided. The restated Credit Agreement removed the Company’s United Kingdom subsidiary as a party to such agreement and the concept of borrowings thereunder for certain transactions in the United Kingdom. On March 19, 2014, the Company entered into a separate credit agreement (a “UK Credit Agreement”) with an affiliate of Wells Fargo Bank which provides for the financing of transactions in the United Kingdom. The facility allows the Company to borrow up to 50 million British Pounds. Any borrowings on the UK Credit Agreement reduce the availability on the asset based $100,000 credit facility. The UK Credit Agreement is cross collateralized and integrated in certain respects with the Credit Agreement. Cash advances and the issuance of letters of credit under the credit facility are made at the lender’s discretion. The letters of credit issued under this facility are furnished by the lender to third parties for the principal purpose of securing minimum guarantees under liquidation services contracts more fully described in Note 2(c). All outstanding loans, letters of credit, and interest are due on the expiration date which is generally within 180 days of funding. The credit facility is secured by the proceeds received for services rendered in connection with liquidation service contracts pursuant to which any outstanding loan or letters of credit are issued and the assets that are sold at liquidation related to such contract. The credit facility also provides for success fees in the amount of 5% to 20% of the net profits, if any, earned on the liquidation engagements funded under the Credit Agreement as set forth therein. On July 15, 2014, the Company entered into a further amendment to the Credit Agreement whereby Wells Fargo Bank consented to the reverse stock split, Private Placement, repayment of long-term debt as more fully described in Note 11, and the acquisition of BRC Inc. Interest expense totaled $343 (including success fees of $119), $400 (including success fees of $162) and $532 (including success fees of $292) for the years ended December 31, 2015, 2014 and 2013, respectively. There was no outstanding balance under this credit facility at December 31, 2015 and the outstanding balance under this credit facility was $18,506 at December 31, 2014.
The Credit Agreement governing the credit facility contains certain covenants, including covenants that limit or restrict the Company’s ability to incur liens, incur indebtedness, make investments, dispose of assets, make certain restricted payments, merge or consolidate and enter into certain transactions with affiliates. Upon the occurrence of an event of default under the Credit Agreement, the lender may cease making loans, terminate the Credit Agreement and declare all amounts outstanding under the Credit Agreement to be immediately due and payable. The Credit Agreement specifies a number of events of default (some of which are subject to applicable grace or cure periods), including, among other things, nonpayment defaults, covenant defaults, cross-defaults to other material indebtedness, bankruptcy and insolvency defaults, and material judgment defaults.
| F-23 |
(b) Line of Credit
On May 17, 2011, GAAV entered into a Loan and Security Agreement (Accounts Receivable Line of Credit) (the “Line of Credit”) with BFI Business Finance (“BFI”). The Line of Credit is collateralized by the accounts receivable of GAAV and allows for borrowings in the amount of 85% of the net face amount of prime accounts, as defined in the Line of Credit, with maximum borrowings not to exceed $2,000. The interest rate under the Line of Credit is the prime rate plus 2% (6.5% at December 31, 2015), payable monthly in arrears. The Line of Credit was amended effective February 3, 2012 and the maximum borrowings allowed was increased from $2,000 to $3,000. On December 7, 2015, the Company notified BFI to terminate the line of credit upon maturity on February 3, 2016. At December 31, 2015, there was $3,922 of accounts receivable as collateral for the Line of Credit and the total borrowings outstanding was $272 and $2,738 was available and unused. Interest expense totaled $84, $46 and $90 for the years ended December 31, 2015, 2014 and 2013, respectively.
NOTE 11— NOTES PAYABLE
(a) Note Payable Collateralized by Machinery and Equipment
On May 29, 2008, GAGEE entered into a credit agreement with Garrison Special Opportunities Fund LP and Gage Investment Group LLC (collectively, the “Lenders”) to finance the purchase of certain machinery and equipment to be sold at auction or liquidation. The principal amount of the loan was $12,000 and borrowings bore interest at a rate of 20% per annum. The loan is collateralized by the machinery and equipment which were purchased with the proceeds from the loan as more fully described in Note 6. GAGEE was required to make principal and interest payments from proceeds from the sale of the machinery and equipment. GAGEE is a special purpose entity created to purchase the machinery and equipment, whose assets consist only of the machinery and equipment in question and whose liabilities are limited to the Lenders’ note and certain operational expenses related to this transaction. Great American Group, LLC guaranteed GAGEE’s liabilities to the Lenders up to a maximum of $1,200. The original maturity date of the loan was May 29, 2009; however, GAGEE exercised its right to extend the maturity date for 120 days until September 26, 2009. On September 26, 2009, the note payable became due and payable.
On October 8, 2009, GAGEE and Great American Group, LLC entered into a Forbearance Agreement effective as of September 27, 2009 (the “Forbearance Agreement”) with the Lenders and Garrison Loan Agency Services LLC (the “Administrative Agent”), relating to the credit agreement, by and among GAGEE, as borrower, Great American Group, LLC, as guarantor, the Lenders and the Administrative Agent. Pursuant to the terms of the Forbearance Agreement, the Lenders agreed to forbear from exercising any of the remedies available to them under the credit agreement and the related security agreement unless a forbearance default occurs, as specified in the Forbearance Agreement. Pursuant to the Forbearance Agreement, and further amendments to the credit agreement for which the most recent amendment which was effective December 31, 2013 the maturity date of the note payable was extended to June 30, 2015 and the interest rate remained at 0% through maturity. GAGEE has no assets other than those collateralizing the loan which is comprised of prepaid and other current assets of $2,531 and machinery and equipment with a carrying value of $4,026 that is included in goods held for sale or auction in the accompanying balance sheet at December 31, 2014. Great American Group, LLC has satisfied its obligation to pay the $1,200 guarantee and the credit agreement does not provide for other recourse against Great American Group, LLC. At December 31, 2014, the note payable balance was $6,570.
On January 11, 2015, GAGEE filed a voluntary petition with the United States Bankruptcy Court for the Northern District of Texas for relief under Chapter 7 of Title 11 of the United States Code. At December 31, 2014, GAGEE had total assets of $6,557 and total liabilities of $6,570. Total assets included $2,531 of other receivables included in prepaid and other current assets and $4,026 of goods held for sale which was comprised of five oil rigs (see Note 6). Total liabilities include the $6,570 of notes payable discussed above that is collateralized by the assets of GAGEE. As a result of such bankruptcy filing, the assets and liabilities of GAGEE described above are no longer consolidated in the Company's consolidated financial statements for periods subsequent to such bankruptcy filing. In January 2015, upon GAGEE’s filing for bankruptcy the Company recorded a loss on the deconsolidation of GAGEE of $13. On June 29, 2015, the trustee handling the bankruptcy case for GAGEE was discharged and the bankruptcy case was closed. As a result of this process, the Lenders are proceeding with the disposition of the assets of GAGEE in accordance with their security interest in connection with their loan. At the present time, the Company does not have any remaining investment or any obligations with respect to GAGEE’s liabilities. The Company intends to dissolve GAGEE and wind up its business. If any future expenses or losses are incurred by GAGEE during its wind up, the Company will record its share of losses under the equity method of accounting. Management does not expect these events or any subsequent related actions regarding GAGEE will have a material impact on the consolidated financial position of the Company.
| F-24 |
(b) $4,500 Note Payable to Related Party – Riley Investment Partners, L.P.
In March 2015, the Company had capital deployed for three retail liquidation engagements. On March 10, 2015, the Company borrowed $4,500 from Riley Investment Partners, L.P. (“RIP”) in accordance with the subordinated unsecured promissory note (the “RIP Note”). The principal amount of $4,500 for the RIP Note accrued interest at the rate of 10% per annum (or 15% in the event of a default under the RIP Note). The borrowings were for short-term working capital needs and capital for other retail liquidation engagements. RIP was also entitled to a success fee (the “Success Fee”) of 20% of the net profit, if any, earned by the Company in connection with a designated liquidation transaction. Pursuant to the terms of the RIP Note, under no circumstances was the Company obligated to pay RIP any portion of the combined amount of interest and the Success Fee which exceeded twelve percent (12%) of the $4,500 principal amount of the RIP Note. The outstanding principal amount, together with the accrued and unpaid interest and the Success Fee, were due and payable by the Company on March 9, 2016. The RIP Note was subordinated in certain respects to the Company’s guaranty relating to its existing credit facility with Wells Fargo Bank, National Association and, in the event of certain insolvency proceedings, with respect to such credit facility itself, as well as to any other indebtedness of the Company to the extent required by the documents governing the repayment thereof. Interest expense on the RIP Note totaled $194 for the year ended December 31, 2015, which includes success fees of $126. The RIP Note was repaid on May 4, 2015.
Riley Investment Management LLC, a wholly owned subsidiary of the Company, is the general partner of RIP. Bryant Riley, the Chief Executive Officer and Chairman of the Board of Directors of the Company, owns or controls approximately 45% of the equity interests of RIP. In addition, Thomas Kelleher, the President and a director of the Company, and one other employee of the Company, own or control de minimis amounts of the equity interests of RIP. After considering the economic interests of Mr. Riley and Mr. Kelleher in the RIP Note and comparing the terms of the RIP Note to terms that may have been available from unaffiliated third parties, the disinterested members of the Company’s Board of Directors unanimously approved the issuance of the RIP Note.
(c) $60,000 Notes Payable
As of December 31, 2013, there was $50,483 of aggregate principal balance outstanding on the original $60,000 of notes payable. Of the $50,483 outstanding principal balance at December 31, 2013, $48,759 was owed to Andrew Gumaer, a member of our Board of Directors and an executive officer, and Harvey Yellen, a former director and executive officer (all of which accrued interest at 3.75%) and $1,724 was owed to other related parties, $1,084 of which accrued interest at 3.75% and $640 of which accrued interest at 12.0%.
On January 31, 2014, the Company paid in full the $640 of principal balance for the notes that had the 12.0% interest rate. The remaining $1,084 of principal amount payable had a maturity date of July 31, 2014. The $48,759 principal amount payable to Messrs. Gumaer and Yellen had a maturity date of July 31, 2018. On June 5, 2014, the Company used $30,180 of the net proceeds from the Private Placement to repay the Notes payable to Andrew Gumaer and Harvey Yellen. The $30,000 principal payment and then outstanding accrued interest of $180 retired the entire $48,759 face amount of outstanding Notes payable to Andrew Gumaer and Harvey Yellen. The discount of $18,759 for the repayment of the Notes payable to Andrew Gumaer and Harvey Yellen has been recorded as a capital contribution to additional paid in capital in our consolidated financial statements. On July 31, 2014, the remaining outstanding principal amount of $1,085 was paid in full to the Phantom Equityholders. As of August 1, 2014, there is no remaining outstanding principal or interest payable on the notes payable. Interest expense was $812 and $2,014 for the years ended December 31, 2014 and 2013, respectively.
NOTE 12— COMMITMENTS AND CONTINGENCIES
(a) Letters of Credit
There were no letters of credit outstanding at December 31, 2015. At December 31, 2014, there were letters of credit outstanding in the amount of $8,553 related to two retail liquidation engagements.
(b) Legal Matters
In January 2015, the Company was served with a lawsuit that seeks to assert claims of breach of contract and other matters with damages in an amount up to $10,000. In April 2015, the Company filed a motion to dismiss the lawsuit and in March 2016 the Court issued its’ opinion dismissing some claims while denying the motion with respect to other claims. The Company is continuing to vigorously defending this lawsuit. This lawsuit is in the initial stages, the financial impact to the Company, if any, cannot be estimated.
The Company is subject to certain legal and other claims that arise in the ordinary course of its business. The Company does not believe that the results of these claims are likely to have a material effect on its consolidated financial position or results of operations.
| F-25 |
NOTE 13— INCOME TAXES
The Company’s provision (benefit) for income taxes consists of the following for the years ended December 31, 2015, 2014 and 2013:
| Year Ended December 31, | ||||||||||||
| 2015 | 2014 | 2013 | ||||||||||
| Current: | ||||||||||||
| Federal | $ | 201 | $ | - | $ | - | ||||||
| State | 99 | 98 | 2 | |||||||||
| Foreign | 779 | - | (287 | ) | ||||||||
| Total current provision | 1,079 | 98 | (285 | ) | ||||||||
| Deferred: | ||||||||||||
| Federal | 5,166 | (2,503 | ) | 791 | ||||||||
| State | 1,443 | (481 | ) | 198 | ||||||||
| Foreign | - | - | - | |||||||||
| Total deferred | 6,609 | (2,984 | ) | 989 | ||||||||
| Total provision for income taxes | $ | 7,688 | $ | (2,886 | ) | $ | 704 | |||||
A reconciliation of the federal statutory rate of 34% to the effective tax rate for income (loss) before income taxes is as follows for the year ended December 31, 2015, 2014 and 2013:
| Year Ended December 31, | ||||||||||||
| 2015 | 2014 | 2013 | ||||||||||
| Provision for income taxes at federal statutory rate | 34.0 | % | (34.0 | )% | 34.0 | % | ||||||
| State income taxes, net of federal benefit | 4.0 | (3.7 | ) | 8.7 | ||||||||
| Foreign tax differential | - | - | 9.0 | |||||||||
| Other | (1.8 | ) | 4.5 | 3.3 | ||||||||
| Effective income tax rate | 36.2 | % | (33.2 | )% | 55.0 | % | ||||||
Deferred income tax assets (liabilities) consisted of the following as of December 31, 2015 and 2014:
| December 31, | ||||||||
| 2015 | 2014 | |||||||
| Deferred tax assets: | ||||||||
| Allowance for doubtful accounts | $ | 160 | $ | 282 | ||||
| Goods held for sale or auction | 692 | 2,819 | ||||||
| Deductible goodwill and other intangibles | 9,848 | 9,988 | ||||||
| Accrued liabilities and other | 1,177 | 3,210 | ||||||
| Mandatorily redeemable noncontrolling interests | 768 | 740 | ||||||
| Foreign tax and other tax credit carryforwards | 1,427 | 342 | ||||||
| Net operating loss carryforward | 4,920 | 8,220 | ||||||
| Total gross deferred tax assets | $ | 18,992 | $ | 25,601 | ||||
The Company's income before income taxes of $21,265 for the year ended December 31, 2015 includes a United States component of income before income taxes of $18,642 and a foreign component comprised of income before income taxes of $2,623. As of December 31, 2015, the Company had federal net operating loss carryforwards of $12,023, state net operating loss carryforwards of $13,886, and foreign tax credit carryforwards of $1,121. The Company’s federal net operating loss carryforwards will expire in the tax year ending December 31, 2030, the state net operating loss carryforwards will expire in 2032, and the foreign tax credit carryforwards will expire in 2022.
The Company establishes a valuation allowance if, based on the weight of available evidence, it is more likely than not that some portion or all of the deferred tax assets will not be realized. Tax benefits of operating loss and tax credit carryforwards are evaluated on an ongoing basis, including a review of historical and projected future operating results, the eligible carryforward period, and other circumstances. As a result of the common stock offering that was completed on June 5, 2014, the Company had a more than 50% ownership shift in accordance with Internal Revenue Code Section 382. Accordingly, the Company is limited to the amount of net operating loss that may be utilized in future taxable years depending on the Company’s actual taxable income. As of December 31, 2015, the Company believes that the net operating loss that existed as of the more than 50% ownership shift will be utilized in future tax periods before the loss carryforwards expire and it is more-likely-than-not that future taxable earnings will be sufficient to realize its deferred tax assets and has not provided an allowance.
| F-26 |
On January 1, 2009, the Company adopted the accounting guidance for accounting for uncertainty in income taxes. This accounting guidance addresses the determination of how tax benefits claimed or expected to be claimed on a tax return should be recorded in the financial statements. Under the accounting guidance, the Company must recognize the tax benefit from an uncertain tax position only if it is more likely than not that the tax position will be sustained on examination by the taxing authorities, based on the technical merits of the position. The tax benefits recognized in the financial statements from such a position are measured based on the largest benefit that has a greater than 50% likelihood of being realized upon ultimate resolution. The Company did not recognize any additional liabilities for uncertain tax positions as a result of the implementation of this accounting guidance.
The Company’s uncertain tax positions are related to tax years that remain subject to examination by the relevant taxing authorities. The Company is currently open to audit under the statute of limitations by the Internal Revenue Service for the calendar years ended December 31, 2011 to 2015. The Company and its subsidiaries’ state tax returns are also open to audit under similar statutes of limitations for the same tax years. The Company accrues interest on unrecognized tax benefits as a component of income tax expense. Penalties, if incurred, would be recognized as a component of income tax expense. The Company had no such accrued interest or penalties included in the accrued liabilities associated with unrecognized tax benefits as of the date of adoption.
NOTE 14— EARNINGS PER SHARE
Basic earnings per share is calculated by dividing net income by the weighted-average number of shares outstanding during the period. Diluted earnings per share is calculated by dividing net income by the weighted-average number of common shares outstanding, after giving effect to all dilutive potential common shares outstanding during the period. Basic common shares outstanding exclude 66,000 common shares that are held in escrow and subject to forfeiture as a result of the failure to achieve certain performance targets specified in connection with the transaction with Alternative Asset Management Acquisition Corp. in 2009 (the “Acquisition”).. The 66,000 common shares issued to the former members of Great American Group, LLC are subject to forfeiture upon the final settlement of claims for goods held for sale in connection with the Acquisition. Dilutive common shares outstanding includes contingently issuable shares that are currently in escrow and subject to release if the conditions for the final settlement of claims for goods held for sale in connection with the Acquisition was satisfied at the end of the respective periods. Securities that could potentially dilute basic net income per share in the future that were not included in the computation of diluted net income (loss) per share for the years ended December 31, 2015 and 2014 were 308,699 and 44,883 respectively, because to do so would have been antidilutive.
Basic and diluted earnings from continuing operations calculated as follows (in thousands, except per share amounts):
| Year Ended December 31, | ||||||||||||
| 2015 | 2014 | 2013 | ||||||||||
| Net income (loss) attributable to B. Riley Financial, Inc. | $ | 11,805 | $ | (5,801 | ) | $ | 1,058 | |||||
| Weighted average shares outstanding: | ||||||||||||
| Basic | 16,221,040 | 9,612,154 | 1,434,107 | |||||||||
| Effect of dilutive potential common shares: | ||||||||||||
| Contingently issuable shares | 44,875 | - | 61,221 | |||||||||
| Diluted | 16,265,915 | 9,612,154 | 1,495,328 | |||||||||
| Basic earnings (loss) per share | $ | 0.73 | $ | (0.60 | ) | $ | 0.74 | |||||
| Diluted earnings (loss) per share | $ | 0.73 | $ | (0.60 | ) | $ | 0.71 | |||||
NOTE 15— LIMITED LIABILITY COMPANY SUBSIDIARIES
(a) Operating Agreements of Limited Liability Company Subsidiaries
The Company has subsidiaries that are organized as limited liability companies, each of which has its own separate operating agreement. Generally, each of these subsidiaries is managed by an individual manager who is a member or employee of the subsidiary, although the manager may not take certain actions unless the majority member of the subsidiary consents to the action. These actions include, among others, the dissolution of the subsidiary, the disposition of all or a substantial part of the subsidiary’s assets not in the ordinary course of business, filing for bankruptcy, and the purchase by the subsidiary of one of the members’ ownership interest upon the occurrence of certain events. Certain of the members with a minority ownership interest in the subsidiaries are entitled to receive guaranteed payments in the form of compensation or draws, in addition to distributions of available cash from time to time. Distributions of available cash are generally made to each of the members in accordance with their respective ownership interests in the subsidiary after repayment of any loans made by any members to such subsidiary, and allocations of profits and losses of the subsidiary are generally made to members in accordance with their respective ownership interests in the subsidiary. The operating agreements also generally place restrictions on the transfer of the members’ ownership interests in the subsidiaries and provide the Company or the other members with certain rights of first refusal and drag along and tag along rights in the event of any proposed sales of the members’ ownership interests.
| F-27 |
Generally, a member of the subsidiary who materially breaches the operating agreement of the subsidiary, which breach has a direct, substantial and adverse effect on the subsidiary and the other members, or who is convicted of a felony (or a lesser crime of moral turpitude) involving his management of or involvement in the affairs of the subsidiary, or a material act of dishonesty of the member involving his management of or involvement in the affairs of the subsidiary, shall forfeit his entire ownership interest in the subsidiary.
(b) Repurchase Obligations of Membership Interests of Limited Liability Company Subsidiaries
The operating agreements of the Company’s limited liability company subsidiaries require the Company to repurchase the entire ownership interest of each the members upon the death of a member, disability of a member as defined in the operating agreement, or upon declaration by a court of law that a member is mentally unsound or incompetent. Upon the occurrence of one of these events, the Company is required to repurchase the member’s ownership interest in an amount equal to the fair market value of the member’s noncontrolling interest in the subsidiary.
The Company evaluated the classification of all of its limited liability company members’ ownership interests in accordance with the accounting guidance for financial instruments with characteristics of liabilities and equity. This guidance generally provides for the classification of members’ ownership interests that are subject to mandatory redemption obligations to be classified outside of equity. In accordance with this guidance, all members with a minority ownership interest in these subsidiaries are classified as liabilities and included in mandatorily redeemable noncontrolling interests in the accompanying consolidated balance sheet. Members of these subsidiaries with a minority ownership interest issued before November 5, 2003 are stated on a historical cost basis and members of the Company’s subsidiaries with a minority ownership interests issued on or after November 5, 2003 are stated at fair value at each balance sheet date. The Company deems such repurchase obligations, which are payable to members who are also employees of these subsidiaries, to be a compensatory benefit. Accordingly, the changes in the historical cost basis and the changes in the fair value of the respective members’ ownership interests (noncontrolling interests) are recorded as a component of selling, general and administrative expenses in the accompanying consolidated statements of operations. The noncontrolling interests share of net income was $2,207, $1,921 and $1,897 for the years ended December 31, 2015, 2014 and 2013, respectively. There was no change in the fair value of the mandatorily redeemable noncontrolling interests during the years ended December 31, 2015, 2014 and 2013.
NOTE 16— SHARE BASED PAYMENTS
During the year ended December 31, 2015, the Company granted equity incentive rewards representing 527,372 shares of common stock with a total fair value of $5,255 to certain employees and directors of the Company. Such equity incentive awards consisted of restricted stock units subject to vesting representing 521,772 shares of common stock and stock bonus awards of 5,600 fully vested shares of common stock. Of the 521,772 restricted stock units, the shares of common stock underlying such awards are issuable upon vesting as follows: 189,652 during the year ended December 31, 2015, 169,727 during the year ended December 31, 2016 and the remaining 162,393 during the year ended December 31, 2017. During the year ended December 31, 2014, the Company granted restricted stock units representing 5,859 shares of common stock with a total fair value of $45 to directors of the Company which vested on July 31, 2015. Share based compensation expense for the stock bonus awards and restricted stock units was $2,043 for the year ended December 31, 2015. The total income tax benefit recognized related to the vesting of restricted stock units during the year ended December 31, 2015 was $804.
The restricted stock units generally vest over a period of one to three years based on continued service. In determining the fair value of restricted stock units on the grant date, the fair value is adjusted for (a) estimated forfeitures, (b) expected dividends based on historical patterns and the Company’s anticipated dividend payments over the expected holding period and (c) the risk-free interest rate based on U.S. Treasuries for a maturity matching the expected holding period. As of December 31, 2015, the expected remaining unrecognized share based compensation expense of $3,043 will be expensed over a weighted average period of 1.4 years.
| F-28 |
A summary of equity incentive award activity for the periods indicated was as follows:
| Weighted | ||||||||
| Average | ||||||||
| Shares | Fair Value | |||||||
| Nonvested at December 31, 2013 | - | $ | - | |||||
| Granted | 5,859 | 7.68 | ||||||
| Vested | - | - | ||||||
| Forfeited | - | - | ||||||
| Nonvested at December 31, 2014 | 5,859 | $ | 7.68 | |||||
| Granted | 527,372 | 9.96 | ||||||
| Vested | (198,002 | ) | 9.88 | |||||
| Forfeited | (9,324 | ) | 9.98 | |||||
| Nonvested at December 31, 2015 | 325,905 | $ | 9.97 | |||||
The per-share weighted average grant-date fair value of equity incentive awards was $7.68 and $9.96 for the years ending December 31, 2014 and 2015, respectively. The total fair value of shares vested during the year ended December 31, 2015 was $1,905.
NOTE 17— BENEFIT PLANS AND DIVIDENDS
(a)Amended and Restated 2009 Stock Incentive Plan
In connection with the consummation of the Acquisition, the Company assumed the AAMAC 2009 Stock Incentive Plan which was approved by the AAMAC stockholders on July 31, 2009 (as assumed, the “Incentive Plan”). In accordance with Section 13(a) of the Incentive Plan, in connection with the Company’s assumption of the Incentive Plan, the Company’s board of directors adjusted the maximum number of shares that may be delivered under the Incentive Plan to 782,200 to account for the two-for-one exchange ratio of Company common stock for AAMAC common stock in the Acquisition. On August 19, 2009, the Company’s board of directors approved an amendment and restatement of the Incentive Plan which adjusted the number of shares of stock the Company reserved for issuance thereunder to 391,100. Effective as of October 7, 2014, the Company’s board of directors approved an amendment and restatement of the Incentive Plan which, among other things, increased the number of shares of stock the Company reserved for issuance thereunder to 3,210,133 shares. As of December 31, 2015, the Company has 2,726,328 shares of common stock available for future grants under the Incentive Plan.
(b)Employee Benefit Plan
The Company maintains a qualified defined contribution 401(k) plan, which covers substantially all of its U.S. employees. Under the plan, participants are entitled to make pre-tax contributions up to the annual maximums established by the Internal Revenue Service. The plan document permits annual discretionary contributions from the Company. No employer contributions were made in any of the periods presented.
(c)Dividends
On October 29, 2014, the Board of Directors of the Company approved a dividend of $0.03 per share, which was paid on December 9, 2014 to stockholders of record on November 18, 2014. On May 4, 2015, the Company’s Board of Directors approved a dividend of $0.06 per share, which was paid on or about June 12, 2015 to stockholders of record on May 22, 2015. On August 10, 2015, the Company’s Board of Directors approved a dividend of $0.20 per share, which was paid on or about September 10, 2015 to stockholders of record on August 25, 2015. On November 9, 2015, our Board of Directors approved a dividend of $0.06 per share, which was paid on or about December 9, 2015 to stockholders of record on November 24, 2015. The Company’s Board of Directors may reduce or discontinue the payment of dividends at any time for any reason it deems relevant. The declaration and payment of any future dividends or repurchases of the Company’s common stock will be made at the discretion of the Board of Directors and will be dependent upon the Company’s financial condition, results of operations, cash flows, capital expenditures, and other factors that may be deemed relevant by the Board of Directors.
| F-29 |
NOTE 18— NET CAPITAL REQUIREMENTS
BRC, a subsidiary of the Company, is a registered broker-dealer and, accordingly, is subject to the SEC Uniform Net Capital Rule (Rule 15c3-1) which requires BRC to maintain minimum net capital and requires that the ratio of aggregate indebtedness to net capital, both as defined, shall not exceed 15 to 1. As of December 31, 2015, BRC had net capital of $7,477 (an excess of $7,099). BRC net capital ratio for December 31, 2015 was 0.41 to 1.
NOTE 19— RELATED PARTY TRANSACTIONS
On March 10, 2015, the Company borrowed $4,500 from RIP in accordance with the RIP Note. The borrowings were for short-term working capital needs and capital for other retail liquidation engagements. The principal amount of $4,500 million for the RIP Note accrued interest at the rate of 10% per annum (or 15% in the event of a default under the RIP Note) and included a Success Fee as more fully described in Note 11(b). Riley Investment Management LLC, a wholly owned subsidiary of the Company, is the general partner of RIP. Bryant Riley, the Chief Executive Officer and Chairman of the Board of Directors of the Company, owns or controls approximately 45% of the equity interests of the RIP. In addition, Thomas Kelleher, the President and a director of the Company, and one other employee of the Company, own or control de minimis amounts of the equity interests of RIP. After considering the economic interests of Mr. Riley and Mr. Kelleher in the RIP Note and comparing the terms of the RIP Note to terms that may have been available from unaffiliated third parties, the disinterested members of our Board of Directors unanimously approved the issuance of the RIP Note. The RIP Note was repaid on May 4, 2015 in accordance with its terms. Interest expense on the RIP Note totaled $194 for the year ended December 31, 2015, which includes success fees of $126. The RIP Note was repaid on May 4, 2015.
At December 31, 2015 amounts due from related party of $409 represented amounts due from GACP I, L.P. for management fees and other operating expenses. At December 31, 2015 and 2014, amounts due to related party of $166 and $213, respectively, represents amounts due to CA Global Partners, LLC (“CA Global”). CA Global is one of the members of Great American Global Partners, LLC (“GA Global Ptrs”) which started operations in the first quarter of 2013. The amount payable at December 31, 2015 and 2014 is comprised of expenses that were paid on behalf of the Company by CA Global in connection with certain auctions of wholesale and industrial machinery and equipment that they were managed on behalf of GA Global Ptrs.
At December 31, 2013, the Company had two loan receivables from Shoon with an aggregate outstanding balance of $1,200. The Company owned 44.4% of the common stock of Shoon. The original loan receivable in the amount of $1,300 was made to Shoon on May 4, 2012 and had a remaining principal balance of $353 at December 31, 2013. The loan had a maturity date of May 3, 2014 with interest payable monthly at LIBOR plus 6.0%. On August 2, 2013, an additional loan in the amount of $847 (net of $40 discount) was extended to Shoon with a maturity date of August 3, 2015. Interest is payable monthly at 6.5%. Both of the loans were collateralized by the inventory of Shoon. In January 2014, Shoon was sold to a third party and the two loans in the amount of $1,200 outstanding at December 31, 2013 were repaid to the Company as more fully described in Note 3.
NOTE 20— BUSINESS SEGMENTS
The Company’s operating segments reflect the manner in which the business is managed and how the Company allocates resources and assesses performance internally. The Company has several operating subsidiaries through which it delivers specific services. The Company provides auction, liquidation, capital advisory, financing, real estate, and other services to stressed or distressed companies in a variety of diverse industries that have included apparel, furniture, jewelry, real estate, and industrial machinery. The Company also provides appraisal and valuation services for retail and manufacturing companies. As a result of the acquisition of BRC Inc. in 2014 and MK Capital in 2015, the Company provides investment banking, corporate finance, research, wealth management, sales and trading services to corporate, institutional and high net worth clients. As a result of the acquisition of Shoon in 2012, the Company operated ten retail stores in the United Kingdom which were reported in the UK Retail Stores segment in 2013. In August 2013, the Shoon shareholder agreement was amended and restated to eliminate the Company’s super majority voting rights which enabled the Company to control the board of directors of Shoon. As a result of this amendment, the Company no longer controls Shoon and the operating results of Shoon are not consolidated for any periods after July 31, 2013. As such, the Company no longer operates in the UK Retail Stores segment. In January 2014, Shoon was sold to a third party, and the Company no longer has a financial interest in the operations of Shoon.
The Company’s business in 2013 was previously classified by management into the Auction and Liquidation segment, Valuation and Appraisal segment, and UK Retail Stores segment. In 2014 and 2015, with the acquisition of BRC Inc. and MK Capital, the Company’s business is classified into the Capital Markets segment, Auction and Liquidation segment and Valuation and Appraisal segment. These reportable segments are all distinct businesses, each with a different marketing strategy and management structure.
Additionally, the Valuation and Appraisal operating segments are aggregated into one reportable segment as they have similar economic characteristics and are expected to have similar long-term financial performance.
| F-30 |
The following is a summary of certain financial data for each of the Company’s reportable segments:
| Year Ended December 31, | ||||||||||||
| 2015 | 2014 | 2013 | ||||||||||
| Capital markets reportable segment: | ||||||||||||
| Revenues - Services and fees | $ | 35,183 | $ | 19,420 | $ | |||||||
| Selling, general, and administrative expenses | (30,229 | ) | (14,185 | ) | - | |||||||
| Depreciation and amortization | (519 | ) | (193 | ) | - | |||||||
| Segment income | 4,435 | 5,042 | - | |||||||||
| Auction and Liquidation reportable segment: | ||||||||||||
| Revenues - Services and fees | $ | 35,633 | $ | 17,166 | $ | 32,409 | ||||||
| Revenues - Sale of goods | 10,596 | 9,859 | 9,963 | |||||||||
| Total revenues | 46,229 | 27,025 | 42,372 | |||||||||
| Direct cost of services | (15,489 | ) | (10,719 | ) | (11,120 | ) | ||||||
| Cost of goods sold | (3,072 | ) | (14,080 | ) | (7,940 | ) | ||||||
| Selling, general, and administrative expenses | (8,170 | ) | (8,481 | ) | (11,889 | ) | ||||||
| Restructuring charge | - | (1,339 | ) | - | ||||||||
| Depreciation and amortization | (191 | ) | (107 | ) | (176 | ) | ||||||
| Segment income (loss) | 19,307 | (7,701 | ) | 11,247 | ||||||||
| Valuation and Appraisal reportable segment: | ||||||||||||
| Revenues - Services and fees | 31,113 | 30,671 | 27,558 | |||||||||
| Direct cost of services | (13,560 | ) | (12,747 | ) | (13,026 | ) | ||||||
| Selling, general, and administrative expenses | (9,101 | ) | (10,721 | ) | (8,718 | ) | ||||||
| Restructuring charge | - | (203 | ) | - | ||||||||
| Depreciation and amortization | (137 | ) | (151 | ) | (143 | ) | ||||||
| Segment income | 8,315 | 6,849 | 5,671 | |||||||||
| UK Retail Stores reportable segment: | ||||||||||||
| Revenues - Sale of goods | - | - | 6,202 | |||||||||
| Cost of goods sold | - | - | (3,566 | ) | ||||||||
| Selling, general, and administrative expenses | - | - | (3,773 | ) | ||||||||
| Depreciation and amortization | - | - | (45 | ) | ||||||||
| Segment loss | - | - | (1,182 | ) | ||||||||
| Consolidated operating income from reportable segments | 32,057 | 4,190 | 15,736 | |||||||||
| Corporate and other expenses (includes restructuring charge of $1,006 for the year ended December 31, 2014) | (9,975 | ) | (11,621 | ) | (11,638 | ) | ||||||
| Interest income | 17 | 12 | 26 | |||||||||
| Loss from equity investment in Great American | ||||||||||||
| Real Estate, LLC and Shoon Trading Limited | - | - | (177 | ) | ||||||||
| Interest expense | (834 | ) | (1,262 | ) | (2,667 | ) | ||||||
| Income (loss) before income taxes | 21,265 | (8,681 | ) | 1,280 | ||||||||
| (Provision) benefit for income taxes | (7,688 | ) | 2,886 | (704 | ) | |||||||
| Net income (loss) | 13,577 | (5,795 | ) | 576 | ||||||||
| Net income (loss) attributable to noncontrolling interests | 1,772 | 6 | (482 | ) | ||||||||
| Net income (loss) attributable to B. Riley Financial, Inc. | $ | 11,805 | $ | (5,801 | ) | $ | 1,058 | |||||
| Capital expenditures: | ||||||||||||
| Capital Markets segment | $ | 51 | $ | 104 | $ | - | ||||||
| Auction and Liquidation segment | 157 | 38 | 423 | |||||||||
| Valuation and Appraisal segment | 31 | 1 | 418 | |||||||||
| UK Retail Stores segment | - | - | 319 | |||||||||
| Total | $ | 239 | $ | 143 | $ | 1,160 | ||||||
| F-31 |
| As of December 31, | ||||||||
| 2015 | 2014 | |||||||
| Total Assets: | ||||||||
| Capital Markets segment | $ | 54,882 | $ | 48,878 | ||||
| Auction and Liquidation segment | 45,892 | 41,360 | ||||||
| Valuation and Appraisal segment | 12,171 | 9,527 | ||||||
| Corporate and Other segment | 19,475 | 39,225 | ||||||
| Total | $ | 132,420 | $ | 138,990 | ||||
The following table presents revenues by geographical area:
| Year Ended December 31, | ||||||||||||
| 2015 | 2014 | 2013 | ||||||||||
| Revenues: | ||||||||||||
| Revenues - Services and fees: | ||||||||||||
| North America | $ | 77,153 | $ | 63,417 | $ | 50,624 | ||||||
| Europe | 24,776 | 3,840 | 9,343 | |||||||||
| Total Revenues - Services and fees | $ | 101,929 | $ | 67,257 | $ | 59,967 | ||||||
| Revenues - Sale of goods | ||||||||||||
| North America | $ | 907 | $ | 9,859 | $ | 9,532 | ||||||
| Europe | 9,689 | - | 6,633 | |||||||||
| Total Revenues - Sale of goods | $ | 10,596 | $ | 9,859 | $ | 16,165 | ||||||
| Total Revenues: | ||||||||||||
| North America | $ | 78,060 | $ | 73,276 | $ | 60,156 | ||||||
| Europe | 34,465 | 3,840 | 15,976 | |||||||||
| Total Revenues - Services and fees | $ | 112,525 | $ | 77,116 | $ | 76,132 | ||||||
The following table presents long-lived assets and identifiable assets by geographical area:
| As of | As of | |||||||
| December 31, | December 31, | |||||||
| 2015 | 2014 | |||||||
| Long-lived Assets - Property and Equipment, net: | ||||||||
| North America | $ | 592 | $ | 776 | ||||
| Europe | - | - | ||||||
| Total Long-lived Assets | $ | 592 | $ | 776 | ||||
| Identifiable Assets: | ||||||||
| North America | $ | 128,094 | $ | 137,216 | ||||
| Europe | 4,326 | 1,774 | ||||||
| Total Assets | $ | 132,420 | $ | 138,990 | ||||
| F-32 |
NOTE 21— SELECTED QUARTERLY FINANCIAL DATA (UNAUDITED)
| Quarter Ended | ||||||||||||||||
| March 31, | June 30, | September 30, | December 31, | |||||||||||||
| 2015 | 2015 | 2015 | 2015 | |||||||||||||
| Total revenues | $ | 26,031 | $ | 45,461 | $ | 21,272 | $ | 19,761 | ||||||||
| Operating income (loss) | $ | 5,462 | $ | 14,669 | $ | 3,277 | $ | (1,326 | ) | |||||||
| Income (loss) before income taxes | $ | 5,211 | $ | 14,254 | $ | 3,218 | $ | (1,418 | ) | |||||||
| (Provision) benefit for income taxes | $ | (1,775 | ) | $ | (5,685 | ) | $ | (600 | ) | $ | 372 | |||||
| Net income (loss) | $ | 3,436 | $ | 8,569 | $ | 2,618 | $ | (1,046 | ) | |||||||
| Net income (loss) attributable to B. Riley Financial, Inc. | $ | 2,682 | $ | 8,664 | $ | 1,463 | $ | (1,004 | ) | |||||||
| Earnings (loss) per share: | ||||||||||||||||
| Basic | $ | 0.17 | $ | 0.53 | $ | 0.09 | $ | (0.06 | ) | |||||||
| Diluted | $ | 0.17 | $ | 0.53 | $ | 0.09 | $ | (0.06 | ) | |||||||
| Weighted average shares outstanding: | ||||||||||||||||
| Basic | 16,117,422 | 16,237,860 | 16,243,425 | 16,283,677 | ||||||||||||
| Diluted | 16,162,304 | 16,310,829 | 16,344,649 | 16,283,677 | ||||||||||||
| Quarter Ended | ||||||||||||||||
| March 31, | June 30, | September 30, | December 31, | |||||||||||||
| 2014 | 2014 | 2014 | 2014 | |||||||||||||
| Total revenues | $ | 21,653 | $ | 14,947 | $ | 20,674 | $ | 19,842 | ||||||||
| Operating loss | $ | (1,258 | ) | $ | (1,056 | ) | $ | (1,253 | ) | $ | (3,864 | ) | ||||
| Loss before income taxes | $ | (1,884 | ) | $ | (1,501 | ) | $ | (1,303 | ) | $ | (3,993 | ) | ||||
| Benefit for income taxes | $ | 814 | $ | 594 | $ | 387 | $ | 1,091 | ||||||||
| Net loss | $ | (1,070 | ) | $ | (907 | ) | $ | (916 | ) | $ | (2,902 | ) | ||||
| Net loss attributable to B. Riley Financial, Inc. | $ | (1,334 | ) | $ | (777 | ) | $ | (868 | ) | $ | (2,822 | ) | ||||
| Earnings (loss) per share: | ||||||||||||||||
| Basic | $ | (0.93 | ) | $ | (0.16 | ) | $ | (0.05 | ) | $ | (0.18 | ) | ||||
| Diluted | $ | (0.93 | ) | $ | (0.16 | ) | $ | (0.05 | ) | $ | (0.18 | ) | ||||
| Weighted average shares outstanding: | ||||||||||||||||
| Basic | 1,434,107 | 4,972,203 | 15,911,482 | 15,902,607 | ||||||||||||
| Diluted | 1,434,107 | 4,972,203 | 15,911,482 | 15,902,607 | ||||||||||||
| F-33 |