Attached files
| file | filename |
|---|---|
| EX-32.3 - CERTIFICATION - B. Riley Financial, Inc. | f10k2019ex32-3_briley.htm |
| EX-32.2 - CERTIFICATION - B. Riley Financial, Inc. | f10k2019ex32-2_briley.htm |
| EX-32.1 - CERTIFICATION - B. Riley Financial, Inc. | f10k2019ex32-1_briley.htm |
| EX-31.3 - CERTIFICATION - B. Riley Financial, Inc. | f10k2019ex31-3_briley.htm |
| EX-31.2 - CERTIFICATION - B. Riley Financial, Inc. | f10k2019ex31-2_briley.htm |
| EX-31.1 - CERTIFICATION - B. Riley Financial, Inc. | f10k2019ex31-1_briley.htm |
| EX-23.1 - CONSENT OF MARCUM LLP - B. Riley Financial, Inc. | f10k2019ex23-1_briley.htm |
| EX-21.1 - SUBSIDIARY LIST - B. Riley Financial, Inc. | f10k2019ex21-1_briley.htm |
| EX-4.18 - DESCRIPTION OF REGISTERED SECURITIES - B. Riley Financial, Inc. | f10k2019ex4-18_briley.htm |
UNITED
STATES
SECURITIES AND EXCHANGE COMMISSION
Washington, D.C. 20549
FORM 10-K
(Mark One)
☒ ANNUAL REPORT PURSUANT TO SECTION 13 OR 15(d) OF THE SECURITIES EXCHANGE ACT OF 1934
For the fiscal year ended December 31, 2019
Or
☐ TRANSITION REPORT PURSUANT TO SECTION 13 OR 15(d) OF THE SECURITIES EXCHANGE ACT OF 1934
For the transition period from to
Commission File Number 001-37503
B. RILEY FINANCIAL, INC.
(Exact name of registrant as specified in its charter)
| Delaware | 27-0223495 | |
| (State
or Other Jurisdiction of Incorporation or Organization) |
(I.R.S. Employer Identification No.) | |
| 21255
Burbank Boulevard, Suite 400 Woodland Hills, CA |
91367 | |
| (Address of principal executive offices) | (Zip Code) |
(818) 884-3737
(Registrant’s telephone number, including area code)
Securities registered pursuant to Section 12(b) of the Act:
| Title of each class | Trading Symbol(s) | Name of each exchange on which registered | ||
| Common Stock, par value $0.0001 per share | RILY | Nasdaq Global Market | ||
| Depositary Shares, each representing a 1/1000th fractional interest in a share of Series A Cumulative Perpetual Preferred Stock | RILYP | Nasdaq Global Market | ||
| 7.25% Senior Notes due 2027 | RILYG | Nasdaq Global Market | ||
| 7.50% Senior Notes due 2027 | RILYZ | Nasdaq Global Market | ||
| 6.50% Senior Notes due 2026 | RILYN | Nasdaq Global Market | ||
| 6.375% Senior Notes due 2025 | RILYM | Nasdaq Global Market | ||
| 6.75% Senior Notes due 2024 | RILYO | Nasdaq Global Market | ||
| 7.375% Senior Notes due 2023 | RILYH | Nasdaq Global Market | ||
| 6.875% Senior Notes due 2023 | RILYI | Nasdaq Global Market |
Securities registered pursuant to Section 12(g) of the Act: None
Indicate by check mark if the registrant is a well-known seasoned issuer, as defined in Rule 405 of the Securities Act. Yes: ☐ No ☒
Indicate by check mark if the registrant is not required to file reports pursuant to Section 13 or Section 15(d) of the Act. Yes: ☐ No ☒
Indicate by check mark whether the registrant: (1) has filed all reports required to be filed by Section 13 or 15(d) of the Securities Exchange Act of 1934 during the preceding 12 months (or for such shorter period that the registrant was required to file such reports), and (2) has been subject to such filing requirements for the past 90 days. Yes ☒ No ☐
Indicate by check mark whether the registrant has submitted electronically every Interactive Data File required to be submitted pursuant to Rule 405 of Regulation S-T (§232.405 of this chapter) during the preceding 12 months (or for such shorter period that the registrant was required to submit such files). Yes ☒ No ☐
Indicate by check mark whether the registrant is a large accelerated filer, an accelerated filer, a non-accelerated filer, a smaller reporting company or an emerging growth company. See the definitions of “large accelerated filer”, “accelerated filer,” “smaller reporting company” and “emerging growth company” in Rule 12b-2 of the Exchange Act. (Check one)
| Large accelerated filer ☐ | Accelerated filer ☒ |
| Non-accelerated filer ☐ | Smaller reporting company ☐ |
| Emerging growth company ☐ |
If an emerging growth company, indicate by check mark if the registrant has elected not to use the extended transition period for complying with any new or revised financial accounting standards provided pursuant to Section 13(a) of the Exchange Act. ☐
Indicate by check mark whether the registrant is a shell company (as defined in Rule 12b-2 of the Act). Yes ☐ No ☒
The aggregate market value of the registrant’s common stock held by non-affiliates, based on the closing price of the registrant’s common stock as reported on the NASDAQ Global Market on June 30, 2019, the last business day of the registrant’s most recently completed second fiscal quarter, was approximately $413.9 million. For purposes of this calculation, it has been assumed that all shares of the registrant’s common stock held by directors, executive officers and stockholders beneficially owning ten percent or more of the registrant’s common stock are held by affiliates. The treatment of these persons as affiliates for purposes of this calculation is not conclusive as to whether such persons are, in fact, affiliates of the registrant
As of February 27, 2020, there were 26,127,554 shares of the registrant’s common stock, par value $0.0001 per share, outstanding.
DOCUMENTS INCORPORATED BY REFERENCE
Portions of the definitive Proxy Statement relating to the registrant’s 2020 Annual Meeting of Stockholders are incorporated by reference into Part III of this Annual Report on Form 10-K to the extent stated herein. Such proxy statement will be filed with the Securities and Exchange Commission within 120 days of the registrant’s fiscal year ended December 31, 2019.
B. RILEY FINANCIAL, INC.
INDEX TO ANNUAL REPORT ON FORM 10-K
FOR THE FISCAL YEAR ENDED DECEMBER 31, 2019
i
This Annual Report on Form 10-K (this “Annual Report”) contains forward-looking statements regarding our business, financial condition, results of operations and prospects. Words such as “expect,” “anticipate,” “intend,” “plan,” “believe,” “seek,” “may,” “will,” “should,” “could,” “future,” “likely,” “predict,” “project,” “potential,” “continue,” “estimate” and similar expressions are generally intended to identify forward-looking statements, but are not exclusive means of identifying forward-looking statements in this Annual Report. You should not place undue reliance on such forward-looking statements, which are based on the information currently available to us and speak only as of the date on which this Annual Report was filed with the Securities and Exchange Commission (the “SEC”). Because these forward-looking statements involve known and unknown risks and uncertainties, there are important factors that could cause actual results, events or developments to differ materially from those expressed or implied by these forward-looking statements, including our plans, objectives, expectations and intentions and other factors discussed in “Part I — Item 1A. Risk Factors” contained in this Annual Report. We undertake no obligation to publicly update or revise any forward-looking statements, whether as a result of new information, future events or otherwise.
Except as otherwise required by the context, references in this Annual Report to “the Company,” “B. Riley,” “B. Riley Financial,” “we,” “us” or “our” refer to the combined business of B. Riley Financial, Inc. and all of its subsidiaries.
General
B. Riley Financial, Inc. (NASDAQ: RILY) and its subsidiaries provide collaborative financial services and solutions through several operating subsidiaries including:
| ● | B. Riley FBR, Inc. (“B. Riley FBR”) is a leading, full service investment bank providing financial advisory, corporate finance, research, securities lending and sales and trading services to corporate, institutional and high net worth individual clients. |
| ● | B. Riley Wealth Management, Inc. (“B. Riley Wealth Management”) provides comprehensive wealth management and brokerage services to individuals and families, corporations and non-profit organizations, including qualified retirement plans, trusts, foundations and endowments. |
| ● | B. Riley Capital Management, LLC, a Securities and Exchange Commission (“SEC”) registered investment advisor, which includes: |
| o | B. Riley Asset Management, an advisor to certain private funds and to institutional and high net worth investors; |
| o | Great American Capital Partners, LLC (“GACP”), the general partner of two private funds, GACP I, L.P. and GACP II, L.P., both direct lending funds that provide senior secured loans and second lien secured loan facilities to middle market public and private U.S. companies. |
| ● | GlassRatner Advisory & Capital Group LLC (“GlassRatner”), a specialty financial advisory services firm that provides consulting services to shareholders, creditors and companies, including due diligence, fraud investigations, corporate litigation support, crisis management and bankruptcy services. |
| ● | Great American Group, LLC, (“Great American Group”) a leading provider of asset disposition and auction solutions to a wide range of retail and industrial clients. |
| ● | Great American Group Advisory and Valuation Services, LLC, a leading provider of appraisal and valuation services for asset based lenders, private equity firms and corporate clients. |
We also pursue a strategy of investing in or acquiring companies which we believe have attractive investment return characteristics.
| ● | United Online, Inc. (“UOL” or “United Online”), which we acquired on July 1, 2016, is a communications company that offers consumer subscription services and products, consisting of Internet access services and devices under the NetZero and Juno brands primarily sold in the United States. |
| ● | magicJack VocalTec Ltd. (“magicJack”), which we acquired on November 14, 2018, is a Voice over IP (“VoIP”) cloud-based technology and services communications provider. |
1
BR Brand Holdings LLC (“BR Brand”), in which we acquired a majority investment interest on October 28, 2019, provides licensing of a brand investment portfolio. BR Brand owns the assets and intellectual property related to licenses of six brands: Catherine Malandrino, English Laundry, Joan Vass, Kensie Girl, Limited Too and Nanette Lepore.
We are headquartered in Los Angeles with offices in major cities throughout the United States including New York, Chicago, Boston, Dallas, Memphis, Metro Washington D.C and West Palm Beach.
For financial reporting purposes we classify our businesses into five operating segments: (i) Capital Markets, (ii) Auction and Liquidation, (iii) Valuation and Appraisal, (iv) Principal Investments – United Online and magicJack, and (v) Brands.
Capital Markets Segment. Our Capital Markets segment provides a full array of investment banking, corporate finance, consulting, financial advisory, research, securities lending, wealth management and sales and trading services to corporate, institutional and high net worth clients. Our corporate finance and investment banking services include merger and acquisitions as well as restructuring advisory services to public and private companies, initial and secondary public offerings, and institutional private placements. In addition, we trade equity securities as a principal for our account, including investments in funds managed by our subsidiaries. Our Capital Markets segment also includes our asset management businesses that manage various private and public funds for institutional and individual investors.
Auction and Liquidation Segment. Our Auction and Liquidation segment utilizes our significant industry experience, a scalable network of independent contractors and industry-specific advisors to tailor our services to the specific needs of a multitude of clients, logistical challenges and distressed circumstances. Furthermore, our scale and pool of resources allow us to offer our services across North American as well as parts of Europe, Asia and Australia. Our Auction and Liquidation segment operates through two main divisions, retail store liquidations and wholesale and industrial assets dispositions. Our wholesale and industrial assets dispositions division operates through limited liability companies that are controlled by us.
Valuation and Appraisal Segment. Our Valuation and Appraisal segment provides Valuation and Appraisal services to financial institutions, lenders, private equity firms and other providers of capital. These services primarily include the valuation of assets (i) for purposes of determining and monitoring the value of collateral securing financial transactions and loan arrangements and (ii) in connection with potential business combinations. Our Valuation and Appraisal segment operates through limited liability companies that are majority owned by us.
Principal Investments - United Online and magicJack Segment. Our Principal Investments - United Online and magicJack segment consists of businesses which have been acquired primarily for attractive investment return characteristics. Currently, this segment includes UOL, through which we provide consumer Internet access, and magicJack, through which we provide VoIP communication and related product and subscription services.
Brands Segment. Our Brands segment consists of our brand investment portfolio that is focused on generating revenue through the licensing of trademarks and is held by BR Brand.
Recent Developments
Securities Offerings
Preferred Stock Offering
On October 7, 2019, we closed our underwritten public offering of depositary shares (the “Depositary Shares”), each representing 1/1000th of a share of 6.875% Series A Cumulative Perpetual Preferred Stock, par value $0.0001 per share (the “Series A Preferred Stock”). The liquidation preference of each share of Series A Preferred Stock is $25,000 ($25.00 per Depositary Share). At the closing, we issued 2,000 shares of Series A Preferred Stock represented by 2,000,000 Depositary Shares issued. The offering was conducted pursuant to an underwriting agreement, dated October 2, 2019, by and among us and B. Riley FBR, as representative of the several underwriters named therein. On October 11, 2019, we closed on the issuance of an additional 300,000 additional Depositary Shares pursuant to the full exercise of the underwriters’ over-allotment option. The Depositary Shares were offered pursuant to our shelf registration statement on Form S-3 (Registration No. 333-233907) initially filed with the SEC on September 23, 2019 and declared effective by the SEC on September 30, 2019 (the “September 2019 Shelf Registration”).
December 2019 At Market Issuance Sales Agreement
On December 5, 2019, we entered into an At Market Issuance Sales Agreement (the “December 2019 Sales Agreement”) with B. Riley FBR, pursuant to which the Company may offer and sell, from time to time, up to $100,000,000 of the Company’s 7.25% Senior Notes due 2027 (the “7.25% 2027 Notes”), 7.50% Senior Notes due 2027 (the “7.50% 2027 Notes”), 7.375% Senior Notes due 2023 (the “7.375% 2023 Notes”), 6.875% Senior Notes due 2023 (the “6.875% 2023 Notes”), 6.75% Senior Notes due 2024 (the “2024 Notes”) and 6.50% Senior Notes due 2026 (the “2026 Notes”), Common Stock and Depositary Shares (collectively, the “December 2019 Offered Securities”). Sales of the December 2019 Offered Securities pursuant to the Sales Agreement, if any, may be made in transactions that are deemed to be “at the market offerings” as defined in Rule 415 under the Securities Act. B. Riley FBR is not required to sell any specific number of the December 2019 Offered Securities, but B. Riley FBR will make all sales using commercially reasonable efforts consistent with its normal trading and sales practices on mutually agreed terms between B. Riley FBR and the Company. Under the December 2019 Sales Agreement, B. Riley FBR will be entitled to compensation of up to 2.0% of the gross proceeds of all December 2019 Offered Securities sold through it as the Company’s agent.
2
6.375 Senior Notes due 2025
On February 12, 2020, we closed our underwritten public offering of $132,250,000 aggregate principal amount of 6.375% Senior Notes due 2025 (the “2025 Notes”), which included $17.25 million of notes issued pursuant to the full exercise by the underwriters of their overallotment option. The offering was conducted pursuant to an underwriting agreement, dated February 10, 2020, by and among us and B. Riley FBR, as representative of the several underwriters named therein. The 2025 Notes were offered pursuant to the September 2019 Shelf Registration and the Company’s registration statement on Form S-3 (Registration No. 333-236347) filed with the SEC and effective on February 10, 2020.
February 2020 Shelf Registration Statement and At Market Issuance Sales Agreement
On February 14, 2020, we filed a registration statement on Form S-3 (Registration No. 333-236463) with the SEC for up to $350,000,000 of the Company’s common stock, preferred stock, warrants, debt securities, depositary shares and/or units (the “February 2020 Registration Statement”), which was declared effective by the SEC on February 24, 2020. Contemporaneously, we entered into an At Market Issuance Sales Agreement (the “February 2020 Sales Agreement”) with B. Riley FBR, pursuant to which the Company may offer and sell, from time to time, up to $150,000,000 of 7.25% 2027 Notes, 7.375% 2023 Notes, 6.875% 2023 Notes, 2024 Notes, 2026 Notes, 2025 Notes, and Depositary Shares (collectively, the “February 2020 Offered Securities”). Sales of the February 2020 Offered Securities pursuant to the Sales Agreement, if any, may be made in transactions that are deemed to be “at the market offerings” as defined in Rule 415 under the Securities Act. B. Riley FBR is not required to sell any specific number of the February 2020 Offered Securities, but B. Riley FBR will make all sales using commercially reasonable efforts consistent with its normal trading and sales practices on mutually agreed terms between B. Riley FBR and the Company. Under the February 2020 Sales Agreement, B. Riley FBR will be entitled to compensation of up to 2.0% of the gross proceeds of all February 2020 Offered Securities sold through it as the Company’s agent.
Acquisition of Majority Interest in BR Brand
On October 28, 2019, the Company and B. Riley Brand Management LLC, an indirect wholly-owned subsidiary of the Company (the “B. Riley Member”), completed the acquisition of a majority equity interest in BR Brand in exchange for (i) aggregate consideration of $116.5 million in cash and (ii) the issuance by the Company to Bluestar, an affiliate of the manager of BR Brand, of a warrant to purchase up to 200,000 shares of the Company’s Common Stock, par value $0.0001 per share, at an exercise price per share equal to $26.24. One-third of the shares of common stock issuable under the Warrant vested and became exercisable immediately upon its issuance at the Closing, and the remaining two-thirds of such shares of common stock will vest and become exercisable following the first and/or second anniversaries of the closing, subject to BR Brand’s (or another related joint venture with Bluestar) satisfaction of specified financial performance targets. In connection with the closing, the manager of BR Brand caused the transfer to BR Brand of certain trademarks, domain names, license agreements and related assets from existing brand owners. Each of the B. Riley Member and the manager of BR Brand is, as applicable, subject to certain post-closing obligations to indemnify BR Brand for breaches of representations or warranties, covenants certain tax liabilities certain pre-closing liabilities.
Our Business
B. Riley FBR
Investment Banking and Corporate Finance
B. Riley FBR’s investment banking professionals provide equity and debt capital raising, merger and acquisition, financial advisory and restructuring advisory services to both private and publicly traded companies. Those services include: follow-on public offerings, debt and equity private placements, debt refinancing, corporate debt and equity security repurchases, and buy-side and sell-side representation, divestitures/carveouts, leveraged buyouts, management buyouts, strategic alternatives reviews, fairness opinions, valuations, return-of-capital advisory, hostile/activist advisory, and options trading programs.
3
Sales, Trading and Corporate Services
Our sales and trading professionals distribute B. Riley proprietary research products to our institutional investor clients and high net worth individuals. B. Riley FBR sales and trading also sells the securities of companies in which B. Riley FBR acts as an underwriter and executes equity trades on behalf of clients. We maintain active trading relationships with substantially all major institutional money managers. Our equity and fixed income traders make markets in approximately 1,036 securities. B. Riley FBR also conducts securities lending activities which involves the borrowing and lending of equity and fixed income securities. Our corporate services include retail orders, block trades, Rule 144 transactions, cashless exercise of options, and corporate equity repurchase programs.
Equity Research
Our equity research is focused on fundamentals-based research. Our research focuses on an in-depth analysis of earnings, cash flow trends, balance sheet strength, industry outlook, and strength of management that involves extensive meetings with key management, competitors, channel partners and customers. We provide research on all sizes of firms; however, our research primarily focuses on small and mid-cap stocks that are under-followed by Wall Street. Our analysts regularly communicate their findings through Research Updates and daily Morning Notes.
Our research department includes research analysts maintaining coverage on a variety of companies in a variety of industry sectors. Our research department annually organizes non-deal road shows for issuers in our targeted industries. To provide our institutional clients access to management teams of companies in our coverage universe and others, our research department has held 21 consecutive annual institutional investor conferences.
Capital Management
We provide investment management services under our subsidiary, B. Riley Capital Management, LLC. The registered investment advisor manages private investment funds, including a fund of funds. All of the funds managed typically invest in both public and private equity and debt. Investors in the various funds include institutional, high net worth, and individual investors. GACP is the general partner of GACP I, L.P. and GACP II, L.P., direct lending funds that provide senior secured loans and second lien secured loan facilities to middle market public and private U.S. companies.
Proprietary Trading
We engage in trading activities for strategic investment purposes (i.e. proprietary trading) utilizing the firm’s capital. Proprietary trading activities include investments in public and private stock and debt securities. In 2010, the federal government passed the Dodd-Frank Wall Street Reform and Consumer Protection Act (“Dodd-Frank”). Dodd-Frank significantly restructured and intensified regulation in the financial services industry, and the “Volcker Rule” was promulgated under Dodd-Frank. The Volcker Rule provides for a limitation on proprietary trading and investments by bank holding companies and banks. We are not a bank holding company or bank and, as a result, the Volcker Rule and its proprietary trading and investment limitations do not apply to us.
The business described above for B. Riley FBR is reported in our Capital Markets segment for financial reporting purposes.
B. Riley Wealth Management
Wealth Management
B. Riley Wealth Management provides comprehensive wealth management and brokerage services to individuals and families, corporations and non-profit organizations, including qualified retirement plans, trusts, foundations and endowments. Our financial advisors provide a broad range of investments and services to our clients, including financial planning services. Wunderlich Securities, Inc. (“Wunderlich”) was established in 1996 and headquartered in Memphis, Tennessee. Wunderlich became a wholly-owned subsidiary of B. Riley Financial, Inc., in July 2017 and its operations are included in our Capital Markets segment. In June 2018, Wunderlich changed its name to B. Riley Wealth Management, Inc.
GlassRatner
Financial Advisory Services
GlassRatner, a specialty financial advisory services firm we acquired on August 1, 2018, provides consulting services to shareholders, creditors and companies, including due diligence, fraud investigations, corporate litigation support, crisis management and bankruptcy services. The addition of GlassRatner strengthens B. Riley’s diverse platform and compliments the restructuring services provided by B. Riley FBR.
4
Great American Group
Retail Store Liquidations and Wholesale and Industrial Liquidations
We enable our clients to quickly and efficiently dispose of under-performing assets and generate cash from excess inventory by conducting or assisting in retail store closings, going out of business sales, bankruptcy sales and fixture sales. Financial institution and other capital providers rely on us to maximize recovery rates in distressed asset sales and in retail bankruptcy situations. Additionally, healthy, mature retailers utilize our proven inventory management and strategic disposition solutions, relying on our extensive network of retail professionals, to close unproductive stores and dispose of surplus inventory and fixtures as existing stores are updated.
We often conduct large retail liquidations that entail significant capital requirements through collaborative arrangements with other liquidators. By entering into an agreement with one or more collaborators, we are able to bid on larger engagements that we could not conduct on our own due to the significant capital outlay involved, number of independent contractors required or financial risk associated with the particular engagement. We act as the lead partner in many of the collaborative arrangements that we enter into, meaning that we have primary responsibility for the due diligence, contract negotiation and execution of the engagement.
We design and implement customized disposition programs for our clients seeking to convert excess wholesale and industrial inventory and operational assets into capital. We dispose of a wide array of assets including, among others, equipment related to transportation, heavy mobile construction, energy exploration and services, metal fabrication, food processing, semiconductor fabrication, and distribution services. We manage projects of all sizes and scopes across a variety of asset categories. We believe that our databases of information regarding potential buyers that we have collected from past transactions and engagements, our nationwide name recognition and experience with alternative distribution channels allow us to provide superior wholesale and industrial disposition services.
Great American Group provides the foregoing services to clients on a guarantee, fee or outright purchase basis.
Guarantee. When providing services on a guarantee basis, we guarantee the client a specific recovery often expressed as a percentage of retail inventory value or wholesale inventory cost or, in the case of machinery or equipment, a set dollar amount. This guarantee is often required to be supported by a letter of credit, a cash deposit or a combination thereof. Cash deposits are typically funded in part with available cash together with short term borrowings under our credit facilities. Often when we provide auction or liquidation services on a guarantee basis, we do so through a collaborative arrangement with other service providers. In this situation, each collaborator agrees to provide a certain percentage of the guaranteed amount to the client through a combination of letters of credit, cash and financing. If we are engaged individually, we receive 100% of the net profit, less debt financing fees, sale related expenses (if any) and any share of the profits due to the client as a result of any profit sharing arrangement entered into based on a pre-negotiated formula. If the engagement was conducted through a collaborative arrangement, the profits or losses are divided among us and our partner or partners as set forth in the agreement governing the collaborative arrangement. If the net sales proceeds after expenses are less than the guarantee, we, together with our partners if the engagement was conducted through a collaborative arrangement, are responsible for the shortfall and will recognize a loss on the engagement.
Fee. When we provide services on a fee basis, clients pay a pre-negotiated flat fee for the services provided, a percentage of asset sales generated or a combination of both.
Outright Purchase. When providing services on an outright purchase basis, we purchase the assets from the client and typically sell them at auction, orderly liquidation, through a third-party broker or, less frequently, as augmented inventory in conjunction with another liquidation that we are conducting. In an outright purchase, we take, together with any collaboration partners, title to the assets and absorb the profit or loss associated with the asset disposition.
The retail store liquidations and wholesale and industrial asset dispositions business of Great American Group described above is reported in our Auction and Liquidation segment for financial reporting purposes.
Valuation and Appraisal
Our Valuation and Appraisal teams provide independent appraisals to financial institutions, lenders, private equity firms and other providers of capital for estimated liquidation values of assets. These teams include experts specializing in particular industry niches and asset classes. We provide Valuation and Appraisal services across five general categories:
5
Consumer and Retail Inventory. Representative types of appraisals and valuations include inventory of specialty apparel retailers, department stores, jewelry retailers, sporting goods retailers, mass and discount merchants, home furnishing retailers and footwear retailers.
Wholesale and Industrial Inventory. Representative types of appraisals and valuations include inventory held by manufacturers or distributors of automotive parts, chemicals, food and beverage products, wine and spirits, building and construction products, industrial products, metals, paper and packaging.
Machinery and Equipment. Representative types of asset appraisals and valuations include a broad range of equipment utilized in manufacturing, construction, transportation and healthcare.
Intangible Assets. Representative types of asset appraisals and valuations include intellectual property, goodwill, brands, logos, trademarks and customer lists.
We provide Valuation and Appraisal services on a pre-negotiated flat fee basis.
The Valuation and Appraisal services business of Great American Group described above is reported in our Valuation and Appraisal segment for financial reporting purposes.
Principal Investments - United Online and magicJack
We acquired UOL on July 1, 2016 and magicJack on November 14, 2018 as part of our principal investment strategy. UOL’s primary pay service is Internet access, offered under the NetZero and Juno brands. Internet access includes dial-up service, mobile broadband and DSL. magicJack is a VoIP cloud-based technology and services communications provider and the inventor of the magicJack devices.
Internet Access
Our Internet access services consist of dial-up, mobile broadband and, to a much lesser extent, DSL services. Our dial-up Internet access services are provided on both a free and pay basis, with the free services subject to hourly and other limitations. Basic pay dial-up Internet access services include accelerated dial-up Internet access and an email account. Our Internet access services are also bundled with additional benefits, including antivirus software and enhanced email storage, although we also offer each of these features and certain other value-added features as stand-alone pay services. We offer mobile broadband devices for sale in connection with our mobile broadband services. We also generate revenues from the resale of telecommunications to third parties. Over the past several years revenues from paid subscription services have declined year over year as a result of a decline in the number of paid subscribers for our services. Management believes the decline in paid subscriber accounts is primarily attributable to the industry trends of consumers switching from dial-up Internet access to high speed Internet access such as cable and DSL. Management expects revenues in the Principal Investments - United Online and magicJack segment to continue to decline year over year.
magicJack Devices
The magicJack is a VoIP device weighing about one ounce which includes an initial access right period. Customers receive free VoIP phone service for their home, enterprise or while traveling. The initial access right period for the different versions ranges from three to twelve months. The current device available for purchase is the magicJack GO, which includes a twelve month access right period. magicJack devices are sold either directly to customers through our website or through retailers.
Mobile apps
The Company also offers magicJack mobile apps, which are applications that allow users to make and receive telephone calls through their smart phones or devices. The mobile apps allow customers to place and receive telephone calls in the U.S. or Canada on their mobile devices through either an existing or new magicJack account. The mobile apps also give users the ability to add a second phone number to their smart phone for a monthly or annual fee. Customers may purchase international minutes to place telephone calls through the magicJack device or mobile apps to locations outside of the U.S. and Canada.
Access Right Renewals
Customers who own a magicJack device or mobile app may renew access rights for periods ranging from one month to five years.
6
Other magicJack-Related Products
The Company offers customers other optional products related to their magicJack devices and services, such as custom or vanity phone numbers, Canadian phone numbers and the ability to either change their existing phone numbers or port them to a magicJack device.
Prepaid Minutes
The Company’s customers can purchase international minutes on a prepaid basis.
Access and Wholesale Charges
The Company generates revenues from access fees charged to other carriers, as well as wholesaling telephone service to VoIP providers and telecommunication carriers.
UCaaS Services and Equipment
The Company provided hosted communication services and sold hardware and network equipment that are compatible with the service, through its subsidiary, Broadsmart, which was sold during 2019.
Advertising and other revenue
Advertising and other revenues are primarily derived from various advertising, marketing and media-related initiatives. The majority of our advertising and other revenues include advertising revenues from search placements, display advertisements and online market research associated with our Internet access and email services.
Brands
Our brand investment portfolio focuses on generating revenue through the licensing of trademarks. The Company holds a majority ownership interest in BR Brand, which owns the assets and intellectual property related to licenses of six brands: Catherine Malandrino, English Laundry, Joan Vass, Kensie Girl, Limited Too and Nanette Lepore as well as an investment in the Hurley Brand with Bluestar Alliance LLC (“Bluestar”). The Company intends to grow licensing revenue from the brand holdings in partnership with Bluestar by leveraging its extensive relationships and strategic partnerships in the retail sector. The Company intends to pursue future acquisitions of consumer brands, intellectual property, trademarks and licenses, and participate in select transactions as an equity owner.
Customers
We serve retail, corporate, capital provider and individual customers across our services lines. The services provided to these customers were under short-term liquidation contracts that generally do not exceed a period of six months. There were no recurring revenues from year-to-year in connection with the services we performed under these contracts.
B. Riley FBR
We are engaged by corporate customers, including publicly held and privately owned companies, to provide investment banking, corporate finance, restructuring advisory, research and sales and trading services. We also provide corporate finance, research, wealth management, and sales and trading services to high net worth individuals. We maintain client relationships with companies in the consumer goods, consumer services, defense, industrials and technology industries.
B. Riley Wealth Management
We act as financial wealth management advisors to individuals, families, small businesses, non-profit organizations, and qualified retirement plans. Our investment services are primarily comprised of asset management services to meet the financial plans, financial goals and needs of our customers. We service our customers through a network of 21 branch offices located in 14 states primarily located in the Mid-west and Southern section of the United States.
GlassRatner
We provide specialty financial advisory services to companies, shareholders, creditors and investors on complex business problems and critical board level agenda items including transaction advisory and due diligence, fraud investigations, corporate litigation, business valuations, crisis management and bankruptcy. We provide bankruptcy and restructuring services, forensic accounting and litigation support, valuation services, and real estate consulting.
7
Great American Group
Our retail Auction and Liquidation clients include financially healthy retailers as well as distressed retailers, bankruptcy professionals, financial institution workout groups and a wide range of professional service providers. Some retail segments in which we specialize include apparel, arts and crafts, department stores, discount stores, drug / health and beauty, electronics, footwear, grocery stores, hardware / home improvement, home goods and linens, jewelry, office / party supplies, specialty stores, and sporting goods. We also provide wholesale and industrial auction services and customized disposition programs to a wide range of clients.
We are engaged by financial institutions, lenders, private equity firms and other capital providers, as well as professional service providers, to provide valuation and advisory services. We have extensive experience in the appraisal and valuation of retail and consumer inventories, wholesale and industrial inventories, machinery and equipment, intellectual property and real estate. We maintain ongoing client relationships with major asset based lenders including Bank of America, JPMorgan Chase, and Wells Fargo.
United Online
Our Internet access services are available to customers, which are primarily comprised of individuals, in more than 12,000 cities across the U.S. and Canada. Generally, our Internet access customers also subscribe to value-added features that include antivirus software and enhanced email storage. Our advertising customers primarily include business customers that market products and services over the Internet.
magicJack
magicJack provides complete phone service for home, enterprise and while traveling for retailers, wholesalers or directly to customer over the period associated with the access right period. The Company provides customers with an ability to make and receive telephone calls through their smart phones, add a second phone number to their smart phone and purchase prepaid minutes to place telephone calls through the magicJack device or mobile apps to locations outside of the U.S. and Canada.
Competition
B. Riley FBR, B. Riley Wealth Management and GlassRatner
We face intense competition for our Capital Markets services. Since the mid-1990s, there has been substantial consolidation among U.S. and global financial institutions. In particular, a number of large commercial banks, insurance companies and other diversified financial services firms have merged with other financial institutions or have established or acquired broker-dealers. During 2008, the failure or near-collapse of a number of very large financial institutions led to the acquisition of several of the most sizeable U.S. investment banking firms, consolidating the financial industry to an even greater extent. Currently, our competitors are other investment banks, bank holding companies, brokerage firms, merchant banks and financial advisory firms. Our focus on our target industries also subjects us to direct competition from a number of specialty securities firms and smaller investment banking boutiques that specialize in providing services to these industries.
The industry trend toward consolidation has significantly increased the capital base and geographic reach of many of our competitors. Our larger and better-capitalized competitors may be better able than we are to respond to changes in the investment banking industry, to recruit and retain skilled professionals, to finance acquisitions, to fund internal growth and to compete for market share generally. Many of these firms have the ability to offer a wider range of products than we do, including loans, deposit-taking and insurance, in addition to brokerage, asset management and investment banking services, all of which may enhance their competitive position relative to us. These firms also have the ability to support investment banking and securities products with commercial banking, insurance and other financial services revenues in an effort to gain market share, which could result in downward pricing pressure in our businesses. In particular, the trend in the equity underwriting business toward multiple book runners and co-managers has increased the competitive pressure in the investment banking industry and has placed downward pressure on average transaction fees.
As we seek to expand our asset management business, we face competition in the pursuit of investors for our investment funds, in the identification and completion of investments in attractive portfolio companies or securities, and in the recruitment and retention of skilled asset management professionals.
8
Great American Group
We also face intense competition in our other service areas. While some competitors are unique to specific service offerings, some competitors cross multiple service offerings. A number of companies provide services or products to the Auction and Liquidation and Valuation and Appraisal markets, and existing and potential clients can, or will be able to, choose from a variety of qualified service providers. Some of our competitors may even be able to offer discounts or other preferred pricing arrangements. In a cost-sensitive environment, such arrangements may prevent us from acquiring new clients or new engagements with existing clients. Some of our competitors may be able to negotiate secure alliances with clients and affiliates on more favorable terms, devote greater resources to marketing and promotional campaigns or to the development of technology systems than us. In addition, new technologies and the expansion of existing technologies with respect to the online auction business may increase the competitive pressures on us. We must also compete for the services of skilled professionals. There can be no assurance that we will be able to compete successfully against current or future competitors, and competitive pressures we face could harm our business, operating results and financial condition.
We face competition for our retail services from traditional liquidators as well as Internet-based liquidators such as overstock.com and eBay. Our wholesale and industrial services competitors include traditional auctioneers and fixed site auction houses that may specialize in particular industries or geographic regions as well as other large, prestigious or well-recognized auctioneers. We also face competition and pricing pressure from the internal remarketing groups of our clients and potential clients and from companies that may choose to liquidate or auction assets and/or excess inventory without assistance from service providers like us. We face competition for our Valuation and Appraisal services from large accounting, consulting and other professional service firms as well as other valuation, appraisal and advisory firms.
United Online
The U.S. market for Internet and broadband services is highly competitive. We compete with numerous providers of broadband services, as well as other dial-up Internet access providers. Our principal competitors for broadband services include, among others, local exchange carriers, wireless and satellite service providers, cable service providers, and broadband resellers. These competitors include established providers such as AT&T, Verizon, Sprint and T-Mobile. Our principal dial-up Internet access competitors include established online service and content providers, such as AOL and MSN, and independent national Internet service providers, such as EarthLink. We believe the primary competitive factors in the Internet access industry are speed, price, coverage area, ease of use, scope of services, quality of service, and features. Our dial-up Internet access services do not compete favorably with broadband services with respect to certain of these factors, including, but not limited to, speed.
magicJack
The principal competitors for our products and services include the traditional telephone service providers, such as AT&T, Inc., CenturyLink, Inc. and Verizon Communications Inc., which provide telephone service using the public switched telephone network. Certain of these traditional providers have also added, or are planning to add, broadband telephone services to their existing telephone and broadband offerings. We also face, or expect to face, competition from cable companies, such as Cablevision Systems Corp., Charter Communications, Inc., Comcast Corporation, Cox Communications, Inc. and Time Warner Cable (a division of Time Warner Inc.), which offer broadband telephone services to their existing cable television and broadband offerings. Further, wireless providers, including AT&T Mobility, Inc., Sprint Corporation, T-Mobile USA Inc., and Verizon Wireless, Inc. offer services that some customers may prefer over wireline-based service. In the future, as wireless companies offer more minutes at lower prices, their services may become more attractive to customers as a replacement for broadband or wireline-based phone service.
We face competition on magicJack device sales from Apple, Samsung, Motorola and other manufacturers of smart phones, tablets and other handheld wireless devices. Also, we compete against established alternative voice communication providers, such as Vonage, Google Voice, Ooma, and Skype, which is another non-interconnected voice provider, and may face competition from other large, well-capitalized Internet companies. In addition, we compete with independent broadband telephone service providers.
Brands
Our brand investment portfolio competes with companies that own other brands and trademarks, as these companies could enter into similar licensing arrangements with retailers and wholesalers in the United States and internationally. These arrangements could be with our existing retail and wholesale partners, thereby competing with us for consumer attention and limited floor or rack space in the same stores in which our branded products are sold, and vying with us for the time and resources of the retailers and wholesale licensees that manufacture and distribute our products. These companies may be able to respond more quickly to changes in retailer, wholesaler and consumer preferences and devote greater resources to brand acquisition, development and marketing. We may not be able to compete effectively against these companies.
9
Regulation
We are subject to federal and state consumer protection laws, including regulations prohibiting unfair and deceptive trade practices. In addition, numerous states and municipalities regulate the conduct of auctions and the liability of auctioneers. We and/or our auctioneers are licensed or bonded in the following states where we conduct, or have conducted, retail, wholesale or industrial asset auctions: California, Florida, Georgia, Illinois, Massachusetts, Ohio, South Carolina, Texas, Virginia and Washington. In addition, we are licensed or obtain permits in cities and/or counties where we conduct auctions, as required. If we conduct an auction in a state where we are not licensed or where reciprocity laws do not exist, we will work with an auctioneer of record in such state.
As a participant in the financial services industry, we are subject to complex and extensive regulation of most aspects of our business by U.S. federal and state regulatory agencies, self-regulatory organizations and securities exchanges. The laws, rules and regulations comprising the regulatory framework are constantly changing, as are the interpretation and enforcement of existing laws, rules and regulations. The effect of any such changes cannot be predicted and may direct the manner of our operations and affect our profitability.
B. Riley FBR and B. Riley Wealth Management, our broker-dealer subsidiaries, are subject to regulations governing every aspect of the securities business, including the execution of securities transactions; capital requirements; record-keeping and reporting procedures; relationships with customers, including the handling of cash and margin accounts; the experience of and training requirements for certain employees; and business interactions with firms that are not members of regulatory bodies.
B. Riley FBR and B. Riley Wealth Management are registered as securities broker-dealers with the SEC and are members of FINRA. FINRA is a self-regulatory body composed of members such as our broker-dealer subsidiary that have agreed to abide by the rules and regulations of FINRA. FINRA may expel, fine and otherwise discipline member firms and their employees. B. Riley FBR and B. Riley Wealth Management are licensed as broker-dealers in all 50 states in the U.S., requiring us to comply with the laws, rules and regulations of each such state. Each state may revoke the license to conduct securities business, fine and otherwise discipline broker-dealers and their employees. We are also registered with NASDAQ and must comply with its applicable rules.
B. Riley FBR and B. Riley Wealth Management are also subject to the SEC’s Uniform Net Capital Rule, Rule 15c3-1, which may limit our ability to make withdrawals of capital from our broker-dealer subsidiaries. The Uniform Net Capital Rule sets the minimum level of net capital a broker-dealer must maintain and also requires that a portion of its assets be relatively liquid. In addition, B. Riley FBR and B. Riley Wealth Management are subject to certain notification requirements related to withdrawals of excess net capital.
We are also subject to the USA PATRIOT Act of 2001 (the Patriot Act), which imposes obligations regarding the prevention and detection of money-laundering activities, including the establishment of customer due diligence and customer verification, and other compliance policies and procedures. The conduct of research analysts is also the subject of rule-making by the SEC, FINRA and the federal government through the Sarbanes-Oxley Act. These regulations require certain disclosures by, and restrict the activities of, research analysts and broker-dealers, among others. Failure to comply with these requirements may result in monetary, regulatory and, in the case of the USA Patriot Act, criminal penalties.
Our asset management subsidiaries, B. Riley Capital Management, LLC and B. Riley Wealth Management, are SEC-registered investment advisers, and accordingly subject to regulation by the SEC. Requirements under the Investment Advisors Act of 1940 include record-keeping, advertising and operating requirements, and prohibitions on fraudulent activities.
Various regulators, including the SEC, FINRA and state securities regulators and attorneys general, are conducting both targeted and industry-wide investigations of certain practices relating to the financial services industry, including marketing, sales practices, valuation practices, asset managers, and market and compensation arrangements. These investigations, which have been highly publicized, have involved mutual fund companies, broker-dealers, hedge funds, investors and others.
In addition, the SEC staff has conducted studies with respect to soft dollar practices in the brokerage and asset management industries and proposed interpretive guidance regarding the scope of permitted brokerage and research services in connection with soft dollar practices
In July 2010, Congress enacted Dodd-Frank. Dodd-Frank institutes a wide range of reforms that impact financial services firms and resulted in significant rule-making. In addition, the legislation mandates multiple studies, which could result in additional legislative or regulatory action. Certain provisions of Dodd-Frank remain subject to further rulemaking procedures and studies. As a result, we cannot assess the impact of these new legislative and regulatory changes on our business at the present time.
10
UOL is subject to a number of international, federal, state, and local laws and regulations, including, without limitation, those relating to taxation, bulk email or “spam,” advertising, user privacy and data protection, consumer protection, antitrust, export, and unclaimed property. In addition, proposed laws and regulations relating to some or all of the foregoing, as well as to other areas affecting our businesses, are continuously debated and considered for adoption in the U.S. and other countries, and such laws and regulations could be adopted in the future. For additional information, see “Risk Factors,” which appears in Item 1A of this Annual Report on Form 10-K.
In the United States, magicJack is subject to federal regulation under the rules and regulations of the Federal Communications Commission (“FCC” or the “Commission”) and various state and local regulations. magicJack provides broadband telephone services using VoIP technology and/or services treated as information services by the FCC. magicJack is also licensed as a Competitive Local Exchange Carrier (“CLEC”) and is subject to extensive federal and state regulation applicable to CLECs. The FCC has to date asserted limited statutory jurisdiction and regulatory authority over the operations and offerings of certain providers of broadband telephone services, including non-interconnected VoIP. FCC regulations may now, or may in the future, be applied to magicJack’s broadband telephone operations. Other FCC regulations apply to magicJack because it provides international calling capability. Some of the magicJack’s operations are also subject to regulation by state public utility commissions.
Employees
As of December 31, 2019, we had 982 full time employees. We are not a party to any collective bargaining agreements. We have never experienced a work stoppage or strike and believe that relations with our employees are good.
Acquisition of magicJack
On November 9, 2017, we entered into the magicJack Merger Agreement with B. R. Acquisition Ltd., an Israeli corporation and wholly-owned subsidiary of ours (“Merger Sub”), pursuant to which Merger Sub would merge with and into magicJack, with magicJack continuing as the surviving corporation and as an indirect subsidiary of the Company. Pursuant to the terms of the magicJack Merger Agreement, customary closing conditions were satisfied, and the acquisition was completed on November 14, 2018. Subject to the terms and conditions of the magicJack Merger Agreement, each outstanding share of magicJack converted into the right to receive $8.71 in cash without interest, representing approximately $143.1 million in aggregate merger consideration.
Acquisition of Wunderlich
On May 17, 2017, we entered into a Merger Agreement (the “Wunderlich Merger Agreement”) with Wunderlich. Pursuant to the Wunderlich Merger Agreement, customary closing conditions were satisfied and the acquisition was completed on July 3, 2017. The total consideration of $65.1 million paid to Wunderlich shareholders in connection with the Wunderlich acquisition was comprised of (a) cash in the amount of $29.7 million; (b) 1,974,812 newly issued shares of our common stock at closing which were valued at $31.5 million for accounting purposes determined based on the closing market price of our shares of common stock on the acquisition date on July 3, 2017, less a 13.0% discount for lack of marketability as the shares issued are subject to certain escrow provisions and restrictions that limit their trade or transfer; and (c) 821,816 newly issued common stock warrants with an estimated fair value of $3.9 million. The common stock and common stock warrants issued includes 387,365 common shares and 167,352 common stock warrants that are held in escrow and subject to forfeiture to indemnify us for certain representations and warranties in connection with the acquisition. We believe that the acquisition of Wunderlich will allow us to benefit from wealth management, investment banking, corporate finance, and sales and trading services provided by Wunderlich. The acquisition of Wunderlich is accounted for using the purchase method of accounting. We also entered into a registration rights agreement with certain shareholders of Wunderlich (the “Registration Rights Agreement”) on July 3, 2017 for the shares issued in connection with the Wunderlich Merger Agreement. The Registration Rights Agreement provides the Wunderlich shareholders with the right to notice of and, subject to certain conditions, the right to register shares of our common stock in certain future registered offerings of shares of our common stock. In June 2018, Wunderlich changed its name to B. Riley Wealth Management, Inc.
Acquisition of FBR
On June 1, 2017, we completed the purchase of all of the outstanding common stock of FBR Capital Markets & Co. (“FBR”), a mid-sized investment bank with operations primarily in Washington D.C and New York, pursuant to a purchase agreement we entered into with FBR on February 17, 2017. The aggregate purchase price for the acquisition was $73.5 million in a stock transaction through the issuance of 4,831,633 shares of our common stock. Upon completion of the acquisition, we integrated and merged the investment banking operations of B. Riley & Co, LLC. with and into FBR and changed the name of FBR to B. Riley FBR.
Acquisition of Majority Interest in BR Brand
On October 28, 2019, the Company and the “B. Riley Member”, completed the acquisition of a majority equity interest in BR Brand as described above under the heading “Recent Developments”.
Available Information
We were incorporated in Delaware in May 2009. We maintain a website at www.brileyfin.com. The information on our website is not a part of, or incorporated in, this Annual Report. We file annual reports on Form 10-K, quarterly reports on Form 10-Q, current reports on Form 8-K, proxy and information statements, among other reports and filings, with the SEC, and make available, free of charge, on or through our website, such reports and filings and amendments thereto filed or furnished pursuant to Section 13(a) or 15(d) of the Securities Exchange Act of 1934, as amended (the “Exchange Act”), as soon as reasonably practicable after we electronically file such material with, or furnish it to, the SEC. The public may obtain copies of these reports and filings and any amendments thereto at the SEC’s Internet site, www.sec.gov.
11
Given the nature of our operations and services we provide, a wide range of factors could materially affect our operations and profitability. Changes in competitive, market and economic conditions also affect our operations. The risks and uncertainties described below are not the only risks and uncertainties facing us. Additional risks and uncertainties not presently known or that are currently considered to be immaterial may also materially and adversely affect our business operations or stock price. If any of the following risks or uncertainties occurs, our business, financial condition or operating results could materially suffer.
Our revenues and results of operations are volatile and difficult to predict.
Our revenues and results of operations fluctuate significantly from quarter to quarter, due to a number of factors. These factors include, but are not limited to, the following:
| ● | Our ability to attract new clients and obtain additional business from our existing client base; |
| ● | The number, size and timing of mergers and acquisition transactions, capital raising transactions and other strategic advisory services where we act as an adviser on our Auction and Liquidation and investment banking engagements; |
| ● | The extent to which we acquire assets for resale, or guarantee a minimum return thereon, and our ability to resell those assets at favorable prices; |
| ● | Variability in the mix of revenues from the Auction and Liquidation and Valuation and Appraisal businesses; |
| ● | The rate of decline we experience from our dial-up and DSL Internet access pay accounts in our UOL business as customers continue to migrate to broadband access which provides faster Internet connection and download speeds offered by our competitors; |
| ● | The rate of growth of new service areas; |
| ● | The types of fees we charge clients, or other financial arrangements we enter into with clients; and |
| ● | Changes in general economic and market conditions. |
We have limited or no control over some of the factors set forth above and, as a result, may be unable to forecast our revenues accurately. For example, our investment banking revenues are typically earned upon the successful completion of a transaction, the timing of which is uncertain and beyond our control. A client’s acquisition transaction may be delayed or terminated because of a failure to agree upon final terms with the counterparty, failure to obtain necessary regulatory consents or board or stockholder approvals, failure to secure necessary financing, adverse market conditions or unexpected financial or other problems in the business of a client or a counterparty. If the parties fail to complete a transaction on which we are advising or an offering in which we are participating, we will earn little or no revenue from the contemplated transaction.
We rely on projections of revenues in developing our operating plans for the future and will base our expectations regarding expenses on these projections and plans. If we inaccurately forecast revenues and/or earnings, or fail to accurately project expenses, “FBR” we may be unable to adjust our spending in a timely manner to compensate for these inaccuracies and, as a result, may suffer operating losses and such losses could have a negative impact on our financial condition and results of operations. If, for any reason, we fail to meet company, investor or analyst projections of revenue, growth or earnings, the market price of the common stock could decline and you may lose all or part of your investment.
Conditions in the financial markets and general economic conditions have impacted and may continue to impact our ability to generate business and revenues, which may cause significant fluctuations in our stock price.
Our business has been in the past, and we expect it in the future to be, be materially affected by conditions in the financial market and general economic conditions, such as the level and volatility of interest rates, investor sentiment, the availability and the cost of credit, the U.S. mortgage market, the U.S. real estate market, volatile energy prices, consumer confidence, unemployment, the adverse effects of events such as outbreaks of contagious disease (such as the novel coronavirus), and geopolitical issues. Further, certain aspects of our business are cyclical in nature and changes in the current economic environment may require us to adjust our sales and marketing practices and react to different business opportunities and modes of competition. If we are not successful in reacting to changing economic conditions, we may lose business opportunities which could harm our financial condition. For example, we are more likely to conduct auctions and liquidations in connection with insolvencies and store closures during periods of economic downturn relative to periods of economic expansion. Conversely, during an economic downturn, financial institutions that provide asset-based loans typically reduce the number of loans made, which reduces their need for our Valuation and Appraisal services.
12
In addition, weakness or disruption in equity markets and diminished trading volume of securities could adversely impact our sales and trading business in the future. Any industry-wide declines in the size and number of underwritings and mergers and acquisitions transactions could also have an adverse effect on our investment banking revenues. Reductions in the trading prices for equity securities tend to reduce the transaction value of investment banking transactions, such as underwriting and mergers and acquisitions transactions, which in turn may reduce the fees we earn from these transactions. Market conditions may also affect the level and volatility of securities prices and the liquidity and value of investments in our funds and proprietary inventory, and we may not be able to manage our business’s exposure to these market conditions. In addition to these factors, deterioration in the financial markets or economic conditions could materially affect our investment banking business in other ways, including the following:
| ● | Our opportunity to act as underwriter or placement agent could be adversely affected by a reduction in the number and size of capital raising transactions or by competing sources of equity. |
| ● | The number and size of mergers and acquisitions transactions or other strategic advisory services where we act as adviser could be adversely affected by continued uncertainties in valuations related to asset quality and creditworthiness, volatility in the equity markets, and diminished access to financing. |
| ● | Market volatility could lead to a decline in the volume of transactions that we execute for our customers and, therefore, to a decline in the revenue we receive from commissions and spreads. |
| ● | We may experience losses in securities trading activities, or as a result of write-downs in the value of securities that we own, as a result of deteriorations in the businesses or creditworthiness of the issuers of such securities. |
| ● | We may experience losses or write downs in the realizable value of our proprietary investments due to the inability of companies we invest in to repay their borrowings. |
| ● | Our access to liquidity and the capital markets could be limited, preventing us from making proprietary investments and restricting our sales and trading businesses. |
| ● | We may incur unexpected costs or losses as a result of the bankruptcy or other failure of companies for which we have performed investment banking services to honor ongoing obligations such as indemnification or expense reimbursement agreements. |
| ● | Sudden sharp declines in market values of securities can result in illiquid markets and the failure of counterparties to perform their obligations, which could make it difficult for us to sell securities, hedge securities positions, and invest funds under management. |
| ● | As an introducing broker to clearing firms, we are responsible to the clearing firm and could be held liable for the defaults of our customers, including losses incurred as the result of a customer’s failure to meet a margin call. When we allow customers to purchase securities on margin, we are subject to risks inherent in extending credit. This risk increases when a market is rapidly declining and the value of the collateral held falls below the amount of a customer’s indebtedness. If a customer’s account is liquidated as the result of a margin call, we are liable to our clearing firm for any deficiency. |
| ● | Competition in our investment banking, sales, and trading businesses could intensify as a result of the increasing pressures on financial services companies and larger firms competing for transactions and business that historically would have been too small for them to consider. |
| ● | Market volatility could result in lower prices for securities, which may result in reduced management fees calculated as a percentage of assets under management. |
| ● | Market declines could increase claims and litigation, including arbitration claims from customers. |
| ● | Our industry could face increased regulation as a result of legislative or regulatory initiatives. Compliance with such regulation may increase our costs and limit our ability to pursue business opportunities. |
| ● | Government intervention may not succeed in improving the financial and credit markets and may have negative consequences for our business. |
13
It is difficult to predict how long current financial market and economic conditions will continue, whether they will deteriorate and if they do, which of our business lines will be adversely affected. If one or more of the foregoing risks occurs, our revenues are likely to decline and, if we were unable to reduce expenses at the same pace, our profit margins could erode.
Global economic and political uncertainty, including Brexit, could adversely affect our revenue and results of operations.
As a result of the international nature of our business, we are subject to the risks arising from adverse changes in global economic and political conditions. Uncertainty about the effects of current and future economic and political conditions on us, our customers, suppliers and partners makes it difficult for us to forecast operating results and to make decisions about future investments. Deterioration in economic conditions in any of the countries in which we do business could result in reductions in sales of our products and services and could cause slower or impaired collections on accounts receivable, which may adversely impact our liquidity and financial condition.
On June 23, 2016, the United Kingdom left the European Union, commonly referred to as “Brexit”. Events related to Brexit are causing significant political uncertainty in both the United Kingdom and the European Union. The impact of Brexit and the resulting effect on the political and economic future of the United Kingdom and the European Union is uncertain, and our business may be adversely affected in ways we do not currently anticipate. Brexit may result in a significant change in the British regulatory environment, which may likely increase our compliance costs. We may find it more difficult to conduct business in the United Kingdom and the European Union, as Brexit may result in increased restrictions on the movement of capital, goods and personnel. Depending on developments with respect to Brexit, we may decide to relocate or otherwise alter our European operations to respond to the new business, legal, regulatory, tax and trade environments that may result.
As with any political instability or adverse political developments in or around any of the major countries in which we do business, developments related to Brexit may materially and adversely affect with customers, suppliers and employees and could harm our business, results of operations and financial condition.
We focus principally on specific sectors of the economy in our investment banking operations, and deterioration in the business environment in these sectors or a decline in the market for securities of companies within these sectors could harm our business.
We focus principally on five target industries in our investment banking operations: consumer goods, consumer services, defense, industrials and technology. Volatility in the business environment in these industries or in the market for securities of companies within these industries could adversely affect our financial results and the market value of our common stock. The business environment for companies in some of these industries has been subject to high levels of volatility in recent years, and our financial results have consequently been subject to significant variations from year to year. The market for securities in each of our target industries may also be subject to industry-specific risks. For example, we have research, investment banking and Principal Investments focused in the areas of defense. This sector has been subject to U.S. Department of Defense budget cuts as well as by disruptions in the financial markets and downturns in the general economy. The consumer goods and services sectors are subject to consumer spending trends, which have been volatile, to mall traffic trends, which have been down, to the availability of credit, and to broader trends such as the rise of Internet retailers. Emerging markets have driven the growth of certain consumer companies but emerging market economies are fragile, subject to wide swings in GDP, and subject to changes in foreign currencies. The technology industry has been volatile, driven by evolving technology trends, by technological obsolescence, by enterprise spending, and by changes in the capital spending trends of major corporations and government agencies around the world.
Our investment banking operations focus on various sectors of the economy, and we also depend significantly on private company transactions for sources of revenues and potential business opportunities. Most of these private company clients are initially funded and controlled by private equity firms. To the extent that the pace of these private company transactions slows or the average transaction size declines due to a decrease in private equity financings, difficult market conditions in our target industries or other factors, our business and results of operations may be harmed.
Underwriting and other corporate finance transactions, strategic advisory engagements and related sales and trading activities in our target industries represent a significant portion of our investment banking business. This concentration of activity in our target industries exposes us to the risk of declines in revenues in the event of downturns in these industries.
14
Our corporate finance and strategic advisory engagements are singular in nature and do not generally provide for subsequent engagements.
Our investment banking clients generally retain us on a short-term, engagement-by-engagement basis in connection with specific corporate finance, merger and acquisition transactions (often as an advisor in company sale transactions) and other strategic advisory services, rather than on a recurring basis under long-term contracts. As these transactions are typically singular in nature and our engagements with these clients may not recur, we must seek new engagements when our current engagements are successfully completed or are terminated. As a result, high activity levels in any period are not necessarily indicative of continued high levels of activity in any subsequent period. If we are unable to generate a substantial number of new engagements that generate fees from new or existing clients, our business, results of operations and financial condition could be adversely affected.
The asset management business is intensely competitive.
Over the past several years, the size and number of asset management funds, including hedge funds and mutual funds, has continued to increase. If this trend continues, it is possible that it will become increasingly difficult for our funds to raise capital. More significantly, the allocation of increasing amounts of capital to alternative investment strategies by institutional and individual investors leads to a reduction in the size and duration of pricing inefficiencies. Many alternative investment strategies seek to exploit these inefficiencies and, in certain industries, this drives prices for investments higher, in either case increasing the difficulty of achieving targeted returns. In addition, if interest rates were to rise or there were to be a prolonged bull market in equities, the attractiveness of our funds relative to investments in other investment products could decrease. Competition is based on a variety of factors, including:
| ● | investment performance; |
| ● | investor perception of the drive, focus and alignment of interest of an investment manager; |
| ● | quality of service provided to and duration of relationship with investors; |
| ● | business reputation; and |
| ● | level of fees and expenses charged for services. |
We compete in the asset management business with a large number of investment management firms, private equity fund sponsors, hedge fund sponsors and other financial institutions. A number of factors serve to increase our competitive risks, as follows:
| ● | investors may develop concerns that we will allow a fund to grow to the detriment of its performance; |
| ● | some of our competitors have greater capital, lower targeted returns or greater sector or investment strategy specific expertise than we do, which creates competitive disadvantages with respect to investment opportunities; |
| ● | some of our competitors may perceive risk differently than we do which could allow them either to outbid us for investments in particular sectors or, generally, to consider a wider variety of investments; |
| ● | there are relatively few barriers to entry impeding new asset management firms, and the successful efforts of new entrants into our various lines of business, including former “star” portfolio managers at large diversified financial institutions as well as such institutions themselves, will continue to result in increased competition; and |
| ● | other industry participants in the asset management business continuously seek to recruit our best and brightest investment professionals away from us. |
These and other factors could reduce our earnings and revenues and adversely affect our business. In addition, if we are forced to compete with other alternative asset managers on the basis of price, we may not be able to maintain our current base management and incentive fee structures. We have historically competed primarily on the performance of our funds, and not on the level of our fees relative to those of our competitors. However, there is a risk that fees in the alternative investment management industry will decline, without regard to the historical performance of a manager, including our managers. Fee reductions on our existing or future funds, without corresponding decreases in our cost structure, would adversely affect our revenues and distributable earnings.
Poor investment performance may decrease assets under management and reduce revenues from and the profitability of our asset management business.
Revenues from our asset management business are primarily derived from asset management fees. Asset management fees are generally comprised of management and incentive fees. Management fees are typically based on assets under management, and incentive fees are earned on a quarterly or annual basis only if the return on our managed accounts exceeds a certain threshold return, or “highwater mark,” for each investor. We will not earn incentive fee income during a particular period, even when a fund had positive returns in that period, if we do not generate cumulative performance that surpasses a highwater mark. If a fund experiences losses, we will not earn incentive fees with regard to investors in that fund until its returns exceed the relevant highwater mark.
15
In addition, investment performance is one of the most important factors in retaining existing investors and competing for new asset management business. Investment performance may be poor as a result of the current or future difficult market or economic conditions, including changes in interest rates or inflation, terrorism or political uncertainty, our investment style, the particular investments that we make, and other factors. Poor investment performance may result in a decline in our revenues and income by causing (i) the net asset value of the assets under our management to decrease, which would result in lower management fees to us, (ii) lower investment returns, resulting in a reduction of incentive fee income to us, and (iii) investor redemptions, which would result in lower fees to us because we would have fewer assets under management.
To the extent our future investment performance is perceived to be poor in either relative or absolute terms, the revenues and profitability of our asset management business will likely be reduced and our ability to grow existing funds and raise new funds in the future will likely be impaired.
The historical returns of our funds may not be indicative of the future results of our funds.
The historical returns of our funds should not be considered indicative of the future results that should be expected from such funds or from any future funds we may raise. Our rates of returns reflect unrealized gains, as of the applicable measurement date, which may never be realized due to changes in market and other conditions not in our control that may adversely affect the ultimate value realized from the investments in a fund. The returns of our funds may have also benefited from investment opportunities and general market conditions that may not repeat themselves, and there can be no assurance that our current or future funds will be able to avail themselves of profitable investment opportunities. Furthermore, the historical and potential future returns of the funds we manage also may not necessarily bear any relationship to potential returns on our common stock.
We are subject to risks in using custodians.
Our asset management subsidiary and its managed funds depend on the services of custodians to settle and report securities transactions. In the event of the insolvency of a custodian, our funds might not be able to recover equivalent assets in whole or in part as they will rank among the custodian’s unsecured creditors in relation to assets which the custodian borrows, lends or otherwise uses. In addition, cash held by our funds with the custodian will not be segregated from the custodian’s own cash, and the funds will therefore rank as unsecured creditors in relation thereto.
We may suffer losses if our reputation is harmed.
Our ability to attract and retain customers and employees may be diminished to the extent our reputation is damaged. If we fail, or are perceived to fail, to address various issues that may give rise to reputational risk, we could harm our business prospects. These issues include, but are not limited to, appropriately dealing with market dynamics, potential conflicts of interest, legal and regulatory requirements, ethical issues, customer privacy, record-keeping, sales and trading practices, and the proper identification of the legal, reputational, credit, liquidity and market risks inherent in our products and services. Failure to appropriately address these issues could give rise to loss of existing or future business, financial loss, and legal or regulatory liability, including complaints, claims and enforcement proceedings against us, which could, in turn, subject us to fines, judgments and other penalties. In addition, our Capital Markets operations depend to a large extent on our relationships with our clients and reputation for integrity and high-caliber professional services to attract and retain clients. As a result, if a client is not satisfied with our services, it may be more damaging in our business than in other businesses.
Our Capital Markets operations are highly dependent on communications, information and other systems and third parties, and any systems failures could significantly disrupt our Capital Markets business.
Our data and transaction processing, custody, financial, accounting and other technology and operating systems are essential to our Capital Markets operations. A system malfunction (due to hardware failure, capacity overload, security incident, data corruption, etc.) or mistake made relating to the processing of transactions could result in financial loss, liability to clients, regulatory intervention, reputational damage and constraints on our ability to grow. We outsource a substantial portion of our critical data processing activities, including trade processing and back office data processing. We also contract with third parties for market data and other services. In the event that any of these service providers fails to adequately perform such services or the relationship between that service provider and us is terminated, we may experience a significant disruption in our operations, including our ability to timely and accurately process transactions or maintain complete and accurate records of those transactions.
16
Adapting or developing our technology systems to meet new regulatory requirements, client needs, expansion and industry demands also is critical for our business. Introduction of new technologies present new challenges on a regular basis. We have an ongoing need to upgrade and improve our various technology systems, including our data and transaction processing, financial, accounting, risk management and trading systems. This need could present operational issues or require significant capital spending. It also may require us to make additional investments in technology systems and may require us to reevaluate the current value and/or expected useful lives of our technology systems, which could negatively impact our results of operations.
Secure processing, storage and transmission of confidential and other information in our internal and outsourced computer systems and networks also is critically important to our business. We take protective measures and endeavor to modify them as circumstances warrant. However, our computer systems and software are subject to unauthorized access, computer viruses or other malicious code, inadvertent, erroneous or intercepted transmission of information (including by e-mail), and other events that have had an information security impact. If one or more of such events occur, this potentially could jeopardize our or our clients’ or counterparties’ confidential and other information processed and stored in, and transmitted through, our computer systems and networks, or otherwise cause interruptions or malfunctions in our, our clients’, our counterparties’ or third parties’ operations. We may be required to expend significant additional resources to modify our protective measures or to investigate and remediate vulnerabilities or other exposures, and we may be subject to litigation and financial losses that are either not insured against or not fully covered through any insurance maintained by us.
A disruption in the infrastructure that supports our business due to fire, natural disaster, health emergency (for example, a disease pandemic), power or communication failure, act of terrorism or war may affect our ability to service and interact with our clients. If we are not able to implement contingency plans effectively, any such disruption could harm our results of operations.
The growth of electronic trading and the introduction of new technology in the markets in which our market-making business operates may adversely affect this business and may increase competition.
The continued growth of electronic trading and the introduction of new technologies is changing our market-making business and presenting new challenges. Securities, futures and options transactions are increasingly occurring electronically, through alternative trading systems. We expect that the trend toward alternative trading systems will continue to accelerate. This acceleration could further increase program trading, increase the speed of transactions and decrease our ability to participate in transactions as principal, which would reduce the profitability of our market-making business. Some of these alternative trading systems compete with our market-making business and with our algorithmic trading platform, and we may experience continued competitive pressures in these and other areas. Significant resources have been invested in the development of our electronic trading systems, which includes our at-the-market business, but there is no assurance that the revenues generated by these systems will yield an adequate return on the investment, particularly given the increased program trading and increased percentage of stocks trading off of the historically manual trading markets.
Pricing and other competitive pressures may impair the revenues of our sales and trading business.
We derive a significant portion of our revenues for our investment banking operations from our sales and trading business. There has been intense price competition and trading volume reduction in this business in recent years. In particular, the ability to execute trades electronically and through alternative trading systems has increased the downward pressure on per share trading commissions and spreads. We expect these trends toward alternative trading systems and downward pricing pressure in the business to continue. We experience competitive pressures in these and other areas in the future as some of our competitors seek to obtain market share by competing on the basis of price or by using their own capital to facilitate client trading activities. In addition, we face pressure from our larger competitors, many of whom are better able to offer a broader range of complementary products and services to clients in order to win their trading business. These larger competitors may also be better able to respond to changes in the research, brokerage and investment banking industries, to compete for skilled professionals, to finance acquisitions, to fund internal growth and to compete for market share generally. As we are committed to maintaining and improving our comprehensive research coverage in our target sectors to support our sales and trading business, we may be required to make substantial investments in our research capabilities to remain competitive. If we are unable to compete effectively in these areas, the revenues of our sales and trading business may decline, and our business, results of operations and financial condition may be harmed.
Some of our large institutional sales and trading clients in terms of brokerage revenues have entered into arrangements with us and other investment banking firms under which they separate payments for research products or services from trading commissions for sales and trading services, and pay for research directly in cash, instead of compensating the research providers through trading commissions (referred to as “soft dollar” practices). In addition, we have entered into certain commission sharing arrangements in which institutional clients execute trades with a limited number of brokers and instruct those brokers to allocate a portion of the commission directly to us or other broker-dealers for research or to an independent research provider. If more of such arrangements are reached between our clients and us, or if similar practices are adopted by more firms in the investment banking industry, we expect that would increase the competitive pressures on trading commissions and spreads and reduce the value our clients place on high quality research. Conversely, if we are unable to make similar arrangements with other investment managers that insist on separating trading commissions from research products, volumes and trading commissions in our sales and trading business also would likely decrease.
17
Larger and more frequent capital commitments in our trading and underwriting businesses increase the potential for significant losses.
Certain financial services firms make larger and more frequent commitments of capital in many of their activities. For example, in order to win business, some investment banks increasingly commit to purchase large blocks of stock from publicly traded issuers or significant stockholders, instead of the more traditional marketed underwriting process in which marketing is typically completed before an investment bank commits to purchase securities for resale. We have participated in this activity and expect to continue to do so and, as a result, we are subject to increased risk. Conversely, if we do not have sufficient regulatory capital to so participate, our business may suffer. Furthermore, we may suffer losses as a result of the positions taken in these transactions even when economic and market conditions are generally favorable for others in the industry.
We may increasingly commit our own capital as part of our trading business to facilitate client sales and trading activities. The number and size of these transactions may adversely affect our results of operations in a given period. We may also incur significant losses from our sales and trading activities due to market fluctuations and volatility in our results of operations. To the extent that we own assets, i.e., have long positions, in any of those markets, a downturn in the value of those assets or in those markets could result in losses. Conversely, to the extent that we have sold assets we do not own, i.e., have short positions, in any of those markets, an upturn in those markets could expose us to potentially large losses as we attempt to cover our short positions by acquiring assets in a rising market.
We have made and may make Principal Investments in relatively high-risk, illiquid assets that often have significantly leveraged capital structures, and we may fail to realize any profits from these activities for a considerable period of time or lose some or all of the principal amount we invest in these activities.
From time to time, we use our capital, including on a leveraged basis, in proprietary investments in both private company and public company securities that may be illiquid and volatile. The equity securities of a privately-held entity in which we make a proprietary investment are likely to be restricted as to resale and are otherwise typically highly illiquid. In the case of fund or similar investments, our investments may be illiquid until such investment vehicles are liquidated. We expect that there will be restrictions on our ability to resell the securities that we acquire for a period of up to one year after we acquire those securities. Thereafter, a public market sale may be subject to volume limitations or dependent upon securing a registration statement for an initial and potentially secondary public offering of the securities. We may make Principal Investments that are significant relative to the overall capitalization of the investee company and resales of significant amounts of these securities might be subject to significant limitations and adversely affect the market and the sales price for the securities in which we invest. In addition, our Principal Investments may involve entities or businesses with capital structures that have significant leverage. The large amount of borrowing in the leveraged capital structure increases the risk of losses due to factors such as rising interest rates, downturns in the economy or deteriorations in the condition of the investment or its industry. In the event of defaults under borrowings, the assets being financed would be at risk of foreclosure, and we could lose our entire investment.
Even if we make an appropriate investment decision based on the intrinsic value of an enterprise, we cannot assure you that general market conditions will not cause the market value of our investments to decline. For example, an increase in interest rates, a general decline in the stock markets, or other market and industry conditions adverse to companies of the type in which we invest and intend to invest could result in a decline in the value of our investments or a total loss of our investment.
In addition, some of these investments are, or may in the future be, in industries or sectors which are unstable, in distress or undergoing some uncertainty. Further, the companies in which we invest may rely on new or developing technologies or novel business models, or concentrate on markets which are or may be disproportionately impacted by pressures in the financial services and/or mortgage and real estate sectors, have not yet developed and which may never develop sufficiently to support successful operations, or their existing business operations may deteriorate or may not expand or perform as projected. Such investments may be subject to rapid changes in value caused by sudden company-specific or industry-wide developments. Contributing capital to these investments is risky, and we may lose some or all of the principal amount of our investments. There are no regularly quoted market prices for a number of the investments that we make. The value of our investments is determined using fair value methodologies described in valuation policies, which may consider, among other things, the nature of the investment, the expected cash flows from the investment, bid or ask prices provided by third parties for the investment and the trading price of recent sales of securities (in the case of publicly-traded securities), restrictions on transfer and other recognized valuation methodologies. The methodologies we use in valuing individual investments are based on estimates and assumptions specific to the particular investments. Therefore, the value of our investments does not necessarily reflect the prices that would actually be obtained by us when such investments are sold. Realizations, if any, at values significantly lower than the values at which investments have been reflected on our balance sheet would result in loses of potential incentive income and Principal Investments.
18
We are exposed to credit risk from a variety of our activities and we may not be able to fully realize the value of the collateral securing certain of our loans.
We are generally exposed to the risk that third parties that owe us money, securities or other assets will fail to meet their obligations to us due to numerous causes, including bankruptcy, lack of liquidity, or operational failure, among others. Additionally, when we guarantee or backstop the obligations of third parties, we are exposed to the risk that our guarantee or backstop may be called by the holder following a default by the primary obligor, which could cause us to incur significant losses, and, when our obligations are secured, expose us to the risk that the holder may seek to foreclose on collateral pledged by us.
We incur credit risk through loans, lines of credit, guarantees and backstop commitments issued to or on behalf of businesses and individuals, and other loans collateralized by a variety of assets, including securities. Our credit risk and credit losses can increase if our loans or investments are concentrated among borrowers or issuers engaged in the same or similar activities, industries, or geographies, or to borrowers or issuers who as a group may be uniquely or disproportionately affected by economic or market conditions. The deterioration of an individually large exposure, for example due to natural disasters, health emergencies or pandemics, acts of terrorism, severe weather events or other adverse economic events, could lead to additional loan loss provisions and/or charges-offs, or credit impairment of our investments, and subsequently have a material impact on our net income and regulatory capital.
The amount and duration of our credit exposures have been increasing over the past year, as have the breadth and size of the entities to which we have credit exposures.
We permit our clients to purchase securities on margin. During periods of steep declines in securities prices, the value of the collateral securing client margin loans may fall below the amount of the purchaser’s indebtedness. If clients are unable to provide additional collateral for these margin loans, we may incur losses on those margin transactions. This may cause us to incur additional expenses defending or pursuing claims or litigation related to counterparty or client defaults.
Although a substantial amount of our loans to counterparties are protected by holding security interests in the assets or equity interests of the borrower, we may not be able to fully realize the value of the collateral securing our loans due to one or more of the following factors:
| ● | Our loans may be unsecured, therefore our liens on the collateral, if any, are subordinated to those of the senior secured debt of the borrower, if any. As a result, we may not be able to control remedies with respect to the collateral. |
| ● | The collateral may not be valuable enough to satisfy all of the obligations under our secured loan, particularly after giving effect to the repayment of secured debt of the borrower that ranks senior to our loan. |
| ● | Bankruptcy laws may limit our ability to realize value from the collateral and may delay the realization process. |
| ● | Our rights in the collateral may be adversely affected by the failure to perfect security interests in the collateral. |
| ● | The need to obtain regulatory and contractual consents could impair or impede how effectively the collateral would be liquidated and could affect the value received. |
| ● | Some or all of the collateral may be illiquid and may have no readily ascertainable market value. The liquidity and value of the collateral could be impaired as a result of changing economic conditions, competition, and other factors, including the availability of suitable buyers. |
We may experience write downs of our investments and other losses related to the valuation of our investments and volatile and illiquid market conditions.
In our proprietary investment activities, our concentrated holdings, illiquidity and market volatility may make it difficult to value certain of our investment securities. Subsequent valuations, in light of factors then prevailing, may result in significant changes in the values of these securities in future periods. In addition, at the time of any sales and settlements of these securities, the price we ultimately realize will depend on the demand and liquidity in the market at that time and may be materially lower than their current fair value. Any of these factors could require us to take write downs in the value of our investment and securities portfolio, which may have an adverse effect on our results of operations in future periods.
Our underwriting and market making activities may place our capital at risk.
We may incur losses and be subject to reputational harm to the extent that, for any reason, we are unable to sell securities we purchased as an underwriter at the anticipated price levels. As an underwriter, we also are subject to heightened standards regarding liability for material misstatements or omissions in prospectuses and other offering documents relating to offerings we underwrite. Further, even though underwriting agreements with issuing companies typically include a right to indemnification in favor of the underwriter for these offerings to cover potential liability from any material misstatements or omissions, indemnification may be unavailable or insufficient in certain circumstances, for example if the issuing company has become insolvent. As a market maker, we may own large positions in specific securities, and these undiversified holdings concentrate the risk of market fluctuations and may result in greater losses than would be the case if our holdings were more diversified.
19
Our businesses may be adversely affected by the disruptions in the credit markets, including reduced access to credit and liquidity and higher costs of obtaining credit.
In the event existing internal and external financial resources do not satisfy our needs, we would have to seek additional outside financing. The availability of outside financing will depend on a variety of factors, such as our financial condition and results of operations, the availability of acceptable collateral, market conditions, the general availability of credit, the volume of trading activities, and the overall availability of credit to the financial services industry.
Widening credit spreads, as well as significant declines in the availability of credit, could adversely affect our ability to borrow on an unsecured basis. Disruptions in the credit markets could make it more difficult and more expensive to obtain funding for our businesses. If our available funding is limited or we are forced to fund our operations at a higher cost, these conditions may require us to curtail our business activities and increase our cost of funding, both of which could reduce our profitability, particularly in our businesses that involve investing and taking principal positions.
Liquidity, or ready access to funds, is essential to financial services firms, including ours. Failures of financial institutions have often been attributable in large part to insufficient liquidity. Liquidity is of particular importance to our sales and trading business, and perceived liquidity issues may affect the willingness of our clients and counterparties to engage in sales and trading transactions with us. Our liquidity could be impaired due to circumstances that we may be unable to control, such as a general market disruption or an operational problem that affects our sales and trading clients, third parties or us. Further, our ability to sell assets may be impaired if other market participants are seeking to sell similar assets at the same time.
Our clients engaging us with respect to mergers and acquisitions often rely on access to the secured and unsecured credit markets to finance their transactions. The lack of available credit and the increased cost of credit could adversely affect the size, volume and timing of our clients’ merger and acquisition transactions-particularly large transactions-and adversely affect our investment banking business and revenues.
We have experienced losses and may not achieve or maintain profitability.
Our profitability in each reporting period is impacted by the number and size of retail liquidation and Capital Markets engagements we perform on a quarterly or annual basis. It is possible that we will experience losses with respect to our current operations as we continue to expand our operations. In addition, we expect that our operating expenses will increase to the extent that we grow our business. We may not be able to generate sufficient revenues to maintain profitability.
20
Because of their significant stock ownership, some of our existing stockholders will be able to exert control over us and our significant corporate decisions.
Our executive officers, directors and their affiliates own or control, in the aggregate, approximately 24.3% of our outstanding common stock as of December 31, 2019. In particular, our Chairman and Co-Chief Executive Officer, Bryant R. Riley, owns or controls, in the aggregate, 4,717,755 shares of our common stock or 17.5% of our outstanding common stock as of December 31, 2019. These stockholders are able to exercise influence over matters requiring stockholder approval, such as the election of directors and the approval of significant corporate transactions, including transactions involving an actual or potential change of control of the company or other transactions that non-controlling stockholders may not deem to be in their best interests. This concentration of ownership may harm the market price of our common stock by, among other things:
| ● | delaying, deferring, or preventing a change in control of our company; |
| ● | impeding a merger, consolidation, takeover, or other business combination involving our company; |
| ● | causing us to enter into transactions or agreements that are not in the best interests of all stockholders; or |
| ● | discouraging a potential acquirer from making a tender offer or otherwise attempting to obtain control of our company. |
We may incur losses as a result of “guarantee” based engagements that we enter into in connection with our Auction and Liquidation solutions business.
In many instances, in order to secure an engagement, we are required to bid for that engagement by guaranteeing to the client a minimum amount that such client will receive from the sale of inventory or assets. Our bid is based on a variety of factors, including: our experience, expertise, perceived value added by engagement, valuation of the inventory or assets and the prices we believe potential buyers would be willing to pay for such inventory or assets. An inaccurate estimate of any of the above or inaccurate valuation of the assets or inventory could result in us submitting a bid that exceeds the realizable proceeds from any engagement. If the liquidation proceeds, net of direct operating expenses, are less than the amount we guaranteed in our bid, we will incur a loss. Therefore, in the event that the proceeds, net of direct operating expenses, from an engagement are less than the bid, the value of the assets or inventory decline in value prior to the disposition or liquidation, or the assets are overvalued for any reason, we may suffer a loss and our financial condition and results of operations could be adversely affected.
Losses due to any auction or liquidation engagement may cause us to become unable to make payments due to our creditors and may cause us to default on our debt obligations.
We have three engagement structures for our Auction and Liquidation services: (i) a “fee” based structure under which we are compensated for our role in an engagement on a commission basis, (ii) purchase on an outright basis (and take title to) the assets or inventory of the client, and (iii) “guarantee” to the client that a certain amount will be realized by the client upon the sale of the assets or inventory based on contractually defined terms in the auction or liquidation contract. We bear the risk of loss under the purchase and guarantee structures of Auction and Liquidation contracts. If the amount realized from the sale or disposition of assets, net of direct operating expenses, does not equal or exceed the purchase price (in purchase transaction), we will recognize a loss on the engagement, or should the amount realized, net of direct operating expenses, not equal or exceed the “guarantee,” we are still required to pay the guaranteed amount to the client.
We could incur losses in connection with outright purchase transactions in which we engage as part of our Auction and Liquidation solutions business.
When we conduct an asset disposition or liquidation on an outright purchase basis, we purchase from the client the assets or inventory to be sold or liquidated and therefore, we hold title to any assets or inventory that we are not able to sell. In other situations, we may acquire assets from our clients if we believe that we can identify a potential buyer and sell the assets at a premium to the price paid. We store these unsold or acquired assets and inventory until they can be sold or, alternatively, transported to the site of a liquidation of comparable assets or inventory that we are conducting. If we are forced to sell these assets for less than we paid, or are required to transport and store assets multiple times, the related expenses could have a material adverse effect on our results of operations.
We depend on financial institutions as primary clients for our Valuation and Appraisal business. Consequently, the loss of any financial institutions as clients may have an adverse impact on our business.
A majority of the revenue from our Valuation and Appraisal business is derived from engagements by financial institutions. As a result, any loss of financial institutions as clients of our valuation and advisory services, whether due to changing preferences in service providers, failures of financial institutions or mergers and consolidations within the finance industry, could significantly reduce the number of existing, repeat and potential clients, thereby adversely affecting our revenues. In addition, any larger financial institutions that result from mergers or consolidations in the financial services industry could have greater leverage in negotiating terms of engagements with us, or could decide to internally perform some or all of the Valuation and Appraisal services which we currently provide to one of the constituent institutions involved in the merger or consolidation or which we could provide in the future. Any of these developments could have a material adverse effect on our Valuation and Appraisal business.
21
We may face liability or harm to our reputation as a result of a claim that we provided an inaccurate appraisal or valuation and our insurance coverage may not be sufficient to cover the liability.
We could face liability in connection with a claim by a client that we provided an inaccurate appraisal or valuation on which the client relied. Any claim of this type, whether with or without merit, could result in costly litigation, which could divert management’s attention and company resources and harm our reputation. Furthermore, if we are found to be liable, we may be required to pay damages. While our appraisals and valuations are typically provided only for the benefit of our clients, if a third party relies on an appraisal or valuation and suffers harm as a result, we may become subject to a legal claim, even if the claim is without merit. We carry insurance for liability resulting from errors or omissions in connection with our appraisals and valuations; however, the coverage may not be sufficient if we are found to be liable in connection with a claim by a client or third party.
We could be forced to mark down the value of certain assets acquired in connection with outright purchase transactions.
In most instances, inventory is reported on the balance sheet at its historical cost; however, according to U.S. Generally Accepted Accounting Principles, inventory whose historical cost exceeds its market value should be valued conservatively, which dictates a lower value should apply. Accordingly, should the replacement cost (due to technological obsolescence or otherwise), or the net realizable value of any inventory we hold be less than the cost paid to acquire such inventory (purchase price), we will be required to “mark down” the value of such inventory held. If the value of any inventory held on our balance sheet is required to be written down, such write down could have a material adverse effect on our financial position and results of operations.
We operate in highly competitive industries. Some of our competitors may have certain competitive advantages, which may cause us to be unable to effectively compete with or gain market share from our competitors.
We face competition with respect to all of our service areas. The level of competition depends on the particular service area and, in the case of our asset and liquidation services, the category of assets being liquidated or appraised. We compete with other companies and investment banks to help clients with their corporate finance and capital needs. In addition, we compete with companies and online services in the bidding for assets and inventory to be liquidated. The demand for online solutions continues to grow and our online competitors include other e-commerce providers, auction websites such as eBay, as well as government agencies and traditional liquidators and auctioneers that have created websites to further enhance their product offerings and more efficiently liquidate assets. We expect the market to become even more competitive as the demand for such services continues to increase and traditional and online liquidators and auctioneers continue to develop online and offline services for disposition, redeployment and remarketing of wholesale surplus and salvage assets. In addition, manufacturers, retailers and government agencies may decide to create their own websites to sell their own surplus assets and inventory and those of third parties.
We also compete with other providers of valuation and advisory services. Competitive pressures within the Valuation and Appraisal services market, including a decrease in the number of engagements and/or a decrease in the fees which can be charged for these services, could affect revenues from our Valuation and Appraisal services as well as our ability to engage new or repeat clients. We believe that given the relatively low barriers to entry in the Valuation and Appraisal services market, this market may become more competitive as the demand for such services increases.
Some of our competitors may be able to devote greater financial resources to marketing and promotional campaigns, secure merchandise from sellers on more favorable terms, adopt more aggressive pricing or inventory availability policies and devote more resources to website and systems development than we are able to do. Any inability on our part to effectively compete could have a material adverse effect on our financial condition, growth potential and results of operations.
We compete with specialized investment banks to provide financial and investment banking services to small and middle-market companies. Middle-market investment banks provide access to capital and strategic advice to small and middle-market companies in our target industries. We compete with those investment banks on the basis of a number of factors, including client relationships, reputation, the abilities of our professionals, transaction execution, innovation, price, market focus and the relative quality of our products and services. We have experienced intense competition over obtaining advisory mandates in recent years, and we may experience pricing pressures in our investment banking business in the future as some of our competitors seek to obtain increased market share by reducing fees. Competition in the middle-market may further intensify if larger Wall Street investment banks expand their focus to this sector of the market. Increased competition could reduce our market share from investment banking services and our ability to generate fees at historical levels.
We also face increased competition due to a trend toward consolidation. In recent years, there has been substantial consolidation and convergence among companies in the financial services industry. This trend was amplified in connection with the unprecedented disruption and volatility in the financial markets during the past several years, and, as a result, a number of financial services companies have merged, been acquired or have fundamentally changed their respective business models. Many of these firms may have the ability to support investment banking, including financial advisory services, with commercial banking, insurance and other financial services in an effort to gain market share, which could result in pricing pressure in our businesses.
22
UOL competes with numerous providers of broadband, mobile broadband and DSL services, as well as other dial-up Internet access providers, many of whom are large and have significantly more financial and marketing resources. The principal competitors for UOL’s mobile broadband and DSL services include, among others, local exchange carriers, wireless and satellite service providers, and cable service providers.
magicJack competes with the traditional telephone service providers, which provide telephone service using the public switched telephone network. Certain of these traditional providers have also added, or are planning to add, broadband telephone services to their existing telephone and broadband offerings. We also face, or expect to face, competition from cable companies, which offer broadband telephone services to their existing cable television and broadband offerings. Further, wireless providers offer services that some customers may prefer over wireline-based service. In the future, as wireless companies offer more minutes at lower prices, their services may become more attractive to customers as a replacement for broadband or wireline-based phone service. We face competition on magicJack device sales from manufacturers of smart phones, tablets and other handheld wireless devices. Also, we compete against established alternative voice communication providers, and may face competition from other large, well-capitalized Internet companies. In addition, we compete with independent broadband telephone service providers.
Our brand investment portfolio competes with companies that own other brands and trademarks, as these companies could enter into similar licensing arrangements with retailers and wholesalers in the United States and internationally. These arrangements could be with our existing retail and wholesale partners, thereby competing with us for consumer attention and limited floor or rack space in the same stores in which our branded products are sold, and vying with us for the time and resources of the retailers and wholesale licensees that manufacture and distribute our products. These companies may be able to respond more quickly to changes in retailer, wholesaler and consumer preferences and devote greater resources to brand acquisition, development and marketing.
If we are unable to attract and retain qualified personnel, we may not be able to compete successfully in our industry.
Our future success depends to a significant degree upon the continued contributions of senior management and the ability to attract and retain other highly qualified management personnel. We face competition for management from other companies and organizations; therefore, we may not be able to retain our existing personnel or fill new positions or vacancies created by expansion or turnover at existing compensation levels. Although we have entered into employment agreements with key members of the senior management team, there can be no assurances such key individuals will remain with us. The loss of any of our executive officers or other key management personnel would disrupt our operations and divert the time and attention of our remaining officers and management personnel which could have an adverse effect on our results of operations and potential for growth.
We also face competition for highly skilled employees with experience in our industry, which requires a unique knowledge base. We may be unable to recruit or retain other existing technical, sales and client support personnel that are critical to our ability to execute our business plan.
We frequently use borrowings under credit facilities in connection with our guaranty engagements, in which we guarantee a minimum recovery to the client, and outright purchase transactions.
In engagements where we operate on a guaranty or purchase basis, we are typically required to make an upfront payment to the client. If the upfront payment is less than 100% of the guarantee or the purchase price in a “purchase” transaction, we may be required to make successive cash payments until the guarantee is met or we may issue a letter of credit in favor of the client. Depending on the size and structure of the engagement, we may borrow under our credit facilities and may be required to issue a letter of credit in favor of the client for these additional amounts. If we lose any availability under our credit facilities, are unable to borrow under credit facilities and/or issue letters of credit in favor of clients, or borrow under credit facilities and/or issue letters of credit on commercially reasonable terms, we may be unable to pursue large liquidation and disposition engagements, engage in multiple concurrent engagements, pursue new engagements or expand our operations. We are required to obtain approval from the lenders under our existing credit facilities prior to making any borrowings thereunder in connection with a particular engagement. Any inability to borrow under our credit facilities, or enter into one or more other credit facilities on commercially reasonable terms may have a material adverse effect on our financial condition, results of operations and growth.
Defaults under our credit agreements could have an adverse impact on our ability to finance potential engagements.
The terms of our credit agreements contain a number of events of default. Should we default under any of our credit agreements in the future, lenders may take any or all remedial actions set forth in such credit agreement, including, but not limited to, accelerating payment and/or charging us a default rate of interest on all outstanding amounts, refusing to make any further advances or issue letters of credit, or terminating the line of credit. As a result of our reliance on lines of credit and letters of credit, any default under a credit agreement, or remedial actions pursued by lenders following any default under a credit agreement, may require us to immediately repay all outstanding amounts, which may preclude us from pursuing new liquidation and disposition engagements and may increase our cost of capital, each of which may have a material adverse effect on our financial condition and results of operations.
If we cannot meet our future capital requirements, we may be unable to develop and enhance our services, take advantage of business opportunities and respond to competitive pressures.
We may need to raise additional funds in the future to grow our business internally, invest in new businesses, expand through acquisitions, enhance our current services or respond to changes in our target markets. If we raise additional capital through the sale of equity or equity derivative securities, the issuance of these securities could result in dilution to our existing stockholders. If additional funds are raised through the issuance of debt securities, the terms of that debt could impose additional restrictions on our operations or harm our financial condition. Additional financing may be unavailable on acceptable terms.
23
We are subject to net capital and other regulatory capital requirements; failure to comply with these rules would significantly harm our business.
B. Riley FBR, our broker-dealer subsidiary, is subject to the net capital requirements of the SEC, FINRA, and various self-regulatory organizations of which it is a member. These requirements typically specify the minimum level of net capital a broker-dealer must maintain and also mandate that a significant part of its assets be kept in relatively liquid form. Failure to maintain the required net capital may subject a firm to limitation of its activities, including suspension or revocation of its registration by the SEC and suspension or expulsion by FINRA and other regulatory bodies, and ultimately may require its liquidation. Failure to comply with the net capital rules could have material and adverse consequences, such as:
| ● | limiting our operations that require intensive use of capital, such as underwriting or trading activities; or |
| ● | restricting us from withdrawing capital from our subsidiaries, when our broker-dealer subsidiary has more than the minimum amount of required capital. This, in turn, could limit our ability to implement our business and growth strategies, pay interest on and repay the principal of our debt and/or repurchase our shares. |
In addition, a change in the net capital rules or the imposition of new rules affecting the scope, coverage, calculation, or amount of net capital requirements, or a significant operating loss or any large charge against net capital, could have similar adverse effects.
Furthermore, B. Riley FBR is subject to laws that authorize regulatory bodies to block or reduce the flow of funds from it to B. Riley Financial, Inc. As a holding company, B. Riley Financial, Inc. depends on dividends, distributions and other payments from its subsidiaries to fund dividend payments, if any, and to fund all payments on its obligations, including debt obligations. As a result, regulatory actions could impede access to funds that B. Riley Financial, Inc. needs to make payments on obligations, including debt obligations, or dividend payments. In addition, because B. Riley Financial, Inc. holds equity interests in the firm’s subsidiaries, its rights as an equity holder to the assets of these subsidiaries may not materialize, if at all, until the claims of the creditors of these subsidiaries are first satisfied.
We may incur losses as a result of ineffective risk management processes and strategies.
We seek to monitor and control our risk exposure through operational and compliance reporting systems, internal controls, management review processes and other mechanisms. Our investing and trading processes seek to balance our ability to profit from investment and trading positions with our exposure to potential losses. While we employ limits and other risk mitigation techniques, those techniques and the judgments that accompany their application cannot anticipate economic and financial outcomes or the specifics and timing of such outcomes. Thus, we may, in the course of our investment and trading activities, incur losses, which may be significant.
In addition, we are investing our own capital in our funds and funds of funds as well as principal investing activities, and limitations on our ability to withdraw some or all of our investments in these funds or liquidate our investment positions, whether for legal, reputational, illiquidity or other reasons, may make it more difficult for us to control the risk exposures relating to these investments.
Our risk management policies and procedures may leave us exposed to unidentified or unanticipated risks.
Our risk management strategies and techniques may not be fully effective in mitigating our risk exposure in all market environments or against all types of risk. We seek to manage, monitor and control our operational, legal and regulatory risk through operational and compliance reporting systems, internal controls, management review processes and other mechanisms; however, there can be no assurance that our procedures will be fully effective. Further, our risk management methods may not effectively predict future risk exposures, which could be significantly greater than the historical measures indicate. In addition, some of our risk management methods are based on an evaluation of information regarding markets, clients and other matters that are based on assumptions that may no longer be accurate. A failure to adequately manage our growth, or to effectively manage our risk, could materially and adversely affect our business and financial condition.
We are exposed to the risk that third parties that owe us money, securities or other assets will not perform their obligations. These parties may default on their obligations to us due to bankruptcy, lack of liquidity, operational failure, and breach of contract or other reasons. We are also subject to the risk that our rights against third parties may not be enforceable in all circumstances. As an introducing broker, we could be held responsible for the defaults or misconduct of our customers. These may present credit concerns, and default risks may arise from events or circumstances that are difficult to detect, foresee or reasonably guard against. In addition, concerns about, or a default by, one institution could lead to significant liquidity problems, losses or defaults by other institutions, which in turn could adversely affect us. If any of the variety of instruments, processes and strategies we utilize to manage our exposure to various types of risk are not effective, we may incur losses.
Our common stock price may fluctuate substantially, and your investment could suffer a decline in value.
The market price of our common stock may be volatile and could fluctuate substantially due to many factors, including, among other things:
| ● | actual or anticipated fluctuations in our results of operations; |
24
| ● | announcements of significant contracts and transactions by us or our competitors; |
| ● | sale of common stock or other securities in the future; |
| ● | the trading volume of our common stock; |
| ● | changes in our pricing policies or the pricing policies of our competitors; and |
| ● | general economic conditions |
In addition, the stock market in general has experienced extreme price and volume fluctuations that have often been unrelated or disproportionate to the operating performance of those companies. These broad market factors may materially harm the market price of our common stock, regardless of our operating performance.
There is a limited market for our common shares and the trading price of our common shares is subject to volatility.
Our common shares began trading on the over-the-counter bulletin board in August 2009, and we obtained approval to list and trade our shares on the NASDAQ Capital Market on July 16, 2015. On November 16, 2016, we began trading our shares on the NASDAQ Global Market. Trading of our common stock has in the past been highly volatile with low trading volume and an active trading market for shares of our common stock may not develop. In such case, selling shares of our common stock may be difficult because the limited trading market for our shares could result in lower prices and larger spreads in the bid and ask prices of our shares, as well as lower trading volume. Further, the market price of shares of our common stock could continue to fluctuate substantially. Additionally, if we are not able to maintain our listing on NASDAQ, then our common stock will again be quoted for trading on an over-the-counter quotation system and may be subject to more significant fluctuations in stock price and trading volume and large bid and ask price spreads.
Our amended and restated certificate of incorporation authorizes our board of directors to issue new series of preferred stock that may have the effect of delaying or preventing a change of control, which could adversely affect the value of your shares.
Our amended and restated certificate of incorporation provides that our board of directors will be authorized to issue from time to time, without further stockholder approval, up to 1,000,000 shares of preferred stock in one or more series and to fix or alter the designations, preferences, rights and any qualifications, limitations or restrictions of the shares of each series, including the dividend rights, dividend rates, conversion rights, voting rights, rights of redemption, including sinking fund provisions, redemption price or prices, liquidation preferences and the number of shares constituting any series or designations of any series. Such shares of preferred stock could have preferences over our common stock with respect to dividends and liquidation rights. We may issue additional preferred stock in ways which may delay, defer or prevent a change of control of our company without further action by our stockholders. Such shares of preferred stock may be issued with voting rights that may adversely affect the voting power of the holders of our common stock by increasing the number of outstanding shares having voting rights, and by the creation of class or series voting rights.
Anti-takeover provisions under our charter documents and Delaware law could delay or prevent a change of control and could also limit the market price of our stock.
Our amended and restated certificate of incorporation and our bylaws, as amended, contain provisions that could delay or prevent a change of control of our company or changes in our board of directors that our stockholders might consider favorable. We are also governed by the provisions of Section 203 of the Delaware General Corporate Law, which may prohibit certain business combinations with stockholders owning 15% or more of our outstanding voting stock. The foregoing and other provisions in our amended and restated certificate of incorporation, our bylaws, as amended, and Delaware law could make it more difficult for stockholders or potential acquirers to obtain control of our board of directors or initiate actions that are opposed by the then-current board of directors, including delaying or impeding a merger, tender offer, or proxy contest or other change of control transaction involving our company. Any delay or prevention of a change of control transaction or changes in our board of directors could prevent the consummation of a transaction in which our stockholders could receive a substantial premium over the then current market price for their shares.
Our ability to use net loss carryovers to reduce our taxable income may be limited.
As a result of the common stock offering that was completed on June 5, 2014, the Company had a more than 50% ownership shift in accordance with Section 382 of the Internal Revenue Code of 1986, as amended (the “Code”). Accordingly, the Company may be limited to the amount of net operating loss that may be utilized in future taxable years depending on the Company’s actual taxable income. As a result of the acquisition of UOL on July 1, 2016, the historical net operating losses of UOL are limited to offset income we generate post acquisition. As of December 31, 2019, the Company believes that the net operating loss that existed as of the more than 50% ownership shift will be utilized in future tax periods before the loss carryforwards expire and it is more-likely-than-not that future taxable earnings will be sufficient to realize its deferred tax assets and has not provided an allowance. However, to the extent that the Company is unable to utilize such net operating loss, it may have a material adverse effect on our financial condition and results of operations.
25
The tax benefits, grants and other incentives available to us require us to continue to meet various conditions and may be terminated, repaid or reduced in the future, which could increase our costs and taxes.
The Israeli government currently provides major tax and capital investment incentives to domestic companies, as well as grant and loan programs relating to research and development and marketing and export activities. In recent years, the Israeli Government has reduced the benefits available under these programs and the Israeli Governmental authorities have indicated that the government may in the future further reduce, seek repayment or eliminate the benefits of those programs. magicJack currently takes advantage of these programs. There is no assurance that we will continue to meet the conditions of such benefits and programs or that such benefits and programs would continue to be available to us in the future. If we fail to meet the conditions of such benefits and programs or if they are terminated or further reduced, it could have an adverse effect on our business, operating results and financial condition.
Changes in tax laws or regulations, or to interpretations of existing tax laws or regulations, to which we are subject could adversely affect our financial condition and cash flows.
We are subject to taxation in the United States and in some foreign jurisdictions. Our financial condition and cash flows are impacted by tax policy implemented at each of the federal, state, local and international levels. We cannot predict whether any changes to tax laws or regulations, or to interpretations of existing tax laws or regulations, will be implemented in the future or whether any such changes would have a material adverse effect on our financial condition and cash flows. However, future changes to tax laws or regulations, or to interpretations of existing tax laws or regulations, could increase our tax burden or otherwise adversely affect our financial condition and cash flows.
Financial services firms have been subject to increased scrutiny over the last several years, increasing the risk of financial liability and reputational harm resulting from adverse regulatory actions.
Firms in the financial services industry have been operating in a difficult regulatory environment which we expect will become even more stringent in light of recent well-publicized failures of regulators to detect and prevent fraud. The industry has experienced increased scrutiny from a variety of regulators, including the SEC, the NYSE, FINRA and state attorneys general. Penalties and fines sought by regulatory authorities have increased substantially over the last several years. This regulatory and enforcement environment has created uncertainty with respect to a number of transactions that had historically been entered into by financial services firms and that were generally believed to be permissible and appropriate. We may be adversely affected by changes in the interpretation or enforcement of existing laws and rules by these governmental authorities and self-regulatory organizations. Each of the regulatory bodies with jurisdiction over us has regulatory powers dealing with many aspects of financial services, including, but not limited to, the authority to fine us and to grant, cancel, restrict or otherwise impose conditions on the right to carry on particular businesses. For example, a failure to comply with the obligations imposed by the Exchange Act on broker-dealers and the Investment Advisers Act of 1940 on investment advisers, including record-keeping, advertising and operating requirements, disclosure obligations and prohibitions on fraudulent activities, or by the Investment Company Act of 1940, could result in investigations, sanctions and reputational damage. We also may be adversely affected as a result of new or revised legislation or regulations imposed by the SEC, other U.S. or foreign governmental regulatory authorities or FINRA or other self-regulatory organizations that supervise the financial markets. Substantial legal liability or significant regulatory action against us could have adverse financial effects on us or cause reputational harm to us, which could harm our business prospects.
In addition, financial services firms are subject to numerous conflicts of interests or perceived conflicts. The SEC and other federal and state regulators have increased their scrutiny of potential conflicts of interest. We have adopted various policies, controls and procedures to address or limit actual or perceived conflicts and regularly review and update our policies, controls and procedures. However, appropriately addressing conflicts of interest is complex and difficult and our reputation could be damaged if we fail, or appear to fail, to appropriately address conflicts of interest. Our policies and procedures to address or limit actual or perceived conflicts may also result in increased costs and additional operational personnel. Failure to adhere to these policies and procedures may result in regulatory sanctions or litigation against us. For example, the research operations of investment banks have been and remain the subject of heightened regulatory scrutiny which has led to increased restrictions on the interaction between equity research analysts and investment banking professionals at securities firms. Several securities firms in the U.S. reached a global settlement in 2003 and 2004 with certain federal and state securities regulators and self-regulatory organizations to resolve investigations into the alleged conflicts of interest of research analysts, which resulted in rules that have imposed additional costs and limitations on the conduct of our business.
26
Asset management businesses have experienced a number of highly publicized regulatory inquiries which have resulted in increased scrutiny within the industry and new rules and regulations for mutual funds, investment advisors and broker-dealers. Our subsidiary, B. Riley Capital Management, LLC, is registered as an investment advisor with the SEC and regulatory scrutiny and rulemaking initiatives may result in an increase in operational and compliance costs or the assessment of significant fines or penalties against our asset management business, and may otherwise limit our ability to engage in certain activities. In addition, the SEC staff has conducted studies with respect to soft dollar practices in the brokerage and asset management industries and proposed interpretive guidance regarding the scope of permitted brokerage and research services in connection with soft dollar practices. The SEC staff has indicated that it is considering additional rulemaking in this and other areas, and we cannot predict the effect that additional rulemaking may have on our asset management or brokerage business or whether it will be adverse to us. In addition, Congress is currently considering imposing new requirements on entities that securitize assets, which could affect our credit activities. It is impossible to determine the extent of the impact of any new laws, regulations or initiatives that may be proposed, or whether any of the proposals will become law. Compliance with any new laws or regulations could make compliance more difficult and expensive and affect the manner in which we conduct business.
Financial reforms and related regulations may negatively affect our business activities, financial position and profitability.
The Dodd-Frank Wall Street Reform and Consumer Protection Act (the “Dodd-Frank Act”) instituted a wide range of reforms that have impacted and will continue to impact financial services firms and continues to require significant rule-making. In addition, the legislation mandates multiple studies, which could result in additional legislative or regulatory action. The legislation and regulation of financial institutions, both domestically and internationally, include calls to increase capital and liquidity requirements; limit the size and types of the activities permitted; and increase taxes on some institutions. FINRA’s oversight over broker-dealers and investment advisors may be expanded, and new regulations on having investment banking and securities analyst functions in the same firm may be created. Certain of the provisions of the Dodd-Frank Act remain subject to further rule making procedures and studies. As a result, we cannot assess the full impact of all of these legislative and regulatory changes on our business at the present time. However, these legislative and regulatory changes could affect our revenue, limit our ability to pursue business opportunities, impact the value of assets that we hold, require us to change certain of our business practices, impose additional costs on us, or otherwise adversely affect our businesses. If we do not comply with current or future legislation and regulations that apply to our operations, we may be subject to fines, penalties or material restrictions on our businesses in the jurisdiction where the violation occurred. Accordingly, such legislation or regulation could have an adverse effect on our business, results of operations, cash flows or financial condition.
Our failure to deal appropriately with conflicts of interest could damage our reputation and adversely affect our business.
As we have expanded the number and scope of our businesses, we increasingly confront potential conflicts of interest relating to our and our funds’ and clients’ investment and other activities. Certain of our funds have overlapping investment objectives, including funds which have different fee structures, and potential conflicts may arise with respect to our decisions regarding how to allocate investment opportunities among ourselves and those funds. For example, a decision to acquire material non-public information about a company while pursuing an investment opportunity for a particular fund gives rise to a potential conflict of interest when it results in our having to restrict the ability of the Company or other funds to take any action.
In addition, there may be conflicts of interest regarding investment decisions for funds in which our officers, directors and employees, who have made and may continue to make significant personal investments in a variety of funds, are personally invested. Similarly, conflicts of interest may exist or develop regarding decisions about the allocation of specific investment opportunities between the Company and the funds.
We also have potential conflicts of interest with our investment banking and institutional clients including situations where our services to a particular client or our own proprietary or fund investments or interests conflict or are perceived to conflict with a client. It is possible that potential or perceived conflicts could give rise to investor or client dissatisfaction or litigation or regulatory enforcement actions. Appropriately dealing with conflicts of interest is complex and difficult and our reputation could be damaged if we fail, or appear to fail, to deal appropriately with one or more potential or actual conflicts of interest. Regulatory scrutiny of, or litigation in connection with, conflicts of interest would have a material adverse effect on our reputation, which would materially adversely affect our business in a number of ways, including as a result of redemptions by our investors from our hedge funds, an inability to raise additional funds and a reluctance of counterparties to do business with us.
Our exposure to legal liability is significant, and could lead to substantial damages.
We face significant legal risks in our businesses. These risks include potential liability under securities laws and regulations in connection with our Capital Markets, asset management and other businesses. The volume and amount of damages claimed in litigation, arbitrations, regulatory enforcement actions and other adversarial proceedings against financial services firms have increased in recent years. We also are subject to claims from disputes with our employees and our former employees under various circumstances. Risks associated with legal liability often are difficult to assess or quantify and their existence and magnitude can remain unknown for significant periods of time, making the amount of legal reserves related to these legal liabilities difficult to determine and subject to future revision. Legal or regulatory matters involving our directors, officers or employees in their individual capacities also may create exposure for us because we may be obligated or may choose to indemnify the affected individuals against liabilities and expenses they incur in connection with such matters to the extent permitted under applicable law. In addition, like other financial services companies, we may face the possibility of employee fraud or misconduct. The precautions we take to prevent and detect this activity may not be effective in all cases and there can be no assurance that we will be able to deter or prevent fraud or misconduct. Exposures from and expenses incurred related to any of the foregoing actions or proceedings could have a negative impact on our results of operations and financial condition. In addition, future results of operations could be adversely affected if reserves relating to these legal liabilities are required to be increased or legal proceedings are resolved in excess of established reserves.
27
Misconduct by our employees or by the employees of our business partners could harm us and is difficult to detect and prevent.
There have been a number of highly publicized cases involving fraud or other misconduct by employees in the financial services industry in recent years, and we run the risk that employee misconduct could occur at our firm. For example, misconduct could involve the improper use or disclosure of confidential information, which could result in regulatory sanctions and serious reputational or financial harm. It is not always possible to deter misconduct and the precautions we take to detect and prevent this activity may not be effective in all cases. Our ability to detect and prevent misconduct by entities with which we do business may be even more limited. We may suffer reputational harm for any misconduct by our employees or those entities with which we do business.
Our failure to maintain effective internal control over financial reporting in accordance with Section 404 of the Sarbanes-Oxley Act could have a material adverse effect on our financial condition, results of operations and business and the price of our common stock and other securities.
The Sarbanes-Oxley Act and the related rules require our management to conduct an annual assessment of the effectiveness of our internal control over financial reporting and require a report by our independent registered public accounting firm addressing our internal control over financial reporting. To comply with Section 404 of the Sarbanes-Oxley Act, we are required to document formal policies, processes and practices related to financial reporting that are necessary to comply with Section 404. Such policies, processes and practices are important to ensure the identification of key financial reporting risks, assessment of their potential impact and linkage of those risks to specific areas and activities within our organization.
If we fail for any reason to comply with the requirements of Section 404 in a timely manner, our independent registered public accounting firm may, at that time, issue an adverse report regarding the effectiveness of our internal control over financial reporting. Matters impacting our internal controls may cause us to be unable to report our financial information on a timely basis and thereby subject us to adverse regulatory consequences, including sanctions by the SEC or violations of applicable stock exchange listing rules. There could also be a negative reaction in the financial markets due to a loss of investor confidence in us and the reliability of our financial statements. Any such event could adversely affect our financial condition, results of operations and business, and result in a decline in the price of our common stock and other securities.
We may not pay dividends regularly or at all in the future.
From time to time, we may decide to pay dividends which will be dependent upon our financial condition and results of operations. Our Board of Directors may reduce or discontinue dividends at any time for any reason it deems relevant and there can be no assurances that we will continue to generate sufficient cash to pay dividends, or that we will continue to pay dividends with the cash that we do generate. The determination regarding the payment of dividends is subject to the discretion of our Board of Directors, and there can be no assurances that we will continue to generate sufficient cash to pay dividends, or that we will pay dividends in future periods.
Security breaches and other disruptions could compromise our information and expose us to liability, which would cause our business and reputation to suffer.
In the ordinary course of our business, we collect and store sensitive data, including intellectual property, our proprietary business information and that of our customers, clients and business partners, and personally identifiable information of our employees, in our servers and on our networks. The secure processing, maintenance and transmission of this information is critical to our operations and business strategy. Despite our security measures, our information technology and infrastructure may be vulnerable to attacks by hackers or breached due to employee error, malfeasance or other disruptions. Any such breach could compromise our networks and the information stored there could be accessed, publicly disclosed, lost or stolen. Any such access, disclosure or other loss of information could result in legal claims or proceedings, liability under laws that protect the privacy of personal information, and regulatory penalties. In addition, such a breach could disrupt our operations and the services we provide to our clients, damage our reputation, and cause a loss of confidence in our services, which could adversely affect our business and our financial condition.
Significant disruptions of information technology systems, breaches of data security, or unauthorized disclosures of sensitive data or personally identifiable information could adversely affect our business, and could subject us to liability or reputational damage.
Our business is increasingly dependent on critical, complex, and interdependent information technology (“IT”) systems, including Internet-based systems, some of which are managed or hosted by third parties, to support business processes as well as internal and external communications. The size and complexity of our IT systems make us vulnerable to, and we have experienced, IT system breakdowns, malicious intrusion, and computer viruses, which may result in the impairment of our ability to operate our business effectively.
In addition, our systems and the systems of our third-party providers and collaborators are potentially vulnerable to data security breaches which may expose sensitive data to unauthorized persons or to the public. Such data security breaches could lead to the loss of confidential information, trade secrets or other intellectual property, or could lead to the public exposure of personal information (including personally identifiable information) of our employees, customers, business partners, and others. In addition, the increased use of social media by our employees and contractors could result in inadvertent disclosure of sensitive data or personal information, including but not limited to, confidential information, trade secrets and other intellectual property.
28
Any such disruption or security breach, as well as any action by us or our employees or contractors that might be inconsistent with the rapidly evolving data privacy and security laws and regulations applicable within the United States and elsewhere where we conduct business, could result in enforcement actions by U.S. states, the U.S. Federal government or foreign governments, liability or sanctions under data privacy laws that protect personally identifiable information, regulatory penalties, other legal proceedings such as but not limited to private litigation, the incurrence of significant remediation costs, disruptions to our development programs, business operations and collaborations, diversion of management efforts and damage to our reputation, which could harm our business and operations. Because of the rapidly moving nature of technology and the increasing sophistication of cybersecurity threats, our measures to prevent, respond to and minimize such risks may be unsuccessful.
In addition, the European Parliament and the Council of the European Union adopted a comprehensive general data privacy regulation (“GDPR”) in 2016 that took effect in May 2018 and governs the collection and use of personal data in the European Union. The GDPR, which is wide-ranging in scope, will impose several requirements relating to the consent of the individuals to whom the personal data relates, the information provided to the individuals, the security and confidentiality of the personal data, data breach notification and the use of third party processors in connection with the processing of the personal data. The GDPR also imposes strict rules on the transfer of personal data out of the European Union to the United States, enhances enforcement authority and imposes large penalties for noncompliance, including the potential for fines of up to €20 million or 4% of the annual global revenues of the infringer, whichever is greater. In addition, the California Consumer Privacy Act effective on January 1, 2020 and applies to for-profit businesses that conduct business in California and meet certain revenue or data collection thresholds. The CCPA will give consumers the right to request disclosure of information collected about them, and whether that information has been sold or shared with others, the right to request deletion of personal information (subject to certain exceptions), the right to opt out of the sale of the consumer’s personal information, and the right not to be discriminated against for exercising these rights. In October 2019, the California Attorney General adopted regulations to implement the CCPA. In addition, similar laws have and may be adopted by other states where the Company does business. The impact of the CCPA and other state privacy laws on the Company’s business is yet to be determined.
We may enter into new lines of business, make strategic investments or acquisitions or enter into joint ventures, each of which may result in additional risks and uncertainties for our business.
We may enter into new lines of business, make future strategic investments or acquisitions and enter into joint ventures. As we have in the past, and subject to market conditions, we may grow our business by increasing assets under management in existing investment strategies, pursue new investment strategies, which may be similar or complementary to our existing strategies or be wholly new initiatives, or enter into strategic relationships, or joint ventures. In addition, opportunities may arise to acquire or invest in other businesses that are related or unrelated to our current businesses.
To the extent we make strategic investments or acquisitions, enter into strategic relationships or joint ventures or enter into new lines of business, we will face numerous risks and uncertainties, including risks associated with the required investment of capital and other resources and with combining or integrating operational and management systems and controls and managing potential conflicts. Entry into certain lines of business may subject us to new laws and regulations with which we are not familiar, or from which we are currently exempt, and may lead to increased litigation and regulatory risk. If a new business generates insufficient revenues, or produces investment losses, or if we are unable to efficiently manage our expanded operations, our results of operations will be adversely affected, and our reputation and business may be harmed. In the case of joint ventures, we are subject to additional risks and uncertainties in that we may be dependent upon, and subject to liability, losses or reputational damage relating to, systems, controls and personnel that are not under our control.
UOL competes against large companies, many of whom have significantly more financial and marketing resources, and our business will suffer if we are unable to compete successfully.
UOL competes with numerous providers of broadband, mobile broadband and DSL services, as well as other dial-up Internet access providers, many of whom are large and have significantly more financial and marketing resources. The principal competitors for UOL’s mobile broadband and DSL services include, among others, local exchange carriers, wireless and satellite service providers, and cable service providers. These competitors include established providers such as AT&T, Verizon, Sprint, and T-Mobile. UOL’s principal dial-up Internet access competitors include established online service and content providers, such as AOL and MSN, and independent national Internet service providers, such as EarthLink and its PeoplePC subsidiary. Dial-up Internet access services do not compete favorably with broadband services with respect to connection speed and do not have a significant, if any, price advantage over certain broadband services. In addition, there are a number of mobile virtual network operators, some of which focus on pricing as their main selling point. Certain portions of the U.S., primarily rural areas, currently have limited or no access to broadband services. However, the U.S. government has indicated its intention to facilitate the provision of broadband services to such areas. Such expansion of the availability of broadband services will increase the competition for Internet access subscribers in such areas and will likely adversely affect the UOL business. In addition to competition from broadband, mobile broadband, and DSL providers, competition among dial-up Internet access service providers is intense and neither UOL’s pricing nor the features of UOL’s services provides us with a significant competitive advantage, if any, over certain of UOL’s dial-up Internet access competitors. We expect that competition, particularly with respect to price, for broadband, mobile broadband, and DSL services, as well as dial-up Internet access services, will continue and may materially and adversely impact our business, financial condition, results of operations, and cash flows.
29
Dial-up and DSL pay accounts may decline faster than expected and adversely impact our business.
A significant portion of UOL’s revenues and profits come from dial-up Internet and DSL access services and related services and advertising revenues. UOL’s dial-up and DSL Internet access pay accounts and revenues have been declining and are expected to continue to decline due to the continued maturation of the market for dial-up and DSL Internet access, competitive pressures in the industry and limited sales efforts. Consumers continue to migrate to broadband access, primarily due to the faster connection and download speeds provided by broadband access. Advanced applications such as online gaming, music downloads and videos require greater bandwidth for optimal performance, which adds to the demand for broadband access. The pricing for basic broadband services has been declining as well, making it a more viable option for consumers. In addition, the popularity of accessing the Internet through tablets and mobile devices has been growing and may accelerate the migration of consumers away from dial-up Internet access. The number of dial-up Internet access pay accounts has been adversely impacted by both a decrease in the number of new pay accounts signing up for UOL’s services, as well as the impact of subscribers canceling their accounts, which we refer to as “churn.” Churn has increased from time to time and may increase in the future. If we experience a higher than expected level of churn, it will make it more difficult for us to increase or maintain the number of pay accounts, which could adversely affect our business, financial condition, results of operations, and cash flows.
We expect UOL’s dial-up and DSL Internet access pay accounts to continue to decline. As a result, related services revenues and the profitability of this segment may decline. The rate of decline in these revenues may continue to accelerate.
We may not be able to consistently make a high level of expense reductions in the future. Continued declines in revenues relating to the UOL business, particularly if such declines accelerate, will materially and adversely impact the profitability of this business.
Failure to maintain or grow advertising revenues from UOL, including as a result of failing to increase or maintain the number of subscribers for UOL’s services, could have a negative impact on advertising profitability.
Advertising revenues are a key component of revenues and profitability from UOL. UOL’s services currently generate advertising revenues from search placements, display advertisements and online market research associated with Internet access and email services. Factors that have caused, or may cause in the future, UOL’s advertising revenues to fluctuate include, without limitation, changes in the number of visitors to UOL’s websites, active accounts or consumers purchasing our services and products, the effect of, changes to, or terminations of key advertising relationships, changes to UOL’s websites and advertising inventory, changes in applicable laws, regulations or business practices, including those related to behavioral or targeted advertising, user privacy, and taxation, changes in business models, changes in the online advertising market, changes in the economy, advertisers’ budgeting and buying patterns, competition, and changes in usage of UOL’s services. Decreases in UOL’s advertising revenues are likely to adversely impact our profitability. Further, our successful operation and management of UOL, including the ability to generate advertising revenues for UOL’s services, will depend in part upon our ability to increase or maintain the number of subscribers for UOL’s services. A decline in the number of subscribers using UOL’s services could result in decreased advertising revenues, and decreases in advertising revenues would adversely impact our profitability. The failure to increase or maintain the number of subscribers for UOL’s services could have a material adverse effect on advertising revenues and our profitability.
Interruption or failure of the network, information systems or other technologies essential to the UOL business could impair our ability to provide services relating to the UOL business, which could damage our reputation and harm our operating results.
Our successful operation of the UOL business depends on our ability to provide reliable service. Many of UOL’s products are supported by data centers. UOL’s network, data centers, central offices and those of UOL’s third-party service providers are vulnerable to damage or interruption from fires, earthquakes, hurricanes, tornados, floods and other natural disasters, terrorist attacks, power loss, capacity limitations, telecommunications failures, software and hardware defects or malfunctions, break ins, sabotage and vandalism, human error and other disruptions that are beyond our control. Some of the systems serving the UOL business are not fully redundant, and our disaster recovery or business continuity planning may not be adequate. The UOL business could also experience interruptions due to cable damage, theft of equipment, power outages, inclement weather and service failures of third-party service providers. The occurrence of any disruption or system failure or other significant disruption to business continuity may result in a loss of business, increase expenses, damage to reputation for providing reliable service, subject us to additional regulatory scrutiny or expose us to litigation and possible financial losses, any of which could adversely affect our business, results of operations and cash flows.
30
We may be accused of infringing upon the intellectual property rights of third parties, which is costly to defend and could limit our ability to use certain technologies in the future.
From time to time third parties have alleged that UOL infringes on their intellectual property rights, including patent rights. We may be unaware of filed patent applications and of issued patents that could be related to the products and services we acquired in the UOL acquisition. These claims are often made by patent holding companies that are not operating companies. The alleging parties generally seek royalty payments for prior use as well as future royalty streams. Defending against disputes, litigation or other legal proceedings, whether or not meritorious, may involve significant expense and diversion of management’s attention and resources from other matters. Due to the inherent uncertainties of litigation, we may not prevail in these actions. Both the costs of defending lawsuits and any settlements or judgments against us could adversely affect our results of operations and cash flows.
If there are events or circumstances affecting the reliability or security of the Internet, access to the websites related to the UOL business and/or the ability to safeguard confidential information could be impaired causing a negative effect on the financial results of our business operations.
Our website infrastructure and the website infrastructure of UOL may be vulnerable to computer viruses, hacking or similar disruptive problems caused by customers, other Internet users, other connected Internet sites, and the interconnecting telecommunications networks. Such problems caused by third-parties could lead to interruptions, delays or cessation of service to the customers of the UOL products and services. Inappropriate use of the Internet by third-parties could also potentially jeopardize the security of confidential information stored in our computer system, which may deter individuals from becoming customers. There can be no assurance that any such measures would not be circumvented in future. Dealing with problems caused by computer viruses or other inappropriate uses or security breaches may require interruptions, delays or cessation of service to customers, which could have a material adverse effect on our business, financial condition and results of operations.
The UOL business processes, stores and uses personal information and other data, which subjects us to governmental regulation and other legal obligations related to privacy, and our actual or perceived failure to comply with such obligations could harm our business.
The UOL business receives, stores and processes personal information and other customer data, and UOL enables customers to share their personal information with each other and with third parties. There are numerous federal, state and local laws around the world regarding privacy and the storing, sharing, use, processing, disclosure and protection of personal information and other customer data, the scope of which are changing, subject to differing interpretations, and may be inconsistent between countries or conflict with other rules. We will generally comply with industry standards and are and will be subject to the terms of privacy policies and privacy-related obligations to third parties. We will strive to comply with all applicable laws, policies, legal obligations and industry codes of conduct relating to privacy and data protection, to the extent possible. However, it is possible that these obligations may be interpreted and applied in a manner that is inconsistent from one jurisdiction to another and may conflict with other rules or UOL’s practices. Any failure or perceived failure to comply with UOL’s privacy policies, privacy-related obligations to customers or other third parties, or privacy-related legal obligations, or any compromise of security that results in the unauthorized release or transfer of personally identifiable information or other customer data, may result in governmental enforcement actions, litigation or public statements against us by consumer advocacy groups or others and could cause customers to lose trust in us, which could have an adverse effect on our business. Additionally, if third parties we work with, such as customers, vendors or developers, violate applicable laws or policies, such violations may also put our customers’ information at risk and could in turn have an adverse effect on our business.
Our marketing efforts for UOL’s business may not be successful or may become more expensive, either of which could increase our costs and adversely impact our business, financial condition, results of operations, and cash flows.
We rely on relationships for our UOL business with a wide variety of third parties, including Internet search providers such as Google, social networking platforms such as Facebook, Internet advertising networks, co-registration partners, retailers, distributors, television advertising agencies, and direct marketers, to source new members and to promote or distribute our services and products. In addition, in connection with the launch of new services or products for our UOL business, we may spend a significant amount of resources on marketing. With any of our brands, services, and products, if our marketing activities are inefficient or unsuccessful, if important third-party relationships or marketing strategies, such as Internet search engine marketing and search engine optimization, become more expensive or unavailable, or are suspended, modified, or terminated, for any reason, if there is an increase in the proportion of consumers visiting our websites or purchasing our services and products by way of marketing channels with higher marketing costs as compared to channels that have lower or no associated marketing costs, or if our marketing efforts do not result in our services and products being prominently ranked in Internet search listings, our business, financial condition, results of operations, and cash flows could be materially and adversely impacted.
31
Our UOL business is dependent on the availability of telecommunications services and compatibility with third-party systems and products.
Our UOL business substantially depends on the availability, capacity, affordability, reliability, and security of our telecommunications networks. Only a limited number of telecommunications providers offer the network and data services we currently require for our UOL business, and we purchase most of our telecommunications services from a few providers. Some of our telecommunications services are provided pursuant to short-term agreements that the providers can terminate or elect not to renew. In addition, some telecommunications providers may cease to offer network services for certain less populated areas, which would reduce the number of providers from which we may purchase services and may entirely eliminate our ability to purchase services for certain areas. Currently, our mobile broadband service of our UOL business is entirely dependent upon services acquired from one service provider, and the devices required by the provider can be used for only such provider’s service. If we are unable to maintain, renew or obtain a new agreement with the telecommunications provider on acceptable terms, or the provider discontinues its services, our business, financial condition, results of operations, and cash flows could be materially and adversely affected. Sprint, which owns Clearwire, ceased using WiMAX technology on the Clearwire network. This affected our mobile broadband subscribers for our UOL business that utilized the Clearwire network.
Our dial-up Internet access services of our UOL business also rely on their compatibility with other third-party systems, products and features, including operating systems. Incompatibility with third-party systems and products could adversely affect our ability to deliver our services or a user’s ability to access our services and could also adversely impact the distribution channels for our services. Our dial-up Internet access services are dependent on dial-up modems and an increasing number of computer manufacturers, including certain manufacturers with whom we have distribution relationships, do not pre-load their new computers with dial-up modems, requiring the user to separately acquire a modem to access our services. We cannot assure you that, as the dial-up Internet access market declines and new technologies emerge, we will be able to continue to effectively distribute and deliver our services.
Government regulations could adversely affect our business or force us to change our business practices.
The services that are provided by UOL are subject to varying degrees of international, federal, state and local laws and regulation, including, without limitation, those relating to taxation, bulk email or “spam,” advertising (including, without limitation, targeted or behavioral advertising), user privacy and data protection, consumer protection, antitrust, export, and unclaimed property. Compliance with such laws and regulations, which in many instances are unclear or unsettled, is complex. New laws and regulations, such as those being considered or recently enacted by certain states, the federal government, or international authorities related to automatic-renewal practices, spam, user privacy, targeted or behavioral advertising, and taxation, could impact our revenues or certain of our business practices or those of our advertisers.
UOL resells broadband Internet access services offered by other parties pursuant to wholesale agreements with those providers. In an order released in March 2015, the Federal Communications Commission (the “FCC”) classified retail broadband Internet access services as telecommunications services subject to regulation under Title II of the Communications Act. That ruling is subject to a pending appeal. The classification of retail broadband Internet access services as telecommunications services means that providers of these services are subject to the general requirement that their charges, practices and classifications for telecommunications services be “just and reasonable,” and that they refrain from engaging in any “unjust or unreasonable discrimination” with respect to their charges, practices or classifications. However, the FCC has not determined what, if any, regulations will apply to wholesale broadband Internet access services, and it is uncertain whether it will adopt requirements that will be favorable or unfavorable to us. It is also possible that the classification of retail broadband Internet access services will be overturned on appeal, that Congress will adopt legislation reversing that decision, or that a future FCC will reverse that decision.
Broadband Internet access is also currently classified as an “information service.” While current policy exempts broadband Internet access services (but not all broadband services) from contributing to the Universal Service Fund (“USF”), Congress and the FCC may consider expanding the USF contribution base to include broadband Internet access services. If broadband Internet access providers become subject to USF contribution obligations, they would likely impose a USF surcharge on end users. Such a surcharge will raise the effective cost of our broadband services to UOL’s customers, which could adversely affect customer satisfaction and have an adverse impact on our revenues and profitability.
Failure to make proper payments for federal USF contributions, FCC regulatory fees or other amounts mandated by federal and state regulations; failure to maintain proper state tariffs and certifications; failure to comply with federal, state or local laws and regulations; failure to obtain and maintain required licenses, franchises and permits; imposition of burdensome license, franchise or permit requirements for us to operate in public rights-of-way; and imposition of new burdensome or adverse regulatory requirements could limit the types of services we provide or the terms on which we provide these services.
32
We cannot predict the outcome of any ongoing legislative initiatives or administrative or judicial proceedings or their potential impact upon the communications and information technology industries generally or upon the UOL business specifically. Any changes in the laws and regulations applicable to UOL, the enactment of any additional laws or regulations, or the failure to comply with, or increased enforcement activity by regulators of, such laws and regulations, could significantly impact our services and products, our costs, or the manner in which we or our advertisers conduct business, all of which could adversely impact our business, financial condition, results of operations, and cash flows and cause our business to suffer.
The FCC and some states require us to obtain prior approval of certain major merger and acquisition transactions, such as the acquisition of control of another telecommunications carrier. Delays in obtaining such approvals could affect our ability to close proposed transactions in a timely manner and could increase our costs and increase the risk of non-consummation of some transactions.
We manage debt investments that involve significant risks and potential additional liabilities.
GACP I., L.P. and GACP II, L.P., both direct lending funds of which our wholly owned subsidiary GACP is the general partner, may invest in secured debt issued by companies that have or may incur additional debt that is senior to the secured debt owned by the fund. In the event of insolvency, liquidation, dissolution, reorganization or bankruptcy of any such company, the owners of senior secured debt (i.e., the owners of first priority liens) generally will be entitled to receive proceeds from any realization of the secured collateral until they have been reimbursed. At such time, the owners of junior secured debt (including, in certain circumstances, the fund) will be entitled to receive proceeds from the realization of the collateral securing such debt. There can be no assurances that the proceeds, if any, from the sale of such collateral would be sufficient to satisfy the loan obligations secured by subordinate debt instruments. To the extent that the fund owns secured debt that is junior to other secured debt, the fund may lose the value of its entire investment in such secured debt.
In addition, the fund may invest in loans that are secured by a second lien on assets. Second lien loans have been a developed market for a relatively short period of time, and there is limited historical data on the performance of second lien loans in adverse economic circumstances. In addition, second lien loan products are subject to intercreditor arrangements with the holders of first lien indebtedness, pursuant to which the second lien holders have waived many of the rights of a secured creditor, and some rights of unsecured creditors, including rights in bankruptcy, which can materially affect recoveries. While there is broad market acceptance of some second lien intercreditor terms, no clear market standard has developed for certain other material intercreditor terms for second lien loan products. This variation in key intercreditor terms may result in dissimilar recoveries across otherwise similarly situated second lien loans in insolvency or distressed situations. While uncertainty of recovery in an insolvency or distressed situation is inherent in all debt instruments, second lien loan products carry more risks than certain other debt products.
The market in which magicJack participates is highly competitive and if we do not compete effectively, our operating results may be harmed by loss of market share and revenues.
The telecommunications industry is highly competitive. We face intense competition from traditional telephone companies, wireless companies, cable companies and alternative voice communication providers and manufacturers of communication devices.
The principal competitors for our products and services include the traditional telephone service providers, such as AT&T, Inc., CenturyLink, Inc. and Verizon Communications Inc., which provide telephone service using the public switched telephone network. Certain of these traditional providers have also added, or are planning to add, broadband telephone services to their existing telephone and broadband offerings. We also face, or expect to face, competition from cable companies, such as Cablevision Systems Corp., Charter Communications, Inc., Comcast Corporation, Cox Communications, Inc. and Time Warner Cable (a division of Time Warner Inc.), which offer broadband telephone services to their existing cable television and broadband offerings. Further, wireless providers, including AT&T Mobility, Inc., Sprint Corporation, T-Mobile USA Inc., and Verizon Wireless, Inc. offer services that some customers may prefer over wireline-based service. In the future, as wireless companies offer more minutes at lower prices, their services may become more attractive to customers as a replacement for broadband or wireline-based phone service.
We face competition on magicJack device sales from Apple, Samsung, Motorola and other manufacturers of smart phones, tablets and other handheld wireless devices. Also, we compete against established alternative voice communication providers, such as Vonage, Google Voice, Ooma, and Skype, which is another non-interconnected voice provider, and may face competition from other large, well-capitalized Internet companies. In addition, we compete with independent broadband telephone service providers.
Increased competition may result in our competitors using aggressive business tactics, including providing financial incentives to customers, selling their products or services at a discount or loss, offering products or services similar to our products and services on a bundled basis at a discounted rate or no charge, announcing competing products or services combined with aggressive marketing efforts, and asserting intellectual property rights or claims, irrespective of their validity.
33
We believe that some of our existing competitors may choose to consolidate or may be acquired in the future. Additionally, some of our competitors may enter into alliances or joint ventures with each other or establish or strengthen relationships with other third parties. Any such consolidation, acquisition, alliance, joint venture or other relationship could adversely affect our ability to compete effectively, lead to pricing pressure, our loss of market share and could harm our business, results of operations and financial condition.
magicJack may face difficulty in attracting new customers, and if we fail to attract new customers, our business and results of operations may suffer.
Most traditional wireline and wireless telephone service providers and cable companies are substantially larger and better capitalized than us and have the advantage of a large existing customer base. Because most of our customers are purchasing communications services from one or more of these providers, our success is dependent upon our ability to attract customers away from their existing providers. In addition, these competitors could focus their substantial financial resources to develop competing technology that may be more attractive to potential customers than what we offer. Our competitors’ financial resources may allow them to offer services at prices below cost or even for free in order to maintain and gain market share or otherwise improve their competitive positions.
magicJack’s competitors also could use their greater financial resources to offer broadband telephone service with more attractive service packages that include on-site installation and more robust customer service. In addition, because of the other services that our competitors provide, they may choose to offer broadband telephone service as part of a bundle that includes other products, such as video, high speed Internet access and wireless telephone service, which we do not offer at the present time. This bundle may enable our competitors to offer broadband telephone service at prices with which we may not be able to compete or to offer functionality that integrates broadband telephone service with their other offerings, both of which may be more desirable to consumers. Any of these competitive factors could make it more difficult for us to attract and retain customers to our products, and cause us to lower our prices in order to compete and reduce our market share and revenues.
magicJack may be unable to obtain enough phone numbers in desirable area codes to meet demand, which may adversely affect our ability to attract new customers and our results of operations.
magicJack’s operations are subject to varying degrees of federal and state regulation. It currently allows customers to select the area code for their desired phone number from a list of available area codes in cities throughout much of the United States. This selection may become limited if we are unable to obtain phone numbers, or a sufficient quantity of phone numbers, including certain area codes, due to exhaustion and consequent shortages of numbers in those area codes, restrictions imposed by federal or state regulatory agencies, or a lack of telephone numbers made available to us by third parties. If we are unable to provide our customers with a nationwide selection of phone numbers, or any phone numbers at all, in all geographical areas and is unable to obtain telephone numbers from another alternative source, or is required to incur significant new costs in connection with obtaining such phone numbers, our relationships with current and future customers may be damaged, causing a shortfall in expected revenue, increased customer attrition, and an inability to attract new customers. As a result, our business, results of operations and financial condition could be materially and adversely affected.
If magicJack’s services are not commercially accepted by customers, our prospects for growth will suffer.
Our success in deriving a substantial amount of revenues from magicJack’s broadband telephone service offering sold to consumers and businesses relies on the commercial acceptance of our offering from consumers and business. Although we currently sell our services to a number of customers, it cannot be certain that future customers will find our services attractive. If customer demand for our services does not develop or develops more slowly than anticipated, it would have a material adverse effect on our business, results of operations and financial condition. Our success relies on the commercial acceptance of our offering from these advertisers and retailers. magicJack is not currently selling its advertising and retailing services and it cannot be certain future online advertisers and retailers will find its services attractive. If demand for these services does not develop or develops more slowly than anticipated, it would have a material adverse effect on our business, results of operations and financial condition.
If magicJack is unable to retain its existing customers, our revenue and results of operations would be adversely affected.
We offer magicJack services pursuant to a subscriber agreement that ranges generally from one month to five years in duration and allows our customers to gain access to our servers for telephone calls. Our customers do not have an obligation to renew their subscriber agreement after their initial term period expires, and these agreements may not be renewed on the same or on more profitable terms. As a result, our ability to grow depends in part on retaining customers for renewals. We may not be able to accurately predict future trends in customer renewals, and our customers’ renewal rates may decline or fluctuate because of several factors, including their satisfaction or dissatisfaction with our services, the prices of our services, the fees imposed by government entities, the prices of comparable services offered by our competitors or reductions in our customers’ spending levels. If our customers do not renew their services, renew on less favorable terms, or do not purchase additional functionality, our revenue may grow more slowly than expected or decline, and our profitability and gross margins may be harmed.
34
The market for magicJack’s services and products is characterized by rapidly changing technology and our success will depend on our ability to enhance our existing service and product offerings and to introduce new services and products on a timely and cost effective basis.
The market for magicJack’s services and products is characterized by rapidly changing enabling technology, frequent enhancements and evolving industry standards. Our continued success depends on our ability to accurately anticipate the evolution of new products and technologies and to enhance our existing products and services. Historically, several factors have deterred consumers and businesses from using voice over broadband service, including security concerns, inconsistent quality of service, increasing broadband traffic and incompatible software products. If we are unable to continue to address those concerns and foster greater consumer demand for our products and services, our business and results of operations will be adversely affected.
Our success also depends on our ability to develop and introduce innovative new magicJack services and products that gain market acceptance. We may not be successful in selecting, developing, manufacturing and marketing new products and services or enhancing existing products and services on a timely basis. We may experience difficulties with software development, industry standards, design or marketing that could delay or prevent our development, introduction or implementation of new products, services and enhancements. The introduction of new products or services by competitors, the emergence of new industry standards or the development of entirely new technologies to replace existing service offerings could render our existing or future services obsolete. If our services become obsolete due to wide-spread adoption of alternative connectivity technologies, our ability to generate revenue may be impaired. In addition, any new markets into which we attempt to sell our services, including new countries or regions, may not be receptive. If we are unable to successfully develop or acquire new products or services, enhance our existing products or services to anticipate and meet customer preferences or sell magicJack products and services into new markets, our revenue and results of operations would be adversely affected.
We may be unsuccessful in protecting our proprietary rights or may have to defend ourselves against claims of infringement, which could impair or significantly affect our business.
Our means of protecting our proprietary rights may not be adequate and our competitors may independently develop technology that is similar ours. Legal protections afford only limited protection for our technology. The laws of many countries do not protect our proprietary rights to as great an extent as do the laws of the United States. Despite our efforts to protect our proprietary rights, unauthorized parties have in the past attempted, and may in the future attempt, to copy aspects of our products or to obtain and use information that it regards as proprietary. Third parties may also design around our proprietary rights, which may render our protected products less valuable, if the design around is favorably received in the marketplace. In addition, if any our products or the technology underlying our products is covered by third-party patents or other intellectual property rights, we could be subject to various legal actions.
We cannot assure you that our products do not infringe intellectual property rights held by others or that they will not in the future. Third parties may assert infringement, misappropriation, or breach of license claims against us from time to time. Such claims could cause us to incur substantial liabilities and to suspend or permanently cease the use of critical technologies or processes or the production or sale of major products. Litigation may be necessary to enforce our intellectual property rights, to protect our trade secrets, to determine the validity and scope of the proprietary rights of others, or to defend against claims of infringement or invalidity, misappropriation, or other claims. Any such litigation could result in substantial costs and diversion of our resources, which in turn could materially adversely affect our business and financial condition. Moreover, any settlement of or adverse judgment resulting from such litigation could require us to obtain a license to continue to use the technology that is the subject of the claim, or otherwise restrict or prohibit our use of the technology. Any required licenses may not be available to us on acceptable terms, if at all. If we attempt to design around the technology at issue or to find another provider of suitable alternative technology to permit it to continue offering applicable software or product solutions, our continued supply of software or product solutions could be disrupted or our introduction of new or enhanced software or products could be significantly delayed.
magicJack’s products must comply with various domestic and international regulations and standards and failure to do so could have an adverse effect on our business, operating results and financial condition.
magicJack’s products must comply with various domestic and international regulations and standards defined by regulatory agencies. If it does not comply with existing or evolving industry standards and other regulatory requirements or if we fail to obtain in a timely manner any required domestic or foreign regulatory approvals or certificates, we will not be able to sell our products where these standards or regulations apply, which may harm our business. Moreover, distribution partners or customers may require us, or we may otherwise deem it necessary or advisable, to alter our products to address actual or anticipated changes in the regulatory environment. Our inability to alter our products to address these requirements and any regulatory changes could have a material adverse effect on our business, financial condition, and operating results.
35
magicJack’s emergency and E911 calling services are different from those offered by traditional wireline telephone companies and may expose us to significant liability.
While we do not believe that we are currently subject to regulatory requirements to provide such capability, we provide our customers with emergency calling services/E911 calling services (“E911”) that significantly differ from the emergency calling services offered by traditional wireline telephone companies. Those differences may cause significant delays, or even failures, in callers’ receipt of the emergency assistance they need. Traditional wireline telephone companies route emergency calls from a fixed location over a dedicated infrastructure directly to an emergency services dispatcher at the public safety answering point (“PSAP”) in the caller’s area. Generally, the dispatcher automatically receives the caller’s phone number and actual location information. Because the magicJack devices are portable or nomadic, the only way we can determine to which PSAP to route an emergency call, and the only location information that our E911 service can transmit to a dispatcher at a PSAP is the information that our customers have registered with us. A customer’s registered location may be different from the customer’s actual location at the time of the call because customers can use their magicJack devices to make calls almost anywhere a broadband connection is available. Significant delays may occur in a customer updating its registered location information, and in applicable databases being updated and new routing implemented once a customer has provided new information. If our customers encounter delays when making emergency services calls and any inability to route emergency calls properly, or of the answering point to automatically recognize the caller’s location or telephone number, such delays can have devastating consequences. Customers may, in the future, attempt to hold us responsible for any loss, damage, personal injury or death suffered as a result.
Traditional phone companies also may be unable to provide the precise location or the caller’s telephone number when their customers place emergency calls. However, traditional phone companies are covered by federal legislation exempting them from liability for failures of emergency calling services, and magicJack is not afforded such protection. In addition, magicJack has lost, and may in the future lose, existing and prospective customers because of the limitations inherent in our emergency calling services. Additionally, service interruptions from our third-party providers could cause failures in our customers’ access to E911 services. Any of these factors could cause us to lose revenues, incur greater expenses or cause our reputation or financial results to suffer.
State and local governments may seek to impose E911 fees.
Many state and local governments have sought to impose fees on customers of VoIP providers, or to collect fees from VoIP providers, to support implementation of E911 services in their area. The application of such fees with respect to magicJack users and use is not clear because various statutes and regulations may not cover our services, we do not bill our customers monthly, nor do we bill customers at all for telecommunication services. We may also not know the end user’s location because the magicJack devices and services are nomadic. Should a regulatory authority require payment of money from us for such support, we may be required to develop a mechanism to collect fees from our customers, which may or may not be satisfactory to the entity requesting us to be a billing agent. We cannot predict whether the collection of such additional fees or limitations on where our services are available would impact customers’ interest in purchasing our products.
In settlement of litigation, magicJack agreed that it would, at least once a year, issue bills for 911 emergency calling services to each user who has access to 911 services through their magicJack services, and who has provided a valid address in a U.S. jurisdiction that provides access to 911 services and which is legally empowered to impose 911 charges on such users in accordance with applicable state and/or local law.
Certain E911 regulatory authorities have asserted or may assert in the future that we are liable for damages, including end user assessed E911 taxes, surcharges and/or fees, for not having billed and collected E911 fees from our customers in the past or in the future. If a jurisdiction were to prevail in such claims, the decision could have a material adverse effect on our financial condition and results of operations.
36
Increases in credit card processing fees and high chargeback costs would increase our operating expenses and adversely affect our results of operations, and an adverse change in, or the termination of, magicJack’s relationship with any major credit card company would have a severe, negative impact on our business.
A significant number of magicJack’s customers purchase its products through magicJack’s website and pay for its products and services using credit or debit cards. The major credit card companies or the issuing banks may increase the fees that they charge for transactions using their cards. An increase in those fees would require us to either increase the prices we charge for our products, or suffer a negative impact on our profitability, either of which could adversely affect our business, financial condition and results of operations.
We have potential liability for chargebacks associated with the transactions we process, or that are processed on our behalf by merchants selling our products. If a customer returns his or her magicJack products at any time, or claims that magicJack’s product was purchased fraudulently, the returned product is “charged back” to magicJack or its bank, as applicable. If magicJack or its sponsoring banks are unable to collect the chargeback from the merchant’s account, or, if the merchant refuses or is financially unable, due to bankruptcy or other reasons, to reimburse the merchant’s bank for the chargeback, we bear the loss for the amount of the refund paid.
We are vulnerable to credit card fraud, as we sell magicJack products directly to customers through our website. Card fraud occurs when a customer uses a stolen card (or a stolen card number in a card-not-present-transaction) to purchase merchandise or services. In a traditional card-present transaction, if the merchant swipes the card, receives authorization for the transaction from the card issuing bank and verifies the signature on the back of the card against the paper receipt signed by the customer, the card issuing bank remains liable for any loss. In a fraudulent card-not-present transaction, even if the merchant or magicJack receive authorization for the transaction, magicJack or the merchant are liable for any loss arising from the transaction. Because sales made directly from magicJack’s website are card-not-present transactions, we are more vulnerable to customer fraud. We are also subject to acts of consumer fraud by customers that purchase magicJack products and services and subsequently claim that such purchases were not made.
In addition, as a result of high chargeback rates or other reasons beyond our control, the credit card companies or issuing bank may terminate their relationship with magicJack, and there are no assurances that it will be able to enter into a new credit card processing agreement on similar terms, if at all. Upon a termination, if magicJack’s credit card processor does not assist it in transitioning its business to another credit card processor, or if magicJack were not able to obtain a new credit card processor, the negative impact on our liquidity likely would be significant. The credit card processor may also prohibit magicJack from billing discounts annually or for any other reason. Any increases in the magicJack’s credit card fees could adversely affect our results of operations, particularly if we elect not to raise our service rates to offset the increase. The termination of magicJack’s ability to process payments on any major credit or debit card, due to high chargebacks or otherwise, would significantly impair our ability to operate our business.
Flaws in magicJack’s technology and systems could cause delays or interruptions of service, damage our reputation, cause us to lose customers and limit our growth.
Our service could be disrupted by problems with magicJack technology and systems, such as malfunctions in our software or other facilities and overloading of our servers. Our customers could experience interruptions in the future as a result of these types of problems. Interruptions could in the future cause us to lose customers, which could adversely affect our revenue and profitability. In addition, because magicJack’s systems and our customers’ ability to use our services are Internet-dependent, our services may be subject to “hacker attacks” from the Internet, which could have a significant impact on our systems and services. If service interruptions adversely affect the perceived reliability of our service, it may have difficulty attracting and retaining customers and our brand reputation and growth may suffer.
We depend on overseas manufacturers, and for certain magicJack products, third-party suppliers, and our reputation and results of operations would be harmed if these manufacturers or suppliers fail to meet magicJack’s requirements.
The manufacture of the magicJack devices is conducted by a manufacturing company in China, and certain parts are produced in Taiwan and Hong Kong. These manufacturers supply substantially all of the raw materials and provide all facilities and labor required to manufacture our products. If these companies were to terminate their arrangements with us or fail to provide the required capacity and quality on a timely basis, either due to actions of the manufacturers; earthquakes, typhoons, tsunamis, fires, floods, or other natural disasters; or the actions of their respective governments, we would be unable to manufacture our products until replacement contract manufacturing services could be obtained. To qualify a new contract manufacturer, familiarize it with the magicJack products, quality standards and other requirements, and commence volume production is a costly and time-consuming process. We cannot assure you that we would be able to establish alternative manufacturing relationships on acceptable terms or in a timely manner that would not cause disruptions in our supply. Any interruption in the manufacture of our products would be likely to result in delays in shipment, lost sales and revenue and damage to our reputation in the market, all of which would harm our business and results of operations. In addition, while the magicJack contract obligations with its contract manufacturer in China is denominated in U.S. dollars, changes in currency exchange rates could impact our suppliers and increase our prices.
37
We rely on independent retailers to sell the magicJack devices, and disruption to these channels would harm our business.
Because we sell a significant amount of the magicJack devices, other devices and certain services to independent retailers, we are subject to many risks, including risks related to their inventory levels and support for magicJack’s products. In particular, magicJack’s retailers maintain significant levels of our products in their inventories. If retailers attempt to reduce their levels of inventory or if they do not maintain sufficient levels to meet customer demand, our sales could be negatively impacted.
The retailers who sell magicJack products also sell products offered by its competitors. If these competitors offer the retailers more favorable terms, those retailers may de-emphasize or decline to carry magicJack’s products. In the future, we may not be able to retain or attract a sufficient number of qualified retailers. If we are unable to maintain successful relationships with retailers or to expand our distribution channels, our business will suffer.
To continue this method of sales, we will have to allocate resources to train vendors, systems integrators and business partners as to the use of our products, resulting in additional costs and additional time until sales by such vendors, systems integrators and business partners are made feasible. Our business depends to a certain extent upon the success of such channels and the broad market acceptance of our products. To the extent that our channels are unsuccessful in selling our products, our revenues and operating results will be adversely affected.
Many factors out of our control could interfere with our ability to market, license, implement or support magicJack products with any of our channels, which in turn could harm our business. These factors include, but are not limited to, a change in the business strategy of magicJack’s channels, the introduction of competitive product offerings by other companies that are sold through one or more of its channels, potential contract defaults by one or more of its channels, bankruptcy of one or more distribution channel, or changes in ownership or management of one or more of its channels. For example, in February 2015, RadioShack Corporation, one of magicJack’s retail customers, filed a voluntary petition in bankruptcy court. magicJack was owed $1.3 million by RadioShack which it did not collect and sales to RadioShack were ceased to limit exposure. magicJack made limited sales to the RadioShack entity that emerged from the bankruptcy proceedings and terminated its relationship with that entity effective as of October 27, 2016. Some of magicJack’s competitors may have stronger relationships with its channels than magicJack does or offer more favorable terms with respect to their products, and magicJack has limited control, if any, as to whether those channels implement its products rather than its competitors’ products or whether they devote resources to market and support its competitors’ products rather than its offerings. If magicJack fails to maintain relationships with these channels, fails to develop new channels, fails to effectively manage, train, or provide incentives to existing channels or if these channels are not successful in their sales efforts, sales of magicJack’s products may decrease and our operating results would suffer.
We may not be able to maintain adequate customer care during periods of growth or in connection with our addition of new and complex devices or features, which could adversely affect our ability to grow and cause our financial results to be negatively impacted.
We consider our offshore customer care to be critically important to acquiring and retaining customers. A portion of our customer care for magicJack products is provided by third parties located in Costa Rica and the Philippines. This approach exposes us to the risk that we may not maintain service quality, control or effective management within these business operations. The increased elements of risk that arise from conducting certain operating processes in some jurisdictions could lead to an increase in reputational risk. Interruptions in our customer care caused by disruptions at our third-party facilities may cause us to lose customers, which could adversely affect our revenue and profitability. If our customer base expands rapidly in the U.S. or abroad, we may not be able to expand our outsourced customer care operations quickly enough to meet the needs of our customer base, and the quality of our customer care will suffer and our access right renewal rate may decrease. As we broaden our magicJack offerings and its customers build increasingly complex home networking environments, we will face additional challenges in training our customer care staff. We could face a high turnover rate among our customer service providers. We intend to have our customer care provider hire and train customer care representatives in order to meet the needs of our customer base. If they are unable to hire, train and retain sufficient personnel to provide adequate customer care, we may experience slower growth, increased costs and higher levels of customer attrition, which would adversely affect our business and results of operations.
If we are unable to maintain an effective process for local number portability provisioning, our growth may be negatively impacted.
We comply with requests for local number portability from our customers. Local number portability means that our customers can retain their existing telephone numbers when subscribing to magicJack’s services, and would in turn allow former customers to retain their telephone numbers should they subscribe to another carrier. If we are unable to maintain the technology to expedite porting our customers’ numbers, demand for our services may be reduced, and this will adversely affect our revenue and profitability.
38
If we cannot continue to obtain key switching elements from magicJack’s primary competitors on acceptable terms, we may not be able to offer our local voice and data services on a profitable basis, if at all.
We will not be able to provide our local voice and data services on a profitable basis, if at all, unless we are able to obtain key switching elements from some of magicJack’s primary competitors on acceptable terms. To offer local voice and data services in a market, we must connect our servers with other carriers in a specific market. This relationship is governed by an interconnection agreement or carrier service agreement between us and that carrier. magicJack has such agreements with Verizon, AT&T, XO Communications Services and CenturyLink in a majority of its markets. If we are unable to continue these relationships, enter into new interconnection agreements or carrier service agreements with additional carriers in other markets or if these providers liquidate or file for bankruptcy, our business and profitability may suffer.
Regulatory initiatives may continue to reduce the maximum rates we are permitted to charge long distance service providers for completing calls by our customers to customers served by our servers.
The rates that we charge and is charged by service providers for terminating calls by their customers to customers served by its servers, and for transferring calls by its customers onto other carriers, cannot exceed rates determined by regulatory authorities. In 2011, the FCC adopted an order fundamentally overhauling its existing intercarrier compensation (“ICC”) rules, which govern payments between carriers for exchange traffic. This order established a new ICC regime that will result in the elimination of virtually all terminating switched access charges and reciprocal compensation payments over a transition period that will end in 2020. The reductions resulting from these new ICC rules have affected and will continue to affect our revenues and results of operations.
Regulation of broadband telephone services are developing and therefore uncertain; and future legislative, regulatory or judicial actions could adversely impact our business and expose us to liability.
The current regulatory environment for broadband telephone services is developing and therefore uncertain. The United States and other countries have begun to assert regulatory authority over broadband telephone service and are continuing to evaluate how broadband telephone service will be regulated in the future. Both the application of existing rules to us and our competitors and the effects of future regulatory developments are uncertain. Future legislative, judicial or other regulatory actions could have a negative effect on our business. If its VoIP telephony service or our other magicJack products and services become subject to the rules and regulations applicable to telecommunications providers, if current broadband telephone service rules are expanded and applied to us, or if additional rules and regulations applicable specifically to broadband telephone services are adopted, we may incur significant compliance costs, and we may have to restructure our service offerings, exit certain markets or start charging for our services at least to the extent of regulatory costs or requirements, any of which could cause our services to be less attractive to customers. We are faced, and may continue to face, difficulty collecting such charges from our customers and/or carriers, and collecting such charges may cause us to incur legal fees. We may be unsuccessful in collecting all of the regulatory fees owed to us. The imposition of any such additional regulatory fees, charges, taxes and regulations on VoIP communications services could materially increase our costs and may limit or eliminate our competitive pricing advantages.
Regulatory and governmental agencies may determine that we should be subject to rules applicable to certain broadband telephone service providers or seek to impose new or increased fees, taxes, and administrative burdens on broadband telephone service providers. We also may change our product and service offerings in a manner that subjects us to greater regulation and taxation. Such obligations could include requirements that we contribute directly to federal or state Universal Service Funds. We may also be required to meet various disability access requirements, number portability obligations, and interception or wiretapping requirements, such as the Communications Assistance for Law Enforcement Act. The imposition of such regulatory obligations or the imposition of additional federal, state or local taxes on our services could increase our cost of doing business and limit our growth.
We offer our magicJack products and services in other countries, and therefore could also be subject to regulatory risks in each such foreign jurisdiction, including the risk that regulations in some jurisdictions will prohibit us from providing our services cost-effectively or at all, which could limit our growth. Currently, there are several countries where regulations prohibit us from offering service. In addition, because customers can use our services almost anywhere that a broadband Internet connection is available, including countries where providing broadband telephone service is illegal, the governments of those countries may attempt to assert jurisdiction over us. Violations of these laws and regulations could result in fines, criminal sanctions against us, our officers or our employees, and prohibitions on the conduct of our business. Any such violations could include prohibitions on our ability to offer our products and services in one or more countries, could delay or prevent potential acquisitions, expose us to significant liability and regulation and could also materially damage our reputation, our brand, our international expansion efforts, our ability to attract and retain employees, our business and our operating results. Our success depends, in part, on our ability to anticipate these risks and manage these difficulties.
39
The success of our business relies on customers’ continued and unimpeded access to broadband service. Providers of broadband services may be able to block our services or charge their customers more for also using our services, which could adversely affect our revenue and growth.
Our customers must have broadband access to the Internet in order to use our service. Providers of broadband access, some of whom are also competing providers of voice services, may take measures that affect their customers’ ability to use our service, such as degrading the quality of the data packets they transmit over their lines, giving those packets low priority, giving other packets higher priority than ours, blocking our packets entirely or attempting to charge their customers more for also using our services.
In 2015, the FCC adopted net neutrality rules that prohibited broadband providers from: 1) blocking legal content, applications, services, or non-harmful devices; 2) impairing or degrading lawful Internet traffic on the basis of content, applications, services, or non-harmful devices; 3) engaging in paid prioritization by favoring some lawful Internet traffic over other lawful traffic in exchange for consideration of any kind or by prioritizing content and services of their affiliates; and 4) unreasonably interfering with or unreasonably disadvantaging the ability of consumers to select, access, and use the lawful content, applications, services, or devices of their choosing; or of edge providers to make lawful content, applications, services, or devices available to consumers. In doing so, the FCC reclassified broadband Internet access - the retail broadband service mass-market customers buy from cable, phone, and wireless providers - as a telecommunications service regulated under Title II of the Communications Act of 1934, although the FCC agreed to forbear from many requirements of Title II. Significantly, these rules applied equally to fixed and mobile broadband networks.
After the FCC’s new net neutrality rules went into effect in June 2015, various broadband providers and their trade associations challenged the FCC’s decision before the U.S. Court of Appeals for the D.C. Circuit. In June 2016, the D.C. Circuit issued its decision upholding the FCC’s rules. The D.C. Circuit also denied various petitions seeking rehearing en banc of the court’s decision. Various parties have sought review by the United States Supreme Court of the D.C. Circuit’s decision, which remains pending. We cannot predict the outcome of these proceedings.
In December 2017, the FCC adopted its “Restoring Internet Freedom Order,” which: 1) restored the classification of broadband Internet access services as unregulated information services, ending Title II regulation of these services; 2) eliminated the FCC’s three “bright-line” net neutrality rules; 3) eliminated the FCC’s “general conduct” rule; and 4) adopted a new transparency rule.
Multiple parties filed petitions seeking judicial review of the “Restoring Internet Freedom Order,” which were consolidated and heard by the United States Court of Appeals for the D.C. Circuit. In October 2019, the D.C. Circuit largely upheld the FCC decision to eliminate legal prohibitions against broadband providers blocking, throttling, or otherwise degrading the quality of our data packets or attempting to extract additional fees from us or our customers, which could adversely impact our business.
We may be bound by certain FCC regulations relating to the provision of E911 service, and if we fail to comply with FCC regulations requiring us to provide E911 emergency calling services, we may be subject to fines or penalties.
In 2005, the FCC issued regulations requiring interconnected voice-over broadband providers to provide E911 services and to notify customers of any differences between the broadband telephone service emergency calling services and those available through traditional telephone providers and obtain affirmative acknowledgments from customers of those notifications. In 2019, the FCC adopted rules broadening the scope of its E911 requirements, including imposing 911 obligations on outbound VoIP providers – obligations that will take effect in two years.
Limitations on our ability to provide E911 service or comply with the FCC’s new mandates could materially limit our growth and have a material adverse effect on our profitability. We could be subjected to various fines and forfeitures. FCC rulings could also subject us to greater regulation in some states.
40
Regulatory rulings and/or carrier disputes could affect the manner in which we interconnect and exchange traffic with other providers and the costs and revenues associated with doing so.
We exchange calls with other providers pursuant to applicable law and interconnection agreements and other carrier contracts that define the rates, terms, and conditions applicable to such traffic exchange. The calls we exchange originate from and terminate to a customer that uses a broadband Internet connection to access our services and are routed using telephone numbers of the customer’s choosing. There is uncertainty, however, with respect to intercarrier compensation for such traffic while rules continue to be challenged in various courts. The FCC Report and Order issued in November 2011 has asserted its jurisdiction over such traffic. Various state commissions have also issued rulings with respect to the exchange of different categories of traffic under interconnection agreements. To the extent that another provider were to assert that the traffic we exchanges with them is subject to higher levels of compensation than we, or the third parties terminating our traffic to the PSTN, pay today (if any), or if other providers from whom we currently collect compensation for the exchange of such traffic refuse to pay it going forward, we may need to seek regulatory relief to resolve such a dispute. Given the recent changes to the intercarrier compensation regime, we cannot guarantee that the outcome of any proceeding would be favorable, and an unfavorable ruling could adversely affect the amounts we collect and/or pay to other providers in connection with the exchange of our traffic. The FCC clarified in January 2015 that its VoIP symmetry rule does not require a CLEC or its VoIP provider partner to provide the physical last-mile facility to the VoIP provider’s end user customers in order to provide the functional equivalent of end office switching, and thus for the CLEC to be eligible to assess access charges for this service. The ruling confirms that the VoIP symmetry rule is technology and facilities neutral and applies regardless of whether a CLEC’s VoIP partner is a facilities-based or over-the-top VoIP provider. However, in November 2016, the U.S. Court of Appeals for the D.C. Circuit vacated the FCC’s ruling. In December 2019, the Federal Communications Commission (FCC) issued an order on remand revisiting its interpretation of the VoIP symmetry rule, concluding that LECs may assesses end office switched access charges only if the LEC or its VoIP partner provides a physical connection to the last-mile facilities used to serve an end user. If neither the LEC nor its VoIP partner provides such physical connection, it is not providing the functional equivalent of end office switched access and the LEC may not assess end office switched access charges. The FCC also decided to give its order retroactive effect to “prevent an undue hardship being worked upon those parties who properly interpreted the VoIP Symmetry Rule and have been in disputes ever since.” We are still assessing the impact of this recent FCC order that will affect the amounts we collect and/or pay to other providers in connection with the exchange of our traffic.
Server failures or system breaches could cause delays or adversely affect our service quality, which may cause us to lose customers and revenue.
In operating our servers, we may be unable to connect and manage a large number of customers or a large quantity of traffic at high speeds. Any failure or perceived failure to achieve or maintain high-speed data transmission could significantly reduce demand for our magicJack services and adversely affect our operating results. In addition, computer viruses, break-ins, human error, natural disasters and other problems may disrupt our servers. The system security and stability measures we implement may be circumvented in the future or otherwise fail to prevent the disruption of our services. The costs and resources required to eliminate computer viruses and other security problems may result in interruptions, delays or cessation of services to our customers, which could decrease demand, decrease our revenue and slow our planned expansion.
Hardware and software failures, delays in the operation of magicJack’s computer and communications systems or the failure to implement system enhancements may harm our business.
Our success depends on the efficient and uninterrupted operation of magicJack’s software and communications systems. A failure of our servers could impede the delivery of services, customer orders and day-to-day management of our business and could result in the corruption or loss of data. Despite any precautions we may take, damage from fire, floods, hurricanes, power loss, telecommunications failures, computer viruses, break-ins and similar events at our various facilities could result in interruptions in the flow of data to our servers and from our servers to our customers. In addition, any failure by our computer environment to provide our required telephone communications capacity could result in interruptions in our service. Additionally, significant delays in the planned delivery of system enhancements and improvements, or inadequate performance of the systems once they are completed, could damage our reputation and harm our business. Finally, long-term disruptions in infrastructure caused by events such as natural disasters, the outbreak of war, the escalation of hostilities, and acts of terrorism (particularly involving cities in which it has offices) could adversely affect our business. Although we maintain general liability insurance, including coverage for errors and omissions, this coverage may be inadequate, or may not be available in the future on reasonable terms, or at all. We cannot assure you that this policy will cover any claim against us for loss of data or other indirect or consequential damages and defending a lawsuit, regardless of its merit, could be costly and divert management’s attention. In addition to potential liability, if we experience interruptions in our ability to supply our services, our reputation could be harmed and we could lose customers.
Our magicJack service requires an operative broadband connection, and if the adoption of broadband does not progress as expected, the market for our services will not grow and we may not be able to grow our business and increase our revenue.
Use of magicJack’s service requires that the user be a subscriber to an existing broadband Internet service, most typically provided through a cable or digital subscriber line, or DSL, connection. Although the number of broadband subscribers in the U.S. and worldwide has grown significantly over the last five years, this service has not yet been adopted by all consumers and is not available in every part of the United States and Canada, particularly rural locations. If the adoption of broadband services does not continue to grow, the market for our services may not grow.
41
Our magicJack business is subject to privacy and online security risks, including security breaches, and we could be liable for such breaches of security. If we are unable to protect the privacy of our customers making calls using our service, or information obtained from our customers in connection with their use or payment of our services, in violation of privacy or security laws or expectations, we could be subject to significant liability and damage to our reputation.
Although we have developed systems and processes that are designed to protect customer information and prevent fraudulent transactions, data loss and other security breaches, such systems and processes may not be sufficient to prevent fraudulent transactions, data loss and other security breaches. Failure to prevent or mitigate such breaches may adversely affect our operating results.
Customers may believe that using our services to make and receive telephone calls using their broadband connection could result in a reduction of their privacy, as compared to traditional wireline carriers. Additionally, our website, www.magicJack.com, serves as an online sales portal. We currently obtain and retain personal information about our website users in connection with such purchases. In addition, we obtain personal information about our customers as part of their registration to use our products and services. Federal, state and foreign governments have enacted or may enact laws or regulations regarding the collection and use of personal information.
Our business involves the storage and transmission of users’ proprietary information, and security breaches could expose us to a risk of loss or misuse of this information, litigation, and potential liability. An increasing number of websites, including several other Internet companies, have recently disclosed breaches of their security, some of which have involved sophisticated and highly targeted attacks on portions of their sites. Because the techniques used to obtain unauthorized access, disable or degrade service, or sabotage systems, change frequently and often are not recognized until launched against a target, we may be unable to anticipate these techniques or to implement adequate preventative measures. If an actual or perceived breach of our security occurs, the market perception of the effectiveness of our security measures could be harmed and we could lose users. A party that is able to circumvent our security measures could misappropriate magicJack’s or its users’ proprietary information, cause interruption in our operations, damage our computers or those of our users, or otherwise damage our reputation and business. Any compromise of our security could result in a violation of applicable privacy and other laws, significant legal and financial exposure, damage to our reputation, and a loss of confidence in our security measures, which could harm our business.
Currently, a significant number of our users authorize it to bill their credit card accounts directly for all transaction fees charged by us. We rely on encryption and authentication technology licensed from third parties to provide the security and authentication to effectively secure transmission of confidential information, including customer credit card numbers. Advances in computer capabilities, new discoveries in the field of cryptography or other developments may result in the technology used by us to protect transaction data being breached or compromised. Non-technical means, for example, actions by a suborned employee, can also result in a data breach.
Possession and use of personal information in conducting our business subjects it to legislative and regulatory burdens that could require notification of data breach, restrict our use of personal information and hinder our ability to acquire new customers or market to existing customers. We may incur expenses to comply with privacy and security standards and protocols imposed by law, regulation, industry standards or contractual obligations.
Under payment card rules and magicJack’s contracts with its card processors, if there is a breach of payment card information that we store, we could be liable to the payment card issuing banks for their cost of issuing new cards and related expenses. In addition, if we fail to follow payment card industry security standards, even if there is no compromise of customer information, we could incur significant fines or lose our ability to give customers the option of using payment cards to fund their payments or pay their fees. If we were unable to accept payment cards, our business would be seriously damaged.
Our servers are also vulnerable to computer viruses, physical or electronic break-ins, and similar disruptions. We may need to expend significant resources to protect against security breaches or to address problems caused by breaches. These issues are likely to become more difficult as we expand the number of places where we operate. Security breaches, including any breach by us or by parties with which we have commercial relationships that result in the unauthorized release of magicJack’s users’ personal information, could damage our reputation and expose us to a risk of loss or litigation and liability. Our insurance policies carry coverage limits that may not be adequate to reimburse it for losses caused by security breaches.
magicJack’s users, as well as those of other prominent Internet companies, have been and will continue to be targeted by parties using fraudulent “spoof” and “phishing” emails to misappropriate passwords, credit card numbers, or other personal information or to introduce viruses or other malware through “trojan horse” programs to magicJack’s users’ computers. These emails appear to be legitimate emails sent by magicJack, but direct recipients to fake websites operated by the sender of the email or request that the recipient send a password or other confidential information via email or download a program. Despite our efforts to mitigate “spoof” and “phishing” emails through product improvements and user education, “spoof” and “phishing” remain a serious problem that may damage our brands, discourage use of our websites, and increase our costs.
42
We have a stringent privacy policy covering the information we collect from our customers and have established security features to protect this information. However, our security measures may not prevent security breaches. We may need to expend resources to protect against security breaches or to address problems caused by breaches. If unauthorized third parties were able to penetrate our security and gain access to, or otherwise misappropriate, our customers’ personal information or be able to access their telephone calls, it could harm our reputation and, therefore, our business and magicJack could be subject to liability. Such liability could include claims for misuse of personal information or unauthorized use of credit cards. These claims could result in litigation, our involvement in which, regardless of the outcome, could require us to expend significant financial resources. Internet privacy is a rapidly changing area and we may be subject to future requirements and legislation that are costly to implement and negatively impact our results.
magicJack has operations located in Israel, and therefore our results may be adversely affected by political, economic and military conditions in Israel.
magicJack’s business and operations may be directly influenced by the political, economic and military conditions affecting Israel at any given time. A change in the security and political situation in Israel could have a material adverse effect on our business, operating results and financial condition. Since the establishment of the State of Israel in 1948, a number of armed conflicts have taken place between Israel and its Arab neighbors, including Hezbollah in Lebanon and Hamas in the Gaza Strip. In the last few years, these conflicts involved missile strikes against civilian targets in various parts of Israel and negatively affected business conditions in Israel. In addition, political uprisings and conflicts in various countries in the Middle East, including Syria and Iraq, and including terrorist organizations gaining control and political power in the region such as the Islamic State of Iraq and Syria, or ISIS, are affecting the political stability of those countries. It is not clear how this instability will develop and how it will affect the political and security situation in the Middle East.
Our commercial insurance does not cover losses that may occur as a result of events associated with the security situation in the Middle East. Although the Israeli government currently covers the reinstatement value of direct damages that are caused by terrorist attacks or acts of war, we cannot assure you that this government coverage will be maintained. Any losses or damages incurred by us could have a material adverse effect on our business, operating results and financial condition.
Furthermore, several countries, principally in the Middle East, restrict doing business with Israel and Israeli companies, and additional countries may impose restrictions on doing business with Israel and Israeli companies if hostilities in the region continue or intensify. Any hostilities involving Israel or the interruption or curtailment of trade between Israel and its present trading partners could have a material adverse effect on our business, operating results and financial condition.
Our operations could be disrupted as a result of the obligation of magicJack’s personnel to perform military service.
Several of magicJack’s employees reside in Israel and may be required to perform annual military reserve duty and may be called for active duty under emergency circumstances at any time. Our operations could be disrupted by the absence for a significant period of time of one or more of these employees due to military service. Any such disruption could adversely affect our business, results of operations and financial condition.
The failure of our licensees to sell products that generate royalties to us, to pay us royalties pursuant to their license agreements with us, or to renew these agreements could negatively affect our results of operations and financial condition.
Our revenues are dependent on royalty payments made to us under our license agreements. Although some of our license agreements guarantee a minimum royalty payment to us each year, the failure of our licensees to satisfy these or the other obligations under their agreements with us, their decision to not renew their agreements with us or their inability to grow or maintain their sales of products bearing our brands or their businesses generally could cause our revenues to decline. These events or circumstances could occur for a variety of reasons, many of which are outside our control, including business and operational risks that impact our licensees’ ability to make payments and sell products generally, such as obtaining and maintaining desirable store locations and consumer acceptance and presence; retaining key personnel, including the specific individuals who work on sales and marketing for products bearing our brands; and liquidity and capital resources risks. Further, the failure by any of our key licensees or the concurrent failure by several licensees to meet their financial obligations to us or to renew their respective license agreements with us could materially and adversely impact our results of operations and our financial condition.
43
Our brand investment portfolio is subject to intense competition.
We hold a majority interest in a brand investment portfolio that is focused on generating revenue through the licensing of trademarks. Therefore, our degree of success is dependent on the strength of our brands, consumer acceptance of our brands and our licensees’ ability to design, manufacture and sell products bearing our brands, all of which is dependent on the ability of us and our licensees responding to ever-changing consumer demands. We cannot control the level of consumer acceptance of our brands and changing preferences and trends may lead customers to purchase other products. Further, we cannot control the level of resources that our licensees commit to supporting our brands, and our licensees may choose to support products bearing other brands to the detriment of our brands because our agreements generally do not prevent them from licensing or selling other products, including products bearing competing brands.
In addition, we compete with companies that own other brands and trademarks, as these companies could enter into similar licensing arrangements with retailers and wholesalers in the United States and internationally. These arrangements could be with our existing retail and wholesale partners, thereby competing with us for consumer attention and limited floor or rack space in the same stores in which our branded products are sold, and vying with us for the time and resources of the retailers and wholesale licensees that manufacture and distribute our products. These companies may be able to respond more quickly to changes in retailer, wholesaler and consumer preferences and devote greater resources to brand acquisition, development and marketing. We may not be able to compete effectively against these companies.
If we or our brands are unable to compete successfully against current and future competitors, we may be unable to sustain or increase demand for products bearing our brands, which could have a material adverse effect on our reputation, prospects, performance and financial condition.
Our level of indebtedness, and restrictions under such indebtedness, could adversely affect our operations and liquidity.
Our senior notes include: (a) “the 6.875% 2023 Notes” with an aggregate principal amount of approximately $106.0 million; (b) “the 7.375% 2023 Notes” with an aggregate principal amount of approximately $122.1 million, (c) “the 7.25% 2027 Notes” with an aggregate principal amount of $120.1 million; (d) “the 7.50% 2027 Notes” with an aggregate principal amount of $118.0 million; (e) “2024 Notes” with an aggregate principal amount of approximately $106.6 million; (f) “2026 Notes” with an aggregate principal amount of approximately $124.2 million and (g) 2025 Notes with an aggregate principal amount of approximately $132.3 million. The Company periodically enters into At Market Issuance Sales Agreements with B. Riley FBR. Most recently, the Company entered into the December 2019 Sales Agreement on December 5, 2019 and the February 2020 Sales Agreement on February 14, 2020. Pursuant to the December 2019 Sales Agreement, the Company may sell from time to time, at the Company’s option, up to the aggregate principal amount of $100.0 million of the 6.875% 2023 Notes, 7.375% 2023 Notes, 2024 Notes, 2026 Notes, 7.25% 2027 Notes and 7.50% 2027 Notes, as well as the Company’s common stock and Depositary Shares. At December 31, 2019, the Company had $60.8 million available for offer and sale pursuant to the December 2019 Sales Agreement. Pursuant to the February 2020 Sales Agreement, the Company may sell from time to time, at the Company’s option, up to the aggregate principal amount of $150,000,000 of the 7.25% 2027 Notes, 7.375% 2023 Notes, 6.875% 2023 Notes, 2024 Notes, 2026 Notes, 2025 Notes and Depositary Shares.
On December 19, 2018, BRPI Acquisition Co LLC (“BRPAC”), a Delaware limited liability company, UOL, and YMAX Corporation, a Delaware corporation (collectively, the “Borrowers”), indirect wholly owned subsidiaries of ours, in the capacity of borrowers, entered into a credit agreement with the Banc of California, N.A. in the capacity as agent and lender and with the other lenders party thereto (the “BRPAC Credit Agreement”). Under the BRPAC Credit Agreement, we borrowed $80.0 million due December 19, 2023. Pursuant to the terms of the BRPAC Credit Agreement, we may request additional optional term loans in an aggregate principal amount of up to $10.0 million at any time prior to the first anniversary of the agreement date. On February 1, 2019, the Borrowers entered into the First Amendment to Credit Agreement and Joinder with City National Bank as a new lender in which the new lender extended to Borrowers the additional $10.0 million as further discussed in Note 10 to the accompanying financial statements. In April 2017, we amended our Credit Agreement with Wells Fargo Bank (the “Wells Fargo Credit Agreement”) to increase our retail liquidation line of credit from $100 million to $200 million.
The terms of such indebtedness contain various restrictions and covenants regarding the operation of our business, including, but not limited to, restrictions on our ability to merge or consolidate with or into any other entity. We may also secure additional debt financing in the future in addition to our current debt. Our level of indebtedness generally could adversely affect our operations and liquidity, by, among other things: (i) making it more difficult for us to pay or refinance our debts as they become due during adverse economic and industry conditions because we may not have sufficient cash flows to make our scheduled debt payments; (ii) causing us to use a larger portion of our cash flows to fund interest and principal payments, thereby reducing the availability of cash to fund working capital, capital expenditures and other business activities; (iii) making it more difficult for us to take advantage of significant business opportunities, such as acquisition opportunities or other strategic transactions, and to react to changes in market or industry conditions; and (iv) limiting our ability to borrow additional monies in the future to fund working capital, capital expenditures, acquisitions and other general corporate purposes as and when needed, which could force us to suspend, delay or curtail business prospects, strategies or operations.
We may not be able to generate sufficient cash flow to pay the interest on our debt, and future working capital, borrowings or equity financing may not be available to pay or refinance such debt. If we are unable to generate sufficient cash flow to pay the interest on our debt, we may have to delay or curtail our operations. If we are unable to service our indebtedness, we will be forced to adopt an alternative strategy that may include actions such as reducing capital expenditures, selling assets, restructuring or refinancing our indebtedness or seeking additional equity capital. These alternative strategies may not be affected on satisfactory terms, if at all, and they may not yield sufficient funds to make required payments on our indebtedness. If, for any reason, we are unable to meet our debt service and repayment obligations, we would be in default under the terms of the agreements governing our debt, which could allow our creditors at that time to declare certain outstanding indebtedness to be due and payable or exercise other available remedies, which may in turn trigger cross acceleration or cross default rights in other agreements. If that should occur, we may not be able to pay all such debt or to borrow sufficient funds to refinance it. Even if new financing were then available, it may not be on terms that are acceptable to us.
44
Our senior notes are unsecured and therefore are effectively subordinated to any secured indebtedness that we currently have or that we may incur in the future.
Our senior notes are not secured by any of our assets or any of the assets of our subsidiaries. As a result, our senior notes are effectively subordinated to any secured indebtedness that we or our subsidiaries have currently outstanding or may incur in the future (or any indebtedness that is initially unsecured to which we subsequently grant security) to the extent of the value of the assets securing such indebtedness. The indenture governing our senior notes does not prohibit us or our subsidiaries from incurring additional secured (or unsecured) indebtedness in the future. In any liquidation, dissolution, bankruptcy or other similar proceeding, the holders of any of our existing or future secured indebtedness and the secured indebtedness of our subsidiaries may assert rights against the assets pledged to secure that indebtedness and may consequently receive payment from these assets before they may be used to pay other creditors, including the holders of our senior notes.
Our senior notes are structurally subordinated to the indebtedness and other liabilities of our subsidiaries.
Our senior notes are obligations exclusively of the Company and not of any of our subsidiaries. None of our subsidiaries is a guarantor of our senior notes, and our senior notes are not required to be guaranteed by any subsidiaries we may acquire or create in the future. Therefore, in any bankruptcy, liquidation or similar proceeding, all claims of creditors (including trade creditors) of our subsidiaries will have priority over our equity interests in such subsidiaries (and therefore the claims of our creditors, including holders of our senior notes) with respect to the assets of such subsidiaries. Even if we are recognized as a creditor of one or more of our subsidiaries, our claims would still be effectively subordinated to any security interests in the assets of any such subsidiary and to any indebtedness or other liabilities of any such subsidiary senior to our claims. Consequently, our senior notes will be structurally subordinated to all indebtedness and other liabilities (including trade payables) of any of our subsidiaries and any subsidiaries that we may in the future acquire or establish as financing vehicles or otherwise. The indenture governing our senior notes does not prohibit us or our subsidiaries from incurring additional indebtedness in the future. In addition, future debt and security agreements entered into by our subsidiaries may contain various restrictions, including restrictions on payments by our subsidiaries to us and the transfer by our subsidiaries of assets pledged as collateral.
The indenture under which our senior notes were issued contains limited protection for holders of our senior notes.
The indenture under which our senior notes were issued offers limited protection to holders of our senior notes. The terms of the indenture and our senior notes do not restrict our or any of our subsidiaries’ ability to engage in, or otherwise be a party to, a variety of corporate transactions, circumstances or events that could have an adverse impact on the holders of our senior notes. In particular, the terms of the indenture and our senior notes do not place any restrictions on our or our subsidiaries’ ability to:
| ● | issue debt securities or otherwise incur additional indebtedness or other obligations, including (1) any indebtedness or other obligations that would be equal in right of payment to our senior notes, (2) any indebtedness or other obligations that would be secured and therefore rank effectively senior in right of payment to our senior notes to the extent of the values of the assets securing such debt, (3) indebtedness of ours that is guaranteed by one or more of our subsidiaries and which therefore is structurally senior to our senior notes and (4) securities, indebtedness or obligations issued or incurred by our subsidiaries that would be senior to our equity interests in our subsidiaries and therefore rank structurally senior to our senior notes with respect to the assets of our subsidiaries; |
| ● | pay dividends on, or purchase or redeem or make any payments in respect of, capital stock or other securities subordinated in right of payment to our senior notes; |
| ● | sell assets (other than certain limited restrictions on our ability to consolidate, merge or sell all or substantially all of our assets); |
| ● | enter into transactions with affiliates; |
| ● | create liens (including liens on the shares of our subsidiaries) or enter into sale and leaseback transactions; |
| ● | make investments; or |
| ● | create restrictions on the payment of dividends or other amounts to us from our subsidiaries. |
45
In addition, the indenture does not include any protection against certain events, such as a change of control, a leveraged recapitalization or “going private” transaction (which may result in a significant increase of our indebtedness levels), restructuring or similar transactions. Furthermore, the terms of the indenture and our senior notes do not protect holders of our senior notes in the event that we experience changes (including significant adverse changes) in our financial condition, results of operations or credit ratings, as they do not require that we or our subsidiaries adhere to any financial tests or ratios or specified levels of net worth, revenues, income, cash flow, or liquidity. Also, an event of default or acceleration under our other indebtedness would not necessarily result in an event of default under our senior notes.
Our ability to recapitalize, incur additional debt and take a number of other actions that are not limited by the terms of our senior notes may have important consequences for the holders of our senior notes, including making it more difficult for us to satisfy our obligations with respect to our senior notes or negatively affecting the trading value of our senior notes.
Other debt we issue or incur in the future could contain more protections for its holders than the indenture and our senior notes, including additional covenants and events of default. The issuance or incurrence of any such debt with incremental protections could affect the market for and trading levels and prices of our senior notes.
An increase in market interest rates could result in a decrease in the value of our senior notes.
In general, as market interest rates rise, notes bearing interest at a fixed rate decline in value. Consequently, if the market interest rates increase after our senior notes were purchased, the market value of our senior notes may decline. We cannot predict the future level of market interest rates.
An active trading market for our senior notes may not develop, which could limit the market price of our senior notes or the ability of our senior note holders to sell them.
The 7.25% 2027 Notes are quoted on Nasdaq under the symbol “RILYG,” the 7.50% 2027 Notes are quoted on Nasdaq under the symbol “RILYZ,” the 7.375% 2023 Notes are quoted on Nasdaq under the symbol “RILYH,” the 6.875% 2023 Notes are quoted on Nasdaq under the symbol “RILYI,” the 2024 Notes are quoted on Nasdaq under the symbol “RILYO,” and the 2026 Notes are quoted on Nasdaq under the symbol “RILYN.” We cannot provide any assurances that an active trading market will develop for our senior notes or that our senior note holders will be able to sell their senior notes. If the senior notes are traded after their initial issuance, they may trade at a discount from their initial offering price depending on prevailing interest rates, the market for similar securities, our credit ratings, general economic conditions, our financial condition, performance and prospects and other factors. Accordingly, we cannot assure our senior note holders that a liquid trading market will develop for our senior notes, that our senior note holders will be able to sell our senior notes at a particular time or that the price our senior note holders receive when they sell will be favorable. To the extent an active trading market does not develop, the liquidity and trading price for our senior notes may be harmed. Accordingly, our senior note holders may be required to bear the financial risk of an investment in our senior notes for an indefinite period of time.
We may issue additional notes.
Under the terms of the indenture governing our senior notes, we may from time to time without notice to, or the consent of, the holders of our senior notes, create and issue additional notes which will be equal in rank to our senior notes. We will not issue any such additional notes unless such issuance would constitute a “qualified reopening” for U.S. federal income tax purposes.
The rating for the 7.25% 2027 Notes, 7.375% 2023 Notes, 6.875% 2023 Notes, 2024 Notes, 2026 Notes or 2025 Notes could at any time be revised downward or withdrawn entirely at the discretion of the issuing rating agency.
We have obtained a rating for the 7.25% 2027 Notes, 7.375% 2023 Notes, 6.875% 2023 Notes, 2024 Notes, 2026 Notes and 2025 Notes (collectively, the “Rated Notes”). Ratings only reflect the views of the issuing rating agency or agencies and such ratings could at any time be revised downward or withdrawn entirely at the discretion of the issuing rating agency. A rating is not a recommendation to purchase, sell or hold any of the Rated Notes. Ratings do not reflect market prices or suitability of a security for a particular investor and the rating of the Rated Notes may not reflect all risks related to us and our business, or the structure or market value of the Rated Notes. We may elect to issue other securities for which we may seek to obtain a rating in the future. If we issue other securities with a rating, such ratings, if they are lower than market expectations or are subsequently lowered or withdrawn, could adversely affect the market for or the market value of the Rated Notes.
46
There is no established market for the Depositary Shares and the market value of the Depositary Shares could be substantially affected by various factors.
The Depositary Shares are a new issue of securities with no established trading market. Although the shares recently began trading on the Nasdaq Global Market, an active trading market on the Nasdaq Global Market for the Depositary Shares may not develop or last, in which case the trading price of the Depositary Shares could be adversely affected. If an active trading market does develop on the Nasdaq Global Market, the Depositary Shares may trade at prices higher or lower than their initial offering price. The trading price of the Depositary Shares also depends on many factors, including, but not limited to:
| ● | prevailing interest rates; |
| ● | the market for similar securities; |
| ● | general economic and financial market conditions; and |
| ● | the Company’s financial condition, results of operations and prospects. |
The Company has been advised by some of the underwriters that they intend to make a market in the Depositary Shares, but they are not obligated to do so and may discontinue market-making at any time without notice.
The Series A Preferred Stock and the Depositary Shares rank junior to all of the Company’s indebtedness and other liabilities and are effectively junior to all indebtedness and other liabilities of the Company’s subsidiaries.
In the event of a bankruptcy, liquidation, dissolution or winding-up of the affairs of the Company, the Company’s assets will be available to pay obligations on the 6.875% Series A Cumulative Perpetual Preferred Stock, par value $0.0001 per share (the “Series A Preferred Stock”), only after all of the Company’s indebtedness and other liabilities have been paid. The rights of holders of the Series A Preferred Stock to participate in the distribution of the Company’s assets will rank junior to the prior claims of the Company’s current and future creditors and any future series or class of preferred stock the Company may issue that ranks senior to the Series A Preferred Stock. In addition, the Series A Preferred Stock effectively ranks junior to all existing and future indebtedness and other liabilities of (as well as any preferred equity interests held by others in) the Company’s existing subsidiaries and any future subsidiaries. The Company’s existing subsidiaries are, and any future subsidiaries would be, separate legal entities and have no legal obligation to pay any amounts to the Company in respect of dividends due on the Series A Preferred Stock. If the Company is forced to liquidate its assets to pay its creditors, the Company may not have sufficient assets to pay amounts due on any or all of the Series A Preferred Stock then outstanding. The Company and its subsidiaries have incurred and may in the future incur substantial amounts of debt and other obligations that will rank senior to the Series A Preferred Stock. The Company may incur additional indebtedness and become more highly leveraged in the future, which could harm the Company’s financial position and potentially limit cash available to pay dividends. As a result, the Company may not have sufficient funds remaining to satisfy its dividend obligations relating to the Series A Preferred Stock if the Company incurs additional indebtedness.
Future offerings of debt or senior equity securities may adversely affect the market price of the Depositary Shares. If the Company decides to issue debt or senior equity securities in the future, it is possible that these securities will be governed by an indenture or other instrument containing covenants restricting the Company’s operating flexibility. Additionally, any convertible or exchangeable securities that the Company issues in the future may have rights, preferences and privileges more favorable than those of the Series A Preferred Stock and may result in dilution to owners of the Depositary Shares. The Company and, indirectly, the Company’s shareholders, will bear the cost of issuing and servicing such securities. Because the Company’s decision to issue debt or equity securities in any future offering will depend on market conditions and other factors beyond the Company’s control, the Company cannot predict or estimate the amount, timing or nature of the Company’s future offerings. Thus, holders of the Depositary Shares will bear the risk of the Company’s future offerings reducing the market price of the Depositary Shares and diluting the value of their holdings in the Company.
The Company may issue additional shares of the Series A Preferred Stock and additional series of preferred stock that rank on a parity with the Series A Preferred Stock as to dividend rights, rights upon liquidation or voting rights.
The Company is allowed to issue additional shares of Series A Preferred Stock and additional series of preferred stock that would rank on a parity with the Series A Preferred Stock as to dividend payments and rights upon the Company’s liquidation, dissolution or winding up of the Company’s affairs pursuant to the Company’s articles of incorporation and the certificate of designation for the Series A Preferred Stock without any vote of the holders of the Series A Preferred Stock. The Company’s articles of incorporation authorize the Company to issue up to 1,000,000 shares of preferred stock in one or more series on terms determined by the Company’s Board of Directors. Prior to the issuance of Series A Preferred Stock, the Company had no outstanding series of preferred stock. However, the use of depositary shares enables the Company to issue significant amounts of preferred stock, notwithstanding the number of shares authorized by the Company’s articles of incorporation. The issuance of additional shares of Series A Preferred Stock and additional series of parity preferred stock could have the effect of reducing the amounts available to the Series A Preferred Stockholders upon the Company’s liquidation or dissolution or the winding up of the Company’s affairs. It also may reduce dividend payments on the Series A Preferred Stock issued and outstanding if the Company does not have sufficient funds to pay dividends on all Series A Preferred Stock outstanding and other classes of stock with equal priority with respect to dividends.
47
In addition, although holders of the Depositary Shares are entitled to limited voting rights (discussed further below), the holders of the Depositary Shares will vote separately as a class along with all other outstanding series of the Company’s preferred stock that the Company may issue upon which like voting rights have been conferred and are exercisable. As a result, the voting rights of holders of the Depositary Shares may be significantly diluted, and the holders of such other series of preferred stock that the Company may issue may be able to control or significantly influence the outcome of any vote.
Future issuances and sales of parity preferred stock, or the perception that such issuances and sales could occur, may cause prevailing market prices for the Depositary Shares and the Company’s common stock to decline and may adversely affect the Company’s ability to raise additional capital in the financial markets at times and prices favorable to the Company. Such issuances may also reduce or eliminate the Company’s ability to pay dividends on the Company’s common stock.
Holders of Depositary Shares will have extremely limited voting rights.
The voting rights of holders of Depositary Shares will be limited. The Company’s common stock is the only class of the Company’s securities that carries full voting rights. Voting rights for holders of Depositary Shares will exist primarily with respect to the ability to elect (together with the holders of other outstanding series of the Company’s preferred stock, or Depositary Shares representing interests in the Company’s preferred stock, or additional series of preferred stock the Company may issue in the future and upon which similar voting rights have been or are in the future conferred and are exercisable) two additional directors to the Company’s Board of Directors in the event that six quarterly dividends (whether or not declared or consecutive) payable on the Series A Preferred Stock are in arrears, and with respect to voting on amendments to the Company’s articles of incorporation or certificate of designation (in some cases voting together with the holders of other outstanding series of the Company’s preferred stock as a single class) that materially and adversely affect the rights of the holders of Depositary Shares (and other series of preferred stock, as applicable) or create additional classes or series of the Company’s stock that are senior to the Series A Preferred Stock, provided that in any event adequate provision for redemption has not been made. Other than the limited circumstances described in this prospectus supplement, holders of Depositary Shares will not have any voting rights.
The Depositary Shares have not been rated.
The Series A Preferred Stock and the Depositary Shares have not been rated and may never be rated. It is possible, however, that one or more rating agencies might independently decide to assign a rating to the Depositary Shares or that the Company may elect to obtain a rating of the Depositary Shares in the future. Furthermore, the Company may elect to issue other securities for which the Company may seek to obtain a rating. If any ratings are assigned to the Depositary Shares in the future or if the Company issues other securities with a rating, such ratings, if they are lower than market expectations or are subsequently lowered or withdrawn, could adversely affect the market for, or the market value of, the Depositary Shares.
Ratings reflect the views of the issuing rating agency or agencies, and such ratings could at any time be revised downward, placed on negative outlook or withdrawn entirely at the discretion of the issuing rating agency or agencies. Furthermore, a rating is not a recommendation to purchase, sell or hold any particular security, including the Depositary Shares. Ratings do not reflect market prices or the suitability of a security for a particular investor, and any future rating of the Depositary Shares may not reflect all risks related to the Company and its business, or the structure or market value of the Depositary Shares.
The conversion feature may not adequately compensate the holders, and the conversion and redemption features of the Series A Preferred Stock and the Depositary Shares may make it more difficult for a party to take over the Company and may discourage a party from taking over the Company.
Upon the occurrence of a Delisting Event or Change of Control (each as defined in the certificate of designation for the Series A Preferred Stock), holders of the Depositary Shares will have the right (unless, prior to the Delisting Event Conversion Date or Change of Control Conversion Date (each as defined in the certificate of designation for the Series A Preferred Stock), as applicable, the Company has provided or provide notice of the Company’s election to redeem the Series A Preferred Stock) to direct the depositary to convert some or all of the Series A Preferred Stock underlying their Depositary Shares into the Company’s common stock (or equivalent value of alternative consideration), and under these circumstances the Company will also have a special optional redemption right to redeem the Series A Preferred Stock. Upon such a conversion, the holders will be limited to a maximum number of shares of the Company’s common stock equal to the Share Cap (as defined in the certificate of designation for the Series A Preferred Stock) multiplied by the number of shares of Series A Preferred Stock converted. If the Common Stock Price is less than $11.49 (which is approximately 50% of the closing sale price per share of the Company’s common stock on October 1, 2019), subject to adjustment, the holders will receive a maximum number of shares of the Company’s common stock per depositary share, which may result in a holder receiving value that is less than the liquidation preference of the Depositary Shares. In addition, those features of the Series A Preferred Stock and Depositary Shares may have the effect of inhibiting a third party from making an acquisition proposal for the Company or of delaying, deferring or preventing a change of control of the Company under circumstances that otherwise could provide the holders of the Company’s common stock and Depositary Shares with the opportunity to realize a premium over the then-current market price or that shareholders may otherwise believe is in their best interests.
48
The market price of the Depositary Shares could be substantially affected by various factors.
The market price of the Depositary Shares will depend on many factors, which may change from time to time, including:
| ● | prevailing interest rates, increases in which may have an adverse effect on the market price of the Depositary Shares; |
| ● | the annual yield from distributions on the Depositary Shares as compared to yields on other financial instruments; |
| ● | general economic and financial market conditions; |
| ● | government action or regulation; |
| ● | the financial condition, performance and prospects of the Company and its competitors; |
| ● | changes in financial estimates or recommendations by securities analysts with respect to the Company, its competitors or the industry in which the Company operates; |
| ● | the Company’s issuance of additional preferred equity or debt securities; and |
| ● | actual or anticipated variations in quarterly operating results of the Company and its competitors. |
As a result of these and other factors, investors who purchase the Depositary Shares may experience a decrease, which could be substantial and rapid, in the market price of the Depositary Shares, including decreases unrelated to the Company’s operating performance or prospects.
Item 1B. UNRESOLVED STAFF COMMENTS
None.
49
Our headquarters are located in Woodland Hills, California in a leased facility. The following table sets forth the location and use of each of our properties, all of which are leased as of December 31, 2019.
| Location | Use | |
| Woodland Hills, California | Headquarters; Accounting, Information Technology and Human Resources offices; Appraisal, Auction and Liquidation and Principal Investments offices - United Online | |
| Chicago, Illinois | Appraisal, Capital Markets offices | |
| Dallas, Texas | Appraisal, Auction & Liquidation, Capital Markets | |
| Needham, Massachusetts | Appraisal offices | |
| Winston-Salem, North Carolina | Appraisal offices | |
| New York, New York | Appraisal, Capital Markets, Wealth Management, and Legal offices | |
| Sydney, Australia | Auction & Liquidation offices | |
| Asbury Park, New Jersey | Capital Markets offices | |
| Arlington, Virginia | Capital Markets offices | |
| Atlanta, Georgia | Capital Markets offices | |
| Auburn, Alabama | Capital Markets offices | |
| Bakersfield, California | Capital Markets offices | |
| Beachwood, Ohio | Capital Markets offices | |
| Boston, Massachusetts | Capital Markets offices | |
| Brighton, Michigan | Capital Markets offices | |
| Charlotte, North Carolina | Capital Markets offices | |
| Costa Mesa, California | Capital Markets offices | |
| Denver, Colorado | Capital Markets offices | |
| Devon, Pennsylvania | Capital Markets offices | |
| East Lansing, Michigan | Capital Markets offices | |
| Fort Lauderdale, Florida | Capital Markets offices | |
| Franklin, Tennessee | Capital Markets, and Principal Investments offices - magicJack | |
| Irvine, California | Capital Markets offices | |
| Houston, Texas | Capital Markets offices | |
| Huntersville, North Carolina | Capital Markets offices | |
| Kansas City, Missouri | Capital Markets offices | |
| Lafayette, Louisiana | Capital Markets offices | |
| Los Angeles, California | Capital Markets offices | |
| Memphis, Tennessee | Capital Markets offices, Information Technology | |
| Miami, Florida | Capital Markets offices | |
| Nashville, Tennessee | Capital Markets offices | |
| New Canaan, Connecticut | Capital Markets offices | |
| Norwalk, Connecticut | Capital Markets offices | |
| Oberlin, Ohio | Capital Markets offices | |
| Orlando, Florida | Capital Markets offices | |
| Palatine, Illinois | Capital Markets offices | |
| Parsippany, New Jersey | Capital Markets offices | |
| Phoenix, Arizona | Capital Markets offices | |
| Plymouth, Michigan | Capital Markets offices | |
| San Francisco, California | Capital Markets offices | |
| St. Louis, Missouri | Capital Markets offices | |
| Tampa, Florida | Capital Markets offices | |
| Tulsa, Oklahoma | Capital Markets offices | |
| West Palm Beach, Florida | Capital Markets offices, and Principal Investments offices - magicJack | |
| Wilton, Connecticut | Capital Markets offices | |
| Netanya, Israel | Principal Investments offices - magicJack | |
| Plano, Texas | Principal Investments offices - magicJack | |
| Hyderabad, India | Principal Investments offices - United Online |
We believe that our existing facilities are suitable and adequate for the business conducted therein, appropriately used and have sufficient capacity for their intended purpose.
50
The Company is subject to certain legal and other claims that arise in the ordinary course of its business. In particular, the Company and its subsidiaries are named in and subject to various proceedings and claims arising primarily from our securities business activities, including lawsuits, arbitration claims, class actions, and regulatory matters. Some of these claims seek substantial compensatory, punitive, or indeterminate damages. The Company and its subsidiaries are also involved in other reviews, investigations, and proceedings by governmental and self-regulatory organizations regarding our business, which may result in adverse judgments, settlements, fines, penalties, injunctions, and other relief. In view of the number and diversity of claims against our company, the number of jurisdictions in which litigation is pending, and the inherent difficulty of predicting the outcome of litigation and other claims, we cannot state with certainty what the eventual outcome of pending litigation or other claims will be. Notwithstanding this uncertainty, the Company does not believe that the results of these claims are likely to have a material effect on its financial position or results of operations.
On August 11, 2017, a putative class action lawsuit titled Freedman v. magicJack VocalTec Ltd. et al., Case 9-17-cv-80940, was filed against magicJack and its Board of Directors in the United States District Court for the Southern District of Florida (Case No: 9:17-cv-80940-RLR). Oral arguments were held on for January 17, 2020 and the Company is awaiting the court’s decision. The Company cannot estimate the amount of potential liability, if any, that could arise from this matter.
On January 5, 2017, complaints filed in November 2015 and May 2016 naming MLV & Co. (“MLV”), a broker-dealer subsidiary of FBR, as a defendant in putative class action lawsuits alleging claims under the Securities Act, in connection with the offerings of Miller Energy Resources, Inc. (“Miller”) have been consolidated. The Master Consolidated Complaint, styled Gaynor v. Miller et al., is pending in the United States District Court for the Eastern District of Tennessee, and, like its predecessor complaints, continues to allege claims under Sections 11 and 12 of the Securities Act against nine underwriters for alleged material misrepresentations and omissions in the registration statement and prospectuses issued in connection with six offerings (February 13, 2013; May 8, 2013; June 28, 2013; September 26, 2013; October 17, 2013 (as to MLV only) and August 21, 2014) with an alleged aggregate offering price of approximately $151 million. Court-ordered mediation before a federal magistrate took place on August 6, 2019, with no resolution. In December 2019, the Court lifted the stay on the proceedings (pending mediation) and remanded the case to state court.
Item 4. MINE SAFETY DISCLOSURES
Not applicable.
51
Item 5. MARKET FOR REGISTRANT’S COMMON EQUITY, RELATED STOCKHOLDER MATTERS AND ISSUER PURCHASES OF EQUITY SECURITIES
Stock Market and Other Information
Our common stock is traded on the NASDAQ Global Market under the symbol: “RILY”. From July 16, 2015 to November 15, 2016, our common stock was traded on the NASDAQ Capital Market under the symbol “RILY”. Prior to July 16, 2015, our common stock was traded on the OTC Bulletin Board under the symbol “RILY” from November 7, 2014 to July 16, 2015.
As of February 27, 2020, there were approximately 146 holders of record of our Common Stock. This number does not include beneficial owners holding shares through nominees or in “street” name.
Dividend Policy
From time to time, we may decide to pay dividends which will be dependent upon our financial condition and results of operations. On March 3, 2020, we declared a regular dividend of $0.25 per share and special dividend of $0.10 per share that will be paid on or about March 31, 2020 to stockholders of record as of March 17, 2020. During the years ended December 31, 2019 and 2018, we paid cash dividends on our common stock of $41.1 million and $22.7 million, respectively. On August 1, 2019, the Board of Directors announced an increase to the regular quarterly dividend from $0.08 per share to $0.175 per share. While it is the Board’s current intention to make regular dividend payments of $0.175 per share each quarter and special dividend payments dependent upon exceptional circumstances from time to time, our Board of Directors may reduce or discontinue the payment of dividends at any time for any reason it deems relevant. The declaration and payment of any future dividends or repurchases of our common stock will be made at the discretion of our Board of Directors and will be dependent upon our financial condition, results of operations, cash flows, capital expenditures, and other factors that may be deemed relevant by our Board of Directors.
A summary of dividend activity for the years ended December 31, 2019 and 2018 was as follows:
| Regular | Special | Total | ||||||||||||||
| Stockholder | Dividend | Dividend | Dividend | |||||||||||||
| Date Declared | Date Paid | Record Date | Amount | Amount | Amount | |||||||||||
| October 30, 2019 | November 26, 2019 | November 14, 2019 | $ | 0.175 | $ | 0.475 | $ | 0.650 | ||||||||
| August 1, 2019 | August 29, 2019 | August 15, 2019 | 0.175 | 0.325 | 0.500 | |||||||||||
| May 1, 2019 | May 29, 2019 | May 15, 2019 | 0.08 | 0.18 | 0.26 | |||||||||||
| March 5, 2019 | March 26, 2019 | March 19, 2019 | 0.08 | 0.00 | 0.08 | |||||||||||
| November 5, 2018 | November 27, 2018 | November 16, 2018 | 0.08 | 0.08 | 0.16 | |||||||||||
| August 2, 2018 | August 29, 2018 | August 16, 2018 | 0.08 | 0.22 | 0.30 | |||||||||||
| May 7, 2018 | June 5, 2018 | May 21, 2018 | 0.08 | 0.04 | 0.12 | |||||||||||
| March 7, 2018 | April 3, 2018 | March 20, 2018 | 0.08 | 0.08 | 0.16 | |||||||||||
Holders of Series A Preferred Stock, when and as authorized by the board of directors of the Company, are entitled to cumulative cash dividends at the rate of 6.875% per annum of the $25,000 liquidation preference ($25.00 per Depositary Share) per year (equivalent to $1,718.75 or $1.71875 per Depositary Share). Dividends will be payable quarterly in arrears, on or about the last day of January, April, July and October. On October 15, 2019, the Company declared a cash dividend of $0.11458333 per Depositary Share. The dividend was paid on October 31, 2019 to holders of record as of the close of business on October 21, 2019. On January 9, 2020, the Company declared a cash dividend representing $0.4296875 per Depositary Share, which was paid on January 31, 2020 to holders of record as of the close of business on January 21, 2020.
52
Share Performance Graph
The following graph compares the cumulative total shareholder return on our common share with the cumulative total return on the Russell 2000 Index and a peer group index for the period from December 31, 2014 to December 31, 2019. The graph and table below assume that $100 was invested on the starting date and dividends, if any, were reinvested on the date of payment without payment of any commissions. The performance shown in the graph and table represents past performance and should not be considered an indication of future performance.
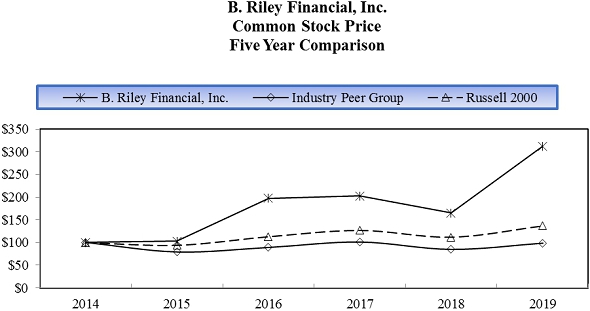
| As of December 31, | 2014 | 2015 | 2016 | 2017 | 2018 | 2019 | ||||||||||||||||||
| B. Riley Financial, Inc. | $ | 100 | $ | 103 | $ | 198 | $ | 203 | $ | 165 | $ | 312 | ||||||||||||
| Russell 2000 | $ | 100 | $ | 94 | $ | 113 | $ | 127 | $ | 112 | $ | 137 | ||||||||||||
| Industry Peer Group | $ | 100 | $ | 79 | $ | 89 | $ | 101 | $ | 85 | $ | 98 | ||||||||||||
Our peer group index includes the following companies: Cowen Group, Inc.; JMP Group LLC; Oppenheimer Holdings Inc.; and Stifel Financial Corp. These companies were selected because their businesses and operations were comparable to ours throughout or for some portion of the five-year period presented in the chart above.
The information provided above under the heading “Share Performance Graph” shall not be considered “filed” for purposes of Section 18 of the Exchange Act or incorporated by reference in any filing under the Securities Act of 1933, as amended or the Exchange Act.
53
Item 6. SELECTED FINANCIAL DATA
The following table sets forth our selected consolidated financial data as of and for each of the five fiscal years ended December 31, 2019, and is derived from our Consolidated Financial Statements. The Consolidated Financial Statements as of December 31, 2019 and 2018, and for each of the years in the three-year period ended December 31, 2019, are included elsewhere in this report. The following data should be read in conjunction with “Management’s Discussion and Analysis of Financial Condition and Results of Operations” and the Consolidated Financial Statements and Notes thereto included elsewhere in this report.
Consolidated Statement of Operations Data:
(Dollars in thousands, except share data)
| Year Ended December 31, | ||||||||||||||||||||
| 2019 | 2018 | 2017 | 2016 | 2015 | ||||||||||||||||
| Revenues: | ||||||||||||||||||||
| Services and fees | $ | 566,956 | $ | 384,076 | $ | 302,113 | $ | 164,227 | $ | 101,929 | ||||||||||
| Interest income - Loans and securities lending | 77,221 | 38,277 | 19,756 | 8 | — | |||||||||||||||
| Sale of goods | 7,935 | 638 | 307 | 26,116 | 10,596 | |||||||||||||||
| Total revenues | 652,112 | 422,991 | 322,176 | 190,351 | 112,525 | |||||||||||||||
| Operating expenses: | ||||||||||||||||||||
| Direct cost of services | 58,824 | 34,754 | 40,625 | 26,874 | 15,489 | |||||||||||||||
| Cost of goods sold | 7,575 | 800 | 398 | 14,755 | 3,072 | |||||||||||||||
| Selling, general and administrative expenses | 385,219 | 310,508 | 227,884 | 96,110 | 71,882 | |||||||||||||||
| Restructuring charge | 1,699 | 8,506 | 12,374 | 3,887 | — | |||||||||||||||
| Interest expense - Securities lending and loan participations sold | 32,144 | 23,039 | 12,051 | — | — | |||||||||||||||
| Total operating expenses | 485,461 | 377,607 | 293,332 | 141,626 | 90,443 | |||||||||||||||
| Operating income | 166,651 | 45,384 | 28,844 | 48,725 | 22,082 | |||||||||||||||
| Other income (expense): | ||||||||||||||||||||
| Interest income | 1,577 | 1,326 | 420 | 318 | 17 | |||||||||||||||
| (Loss) income from equity investments | (1,431 | ) | 7,986 | (437 | ) | — | — | |||||||||||||
| Interest expense | (50,205 | ) | (33,393 | ) | (8,382 | ) | (1,996 | ) | (834 | ) | ||||||||||
| Income before income taxes | 116,592 | 21,303 | 20,445 | 47,047 | 21,265 | |||||||||||||||
| Provision for income taxes | (34,644 | ) | (4,903 | ) | (8,510 | ) | (14,321 | ) | (7,688 | ) | ||||||||||
| Net income | 81,948 | 16,400 | 11,935 | 32,726 | 13,577 | |||||||||||||||
| Net income attributable to noncontrolling interests | 337 | 891 | 379 | 11,200 | 1,772 | |||||||||||||||
| Net income attributable to B. Riley Financial, Inc. | 81,611 | 15,509 | 11,556 | 21,526 | 11,805 | |||||||||||||||
| Preferred stock dividends | 264 | — | — | — | — | |||||||||||||||
| Net income available to common shareholders | $ | 81,347 | $ | 15,509 | $ | 11,556 | $ | 21,526 | $ | 11,805 | ||||||||||
| Basic income per common share | $ | 3.08 | $ | 0.60 | $ | 0.50 | $ | 1.19 | $ | 0.73 | ||||||||||
| Diluted income per common share | $ | 2.95 | $ | 0.58 | $ | 0.48 | $ | 1.17 | $ | 0.73 | ||||||||||
| Weighted average basic common shares outstanding | 26,401,036 | 25,937,305 | 23,181,388 | 18,106,621 | 16,221,040 | |||||||||||||||
| Weighted average diluted common shares outstanding | 27,529,157 | 26,764,856 | 24,290,904 | 18,391,852 | 16,265,915 | |||||||||||||||
Consolidated Balance Sheet Data:
(Dollars in thousands)
| As of December 31, | ||||||||||||||||||||
| 2019 | 2018 | 2017 | 2016 | 2015 | ||||||||||||||||
| Cash and cash equivalents | $ | 104,268 | $ | 179,440 | $ | 132,823 | $ | 112,105 | $ | 30,012 | ||||||||||
| Restricted cash | 471 | 838 | 19,711 | 3,294 | 51 | |||||||||||||||
| Securities and other investments owned, at fair value | 451,551 | 273,577 | 145,360 | 16,579 | 25,543 | |||||||||||||||
| Total assets | 2,318,178 | 1,957,710 | 1,386,904 | 264,618 | 132,420 | |||||||||||||||
| Total liabilities | 1,927,927 | 1,699,050 | 1,121,058 | 114,226 | 23,100 | |||||||||||||||
| Total equity | 390,251 | 258,660 | 265,846 | 150,392 | 109,320 | |||||||||||||||
54
Item 7. MANAGEMENT’S DISCUSSION AND ANALYSIS OF FINANCIAL CONDITION AND RESULTS OF OPERATIONS
This report contains forward-looking statements. These statements relate to future events or our future financial performance. In some cases, you can identify forward-looking statements by terminology such as “may,” “will,” “should,” “could,” “expect,” “plan,” “anticipate,” “believe,” “estimate,” “predict,” “future,” “intend,” “seek,” “likely,” “potential” or “continue,” the negative of such terms or other comparable terminology. These statements are only predictions. Actual events or results may differ materially.
Although we believe that the expectations reflected in the forward-looking statements are reasonable, we cannot guarantee future results, levels of activity, performance or achievements. Moreover, neither we, nor any other person, assume responsibility for the accuracy and completeness of the forward-looking statements. Except as required by law we are under no obligation to update any of the forward-looking statements after the filing of this Annual Report to conform such statements to actual results or to changes in our expectations.
The following discussion of our financial condition and results of operations should be read in conjunction with our consolidated financial statements and the related notes and other financial information appearing elsewhere in this Annual Report. Readers are also urged to carefully review and consider the various disclosures made by us which attempt to advise interested parties of the factors which affect our business, including without limitation the disclosures made in Item 1A of Part II of this Annual Report under the caption “Risk Factors.”
Risk factors that could cause actual results to differ from those contained in the forward-looking statements include but are not limited to risks related to: volatility in our revenues and results of operations; changing conditions in the financial markets; our ability to generate sufficient revenues to achieve and maintain profitability; our exposure to credit risk; the short term nature of our engagements; the accuracy of our estimates and valuations of inventory or assets in “guarantee” based engagements; competition in the asset management business; potential losses related to our auction or liquidation engagements; our dependence on communications, information and other systems and third parties; potential losses related to purchase transactions in our auction and liquidations business; the potential loss of financial institution clients; potential losses from or illiquidity of our proprietary investments; changing economic and market conditions; potential liability and harm to our reputation if we were to provide an inaccurate appraisal or valuation; potential mark-downs in inventory in connection with purchase transactions; failure to successfully compete in any of our segments; loss of key personnel; our ability to borrow under our credit facilities or at-the-market offering as necessary; failure to comply with the terms of our credit agreements or senior notes; our ability to meet future capital requirements; our ability to realize the benefits of our completed acquisitions, including our ability to achieve anticipated opportunities and operating cost savings, and accretion to reported earnings estimated to result from completed and proposed acquisitions in the time frame expected by management or at all; the diversion of management time on acquisition- related issues; the failure of our brand investment portfolio licensees to pay us royalties; and the intense competition to which our brand investment portfolio is subject. We undertake no obligation to publicly update or revise any forward-looking statements, whether as a result of new information, future events or otherwise.
Except as otherwise required by the context, references in this Annual Report to the “Company,” “B. Riley,” “B. Riley Financial,” “we,” “us” or “our” refer to the combined business of B. Riley Financial, Inc. and all of its subsidiaries.
Overview
General
B. Riley Financial, Inc. (NASDAQ: RILY) and its subsidiaries provide collaborative financial services and solutions through several operating subsidiaries including:
| ● | B. Riley FBR, Inc. (“B. Riley FBR”) is a leading, full service investment bank providing financial advisory, corporate finance, research, securities lending and sales and trading services to corporate, institutional and high net worth individual clients. B. Riley FBR was formed in November 2017 through the merger of B. Riley & Co, LLC and FBR Capital Markets & Co. (“FBR”), which the Company acquired in June 2017; the name of the combined broker dealer was subsequently changed to B. Riley FBR, Inc. |
| ● | B. Riley Wealth Management, Inc. (“B. Riley Wealth Management”) provides comprehensive wealth management and brokerage services to individuals and families, corporations and non-profit organizations, including qualified retirement plans, trusts, foundations and endowments. B. Riley Wealth Management was formerly Wunderlich Securities, Inc., which the Company acquired on July 3, 2017 and renamed in June 2018. |
55
| ● | B. Riley Capital Management, LLC, a Securities and Exchange Commission (“SEC”) registered investment advisor, which includes: |
| o | B. Riley Asset Management, an advisor to certain private funds and to institutional and high net worth investors; |
| o | Great American Capital Partners, LLC (“GACP”), the general partner of two private funds, GACP I, L.P. and GACP II, L.P., both direct lending funds that provide senior secured loans and second lien secured loan facilities to middle market public and private U.S. companies. |
| ● | GlassRatner Advisory & Capital Group LLC (“GlassRatner”), a specialty financial advisory services firm that provides consulting services to shareholders, creditors and companies, including due diligence, fraud investigations, corporate litigation support, crisis management and bankruptcy services. We acquired GlassRatner on August 1, 2018. GlassRatner strengthens B. Riley’s diverse platform and compliments the restructuring services provided by B. Riley FBR. |
| ● | Great American Group, LLC (“Great American Group”), a leading provider of asset disposition and auction solutions to a wide range of retail and industrial clients. |
| ● | Great American Group Advisory and Valuation Services, LLC, a leading provider of appraisal and valuation services for asset based lenders, private equity firms and corporate clients. |
We also pursue a strategy of investing in or acquiring companies which we believe have attractive investment return characteristics. We acquired United Online, Inc. (“UOL” or “United Online”) on July 1, 2016 and magicJack VocalTec Ltd. (“magicJack”) on November 14, 2018 as part of our principal investment strategy.
| ● | UOL is a communications company that offers consumer subscription services and products, consisting of Internet access services and devices under the NetZero and Juno brands primarily sold in the United States. |
| ● | magicJack is a Voice over IP (“VoIP”) cloud-based technology and services communications provider. |
BR Brand, in which the company owns a majority interest, provides licensing of a brand investment portfolio. BR Brand owns the assets and intellectual property related to licenses of six brands: Catherine Malandrino, English Laundry, Joan Vass, Kensie Girl, Limited Too and Nanette Lepore.
We are headquartered in Los Angeles with offices in major cities throughout the United States including New York, Chicago, Boston, Dallas, Memphis, Metro Washington D.C and West Palm Beach.
For financial reporting purposes we classify our businesses into five operating segments: (i) Capital Markets, (ii) Auction and Liquidation, (iii) Valuation and Appraisal, (iv) Principal Investments – United Online and magicJack and (v) Brands.
Capital Markets Segment. Our Capital Markets segment provides a full array of investment banking, corporate finance, consulting, financial advisory, research, securities lending, wealth management and sales and trading services to corporate, institutional and high net worth clients. Our corporate finance and investment banking services include merger and acquisitions as well as restructuring advisory services to public and private companies, initial and secondary public offerings, and institutional private placements. In addition, we trade equity securities as a principal for our account, including investments in funds managed by our subsidiaries. Our Capital Markets segment also includes our asset management businesses that manage various private and public funds for institutional and individual investors.
Auction and Liquidation Segment. Our Auction and Liquidation segment utilizes our significant industry experience, a scalable network of independent contractors and industry-specific advisors to tailor our services to the specific needs of a multitude of clients, logistical challenges and distressed circumstances. Furthermore, our scale and pool of resources allow us to offer our services across North American as well as parts of Europe, Asia and Australia. Our Auction and Liquidation segment operates through two main divisions, retail store liquidations and wholesale and industrial assets dispositions. Our wholesale and industrial assets dispositions division operates through limited liability companies that are controlled by us.
Valuation and Appraisal Segment. Our Valuation and Appraisal segment provides Valuation and Appraisal services to financial institutions, lenders, private equity firms and other providers of capital. These services primarily include the valuation of assets (i) for purposes of determining and monitoring the value of collateral securing financial transactions and loan arrangements and (ii) in connection with potential business combinations. Our Valuation and Appraisal segment operates through limited liability companies that are majority owned by us.
56
Principal Investments - United Online and magicJack Segment. Our Principal Investments - United Online and magicJack segment consists of businesses which have been acquired primarily for attractive investment return characteristics. Currently, this segment includes UOL, through which we provide consumer Internet access, and magicJack, through which we provide VoIP communication and related product and subscription services.
Brands Segment. Our Brands segment consists of our brand investment portfolio that is focused on generating revenue through the licensing of trademarks and is held by BR Brand.
Recent Developments
Securities Offerings
Preferred Stock Offering
On October 7, 2019, we closed our underwritten public offering of Depositary Shares, each representing 1/1000th of a share of Series A Preferred Stock. The liquidation preference of each share of Series A Preferred Stock is $25,000 ($25.00 per Depositary Share). At the closing, we issued 2,000 shares of Series A Preferred Stock represented by 2,000,000 Depositary Shares issued. The offering was conducted pursuant to an underwriting agreement, dated October 2, 2019, by and among us and B. Riley FBR, as representative of the several underwriters named therein. On October 11, 2019, we closed on the issuance of an additional 300,000 additional Depositary Shares pursuant to the full exercise of the underwriters’ over-allotment option. The Depositary Shares were offered pursuant to our September 2019 Shelf Registration.
December 2019 At Market Issuance Sales Agreement
On December 5, 2019, we entered into the December 2019 Sales Agreement with B. Riley FBR, pursuant to which the Company may offer and sell, from time to time, up to $100,000,000 of December 2019 Offered Securities. Sales of the December 2019 Offered Securities pursuant to the Sales Agreement, if any, may be made in transactions that are deemed to be “at the market offerings” as defined in Rule 415 under the Securities Act. B. Riley FBR is not required to sell any specific number of the December 2019 Offered Securities, but B. Riley FBR will make all sales using commercially reasonable efforts consistent with its normal trading and sales practices on mutually agreed terms between B. Riley FBR and the Company. Under the December 2019 Sales Agreement, B. Riley FBR will be entitled to compensation of up to 2.0% of the gross proceeds of all December 2019 Offered Securities sold through it as the Company’s agent.
6.375 Senior Notes due 2025
On February 12, 2020, we closed our underwritten public offering of $132,250,000 aggregate principal amount of 2025 Notes, which included $17.25 million of notes issued pursuant to the full exercise by the underwriters of their overallotment option. The offering was conducted pursuant to an underwriting agreement, dated February 10, 2020, by and among us and B. Riley FBR, as representative of the several underwriters named therein. The 2025 Notes were offered pursuant to the September 2019 Shelf Registration and the Company’s registration statement on Form S-3 (Registration No. 333-236347) filed with the SEC and effective on February 10, 2020.
February 2020 Shelf Registration Statement and At Market Issuance Sales Agreement
On February 14, 2020, we filed the February 2020 Registration Statement, which was declared effective by the SEC on February 24, 2020. Contemporaneously, we entered into the February 2020 Sales Agreement with B. Riley FBR, pursuant to which the Company may offer and sell, from time to time, up to $150,000,000 of February 2020 Offered Securities. Sales of the February 2020 Offered Securities pursuant to the February 2020 Sales Agreement, if any, may be made in transactions that are deemed to be “at the market offerings” as defined in Rule 415 under the Securities Act. B. Riley FBR is not required to sell any specific number of the February 2020 Offered Securities, but February 2020 will make all sales using commercially reasonable efforts consistent with its normal trading and sales practices on mutually agreed terms between B. Riley FBR and the Company. Under the February 2020 Sales Agreement, B. Riley FBR will be entitled to compensation of up to 2.0% of the gross proceeds of all February 2020 Offered Securities sold through it as the Company’s agent.
57
Acquisition of Majority Interest in BR Brand
On October 28, 2019, the Company and the B. Riley Member completed the acquisition of a majority equity interest in BR Brand in exchange for (i) aggregate consideration of $116.5 million in cash and (ii) the issuance by the Company to Bluestar, an affiliate of the manager of BR Brand, of a warrant to purchase up to 200,000 shares of the Company’s Common Stock, par value $0.0001 per share, at an exercise price per share equal to $26.24. One-third of the shares of common stock issuable under the Warrant vested and became exercisable immediately upon its issuance at the Closing, and the remaining two-thirds of such shares of common stock will vest and become exercisable following the first and/or second anniversaries of the closing, subject to BR Brand’s (or another related joint venture with Bluestar) satisfaction of specified financial performance targets. In connection with the closing, the manager of BR Brand caused the transfer to BR Brand of certain trademarks, domain names, license agreements and related assets from existing brand owners. Each of the B. Riley Member and the manager of BR Brand is, as applicable, subject to certain post-closing obligations to indemnify BR Brand for breaches of representations or warranties, covenants certain tax liabilities certain pre-closing liabilities.
Results of Operations
The following period to period comparisons of our financial results and our interim results are not necessarily indicative of future results.
Year Ended December 31, 2019 Compared to Year Ended December 31, 2018
Consolidated Statements of Income
(Dollars in thousands)
| Year Ended December 31, 2019 |
Year Ended December 31, 2018 |
Change | ||||||||||||||||||||||
| Amount | % | Amount | % | Amount | % | |||||||||||||||||||
| Revenues: | ||||||||||||||||||||||||
| Services and fees | $ | 566,956 | 86.9 | % | $ | 384,076 | 90.8 | % | $ | 182,880 | 47.6 | % | ||||||||||||
| Interest income - Loans and securities lending | 77,221 | 11.8 | % | 38,277 | 9.0 | % | 38,944 | 101.7 | % | |||||||||||||||
| Sale of goods | 7,935 | 1.2 | % | 638 | 0.2 | % | 7,297 | n/m | ||||||||||||||||
| Total revenues | 652,112 | 100.0 | % | 422,991 | 100.0 | % | 229,121 | 54.2 | % | |||||||||||||||
| Operating expenses: | ||||||||||||||||||||||||
| Direct cost of services | 58,824 | 9.0 | % | 34,754 | 8.2 | % | 24,070 | 69.3 | % | |||||||||||||||
| Cost of goods sold | 7,575 | 1.2 | % | 800 | 0.2 | % | 6,775 | 846.9 | % | |||||||||||||||
| Selling, general and administrative expenses | 385,219 | 59.1 | % | 310,508 | 73.4 | % | 74,711 | 24.1 | % | |||||||||||||||
| Restructuring charge | 1,699 | 0.3 | % | 8,506 | 2.0 | % | (6,807 | ) | (80.0 | )% | ||||||||||||||
| Interest expense - Securities lending and loan participations sold | 32,144 | 4.9 | % | 23,039 | 5.4 | % | 9,105 | 39.5 | % | |||||||||||||||
| Total operating expenses | 485,461 | 74.5 | % | 377,607 | 89.2 | % | 107,854 | 28.6 | % | |||||||||||||||
| Operating income | 166,651 | 25.6 | % | 45,384 | 10.7 | % | 121,267 | 267.2 | % | |||||||||||||||
| Other income (expense): | ||||||||||||||||||||||||
| Interest income | 1,577 | 0.2 | % | 1,326 | 0.3 | % | 251 | 18.9 | % | |||||||||||||||
| (Loss) income on equity investments | (1,431 | ) | (0.2 | )% | 7,986 | 1.9 | % | (9,417 | ) | (117.9 | )% | |||||||||||||
| Interest expense | (50,205 | ) | (7.7 | )% | (33,393 | ) | (7.9 | )% | (16,812 | ) | 50.3 | % | ||||||||||||
| Income before income taxes | 116,592 | 17.9 | % | 21,303 | 5.0 | % | 95,289 | 447.3 | % | |||||||||||||||
| Provision for income taxes | (34,644 | ) | (5.3 | )% | (4,903 | ) | (1.2 | )% | (29,741 | ) | 606.6 | % | ||||||||||||
| Net income | 81,948 | 12.6 | % | 16,400 | 3.9 | % | 65,548 | 399.7 | % | |||||||||||||||
| Net income attributable to noncontrolling interests | 337 | 0.1 | % | 891 | 0.2 | % | (554 | ) | (62.2 | )% | ||||||||||||||
| Net income attributable to B. Riley Financial, Inc. | 81,611 | 12.5 | % | 15,509 | 3.7 | % | 66,102 | 426.2 | % | |||||||||||||||
| Preferred stock dividends | 264 | 0.0 | % | — | 0.0 | % | 264 | n/m | ||||||||||||||||
| Net income available to common shareholders | $ | 81,347 | 12.5 | % | $ | 15,509 | 3.7 | % | $ | 65,838 | 424.5 | % | ||||||||||||
n/m - Not applicable or not meaningful.
58
Revenues
The table below and the discussion that follows are based on how we analyze our business.
| Year Ended | Year Ended | |||||||||||||||||||||||
| December 31, 2019 | December 31, 2018 | Change | ||||||||||||||||||||||
| Amount | % | Amount | % | Amount | % | |||||||||||||||||||
| Revenues - Services and fees: | ||||||||||||||||||||||||
| Capital Markets segment | $ | 408,637 | 62.7 | % | $ | 236,789 | 56.0 | % | $ | 171,848 | 72.6 | % | ||||||||||||
| Auction and Liquidation segment | 18,296 | 2.8 | % | 54,923 | 13.0 | % | (36,627 | ) | (66.7 | )% | ||||||||||||||
| Valuation and Appraisal segment | 38,821 | 6.0 | % | 38,705 | 9.2 | % | 116 | 0.3 | % | |||||||||||||||
| Principal Investments - United Online and magicJack segment | 97,147 | 14.9 | % | 53,659 | 12.7 | % | 43,488 | 81.0 | % | |||||||||||||||
| Brands | 4,055 | 0.6 | % | — | 0.0 | % | 4,055 | n/m | ||||||||||||||||
| Subtotal | 566,956 | 86.9 | % | 384,076 | 90.8 | % | 182,880 | 47.6 | % | |||||||||||||||
| Revenues - Sale of goods | ||||||||||||||||||||||||
| Auction and Liquidation segment | 4,220 | 0.6 | % | 63 | 0.0 | % | 4,157 | n/m | ||||||||||||||||
| Principal Investments - United Online and magicJack segment | 3,715 | 0.6 | % | 575 | 0.1 | % | 3,140 | n/m | ||||||||||||||||
| Subtotal | 7,935 | 1.2 | % | 638 | 0.2 | % | 7,297 | n/m | ||||||||||||||||
| Interest income - Loans and securities lending: | ||||||||||||||||||||||||
| Capital Markets segment | 77,221 | 11.8 | % | 38,277 | 9.0 | % | 38,944 | 101.7 | % | |||||||||||||||
| Total revenues | $ | 652,112 | 100.0 | % | $ | 422,991 | 100.0 | % | $ | 229,121 | 54.2 | % | ||||||||||||
n/m - Not applicable or not meaningful.
Total revenues increased approximately $229.1 million to $652.1 million during the year ended December 31, 2019 from $423.0 million during the year ended December 31, 2018. The increase in revenues during the year ended December 31, 2019 was primarily due to an increase in revenue from services and fees of $182.9 million, an increase in revenue from interest income — loans and securities lending of $38.9 million and increase in revenue from sale of goods of $7.3 million. The increase in revenue from services and fees of $182.9 million in 2019 was primarily due to an increase in revenue of $171.8 million in the Capital Markets segment, $0.1 million in the Valuation and Appraisal segment, $43.5 million in the Principal Investments — United Online and magicJack segment and $4.1 million in the Brands segment, partially offset by a decrease of $36.6 million in the Auction and Liquidation segment,.
Revenues from services and fees in the Capital Markets segment increased approximately $171.8 million, to $408.6 million during the year ended December 31, 2019 from $236.8 million during the year ended December 31, 2018. The increase in revenues was primarily due to an increase in revenue of $115.0 million from trading gains, an increase in revenue of $24.8 million from consulting fees primarily as a result of the acquisition of GlassRatner on August 1, 2018, an increase in investment banking fees of $24.2 million and an increase in asset management fees and carried interest of $10.3 million. The $115.0 million increase in trading gains includes realized and unrealized amounts earned on investments made in our proprietary trading account. Investments made in our proprietary trading account has increased from $273.6 million at December 31, 2018 to $451.6 million at December 31, 2019.
Revenues from services and fees in the Auction and Liquidation segment decreased $36.6 million, to $18.3 million during the year ended December 31, 2019 from $54.9 million during the year ended December 31, 2018. The decrease in revenues of $36.6 million was primarily due to a decrease in revenues of $31.8 million from services and fees related to retail liquidation engagements and a decrease in revenues of $2.5 million from services and fees in our wholesale and industrial auction division. The $31.8 million decrease in revenues from retail liquidation engagements was caused by a retail engagement loss incurred for a contract entered into during the fourth quarter of 2019 to liquidate the assets of a retailer where the funds advanced exceed the expected recovery.
Revenues from services and fees in the Valuation and Appraisal segment increased $0.1 million, to $38.8 million during the year ended December 31, 2019 from $38.7 million during the year ended December 31, 2018. The increase in revenues in the Valuation and Appraisal segment is primarily due to an increase in revenues for appraisal engagements where we perform valuations for the monitoring of collateral for financial institutions, lenders, and private equity investors.
Revenues from services and fees in the Principal Investments - United Online and magicJack segment increased $43.5 million to $97.1 million year ended December 31, 2019 from $53.7 million during the year ended December 31, 2018. The increase in revenues from services and fees is a result of the acquisition of magicJack on November 14, 2018 in the segment for the full year ended December 31, 2019 which increased revenue $53.3 million from the year ended December 31, 2018. This increase was partially offset by a decrease in services and fees revenue from UOL of $9.8 million. Management expects revenues from UOL continue to decline year over year. The primary source of revenue included in this segment is subscription services revenue and some advertising and other revenues.
59
Revenues from services and fees in the Brands segment were $4.1 million for the year ended December 31, 2019. We established the Brands segment in 2019 following the acquisition of a majority interest in BR Brands on October 28, 2019. The primary source of revenue included in this segment is the licensing of trademarks.
Interest income – loans and securities lending increased $38.9 million, to $77.2 million during the year ended December 31, 2019 from $38.3 million during the year ended December 31, 2018. Interest income from securities lending was $40.2 million and $31.8 million during the year ended December 31, 2019 and 2018, respectively. Interest income from loans was $34.6 million and $6.5 million during the year ended December 31, 2019 and 2018, respectively. The increase in interest income on loans was primarily due to the increase in lending activities in our Capital Markets segment which included an increase in loans receivable to $225.8 million at December 31, 2019 from $38.8 million at December 31, 2018.
Sale of Goods, Cost of Goods Sold and Gross Margin
| Year Ended December 31, 2019 | Year Ended December 31, 2018 | |||||||||||||||||||||||
| Auction and Liquidation Segment | Principal Investments - United Online and magicJack Segment | Total | Auction and Liquidation Segment | Principal Investments - United Online and magicJack Segment | Total | |||||||||||||||||||
| Revenues - Sale of Goods | $ | 4,220 | $ | 3,715 | $ | 7,935 | $ | 63 | $ | 575 | $ | 638 | ||||||||||||
| Cost of goods sold | 4,016 | 3,559 | 7,575 | 41 | 759 | 800 | ||||||||||||||||||
| Gross margin on sale of goods | $ | 204 | $ | 156 | $ | 360 | $ | 22 | $ | (184 | ) | $ | (162 | ) | ||||||||||
| Gross margin percentage | 4.8 | % | 4.2 | % | 4.5 | % | 34.9 | % | (32.0 | )% | (25.4 | )% | ||||||||||||
Revenues from the sale of goods increased $7.3 million, to $7.9 million during the year ended December 31, 2019 from $0.6 million during the year ended December 31, 2018. The increase in revenues from sale of goods were primarily attributable to $4.2 million of goods sold as part of our retail liquidation engagements and $3.1 million of sales of magicJack devices that are sold in connection with VoIP services and, to a lesser extent, sale of mobile broadband devices from UOL that are sold in connection with the mobile broadband services. Cost of goods sold for the year ended December 31, 2019 was $7.6 million, resulting in a gross margin of 4.5%.
Operating Expenses
Direct Cost of Services. Direct cost of services and direct cost of services measured as a percentage of revenues – services and fees by segment during the year ended December 31, 2019 and 2018 are as follows:
| Year Ended December 31, 2019 | Year Ended December 31, 2018 | |||||||||||||||||||||||
| Auction and Liquidation Segment | Principal Investments - United Online and magicJack Segment | Total | Auction and Liquidation Segment | Principal Investments - United Online and magicJack Segment | Total | |||||||||||||||||||
| Revenues - Services and fees | $ | 18,296 | $ | 97,147 | $ | 54,923 | $ | 53,659 | ||||||||||||||||
| Direct cost of services | 33,296 | 25,529 | $ | 58,825 | 19,627 | 15,127 | $ | 34,754 | ||||||||||||||||
| Gross margin on services and fees | $ | (15,000 | ) | $ | 71,618 | $ | 35,296 | $ | 38,532 | |||||||||||||||
| Gross margin percentage | -82.0 | % | 73.7 | % | 64.3 | % | 71.8 | % | ||||||||||||||||
Total direct costs increased $24.1 million, to $58.8 million during the year ended December 31, 2019 from $34.8 million during the year ended December 31, 2018. Direct costs of services increased by $13.7 million in the Auction and Liquidation segment and $10.4 million in the Principal Investments - United Online and magicJack segment. The increase in direct costs in the Auction and Liquidation segment was primarily due to mix of engagement types performed during the year ended December 31, 2019 as compared to the year ended December 31, 2018. The increase in direct costs in the Principal Investments - United Online and magicJack segment was primarily as a result of the acquisition of magicJack on November 14, 2018.
Auction and Liquidation
Gross margin in the Auction and Liquidation segment for services and fees decreased to a loss of 82.0% of revenues during the year ended December 31, 2019, as compared to 64.3% of revenues during the year ended December 31, 2018. The decrease in margin in the Auction and Liquidation segment is due to a retail engagement loss incurred for a contract entered into during the fourth quarter of 2019 to liquidate the assets of a retailer where the funds advanced exceed the expected recovery.
60
Principal Investments - United Online and magicJack
Gross margins in the Principal Investments - United Online and magicJack segment increased to 73.7% of revenues year ended December 31, 2019 as compared to 71.8% of revenues during the year ended December 31, 2018. The increase in margin in the Principal Investments - United Online and magicJack segment is primarily due to the mix of revenues of services and fees and as a result of the acquisition of magicJack on November 14, 2018.
Selling, General and Administrative Expenses. Selling, general and administrative expenses during the year ended December 31, 2019 and 2018 were comprised of the following:
Selling, General and Administrative Expenses
| Year Ended | Year Ended | |||||||||||||||||||||||
| December 31, 2019 | December 31, 2018 | Change | ||||||||||||||||||||||
| Amount | % | Amount | % | Amount | % | |||||||||||||||||||
| Capital Markets segment | $ | 274,469 | 71.2 | % | $ | 233,497 | 75.1 | % | $ | 40,972 | 17.5 | % | ||||||||||||
| Auction and Liquidation segment | 10,737 | 2.8 | % | 8,305 | 2.7 | % | 2,432 | 29.3 | % | |||||||||||||||
| Valuation and Appraisal segment | 28,584 | 7.4 | % | 27,608 | 8.9 | % | 976 | 3.5 | % | |||||||||||||||
| Principal Investments - United Online and magicJack segment | 36,914 | 9.6 | % | 18,563 | 6.0 | % | 18,351 | 98.9 | % | |||||||||||||||
| Brands | 1,388 | 0.4 | % | — | 0.0 | % | 1,388 | n/m | ||||||||||||||||
| Corporate and Other segment | 33,127 | 8.6 | % | 22,535 | 7.3 | % | 10,592 | 47.0 | % | |||||||||||||||
| Total selling, general & administrative expenses | $ | 385,219 | 100.0 | % | $ | 310,508 | 100.0 | % | $ | 74,711 | 24.1 | % | ||||||||||||
Total selling, general and administrative expenses increased $74.7 million to $385.2 million during the year ended December 31, 2019 from $310.5 million for the year ended December 31, 2018. The increase of $74.7 million in selling, general and administrative expenses was due to an increase of $41.0 million in the Capital Markets segment, an increase of $2.4 million in the Auction and Liquidation segment, an increase of $1.0 million in the Valuation and Appraisal segment, an increase of $18.4 million in the Principal Investments - United Online and magicJack segment an increase of $1.4 million in the Brands segment and an increase of $10.6 million in the Corporate and Other segment.
Capital Markets
Selling, general and administrative expenses in the Capital Markets segment increased by $41.0 million to $274.5 million during the year ended December 31, 2019 from $233.5 million during the year ended December 31, 2018. The increase was primarily due to an increase of $14.6 million in payroll and related expenses primarily as a result of the acquisition of GlassRatner on August 1, 2018. Selling, general and administrative expenses in the Capital Markets segment also increased during the year ended December 31, 2019 by $13.3 million in professional advisory fees incurred in connection with the management of certain investments that are included in securities and other investments owned.
Auction and Liquidation
Selling, general and administrative expenses in the Auction and Liquidation segment increased by $2.4 million to $10.7 million during the year ended December 31, 2019 from $8.3 million during the year ended December 31, 2018. The increase in selling, general and administrative expenses in the Auction and Liquidation segment was primarily due to an increase of $2.0 million in payroll and related expenses.
Valuation and Appraisal
Selling, general and administrative expenses in the Valuation and Appraisal segment increased by $1.0 million to $28.6 million during the year ended December 31, 2019 from $27.6 million during the year ended December 31, 2018. The increase in selling, general and administrative expenses in the Valuation and Appraisal segment was primarily due to an increase of $0.5 million in payroll and related expenses and an increase in general operating expenses.
Principal Investments - United Online and magicJack
Selling, general and administrative expenses in the Principal Investments - United Online and magicJack segment increased by $18.4 million to $36.9 million for the year ended December 31, 2019 from $18.6 million for the year ended December 31, 2018. The increase in selling, general and administrative expenses in the Principal Investments - United Online and magicJack segment is due to the acquisition of magicJack on November 14, 2018. magicJack’s selling, general and administrative expenses included in the segment for the year ended December 31, 2019 was $22.3 million.
61
Brands
Selling, general and administrative expenses in the Brands segment was $1.4 million for the year ended December 31, 2019. We established the Brands segment in 2019 following the acquisition of a majority equity interest in BR Brands on October 28, 2019.
Corporate and Other
Selling, general and administrative expenses for the Corporate and Other segment increased $10.6 million to $33.1 million during the year ended December 31, 2019 from $22.5 million for the year ended December 31, 2018. The increase of expenses in the Corporate and Other segment for the year ended December 31, 2019 was primarily due to an increase of $9.2 million in payroll and related expenses.
Restructuring Charge. Restructuring charge decreased $6.8 million to $1.7 million for the year ended December 31, 2019. The restructuring charges during the year ended December 31, 2019 were primarily related to severance costs for magicJack employees from a reduction in workforce and lease termination costs in the Principal Investments – United Online and magicJack segment. The restructuring charge of $8.5 million during the year ended December 31, 2018 was primarily related to severance costs and lease loss accruals for the planned consolidation of office space related to operations in the Capital Markets segment and the impairment of tradename for the rebranding of B. Riley Wealth Management.
Other Income (Expense). Other income included interest income of $1.6 million during the year ended December 31, 2019 compared to $1.3 million during the year ended December 31, 2018. Loss on equity investments was $1.4 million during the year ended December 31, 2019 compared to income of $8.0 million during the year ended December 31, 2018. Interest expense was $50.2 million during the year ended December 31, 2019 compared to $33.4 million during the year ended December 31, 2018. The increase in interest expense during the year ended December 31, 2019 was primarily due to an increase in interest expense of $18.4 million from the issuance of senior notes, and an increase in interest expense of $4.2 million from the term loan dated December 2018, offset by a decrease in interest expense on our asset based credit facility and other borrowings in connection with retail liquidation engagements of $6.4 million.
Income Before Income Taxes. Income before income taxes increased $95.3 million to income before income taxes of $116.6 million during the year ended December 31, 2019 from an income before income taxes of $21.3 million during the year ended December 31, 2018. The increase in income before income taxes was primarily due to an increase in revenues of approximately $229.1 million offset by an increase in operating expenses of $107.9 million, and a decrease in income from equity investments of $9.4 million and an increase in interest expense of $16.8 million.
Provision for Income Taxes. Provision for income taxes was $34.6 million during the year ended December 31, 2019 compared to provision for income taxes of $4.9 million during the year ended December 31, 2018. The effective income tax rate was a provision of 29.7% for the year ended December 31, 2019 as compared to a provision of 23.0% for the year ended December 31, 2018.
Net Income Attributable to Noncontrolling Interest. Net income attributable to noncontrolling interests represents the proportionate share of net income generated by BR Brand, 20% of the membership interest of which we do not own and Great American Global Partners, LLC, 50% of the membership interest of which we do not own. The net income attributable to noncontrolling interests was $0.3 million during the year ended December 31, 2019 compared to $0.9 million during the year ended December 31, 2018.
Net Income Attributable to the Company. Net income attributable to the Company for the year ended December 31, 2019 was $81.6 million, an increase of net income of $66.1 million, from net income attributable to the Company of $15.5 million for the year ended December 31, 2018. Increase in net income attributable to the Company during the year ended December 31, 2019 as compared to the same period in 2018 was primarily due to an increase in operating income of $121.3 million, offset by an increase in interest expense of approximately $16.8 million, a decrease in income from equity investments of $9.4 million and an increase in provision for income taxes of $29.7 million.
Preferred Stock Dividends. On October 7, 2019, the Company closed its public offering of Depositary Shares, each representing 1/1000th of a share of 6.875% Series A Cumulative Perpetual Preferred Stock, par value $0.0001 per share. Holders of Series A Preferred Stock, when and as authorized by the board of directors of the Company, are entitled to cumulative cash dividends at the rate of 6.875% per annum of the $25,000 liquidation preference ($25.00 per Depositary Share) per year (equivalent to $1,718.75 or $1.71875 per Depositary Share). Dividends will be payable quarterly in arrears, on or about the last day of January, April, July and October. On October 15, 2019, the Company declared a cash dividend of $0.3 million representing $0.11458333 per Depositary Share. The dividend was paid on October 31, 2019 to holders of record as of the close of business on October 21, 2019. On January 9, 2020, the Company declared a cash dividend representing $0.4296875 per Depositary Share, which was paid on January 31, 2019 to holders of record as of the close of business on January 21, 2019.
Net Income Available to Common Shareholders. Net income available to common shareholders for the year ended December 31, 2019 was $81.3 million, an increase of $65.8 million, from net income available to common shareholders of $15.5 million for the year ended December 31, 2018. The increase in net income available to common shareholders during the year ended December 31, 2019 as compared to the same period in 2018 was primarily due to an increase in operating income of $121.3 million, offset by an increase in interest expense of approximately $16.8 million, a decrease in income from equity investments of $9.4 million and an increase in provision for income taxes of $29.7 million.
62
Year Ended December 31, 2018 Compared to Year Ended December 31, 2017
Consolidated Statements of Income
(Dollars in thousands)
| Year Ended | Year Ended | |||||||||||||||||||||||
| December 31, 2018 | December 31, 2017 | Change | ||||||||||||||||||||||
| Amount | % | Amount | % | Amount | % | |||||||||||||||||||
| Revenues: | ||||||||||||||||||||||||
| Services and fees | $ | 384,076 | 90.8 | % | $ | 302,113 | 93.8 | % | $ | 81,963 | 27.1 | % | ||||||||||||
| Interest income - Loans and securities lending | 38,277 | 9.0 | % | 19,756 | 6.1 | % | 18,521 | 93.7 | % | |||||||||||||||
| Sale of goods | 638 | 0.2 | % | 307 | 0.1 | % | 331 | 107.8 | % | |||||||||||||||
| Total revenues | 422,991 | 100.0 | % | 322,176 | 100.0 | % | 100,815 | 31.3 | % | |||||||||||||||
| Operating expenses: | ||||||||||||||||||||||||
| Direct cost of services | 34,754 | 8.2 | % | 40,625 | 12.6 | % | (5,871 | ) | (14.5 | )% | ||||||||||||||
| Cost of goods sold | 800 | 0.2 | % | 398 | 0.1 | % | 402 | 101.0 | % | |||||||||||||||
| Selling, general and administrative expenses | 310,508 | 73.4 | % | 227,884 | 70.7 | % | 82,624 | 36.3 | % | |||||||||||||||
| Restructuring charge | 8,506 | 2.0 | % | 12,374 | 3.8 | % | (3,868 | ) | (31.3 | )% | ||||||||||||||
| Interest expense - Securities lending and loan participations sold | 23,039 | 5.4 | % | 12,051 | 3.7 | % | 10,988 | 91.2 | % | |||||||||||||||
| Total operating expenses | 377,607 | 89.2 | % | 293,332 | 90.9 | % | 84,275 | 28.7 | % | |||||||||||||||
| Operating income | 45,384 | 10.7 | % | 28,844 | 9.0 | % | 16,540 | 57.3 | % | |||||||||||||||
| Other income (expense): | ||||||||||||||||||||||||
| Interest income | 1,326 | 0.3 | % | 420 | 0.1 | % | 906 | 215.7 | % | |||||||||||||||
| Income (loss) on equity investments | 7,986 | 1.9 | % | (437 | ) | (0.1 | )% | 8,423 | n/m | |||||||||||||||
| Interest expense | (33,393 | ) | (7.9 | )% | (8,382 | ) | (2.6 | )% | (25,011 | ) | 298.4 | % | ||||||||||||
| Income before income taxes | 21,303 | 5.0 | % | 20,445 | 6.4 | % | 858 | 4.2 | % | |||||||||||||||
| Provision for income taxes | (4,903 | ) | (1.2 | )% | (8,510 | ) | (2.6 | )% | 3,607 | (42.4 | )% | |||||||||||||
| Net income | 16,400 | 3.9 | % | 11,935 | 3.7 | % | 4,465 | 37.4 | % | |||||||||||||||
| Net income attributable to noncontrolling interests | 891 | 0.2 | % | 379 | 0.1 | % | 512 | 135.1 | % | |||||||||||||||
| Net income attributable to B. Riley Financial, Inc. | $ | 15,509 | 3.7 | % | $ | 11,556 | 3.6 | % | $ | 3,953 | 34.2 | % | ||||||||||||
n/m - Not applicable or not meaningful.
Revenues
The table below and the discussion that follows are based on how we analyze our business.
| Year Ended | Year Ended | |||||||||||||||||||||||
| December 31, 2018 | December 31, 2017 | Change | ||||||||||||||||||||||
| Amount | % | Amount | % | Amount | % | |||||||||||||||||||
| Revenues - Services and fees: | ||||||||||||||||||||||||
| Capital Markets segment | $ | 236,789 | 56.0 | % | $ | 169,967 | 52.8 | % | $ | 66,822 | 39.3 | % | ||||||||||||
| Auction and Liquidation segment | 54,923 | 13.0 | % | 47,376 | 14.7 | % | 7,547 | 15.9 | % | |||||||||||||||
| Valuation and Appraisal segment | 38,705 | 9.2 | % | 33,331 | 10.3 | % | 5,374 | 16.1 | % | |||||||||||||||
| Principal Investments - United Online and magicJack segment | 53,659 | 12.7 | % | 51,439 | 16.0 | % | 2,220 | 4.3 | % | |||||||||||||||
| Subtotal | 384,076 | 90.8 | % | 302,113 | 93.8 | % | 81,963 | 27.1 | % | |||||||||||||||
| Revenues - Sale of goods | ||||||||||||||||||||||||
| Auction and Liquidation segment | 63 | 0.0 | % | 3 | 0.0 | % | 60 | n/m | ||||||||||||||||
| Principal Investments - United Online and magicJack segment | 575 | 0.1 | % | 304 | 0.1 | % | 271 | n/m | ||||||||||||||||
| Subtotal | 638 | 0.2 | % | 307 | 0.1 | % | 331 | n/m | ||||||||||||||||
| Interest income - Loans and securities lending: | ||||||||||||||||||||||||
| Capital Markets segment | 38,277 | 9.0 | % | 19,756 | 6.1 | % | 18,521 | 93.7 | % | |||||||||||||||
| Total revenues | $ | 422,991 | 100.0 | % | $ | 322,176 | 100.0 | % | $ | 100,815 | 31.3 | % | ||||||||||||
n/m - Not applicable or not meaningful.
63
Total revenues increased $100.8 million to $423.0 million during the year ended December 31, 2018 from $322.2 million during the year ended December 31, 2017. The increase in revenues during the year ended December 31, 2018 was primarily due to an increase in revenue from services and fees of $82.0 million, an increase in revenue from interest income – loans and securities lending of $18.5 million and increase in revenue from sale of goods of $0.3 million. The increase in revenue from services and fees of $82.0 million in 2018 was primarily due to an increase in revenue of $66.8 million in the Capital Markets segment, $7.5 million in the Auction and Liquidation segment, $5.4 million in the Valuation and Appraisal segment and $2.2 million in the Principal Investments - United Online and magicJack segment.
Revenues from services and fees in the Capital Markets segment increased $66.8 million, or 39.3% to $236.8 million during the year ended December 31, 2018 from $170.0 million during the year ended December 31, 2017. The increase in revenues was primarily due to an increase in revenue of $25.4 million from investment banking fees, an increase in revenue of $33.9 million from wealth management services, an increase in revenue of $12.8 million from consulting fees as a result of the acquisition of GlassRatner on August 1, 2018, an increase of $13.5 million from commissions and fees revenue from research, sales and trading and an increase of $7.4 million of other revenues, offset by a decrease in revenues of $23.1 million from trading gains. Included in the revenue from the Capital Markets segment during the year ended December 31, 2018 is full year revenue of FBR and Wunderlich, which the company acquired on June 1, 2017 and July 2, 2017, respectively.
Revenues from services and fees in the Auction and Liquidation segment increased $7.5 million, or 15.9%, to $54.9 million during the year ended December 31, 2018 from $47.4 million during the year ended December 31, 2017. The increase in revenues of $7.5 million was primarily due to an increase in revenues of $5.8 million from services and fees from retail liquidation engagements and an increase in revenues of $1.7 million from services and fees in our wholesale and industrial auction division.
Revenues from services and fees in the Valuation and Appraisal segment increased $5.4 million, or 16.1%, to $38.7 million during the year ended December 31, 2018 from $33.3 million during the year ended December 31, 2017. The increase in revenues was primarily due to $3.9 million increase related to appraisal engagements where we perform valuations for the monitoring of collateral for financial institutions, lenders, and private equity investors, $1.3 million increase related to appraisal engagements where we perform valuations of intellectual property and business valuations, and $0.2 million increase related to appraisal engagements where we perform valuations of machinery and equipment.
Revenues from services and fees in the Principal Investments – United Online and magicJack segment increased $2.2 million to $53.7 million during the year ended December 31, 2018 from $51.4 million during the year ended December 31, 2017. Revenues from services and fees as a result of the acquisition of magicJack included in the segment for the period from November 14, 2018 (acquisition date) through December 31, 2018 were $8.8 million. UOL services revenues primarily from customer paid accounts related to our Internet access and related subscription services decreased approximately $3.8 million to $35.4 million during the year ended December 31, 2018 from $39.2 million during the year ended December 31, 2017. Advertising revenues from Internet display advertising and search related to our email and Internet access services decreased $2.7 million to $9.5 million during the year ended December 31, 2018 from $12.2 million during the year ended December 31, 2017. Over the past several years revenues from UOL paid subscription services have declined year over year as a result of a decline in the number of paid subscribers for our services. Management believes the decline in UOL paid subscriber accounts is primarily attributable to the industry trends of consumers switching from dial-up Internet access to high speed Internet access such as cable and DSL. Management expects revenues from UOL continue to decline year over year.
Sale of Goods, Cost of Goods Sold and Gross Margin
| Year Ended December 31, 2018 | Year Ended December 31, 2017 | |||||||||||||||||||||||
| Auction and Liquidation Segment | Principal Investments - United Online and magicJack Segment | Total | Auction and Liquidation Segment | Principal Investments - United Online and magicJack Segment | Total | |||||||||||||||||||
| Revenues - Sale of Goods | $ | 63 | $ | 575 | $ | 638 | $ | 3 | $ | 304 | $ | 307 | ||||||||||||
| Cost of goods sold | 41 | 759 | 800 | 2 | 396 | 398 | ||||||||||||||||||
| Gross margin on sale of goods | $ | 22 | $ | (184 | ) | $ | (162 | ) | $ | 1 | $ | (92 | ) | $ | (91 | ) | ||||||||
| Gross margin percentage | 34.9 | % | (32.0 | )% | (25.4 | )% | 33.3 | % | (30.3 | )% | (29.6 | )% | ||||||||||||
Revenues from the sale of goods increased $0.3 million, to $0.6 million during the year ended December 31, 2018 from $0.3 during the year ended December 31, 2017. Revenues from sale of goods was primarily attributable to the sale of mobile broadband devices from UOL that are sold in connection with the mobile broadband services and the sale of magicJack devices that are sold in connection with VoIP services. Cost of goods sold for the year ended December 31, 2018 was $0.8 million, resulting in a gross margin of ($0.2) million or (25.4%). Cost of goods sold in 2017 was $0.4 million resulting in a gross margin of ($0.1) million or (29.6%) during the year ended December 31, 2017.
64
Operating Expenses
Direct Cost of Services. Direct cost of services and direct cost of services measured as a percentage of revenues – services and fees by segment during the year ended December 31, 2018 and 2017 are as follows:
| Year Ended December 31, 2018 | Year Ended December 31, 2017 | |||||||||||||||||||||||
| Auction and Liquidation Segment | Principal Investments - United Online and magicJack Segment | Total | Auction and Liquidation Segment | Principal Investments - United Online and magicJack Segment | Total | |||||||||||||||||||
| Revenues - Services and fees | $ | 54,923 | $ | 53,659 | $ | 47,376 | $ | 51,439 | ||||||||||||||||
| Direct cost of services | 19,627 | 15,127 | $ | 34,754 | 27,841 | 12,784 | $ | 40,625 | ||||||||||||||||
| Gross margin on services and fees | $ | 35,296 | $ | 38,532 | $ | 19,535 | $ | 38,655 | ||||||||||||||||
| Gross margin percentage | 64.3 | % | 71.8 | % | 41.2 | % | 75.1 | % | ||||||||||||||||
Total direct costs decreased $5.9 million, to $34.8 million during the year ended December 31, 2018 from $40.6 million during the year ended December 31, 2017. Direct costs of services decreased by $8.2 million in the Auction and Liquidation segment, offset by an increase of $2.3 million in the Principal Investments - United Online and magicJack segment. The decrease in direct costs in the Auction and Liquidation segment was primarily due to mix of engagement types performed during the year ended December 31, 2018 as compared to the year ended December 31, 2017. The increase in direct costs in the Principal Investments - United Online and magicJack segment was primarily as a result of the acquisition of magicJack on November 14, 2018.
Auction and Liquidation
Gross margin in the Auction and Liquidation segment for services and fees increased to 64.3% of revenues during the year ended December 31, 2018, as compared to 41.2% of revenues during the year ended December 31, 2017. The increase in margin in the Auction and Liquidation segment is due to the mix of engagement types between guarantee and commission and fees engagements performed during the year ended December 31, 2018 as compared to the prior year period.
Principal Investments — United Online and magicJack
Gross margins in the Principal Investments-United Online and magicJack segment decreased to 71.8% of revenues during the year ended December 31, 2018 as compared to 75.1% of revenues during the year ended December 31, 2017. The decrease in margin in the Principal Investments — United Online and magicJack segment is primarily due to the mix of revenues of services and fees and as a result of the acquisition of magicJack on November 14, 2018.
Selling, General and Administrative Expenses. Selling, general and administrative expenses during the year ended December 31, 2018 and 2017 were comprised of the following:
Selling, General and Administrative Expenses
| Year Ended | Year Ended | |||||||||||||||||||||||
| December 31, 2018 | December 31, 2017 | Change | ||||||||||||||||||||||
| Amount | % | Amount | % | Amount | % | |||||||||||||||||||
| Capital Markets segment | $ | 233,497 | 75.1 | % | $ | 153,886 | 67.5 | % | $ | 79,611 | 51.7 | % | ||||||||||||
| Auction and Liquidation segment | 8,305 | 2.7 | % | 8,350 | 3.7 | % | (45 | ) | (0.5 | )% | ||||||||||||||
| Valuation and Appraisal segment | 27,608 | 8.9 | % | 23,618 | 10.4 | % | 3,990 | 16.9 | % | |||||||||||||||
| Principal Investments - United Online and magicJack segment | 18,563 | 6.0 | % | 18,337 | 8.0 | % | 226 | 1.2 | % | |||||||||||||||
| Corporate and Other segment | 22,535 | 7.3 | % | 23,693 | 10.4 | % | (1,158 | ) | (4.9 | )% | ||||||||||||||
| Total selling, general & administrative expenses | $ | 310,508 | 100.0 | % | $ | 227,884 | 100.0 | % | $ | 82,624 | 36.3 | % | ||||||||||||
Total selling, general and administrative expenses increased $82.6 million, or 36.3%, to $310.5 million during the year ended December 31, 2018 from $227.9 million for the year ended December 31, 2017. The increase of $82.6 million in selling, general and administrative expenses was due to an increase of $79.6 million in the Capital Markets segment, $4.0 million in the Valuation and Appraisal segment, and $0.2 million in the Principal Investments - United Online and magicJack segment, offset by a decrease in selling, general and administrative expenses of $1.2 million in the Corporate and Other segment.
65
Capital Markets
Selling, general and administrative expenses in the Capital Markets segment increased by $79.6 million, or 51.7% to $233.5 million during the year ended December 31, 2018 from $153.9 million during the year ended December 31, 2017. The increase in expenses was primarily due to an increase of $58.7 million in payroll and related expenses, an increase of $3.5 million in market data and other communication expenses, an increase of $2.7 million in share based payments, an increase of $2.5 million in rent, occupancy and related expenses, an increase of $2.6 million in clearing charges, an increase of $1.3 million in amortization expense, an increase of $2.0 million in business development expenses, an increase of $1.2 million in professional fees and an increase of $5.1 million in other expenses. The selling, general and administrative expenses in the Capital Markets segment for the year ended December 31, 2018 included full year expenses of FBR and Wunderlich, which we acquired on June 1, 2017 and July 3, 2017, respectively.
Auction and Liquidation
Selling, general and administrative expenses in the Auction and Liquidation segment was $8.3 million during the year ended December 31, 2018 compared to $8.4 million for the year ended December 31, 2017.
Valuation and Appraisal
Selling, general and administrative expenses in the Valuation and Appraisal segment increased $4.0 million, or 16.9%, to $27.6 million during year ended December 31, 2018 from $23.6 million for the year ended December 31, 2017. The increase of $4.0 million was primarily due to an increase of $2.7 million in payroll and related expenses, an increase of $0.6 million in professional fees and an increase of $0.7 million in other expenses.
Principal Investments - United Online and magicJack
Selling, general and administrative expenses in the Principal Investments - United Online and magicJack segment increased $0.2 million, or 1.2%, to $18.6 million for the year ended December 31, 2018 from $18.3 million for the year ended December 31, 2017. magicJack’s selling, general and administrative expenses included in the segment for the period from November 14, 2018 (acquisition date) to December 31, 2018 was $2.4 million.
Corporate and Other
Selling, general and administrative expenses for the Corporate and Other segment decreased $1.2 million, or 4.9%, to $22.5 million during the year ended December 31, 2018 from $23.7 million for the year ended December 31, 2017. The decrease of expenses in the Corporate and Other segment for year ended December 31, 2018 was primarily due a decrease of $3.0 million primarily related to the fair value adjustment and insurance recovery from key man life insurance in the prior year related to one of our executives in our appraisal segment and decrease in other general administrative expenses of $2.0 million, offset by an increase in payroll and related expenses of $3.8 million.
Restructuring Charge. During the year ended December 31, 2018, we incurred restructuring charges of $8.5 million compared to restructuring charges of $12.4 million during the year ended December 31, 2017. Restructuring charges of $8.5 million during the 2018 period was primarily related to severance costs and lease loss accruals for the planned consolidation of office space related to operations in the Capital Markets segment and the impairment of tradename for the rebranding of B. Riley Wealth Management. During the year ended December 31, 2017, we implemented costs savings measures taking into account the planned synergies as a result of the acquisitions of Wunderlich and FBR which included a reduction in force for some of the corporate executives of Wunderlich and FBR and a restructuring to integrate Wunderlich and FBR’s operations with our operations. These initiatives resulted in a restructuring charge of $11.7 million during the year ended December 31, 2017. The restructuring charges included $3.3 million related to severance and accelerated vesting of restricted stock awards to former corporate executives of Wunderlich and FBR and $5.0 million of severance, accelerated vesting of stock awards to employees and $3.4 million of lease loss accruals for the planned consolidation of office space related to operations. The restructuring charge in 2017 also included employee termination costs of $0.7 million related to a reduction in personnel in the Principal Investments - United Online and magicJack segment of our operations.
Other Income (Expense). Other income included $8.0 million income on equity investments during the year ended December 31, 2018 compared to a loss on equity investment of $0.4 million during the same period in 2017. Other income included interest income of $1.3 million during the year ended December 31, 2018 as compared to $0.4 million during the year ended December 31, 2017. Interest expense was $33.4 million during the year ended December 31, 2018 as compared to $8.4 million during the year ended December 31, 2017. The increase in interest expense of $25.0 million during the year ended December 31, 2018 compared to the same period in 2017 was primarily due to an increase in interest expense of $19.0 million from the issuances of senior notes due in 2021, 2023 and 2027; and approximately $6.6 million interest expense related to borrowings in connection with retail liquidation engagements, offset by a decrease in other interest expense of $0.6 million.
66
Income Before Income Taxes. Income before income taxes increased $0.9 million to $21.3 million during the year ended December 31, 2018 from $20.4 million during the year ended December 31, 2017. The increase in income before income taxes of $0.9 million was due to an increase in revenues of $100.8 million, an increase in income from equity investments of $8.4 million and an increase in interest income of $0.9 million, offset by an increase in operating expenses of $84.2 million and an increase in interest expense of $25.0 million.
Provision for Income Taxes. Provision for income tax was $4.9 million during the year ended December 31, 2018, a decrease of $3.6 million, from $8.5 million during the year ended December 31, 2017. The effective income tax rate was 23.0% during the year ended December 31, 2018 and 41.6% during the year ended December 31, 2017. The provision for income taxes during the year ended December 31, 2017 included (a) tax expense of $13.1 million primarily related to revaluation of deferred tax assets at 21.0% as a result of the U.S. Tax Cuts and Jobs Act enacted on December 22, 2017; and (b) a tax benefit of $8.4 million related to our election to treat the acquisition of UOL as a taxable business combination for income tax purposes in accordance with Internal Revenue Code Section 338(g) as more fully discussed in Note 14 in the consolidated financial statements. The tax provision during the year ended December 31, 2017 also includes a tax benefit due to a non-taxable insurance recovery in the amount of $6.0 million that was received in the second quarter of 2017.
Net Income Attributable to Noncontrolling Interest. Net income attributable to noncontrolling interests represents the proportionate share of net income generated by Great American Global Partners, LLC, in which we have a 50% membership interest that we do not own. The net income attributable to noncontrolling interests was $0.9 million during the year ended December 31, 2018 compared to net income attributable to noncontrolling interests of $0.4 million during the year ended December 31, 2017.
Net Income Attributable to the Company. Net income attributable to the Company for the year ended December 31, 2018 was $15.5 million, an increase of $3.9 million, from $11.6 million during the year ended December 31, 2017. The increase in net income attributable to the Company during the year ended December 31, 2018 of $3.9 million was primarily due to an increase in total revenues of $100.8 million, an increase in income from equity investments of $8.4 million, an increase in interest income of $0.9 million and a decrease in provision for income taxes of $3.6 million, offset by an increase in operating expenses of $84.3 million, an increase in interest expense of $25.0 million and an increase in net income attributable to noncontrolling interest of $0.5 million
Liquidity and Capital Resources
Our operations are funded through a combination of existing cash on hand, cash generated from operations, borrowings under our senior notes payable, term loan and credit facility, issuances of common and preferred stock and special purposes financing arrangements.
During the years ended December 31, 2019 and 2018, we generated net income attributable to the Company of $81.6 million and $15.5 million, respectively. Our cash flows and profitability are impacted by the number and size of retail liquidation and capital markets engagements performed on a quarterly and annual basis.
As of December 31, 2019, we had $104.3 million of unrestricted cash and cash equivalents, $0.5 million of restricted cash, $451.6 million of securities and other investments held at fair value, $225.8 million of loans receivable, and $814.9 million of borrowings outstanding. The borrowings outstanding of $814.9 million at December 31, 2019 included (a) $118.0 million of borrowings from the issuance of the 7.50% 2027 Notes, (b) $120.1 million of borrowings from the issuance of the 7.25% 2027 Notes, (c) $122.1 million of borrowings from the issuance of the 7.375% 2023 Notes, (d) $106.0 million of borrowings from the issuance of the 6.875% 2023 Notes, (e) $106.6 million of borrowings from the issuance of the 6.75% 2024 Notes, (f) $124.2 million of borrowings from the issuance of the 6.50% 2026 Notes, (g) $67.2 million term loan borrowed pursuant to the BRPAC Credit Agreement discussed below, (h) $38.2 million of notes payable, and (i) $12.5 million of loan participations sold. We believe that our current cash and cash equivalents, securities and other investments owned, funds available under our asset based credit facility, and cash expected to be generated from operating activities will be sufficient to meet our working capital and capital expenditure requirements for at least the next 12 months from issuance date of the accompanying financial statements. We continue to monitor our financial performance to ensure sufficient liquidity to fund operations and execute on our business plan.
67
Cash Flow Summary
| Year Ended December 31, | ||||||||||||
| 2019 | 2018 | 2017 | ||||||||||
| (Dollars in thousands) | ||||||||||||
| Net cash (used in) provided by: | ||||||||||||
| Operating activities | $ | (30,392 | ) | $ | (104,814 | ) | $ | (81,790 | ) | |||
| Investing activities | (295,396 | ) | (151,441 | ) | (17,836 | ) | ||||||
| Financing activities | 250,176 | 284,859 | 134,094 | |||||||||
| Effect of foreign currency on cash | 73 | (860 | ) | 2,667 | ||||||||
| Net (decrease) increase in cash, cash equivalents and restricted cash | $ | (75,539 | ) | $ | 27,744 | $ | 37,135 | |||||
Year Ended December 31, 2019 Compared to Year Ended December 31, 2018
Cash used in operating activities was $30.4 million during the year ended December 31, 2019 compared to cash used in operating activities of $104.8 million during the year ended December 31, 2018. Cash used in operating activities for the year ended December 31, 2019 included net income of $81.9 million adjusted for noncash items of $38.0 million and changes in operating assets and liabilities of $150.3 million. Noncash items of $38.0 million include (a) depreciation and amortization of $19.0 million, (b) share-based compensation of $15.9 million, (c) loss on equity investments of $1.4 million, (d) provision for doubtful accounts of $2.1 million, (e) income allocated for mandatorily redeemable noncontrolling interests of $1.2 million, (f) other noncash interest and other of $12.3 million, (g) deferred income taxes of $10.9 million, and (h) impairment of leaseholds, intangibles and lease loss accrual and gain on disposal of fixed assets of $0.3 million.
Cash used in investing activities was $295.4 million during the year ended December 31, 2019 compared to cash used in investing activities of $151.4 million for the year ended December 31, 2018. During the year ended December 31, 2019, cash used in investing activities consisted of cash used for loans receivable of $343.8 million, cash used for equity investments of $33.4 million, repayments of loan participations sold of $18.9 million, cash used for purchase of a majority equity interest in BR Brands, net of cash acquired of $114.9 million and cash used for purchases of property and equipment and intangible assets of $3.5 million, offset by proceeds from sale of division of magicJack of $6.2 million, cash received from loans receivable repayment of $159.2 million, loan participations sold of $31.8 million, dividends and distributions from equity investments of $21.4 million and proceeds from sale of property, equipment and intangible assets of $0.5 million. During the year ended December 31, 2018, cash used in investing activities consisted of cash used to purchase loans receivable of $38.8 million, cash used for the acquisition of magicJack, net of cash acquired of $89.2 million, cash use for equity investments of $16.6 million, cash used of $4.0 million to acquire a business and cash use of $5.4 million for purchases of property and equipment, offset by $2.6 million dividends received from one of our equity investments.
Cash provided by financing activities was $250.2 million during the year ended December 31, 2019 compared to cash provided by financing activities of $284.9 million during the year ended December 31, 2018. During the year ended December 31, 2019, cash provided by financing activities primarily consisted of $10.0 million proceeds from our term loan, $281.9 million proceeds from issuance of senior notes, $140.4 million proceeds from our asset based credit facility $56.6 million proceeds from our offering of preferred stock, offset by (a) $103.3 million used for repayment of our asset based credit facility, (b) $41.1 million used to pay dividends on our common shares, (c) $22.7 million used for repayment on our term loan, (d) $7.1 million used to repurchase our common stock and warrants, (e) $4.3 million used for payment of participating note payable and contingent consideration; (f) $3.4 million used to pay debt issuance costs, (g) $2.0 million used for payment of employment taxes on vesting of restricted stock, (h) $2.0 million distribution to noncontrolling interests, and (i) $0.5 million used to repay our other notes payable. During the year ended December 31, 2018, cash provided by financing activities primarily consisted of (a) $300.0 million proceeds from asset based credit facility, (b) $259.0 million proceeds from issuance of senior notes, (c) $80.0 million proceeds from our term loan and (d) $51.0 million in proceeds from notes payable, offset by (a) $300.0 million used to repay the asset based credit facility, (b) $22.7 million used to pay cash dividends, (c) $51.7 million used to repay other notes payable, (d) $1.1 million distributions to noncontrolling interests, (e) $7.3 million used for debt issuance costs, (f) $18.7 million used to repurchase common stock, and (g) $3.7 million used for the payment of employment taxes on vesting of restricted stock.
Year Ended December 31, 2018 Compared to Year Ended December 31, 2017
Cash used in operating activities was $104.8 million for the year ended December 31, 2018, an increase of $23.0 million, from cash used by operating activities of $81.8 million for the year ended December 31, 2017. Cash used in operating activities for the year ended December 31, 2018 included net income of $16.4 million adjusted for noncash items and changes in operating assets and liabilities. The increase in cash used in operating activities of $104.8 million was primarily due to changes in operating assets and liabilities that resulted in a decrease of $151.9 million in cash flows from operations during the year ended December 31, 2018, offset by (a) an increase in net income of $4.5 million to $16.4 million during the year ended December 31, 2018 from $11.9 million during the year ended December 31, 2017, and (b) an increase in non-cash charges and other items of $30.7 million, which included depreciation and amortization of $13.8 million, share-based compensation of $13.0 million, income on equity investments of $8.0 million, deferred income taxes of $2.0 million, provision for doubtful accounts of $1.3 million, impairment of leaseholds and intangibles, lease loss accrual and loss on disposal of fixed assets of $4.1 million, income allocated for mandatorily redeemable noncontrolling interests of $1.2 million and other non-cash items and effects of foreign currency on operations of $0.9 million.
68
Cash used in investing activities was $151.4 million during the year ended December 31, 2018 compared to cash used in investing activities of $17.8 million during for the year ended December 31, 2017. During the year ended December 31, 2018, cash used in investing activities consisted of cash used to purchase loans receivable of $38.8 million, cash use for the acquisition of magicJack, net of cash acquired of $89.2 million, cash use for equity investments of $16.6 million, cash use of $4.0 million to acquire a business and cash use of $5.4 million for purchases of property and equipment, offset by $2.6 million dividends received from one of our equity investments. During the year ended December 31, 2017, cash used in investing activities consisted of (a) cash used to purchase Wunderlich and United Online in the amounts of approximately $25.4 million and $10.4 million, respectively, (b) cash use of $2.1 million for the acquisition of other businesses, (c) cash use of $1.7 million for an equity investment, and (d) cash use of $0.8 million for purchases of property and equipment, offset by (a) cash acquired from the acquisition of FBR of $15.7 million, (b) proceeds from key man life insurance of $6.0 million, and (c) proceeds from sale of property, equipment and other intangibles of $0.8 million.
Cash provided by financing activities was $284.9 million during the year ended December 31, 2018 compared to $134.1 million during the year ended December 31, 2017. During the year ended December 31, 2018, cash provided by financing activities primarily consisted of (a) $259.0 million proceeds from issuance of senior notes, (b) $80.0 million proceeds from term loan borrowings; (c) $300.0 million proceeds from our asset based credit facility, and (d) $51.0 million proceeds from notes payable, offset by (a) $300.0 million used for repayment of borrowings from our asset based credit facility, (b) $51.7 million repayment of notes payable, (c) $22.7 million used to pay cash dividends, (d) $18.7 million used to repurchase our common stock, (e) $7.3 million used for payment of debt issuance costs, (f) $3.7 million comprised of ESPP shares and payment of employment taxes on vesting of restricted stock, and (g) $1.1 million distribution to noncontrolling interests. During the year ended December 31, 2017, cash provided by financing activities primarily consisted of (a) $66.0 million proceeds from asset based credit facility and (b) $179.5 million proceeds from issuance of senior notes, offset by (a) $66.0 million used to repay the asset based credit facility, (b) $16.8 million used to pay cash dividends, (c) $8.3 million used to repay other notes payable in connection with the acquisition of Wunderlich, (d) $11.3 million distributions to noncontrolling interests, (e) $4.3 million used for debt issuance costs, (f) $1.3 million used for the payment of contingent consideration, and (g) $3.5 million used for the payment of employment taxes on vesting of restricted stock.
Credit Agreements
On April 21, 2017, we amended the asset based credit facility agreement (as amended, the “Credit Agreement”) with Wells Fargo Bank to increase the maximum borrowing limit from $100.0 million to $200.0 million. Such amendment, among other things, also extended the expiration date of the credit facility from July 15, 2018 to April 21, 2022. The Credit Agreement continues to allow for borrowings under a separate credit agreement (a “UK Credit Agreement”) dated March 19, 2015 with an affiliate of Wells Fargo Bank which provides for the financing of transactions in the United Kingdom with borrowings up to 50.0 million British Pounds. Any borrowing on the UK Credit Agreement reduces the availability of the asset based $200.0 million credit facility. The UK Credit Agreement is cross collateralized and integrated in certain respects with the Credit Agreement. The Credit Agreement continues to include the addition of our Canadian subsidiary, from the October 5, 2016 amendment to the Credit Agreement, to facilitate borrowings to fund retail liquidation transactions in Canada. From time to time, we utilize this credit facility to fund costs and expenses incurred in connection with liquidation engagements. We also utilize this credit facility in order to issue letters of credit in connection with liquidation engagements conducted on a guaranteed basis. Subject to certain limitations and offsets, we are permitted to borrow up to $200.0 million under the credit facility, less the aggregate principal amount borrowed under the UK Credit Agreement (if in effect). Borrowings under the credit facility are only made at the discretion of the lender and are generally required to be repaid within 180 days. The interest rate for each revolving credit advance under the related credit agreement is, subject to certain terms and conditions, equal to the LIBOR plus a margin of 2.25% to 3.25% depending on the type of advance and the percentage such advance represents of the related transaction for which such advance is provided. The credit facility is secured by the proceeds received for services rendered in connection with the liquidation service contracts pursuant to which any outstanding loan or letters of credit are issued and the assets that are sold at liquidation related to such contract, if any. The credit facility also provides for success fees in the amount of 2.5% to 17.5% of the net profits, if any, earned on liquidation engagements that are financed under the credit facility as set forth in the related credit agreement. We typically seek borrowings on an engagement-by-engagement basis. The Credit Agreement contains certain covenants, including covenants that limit or restrict our ability to incur liens, incur indebtedness, make investments, dispose of assets, make certain restricted payments, merge or consolidate and enter into certain transactions with affiliates. The outstanding balance on this credit facility was $37.1 million and $0 million at December 31, 2019 and December 31, 2018, respectively. At December 31, 2019, there were no letters of credit outstanding under this credit facility. We are in compliance with all financial covenants in the asset based credit facility at December 31, 2019.
69
On December 19, 2018, BRPI Acquisition Co LLC (“BRPAC”), a Delaware limited liability company, UOL, and YMAX Corporation, Delaware corporations (collectively, the “Borrowers”), indirect wholly owned subsidiaries of the Company, in the capacity of borrowers, entered into a credit agreement with Banc of California, N.A. in the capacity as agent and lender and with the other lenders party thereto (the “BRPAC Credit Agreement”). Under the BRPAC Credit Agreement, we borrowed $80.0 million due December 19, 2023. Pursuant to the terms of the BRPAC Credit Agreement, we may request additional optional term loans in an aggregate principal amount of up to $10.0 million at any time prior to the first anniversary of the agreement date. On February 1, 2019, the Borrowers entered into the First Amendment to Credit Agreement and Joinder with City National Bank as a new lender in which the new lender extended to Borrowers the additional $10.0 million as further discussed in Note 11 to the accompanying financial statements. The borrowings under the BRPAC Credit Agreement bear interest equal to the LIBOR plus a margin of 2.50% to 3.00% depending on the Borrowers’ consolidated total funded debt ratio as defined in the BRPAC Credit Agreement.
Borrowings under the BRPAC Credit Agreement are due in quarterly installments commencing on March 31, 2019 with any remaining amounts outstanding due at maturity. For the $80.0 million loan, quarterly installments from December 31, 2019 to December 31, 2022 are $4.2 million per quarter and from March 31, 2023 to December 31, 2023, the quarterly installments are $2.1 million per quarter. For the $10.0 million loan, quarterly installments from December 31, 2019 to December 31, 2022 are $0.6 million per quarter and from March 31, 2023 to December 31, 2023, the quarterly installments are $0.3 million per quarter. At December 31, 2019 and December 31, 2018, the outstanding balance of the term loan was $66.7 million (net of unamortized debt issuance costs of $0.6 million) and $79.2 million (net of unamortized debt issuance costs of $0.8 million), respectively. We are in compliance with all financial covenants in the BRPAC Credit Agreement at December 31, 2019.
Preferred stock offering
On October 7, 2019, the Company closed its public offering of depositary shares, each representing 1/1000th of a share of Series A Preferred Stock. The liquidation preference of each share of Series A Preferred Stock is $25,000 ($25.00 per Depositary Share). At the closing, the Company issued 2,000 shares of Series A Preferred Stock represented by 2,000,000 Depositary Shares issued. On October 11, 2019, the Company completed the sale of an additional 300,000 Depositary Shares, pursuant to the underwriters’ full exercise of their over-allotment option to purchase additional Depositary Shares. The offering of the 2,300,000 Depository Shares generated $57,500 of gross proceeds.
Senior Note Offerings
Senior notes payable, net, is comprised of the following as of December 31, 2019 and 2018:
| December 31, | December 31, | |||||||
| 2019 | 2018 | |||||||
| 7.50% Senior notes due October 31, 2021 | $ | — | $ | 46,407 | ||||
| 7.50% Senior notes due May 31, 2027 | 117,954 | 108,792 | ||||||
| 7.25% Senior notes due December 31, 2027 | 120,126 | 100,441 | ||||||
| 7.375% Senior notes due May 31, 2023 | 122,140 | 111,528 | ||||||
| 6.875% Senior notes due September 30, 2023 | 105,952 | 100,050 | ||||||
| 6.75% Senior notes due May 31, 2024 | 106,589 | — | ||||||
| 6.50% Senior notes due September 30, 2026 | 124,226 | — | ||||||
| 696,987 | 467,218 | |||||||
| Less: Unamortized debt issuance costs | (8,875 | ) | (7,464 | ) | ||||
| $ | 688,112 | $ | 459,754 | |||||
During the years ended December 31, 2019 and 2018, we issued $66.9 million and $58.9 million of senior notes due with maturities dates ranging from October 2021 to December 2027 pursuant to At the Market Issuance Sales Agreements with B. Riley FBR, Inc. which governs the program of at-the-market sales of our senior notes.
On May 7, 2019, we issued $100.05 million of senior notes due in May 2024 (“6.75% 2024 Notes”) pursuant to the prospectus supplement dated May 2, 2019. Interest on the 6.75% 2024 Notes is payable quarterly at 6.75%. The 6.75% 2024 Notes are unsecured and due and payable in full on May 31, 2024. In connection with the issuance of the 6.75% 2024 Notes, we received net proceeds of $98.1 million (after underwriting commissions, fees and other issuance costs of $2.0 million).
On September 23, 2019, we issued $115.0 million of senior notes due in September 2026 (“6.50% 2026 Notes”) pursuant to the prospectus supplement dated September 18, 2019. Interest on the 6.50% 2026 Notes is payable quarterly at 6.50%. The 6.50% 2026 Notes are unsecured and due and payable in full on September 30, 2026. In connection with the issuance of the 6.50% 2026 Notes, we received net proceeds of $112.6 million (after underwriting commissions, fees and other issuance costs of $2.4 million).
70
On December 30, 2019, we redeemed $52.2 of senior notes due in October 2021 (“7.50% 2021 Notes”). We recognized a net loss on acceleration of unamortized discount of $0.3 million on this redemption.
In May 2018, we issued approximately $100.1 million of the 7.375% 2023 Notes. Interest on the 7.375% 2023 Notes is payable quarterly at 7.375%. The 7.375% 2023 Notes are unsecured and due and payable in full on May 31, 2023. In connection with the issuance of the 7.375% 2023 Notes, we received net proceeds of $98.0 million (after underwriting commissions, fees and other issuance costs of $2.0 million).
In September 2018, we issued approximately $100.1 million of the 6.875% 2023 Notes. Interest on the 6.875% 2023 Notes is payable quarterly at 6.875%. The 6.875% 2023 Notes are unsecured and due and payable in full on September 30, 2023. In connection with the issuance of the 6.875% 2023 Notes, we received net proceeds of $98.6 million (after underwriting commissions, fees and other issuance costs of $1.4 million).
At December 31, 2019 and December 31, 2018, the total senior notes outstanding was $688.1 million (net of unamortized debt issue costs of $8.9 million) and $459.8 million (net of unamortized debt issue costs of $7.5 million) with a weighted average interest rate of 7.05% and 7.28%, respectively. Interest on senior notes is payable on a quarterly basis. Interest expense on senior notes totaled $43.8 million, $25.4 million and $6.4 million for the years ended December 31, 2019, 2018 and 2017, respectively.
On December 5, 2019, we entered into a new At the Market Issuance Sales Agreement (the “December 2019 Sales Agreement”) with B. Riley FBR, Inc. governing a program of at-the-market sales of certain of our senior notes and common stock. Under this program we may sell up to $100,000 of certain of our senior notes and common stock, pursuant to an effective Registration Statement on Form S-3. As of December 31, 2019, we had $60.8 million remaining availability under the December 2019 Sales Agreement.
Off Balance Sheet Arrangements
As part of our investment banking and financial services activities, from time to time we enter into guaranties of debt, commitments of other entities, and similar transactions that may be considered off-balance sheet arrangements.
B&W Credit Agreement and Backstop
On January 31, 2020, the Company provided Babcock & Wilcox Enterprises, Inc. (“B&W”) $30 million of additional Tranche A-4 last out term loans pursuant to Amendment No. 20 (“Amendment No. 20”) to the Credit Agreement, dated May 11, 2015 (as amended to date, the “B&W Credit Agreement”) with Bank of America, N.A., as administrative agent and lender, and the other lenders party thereto. The Company is a lender with respect to B&W’s existing last out term loans under the Credit Agreement. Kenneth Young, our President, is the Chief Executive Officer of B&W. Pursuant to Amendment No. 20, B&W and the lenders, including the Company, also agreed upon a term sheet pursuant to which B&W would undertake a refinancing transaction on or prior to May 11, 2020 (the “Refinancing”) and B&W and the lenders, including the Company, would amend and restate the Credit Agreement on the terms specified therein. As part of the Refinancing, the size of B&W’s board of directors may also be reduced to 5 members, with the Company retaining the ability to appoint 2 members. On January 31, 2020, B&W also entered into a letter agreement with the Company (the “Backstop Commitment Letter”) pursuant to which the Company agreed to fund any shortfall in the $200 million of new debt or equity financing required as part of the terms of the Refinancing to the extent such amounts have not been raised from third parties on the same terms contemplated by the Refinancing.
Franchise Group Commitment Letter and Loan Participant Guaranty
Commitment Letter
On February 14, 2020, affiliates of Franchise Group, Inc. (collectively with all of its affiliates, “FRG”) entered into an ABL Credit Agreement (the “Franchise Credit Agreement”), with GACP Finance Co., LLC (“GACP Finance”) as administrative agent and collateral agent, and the lenders from time to time party thereto, pursuant to which the lenders provided an asset based credit facility to FRG in an aggregate principal amount of $100.0 million. In connection with the Franchise Credit Agreement, the Company entered into a commitment letter, dated as of February 14, 2020 (the “Commitment Letter”), pursuant to which the Company committed to provide a $100.0 million asset based lending facility to FRG, on April 14, 2020 if, on or before such date, the obligations under the Franchise Credit Agreement are not refinanced in full.
71
The Loan Participant Guaranty
On February 14, 2020 FRG, the lenders from time to time party thereto and GACP Finance as administrative agent, entered into a Credit Agreement (the “Term Loan Credit Agreement”), pursuant to which the lenders provided a term loan facility to FRG in an aggregate principal amount of $575.0 million.
On February 19, 2020, the Company entered into a limited guaranty the (“Loan Participant Guaranty”) to one of the lenders under the Term Loan Credit Agreement (the “Loan Participant”) pursuant to which the Company guaranteed the payment when due of certain obligations, including principal, interest, and other amounts payable to the Loan Participant under the Term Loan Credit Agreement in an amount not to exceed $50.0 million plus certain expenses of the Loan Participant and certain protective advances related to such guaranteed obligations (the “Loan Participant Guaranteed Obligations”). The Loan Participant may require payment of the Loan Participant Guaranteed Obligations by the Company upon the occurrence of certain guarantor events of default, including payment or bankruptcy events of default, in each case pursuant to the Term Loan Credit Agreement. The Loan Participant Guaranty remains in effect until the date that the Loan Participant Guaranteed Obligations have been paid in full.
The Loan Participant Guaranteed Obligations are unsecured obligations of the Company and rank equally in right of payment with all of the Company’s other existing and future unsecured and unsubordinated indebtedness. The Loan Participant Guaranteed Obligations are effectively subordinated in right of payment to all of the Company’s existing and future secured indebtedness and structurally subordinated to all existing and future indebtedness of the Company’s subsidiaries, including trade payables.
CIBC Guaranty
On February 14, 2020, the Company entered into a limited guaranty (the “CIBC Guaranty”) in favor of CIBC Bank USA (“CIBC”), pursuant to which the Company guaranteed the payment when due of certain obligations, including all principal, interest, and other amounts that shall be at any time payable by FRG under FRG’s credit agreement with CIBC and the lenders party thereto, dated as of May 16, 2019, as amended (the “CIBC Credit Agreement”) in an amount not to exceed $125.0 million plus certain expenses of CIBC related to such guaranteed obligations (the “CIBC Guaranteed Obligations”). CIBC may require payment of the CIBC Guaranteed Obligations by the Company upon the occurrence of either (a) the failure of FRG to pay any principal of any loan or any reimbursement obligation in respect of any letter of credit disbursement or (b) the failure of FRG to pay any interest on any loan or on any reimbursement obligation in respect of any letter of credit disbursement within five business days of the date due, in each case pursuant to the CIBC Credit Agreement. The CIBC Guaranty remains in effect until the earlier of (a) the date that the CIBC Guaranteed Obligations have been paid in full and (b) June 30, 2020.
The CIBC Guaranteed Obligations are unsecured obligations of the Company and rank equally in right of payment with all of the Company’s other existing and future unsecured and unsubordinated indebtedness. The CIBC Guaranteed Obligations are effectively subordinated in right of payment to all of the Company’s existing and future secured indebtedness and structurally subordinated to all existing and future indebtedness of the Company’s subsidiaries, including trade payables.
Except as disclosed above, we have no material obligations, assets or liabilities which would be considered off-balance sheet arrangements and do not participate in transactions that create relationships with unconsolidated entities or financial partnerships, often referred to as variable interest entities, established for the purpose of facilitating off-balance sheet arrangements.
Dividends
From time to time, we may decide to pay dividends which will be dependent upon our financial condition and results of operations. On March 3, 2020, we declared a regular dividend of $0.25 per share and special dividend of $0.10 per share that will be paid on or about March 31, 2020 to stockholders of record as of March 17, 2020. During the years ended December 31, 2019 and 2018, we paid cash dividends on our common stock of $41.1 million and $22.7 million, respectively. On August 1, 2019, the Board of Directors announced an increase to the regular quarterly dividend from $0.08 per share to $0.175 per share. While it is the Board’s current intention to make regular dividend payments of $0.175 per share each quarter and special dividend payments dependent upon exceptional circumstances from time to time, our Board of Directors may reduce or discontinue the payment of dividends at any time for any reason it deems relevant. The declaration and payment of any future dividends or repurchases of our common stock will be made at the discretion of our Board of Directors and will be dependent upon our financial condition, results of operations, cash flows, capital expenditures, and other factors that may be deemed relevant by our Board of Directors.
72
A summary of dividend activity for the years ended December 31, 2019 and 2018 was as follows:
| Regular | Special | Total | ||||||||||||||
| Stockholder | Dividend | Dividend | Dividend | |||||||||||||
| Date Declared | Date Paid | Record Date | Amount | Amount | Amount | |||||||||||
| October 30, 2019 | November 26, 2019 | November 14, 2019 | $ | 0.175 | $ | 0.475 | $ | 0.650 | ||||||||
| August 1, 2019 | August 29, 2019 | August 15, 2019 | 0.175 | 0.325 | 0.500 | |||||||||||
| May 1, 2019 | May 29, 2019 | May 15, 2019 | 0.08 | 0.18 | 0.26 | |||||||||||
| March 5, 2019 | March 26, 2019 | March 19, 2019 | 0.08 | 0.00 | 0.08 | |||||||||||
| November 5, 2018 | November 27, 2018 | November 16, 2018 | 0.08 | 0.08 | 0.16 | |||||||||||
| August 2, 2018 | August 29, 2018 | August 16, 2018 | 0.08 | 0.22 | 0.30 | |||||||||||
| May 7, 2018 | June 5, 2018 | May 21, 2018 | 0.08 | 0.04 | 0.12 | |||||||||||
| March 7, 2018 | April 3, 2018 | March 20, 2018 | 0.08 | 0.08 | 0.16 | |||||||||||
Holders of Series A Preferred Stock, when and as authorized by the board of directors of the Company, are entitled to cumulative cash dividends at the rate of 6.875% per annum of the $25,000 liquidation preference ($25.00 per Depositary Share) per year (equivalent to $1,718.75 or $1.71875 per Depositary Share). Dividends will be payable quarterly in arrears, on or about the last day of January, April, July and October. On October 15, 2019, the Company declared a cash dividend representing $0.11458333 per Depositary Share. The dividend was paid on October 31, 2019 to holders of record as of the close of business on October 21, 2019. As of December 31, 2019, dividends in arrears in respect of the Depositary Shares were $673. On January 9, 2020, the Company declared a cash dividend $0.4296875 per Depositary Share, which was paid on January 31, 2019 to holders of record as of the close of business on January 21, 2019.
Contractual Obligations
The following table sets forth aggregate information about our contractual obligations as of December 31, 2019 and the periods in which payments are due:
| Payments due by period | ||||||||||||||||||||
| Total | Less Than One Year | 1-3 Years | 4-5 Years | More Than 5 years | ||||||||||||||||
| (Dollars in thousands) | ||||||||||||||||||||
| Contractual Obligations | ||||||||||||||||||||
| Operating lease obligations | $ | 75,885 | $ | 12,646 | $ | 20,634 | $ | 17,886 | $ | 24,719 | ||||||||||
| Notes payable | 38,255 | 37,509 | 746 | — | — | |||||||||||||||
| Term loan | 64,597 | 19,270 | 36,592 | 8,735 | — | |||||||||||||||
| Senior notes payable, including interest | 984,832 | 49,117 | 98,234 | 409,265 | 428,216 | |||||||||||||||
| Total | $ | 1,163,569 | $ | 118,542 | $ | 156,206 | $ | 435,886 | $ | 452,935 | ||||||||||
We anticipate that cash generated from operations and existing borrowing arrangements under our credit facility to fund costs and expenses incurred in connection with liquidation engagements should be sufficient to meet our cash requirements for at least the next twelve months. However, our future capital requirements will depend on many factors, including the success of our businesses in generating cash from operations, continued compliance with financial covenants contained in our credit facility, the timing of principal payments on our long-term debt and the Capital Markets in general, among other factors.
73
Critical Accounting Policies
Our financial statements and the notes thereto contain information that is pertinent to management’s discussion and analysis. The preparation of financial statements in conformity with accounting principles generally accepted in the United States of America (“GAAP”) requires management to make estimates and assumptions that affect the reported amounts of assets and liabilities and disclosures of contingent assets and liabilities. Management bases its estimates on historical experience and on various other assumptions that are believed to be reasonable under the circumstances, the results of which form the basis for making judgments about the carrying values of assets and liabilities that are not readily apparent from other sources. On a continual basis, management reviews its estimates utilizing currently available information, changes in facts and circumstances, historical experience and reasonable assumptions. After such reviews, and if deemed appropriate, management’s estimates are adjusted accordingly. Actual results may vary from these estimates and assumptions under different and/or future circumstances. Management considers an accounting estimate to be critical if:
| ● | it requires assumptions to be made that were uncertain at the time the estimate was made; and |
| ● | changes in the estimate, or the use of different estimating methods that could have been selected, could have a material impact on results of operations or financial condition. |
Use of Estimates. The preparation of financial statements in conformity with GAAP requires management to make estimates and assumptions that affect the reported amounts of assets, liabilities and disclosures of contingent assets and liabilities at the date of the financial statements and the reported amounts of revenues and expenses during the reporting period. Actual results could differ from those estimates. Estimates are used when accounting for certain items such as valuation of securities, reserves for accounts receivable, the carrying value of intangible assets and goodwill, the fair value of mandatorily redeemable noncontrolling interests, accounting for income tax valuation allowances, recovery of contract assets and sales returns and allowances. Estimates are based on historical experience, where applicable, and assumptions that management believes are reasonable under the circumstances. Due to the inherent uncertainty involved with estimates, actual results may differ.
Our significant accounting policies are described in Note 2 to the consolidated financial statements included elsewhere in this Annual Report. Management believes that the following critical accounting policies reflect the more significant estimates and assumptions used in the preparation of our financial statements.
Revenue Recognition. On January 1, 2018, we adopted Accounting Standards Codification (“ASC”) 606 – Revenue from Contracts with Customers using the modified retrospective method and the impact was determined to be immaterial on our consolidated financial statements. The new revenue standard was applied prospectively in our consolidated financial statements from January 1, 2018 forward and reported financial information for historical comparable periods will not be revised and will continue to be reported under the accounting standards in effect during those historical periods.
Revenues are recognized when control of the promised goods or performance obligations for services is transferred to our customers, in an amount that reflects the consideration we expect to be entitled to in exchange for the goods or services.
Revenues from contracts with customers in the Capital Markets segment, Auction and Liquidation segment, Valuation and Appraisal segment, Principal Investments – United Online and magicJack segment and Brands segment are primarily comprised of the following:
Capital Markets Segment - Fees earned from corporate finance and investment banking services are derived from debt, equity and convertible securities offerings in which the Company acted as an underwriter or placement agent. Fees from underwriting activities are recognized as revenues when the performance obligation for the services related to the underwriting transaction is satisfied under the terms of the engagement and is not subject to any other contingencies. Fees are also earned from financial advisory and consulting services rendered in connection with client mergers, acquisitions, restructurings, recapitalizations and other strategic transactions. The performance obligation for financial advisory services is satisfied over time as work progresses on the engagement and services are delivered to the client. The performance obligation for financial advisory services may also include success and performance based fees which are recognized as revenue when the performance obligation is no longer constrained and it is not probable that the revenue recognized would be subject to significant reversal in a future period. Generally, it is probable that the revenue recognized is no longer subject to significant reversal upon the closing of the investment banking transaction.
Fees from wealth and asset management services consist primarily of investment management fees that are recognized over the period the performance obligation for the services are provided. Investment management fees are primarily comprised of fees for investment management services and are generally based on the dollar amount of the assets being managed.
Revenues from sales and trading are recognized when the performance obligation is satisfied and include commissions resulting from equity securities transactions executed as agent or principal and are recorded on a trade date basis and fees paid for equity research.
Revenues from other sources in the Capital Markets segment is primarily comprised of (i) interest income from loans receivable and securities lending activities, (ii) related net trading gains and losses from market making activities, the commitment of capital to facilitate customer orders, (iii) trading activities from our Principal Investments in equity and other securities for the Company’s account, and (iv) other income.
74
Interest income from securities lending activities consists of interest income from equity and fixed income securities that are borrowed from one party and loaned to another. The Company maintains relationships with a broad group of banks and broker-dealers to facilitate the sourcing, borrowing and lending of equity and fixed income securities in a “matched book” to limit the Company’s exposure to fluctuations in the market value or securities borrowed and securities loaned.
Other revenues include (i) net trading gains and losses from market making activities in our fixed income group, (ii) carried interest from our asset management recognized as earnings from financial assets within the scope of ASC 323 - Investments - Equity Method and Joint Ventures, and therefore will not be in the scope of ASC 606 - Revenue from Contracts with Customers. In accordance with ASC 323 - Investments - Equity Method and Joint Ventures, the Company will record equity method income (losses) as a component of investment income based on the change in our proportionate claim on net assets of the investment fund, including performance-based capital allocations, assuming the investment fund was liquidated as of each reporting date pursuant to each fund’s governing agreements, and (iii) other miscellaneous income
Auction and Liquidation segment - Commission and fees earned on the sale of goods at Auction and Liquidation sales are recognized when evidence of a contract or arrangement exists, the transaction price has been determined, and the performance obligation has been satisfied when control of the product and risks of ownership has been transferred to the buyer. The commission and fees earned for these services are included in revenues in the accompanying consolidated statements of income. Under these types of arrangements, revenues also include contractual reimbursable costs.
Revenues earned from Auction and Liquidation services contracts where the Company guarantees a minimum recovery value for goods being sold at auction or liquidation are recognized over time when the performance obligation is satisfied. We generally use the cost-to-cost measure of progress for our contracts because it best depicts the transfer of services to the customer which occurs as we incur costs on our contracts. Under the cost-to-cost measure of progress, the extent of progress towards completion is measured based on the ratio of costs incurred to date to the total estimated costs at completion of the performance obligation. Revenues, including estimated fees or profits, are recorded proportionally as costs are incurred. Costs to fulfill the contract include labor and other direct costs incurred by the Company related to the contract. Due to the nature of the guarantees and performance obligations under these contracts, the estimation of revenue that is ultimately earned is complex and subject to many variables and requires significant judgment. It is common for these contracts to contain provisions that can either increase or decrease the transaction price upon completion of our performance obligations under the contract. Estimated amounts are included in the transaction price at the most likely amount it is probable that a significant reversal of revenue will not occur. Our estimates of variable consideration and determination of whether or not to include estimated amounts in the transaction price are based on an assessment of our anticipated performance under the contract taking into consideration all historical, current and forecasted information that is reasonably available to us. Costs that directly relate to the contract and expected to be recoverable are capitalized as an asset and included in advances against customer contracts in the accompanying consolidated balance sheets. These costs are amortized as the services are transferred to the customer over the contract period, which generally does not exceed six months, and the expense is recognized as a component of direct cost of services. If, during the auction or liquidation sale, the Company determines that the total costs to be incurred on a performance obligation under a contract exceeds the total estimated revenues to be earned, a provision for the entire loss on the performance obligation is recognized in the period the loss is determined.
If the Company determines that the variable consideration used in the initial determination of the transaction price for the contract is such that the total recoveries from the auction or liquidation will not exceed the guaranteed recovery values or advances made in accordance with the contract, the transaction price will be reduced and a loss or negative revenue could result from the performance obligation. A provision for the entire loss as negative revenue on the performance obligation is recognized in the period the loss is determined.
Valuation and Appraisal Segment - Revenues in the Valuation and Appraisal segment are primarily comprised of fees for Valuation and Appraisal services. Revenues are recognized when the performance obligation is completed and is generally at the point in time upon delivery of the report to the customer. Revenues in the Valuation and Appraisal segment also include contractual reimbursable costs.
Principal Investments – United Online and magicJack Segment –Revenues in the Principal Investments - United Online and magicJack segment are primarily comprised of services revenue from fees charged to United Online pay accounts; sales revenue from the sale of the magicJack and related devices and access rights; revenues from access rights renewals and mobile apps; prepaid minutes revenues; revenues from access and wholesale charges; service revenue from UCaaS hosting services; advertising and other revenues; and products revenues from the sale of magicJack and mobile broadband service devices, including the related shipping and handling and installation fees, if applicable.
Service revenues from fees charged to United Online pay accounts are recognized in the period in which fees are fixed or determinable and the related services are provided to the customer. The Company’s pay accounts generally pay in advance for their services by credit card, PayPal, automated clearinghouse or check, and revenues are then recognized ratably over the service period. Advance payments from pay accounts are recorded in the consolidated balance sheets as deferred revenue. In circumstances where payment is not received in advance, revenues are only recognized if collectability is probably.
75
Revenues from sales of the magicJack devices and access rights represent revenues recognized from sales of the magicJack devices to retailers, wholesalers, or direct to customers, net of returns, over the period associated with the access right period. Revenues for the device and initial access right were accounted for as a combined unit of accounting and recognized ratably over the service term. The transaction price for magicJack devices is allocated between equipment and service based on stand-alone selling prices. Revenues allocated to equipment are recognized upon delivery (when control transfers to the customer), and service revenue is recognized ratably over the service term. The Company estimates the return of direct sales as part of the transaction price using a six month rolling average of historical returns. Revenues for hardware and shipping are recognized at the time of delivery and revenues for services are recognized ratably over the service. The Company recognizes revenue for hardware based on delivery terms to the retailer and revenue for service is deferred for the delay period and recognized ratably over the remaining access right period.
Revenues from access rights renewals and mobile apps represents revenues from customers purchasing rights to access our servers beyond the access right period included in a magicJack device or magicJack service. The extended access right ranges from one to five years. These fees charged to customers are initially deferred and recognized as revenue ratably over the extended access right period. Revenues from access rights granted to users of the magicApp, magicJack Connect App and magicJack Spark are recognized ratably over the access right period.
Revenues from the sale of other magicJack related products are revenues recognized from the sale of other items related to the magicJack devices and access right renewals the Company offers its customers, including porting fees charged to customers to port their existing phone number to a magicJack device or services, fees charged for customer to select a custom, vanity or Canadian phone number and fees charged to customers to change their existing number. These revenues are recognized at the time of sale.
Prepaid minutes revenues are primarily from the usage and expiration of international prepaid minutes, net of chargebacks. Revenues from prepaid minutes are recognized as minutes are used.
Revenues from access and wholesale charges are generated from access fees charged to other telecommunication carriers or providers for Interexchange Carriers (“IXC”) calls terminated to the Company’s end-users, and other fees charged to telecommunication carriers or providers for origination of calls to their 800-numbers. These revenues are recorded based on rates set forth in the respective state and federal tariffs or negotiated contract rates, less provisions for billing adjustments. Revenues from access and wholesale charges are recognized as calls are terminated to the network.
UCaaS revenues are recurring monthly service revenue from sales of its hosted services. Customers are billed monthly in advance for these recurring services and in arrears for one time service charges and other certain usage charges. UCaaS revenues also includes non-recurring revenue from the sale of hardware and network equipment. Revenues for recurring monthly service are recorded in the period the services are provided over the term of the respective customer agreements and revenue from the sale of hardware and network equipment is recognized in the period that the equipment is delivered and put into service.
Advertising revenues consist primarily of amounts from the Company’s Internet search partner that are generated as a result of users utilizing the partner’s Internet search services and amounts generated from display advertisements. The Company recognizes such advertising revenues in the period in which the advertisement is displayed or, for performance-based arrangements, when the related performance criteria are met. In determining whether an arrangement exists, the Company ensures that a written contract is in place, such as a standard insertion order or a customer-specific agreement. The Company assesses whether performance criteria have been met and whether the fees are fixed or determinable based on a reconciliation of the performance criteria and the payment terms associated with the transaction.
Brands Segment– Revenues are derived from various license agreements that provide revenue based on guaranteed minimum royalty payments and advertising/marketing fees with additional royalty revenue based on a percentage of defined sales. Guaranteed minimum royalty payments and advertising/marketing revenue are recognized on a straight-line basis over the term of each contract year, as defined in each license agreement. Royalty payments exceeding the guaranteed minimum amounts are recognized as income during the period corresponding to the licensee’s sales. Additionally, payments received for terminating licenses are recognized when termination agreements are entered into and collectability is probable.
Payments received as consideration for the grant of a license are recorded as deferred revenue at the time payment is received and recognized ratably as revenue over the term of the license agreement. Advanced royalty payments are recorded as deferred revenue at the time payment is received and recognized as revenue when earned. Revenue is not recognized unless collectability is probable.
76
Allowance for Doubtful Accounts. We maintain an allowance for doubtful accounts for estimated losses inherent in our accounts receivable portfolio. In establishing the required allowance, management utilizes a specific customer identification methodology. Management also considers historical losses adjusted for current market conditions and the customers’ financial condition, the amount of receivables in dispute, and the current receivables aging and current payment patterns. Account balances are charged off against the allowance after all means of collection have been exhausted and the potential for recovery is considered remote. The bad debt expense is included as a component of selling, general and administrative expenses in the accompanying consolidated statements of income.
Goodwill and Other Intangible Assets. We account for goodwill and intangible assets in accordance with the accounting guidance which requires that goodwill and other intangibles with indefinite lives be tested for impairment annually or on an interim basis if events or circumstances indicate that the fair value of an asset has decreased below its carrying value.
Goodwill includes the excess of the purchase price over the fair value of net assets acquired in business combinations and the acquisition of noncontrolling interests. The Codification requires that goodwill be tested for impairment at the reporting unit level (operating segment or one level below an operating segment). Application of the goodwill impairment test requires judgment, including the identification of reporting units, assigning assets and liabilities to reporting units, assigning goodwill to reporting units, and determining the fair value. The Company operates five reporting units, which are the same as its reporting segments described in Note 22 to the consolidated financial statements. Significant judgment is required to estimate the fair value of reporting units which includes estimating future cash flows, determining appropriate discount rates and other assumptions. Changes in these estimates and assumptions could materially affect the determination of fair value and/or goodwill impairment.
When testing goodwill for impairment, we may assess qualitative factors for some or all of our reporting units to determine whether it is more likely than not (that is, a likelihood of more than 50 percent) that the fair value of a reporting unit is less than its carrying amount, including goodwill. Alternatively, we may bypass this qualitative assessment for some or all of our reporting units and perform a detailed quantitative test of impairment (step 1). If we perform the detailed qualitative impairment test and the carrying amount of the reporting unit exceeds its fair value, we would perform an analysis (step 2) to measure such impairment. In 2019, we performed a qualitative assessment of the recoverability of our goodwill balances for each of our reporting units in performing our annual impairment test and concluded that the fair values of each of our reporting units exceeded their carrying values and no impairments were identified.
In accordance with the Codification, the Company reviews the carrying value of its intangibles, which is comprised of tradenames and customer lists, and other long-lived assets for impairment at least annually or whenever events or changes in circumstances indicate that the carrying amount of an asset may not be recoverable. Recoverability of long-lived assets is measured by comparing the carrying amount of the asset or asset group to the undiscounted cash flows that the asset or asset group is expected to generate. If the undiscounted cash flows of such assets are less than the carrying amount, the impairment to be recognized is measured by the amount by which the carrying amount of the asset or asset group, if any, exceeds its fair market value. During the year ended December 31, 2019, the Company recognized no impairment of intangibles. During the year ended December 31, 2018, the Company recognized impairment of intangibles in the amount of $1.1 million related to the tradename of Wunderlich Securities, Inc. In June 2018, the Company changed the name Wunderlich Securities, Inc. to B. Riley Wealth Management, Inc. This impairment charge is included in restructuring charge in our consolidated statements of income.
Fair Value Measurements. The Company records securities and other investments owned, securities sold not yet purchased, and mandatorily redeemable noncontrolling interests that were issued after November 5, 2003 at fair value with fair value determined in accordance with the Codification. Our mandatorily redeemable noncontrolling interests are measured at fair value on a recurring basis and are categorized using the three levels of fair value hierarchy. In general, fair values determined by Level 1 inputs utilize quoted prices (unadjusted) for identical instruments that are highly liquid, observable and actively traded in over-the-counter markets. Fair values determined by Level 2 inputs utilize inputs other than quoted prices included in Level 1 that are observable for the asset or liability, either directly or indirectly. Level 2 inputs include quoted prices for similar instruments in active markets, quoted prices for identical or similar instruments in markets that are not active and model-derived valuations whose inputs are observable and can be corroborated by market data. Level 3 inputs are unobservable inputs that are supported by little or no market activity and that are significant to the fair value of the assets or liabilities. In certain cases, the inputs used to measure fair value may fall into different levels of the fair value hierarchy. In such cases, the level in the fair value hierarchy within which the fair value measurement in its entirety falls has been determined based on the lowest level input that is significant to the fair value measurement in its entirety. Our assessment of the significance of a particular input to the fair value measurement in its entirety requires judgment and considers factors specific to the asset or liability.
The fair value of mandatorily redeemable noncontrolling interests is determined based on the issuance of similar interests for cash, references to industry comparables, and relied, in part, on information obtained from appraisal reports and internal valuation models.
77
Investments in partnership interests include investments in private equity partnerships that primarily invest in equity securities, bonds, and direct lending funds. We also invest in priority investment funds and the underlying securities held by these funds are primarily corporate and asset-backed fixed income securities and restrictions exist on the redemption of amounts invested by the Company. The Company’s partnership and investment fund interests are valued based on the Company’s proportionate share of the net assets of the partnerships and funds; the value for these investments are derived from the most recent statements received from the general partner or fund administrator. These partnership and investment fund interests are valued at net asset value (“NAV”) in accordance with ASC “Topic 820: Fair Value Measurements.”
The carrying amounts reported in the consolidated financial statements for cash, restricted cash, accounts receivable, accounts payable and accrued expenses and other current liabilities approximate fair value based on the short-term maturity of these instruments. The carrying amounts of the notes payable (including credit lines used to finance liquidation engagements), long-term debt and capital lease obligations approximate fair value because the contractual interest rates or effective yields of such instruments are consistent with current market rates of interest for instruments of comparable credit risk.
Share-Based Compensation. The Company’s share based payment awards principally consist of grants of restricted stock and restricted stock units. Share based payment awards also include grants of membership interests in the Company’s majority owned subsidiaries. The grants of membership interests consist of percentage interests in the Company’s majority owned subsidiaries as determined at the date of grant. In accordance with the accounting guidance share based payment awards are classified as either equity or a liability. For equity-classified awards, the Company measures compensation cost for the grant of membership interests at fair value on the date of grant and recognizes compensation expense in the consolidated statement of operations over the requisite service or performance period the award is expected to vest. The fair value of the liability-classified award will be subsequently remeasured at each reporting date through the settlement date. Change in fair value during the requisite service period will be recognized as compensation cost over that period.
In June 2018, the Company adopted the 2018 Employee Stock Purchase Plan (“Purchase Plan”) which allows eligible employees to purchase common stock through payroll deductions at a price that is 85% of the market value of the common stock on the last day of the offering period. In accordance with the provisions of ASC 718, “Compensation – Stock Compensation” (“ASC 718”), the Company is required to recognize compensation expense relating to shares offered under the Purchase Plan.
Income Taxes. The Company recognizes deferred tax liabilities and assets for the expected future tax consequences of events that have been included in the financial statements or tax returns. Deferred tax liabilities and assets are determined based on the difference between the financial statement and tax basis of assets and liabilities using enacted tax rates in effect for the year in which the differences are expected to reverse. The Company estimates the degree to which tax assets and credit carryforwards will result in a benefit based on expected profitability by tax jurisdiction, the eligible carryforward period, and other circumstances. A valuation allowance for such tax assets and loss carryforwards is provided when it is determined to be more likely than not that the benefit of such deferred tax asset will not be realized in future periods. Tax benefits of operating loss carryforwards are evaluated on an ongoing basis, including a review of historical and projected future operating results, the eligible carryforward period, and other circumstances. If it becomes more likely than not that a tax asset will be used, the related valuation allowance on such assets would be reduced.
The Company establishes a valuation allowance if, based on the weight of available evidence, it is more likely than not that some portion or all of the deferred tax assets will not be realized. Tax benefits of operating loss and tax credit carryforwards are evaluated on an ongoing basis, including a review of historical and projected future operating results, the eligible carryforward period, and other circumstances. As a result of the common stock offering that was completed on June 5, 2014, the Company had a more than 50% ownership shift in accordance with Internal Revenue Code Section 382. Accordingly, the Company is limited to the amount of net operating loss that may be utilized in future taxable years depending on the Company’s actual taxable income. As of December 31, 2019, the Company believes that the net operating loss that existed as of the more than 50% ownership shift will be utilized in future tax periods and it is more-likely-than-not that future taxable earnings will be sufficient to realize its deferred tax assets and has not provided an allowance.
Recent Accounting Pronouncements
See Note 2(ab) to the accompanying financial statements for recent accounting pronouncements we have not yet adopted and recently adopted.
78
Item 7A. QUANTITATIVE AND QUALITATIVE DISCLOSURES ABOUT MARKET RISK
B. Riley’s primary exposure to market risk consists of risk related to changes in interest rates. B. Riley has not used derivative financial instruments for speculation or trading purposes.
Interest Rate Risk
Our primary exposure to market risk consists of risk related to changes in interest rates. We utilize borrowings under our senior notes payable and credit facilities to fund costs and expenses incurred in connection with our acquisitions and retail liquidation engagements. Borrowings under our senior notes payable are at fixed interest rates and borrowings under our credit facilities bear interest at a floating rate of interest. In our portfolio of securities owned we invest in loans receivable that primarily bear interest at a floating rate of interest.
The primary objective of our investment activities is to preserve capital for the purpose of funding operations while at the same time maximizing the income we receive from investments without significantly increasing risk. To achieve these objectives, our investments allow us to maintain a portfolio of cash equivalents, short-term investments through a variety of securities owned that primarily includes common stocks, loans receivable and investments in partnership interests. Our cash and cash equivalents through December 31, 2019 included amounts in bank checking and liquid money market accounts. We may be exposed to interest rate risk through trading activities in convertible and fixed income securities as well as U.S. Treasury securities, however, based on our daily monitoring of this risk, we believe we currently have limited exposure to interest rate risk in these activities.
Foreign Currency Risk
The majority of our operating activities are conducted in U.S. dollars. Revenues generated from our foreign subsidiaries totaled $0.1 million for the year ended December 31, 2019 or less than 1% of our total revenues of $652.1 million during the year ended December 31, 2019. The financial statements of our foreign subsidiaries are translated into U.S. dollars at period-end rates, with the exception of revenues, costs and expenses, which are translated at average rates during the reporting period. We include gains and losses resulting from foreign currency transactions in income, while we exclude those resulting from translation of financial statements from income and include them as a component of accumulated other comprehensive income (loss). Transaction gains (losses), which were included in our consolidated statements of income, amounted to a loss of $0.2 million and a gain of $1.3 million during the year ended December 31, 2019 and 2018, respectively. We may be exposed to foreign currency risk; however, our operating results during the year ended December 31, 2019 included $0.1 million of revenues from our foreign subsidiaries and a 10% appreciation of the U.S. dollar relative to the local currency exchange rates would result in less than $0.1 million increase in our operating income and a 10% depreciation of the U.S. dollar relative to the local currency exchange rates would have resulted in a net decrease in our operating income of less than $0.1 million for the year ended December 31, 2019.
Item 8. FINANCIAL STATEMENTS AND SUPPLEMENTARY DATA
The information required by this Item 8 is submitted as a separate section beginning on page F-1 of this Annual Report on Form 10-K (the “Financial Statements”).
Item 9. CHANGES IN AND DISAGREEMENTS WITH ACCOUNTANTS ON ACCOUNTING AND FINANCIAL DISCLOSURE
None.
Item 9A. CONTROLS AND PROCEDURES
Evaluation of Disclosure Controls and Procedures
We maintain a system of disclosure controls and procedures (as defined in the Rules 13a-15(e) and 15(d)-15(e) under the Securities Exchange Act of 1934, as amended (the “Exchange Act”)) that is designed to ensure that information required to be disclosed in our Exchange Act reports is recorded, processed, summarized and reported within the time periods specified in the Securities and Exchange Commission’s rules and forms, and that such information is accumulated and communicated to our management, including our Co-Chief Executive Officers and Chief Financial Officer, as appropriate, to allow timely decisions regarding required disclosures.
79
Under the supervision and with the participation of our management, including our Co-Chief Executive Officers and Chief Financial Officer, we conducted an evaluation of our disclosure controls and procedures pursuant to Rule 13a-15 under the Exchange Act. Based upon the foregoing evaluation, our Co-Chief Executive Officers and our Chief Financial Officer concluded that as of December 31, 2019 our disclosure controls and procedures were not effective at the reasonable assurance level.
Changes in Internal Control over Financial Reporting
Except for the material weakness identified below, there have not been any changes in our internal control over financial reporting (as such term is defined in Rules 13a-15(f) and 15d-15(f) under the Exchange Act) during the fourth fiscal quarter to which this report relates that materially affected, or are reasonably likely to materially affect, our internal control over financial reporting.
Report of Management on Internal Control over Financial Reporting
Our management is responsible for establishing and maintaining adequate internal control over financial reporting (as such term is defined in Rules 13a-15(f) and 15d-15(f) under the Exchange Act). Under the supervision and with the participation of management, including our Co-Chief Executive Officers and Chief Financial Officer, we conducted an evaluation of the effectiveness of our internal control over financial reporting based on criteria established in Internal Control — Integrated Framework issued by the Committee of Sponsoring Organizations of the Treadway Commission (2013 framework) issued by the Committee of Sponsoring Organizations of the Treadway Commission. Based on our evaluation, our management concluded that our internal control over financial reporting was not effective as of December 31, 2019.
A “material weakness” is a deficiency, or a combination of deficiencies, in internal control over financial reporting, such that there is a reasonable possibility that a material misstatement of our annual or interim financial statements would not be prevented or detected on a timely basis.
Our management assessed the effectiveness of our internal control over financial reporting as of December 31, 2019 using criteria set forth in Internal Control – Integrated Framework issued by the Committee of Sponsoring Organizations of the Treadway Commission. Based on this assessment, our management concluded there is a material weakness in internal control over financial reporting as December 31, 2019 related to our disclosure controls of related party transactions. Management’s controls over related party disclosures did not operate at a level of precision to prevent or detect a potential material disclosure misstatement in the consolidated financial statements.
Remediation
Management has been implementing and continues to implement measures designed to ensure that the control deficiency contributing to the material weakness is remediated, such that the controls are designed, implemented, and operating effectively. The remediation actions include: (i) creating a related party oversight function and (ii) enhancing the related party policies and procedures with a specific focus on related party disclosures.
We believe that these actions will remediate the material weakness. The weakness will not be considered remediated, however, until the applicable controls operate for a sufficient period of time and management has concluded, through testing, that these controls are operating effectively. We expect that the remediation of this material weakness will be completed prior to the end of fiscal 2020.
Our independent registered public accounting firm, Marcum LLP, has audited the consolidated financial statements and has issued an adverse attestation report on the effectiveness of our internal control over financial reporting as of December 31, 2019, as stated in their report which is included in the Financial Statements of this Annual Report on Form 10-K.
Inherent Limitation on Effectiveness of Controls
Our management, including our Co-Chief Executive Officers and Chief Financial Officer, does not expect that our disclosure controls and procedures or our internal control over financial reporting will prevent or detect all errors and all fraud. A control system, no matter how well- designed and operated, can provide only reasonable, not absolute, assurance that the control system’s objectives will be met. The design of a control system must reflect the fact that there are resource constraints, and the benefits of controls must be considered relative to their costs. Further, because of the inherent limitations in all control systems, no evaluation of controls can provide absolute assurance that misstatements due to error or fraud will not occur or that all control issues and instances of fraud, if any, have been detected. The design of any system of controls is based in part on certain assumptions about the likelihood of future events, and there can be no assurance that any design will succeed in achieving its stated goals under all potential future conditions. Projections of any evaluation of the effectiveness of controls to future periods are subject to risks. Over time, controls may become inadequate because of changes in conditions or deterioration in the degree of compliance with policies or procedures.
None.
80
Item 10. DIRECTORS, EXECUTIVE OFFICERS AND CORPORATE GOVERNANCE
The information called for by this item is hereby incorporated by reference from our definitive Proxy Statement relating to the 2020 Annual Meeting of Stockholders, which Proxy Statement is anticipated to be filed with the Securities and Exchange Commission within 120 days of December 31, 2019.
Item 11. EXECUTIVE COMPENSATION
The information called for by this item is hereby incorporated by reference from our definitive Proxy Statement relating to the 2020 Annual Meeting of Stockholders, which Proxy Statement is anticipated to be filed with the Securities and Exchange Commission within 120 days of December 31, 2019.
Item 12. SECURITY OWNERSHIP OF CERTAIN BENEFICIAL OWNERS AND MANAGEMENT AND RELATED STOCKHOLDER MATTERS
The information called for by this item is hereby incorporated by reference from our definitive Proxy Statement relating to the 2020 Annual Meeting of Stockholders, which Proxy Statement is anticipated to be filed with the Securities and Exchange Commission within 120 days of December 31, 2019.
Item 13. CERTAIN RELATIONSHIPS AND RELATED TRANACTIONS, AND DIRECTOR INDEPENDENCE
The information called for by this item is hereby incorporated by reference from our definitive Proxy Statement relating to the 2020 Annual Meeting of Stockholders, which Proxy Statement is anticipated to be filed with the Securities and Exchange Commission within 120 days of December 31, 2019.
Item 14. PRINCIPAL ACCOUNTING FEES AND SERVICES
The information called for by this item is hereby incorporated by reference from our definitive Proxy Statement relating to the 2020 Annual Meeting of Stockholders, which Proxy Statement is anticipated to be filed with the Securities and Exchange Commission within 120 days of December 31, 2019.
81
Item 15. EXHIBITS AND FINANCIAL STATEMENT SCHEDULES
| (a) | The following documents are filed as part of this report: |
| 1. | Financial Statements. The Company’s Consolidated Financial Statements as of December 31, 2019 and 2018 and for each of the three years in the year ended December 31, 2019 and the notes thereto, together with the report of the independent auditors on those Consolidated Financial Statements and the effectiveness of internal control over financial reporting of the Company are hereby filed as part of this report, beginning on page F-1. |
| 2. | Financial Statement Schedules. |
Financial Statement Schedules other than those listed above have been omitted because they are either not applicable or the information is otherwise included in the consolidated financial statements or the notes thereto.
| (b) | Exhibits and Index to Exhibits, below. |
Exhibit Index
82
83
84
85
86
| * | Filed herewith. |
| ** | Furnished herewith. |
| + | Schedules to this exhibit have been omitted pursuant to Item 601(b)(2) of Regulation S-K. The registrant hereby agrees to furnish a copy of any omitted schedules to the Securities and Exchange Commission upon request. |
| # | Management contract or compensatory plan or arrangement. |
None.
87
Pursuant to the requirements of Section 13 or 15(d) of the Securities Exchange Act of 1934, the registrant has duly caused this report to be signed on its behalf by the undersigned, thereunto duly authorized.
| B. Riley Financial, Inc. | |
| Date: March 9, 2020 | /s/ PHILLIP J. AHN |
| (Phillip J. Ahn, Chief Financial Officer and Chief Operating Officer) |
Pursuant to the requirements of the Securities Exchange Act of 1934, this report has been signed below by the following persons on behalf of the registrant and in the capacities and on the date indicated:
| Signature | Title | Date | ||
| /s/ BRYANT R. RILEY | Co-Chief Executive Officer | March 9, 2020 | ||
| (Bryant R. Riley) | Chairman of the Board (Principal Executive Officer) | |||
| /s/ THOMAS J. KELLEHER | Co-Chief Executive Officer | March 9, 2020 | ||
| (Thomas J. Kelleher) | Director | |||
| /s/ PHILLIP J. AHN | Chief Financial Officer | March 9, 2020 | ||
| (Phillip J. Ahn) | Chief Operating Officer (Principal Financial Officer) | |||
| /s/ HOWARD E. WEITZMAN | Chief Accounting Officer | March 9, 2020 | ||
| (Howard E. Weitzman) | (Principal Accounting Officer) | |||
| /s/ ROBERT D’AGOSTINO | Director | March 9, 2020 | ||
| (Robert D’Agostino) | ||||
| /s/ ROBERT L. ANTIN | Director | March 9, 2020 | ||
| (Robert L. Antin) | ||||
| /s/ ANDREW GUMAER | Director | March 9, 2020 | ||
| (Andrew Gumaer) | ||||
| /s/ MICHAEL J. SHELDON | Director | March 9, 2020 | ||
| (Michael J. Sheldon) | ||||
| /s/ TODD D. SIMS | Director | March 9, 2020 | ||
| (Todd D. Sims) | ||||
| /s/ MIMI WALTERS | Director |
March 9, 2020 | ||
| (Mimi Walters) | ||||
| /s/ MIKEL H. WILLIAMS | Director | March 9, 2020 | ||
| (Mikel H. Williams) |
88
B. RILEY FINANCIAL, INC.
INDEX TO CONSOLIDATED FINANCIAL STATEMENTS
F-1
REPORT OF INDEPENDENT REGISTERED PUBLIC ACCOUNTING FIRM
To the Shareholders and Board of Directors of
B. Riley Financial, Inc.
Opinion on the Financial Statements
We have audited the accompanying consolidated balance sheets of B. Riley Financial, Inc. and Subsidiaries (the “Company”) as of December 31, 2019 and 2018, the related consolidated statements of income, comprehensive income, equity and cash flows for each of the three years in the period ended December 31, 2019, and the related notes (collectively referred to as the “financial statements”). In our opinion, the financial statements present fairly, in all material respects, the financial position of the Company as of December 31, 2019 and 2018, and the results of its operations and its cash flows for each of the three years in the period ended December 31, 2019, in conformity with accounting principles generally accepted in the United States of America.
We also have audited, in accordance with the standards of the Public Company Accounting Oversight Board (United States) ("PCAOB"), the Company's internal control over financial reporting as of December 31, 2019, based on the criteria established in Internal Control - Integrated Framework issued by the Committee of Sponsoring Organizations of the Treadway Commission (COSO) in 2013 and our report dated March 9, 2020, expressed an adverse opinion on the effectiveness of the Company’s internal control over financial reporting.
Basis for Opinion
These financial statements are the responsibility of the Company's management. Our responsibility is to express an opinion on the Company's financial statements based on our audits. We are a public accounting firm registered with the PCAOB and are required to be independent with respect to the Company in accordance with the U.S. federal securities laws and the applicable rules and regulations of the Securities and Exchange Commission and the PCAOB.
We conducted our audits in accordance with the standards of the PCAOB. Those standards require that we plan and perform the audits to obtain reasonable assurance about whether the financial statements are free of material misstatement, whether due to error or fraud. Our audits included performing procedures to assess the risks of material misstatement of the financial statements, whether due to error or fraud, and performing procedures that respond to those risks. Such procedures included examining, on a test basis, evidence regarding the amounts and disclosures in the financial statements. Our audits also included evaluating the accounting principles used and significant estimates made by management, as well as evaluating the overall presentation of the financial statements. We believe that our audits provides a reasonable basis for our opinion.
/s/ Marcum LLP
We have served as the Company’s auditor since 2009.
Marcum LLP
New York, NY
March 9, 2020
F-2
REPORT OF INDEPENDENT REGISTERED PUBLIC ACCOUNTING FIRM ON INTERNAL CONTROL OVER FINANCIAL REPORTING
To the Shareholders and Board of Directors of
B. Riley Financial, Inc.
Opinion on the Financial Statements
We have audited B. Riley Financial, Inc.'s (the “Company”) internal control over financial reporting as of December 31, 2019, based on criteria established in Internal Control-Integrated Framework (2013) issued by the Committee of Sponsoring Organizations of the Treadway Commission. In our opinion, because of the effect of the material weakness described below, the Company did not maintain, in all material respects, effective internal control over financial reporting as of December 31, 2019, based on criteria established in Internal Control – Integrated Framework (2013) issued by the Committee of Sponsoring Organizations of the Treadway Commission.
A “material weakness” is a deficiency, or a combination of deficiencies, in internal control over financial reporting, such that there is a reasonable possibility that a material misstatement of the Company’s annual or interim financial statements will not be prevented or detected on a timely basis. The following material weakness has been identified and included in “Management Annual Report on Internal Control over Financial Reporting”.
The Company uses certain controls for the identification and disclosure of material related party transactions. These controls were not effective, and as a result, the Company did not have adequate controls in place as of December 31, 2019 to properly identify and disclose material related party transactions in accordance with ASC 850, Related Party Disclosures.
The material weakness was considered in determining the nature, timing, and extend of audit tests applied in our audit of the 2019 financial statements, and this report does not affect our report dated March 9, 2020 on those consolidated financial statements.
We have also audited, in accordance with the standards of the Public Company Accounting Oversight Board (United States) (“PCAOB”), the consolidated balance sheets as of December 31, 2019 and 2018 and the related consolidated statements of income, comprehensive income, equity, and cash flows and the related notes for each of the three years in the period ended December 31, 2019 of the Company, and our report dated March 9, 2020 expressed an unqualified opinion on those financial statements.
Basis for Opinion
The Company's management is responsible for maintaining effective internal control over financial reporting, and for its assessment of the effectiveness of internal control over financial reporting, included in the accompanying “Management Annual Report on Internal Control over Financial Reporting”. Our responsibility is to express an opinion on the Company's internal control over financial reporting based on our audit. We are a public accounting firm registered with the PCAOB and are required to be independent with respect to the Company in accordance with the U.S. federal securities laws and the applicable rules and regulations of the Securities and Exchange Commission and the PCAOB.
We conducted our audit in accordance with the standards of the PCAOB. Those standards require that we plan and perform the audit to obtain reasonable assurance about whether effective internal control over financial reporting was maintained in all material respects. Our audit of internal control over financial reporting included obtaining an understanding of internal control over financial reporting, assessing the risk that a material weakness exists, and testing and evaluating the design and operating effectiveness of internal control based on the assessed risk. Our audit also included performing such other procedures as we considered necessary in the circumstances. We believe that our audit provides a reasonable basis for our opinion.
Definition and Limitations of Internal Control over Financial Reporting
A company’s internal control over financial reporting is a process designed to provide reasonable assurance regarding the reliability of financial reporting and the preparation of financial statements for external purposes in accordance with generally accepted accounting principles. A company’s internal control over financial reporting includes those policies and procedures that (1) pertain to the maintenance of records that, in reasonable detail, accurately and fairly reflect the transactions and dispositions of the assets of the company; (2) provide reasonable assurance that transactions are recorded as necessary to permit preparation of financial statements in accordance with generally accepted accounting principles, and that receipts and expenditures of the company are being made only in accordance with authorizations of management and directors of the company; and (3) provide reasonable assurance regarding prevention or timely detection of unauthorized acquisition, use, or disposition of the company’s assets that could have a material effect on the financial statements.
Because of the inherent limitations, internal control over financial reporting may not prevent or detect misstatements. Also, projections of any evaluation of effectiveness to future periods are subject to the risk that controls may become inadequate because of changes in conditions, or that degree of compliance with the policies or procedures may deteriorate.
/s/ Marcum LLP
We have served as the Company’s auditor since 2009.
Marcum LLP
New York, NY
March 9, 2020
F-3
PART I. FINANCIAL INFORMATION
Item 1. Financial Statements.
B. RILEY FINANCIAL, INC. AND SUBSIDIARIES
Consolidated Balance Sheets
(Dollars in thousands, except par value)
| December 31, | December 31, | |||||||
| 2019 | 2018 | |||||||
| Assets | ||||||||
| Assets: | ||||||||
| Cash and cash equivalents | $ | 104,268 | $ | 179,440 | ||||
| Restricted cash | 471 | 838 | ||||||
| Due from clearing brokers | 23,818 | 37,738 | ||||||
| Securities and other investments owned, at fair value | 451,551 | 273,577 | ||||||
| Securities borrowed | 814,331 | 931,346 | ||||||
| Accounts receivable, net | 46,624 | 42,123 | ||||||
| Due from related parties | 5,832 | 1,729 | ||||||
| Advances against customer contracts | 27,347 | — | ||||||
| Loans receivable (includes $157,080 from related parties at December 31, 2019) | 225,848 | 38,794 | ||||||
| Prepaid expenses and other assets | 81,808 | 79,477 | ||||||
| Operating lease right-of-use assets | 47,809 | — | ||||||
| Property and equipment, net | 12,727 | 15,523 | ||||||
| Goodwill | 223,697 | 223,368 | ||||||
| Other intangible assets, net | 220,525 | 91,358 | ||||||
| Deferred income taxes | 31,522 | 42,399 | ||||||
| Total assets | $ | 2,318,178 | $ | 1,957,710 | ||||
| Liabilities and Equity | ||||||||
| Liabilities: | ||||||||
| Accounts payable | $ | 4,477 | $ | 5,646 | ||||
| Accrued expenses and other liabilities | 130,714 | 108,662 | ||||||
| Deferred revenue | 67,121 | 69,066 | ||||||
| Due to related parties and partners | 1,750 | 2,428 | ||||||
| Securities sold not yet purchased | 41,820 | 37,623 | ||||||
| Securities loaned | 810,495 | 930,522 | ||||||
| Mandatorily redeemable noncontrolling interests | 4,616 | 4,633 | ||||||
| Operating lease liabilities | 61,511 | — | ||||||
| Notes payable | 38,167 | 1,550 | ||||||
| Loan participations sold | 12,478 | — | ||||||
| Term loan | 66,666 | 79,166 | ||||||
| Senior notes payable | 688,112 | 459,754 | ||||||
| Total liabilities | 1,927,927 | 1,699,050 | ||||||
| Commitments and contingencies (Note 17) | ||||||||
| B. Riley Financial, Inc. stockholders’ equity: | ||||||||
| Preferred stock, $0.0001 par value; 1,000,000 shares authorized; 2,349 shares issued and outstanding as of December 31, 2019 and none issued and outstanding as of December 31, 2018; liquidation preference of $58,723 as of December 31, 2019. | — | — | ||||||
| Common stock, $0.0001 par value; 100,000,000 shares authorized; 26,972,332 and 26,603,355 issued and outstanding as of December 31, 2019 and December 31, 2018, respectively. | 3 | 2 | ||||||
| Additional paid-in capital | 323,109 | 258,638 | ||||||
| Retained earnings | 39,536 | 1,579 | ||||||
| Accumulated other comprehensive loss | (1,988 | ) | (2,161 | ) | ||||
| Total B. Riley Financial, Inc. stockholders’ equity | 360,660 | 258,058 | ||||||
| Noncontrolling interests | 29,591 | 602 | ||||||
| Total equity | 390,251 | 258,660 | ||||||
| Total liabilities and equity | $ | 2,318,178 | $ | 1,957,710 | ||||
The accompanying notes are an integral part of these consolidated financial statements.
F-4
B. RILEY FINANCIAL, INC. AND SUBSIDIARIES
Consolidated Statements of Income
(Dollars in thousands, except share data)
| Year Ended December 31, | ||||||||||||
| 2019 | 2018 | 2017 | ||||||||||
| Revenues: | ||||||||||||
| Services and fees | $ | 566,956 | $ | 384,076 | $ | 302,113 | ||||||
| Interest income - Loans and securities lending | 77,221 | 38,277 | 19,756 | |||||||||
| Sale of goods | 7,935 | 638 | 307 | |||||||||
| Total revenues | 652,112 | 422,991 | 322,176 | |||||||||
| Operating expenses: | ||||||||||||
| Direct cost of services | 58,824 | 34,754 | 40,625 | |||||||||
| Cost of goods sold | 7,575 | 800 | 398 | |||||||||
| Selling, general and administrative expenses | 385,219 | 310,508 | 227,884 | |||||||||
| Restructuring charge | 1,699 | 8,506 | 12,374 | |||||||||
| Interest expense - Securities lending and loan participations sold | 32,144 | 23,039 | 12,051 | |||||||||
| Total operating expenses | 485,461 | 377,607 | 293,332 | |||||||||
| Operating income | 166,651 | 45,384 | 28,844 | |||||||||
| Other income (expense): | ||||||||||||
| Interest income | 1,577 | 1,326 | 420 | |||||||||
| (Loss) income from equity investments | (1,431 | ) | 7,986 | (437 | ) | |||||||
| Interest expense | (50,205 | ) | (33,393 | ) | (8,382 | ) | ||||||
| Income before income taxes | 116,592 | 21,303 | 20,445 | |||||||||
| Provision for income taxes | (34,644 | ) | (4,903 | ) | (8,510 | ) | ||||||
| Net income | 81,948 | 16,400 | 11,935 | |||||||||
| Net income attributable to noncontrolling interests | 337 | 891 | 379 | |||||||||
| Net income attributable to B. Riley Financial, Inc. | 81,611 | 15,509 | 11,556 | |||||||||
| Preferred stock dividends | 264 | — | — | |||||||||
| Net income available to common shareholders | $ | 81,347 | $ | 15,509 | $ | 11,556 | ||||||
| Basic income per common share | $ | 3.08 | $ | 0.60 | $ | 0.50 | ||||||
| Diluted income per common share | $ | 2.95 | $ | 0.58 | $ | 0.48 | ||||||
| Weighted average basic common shares outstanding | 26,401,036 | 25,937,305 | 23,181,388 | |||||||||
| Weighted average diluted common shares outstanding | 27,529,157 | 26,764,856 | 24,290,904 | |||||||||
The accompanying notes are an integral part of these consolidated financial statements.
F-5
B. RILEY FINANCIAL, INC. AND SUBSIDIARIES
Consolidated Statements of Comprehensive Income
(Dollars in thousands)
| Year Ended December 31, | ||||||||||||
| 2019 | 2018 | 2017 | ||||||||||
| Net income | $ | 81,948 | $ | 16,400 | $ | 11,935 | ||||||
| Other comprehensive income (loss): | ||||||||||||
| Change in cumulative translation adjustment | 173 | (1,627 | ) | 1,178 | ||||||||
| Other comprehensive income (loss), net of tax | 173 | (1,627 | ) | 1,178 | ||||||||
| Total comprehensive income | 82,121 | 14,773 | 13,113 | |||||||||
| Comprehensive income attributable to noncontrolling interests | 337 | 891 | 379 | |||||||||
| Comprehensive income attributable to B. Riley Financial, Inc. | $ | 81,784 | $ | 13,882 | $ | 12,734 | ||||||
The accompanying notes are an integral part of these consolidated financial statements.
F-6
B. RILEY FINANCIAL, INC. AND SUBSIDIARIES
Consolidated Statements of Equity
(Dollars in thousands, except share data)
| Accumulated | ||||||||||||||||||||||||||||||||||||
| Additional | Other | |||||||||||||||||||||||||||||||||||
| Preferred Stock | Common Stock | Paid-in | Retained | Comprehensive | Noncontrolling | Total | ||||||||||||||||||||||||||||||
| Shares | Amount | Shares | Amount | Capital | Earnings | Loss | Interests | Equity | ||||||||||||||||||||||||||||
| Balance, January 1, 2017 | — | $ | — | 19,140,342 | $ | 2 | $ | 141,170 | $ | 9,887 | $ | (1,712 | ) | $ | 1,045 | $ | 150,392 | |||||||||||||||||||
| Issuance of common stock for acquisition of MK Capital, LLC - contingent equity consideration on February 2, 2017 | — | — | 166,666 | — | 1,151 | — | — | — | 1,151 | |||||||||||||||||||||||||||
| Issuance of common stock for acquisition Dialectic general partner interests on April 13, 2017 | — | — | 158,484 | — | 1,952 | — | — | — | 1,952 | |||||||||||||||||||||||||||
| Issuance of common stock for acquisition of FBR & Co. on June 1, 2017 | — | — | 4,779,354 | — | 73,471 | — | — | — | 73,471 | |||||||||||||||||||||||||||
| Issuance of common stock and common stock warrants for acquisition of Wunderlich on July 3, 2017 | — | — | 1,974,812 | — | 35,381 | — | — | — | 35,381 | |||||||||||||||||||||||||||
| Vesting of restricted stock, net of shares withheld for employer taxes | — | — | 349,804 | — | (3,486 | ) | — | — | — | (3,486 | ) | |||||||||||||||||||||||||
| Share based payments | — | — | — | — | 10,341 | — | — | — | 10,341 | |||||||||||||||||||||||||||
| Dividends on common stock ($0.67 per share) | — | — | — | — | — | (14,861 | ) | — | — | (14,861 | ) | |||||||||||||||||||||||||
| Net income | — | — | — | — | — | 11,556 | — | (307 | ) | 11,249 | ||||||||||||||||||||||||||
| Distributions to noncontrolling interests | — | — | — | — | — | — | — | (922 | ) | (922 | ) | |||||||||||||||||||||||||
| Foreign currency translation adjustment | — | — | — | — | — | — | 1,178 | — | 1,178 | |||||||||||||||||||||||||||
| Balance, December 31, 2017 | — | $ | — | 26,569,462 | $ | 2 | $ | 259,980 | $ | 6,582 | $ | (534 | ) | $ | (184 | ) | $ | 265,846 | ||||||||||||||||||
| Issuance of common stock for acquisition of GlassRatner Advisory & Capital Group LLC | — | — | 405,817 | — | 8,050 | — | — | — | 8,050 | |||||||||||||||||||||||||||
| ESPP shares issued and vesting of restricted stock, net of shares withheld for employer taxes | — | — | 682,442 | — | (3,731 | ) | — | — | — | (3,731 | ) | |||||||||||||||||||||||||
| Common shares cancelled - resolution of escrow claim | — | — | (21,233 | ) | — | — | — | — | — | — | ||||||||||||||||||||||||||
| Common stock repurchased and retired | — | — | (1,033,133 | ) | — | (18,703 | ) | — | — | — | (18,703 | ) | ||||||||||||||||||||||||
| Share based payments | — | — | — | — | 13,042 | — | — | — | 13,042 | |||||||||||||||||||||||||||
| Dividends on common stock ($0.74 per share) | — | — | — | — | — | (20,512 | ) | — | — | (20,512 | ) | |||||||||||||||||||||||||
| Net income | — | — | — | — | — | 15,509 | — | 786 | 16,295 | |||||||||||||||||||||||||||
| Foreign currency translation adjustment | — | — | — | — | — | — | (1,627 | ) | — | (1,627 | ) | |||||||||||||||||||||||||
| Balance, December 31, 2018 | — | $ | — | 26,603,355 | $ | 2 | $ | 258,638 | $ | 1,579 | $ | (2,161 | ) | $ | 602 | $ | 258,660 | |||||||||||||||||||
| Common stock issued | — | — | 2,248 | — | 63 | — | — | — | 63 | |||||||||||||||||||||||||||
| Preferred stock issued | 2,349 | — | — | — | 56,566 | — | — | — | 56,566 | |||||||||||||||||||||||||||
| Issuance of common stock warrant for purchase of BR Brand Holdings, LLC | — | — | — | — | 990 | — | — | — | 990 | |||||||||||||||||||||||||||
| ESPP shares issued and vesting of restricted stock, net of shares withheld for employer taxes | — | — | 604,661 | 1 | (2,014 | ) | — | — | — | (2,013 | ) | |||||||||||||||||||||||||
| Common stock repurchased and retired | — | — | (237,932 | ) | — | (4,273 | ) | — | — | — | (4,273 | ) | ||||||||||||||||||||||||
| Warrants repurchased and retired | — | — | — | — | (2,777 | ) | — | — | — | (2,777 | ) | |||||||||||||||||||||||||
| Share based payments | — | — | — | — | 15,916 | — | — | — | 15,916 | |||||||||||||||||||||||||||
| Dividends on common stock ($1.49 per share) | — | — | — | — | — | (43,390 | ) | — | — | (43,390 | ) | |||||||||||||||||||||||||
| Dividends on preferred stock ($114.58 per share) | — | — | — | — | — | (264 | ) | — | — | (264 | ) | |||||||||||||||||||||||||
| Net income | — | — | — | — | — | 81,611 | — | 337 | 81,948 | |||||||||||||||||||||||||||
| Distributions to noncontrolling interests | — | — | — | — | — | — | — | (721 | ) | (721 | ) | |||||||||||||||||||||||||
| Noncontrolling interest from purchase of BR Brand Holdings, LLC | — | — | — | — | — | — | — | 29,373 | 29,373 | |||||||||||||||||||||||||||
| Foreign currency translation adjustment | — | — | — | — | — | — | 173 | — | 173 | |||||||||||||||||||||||||||
| Balance, Year Ended December 31, 2019 | 2,349 | $ | — | 26,972,332 | $ | 3 | $ | 323,109 | $ | 39,536 | $ | (1,988 | ) | $ | 29,591 | $ | 390,251 | |||||||||||||||||||
The accompanying notes are an integral part of these consolidated financial statements.
F-7
B. RILEY FINANCIAL, INC. AND SUBSIDIARIES
Consolidated Statements of Cash Flows
(Dollars in thousands)
| Year Ended December 31, | ||||||||||||
| 2019 | 2018 | 2017 | ||||||||||
| Cash flows from operating activities: | ||||||||||||
| Net income | $ | 81,948 | $ | 16,400 | $ | 11,935 | ||||||
| Adjustments to reconcile net income to net cash used in operating activities: | ||||||||||||
| Depreciation and amortization | 19,048 | 13,809 | 11,140 | |||||||||
| Provision for doubtful accounts | 2,126 | 1,308 | 1,066 | |||||||||
| Share-based compensation | 15,916 | 13,042 | 10,341 | |||||||||
| Recovery of key man life insurance | — | — | (6,000 | ) | ||||||||
| Non-cash interest and other | (12,267 | ) | 4,068 | 456 | ||||||||
| Effect of foreign currency on operations | (78 | ) | (916 | ) | (769 | ) | ||||||
| Loss (income) from equity investments | 1,431 | (7,986 | ) | 437 | ||||||||
| Deferred income taxes | 10,874 | 1,990 | 5,729 | |||||||||
| Impairment of leaseholds and intangibles, lease loss accrual and gain on disposal of fixed assets | (286 | ) | 4,142 | 3,602 | ||||||||
| Income allocated and fair value adjustment for mandatorily redeemable noncontrolling interests | 1,220 | 1,222 | 10,799 | |||||||||
| Change in operating assets and liabilities: | ||||||||||||
| Due from clearing brokers | 13,920 | (6,259 | ) | 3,359 | ||||||||
| Securities and other investments owned | (165,765 | ) | (128,217 | ) | (82,143 | ) | ||||||
| Securities borrowed | 117,015 | (124,257 | ) | 47,595 | ||||||||
| Accounts receivable and advances against customer contracts | (33,927 | ) | (12,948 | ) | 1,614 | |||||||
| Prepaid expenses and other assets | 9,588 | (24,395 | ) | (1,506 | ) | |||||||
| Accounts payable, accrued payroll and related expenses, accrued expenses and other liabilities | 32,553 | 3,559 | (30,374 | ) | ||||||||
| Amounts due to/from related parties and partners | (4,781 | ) | 4,705 | (11,826 | ) | |||||||
| Securities sold, not yet purchased | 4,197 | 9,332 | 7,678 | |||||||||
| Deferred revenue | (3,098 | ) | (564 | ) | (668 | ) | ||||||
| Securities loaned | (120,026 | ) | 127,151 | (64,255 | ) | |||||||
| Net cash used in operating activities | (30,392 | ) | (104,814 | ) | (81,790 | ) | ||||||
| Cash flows from investing activities: | ||||||||||||
| Purchases of loans receivable | (343,811 | ) | (38,794 | ) | — | |||||||
| Repayments of loans receivable | 159,186 | — | — | |||||||||
| Loan participations sold | 31,806 | — | — | |||||||||
| Repayment of loan participations sold | (18,911 | ) | — | — | ||||||||
| Asset acquisition - Brands, net of cash acquired $2,160 | (114,912 | ) | — | — | ||||||||
| Acquisition of magicJack, net of cash acquired $53,875 | — | (89,240 | ) | — | ||||||||
| Acquisition of Wunderlich, net of cash acquired $4,259 | — | — | (25,478 | ) | ||||||||
| Cash acquired from acquisition of FBR & Co. | — | — | 15,738 | |||||||||
| Acquisition of other businesses | — | (4,000 | ) | (2,052 | ) | |||||||
| Acquisition of United Online, net of cash acquired $125,542 in 2016 | — | — | (10,381 | ) | ||||||||
| Proceeds from sale of division of magicJack | 6,196 | — | — | |||||||||
| Purchases of property, equipment and intangible assets | (3,461 | ) | (5,432 | ) | (825 | ) | ||||||
| Proceeds from sale of property, equipment and intangible assets | 513 | 37 | 836 | |||||||||
| Proceeds from key man life insurance | — | — | 6,000 | |||||||||
| Equity investments | (33,391 | ) | (16,640 | ) | (1,674 | ) | ||||||
| Dividends and distributions from equity investments | 21,389 | 2,628 | — | |||||||||
| Net cash used in investing activities | (295,396 | ) | (151,441 | ) | (17,836 | ) | ||||||
| Cash flows from financing activities: | ||||||||||||
| Proceeds from asset based credit facility | 140,439 | 300,000 | 65,987 | |||||||||
| Repayment of asset based credit facility | (103,343 | ) | (300,000 | ) | (65,987 | ) | ||||||
| Proceeds from notes payable | — | 51,020 | — | |||||||||
| Repayment of notes payable | (478 | ) | (51,713 | ) | (8,336 | ) | ||||||
| Payment of participating note payable and contingent consideration | (4,250 | ) | — | (1,250 | ) | |||||||
| Proceeds from term loan | 10,000 | 80,000 | — | |||||||||
| Repayment of term loan | (22,734 | ) | — | — | ||||||||
| Proceeds from issuance of senior notes | 281,924 | 258,997 | 179,471 | |||||||||
| Redemption of senior notes | (52,154 | ) | — | — | ||||||||
| Payment of debt issuance costs | (3,425 | ) | (7,260 | ) | (4,289 | ) | ||||||
| Payment of employment taxes on vesting of restricted stock | (2,022 | ) | (3,731 | ) | (3,486 | ) | ||||||
| Common dividends paid | (41,138 | ) | (22,684 | ) | (16,755 | ) | ||||||
| Preferred dividends paid | (264 | ) | — | — | ||||||||
| Repurchase of common stock | (4,273 | ) | (18,703 | ) | — | |||||||
| Repurchase of warrants | (2,777 | ) | — | — | ||||||||
| Distribution to noncontrolling interests | (1,958 | ) | (1,067 | ) | (11,261 | ) | ||||||
| Proceeds from offering common stock | 63 | — | — | |||||||||
| Proceeds from offering preferred stock | 56,566 | — | — | |||||||||
| Net cash provided by financing activities | 250,176 | 284,859 | 134,094 | |||||||||
| (Decrease) increase in cash, cash equivalents and restricted cash | (75,612 | ) | 28,604 | 34,468 | ||||||||
| Effect of foreign currency on cash, cash equivalents and restricted cash | 73 | (860 | ) | 2,667 | ||||||||
| Net (decrease) increase in cash, cash equivalents and restricted cash | (75,539 | ) | 27,744 | 37,135 | ||||||||
| Cash, cash equivalents and restricted cash, beginning of year | 180,278 | 152,534 | 115,399 | |||||||||
| Cash, cash equivalents and restricted cash, end of year | $ | 104,739 | $ | 180,278 | $ | 152,534 | ||||||
| Supplemental disclosures: | ||||||||||||
| Interest paid | $ | 75,625 | $ | 50,103 | $ | 18,840 | ||||||
| Taxes paid | $ | 8,649 | $ | 6,497 | $ | 14,986 | ||||||
The accompanying notes are an integral part of these consolidated financial statements.
F-8
B. RILEY FINANCIAL, INC. AND SUBSIDIARIES
NOTES TO CONSOLIDATED FINANCIAL STATEMENTS
(Dollars in thousands, except share data)
NOTE 1 — ORGANIZATION AND NATURE OF BUSINESS OPERATIONS
B. Riley Financial, Inc. and its subsidiaries (collectively, the “Company”) provide investment banking and financial services to corporate, institutional and high net worth clients, and asset disposition, valuation and appraisal and capital advisory services to a wide range of retail, wholesale and industrial clients, as well as lenders, capital providers, private equity investors and professional services firms throughout the United States, Australia, Canada, and Europe and with the acquisitions of United Online, Inc. (“UOL”) on July 1, 2016 and magicJack VocalTec Ltd. (“magicJack”) on November 14, 2018, provide consumer Internet access and cloud communication services. The Company acquired a majority ownership of BR Brand Holding, LLC on October 28, 2019, through which the Company provides licensing of trademarks.
The Company operates in five operating segments: (i) Capital Markets, through which the Company provides investment banking, corporate finance, securities lending, restructuring, consulting, research, sales and trading and wealth management services to corporate, institutional and high net worth clients; (ii) Auction and Liquidation, through which the Company provides auction and liquidation services to help clients dispose of assets that include multi-location retail inventory, wholesale inventory, trade fixtures, machinery and equipment, intellectual property and real property; (iii) Valuation and Appraisal, through which the Company provides valuation and appraisal services to clients with independent appraisals in connection with asset based loans, acquisitions, divestitures and other business needs; (iv) Principal Investments - United Online and magicJack, through which the Company provides consumer Internet access and related subscription services from United Online and cloud communication services primarily through the magicJack devices; and (v) Brands, through which the Company licenses trademarks.
NOTE 2 — SUMMARY OF SIGNIFICANT ACCOUNTING POLICIES
(a) Principles of Consolidation and Basis of Presentation
The consolidated financial statements include the accounts of B. Riley Financial, Inc. and its wholly-owned and majority-owned subsidiaries. The consolidated financial statements also include the accounts of (a) Great American Global Partners, LLC which is controlled by the Company as a result of its ownership of a 50% member interest, appointment of two of the three executive officers and significant influence over the funding of operations, and (b) GA Retail Investments, L.P. which is controlled by the Company as a result of its ownership of a 50% partnership interest, appointment of executive officers and significant influence over the operations. All intercompany accounts and transactions have been eliminated upon consolidation.
The accounting guidance requires an enterprise to perform an analysis to determine whether the enterprise’s variable interest or interests give it a controlling financial interest in a variable interest entity; to require ongoing reassessments of whether an enterprise is the primary beneficiary of a Variable Interest Entity (“VIE”); to eliminate the solely quantitative approach previously required for determining the primary beneficiary of a VIE; to add an additional reconsideration event for determining whether an entity is a VIE when any changes in facts and circumstances occur such that holders of the equity investment at risk, as a group, lose the power from voting rights or similar rights of those investments to direct the activities of the entity that most significantly impact the entity’s economic performance; and to require enhanced disclosures that will provide users of financial statements with more transparent information about an enterprise’s involvement in a VIE.
(b) Use of Estimates
The preparation of the consolidated financial statements in accordance with accounting principles generally accepted in the United States of America (“GAAP”) requires management to make estimates and assumptions that affect the reported amounts of assets and liabilities at the date of the consolidated financial statements and reported amounts of revenue and expense during the reporting period. Estimates are used when accounting for certain items such as valuation of securities, allowance for doubtful accounts, the fair value of intangible assets and goodwill, the fair value of mandatorily redeemable noncontrolling interests, fair value of share based arrangements, accounting for income tax valuation allowances, recovery of contract assets and sales returns and allowances. Estimates are based on historical experience, where applicable, and assumptions that management believes are reasonable under the circumstances. Due to the inherent uncertainty involved with estimates, actual results may differ.
(c) Revenue Recognition
On January 1, 2018, the Company adopted Accounting Standards Codification (“ASC”) 606 – Revenue from Contracts with Customers using the modified retrospective method and the impact was determined to be immaterial on our consolidated financial statements. The new revenue standard was applied prospectively in the Company’s consolidated financial statements from January 1, 2018 forward and reported financial information for historical comparable periods will not be revised and will continue to be reported under the accounting standards in effect during those historical periods.
F-9
Revenues are recognized when control of the promised goods or performance obligations for services is transferred to the Company’s customers, in an amount that reflects the consideration the Company expects to be entitled to in exchange for the goods or services.
Revenues from contracts with customers in the Capital Markets segment, Auction and Liquidation segment, Valuation and Appraisal segment, Principal Investments – United Online and magicJack segment and Brands segment are primarily comprised of the following:
Capital Markets segment – Fees earned from corporate finance and investment banking services are derived from debt, equity and convertible securities offerings in which the Company acted as an underwriter or placement agent. Fees from underwriting activities are recognized as revenues when the performance obligation for the services related to the underwriting transaction is satisfied under the terms of the engagement and is not subject to any other contingencies. Fees are also earned from financial advisory and consulting services rendered in connection with client mergers, acquisitions, restructurings, recapitalizations and other strategic transactions. The performance obligation for financial advisory services is satisfied over time as work progresses on the engagement and services are delivered to the client. The performance obligation for financial advisory services may also include success and performance based fees which are recognized as revenue when the performance obligation is no longer constrained and it is not probable that the revenue recognized would be subject to significant reversal in a future period. Generally, it is probable that the revenue recognized is no longer subject to significant reversal upon the closing of the investment banking transaction.
Fees from wealth and asset management services consist primarily of investment management fees that are recognized over the period the performance obligation for the services are provided. Investment management fees are primarily comprised of fees for investment management services and are generally based on the dollar amount of the assets being managed.
Revenues from sales and trading are recognized when the performance obligation is satisfied and include commissions resulting from equity securities transactions executed as agent or principal and are recorded on a trade date basis and fees paid for equity research.
Revenues from other sources in the Capital Markets segment is primarily comprised of (i) interest income from loans receivable and securities lending activities, (ii) related net trading gains and losses from market making activities, the commitment of capital to facilitate customer orders, (iii) trading activities from the Company’s Principal Investments in equity and other securities for the Company’s account, and (iv) other income.
Interest income from securities lending activities consists of interest income from equity and fixed income securities that are borrowed from one party and loaned to another. The Company maintains relationships with a broad group of banks and broker-dealers to facilitate the sourcing, borrowing and lending of equity and fixed income securities in a “matched book” to limit the Company’s exposure to fluctuations in the market value or securities borrowed and securities loaned.
Other revenues include (i) net trading gains and losses from market making activities in the Company’s fixed income group, (ii) carried interest from the Company’s asset management recognized as earnings from financial assets within the scope of ASC 323 - Investments - Equity Method and Joint Ventures, and therefore will not be in the scope of ASC 606 - Revenue from Contracts with Customers. In accordance with ASC 323 - Investments - Equity Method and Joint Ventures, the Company will record equity method income (losses) as a component of investment income based on the change in the Company’s proportionate claim on net assets of the investment fund, including performance-based capital allocations, assuming the investment fund was liquidated as of each reporting date pursuant to each fund’s governing agreements, and (iii) other miscellaneous income
Auction and Liquidation segment – Commission and fees earned on the sale of goods at Auction and Liquidation sales are recognized when evidence of a contract or arrangement exists, the transaction price has been determined, and the performance obligation has been satisfied when control of the product and risks of ownership has been transferred to the buyer. The commission and fees earned for these services are included in revenues in the accompanying consolidated statements of income. Under these types of arrangements, revenues also include contractual reimbursable costs.
F-10
Revenues earned from Auction and Liquidation services contracts where the Company guarantees a minimum recovery value for goods being sold at auction or liquidation are recognized over time when the performance obligation is satisfied. The Company generally uses the cost-to-cost measure of progress for the Company’s contracts because it best depicts the transfer of services to the customer which occurs as the Company incurs costs on its contracts. Under the cost-to-cost measure of progress, the extent of progress towards completion is measured based on the ratio of costs incurred to date to the total estimated costs at completion of the performance obligation. Revenues, including estimated fees or profits, are recorded proportionally as costs are incurred. Costs to fulfill the contract include labor and other direct costs incurred by the Company related to the contract. Due to the nature of the guarantees and performance obligations under these contracts, the estimation of revenue that is ultimately earned is complex and subject to many variables and requires significant judgment. It is common for these contracts to contain provisions that can either increase or decrease the transaction price upon completion of the Company’s performance obligations under the contract. Estimated amounts are included in the transaction price at the most likely amount it is probable that a significant reversal of revenue will not occur. The Company estimates of variable consideration and determination of whether or not to include estimated amounts in the transaction price are based on an assessment of the Company’s anticipated performance under the contract taking into consideration all historical, current and forecasted information that is reasonably available to the Company. Costs that directly relate to the contract and expected to be recoverable are capitalized as an asset and included in advances against customer contracts in the accompanying consolidated balance sheets. These costs are amortized as the services are transferred to the customer over the contract period, which generally does not exceed six months, and the expense is recognized as a component of direct cost of services. If, during the auction or liquidation sale, the Company determines that the total costs to be incurred on a performance obligation under a contract exceeds the total estimated revenues to be earned, a provision for the entire loss on the performance obligation is recognized in the period the loss is determined.
If the Company determines that the variable consideration used in the initial determination of the transaction price for the contract is such that the total recoveries from the auction or liquidation will not exceed the guaranteed recovery values or advances made in accordance with the contract, the transaction price will be reduced and a loss or negative revenue could result from the performance obligation. A provision for the entire loss as negative revenue on the performance obligation is recognized in the period the loss is determined.
Valuation and Appraisal segment – Revenues in the Valuation and Appraisal segment are primarily comprised of fees for Valuation and Appraisal services. Revenues are recognized when the performance obligation is completed and is generally at the point in time upon delivery of the report to the customer. Revenues in the Valuation and Appraisal segment also include contractual reimbursable costs.
Principal Investments – United Online and magicJack segment – Revenues in the Principal Investments - United Online and magicJack segment are primarily comprised of services revenue from fees charged to United Online pay accounts; sales revenue from the sale of the magicJack and related devices and access rights; revenues from access rights renewals and mobile apps; prepaid minutes revenues; revenues from access and wholesale charges; service revenue from Unified Communication as a Service (“UCaaS”) hosting services; advertising and other revenues; and products revenues from the sale of magicJack and mobile broadband service devices, including the related shipping and handling and installation fees, if applicable.
Service revenues from fees charged to United Online pay accounts are recognized in the period in which fees are fixed or determinable and the related services are provided to the customer. The Company’s pay accounts generally pay in advance for their services by credit card, PayPal, automated clearinghouse or check, and revenues are then recognized ratably over the service period. Advance payments from pay accounts are recorded in the consolidated balance sheets as deferred revenue. In circumstances where payment is not received in advance, revenues are only recognized if collectability is probable.
Revenues from sales of the magicJack devices and access rights represent revenues recognized from sales of the magicJack devices to retailers, wholesalers, or direct to customers, net of returns. The transaction price for magicJack devices is allocated between equipment and service based on stand-alone selling prices. Revenues allocated to equipment are recognized upon delivery (when control transfers to the customer), and service revenue is recognized ratably over the service term. The Company estimates the return of direct sales as part of the transaction price using a six month rolling average of historical returns. Revenues for hardware and shipping are recognized at the time of delivery and revenues for services are recognized ratably over the service term. The Company recognizes revenue for hardware based on delivery terms to the retailer and revenue for service is deferred for the delay period and recognized ratably over the remaining access right period.
Revenues from access rights renewals and mobile apps represents revenues from customers purchasing rights to access the Company’s servers beyond the access right period included in a magicJack device or magicJack service. The extended access right ranges from one to five years. These fees charged to customers are initially deferred and recognized as revenue ratably over the extended access right period. Revenues from access rights granted to users of the magicApp, magicJack Connect App and magicJack Spark are recognized ratably over the access right period.
Revenues from the sale of other magicJack related products are revenues recognized from the sale of other items related to the magicJack devices and access right renewals the Company offers its customers, including porting fees charged to customers to port their existing phone number to a magicJack device or services, fees charged for customer to select a custom, vanity or Canadian phone number and fees charged to customers to change their existing number. These revenues are recognized at the time of sale.
Prepaid minutes revenues are primarily from the usage and expiration of international prepaid minutes, net of chargebacks. Revenues from prepaid minutes are recognized as minutes are used.
Revenues from access and wholesale charges are generated from access fees charged to other telecommunication carriers or providers for Interexchange Carriers (“IXC”) calls terminated to the Company’s end-users, and other fees charged to telecommunication carriers or providers for origination of calls to their 800-numbers. These revenues are recorded based on rates set forth in the respective state and federal tariffs or negotiated contract rates, less provisions for billing adjustments. Revenues from access and wholesale charges are recognized as calls are terminated to the network.
F-11
UCaaS revenues are recurring monthly service revenue from sales of its hosted services. Customers are billed monthly in advance for these recurring services and in arrears for one time service charges and other certain usage charges. UCaaS revenues also includes non-recurring revenue from the sale of hardware and network equipment. Revenues for recurring monthly service are recorded in the period the services are provided over the term of the respective customer agreements and revenue from the sale of hardware and network equipment is recognized in the period that the equipment is delivered and put into service.
Advertising revenues consist primarily of amounts from the Company’s Internet search partner that are generated as a result of users utilizing the partner’s Internet search services and amounts generated from display advertisements. The Company recognizes such advertising revenues in the period in which the advertisement is displayed or, for performance-based arrangements, when the related performance criteria are met. In determining whether an arrangement exists, the Company ensures that a written contract is in place, such as a standard insertion order or a customer-specific agreement. The Company assesses whether performance criteria have been met and whether the fees are fixed or determinable based on a reconciliation of the performance criteria and the payment terms associated with the transaction.
Brands segment – Revenues are derived from various license agreements that provide revenue based on guaranteed minimum royalty payments and advertising/marketing fees with additional royalty revenue based on a percentage of defined sales. Guaranteed minimum royalty payments and advertising/marketing revenue are recognized on a straight-line basis over the term of each contract year, as defined in each license agreement. Royalty payments exceeding the guaranteed minimum amounts are recognized as income during the period corresponding to the licensee’s sales. Additionally, payments received for terminating licenses are recognized when termination agreements are entered into and collectability is probable.
Payments received as consideration for the grant of a license are recorded as deferred revenue at the time payment is received and recognized ratably as revenue over the term of the license agreement. Advanced royalty payments are recorded as deferred revenue at the time payment is received and recognized as revenue when earned. Revenue is not recognized unless collectability is probable.
(d) Direct Cost of Services
Direct cost of services relates to service and fee revenues. Direct costs of services include participation in profits under collaborative arrangements in which the Company is a majority participant. Direct costs of services also include the cost of consultants and other direct expenses related to Auction and Liquidation contracts pursuant to commission and fee based arrangements in the Auction and Liquidation segment. Direct cost of services in the Principal Investments - United Online and magicJack segment include cost of telecommunications and data center costs, personnel and overhead-related costs associated with operating the Company’s networks, servers and data centers, sales commissions associated with multi-year service plans, depreciation of network computers and equipment, amortization expense, third party advertising sales commissions, license fees, costs related to providing customer support, costs related to customer billing and processing of customer credit cards and associated bank fees. Direct cost of services does not include an allocation of the Company’s overhead costs.
(e) Interest Expense - Securities Lending Activities and Loan Participations Sold
Interest expense from securities lending activities is included in operating expenses related to operations in the Capital Markets segment. Interest expense from securities lending activities is incurred from equity and fixed income securities that are loaned to the Company and totaled $30,739, $23,039 and $12,051 for the year ended December 31, 2019, 2018 and 2017, respectively. Loan participations sold as of December 31, 2019 totaled $12,478. Interest expense from loan participations sold totaled $1,405 for the year ended December 31, 2019.
(f) Concentration of Risk
Revenues in the Capital Markets, Valuation and Appraisal, Principal Investments - United Online and magicJack and Brands segments are currently primarily generated in the United States. Revenues in the Auction and Liquidation segment are primarily generated in the United States, Australia, Canada and Europe.
The Company’s activities in the Auction and Liquidation segment are executed frequently with, and on behalf of, distressed customers and secured creditors. Concentrations of credit risk can be affected by changes in economic, industry, or geographical factors. The Company seeks to control its credit risk and potential risk concentration through risk management activities that limit the Company’s exposure to losses on any one specific liquidation services contract or concentration within any one specific industry. To mitigate the exposure to losses on any one specific liquidations services contract, the Company sometimes conducts operations with third parties through collaborative arrangements.
F-12
The Company maintains cash in various federally insured banking institutions. The account balances at each institution periodically exceed the Federal Deposit Insurance Corporation’s (“FDIC”) insurance coverage, and as a result, there is a concentration of credit risk related to amounts in excess of FDIC insurance coverage. The Company has not experienced any losses in such accounts. The Company also has substantial cash balances from proceeds received from auctions and liquidation engagements that are distributed to parties in accordance with the collaborative arrangements.
(g) Advertising Expenses
The Company expenses advertising costs, which consist primarily of costs for printed materials, as incurred. Advertising costs totaled $1,903, $2,727, and $1,312 for the years ended December 31, 2019, 2018, and 2017 respectively. Advertising expense is included as a component of selling, general and administrative expenses in the accompanying consolidated statements of income.
(h) Share-Based Compensation
The Company’s share-based payment awards principally consist of grants of restricted stock, restricted stock units, performance based restricted stock units and costs associated with the Company’s employee stock purchase plan. In accordance with the applicable accounting guidance, share-based payment awards are classified as either equity or liabilities. For equity-classified awards, the Company measures compensation cost for the grant of membership interests at fair value on the date of grant and recognizes compensation expense in the consolidated statements of income over the requisite service or performance period the award is expected to vest. The fair value of the liability-classified award will be subsequently remeasured at each reporting date through the settlement date. Change in fair value during the requisite service period will be recognized as compensation cost over that period.
In June 2018, the Company adopted the 2018 Employee Stock Purchase Plan (“Purchase Plan”) which allows eligible employees to purchase common stock through payroll deductions at a price that is 85% of the market value of the common stock on the last day of the offering period. In accordance with the provisions of ASC 718, Compensation - Stock Compensation (“ASC 718”), the Company is required to recognize compensation expense relating to shares offered under the Purchase Plan.
(i) Income Taxes
The Company recognizes deferred tax liabilities and assets for the expected future tax consequences of events that have been included in the consolidated financial statements or tax returns. Deferred tax liabilities and assets are determined based on the difference between the financial statement basis and tax basis of assets and liabilities using enacted tax rates in effect for the year in which the differences are expected to reverse. The Company estimates the degree to which tax assets and credit carryforwards will result in a benefit based on expected profitability by tax jurisdiction. A valuation allowance for such tax assets and loss carryforwards is provided when it is determined to be more likely than not that the benefit of such deferred tax asset will not be realized in future periods. Tax benefits of operating loss carryforwards are evaluated on an ongoing basis, including a review of historical and projected future operating results, the eligible carryforward period, and other circumstances. If it becomes more likely than not that a tax asset will be used, the related valuation allowance on such assets would be reduced.
The Company recognizes tax benefits from uncertain tax positions only if it is more likely than not that the tax position will be sustained on examination by the taxing authorities, based on the technical merits of the position. Once this threshold has been met, the Company’s measurement of its expected tax benefits is recognized in its financial statements. The Company accrues interest on unrecognized tax benefits as a component of income tax expense. Penalties, if incurred, would be recognized as a component of income tax expense.
(j) Cash and Cash Equivalents
The Company considers all highly liquid investments with a maturity of three months or less when purchased to be cash equivalents.
(k) Restricted Cash
As of December 31, 2019, restricted cash balance is $471 related to one of the Company’s telecommunication suppliers. As of December 31, 2018, restricted cash balance of $838 included $469 cash collateral for one of the Company’s telecommunication suppliers and $369 certificate of deposits collateral for certain letters of credit.
F-13
(l) Securities Borrowed and Securities Loaned
Securities borrowed and securities loaned are recorded based upon the amount of cash advanced or received. Securities borrowed transactions facilitate the settlement process and require the Company to deposit cash or other collateral with the lender. With respect to securities loaned, the Company receives collateral in the form of cash. The amount of collateral required to be deposited for securities borrowed, or received for securities loaned, is an amount generally in excess of the market value of the applicable securities borrowed or loaned. The Company monitors the market value of the securities borrowed and loaned on a daily basis, with additional collateral obtained, or excess collateral recalled, when deemed appropriate.
The Company accounts for securities lending transactions in accordance with ASC “Topic 210: Balance Sheet,” which requires companies to report disclosures of offsetting assets and liabilities. The Company does not net securities borrowed and securities loaned and these items are presented on a gross basis in the consolidated balance sheets.
(m) Due from/to Brokers, Dealers, and Clearing Organizations
The Company clears all of its proprietary and customer transactions through other broker-dealers on a fully disclosed basis. The amount receivable from or payable to the clearing brokers represents the net of proceeds from unsettled securities sold, the Company’s clearing deposits and amounts receivable for commissions less amounts payable for unsettled securities purchased by the Company and amounts payable for clearing costs and other settlement charges. This amount also includes the cash collateral received for securities loaned less cash collateral for securities borrowed. Any amounts payable would be fully collateralized by all of the securities owned by the Company and held on deposit at the clearing broker.
(n) Accounts Receivable
Accounts receivable represents amounts due from the Company’s Auction and Liquidation, Valuation and Appraisal, Capital Markets, Principal Investments — United Online and magicJack and Brands customers. The Company maintains an allowance for doubtful accounts for estimated losses inherent in its accounts receivable portfolio. In establishing the required allowance, management utilizes a specific customer identification methodology. Management also considers historical losses adjusted for current market conditions and the customers’ financial condition and the current receivables aging and current payment patterns. Account balances are charged off against the allowance after all means of collection have been exhausted and the potential for recovery is considered remote. The Company does not have any off-balance sheet credit exposure related to its customers. The Company’s bad debt expense and changes in the allowance for doubtful accounts for the years ended December 31, 2019 and 2018 are included in Note 6.
(o) Leases
The Company determines if an arrangement is, or contains, a lease at the inception date. Operating leases are included in right-of-use assets, with the related liabilities included in operating lease liabilities in the consolidated balance sheet.
Operating lease assets represent our right to use an underlying asset for the lease term and lease liabilities represent our obligation to make lease payments arising from the lease. Operating lease assets and liabilities are recognized at the lease commencement date based on the estimated present value of lease payments over the lease term. We use our estimated incremental borrowing rate in determining the present value of lease payments. Variable components of the lease payments such as fair market value adjustments, utilities, and maintenance costs are expensed as incurred and not included in determining the present value. Our lease terms include options to extend or terminate the lease when it is reasonably certain that we will exercise that option. Lease expense is recognized on a straight-line basis over the lease term. We have lease agreements with lease and non-lease components which are accounted for as a single lease component. See Note 9 for additional information on leases.
(p) Property and Equipment
Property and equipment are stated at cost. Depreciation and amortization are computed using the straight-line method over the estimated useful lives of the assets. Property and equipment held under finance leases are amortized on a straight-line basis over the shorter of the lease term or estimated useful life of the asset.
(q) Loans Receivable
Loans receivable are measured at historical cost and reported at their outstanding principal balances net of any unearned income, charge-offs, unamortized deferred fees and costs on originated loans, and for purchased loans, net of any unamortized premiums or discounts. Loan origination fees and certain direct origination costs are deferred and recognized as adjustments to interest income over the lives of the related loans. Unearned income, discounts and premiums are amortized to interest income using a level yield methodology. At December 31, 2019 and 2018, loans receivable had a carrying value of $225,848 and $38,794, respectively, with interest rates ranging from 10.0% to 12.0% and various maturity dates through June 2022.
F-14
(r) Securities and Other Investments Owned and Securities Sold Not Yet Purchased
Securities owned consist of marketable securities and investments in partnership interests and other securities recorded at fair value. Securities sold, but not yet purchased represents obligations of the Company to deliver the specified security at the contracted price and thereby create a liability to purchase the security in the market at prevailing prices. Changes in the value of these securities are reflected currently in the results of operations.
As of December 31, 2019 and 2018, the Company’s securities and other investments owned and securities sold not yet purchased at fair value consisted of the following securities:
| December 31, | December 31, | |||||||
| 2019 | 2018 | |||||||
| Securities and other investments owned: | ||||||||
| Equity securities | $ | 353,162 | $ | 193,459 | ||||
| Corporate bonds | 19,020 | 18,825 | ||||||
| Other fixed income securities | 8,414 | 3,825 | ||||||
| Loans receivable at fair value | 43,338 | 33,731 | ||||||
| Partnership interests and other | 27,617 | 23,737 | ||||||
| $ | 451,551 | $ | 273,577 | |||||
| Securities sold not yet purchased: | ||||||||
| Equity securities | $ | 5,360 | $ | 11,130 | ||||
| Corporate bonds | 33,436 | 16,338 | ||||||
| Other fixed income securities | 3,024 | 10,155 | ||||||
| $ | 41,820 | $ | 37,623 | |||||
(s) Goodwill and Other Intangible Assets
The Company accounts for goodwill and intangible assets in accordance with the accounting guidance which requires that goodwill and other intangibles with indefinite lives be tested for impairment annually or on an interim basis if events or circumstances indicate that the fair value of an asset has decreased below its carrying value.
Goodwill includes the excess of the purchase price over the fair value of net assets acquired in business combinations and the acquisition of noncontrolling interests. ASC 805 requires that goodwill be tested for impairment at the reporting unit level (operating segment or one level below an operating segment). Application of the goodwill impairment test requires judgment, including the identification of reporting units, assigning assets and liabilities to reporting units, assigning goodwill to reporting units, and determining the fair value. The Company operates five reporting units, which are the same as its reporting segments described in Note 22. Significant judgment is required to estimate the fair value of reporting units which includes estimating future cash flows, determining appropriate discount rates and other assumptions. Changes in these estimates and assumptions could materially affect the determination of fair value and/or goodwill impairment.
When testing goodwill for impairment, the Company may assess qualitative factors for some or all of our reporting units to determine whether it is more likely than not (that is, a likelihood of more than 50 percent) that the fair value of a reporting unit is less than its carrying amount, including goodwill. Alternatively, the Company may bypass this qualitative assessment for some or all of the Company’s reporting units and perform a detailed quantitative test of impairment (step 1). If the Company performs the detailed quantitative impairment test and the carrying amount of the reporting unit exceeds its fair value, the Company would perform an analysis (step 2) to measure such impairment. Based on the Company’s qualitative assessments during 2019, the Company concluded that a positive assertion can be made from the qualitative assessment that it is more likely than not that the fair value of the reporting units exceeded their carrying values and no impairments were identified.
The Company reviews the carrying value of its amortizable intangibles and other long-lived assets for impairment at least annually or whenever events or changes in circumstances indicate that the carrying amount of an asset may not be recoverable. Recoverability of long-lived assets is measured by comparing the carrying amount of the asset or asset group to the undiscounted cash flows that the asset or asset group is expected to generate. If the undiscounted cash flows of such assets are less than the carrying amount, the impairment to be recognized is measured by the amount by which the carrying amount of the asset or asset group, if any, exceeds its fair market value. During the year ended December 31, 2019, the Company recognized no impairment of intangibles. During the year ended December 31, 2018, the Company recognized impairment of intangibles in the amount of $1,070 related to the tradename of Wunderlich Securities, Inc. In June 2018, the Company changed the name Wunderlich Securities, Inc. to B. Riley Wealth Management, Inc. This impairment charge is included in restructuring charge in the Company’s consolidated statements of income.
F-15
(t) Fair Value Measurements
The Company’s assessment of the significance of a particular input to the fair value measurement in its entirety requires judgment and considers factors specific to the asset or liability. Fair value is the price that would be received to sell an asset or paid to transfer a liability in an orderly transaction between market participants at the measurement date. A fair value measurement assumes that the transaction to sell the asset or transfer the liability occurs in the principal market for the asset or liability or, in the absence of a principal market, the most advantageous market. In general, fair values determined by Level 1 inputs utilize quoted prices (unadjusted) for identical instruments that are highly liquid, observable and actively traded in over-the-counter markets. Fair values determined by Level 2 inputs utilize inputs other than quoted prices included in Level 1 that are observable for the asset or liability, either directly or indirectly. Level 2 inputs include quoted prices for similar instruments in active markets, quoted prices for identical or similar instruments in markets that are not active and model-derived valuations whose inputs are observable and can be corroborated by market data. Level 3 inputs are unobservable inputs that are supported by little or no market activity and that are significant to the fair value of the assets or liabilities. In certain cases, the inputs used to measure fair value may fall into different levels of the fair value hierarchy. In such cases, the level in the fair value hierarchy within which the fair value measurement in its entirety falls has been determined based on the lowest level input that is significant to the fair value measurement in its entirety. The Company’s assessment of the significance of a particular input to the fair value measurement in its entirety requires judgment and considers factors specific to the asset or liability.
The Company’s securities and other investments owned and securities sold and not yet purchased are comprised of equity securities including, common and preferred stocks, warrants, options and common limited partnership interests; corporate bonds; other fixed income securities including, government and agency bonds; loans receivable valued at fair value; and investments in partnerships. Investments in equity securities that are based on quoted prices in active markets are included in Level 1 of the fair value hierarchy. The Company also holds nonpublic equity securities for which there is little or no public market and fair value is determined by management on a consistent basis. For investments where little or no public market exists, management’s determination of fair value is based on the best available information which may incorporate management’s own assumptions and involves a significant degree of judgment, taking into consideration various factors including earnings history, financial condition, recent sales prices of the issuer’s securities and liquidity risks. These investments are included in Level 3 of the fair value hierarchy. Investments in partnership interests include investments in private equity partnerships that primarily invest in equity securities, bonds, and direct lending funds. The Company also invests in priority investment funds and the underlying securities held by these funds are primarily corporate and asset-backed fixed income securities and restrictions exist on the redemption of amounts invested by the Company. The Company’s partnership and investment fund interests are valued based on the Company’s proportionate share of the net assets of the partnerships and funds; the value for these investments are derived from the most recent statements received from the general partner or fund administrator. These partnership and investment fund interests are valued at net asset value (“NAV”) in accordance with ASC “Topic 820: Fair Value Measurements.”
The fair value of mandatorily redeemable noncontrolling interests is determined based on the issuance of similar interests for cash, references to industry comparables, and relied, in part, on information obtained from appraisal reports and internal valuation models.
F-16
The following tables present information on the financial assets and liabilities measured and recorded at fair value on a recurring basis as of December 31, 2019 and 2018.
| Financial Assets and Liabilities Measured at Fair Value | ||||||||||||||||
| on a Recurring Basis at December 31, 2019 Using | ||||||||||||||||
| Quoted prices in | Other | Significant | ||||||||||||||
| Fair value at | active markets for | observable | unobservable | |||||||||||||
| December 31, | identical assets | inputs | inputs | |||||||||||||
| 2019 | (Level 1) | (Level 2) | (Level 3) | |||||||||||||
| Assets: | ||||||||||||||||
| Securities and other investments owned: | ||||||||||||||||
| Equity securities | $ | 353,162 | $ | 243,911 | $ | — | $ | 109,251 | ||||||||
| Corporate bonds | 19,020 | — | 19,020 | — | ||||||||||||
| Other fixed income securities | 8,414 | — | 8,414 | — | ||||||||||||
| Loans receivable at fair value | 43,338 | — | — | 43,338 | ||||||||||||
| Total | 423,934 | $ | 243,911 | $ | 27,434 | $ | 152,589 | |||||||||
| Investment funds valued at net asset value (1) | 27,617 | |||||||||||||||
| Total assets measured at fair value | $ | 451,551 | ||||||||||||||
| Liabilities: | ||||||||||||||||
| Securities sold not yet purchased: | ||||||||||||||||
| Equity securities | $ | 5,360 | $ | 5,360 | $ | — | $ | — | ||||||||
| Corporate bonds | 33,436 | — | 33,436 | — | ||||||||||||
| Other fixed income securities | 3,024 | — | 3,024 | — | ||||||||||||
| Total securities sold not yet purchased | 41,820 | 5,360 | 36,460 | — | ||||||||||||
| Mandatorily redeemable noncontrolling interests issued after November 5, 2003 | 4,616 | — | — | 4,616 | ||||||||||||
| Total liabilities measured at fair value | $ | 46,436 | $ | 5,360 | $ | 36,460 | $ | 4,616 | ||||||||
| Financial Assets and Liabilities Measured at Fair Value | ||||||||||||||||
| on a Recurring Basis at December 31, 2018 Using | ||||||||||||||||
| Quoted prices in | Other | Significant | ||||||||||||||
| Fair value at | active markets for | observable | unobservable | |||||||||||||
| December 31 | identical assets | inputs | inputs | |||||||||||||
| 2018 | (Level 1) | (Level 2) | (Level 3) | |||||||||||||
| Assets: | ||||||||||||||||
| Securities and other investments owned: | ||||||||||||||||
| Equity securities | $ | 193,459 | $ | 168,882 | $ | — | $ | 24,577 | ||||||||
| Corporate bonds | 18,825 | — | 18,825 | — | ||||||||||||
| Other fixed income securities | 3,825 | — | 3,825 | — | ||||||||||||
| Loans receivable at fair value | 33,731 | — | — | 33,731 | ||||||||||||
| Total | 249,840 | $ | 168,882 | $ | 22,650 | $ | 58,308 | |||||||||
| Investment funds valued at net asset value(1) | 23,737 | |||||||||||||||
| Total assets measured at fair value | $ | 273,577 | ||||||||||||||
| Liabilities: | ||||||||||||||||
| Securities sold not yet purchased: | ||||||||||||||||
| Equity securities | $ | 11,130 | $ | 11,130 | $ | — | $ | — | ||||||||
| Corporate bonds | 16,338 | — | 16,338 | — | ||||||||||||
| Other fixed income securities | 10,155 | — | 10,155 | — | ||||||||||||
| Total securities sold not yet purchased | 37,623 | 11,130 | 26,493 | — | ||||||||||||
| Mandatorily redeemable noncontrolling interests issued after November 5, 2003 | 4,633 | — | — | 4,633 | ||||||||||||
| Total liabilities measured at fair value | $ | 42,256 | $ | 11,130 | $ | 26,493 | $ | 4,633 | ||||||||
| (1) | Certain investments that are measured at fair value using the net asset value per share (or its equivalent) practical expedient have not been classified in the fair value hierarchy in accordance with ASC “Topic 820 Fair Value Measurements.” The fair value amounts presented in the tables above for investment funds valued at net asset value are intended to permit reconciliation of the fair value hierarchy to the amounts presented in the consolidated balance sheets. |
As of December 31, 2019 and 2018, financial assets measured and reported at fair value on a recurring basis and classified within Level 3 were $152,589 and $58,308, respectively, or 6.6% and 3.0%, respectively, of the Company’s total assets. In determining the fair value for these Level 3 financial assets, the Company analyzes various financial, performance and market factors to estimate the value, including where applicable, over-the-counter market trading activity.
F-17
The following table summarizes the significant unobservable inputs in the fair value measurement of level 3 financial assets and liabilities by category of investment and valuation technique as of December 31, 2019:
| Fair value at | ||||||||||||||
| December 31, | Weighted | |||||||||||||
| 2019 | Valuation Technique | Unobservable Input | Range | Average | ||||||||||
| Assets: | ||||||||||||||
| Equity securities | $ | 109,251 | Market approach | Multiple of revenue | 1.2x | 1.2 | x | |||||||
| Multiple of EBITDA | 8.5x - 11.0x | 9.9 | x | |||||||||||
| Multiple of EV-10 | 0.35x | 0.35 | x | |||||||||||
| Market price of related security | $0.70 - $3.64/share | $ | 3.52 | |||||||||||
| Discounted cash flow | Market interest rate | 25.7% | 25.7 | % | ||||||||||
| Option pricing model | Annualized volatility | 75.0% | 75 | % | ||||||||||
| Loans receivable at fair value | 43,338 | Discounted cash flow | Market interest rate | 12.5% -13.7% | 13.0 | % | ||||||||
| Market approach | Market price of related security | $0.70/share | $ | 0.70 | ||||||||||
| Total level 3 assets measured at fair value | $ | 152,589 | ||||||||||||
| Liabilities: | ||||||||||||||
| Mandatorily redeemable noncontrolling interests issued after November 5, 2003 | $ | 4,616 | Market approach | Operating income multiple | 6.0x | 6.0 | x | |||||||
The changes in Level 3 fair value hierarchy during the year ended December 31, 2019 and 2018 are as follows:
| Level 3 | Level 3 Changes During the Period | Level 3 | ||||||||||||||||||||||
| Balance at | Fair | Relating to | Purchases, | Transfer in | Balance at | |||||||||||||||||||
| Beginning of | Value | Undistributed | Sales and | and/or out | End of | |||||||||||||||||||
| Year | Adjustments | Earnings | Settlements | of Level 3 | Period | |||||||||||||||||||
| Year Ended December 31, 2019 | ||||||||||||||||||||||||
| Equity securities | $ | 24,577 | $ | (4,809 | ) | $ | 1,424 | $ | 91,243 | $ | (3,184 | ) | $ | 109,251 | ||||||||||
| Loans receivable at fair value | 33,731 | 10,999 | 1,621 | (3,013 | ) | — | 43,338 | |||||||||||||||||
| Mandatorily redeemable noncontrolling interests issued after November 5, 2003 | 4,633 | — | (17 | ) | — | — | 4,616 | |||||||||||||||||
| Year Ended December 31, 2018 | ||||||||||||||||||||||||
| Equity securities | $ | 28,346 | $ | (4,220 | ) | $ | 578 | $ | 20,843 | $ | (20,970 | ) | $ | 24,577 | ||||||||||
| Loans receivable at fair value | 33,713 | 35 | 300 | (317 | ) | — | 33,731 | |||||||||||||||||
| Partnership interests and other | 26,104 | 1,108 | 607 | (26,087 | ) | (1,732 | ) | — | ||||||||||||||||
| Mandatorily redeemable noncontrolling interests issued after November 5, 2003 | 4,478 | — | 155 | — | — | 4,633 | ||||||||||||||||||
The amount reported in the table above for the year ended December 31, 2019 and 2018 includes the amount of undistributed earnings attributable to the noncontrolling interests that is distributed on a quarterly basis. The carrying amounts reported in the consolidated financial statements for cash and cash equivalents, restricted cash, accounts receivable, accounts payable and accrued expenses and other liabilities approximate fair value based on the short-term maturity of these instruments.
The carrying amount of the senior notes payable and term loan approximate fair value because the contractual interest rates or effective yields of such instruments are consistent with current market rates of interest for instruments of comparable credit risk.
During the year ended December 31, 2019 and 2018, there were no assets or liabilities measured at fair value on a non-recurring basis.
(u) Derivative and Foreign Currency Translation
The Company periodically uses derivative instruments, which primarily consist of the purchase of forward exchange contracts, for certain Auction and Liquidation engagements with operations outside the United States. The Company did not use any derivative contracts during the year ended December 31, 2019. The Company’s use of derivatives consisted of the purchase of forward exchange contracts in the amount of $42,108 Canadian dollars that were settled during the first and second quarter of 2018.
The net loss from forward exchange contracts was $91 during the year ended December 31, 2018. This amount is reported as a component of selling, general and administrative expenses in the consolidated statements of income.
F-18
The Company transacts business in various foreign currencies. In countries where the functional currency of the underlying operations has been determined to be the local country’s currency, revenues and expenses of operations outside the United States are translated into United States dollars using average exchange rates while assets and liabilities of operations outside the United States are translated into United States dollars using period-end exchange rates. The effects of foreign currency translation adjustments are included in stockholders’ equity as a component of accumulated other comprehensive income in the accompanying consolidated balance sheets. Transaction (losses) gains were ($238), 1,294, and ($786) during the years ended December 31, 2019, 2018 and 2017, respectively. These amounts are included in selling, general and administrative expenses in the Company’s consolidated statements of income.
(v) Common Stock Warrants
The Company issued 821,816 warrants to purchase common stock of the Company (the “Wunderlich Warrants”) in connection with the acquisition of Wunderlich Securities, Inc. (“Wunderlich”) on July 3, 2017. The Wunderlich Warrants entitle the holders of the warrants to acquire shares of the Company’s common stock from the Company at an exercise price of $17.50 per share, subject to, among other matters, the proper completion of an exercise notice and payment. The exercise price and the number of shares of Company common stock issuable upon exercise are subject to customary anti-dilution and adjustment provisions, which include stock splits, subdivisions or reclassifications of the Company’s common stock. The Wunderlich Warrants expire on July 3, 2022. On May 16, 2019, the Company repurchased 638,311 warrants for $2,777 ($4.35 per warrant) which is included in common stock warrants repurchased in the consolidated statements of equity. As of December 31, 2019, Wunderlich Warrants to purchase 183,505 shares of common stock were outstanding.
On October 28, 2019, the Company issued 200,000 warrants to purchase common stock of the Company (the “BR Brands Warrants”) in connection with the acquisition of BR Brand Holdings LLC (“BR Brand”). The BR Brand Warrants entitle the holders of the warrants to acquire shares of the Company’s common stock from the Company at an exercise price of $26.24 per share. One-third of the BR Brand Warrants immediately vested and became exercisable upon its issuance, and the remaining two-thirds of warrants will vest and become exercisable following the first and/or second anniversaries of the closing, subject to BR Brand’s (or another related joint venture with Bluestar Alliance LLC) satisfaction of specified financial performance targets. The BR Brand warrants expire three years after the last vesting event occurs.
| Exercise | Expiration | Issued
and Outstanding Warrants as of Beginning of | Warrants | Warrants | Issued
and Outstanding Warrants as of | |||||||||||||||||
| Price | Date | Year | Issued | Repurchased | End of Year | |||||||||||||||||
| For the year ended December 31, 2018 | ||||||||||||||||||||||
| Wunderlich Warrants | $ | 17.50 | July 3, 2022 | 821,816 | - | - | 821,816 | |||||||||||||||
| For the year ended December 31, 2019 | ||||||||||||||||||||||
| Wunderlich Warrants | $ | 17.50 | July 3, 2022 | 821,816 | - | (638,311 | ) | 183,505 | ||||||||||||||
| BR Brand Warrants | $ | 26.24 | October 28, 2024 | - | 200,000 | - | 200,000 | |||||||||||||||
| Total | 821,816 | 200,000 | (638,311 | ) | 383,505 | |||||||||||||||||
(w) Equity Investment
bebe stores, inc.
At December 31, 2019, the Company had a 30.5% ownership interest in bebe stores, inc. (“bebe”). The equity ownership in bebe is accounted for under the equity method of accounting and is included in prepaid expenses and other assets in the consolidated balance sheets.
National Holdings Corporation
On November 14, 2018, the Company entered into an agreement to acquire shares of National Holdings Corporation (“National Holdings”), a Nasdaq-listed issuer, from Fortress Biotech, Inc. for an aggregate purchase price totaling approximately $22,900. The transaction was completed in two tranches. In the first tranche, which was completed in the fourth quarter of 2018, the Company acquired shares representing 24% of the total outstanding shares of National Holdings. The second tranche was completed in the first quarter of 2019. As of December 31, 2019, the Company had purchased 6,159,550 shares of National Holdings’ common stock, representing 46.8% of National Holdings’ outstanding shares, at $3.25 per share. The carrying value for the National Holdings investment is included in prepaid expenses and other assets in the consolidated balance sheets. The equity ownership in National Holdings is accounted for under the equity method of accounting.
F-19
(x) Loan Participations Sold
As of December 31, 2019, the Company has sold investments to third parties (“Participants”) that are accounted for as secured borrowings under ASC Topic 860, Transfers and Servicing. Under ASC Topic 860, a partial loan transfer does not qualify for sale accounting in order for sale treatment to be allowed. A participation or other partial loan transfer that meets the definition of a participating interest is classified as loan receivable and the portion transferred is recorded as a secured borrowing under loan participations sold in the consolidated balance sheet. The Participants are entitled to payments made by the borrower of the related loan equal to the current loan participations sold outstanding at the interest rates for the respective investment. In the event that the borrower defaults, the Participants have rights to payments from such borrower, but do not have recourse to the Company. The terms of the loan participations sold are commensurate with the terms of the related loan.
As of December 31, 2019, the Company had entered into participation agreements for a total of $12,478. In addition, the interest income and interest expense related to the loan participations sold is presented gross on the consolidated statement of income.
(y) Supplemental Non-cash Disclosures
During the year ended December 31, 2019, non-cash activities included the conversion of loans receivable in the amount of $12,209 into securities and other investments owned, the recognition of new operating lease right-of-use (“ROU”) assets of $1,032, the recognition of new operating lease liabilities of $1,032 and the issuance of warrants to purchase the Company’s stock in the amount of $990 related to the purchase of BR Brand. During the year ended December 31, 2018, non-cash activities included the conversion of a loan receivable in the amount of $16,867 and accrued interest receivable of $51 into an equity investment that totaled $16,918.
(z) Reclassifications
During the years ended December 31, 2018 and 2017, interest income earned on loans of $6,479 and $2,728, respectively, was previously included in services and fees income in the capital markets segment. These interest income amounts have been reclassified and reported in interest income – loans and securities lending to conform to the 2019 presentation. During the years ended December 31, 2018 and 2017, expenses of $16,826 and $14,876, respectively, were previously included in direct cost of services in the valuation and appraisal segment. These expenses have been reclassified and reported in selling, general and administrative expenses to conform to the 2019 presentation.
(aa) Variable Interest Entity
In 2018, the operations of GACP II, LP, a private debt investment limited partnership (the “Partnership”) commenced operations. The Company’s investment in the Partnership is a variable interest entity (“VIE”) since the unaffiliated limited partners do not have substantive kick- out or participating rights to remove the Company’s subsidiary that is the general partner managing the Partnership. The Company has determined that it is not the primary beneficiary due to the fact that its fee arrangements are considered at-market and thus not deemed to be variable interests, and it does not hold any other interests in the Partnership that are considered to be more than insignificant. The Company determines whether it is the primary beneficiary of a VIE at the time it becomes involved with a VIE and reconsiders that conclusion at each reporting date. In evaluating whether the Company is the primary beneficiary, the Company evaluates its economic interests in the entity held either directly by the Company or indirectly through related parties. The consolidation analysis can generally be performed qualitatively; however, if it is not readily apparent that the Company is not the primary beneficiary, a quantitative analysis may also be performed.
The carrying value of the Company’s investments in the VIE that was not consolidated is shown below.
| December 31, 2019 | ||||
| Partnership investments | $ | 12,780 | ||
| Due from related party | 12 | |||
| Maximum exposure to loss | $ | 12,792 | ||
(ab) Recent Accounting Standards
Not yet adopted
In January 2017, the Financial Accounting Standards Board (the “FASB”) issued Accounting Standards Update (“ASU”) 2017-04, Intangibles — Goodwill and Other (Topic 350): Simplifying the Test for Goodwill Impairment. This standard simplifies the accounting for goodwill impairment. The guidance removes Step 2 of the goodwill impairment test, which requires a hypothetical purchase price allocation. Goodwill impairment will now be the amount by which a reporting unit’s carrying value exceeds its fair value, not to exceed the carrying amount of goodwill. The revised guidance will be applied prospectively and is effective for calendar year-end SEC filers for its annual or any interim goodwill impairment tests in fiscal years beginning after December 15, 2019. Early adoption is permitted for interim or annual goodwill impairment tests performed on testing dates after January 1, 2017. The adoption of this accounting update will not have a material impact on our consolidated financial statements.
F-20
In June 2016, the FASB issued ASU 2016-13, Financial Instruments − Credit Losses (Topic 326): Measurement of Credit Losses on Financial Instruments (“ASC 326”). This standard requires an allowance to be recorded for all expected credit losses for certain financial assets. The new standard introduces an approach, based on expected losses, to estimate credit losses on certain types of financial instruments. In May 2019, the FASB issued ASU No. 2019-05, Financial Instruments − Credit Losses (Topic 326); Targeted Transition Relief,” which allows entities to irrevocably elect, upon adoption of ASU 2016-13, the fair value option on financial instruments that (1) were previously recorded at amortized cost and (2) are within the scope of ASC 326-20 if the instruments are eligible for the fair value option under ASC 825-10. ASU 2016-13 and ASU 2019-05 are effective for public companies for interim and annual period beginning December 15, 2019. Entities are required to apply the standards’ provisions as a cumulative-effect adjustment to retained earnings as of the beginning of the first reporting period in which the guidance is adopted.
The Company will adopt the new credit losses standard effective January 1, 2020. Pursuant to ASU 2016-13 and its amendment ASU 2019-05, the Company will elect the irrevocable fair value option for all outstanding loans receivable that are currently measured at amortized cost. Under the fair value option, loans receivable will be measured at each reporting period based upon their exit value in an orderly transaction and unrealized gains or losses from changes in fair value will be recorded in services and fee on the consolidated statements of income. These loans will no longer be subject to evaluation for impairment through an allowance for loan loss as such losses will be captured through fair value changes. The Company has determined that the impact of adopting ASC 326 is immaterial to the consolidated financial statements.
Recently adopted
In February 2016, FASB issued ASU. 2016-02: Leases (Topic 842) which requires a lessee to recognize a ROU asset and lease liability on the balance sheet for all leases with a contract term longer than 12 months and provide enhanced disclosures. The Company adopted the new standard effective January 1, 2019 using the modified retrospective method. The Company elected the ‘package of practical expedients,’ which permits the Company not to reassess under the new standard the Company’s prior conclusions about lease identification, lease classification and initial direct costs. Upon adoption of ASC 842 on January 1, 2019, the Company recognized $67,519 operating lease liabilities with corresponding operating lease right-of-use assets. See Note 9 to the accompanying financial statements for additional information on leases.
In February 2018, the FASB issued ASU 2018-02, Income Statement - Reporting Comprehensive Income (Topic 220): Reclassification of Certain Tax Effects from Accumulated Other Comprehensive Income that provides for the reclassification from accumulated other comprehensive income to retained earnings for stranded effects resulting from the Tax Reform Act. The accounting update should be applied either in the period of adoption or retrospectively to each period in which the effect of the change in the U.S. federal corporate income tax rate in the Tax Reform Act is recognized. The accounting update is effective for the fiscal year beginning after December 15, 2018. The adoption of this standard did not have a material impact to the Company’s financial condition and results of operations.
In August 2016, the FASB issued ASU 2016-15, Statement of Cash Flows (Topic 230): Classification of Certain Cash Receipts and Cash Payments (“ASU 2016-15”), which clarifies how companies present and classify certain cash receipts and cash payments in the statement of cash flows. ASU 2016-15 was effective for us in our first quarter of fiscal year 2019. The adoption of this standard did not have a material impact to the Company’s financial condition and results of operations.
NOTE 3 — ACQUISITIONS
Acquisition of magicJack VocalTec Ltd
On November 9, 2017, the Company entered into an Agreement and Plan of Merger (the “magicJack Merger Agreement”) with B. R. Acquisition Ltd., an Israeli corporation and wholly-owned subsidiary of the Company (“Merger Sub”), and magicJack VocalTec Ltd., an Israeli corporation (“magicJack”), pursuant to which Merger Sub would merge with and into magicJack, with magicJack continuing as the surviving corporation and as an indirect subsidiary of the Company. Pursuant to the magicJack Merger Agreement, customary closing conditions were satisfied, and the acquisition was completed on November 14, 2018. Subject to the terms and conditions of the Agreement and Plan of Merger, each outstanding share of magicJack converted into the right to receive $8.71 in cash without interest, representing approximately $143,115 in aggregate merger consideration.
The assets and liabilities of magicJack, both tangible and intangible, were recorded at their estimated fair values as of the November 14, 2018, acquisition date for magicJack. The application of the purchase method of accounting resulted in goodwill of $109,674 which represents the benefits from synergies with the Company’s existing business and acquired workforce. The purchase accounting for the acquisition has been accounted for as a stock purchase with all of the recognized goodwill is expected to be non-deductible for tax purposes.
F-21
The purchase price allocation was as follows:
| Consideration paid by B. Riley: | ||||
| Number of magicJack shares outstanding at November 14, 2018 | 16,248,299 | |||
| Cash merger consideration per share | $ | 8.71 | ||
| Total cash consideration for magicJack common shares | 141,523 | |||
| Cash consideration for magicJack stock options and accelerated vesting of restricted stock awards | 1,592 | |||
| Total consideration | $ | 143,115 | ||
| Tangible assets acquired and assumed: | ||||
| Cash and cash equivalents | $ | 53,875 | ||
| Restricted cash | 369 | |||
| Accounts receivable | 3,103 | |||
| Inventory | 2,033 | |||
| Prepaid expenses and other assets | 4,961 | |||
| Property and equipment | 2,922 | |||
| Deferred taxes | 16,769 | |||
| Accounts payable | (2,313 | ) | ||
| Contract liabilities | (66,489 | ) | ||
| Accrued payroll and related expenses | (1,989 | ) | ||
| Accrued expenses and other liabilities | (24,450 | ) | ||
| Developed technology | 6,400 | |||
| Tradename | 1,750 | |||
| Customer list | 34,500 | |||
| Process-know-how | 2,000 | |||
| Goodwill | 109,674 | |||
| Total | $ | 143,115 | ||
Membership Interest Purchase Agreement with BR Brand Acquisition LLC
On October 11, 2019, the Company and B. Riley Brand Management LLC, an indirect wholly-owned subsidiary of the Company (the “B. Riley Member”), entered into a Membership Interest Purchase Agreement (the “MIPA”) with BR Brand Acquisition LLC (the “BR Brand Member”) and BR Brand, pursuant to which the B. Riley Member acquired a majority of the equity interest in BR Brand. The closing of the transactions in accordance with the MIPA (the “Closing”) occurred on October 28, 2019.
The B. Riley Member completed the Closing of a majority of the equity interest in BR Brand pursuant to the terms of the MIPA in exchange for (i) aggregate consideration of $116,500 in cash and (ii) warrant consideration of $990 from the issuance by the Company to Bluestar Alliance LLC (“Bluestar”), an affiliate of the BR Brand Member, of a warrant to purchase up to 200,000 shares of the Company’s common stock at an exercise price per share equal to $26.24. One-third of the shares of common stock issuable under the warrant immediately vested and became exercisable upon its issuance at the Closing, and the remaining two-thirds of such shares of common stock will vest and become exercisable following the first and/or second anniversaries of the Closing, subject to BR Brand’s (or another related joint venture with Bluestar) satisfaction of specified financial performance targets. The fair value of the non-controlling interest in the amount of $29,373 was determined based on the relative fair value of the net assets acquired. The Company incurred $570 of transaction costs in connection with the acquisition.
In connection with the Closing, (i) the BR Brand Member has caused the transfer of certain trademarks, domain names, license agreements and related assets from existing brand owners to BR Brand and (ii) the Company, Bluestar and certain of their affiliates (including the B. Riley Member and the BR Brand Member) entered into an amended and restated operating agreement for BR Brand and certain other commercial agreements.
F-22
The Company evaluated the transaction under the Financial Accounting Standards Board (“FASB”) Accounting Standards Codification (“ASC”) Topic 805, Business Combinations, and Accounting Standards Update (“ASU”) 2017-01, Business Combinations: Clarifying the Definition of a Business. Based on this evaluation, the Company has determined that the acquisition did not meet the definition of a business and, therefore, has accounted for the transaction as an acquisition of assets. The fair value of the assets acquired, including transaction costs, have been reflected in the accompanying financial statements as follows:
| Consideration paid by B. Riley: | ||||
| Cash acquisition consideration | $ | 116,500 | ||
| Transaction costs | 570 | |||
| Total cash consideration | 117,070 | |||
| Warrant consideration | 990 | |||
| Total consideration | $ | 118,060 | ||
| Tangible assets acquired and assumed: | ||||
| Cash and cash equivalents | $ | 2,160 | ||
| Accounts receivable | 1,751 | |||
| Deferred revenue | (1,332 | ) | ||
| Tradename | 136,176 | |||
| Customer list | 8,678 | |||
| Non-controlling interest | (29,373 | ) | ||
| Total | $ | 118,060 | ||
Pro Forma Financial Information
The unaudited pro-forma financial information in the table below summarizes the combined results of operations of the Company and magicJack as though the acquisition had occurred as of January 1, 2018. The pro-forma financial information presented includes the effects of adjustments related to the amortization charges from the acquired intangible assets and the elimination of certain activities excluded from the transaction and transaction related costs. The pro forma financial information as presented below is for informational purposes only and is not necessarily indicative of the results of operations that would have been achieved if the acquisition had taken place at the beginning of the earliest period presented, nor does it intend to be a projection of future results.
| Pro Forma (Unaudited) | ||||
| Year Ended December 31, | ||||
| 2018 | ||||
| Revenues | $ | 489,556 | ||
| Net income attributable to B. Riley Financial, Inc. | $ | 20,822 | ||
| Basic earnings per share | $ | 0.80 | ||
| Diluted earnings per share | $ | 0.78 | ||
| Weighted average basic shares outstanding | 25,937,305 | |||
| Weighted average diluted shares outstanding | 26,764,856 | |||
NOTE 4 — RESTRUCTURING CHARGE
The Company recorded restructuring charges in the amount of $1,699, $8,506 and $12,374 for the years ended December 31, 2019, 2018 and 2017, respectively.
The restructuring charges during the year ended December 31, 2019 were primarily related to severance costs for magicJack employees from a reduction in workforce and lease termination costs in the Principal Investments – United Online and magicJack segment.
The restructuring charges during the year ended December 31, 2018 were primarily related to severance costs and lease loss accruals for the planned consolidation of office space related to operations in the Capital Markets segment and the rebrand of B. Riley Wealth Management.
F-23
During the year ended December 31, 2017, the Company implemented costs savings measures taking into account the planned synergies as a result of the acquisitions of FBR and Wunderlich, which included a reduction in force for some of the corporate executives of FBR and Wunderlich and a restructuring to integrate FBR and Wunderlich’s operations with the Company’s existing operations. These initiatives resulted in a restructuring charge of $11,651 during the year ended December 31, 2017. The restructuring charges during the year ended December 31, 2017 included $2,400 related to severance and $884 related to the accelerated vesting of restricted stock awards to former corporate executives of FBR and Wunderlich and $3,241 of severance and $1,710 related to accelerated vesting of stock awards to employees and $3,416 of lease loss accruals and impairments for the planned consolidation of office space related to operations of FBR and Wunderlich. Of the $11,651 of restructuring charges related to these initiatives, $7,855 related to the Capital Markets segment and $3,796 related to corporate overhead. The restructuring charge during the year ended December 31, 2017 also included employee termination costs of $723 related to a reduction in personnel in the Principal Investments - United Online segment of the Company’s operations.
The following tables summarize the changes in accrued restructuring charge during the year ended December 31, 2019, 2018 and 2017:
| Year Ended December 31, | ||||||||||||
| 2019 | 2018 | 2017 | ||||||||||
| Balance, beginning of year | $ | 3,855 | $ | 2,600 | $ | 694 | ||||||
| Restructuring charge | 1,699 | 8,506 | 12,374 | |||||||||
| Cash paid | (4,150 | ) | (4,667 | ) | (5,957 | ) | ||||||
| Non-cash items | 196 | (2,584 | ) | (4,511 | ) | |||||||
| Balance, end of year | $ | 1,600 | $ | 3,855 | $ | 2,600 | ||||||
The following tables summarize the restructuring activities by reportable segment during the year ended December 31, 2019, 2018 and 2017:
| Year Ended December 31, 2019 | ||||||||||||||||
| Principal | ||||||||||||||||
| Investments - | ||||||||||||||||
| Capital | United Online | |||||||||||||||
| Markets | and magicJack | Corporate | Total | |||||||||||||
| Restructuring charge: | ||||||||||||||||
| Employee termination costs | $ | — | $ | 1,594 | $ | — | $ | 1,594 | ||||||||
| Facility closure and consolidation charge (recovery) | (4 | ) | 109 | — | 105 | |||||||||||
| Total restructuring charge | $ | (4 | ) | $ | 1,703 | $ | — | $ | 1,699 | |||||||
| Year Ended December 31, 2018 | ||||||||||||||||
| Principal | ||||||||||||||||
| Investments - | ||||||||||||||||
| Capital | United Online | |||||||||||||||
| Markets | and magicJack | Corporate | Total | |||||||||||||
| Restructuring charge: | ||||||||||||||||
| Employee termination costs | $ | 4,179 | $ | 338 | $ | — | $ | 4,517 | ||||||||
| Impairment of intangible assets | 1,070 | — | — | 1,070 | ||||||||||||
| Facility closure and consolidation charge (recovery) | 3,129 | — | (210 | ) | 2,919 | |||||||||||
| Total restructuring charge | $ | 8,378 | $ | 338 | $ | (210 | ) | $ | 8,506 | |||||||
| Year Ended December 31, 2017 | ||||||||||||||||
| Principal | ||||||||||||||||
| Investments - | ||||||||||||||||
| Capital | United Online | |||||||||||||||
| Markets | and magicJack | Corporate | Total | |||||||||||||
| Restructuring charge: | ||||||||||||||||
| Employee termination costs | $ | 4,951 | $ | 723 | $ | 3,284 | $ | 8,958 | ||||||||
| Facility closure and consolidation charge (recovery) | 2,904 | — | 512 | 3,416 | ||||||||||||
| Total restructuring charge | $ | 7,855 | $ | 723 | $ | 3,796 | $ | 12,374 | ||||||||
F-24
NOTE 5 — SECURITIES LENDING
The following table presents the contractual gross and net securities borrowing and lending balances and the related offsetting amount as of December 31, 2019 and 2018:
| Amounts not | ||||||||||||||||||||
| offset in the | ||||||||||||||||||||
| consolidated balance | ||||||||||||||||||||
| Gross amounts | Net amounts | sheets but eligible | ||||||||||||||||||
| offset in the | included in the | for offsetting | ||||||||||||||||||
| Gross amounts | consolidated | consolidated | upon counterparty | |||||||||||||||||
| recognized | balance sheets (1) | balance sheets | default(2) | Net amounts | ||||||||||||||||
| As of December 31, 2019 | ||||||||||||||||||||
| Securities borrowed | $ | 814,331 | $ | — | $ | 814,331 | $ | 814,331 | $ | — | ||||||||||
| Securities loaned | $ | 810,495 | $ | — | $ | 810,495 | $ | 810,495 | $ | — | ||||||||||
| As of December 31, 2018 | ||||||||||||||||||||
| Securities borrowed | $ | 931,346 | $ | — | $ | 931,346 | $ | 931,346 | $ | — | ||||||||||
| Securities loaned | $ | 930,522 | $ | — | $ | 930,522 | $ | 930,522 | $ | — | ||||||||||
| (1) | Includes financial instruments subject to enforceable master netting provisions that are permitted to be offset to the extent an event of default has occurred. |
| (2) | Includes the amount of cash collateral held/posted. |
NOTE 6 — ACCOUNTS RECEIVABLE
The components of accounts receivable, net, include the following:
| December 31, | December 31, | |||||||
| 2019 | 2018 | |||||||
| Accounts receivable | $ | 36,385 | $ | 12,594 | ||||
| Investment banking fees, commissions and other receivables | 8,043 | 26,581 | ||||||
| Unbilled receivables | 3,710 | 3,644 | ||||||
| Total accounts receivable | 48,138 | 42,819 | ||||||
| Allowance for doubtful accounts | (1,514 | ) | (696 | ) | ||||
| Accounts receivable, net | $ | 46,624 | $ | 42,123 | ||||
Additions and changes to the allowance for doubtful accounts consist of the following:
| Year Ended December 31, | ||||||||||||
| 2019 | 2018 | 2017 | ||||||||||
| Balance, beginning of period | $ | 696 | $ | 800 | $ | 255 | ||||||
| Add: Additions to reserve | 2,126 | 1,308 | 1,066 | |||||||||
| Less: Write-offs | (1,151 | ) | (1,066 | ) | (311 | ) | ||||||
| Less: Recovery | (157 | ) | (346 | ) | (210 | ) | ||||||
| Balance, end of period | $ | 1,514 | $ | 696 | $ | 800 | ||||||
Unbilled receivables represent the amount of contractual reimbursable costs and fees for services performed in connection with fee and service based auction and liquidation contracts.
F-25
NOTE 7 — PROPERTY AND EQUIPMENT
Property and equipment, net, consists of the following:
| Estimated | December 31, | |||||||||
| Useful Lives | 2019 | 2018 | ||||||||
| Leasehold improvements | Shorter of the remaining lease term or estimated useful life | $ | 12,055 | $ | 11,513 | |||||
| Machinery, equipment and computer software | 1 to 9 years | 14,873 | 18,652 | |||||||
| Furniture and fixtures | 3.5 to 5 years | 4,305 | 5,143 | |||||||
| Total | 31,233 | 35,308 | ||||||||
| Less: Accumulated depreciation and amortization | (18,506 | ) | (19,785 | ) | ||||||
| $ | 12,727 | $ | 15,523 | |||||||
Depreciation expense was $5,202, $4,674 and $3,718 during the years ended December 31, 2019, 2018 and 2017, respectively.
NOTE 8 — GOODWILL AND OTHER INTANGIBLE ASSETS
Goodwill was $223,697 and $223,368 at December 31, 2019 and December 31, 2018, respectively.
The changes in the carrying amount of goodwill for the years ended December 31, 2019 and 2018 were as follows:
| Principal | ||||||||||||||||||||
| Investments- | ||||||||||||||||||||
| Capital | Auction and | Valuation and | United Online | |||||||||||||||||
| Markets | Liquidation | Appraisal | and magicJack | |||||||||||||||||
| Segment | Segment | Segment | Segment | Total | ||||||||||||||||
| Balance as of December 31, 2017 | $ | 77,356 | $ | 1,975 | $ | 3,713 | $ | 15,727 | $ | 98,771 | ||||||||||
| Goodwill acquired during the year: | ||||||||||||||||||||
| Wunderlich purchase price adjustment | 1,847 | — | — | — | 1,847 | |||||||||||||||
| GlassRatner on August 1, 2018 | 16,617 | — | — | — | 16,617 | |||||||||||||||
| magicJack on November 14, 2018 | — | — | — | 106,133 | 106,133 | |||||||||||||||
| Balance as of December 31, 2018 | 95,820 | 1,975 | 3,713 | 121,860 | 223,368 | |||||||||||||||
| Goodwill acquired during the year: | ||||||||||||||||||||
| magicJack purchase price adjustment | — | — | — | 3,542 | 3,542 | |||||||||||||||
| magicJack allocation to the sale of a division | — | — | — | (3,213 | ) | (3,213 | ) | |||||||||||||
| Balance as of December 31, 2019 | $ | 95,820 | $ | 1,975 | $ | 3,713 | $ | 122,189 | $ | 223,697 | ||||||||||
Intangible assets consisted of the following:
| As of December 31, 2019 | As of December 31, 2018 | |||||||||||||||||||||||||
| Gross | Gross | |||||||||||||||||||||||||
| Carrying | Accumulated | Intangibles | Carrying | Accumulated | Intangibles | |||||||||||||||||||||
| Useful Life | Value | Amortization | Net | Value | Amortization | Net | ||||||||||||||||||||
| Amortizable assets: | ||||||||||||||||||||||||||
| Customer relationships | 2 to 16 Years | $ | 99,008 | $ | 27,269 | $ | 71,739 | $ | 92,330 | $ | 16,608 | $ | 75,722 | |||||||||||||
| Domain names | 7 Years | 233 | 117 | 116 | 237 | 85 | 152 | |||||||||||||||||||
| Advertising relationships | 8 Years | 100 | 44 | 56 | 100 | 31 | 69 | |||||||||||||||||||
| Internally developed software and other intangibles | 0.5 to 5 Years | 11,765 | 4,843 | 6,922 | 11,773 | 2,436 | 9,337 | |||||||||||||||||||
| Trademarks | 7 to 10 Years | 4,600 | 1,324 | 3,276 | 4,600 | 762 | 3,838 | |||||||||||||||||||
| Total | 115,706 | 33,597 | 82,109 | 109,040 | 19,922 | 89,118 | ||||||||||||||||||||
| Non-amortizable assets: | ||||||||||||||||||||||||||
| Tradenames | 138,416 | — | 138,416 | 2,240 | — | 2,240 | ||||||||||||||||||||
| Total intangible assets | $ | 254,122 | $ | 33,597 | $ | 220,525 | $ | 111,280 | $ | 19,922 | $ | 91,358 | ||||||||||||||
Amortization expense was $13,846, $9,135 and $7,422 for the years ended December 31, 2019, 2018 and 2017, respectively. At December 31, 2019, estimated future amortization expense is $15,714, $15,218, $14,564, $12,573 and $8,486 for the years ended December 31, 2020, 2021, 2022, 2023 and 2024, respectively. The estimated future amortization expense after December 31, 2024 is $15,554.
F-26
NOTE 9 — LEASING ARRANGEMENTS
The Company’s operating lease assets primarily represent the lease of office space where the Company conducts its operations with the weighted average lease term of 8.0 years. The operating leases have lease terms ranging from one month to twelve years. The weighted average discount rate used to calculate the present value of lease payments was 5.58% at December 31, 2019. For the years ended December 31, 2019, 2018 and 2017, the total operating lease expense was $12,582, $11,752 and $7,599, respectively. For the year ended December 31, 2019, $1,289 of operating lease expense were attributable to variable lease expenses. Operating lease expense is included in selling, general and administrative expenses in the consolidated statements of income.
For the year ended December 31, 2019, cash payments against operating lease liabilities totaled $12,934 and non-cash transactions totaled $3,679 to recognize operating lease right-of-use assets and operating lease liabilities. Cash flows from operating leases are classified as net cash flows from operating activities in the accompanying consolidated statements of cash flows.
As of December 31, 2019, maturities of operating lease liabilities were as follows:
| Operating | ||||
| Leases | ||||
| Year ending December 31: | ||||
| 2020 | $ | 12,646 | ||
| 2021 | 10,753 | |||
| 2022 | 9,881 | |||
| 2023 | 9,127 | |||
| 2024 | 8,759 | |||
| Thereafter | 24,719 | |||
| Total lease payments | 75,885 | |||
| Less: imputed interest | (14,374 | ) | ||
| Total operating lease liability | $ | 61,511 | ||
At December 31, 2019, the Company did not have any significant leases executed but not yet commenced.
NOTE 10 — NOTES PAYABLE
Asset Based Credit Facility
On April 21, 2017, the Company amended its credit agreement (as amended, the “Credit Agreement”) governing its asset based credit facility with Wells Fargo Bank, National Association (“Wells Fargo Bank”) to increase the maximum borrowing limit from $100,000 to $200,000. Such amendment, among other things, also extended the expiration date of the credit facility from July 15, 2018 to April 21, 2022. The Credit Agreement continues to allow for borrowings under the separate credit agreement (a “UK Credit Agreement”) which was dated March 19, 2015 with an affiliate of Wells Fargo Bank which provides for the financing of transactions in the United Kingdom. Such facility allows the Company to borrow up to 50 million British Pounds. Any borrowings on the UK Credit Agreement reduce the availability on the asset based $200,000 credit facility. The UK Credit Agreement is cross collateralized and integrated in certain respects with the Credit Agreement. Cash advances and the issuance of letters of credit under the credit facility are made at the lender’s discretion. The letters of credit issued under this facility are furnished by the lender to third parties for the principal purpose of securing minimum guarantees under liquidation services contracts more fully described in Note 2(c). All outstanding loans, letters of credit, and interest are due on the expiration date which is generally within 180 days of funding. The credit facility is secured by the proceeds received for services rendered in connection with liquidation service contracts pursuant to which any outstanding loan or letters of credit are issued and the assets that are sold at liquidation related to such contract. The Company paid Wells Fargo Bank a closing fee in the amount of $500 in connection with the April 2017 amendment to the Credit Agreement. The interest rate for each revolving credit advance under the Credit Agreement is, subject to certain terms and conditions, equal to the LIBOR plus a margin of 2.25% to 3.25% depending on the type of advance and the percentage such advance represents of the related transaction for which such advance is provided. The credit facility also provides for success fees in the amount of 2.5% to 17.5% of the net profits, if any, earned on the liquidation engagements funded under the Credit Agreement as set forth therein. Interest expense totaled $1,503, $4,247 and $1,136 for the years ended December 31, 2019, 2018 and 2017, respectively. The outstanding balance on this credit facility was $37,096 and $0 at December 31, 2019 and 2018, respectively. At December 31, 2019, there were no open letters of credit outstanding.
We are in compliance with all financial covenants in the asset based credit facility at December 31, 2019.
F-27
Other Notes Payable
Notes payable include notes payable to a clearing organization for one of the Company’s broker dealers. The notes payable accrue interest at the prime rate plus 2.0% (7.5% at December 30, 2019) payable annually, maturing January 31, 2022. At December 31, 2019 and 2018, the outstanding balance for the notes payable was $1,071 and $1,550, respectively. Interest expense was $87, $111 and $71 for the years ended December 31, 2019, 2018 and 2017, respectively.
NOTE 11 — TERM LOAN
On December 19, 2018, BRPI Acquisition Co LLC (“BRPAC”), a Delaware limited liability company, UOL, and YMAX Corporation, Delaware corporations (collectively, the “Borrowers”), indirect wholly owned subsidiaries of the Company, in the capacity as borrowers, entered into a credit agreement (the “BRPAC Credit Agreement”) with the Banc of California, N.A. in the capacity as agent (the “Agent”) and lender and with the other lenders party thereto (the “Closing Date Lenders”). Certain of the Borrowers’ U.S. subsidiaries are guarantors of all obligations under the BRPAC Credit Agreement and are parties to the BRPAC Credit Agreement in such capacity (collectively, the “Secured Guarantors”; and together with the Borrowers, the “Credit Parties”). In addition, the Company and B. Riley Principal Investments, LLC, the parent corporation of BRPAC and a subsidiary of the Company, are guarantors of the obligations under the BRPAC Credit Agreement pursuant to standalone guaranty agreements pursuant to which the shares outstanding membership interests of BRPAC are pledged as collateral.
The obligations under the BRPAC Credit Agreement are secured by first-priority liens on, and first priority security interest in, substantially all of the assets of the Credit Parties, including a pledge of (a) 100% of the equity interests of the Credit Parties, (b) 65% of the equity interests in United Online Software Development (India) Private Limited, a private limited company organized under the laws of India; and (c) 65% of the equity interests in magicJack VocalTec LTD., a limited company organized under the laws of Israel. Such security interests are evidenced by pledge, security and other related agreements.
The BRPAC Credit Agreement contains certain covenants, including those limiting the Credit Parties’, and their subsidiaries’ ability to incur indebtedness, incur liens, sell or acquire assets or businesses, change the nature of their businesses, engage in transactions with related parties, make certain investments or pay dividends. In addition, the BRPAC Credit Agreement requires the Credit Parties to maintain certain financial ratios. The BRPAC Credit Agreement also contains customary representations and warranties, affirmative covenants and events of default, including payment defaults, breach of representations and warranties, covenant defaults and cross defaults. If an event of default occurs, the agent would be entitled to take various actions, including the acceleration of amounts due under the outstanding BRPAC Credit Agreement.
Under the BRPAC Credit Agreement, the Company borrowed $80,000 due December 19, 2023. Pursuant to the terms of the BRPAC Credit Agreement, the Company may request additional optional term loans in an aggregate principal amount of up to $10,000 at any time prior to the first anniversary of the agreement date (the “Option Loan”) with a final maturity date of December 19, 2023. On February 1, 2019, the Credit Parties, the Closing Date Lenders, the Agent and City National Bank, as a new lender (the “New Lender”), entered into the First Amendment to the Credit Agreement and Joinder (the “First Amendment”) pursuant to which, among other things, (i) New Lender became a party to the BRPAC Credit Agreement, (ii) the New Lender extended to Borrowers the Option Loan in the amount of $10,000, (iii) the aggregate outstanding principal amount of the term loans was increased from $80,000 to $90,000; and (iv) the amortization schedule under the BRPAC was amended as set forth in the First Amendment. Additionally, in connection with the Option Loan, the Borrowers executed a term note in favor of New Lender dated February 1, 2019 in the amount of $10,000. Borrowings under the BRPAC Credit Agreement bear interest at a rate equal to (a) the LIBOR rate for Eurodollar loans, plus (b) the applicable margin rate, which ranges from 2.5% to 3.0% per annum, based upon the Borrowers’ ratio of consolidated funded indebtedness to adjusted earnings before interest, taxes, depreciation, and amortization (EBITDA) for the preceding four fiscal quarters or other applicable period. At December 31, 2019 interest rate on the BRPAC Credit Agreement was at 4.55%. Interest payments are to be made each one, three or six months. Amounts outstanding under the BRPAC Credit Agreement are due in quarterly installments commencing on March 31, 2019 with any remaining amounts outstanding due at maturity. For the $80,000 loan, quarterly installments from December 31, 2019 to December 31, 2022 are in the amount of $4,244 per quarter and from March 31, 2023 to December 31, 2023 are $2,122 per quarter. For the $10,000 loan, quarterly installments from December 31, 2019 to December 31, 2022 are $566 per quarter and from March 31, 2023 to December 31, 2023 are $265 per quarter. As of December 31, 2019 and 2018, the outstanding balance on the term loan was $66,666 (net of unamortized debt issuance costs of $600) and $79,166 (net of unamortized debt issuance costs of $834), respectively. Interest expense on the term loan during the years ended December 31, 2019 and 2018, was $4,609 (including amortization of deferred debt issuance costs of $350) and $170 (including amortization of deferred debt issuance costs of $12), respectively.
We are in compliance with all financial covenants in the BRPAC Credit Agreement at December 31, 2019.
On April 13, 2017, UOL, in the capacity as borrower, entered into a credit agreement (the “UOL Credit Agreement”) with Banc of California, N.A. in the capacity as agent and lender. The UOL Credit Agreement provided for a revolving credit facility under which UOL may borrow (or request the issuance of letters of credit) up to $20,000 which amount was reduced by $1,500 commencing on June 30, 2017 and on the last day of each calendar quarter thereafter. The BRPAC Credit Agreement replaced the UOL Credit Agreement and the UOL Credit Agreement was terminated with a zero ($0) balance at December 12, 2018. There was no outstanding balance at termination. Interest expense totaled $456 (including amortization of remaining deferred loan fees at termination of $313) and $292 (including amortization of deferred loan fees of $97) for the years ended December 31, 2018 and 2017, respectively.
F-28
NOTE 12 — SENIOR NOTES PAYABLE
Senior notes payable, net, is comprised of the following as of December 31, 2019 and 2018:
| December 31, | December 31, | |||||||
| 2019 | 2018 | |||||||
| 7.50% Senior notes due October 31, 2021 | $ | — | $ | 46,407 | ||||
| 7.50% Senior notes due May 31, 2027 | 117,954 | 108,792 | ||||||
| 7.25% Senior notes due December 31, 2027 | 120,126 | 100,441 | ||||||
| 7.375% Senior notes due May 31, 2023 | 122,140 | 111,528 | ||||||
| 6.875% Senior notes due September 30, 2023 | 105,952 | 100,050 | ||||||
| 6.75% Senior notes due May 31, 2024 | 106,589 | — | ||||||
| 6.50% Senior notes due September 30, 2026 | 124,226 | — | ||||||
| 696,987 | 467,218 | |||||||
| Less: Unamortized debt issuance costs | (8,875 | ) | (7,464 | ) | ||||
| $ | 688,112 | $ | 459,754 | |||||
During the year ended December 31, 2019, the Company issued $66,874 of senior notes due with maturities dates ranging from October 2021 to December 2027 pursuant to At the Market Issuance Sales Agreements with B. Riley FBR, Inc. which governs the program of at-the-market sales of the Company’s senior notes. A series of prospectus supplements were filed by the Company with the SEC which allowed the Company to sell these senior notes.
On May 7, 2019, the Company issued $100,050 senior notes due in May 2024 (“6.75% 2024 Notes”) pursuant to the prospectus supplement dated May 2, 2019. Interest on the 6.75% 2024 Notes is payable quarterly at 6.75%. The 6.75% 2024 Notes are unsecured and due and payable in full on May 31, 2024. In connection with the issuance of the 6.75% 2024 Notes, the Company received net proceeds of $98,073 (after underwriting commissions, fees and other issuance costs of $1,977).
On September 23, 2019, the Company issued $115,000 senior notes due in September 2026 (“6.50% 2026 Notes”) pursuant to the prospectus supplement dated September 18, 2019. Interest on the 6.50% 2026 Notes is payable quarterly at 6.50%. The 6.50% 2026 Notes are unsecured and due and payable in full on September 30, 2026. In connection with the issuance of the 6.50% 2026 Notes, the Company received net proceeds of $112,644 (after underwriting commissions, fees and other issuance costs of $2,356).
On December 30, 2019, the Company redeemed $52,154 senior notes due in October 2021 (“7.50% 2021 Notes”). The Company recognized a net loss on acceleration of unamortized discount of $300 on this redemption.
At December 31, 2019 and 2018, the total senior notes outstanding was $688,112 (net of unamortized debt issue costs of $8,875) and $459,754 (net of unamortized debt issue costs of $7,464) with a weighted average interest rate of 7.05% and 7.28%, respectively. Interest on senior notes is payable on a quarterly basis. Interest expense on senior notes totaled $43,823, $25,428 and $6,390 for the three years ended December 31, 2019, 2018 and 2017, respectively.
Sales Agreement Prospectus to Issue Up to $100,000 of Senior Notes, Common Stock and Preferred Stock
On December 5, 2019, the Company entered into a new At Market Issuance Sales Agreement (the “December 2019 Sales Agreement”) with B. Riley FBR, Inc. governing a program of at-the-market sales of certain of the Company’s senior notes, common stock and preferred stock. The most recent sales agreement prospectus was filed by the Company with the SEC on September 30, 2019, as supplemented by a prospectus supplement dated December 5, 2019 (the “Sales Agreement Prospectus”). The Sales Agreement Prospectus allows the Company to sell up to $100,000 of certain of the Company’s senior notes, common stock, and preferred stock pursuant to an effective Registration Statement on Form S-3. As of December 31, 2019, the Company had $60,754 remaining availability under the December 2019 Sales Agreement.
2020 Senior Notes Transactions
On February 10, 2020, the Company filed a registration statement registering an additional indeterminate amount of debt securities with an aggregate offering price not to exceed $22,400.
On February 12, 2020, the Company issued $132,250 senior notes due in February 2025 (“6.375% 2025 Notes”) pursuant to the prospectus supplement dated February 10, 2020. Interest on the 6.375% 2025 Notes is payable quarterly at 6.375%. The 6.375% 2025 Notes are unsecured and due and payable in full on February 28, 2025. In connection with the issuance of the 6.375% 2025 Notes, the Company received net proceeds of $129,423 (after underwriting commissions, fees and other issuance costs of $2,827).
On February 14, 2020, the Company entered into a new At Market Issuance Sales Agreement (the “February 2020 Sales Agreement”) with B. Riley FBR, Inc. governing a program of at-the-market sales of certain of the Company’s senior notes. The most recent sales agreement prospectus was filed by the Company with the SEC on February 14, 2020 (the “February 2020 Sales Agreement Prospectus”). The Sales Agreement Prospectus allows the Company to sell up to $150,000 of certain of the Company’s senior notes pursuant to an effective Registration Statement on Form S-3.
F-29
NOTE 13 — REVENUE FROM CONTRACTS WITH CUSTOMERS
Revenue from contracts with customers by reportable segment for the years ended December 31, 2019 and 2018 is as follows:
| Year Ended December 31, 2019 | ||||||||||||||||||||||||
| Reportable Segment | ||||||||||||||||||||||||
| Principal | ||||||||||||||||||||||||
| Investments - | ||||||||||||||||||||||||
| Capital | Auction and | Valuation and | United Online and | |||||||||||||||||||||
| Markets | Liquidation | Appraisal | magicJack | Brands | Total | |||||||||||||||||||
| Corporate finance, consulting and investment banking fees | $ | 166,951 | $ | — | $ | — | $ | — | $ | — | $ | 166,951 | ||||||||||||
| Wealth and asset management fees | 82,778 | — | — | — | — | 82,778 | ||||||||||||||||||
| Commissions, fees and reimbursed expenses | 42,503 | 49,849 | 38,821 | — | — | 131,173 | ||||||||||||||||||
| Subscription services | — | — | — | 82,088 | — | 82,088 | ||||||||||||||||||
| Service contract revenues | — | (31,553 | ) | — | — | — | (31,553 | ) | ||||||||||||||||
| Advertising, licensing and other(1) | — | 4,220 | — | 18,774 | 4,055 | 27,049 | ||||||||||||||||||
| Total revenues from contracts with customers | 292,232 | 22,516 | 38,821 | 100,862 | 4,055 | 458,486 | ||||||||||||||||||
| Interest income - Loans and securities lending | 77,221 | — | — | — | — | 77,221 | ||||||||||||||||||
| Trading gains on investments | 95,487 | — | — | — | — | 95,487 | ||||||||||||||||||
| Other | 20,918 | — | — | — | — | 20,918 | ||||||||||||||||||
| Total revenues | $ | 485,858 | $ | 22,516 | $ | 38,821 | $ | 100,862 | $ | 4,055 | $ | 652,112 | ||||||||||||
| (1) | Includes sale of goods of $4,220 in Auction Liquidation and $3,715 in Principal Investments – United Online and magicJack. |
| Year Ended December 31, 2018 | ||||||||||||||||||||||||
| Reportable Segment | ||||||||||||||||||||||||
| Principal | ||||||||||||||||||||||||
| Investments - | ||||||||||||||||||||||||
| Capital | Auction and | Valuation and | United Online and | |||||||||||||||||||||
| Markets | Liquidation | Appraisal | magicJack | Brands | Total | |||||||||||||||||||
| Corporate finance, consulting and investment banking fees | $ | 117,978 | $ | — | $ | — | $ | — | $ | — | $ | 117,978 | ||||||||||||
| Wealth and asset management fees | 74,510 | — | — | — | — | 74,510 | ||||||||||||||||||
| Commissions, fees and reimbursed expenses | 44,235 | 36,250 | 38,705 | — | — | 119,190 | ||||||||||||||||||
| Subscription services | — | — | — | 42,887 | — | 42,887 | ||||||||||||||||||
| Service contract revenues | — | 18,673 | — | — | — | 18,673 | ||||||||||||||||||
| Advertising, licensing and other(1) | — | 63 | — | 11,347 | — | 11,410 | ||||||||||||||||||
| Total revenues from contracts with customers | 236,723 | 54,986 | 38,705 | 54,234 | — | 384,648 | ||||||||||||||||||
| Interest income - Loans and securities lending | 38,277 | — | — | — | — | 38,277 | ||||||||||||||||||
| Trading losses on investments | (16,129 | ) | — | — | — | — | (16,129 | ) | ||||||||||||||||
| Other | 16,195 | — | — | — | — | 16,195 | ||||||||||||||||||
| Total revenues | $ | 275,066 | $ | 54,986 | $ | 38,705 | $ | 54,234 | $ | — | $ | 422,991 | ||||||||||||
| (1) | Includes sale of goods of $63 in Auction Liquidation and $575 in Principal Investments – United Online and magicJack. |
Revenues are recognized when control of the promised goods or performance obligations for services is transferred to the Company’s customers, in an amount that reflects the consideration the Company expects to be entitled to in exchange for the goods or services. A performance obligation may be satisfied over time or at a point in time. Revenue from a performance obligation satisfied over time is recognized by measuring the Company’s progress in satisfying the performance obligation in a manner that depicts the transfer of the goods or services to the customer. Revenue from a performance obligation satisfied at a point in time is recognized at the point in time that we determine the customer obtains control over the promised good or service. The amount of revenue recognized reflects the consideration we expect to be entitled to in exchange for those promised goods or services (i.e., the “transaction price”). In determining the transaction price, the Company considers multiple factors, including the effects of variable consideration. Variable consideration is included in the transaction price only to the extent it is probable that a significant reversal in the amount of cumulative revenue recognized will not occur when the uncertainties with respect to the amount are resolved. In determining when to include variable consideration in the transaction price, the Company considers the range of possible outcomes, the predictive value of the Company’s past experiences, the time period of when uncertainties expect to be resolved and the amount of consideration that is susceptible to factors outside of our influence, such as market volatility or the judgment and actions of third parties. Revenues by geographic region by segment is included in Note 22 – Business Segments.
F-30
The following provides detailed information on the recognition of the Company’s revenues from contracts with customers:
Corporate finance and investment banking fees. Fees earned from corporate finance and investment banking services are derived from debt, equity and convertible securities offerings in which the Company acted as an underwriter or placement agent. Fees from underwriting activities are recognized as revenues when the performance obligation for the services related to the underwriting transaction is satisfied under the terms of the engagement and is not subject to any other contingencies. Fees are also earned from financial advisory and consulting services rendered in connection with client mergers, acquisitions, restructurings, recapitalizations and other strategic transactions. The performance obligation for financial advisory services is satisfied over time as work progresses on the engagement and services are delivered to the client. The performance obligation for financial advisory services may also include success and performance based fees which are recognized as revenue when the performance obligation is no longer constrained and it is not probable that the revenue recognized would be subject to significant reversal in a future period. Generally, it is probable that the revenue recognized is no longer subject to significant reversal upon the closing of the investment banking transaction.
Wealth and asset management fees. Fees from wealth and asset management services consist primarily of investment management fees that are recognized over the period the performance obligation for the services are provided. Investment management fees are primarily comprised of fees for investment management services and are generally based on the dollar amount of the assets being managed.
Commissions, fees and reimbursed expenses. Commissions and other fees from clients for trading activities are earned from equity securities transactions executed as agent or principal are recorded at a point in time on a trade date basis. Commission, fees and reimbursed expenses earned on the sale of goods at Auction and Liquidation sales are recognized when evidence of a contract or arrangement exists, the transaction price has been determined, and the performance obligation has been satisfied when control of the product and risks of ownership has been transferred to the buyer. Revenues from fees and reimbursed expenses for valuation services to clients are recognized when the performance obligation is completed and is generally at the point in time upon delivery of the report to the customer.
Subscription services. Subscription service revenues derived from fees charged to UOL pay accounts and are recognized in the period in which the transaction price has been determinable and the related performance obligations for services are provided to the customer. The Company’s pay accounts generally pay in advance for their services by credit card, PayPal, automated clearinghouse or check, and revenues are then recognized ratably over the service period. Subscription service revenues from magicJack include (a) revenues for initial access rights, which are recognized ratably over the service term, (b) revenues from access rights renewal, which are recognized ratably over the extended access right period; (c) revenues from access and wholesale charges, which are recognized as calls are terminated to the network; (d) revenues from UCaaS services, which are recognized in the period the services are provided over the term of the customer agreements; and (e) prepaid international long distance minutes, which are recognized as the minutes are used or expired.
Service contract revenues. Service contract revenues are primarily earned from Auction and Liquidation services contracts where the Company guarantees a minimum recovery value for goods being sold at auction or liquidation are recognized over time when the performance obligation is satisfied. The Company generally uses the cost-to-cost measure of progress for its contracts because it best depicts the transfer of services to the customer which occurs as the Company incurs costs on its contracts. Under the cost-to-cost measure of progress, the extent of progress towards completion is measured based on the ratio of costs incurred to date to the total estimated costs at completion of the performance obligation. Revenues, including estimated fees or profits, are recorded proportionally as costs are incurred. Costs to fulfill the contract include labor and other direct costs incurred by the Company related to the contract. Due to the nature of the guarantees and performance obligations under these contracts, the estimation of revenue that is ultimately earned is complex and subject to many variables and requires significant judgment. It is common for these contracts to contain provisions that can either increase or decrease the transaction price upon completion of our performance obligations under the contract. Estimated amounts are included in the transaction price at the most likely amount it is probable that a significant reversal of revenue will not occur. The Company’s estimates of variable consideration and determination of whether or not to include estimated amounts in the transaction price are based on an assessment of its anticipated performance under the contract taking into consideration all historical, current and forecasted information that is reasonably available to the Company.
If the Company determines that the variable consideration used in the initial determination of the transaction price for the contract is such that the total recoveries from the auction or liquidation will not exceed the guaranteed recovery values or advances made in accordance with the contract, the transaction price will be reduced and a loss or negative revenue could result from the performance obligation. A provision for the entire loss as negative revenue on the performance obligation is recognized in the period the loss is determined. Negative revenue from one retail liquidation engagement contributed to the Company reporting negative service contract revenues of $31,553 in the Auction and Liquidation segment during the year ended December 31,2019.
Advertising, licensing and other. Advertising and other revenues consist primarily of amounts from UOL’s Internet search partner that are generated as a result of users utilizing the partner’s Internet search services and amounts generated from display advertisements and the portion of revenues from the sale of magicJack devices that is allocated to hardware, as well as revenues from magicJack ancillary products and mobile broadband service devices to customers. Advertising revenues are recognized in the period in which the advertisement is displayed or, for performance-based arrangements, when the related performance criteria are met. In determining whether an arrangement exists, the Company ensures that a written contract is in place, such as a standard insertion order or a customer-specific agreement. The Company assesses whether performance criteria have been met and whether the transaction price is determinable based on a reconciliation of the performance criteria and the payment terms associated with the transaction. Revenues from the hardware portion of the sale of magicJack devices are recognized upon delivery (when control transfers to the customer). Revenues from the sale of other magicJack related products are recognized at the time of sale. Sale of product revenues also include the related shipping and handling and installment fees, if applicable.
F-31
Licensing revenue results from various license agreements that provide revenue based on guaranteed minimum royalty payments and advertising/marketing fees with additional royalty revenue based on a percentage of defined sales. Guaranteed minimum royalty payments and advertising/marketing revenue are recognized on a straight-line basis over the term of each contract year, as defined in each license agreement. Royalty payments exceeding the guaranteed minimum amounts are recognized as income during the period corresponding to the licensee’s sales. Additionally, payments received for terminating licenses are recognized when termination agreements are entered into and collectability is probable.
Payments received as consideration for the grant of a license are recorded as deferred revenue at the time payment is received and recognized ratably as revenue over the term of the license agreement. Advanced royalty payments are recorded as deferred revenue at the time payment is received and recognized as revenue when earned. Revenue is not recognized unless collectability is probable.
Information on Remaining Performance Obligations and Revenue Recognized from Past Performance
The Company does not disclose information about remaining performance obligations pertaining to contracts that have an original expected duration of one year or less. The transaction price allocated to remaining unsatisfied or partially unsatisfied performance obligation(s) with an original expected duration exceeding one year was not material at December 31, 2019. Corporate finance and investment banking fees and retail liquidation engagement fees that are contingent upon completion of a specific milestone and fees associated with certain distribution services are also excluded as the fees are considered variable and not included in the transaction price at December 31, 2019.
Contract Balances
The timing of the Company’s revenue recognition may differ from the timing of payment by its customers. The Company records a receivable when revenue is recognized prior to payment and the Company has an unconditional right to payment. Alternatively, when payment precedes the provision of the related services, the Company records deferred revenue until the performance obligation(s) are satisfied. Receivables related to revenues from contracts with customers totaled $46,624 and $42,123 at December 31, 2019 and 2018, respectively. The Company had no significant impairments related to these receivables during the year ended December 31, 2019. The Company also has $3,710 and $3,644 of unbilled receivables at December 31, 2019 and 2018, respectively, and advances against customer contracts of $27,347 at December 31, 2019. The Company’s deferred revenue primarily relates to retainer and milestone fees received from corporate finance and investment banking advisory engagements, asset management agreements, Valuation and Appraisal engagements, subscription services where the performance obligation has not yet been satisfied and license agreements with guaranteed minimum royalty payments and advertising/marketing fees with additional royalty revenue based on a percentage of defined sales. Deferred revenue at December 31, 2019 and 2018 was $67,121 and $69,066, respectively. The Company expects to recognize the deferred revenue of $67,121 at December 31, 2019 as service and fee revenues when the performance obligation is met during the years December 31, 2020, 2021, 2022, 2023, 2024 in the amount of $38,563, $14,446, $7,050, $2,985, $1,679, and $2,398, respectively. During the years ended December 31, 2019 and 2018, the Company recognized revenue of $39,885 and $15,278 that was recorded as deferred revenue at the beginning of the respective year.
Contract Costs
Contract costs include: (1) costs to fulfill contracts associated with corporate finance and investment banking engagements are capitalized where the revenue is recognized at a point in time and the costs are determined to be recoverable; (2) costs to fulfill Auction and Liquidation services contracts where the Company guarantees a minimum recovery value for goods being sold at auction or liquidation where the revenue is recognized over time when the performance obligation is satisfied; and (3) commissions paid to obtain magicJack contracts which are recognized ratably over the contract term and third party support costs for magicJack and related equipment purchased by customers which are recognized ratably over the service period.
The capitalized costs to fulfill a contract were $450 and $2,920 at December 31, 2019 and 2018, respectively, and are recorded in prepaid expenses and other assets in the consolidated balance sheets. For the years ended December 31, 2019 and 2018 the Company recognized expenses of $2,755 and $1,428 related to capitalized costs to fulfill a contract, respectively. There were no significant impairment charges recognized in relation to these capitalized costs during year ended December 31, 2019 and 2018.
F-32
NOTE 14 — INCOME TAXES
The Company’s provision for income taxes consists of the following for the years ended December 31, 2019, 2018 and 2017:
| Year Ended December 31, | ||||||||||||
| 2019 | 2018 | 2017 | ||||||||||
| Current: | ||||||||||||
| Federal | $ | 16,499 | $ | 2,117 | $ | 3,804 | ||||||
| State | 6,176 | 284 | 1,019 | |||||||||
| Foreign | 1,092 | (352 | ) | (975 | ) | |||||||
| Total current provision | 23,767 | 2,049 | 3,848 | |||||||||
| Deferred: | ||||||||||||
| Federal | 10,702 | 1,817 | 6,889 | |||||||||
| State | 175 | 353 | (1,937 | ) | ||||||||
| Foreign | — | 684 | (290 | ) | ||||||||
| Total deferred | 10,877 | 2,854 | 4,662 | |||||||||
| Total provision for income taxes | $ | 34,644 | $ | 4,903 | $ | 8,510 | ||||||
A reconciliation of the federal statutory rate of 21%, 21% and 35% to the effective tax rate for income before income taxes is as follows for the year ended December 31, 2019, 2018 and 2017, respectively:
| Year Ended December 31, | ||||||||||||
| 2019 | 2018 | 2017 | ||||||||||
| Provision for income taxes at federal statutory rate | 21.0 | % | 21.0 | % | 35.0 | % | ||||||
| State income taxes, net of federal benefit | 5.9 | 6.0 | 5.0 | |||||||||
| Transaction expenses | — | 1.7 | 2.0 | |||||||||
| Noncontrolling interest tax differential | (0.1 | ) | (1.2 | ) | (6.6 | ) | ||||||
| Key man life insurance | — | — | (7.9 | ) | ||||||||
| Employee stock based compensation | (0.9 | ) | (9.9 | ) | (8.7 | ) | ||||||
| Internal Revenue Service Section 338(g) - Treatment of acquisition of UOL as a taxable business combination | — | — | (44.6 | ) | ||||||||
| U.S. Tax Cuts and Jobs Act | — | — | 63.8 | |||||||||
| Other | 3.8 | 5.4 | 3.6 | |||||||||
| Effective income tax rate | 29.7 | % | 23.0 | % | 41.6 | % | ||||||
F-33
Deferred income tax assets (liabilities) consisted of the following as of December 31, 2019 and 2018:
| December 31, | ||||||||
| 2019 | 2018 | |||||||
| Deferred tax assets: | ||||||||
| Deductible goodwill and other intangibles | $ | — | $ | 690 | ||||
| Accrued liabilities and other | 1,793 | 4,182 | ||||||
| Deferred revenue | — | — | ||||||
| Mandatorily redeemable noncontrolling interests | 1,190 | 1,120 | ||||||
| Other | 2,760 | 4,157 | ||||||
| State taxes | — | 123 | ||||||
| Share based payments | 3,441 | 2,148 | ||||||
| Foreign tax and other tax credit carryforwards | 1,558 | 1,848 | ||||||
| Capital loss carryforward | 61,945 | 61,127 | ||||||
| Net operating loss carryforward | 45,535 | 45,705 | ||||||
| Total deferred tax assets | 118,222 | 121,100 | ||||||
| Deferred tax liabilities: | ||||||||
| Deductible goodwill and other intangibles | (6,246 | ) | — | |||||
| State taxes | (2,831 | ) | (75 | ) | ||||
| Depreciation | 143 | (421 | ) | |||||
| Deferred revenue | (222 | ) | (702 | ) | ||||
| Total deferred tax liabilities | (9,156 | ) | (1,198 | ) | ||||
| Net deferred tax assets | 109,066 | 119,902 | ||||||
| Valuation allowance | (77,544 | ) | (77,503 | ) | ||||
| Net deferred tax assets | $ | 31,522 | $ | 42,399 | ||||
The Company’s income before income taxes of $116,592 for the year ended December 31, 2019 includes a United States component of income before income taxes of $107,073 and a foreign component comprised of income before income taxes of $9,519. As of December 31, 2019, the Company had federal net operating loss carryforwards of $53,932, state net operating loss carryforwards of $64,088. The Company’s federal net operating loss carryforwards will expire in the tax years commencing in December 31, 2032 through December 31, 2037, the state net operating loss carryforwards will expire in tax years commencing in December 31, 2029 and the foreign tax credit carryforwards will expire in tax years commencing 2024.
The Company establishes a valuation allowance if, based on the weight of available evidence, it is more likely than not that some portion or all of the deferred tax assets will not be realized. Tax benefits of operating loss, capital loss and tax credit carryforwards are evaluated on an ongoing basis, including a review of historical and projected future operating results, the eligible carryforward period, and other circumstances. The Company’s net operating losses are subject to annual limitations in accordance with Internal Revenue Code Section 382. Accordingly, the Company is limited to the amount of net operating loss that may be utilized in future taxable years depending on the Company’s actual taxable income. As of December 31, 2019, the Company believes that the existing net operating loss carryforwards will be utilized in future tax periods before the loss carryforwards expire and it is more-likely-than-not that future taxable earnings will be sufficient to realize its deferred tax assets and has not provided a valuation allowance. The Company does not believe that it is more likely than not that the Company will be able to utilize the benefits related to capital loss carryforwards and has provided a valuation allowance in the amount of $61,945 against these deferred tax assets.
F-34
At December 31, 2019, the Company had gross unrecognized tax benefits totaling $10,156 all of which would have an impact on the Company’s effective income tax rate, if recognized. A reconciliation of the amounts of gross unrecognized tax benefits (before federal impact of state items), excluding interest and penalties, was as follows:
| Year Ended | ||||
| December 31, | ||||
| 2019 | ||||
| Beginning balance | $ | 11,138 | ||
| Additions for current year tax positions | 21 | |||
| Additions for prior year tax positions | 505 | |||
| Reductions for prior year tax positions | (1,435 | ) | ||
| Reductions due to lapse in statutes of limitations | (73 | ) | ||
| Ending balance | $ | 10,156 | ||
The Company files income tax returns in the U.S., various state and local jurisdictions, and certain other foreign jurisdictions. The Company is currently under audit by certain federal, state and local, and foreign tax authorities. The audits are in varying stages of completion. The Company evaluates its tax positions and establishes liabilities for uncertain tax positions that may be challenged by tax authorities. Uncertain tax positions are reviewed on an ongoing basis and are adjusted in light of changing facts and circumstances, including progress of tax audits, case law developments and closing of statutes of limitations. Such adjustments are reflected in the provision for income taxes, as appropriate. The Company is currently open to audit under the statute of limitations by the Internal Revenue Service for the calendar years ended December 31, 2016 to 2019.
At December 31, 2019, the Company believes it is reasonably possible that its gross liabilities for unrecognized tax benefits may decrease by approximately $125 within the next 12 months due to expiration of statute of limitations.
The Company had accrued interest and penalties relating to uncertain tax positions of $754 and $3,967 for UOL and magicJack, respectively, for the year ended December 31, 2019 all of which was included in income taxes payable. The Company recorded a benefit of $73 and $174 for UOL and magicJack, respectively, related to interest and penalties for uncertain tax positions primarily due to the lapse in statute of limitation and resolution of magicJack’s 2015 IRS audit in favor of the Company
NOTE 15 — EARNINGS PER SHARE
Basic earnings per share is calculated by dividing net income by the weighted-average number of shares outstanding during the period. Diluted earnings per share is calculated by dividing net income by the weighted-average number of common shares outstanding, after giving effect to all dilutive potential common shares outstanding during the period. Basic common shares outstanding exclude 387,365 common shares in both 2019 and 2018 and 453,365 common shares in 2017 that are held in escrow and subject to forfeiture. The common shares held in escrow include 387,365 common shares that are subject to forfeiture to indemnify the Company for certain representations and warranties in connection with the acquisition of Wunderlich, and in 2017 included 66,000 common shares held in escrow issued to the former members of Great American Group, LLC that were subject to forfeiture upon the final settlement of claims for goods held for sale in connection with the transaction with Alternative Asset Management Acquisition Corp. in 2009. In August 2018, the shares held in escrow issued to the former members of Great American Group, LLC were released and 21,233 of the 66,000 shares held in escrow were cancelled to satisfy the resolution of escrow claims. The shares that remain in escrow are subject to forfeiture upon the final settlement of claims as more fully described in the related escrow instructions. Dilutive common shares outstanding includes contingently issuable shares that are currently in escrow and subject to release if the conditions for the final settlement of claims in accordance with the escrow instructions were satisfied at the end of the respective years. Securities that could potentially dilute basic net income per share in the future that were not included in the computation of diluted net income per share were 1,334,810, 1,920,670 and 709,358 for the year ended December 31, 2019, 2018 and 2017, respectively, because to do so would have been anti-dilutive.
Basic and diluted earnings per share were calculated as follows:
| Year Ended December 31, | ||||||||||||
| 2019 | 2018 | 2017 | ||||||||||
| Net income attributable to B. Riley Financial, Inc. | $ | 81,611 | $ | 15,509 | $ | 11,556 | ||||||
| Preferred stock dividends | (264 | ) | — | — | ||||||||
| Net income applicable to common shareholders | $ | 81,347 | $ | 15,509 | $ | 11,556 | ||||||
| Weighted average common shares outstanding: | ||||||||||||
| Basic | 26,401,036 | 25,937,305 | 23,181,388 | |||||||||
| Effect of dilutive potential common shares: | ||||||||||||
| Restricted stock units and warrants | 1,082,700 | 677,249 | 901,397 | |||||||||
| Contingently issuable shares | 45,421 | 150,302 | 208,119 | |||||||||
| Diluted | 27,529,157 | 26,764,856 | 24,290,904 | |||||||||
| Basic income per common share | $ | 3.08 | $ | 0.60 | $ | 0.50 | ||||||
| Diluted income per common share | $ | 2.95 | $ | 0.58 | $ | 0.48 | ||||||
F-35
NOTE 16 — LIMITED LIABILITY COMPANY SUBSIDIARIES
(a) Operating Agreements of Limited Liability Company Subsidiaries
The Company has certain subsidiaries that are organized as limited liability companies, each of which has its own separate operating agreement. Generally, each of these subsidiaries is managed by an individual manager who is a member or employee of the subsidiary, although the manager may not take certain actions unless the majority member of the subsidiary consents to the action. These actions include, among others, the dissolution of the subsidiary, the disposition of all or a substantial part of the subsidiary’s assets not in the ordinary course of business, filing for bankruptcy, and the purchase by the subsidiary of one of the members’ ownership interest upon the occurrence of certain events. Certain of the members with a minority ownership interest in the subsidiaries are entitled to receive guaranteed payments in the form of compensation or draws, in addition to distributions of available cash from time to time. Distributions of available cash are generally made to each of the members in accordance with their respective ownership interests in the subsidiary after repayment of any loans made by any members to such subsidiary, and allocations of profits and losses of the subsidiary are generally made to members in accordance with their respective ownership interests in the subsidiary. The operating agreements also generally place restrictions on the transfer of the members’ ownership interests in the subsidiaries and provide the Company or the other members with certain rights of first refusal and drag along and tag along rights in the event of any proposed sales of the members’ ownership interests.
Generally, a member of the subsidiary who materially breaches the operating agreement of the subsidiary, which breach has a direct, substantial and adverse effect on the subsidiary and the other members, or who is convicted of a felony (or a lesser crime of moral turpitude) involving his management of or involvement in the affairs of the subsidiary, or a material act of dishonesty of the member involving his management of or involvement in the affairs of the subsidiary, shall forfeit his entire ownership interest in the subsidiary.
(b) Repurchase Obligations of Membership Interests of Limited Liability Company Subsidiaries
The operating agreements of the Company’s limited liability company subsidiaries require the Company to repurchase the entire ownership interest of each the members upon the death of a member, disability of a member as defined in the operating agreement, or upon declaration by a court of law that a member is mentally unsound or incompetent. Upon the occurrence of one of these events, the Company is required to repurchase the member’s ownership interest in an amount equal to the fair market value of the member’s noncontrolling interest in the subsidiary.
The Company evaluated the classification of all of its limited liability company members’ ownership interests in accordance with the accounting guidance for financial instruments with characteristics of liabilities and equity. This guidance generally provides for the classification of members’ ownership interests that are subject to mandatory redemption obligations to be classified outside of equity. In accordance with this guidance, all members with a minority ownership interest in these subsidiaries are classified as liabilities and included in mandatorily redeemable noncontrolling interests in the accompanying consolidated balance sheets. Members of these subsidiaries with a minority ownership interest issued before November 5, 2003 are stated on a historical cost basis and members of the Company’s subsidiaries with a minority ownership interests issued on or after November 5, 2003 are stated at fair value at each balance sheet date. The Company deems such repurchase obligations, which are payable to members who are also employees of these subsidiaries, to be a compensatory benefit. Accordingly, the changes in the historical cost basis and the changes in the fair value of the respective members’ ownership interests (noncontrolling interests) are recorded as a component of selling, general and administrative expenses in the accompanying consolidated statements of income.
In accordance with the operating agreement of one of the Company’s limited liability companies, a repurchase event occurred in the second quarter of 2017 for one of the Members which resulted in the repurchase on the Members minority ownership interest. The triggering event resulted in a fair value adjustment and purchase of the Members minority interest in the amount of $7,850. The Company also received proceeds of $6,000 from key man life insurance in connection with this event.
During the year ended December 31, 2017, the change in fair value of the mandatorily redeemable noncontrolling interests was $9,000, which was comprised of a fair value adjustment of $1,150 and $7,850 from the triggering event previously discussed above. The noncontrolling interests share of net income was $1,220, $1,222 and $1,799 for the years ended December 31, 2019, 2018 and 2017, respectively.
F-36
NOTE 17 — COMMITMENTS AND CONTINGENCIES
(a) Legal Matters
The Company is subject to certain legal and other claims that arise in the ordinary course of its business. In particular, the Company and its subsidiaries are named in and subject to various proceedings and claims arising primarily from the Company’s securities business activities, including lawsuits, arbitration claims, class actions, and regulatory matters. Some of these claims seek substantial compensatory, punitive, or indeterminate damages. The Company and its subsidiaries are also involved in other reviews, investigations, and proceedings by governmental and self-regulatory organizations regarding the Company’s business, which may result in adverse judgments, settlements, fines, penalties, injunctions, and other relief. In view of the number and diversity of claims against the Company, the number of jurisdictions in which litigation is pending, and the inherent difficulty of predicting the outcome of litigation and other claims, the Company cannot state with certainty what the eventual outcome of pending litigation or other claims will be. Notwithstanding this uncertainty, the Company does not believe that the results of these claims are likely to have a material effect on its financial position or results of operations.
On August 11, 2017, a putative class action lawsuit titled Freedman v. magicJack VocalTec Ltd. et al., Case 9-17-cv-80940, was filed against magicJack and its Board of Directors in the United States District Court for the Southern District of Florida (Case No: 9:17-cv-80940-RLR). Oral arguments were held on for January 17, 2020 and the Company is awaiting the court’s decision. The Company cannot estimate the amount of potential liability, if any, that could arise from this matter.
On January 5, 2017, complaints filed in November 2015 and May 2016 naming MLV & Co. (“MLV”), a broker-dealer subsidiary of FBR, as a defendant in putative class action lawsuits alleging claims under the Securities Act, in connection with the offerings of Miller Energy Resources, Inc. (“Miller”) have been consolidated. The Master Consolidated Complaint, styled Gaynor v. Miller et al., is pending in the United States District Court for the Eastern District of Tennessee, and, like its predecessor complaints, continues to allege claims under Sections 11 and 12 of the Securities Act against nine underwriters for alleged material misrepresentations and omissions in the registration statement and prospectuses issued in connection with six offerings (February 13, 2013; May 8, 2013; June 28, 2013; September 26, 2013; October 17, 2013 (as to MLV only) and August 21, 2014) with an alleged aggregate offering price of approximately $151,000. Court ordered mediation before a federal magistrate took place on August 6, 2019, with no resolution. In December 2019, the Court lifted the stay on the proceedings (pending mediation) and remanded the case to state court.
(b) Tax Contingencies
magicJack believes that it files all required tax returns and pays all required federal, state and municipal taxes (such as sales, excise, utility, and ad valorem taxes), fees and surcharges. magicJack is the subject of inquiries and examinations by various states and municipalities in the normal course of business. In accordance with generally accepted accounting principles, magicJack makes a provision for a liability for taxes when it is both probable that a liability has been incurred and the amount of the liability can be reasonably estimated. These provisions are reviewed at least quarterly and adjusted to reflect the impact of negotiations, settlements, rulings, advice of legal counsel, and other information and events pertaining to a particular case. magicJack believes any possible claims are without merit and vigorously defends its rights. However, if a government entity were to prevail in any matter, it could have a material adverse effect on magicJack’s financial condition, results of operation and cash flows. In addition, it is at least reasonably possible that a potential loss may exist for tax contingencies in addition to the provisions taken by magicJack.
Historically, magicJack considered the requirements to collect sales taxes under the auspices of a 1991 Supreme Court case, Quill Corp. v. North Dakota, which established the precedent that a physical presence in the respective state is required for an entity to be subject to a state’s sales and use tax requirements. Accordingly, magicJack had concluded that it did not have nexus for sales tax in those states in which it had no physical presence (i.e., it had no employees regularly and systematically there and it had no property there). On June 21, 2018, via South Dakota v. Wayfair, Inc. (No. 17-494) (“Wayfair”) the U.S. Supreme Court reversed its prior ruling and eliminated the “physical presence” requirement. In consideration of the ruling, magicJack made the decision to start collecting sales tax on direct sales of its magicJack device and access right renewals in states that have adopted similar “Economic Nexus” laws. magicJack began registering for, collecting and remitting sales tax to identified jurisdictions during the third quarter of 2018. The Company will continue to monitor the situation and add additional states if deemed necessary. Though the South Dakota law is to be applied prospectively, it is not certain if other states may try to enact laws on a retrospective basis based on the Wayfair ruling, and the Company cannot estimate the likelihood of liability or the potential amount of assessments that could arise from prior periods if other states tried to apply the ruling on a retrospective basis.
In a letter dated September 12, 2019, the Company received notice that the State of California has selected the Company’s 2016 and 2017 California corporate income tax returns for examination. The Company has received the initial information document request and the first meeting with the auditor is scheduled in March 2020. The Company believes that the positions taken in its 2016 and 2017 California corporate income tax returns are reasonable and appropriate, however, the Company cannot be sure of the ultimate outcome of the examination and cannot estimate the likelihood of liability or the amount of potential assessments, if any, that could arise from the examination.
F-37
(c) Franchise Group Commitment Letter, Loan Participant Guaranty and CIBC Guarantee
Franchise Group Commitment Letter and Loan Participant Guaranty
Commitment Letter
On February 14, 2020, affiliates of Franchise Group, Inc. (collectively with all of its affiliates, “FRG”) entered into an ABL Credit Agreement (the “Franchise Credit Agreement”), with GACP Finance Co., LLC (“GACP Finance”) as administrative agent and collateral agent, and the lenders from time to time party thereto, pursuant to which the lenders provided an asset based credit facility to FRG in an aggregate principal amount of $100,000 In connection with the Franchise Credit Agreement, the Company entered into a commitment letter, dated as of February 14, 2020 (the “Commitment Letter”), pursuant to which the Company committed to provide a $100,000 asset based lending facility to FRG, on April 14, 2020 if, on or before such date, the obligations under the Franchise Credit Agreement are not refinanced in full.
The Loan Participant Guaranty
On February 14, 2020, FRG the lenders from time to time party thereto and GACP Finance as administrative agent, entered into a Credit Agreement (the “Term Loan Credit Agreement”), pursuant to which the lenders provided a term loan facility to FRG in an aggregate principal amount of $575,000.
On February 19, 2020, the Company entered into a limited guaranty the (“Loan Participant Guaranty”) to one of the lenders under the Term Loan Credit Agreement (the “Loan Participant”) pursuant to which the Company guaranteed the payment when due of certain obligations, including principal, interest, and other amounts payable to the Loan Participant under the Term Loan Credit Agreement in an amount not to exceed $50,000 plus certain expenses of the Loan Participant and certain protective advances related to such guaranteed obligations (the “Loan Participant Guaranteed Obligations”). The Loan Participant may require payment of the Loan Participant Guaranteed Obligations by the Company upon the occurrence of certain guarantor events of default, including payment or bankruptcy events of default, in each case pursuant to the Term Loan Credit Agreement. The Loan Participant Guaranty remains in effect until the date that the Loan Participant Guaranteed Obligations have been paid in full.
The Loan Participant Guaranteed Obligations are unsecured obligations of the Company and rank equally in right of payment with all of the Company’s other existing and future unsecured and unsubordinated indebtedness. The Loan Participant Guaranteed Obligations are effectively subordinated in right of payment to all of the Company’s existing and future secured indebtedness and structurally subordinated to all existing and future indebtedness of the Company’s subsidiaries, including trade payables.
CIBC Guaranty
On February 14, 2020, the Company entered into a limited guaranty (the “CIBC Guaranty”) in favor of CIBC Bank USA (“CIBC”), pursuant to which the Company guaranteed the payment when due of certain obligations, including all principal, interest, and other amounts that shall be at any time payable by FRG under FRG’s credit agreement with CIBC and the lenders party thereto, dated as of May 16, 2019, as amended (the “CIBC Credit Agreement”) in an amount not to exceed $125,000 plus certain expenses of CIBC related to such guaranteed obligations (the “CIBC Guaranteed Obligations”). CIBC may require payment of the CIBC Guaranteed Obligations by the Company upon the occurrence of either (a) the failure of FRG to pay any principal of any loan or any reimbursement obligation in respect of any letter of credit disbursement or (b) the failure of FRG to pay any interest on any loan or on any reimbursement obligation in respect of any letter of credit disbursement within five business days of the date due, in each case pursuant to the CIBC Credit Agreement. The CIBC Guaranty remains in effect until the earlier of (a) the date that the CIBC Guaranteed Obligations have been paid in full and (b) June 30, 2020.
The CIBC Guaranteed Obligations are unsecured obligations of the Company and rank equally in right of payment with all of the Company’s other existing and future unsecured and unsubordinated indebtedness. The CIBC Guaranteed Obligations are effectively subordinated in right of payment to all of the Company’s existing and future secured indebtedness and structurally subordinated to all existing and future indebtedness of the Company’s subsidiaries, including trade payables.
F-38
NOTE 18 — SHARE-BASED PAYMENTS
(a) Amended and Restated 2009 Stock Incentive Plan
Share- based compensation expense for restricted stock units under the Company’s Amended and Restated 2009 Stock Incentive Plan (the “Plan”) was $11,626, $5,829 and $4,994 for the years ended December 31, 2019, 2018 and 2017, respectively. Of the 1,857,328 restricted stock units granted during the year ended December 31, 2019, 407,328 restricted stock units were granted to executives and employees with a grant date fair value of $7,870 and 1,450,000 performance based restricted stock units granted to certain executives and managers with a grant date fair value of $12,296.
The restricted stock units generally vest over a period of one to three years based on continued service. Performance based restricted stock units generally vest based on both the employee’s continued service and the Company’s common stock price, as defined in the grant, achieving a set threshold during the three-year period following the grant. In determining the fair value of restricted stock units on the grant date, the fair value is adjusted for (a) estimated forfeitures, (b) expected dividends based on historical patterns and the Company’s anticipated dividend payments over the expected holding period and (c) the risk-free interest rate based on U.S. Treasuries for a maturity matching the expected holding period.
As of December 31, 2019, the expected remaining unrecognized share-based compensation expense of $19,169 will be expensed over a weighted average period of 1.5 years.
A summary of equity incentive award activity for the year ended December 31, 2019 was as follows:
| Weighted | ||||||||
| Average | ||||||||
| Shares | Fair Value | |||||||
| Nonvested at December 31, 2017 | 792,264 | $ | 13.30 | |||||
| Granted | 424,235 | 20.87 | ||||||
| Vested | (310,625 | ) | 13.17 | |||||
| Forfeited | (9,057 | ) | 12.49 | |||||
| Nonvested at December 31, 2018 | 896,817 | $ | 16.94 | |||||
| Granted | 1,857,328 | 10.86 | ||||||
| Vested | (480,388 | ) | 15.02 | |||||
| Forfeited | (9,769 | ) | 18.94 | |||||
| Nonvested at December 31, 2019 | 2,263,988 | $ | 12.35 | |||||
The total fair value of shares vested during the year ended December 31, 2019 was $7,215.
(b) Amended and Restated FBR & Co. 2006 Long-Term Stock Incentive Plan
In connection with the acquisition of FBR & Co. on June 1, 2017, the equity awards previously granted or available for issuance under the FBR & Co. 2006 Long-Term Stock Incentive Plan (the “FBR Stock Plan”) may be issued under the Plan. During the year ended December 31, 2019, the Company granted restricted stock units representing 131,216 shares of common stock with a total grant date fair value of $2,515 under the FBR Stock Plan. The share-based compensation expense in connection with the FBR Stock Plan restricted stock awards was $3,969, $7,081 and $5,347 during the years ended December 31, 2019, 2018 and 2017, respectively. As of December 31, 2019, the expected remaining unrecognized share-based compensation expense of $4,983 will be expensed over a weighted average period of 1.7 years.
F-39
A summary of equity incentive award activity for the years ended December 31, 2019 and 2018 was as follows:
| Weighted | ||||||||
| Average | ||||||||
| Shares | Fair Value | |||||||
| Nonvested at December 31, 2017 | 1,066,133 | $ | 16.15 | |||||
| Granted | 254,213 | 20.58 | ||||||
| Vested | (527,730 | ) | 16.28 | |||||
| Forfeited | (103,186 | ) | 16.44 | |||||
| Nonvested at December 31, 2018 | 689,430 | $ | 17.64 | |||||
| Granted | 131,216 | 19.17 | ||||||
| Vested | (224,086 | ) | 17.61 | |||||
| Forfeited | (111,527 | ) | 16.50 | |||||
| Nonvested at December 31, 2019 | 485,033 | $ | 18.33 | |||||
The per-share weighted average grant-date fair value of restricted stock units granted during the years ended December 31, 2019 and 2018 was $19.17 and $20.58, respectively. The total fair value of shares vested during the years ended December 31, 2019 and 2018 was $3,947 and $8,590, respectively.
(c) 2018 Employee Stock Purchase Plan
In connection with the Company’s Purchase Plan, share based compensation was $322 and $132 for the years ended December 31, 2019 and 2018, respectively. At December 31, 2019, there were 591,674 shares reserved for issuance under the Purchase Plan.
NOTE 19 — BENEFIT PLANS AND CAPITAL TRANSACTIONS
(a) Employee Benefit Plan
The Company maintains qualified defined contribution 401(k) plans, which cover substantially all of its U.S. employees. Under the plans, participants are entitled to make pre-tax contributions up to the annual maximums established by the Internal Revenue Service. The plan documents permit annual discretionary contributions from the Company. Employer contributions in the amount of $1,424 and $1,248 were made during the years ended December 31, 2019 and 2018, respectively.
(b) Common Stock
In January and February of 2020, the Company repurchased 880,000 shares of its common stock in a block purchase from an existing stockholder as part of a privately-negotiated transaction. The Company purchased the shares at $24.4725 per share for an aggregate amount of $21,536.
On October 30, 2018, the Company’s Board of Directors authorized a share repurchase program of up to $50,000 of its outstanding common shares. All share repurchases were effected on the open market at prevailing market prices or in privately negotiated transactions. The share repurchase program expired on October 31, 2019. During the year ended December 31, 2019, the Company repurchased 237,932 shares of commons stock for $4,272. During the year ended December 31, 2018, the Company repurchased 83,133 shares of commons stock for $1,365. The shares repurchased under the program were retired.
On March 15, 2018, the Company was a party to a secondary stock purchase agreement with ACP BD Investments, LLC (“ACP”) which required us to purchase 950,000 shares of our common stock at $18.25 per share or approximately $17,337 in cash. The stock was repurchased from ACP on April 2, 2018 and the shares were retired.
(c) Preferred Stock
On October 7, 2019, the Company closed its public offering of depositary shares (the “Depositary Shares”), each representing 1/1000th of a share of 6.875% Series A Cumulative Perpetual Preferred Stock, par value $0.0001 per share (the “Series A Preferred Stock”). The liquidation preference of each share of Series A Preferred Stock is $25,000 ($25.00 per Depositary Share). At the closing, the Company issued 2,000 shares of Series A Preferred Stock represented by 2,000,000 Depositary Shares issued. On October 11, 2019, the Company completed the sale of an additional 300,000 Depositary Shares, pursuant to the underwriters’ full exercise of their over-allotment option to purchase additional Depositary Shares. The offering of the 2,300,000 Depository Shares generated $57,500 of gross proceeds.
The Series A Preferred Stock ranks, as to dividend rights and rights upon the Company’s liquidation, dissolution or winding up: (i) senior to all classes or series of the Company’s common stock and to all other equity securities issued by the Company other than equity securities issued with terms specifically providing that those equity securities rank on a parity with the Series A Preferred Stock, (ii) junior to all equity securities issued by the Company with terms specifically providing that those equity securities rank senior to the Series A Preferred Stock with respect to payment of dividends and the distribution of assets upon the Company’s liquidation, dissolution or winding up and (iii) effectively junior to all of the Company’s existing and future indebtedness (including indebtedness convertible into our common stock or preferred stock) and to the indebtedness and other liabilities of (as well as any preferred equity interests held by others in) the Company’s existing or future subsidiaries. Generally, the Series A Preferred Stock is not redeemable by the Company prior to October 7, 2024. However, upon a change of control or delisting event, the Company will have the special option to redeem the Series A Preferred Stock.
F-40
(d) Dividends
From time to time, the Company may decide to pay dividends which will be dependent upon its financial condition and results of operations. On March 3, 2020, the Company declared a regular dividend of $0.25 per share and special dividend of $0.10 per share that will be paid on or about March 31, 2020 to stockholders of record as of March 17, 2020. During the years ended December 31, 2019 and 2018, the Company paid cash dividends on its common stock of $41,138 and $22,684, respectively. On August 1, 2019, the Board of Directors announced an increase to the regular quarterly dividend from $0.08 per share to $0.175 per share. While it is the Board’s current intention to make regular dividend payments of $0.175 per share each quarter and special dividend payments dependent upon exceptional circumstances from time to time, our Board of Directors may reduce or discontinue the payment of dividends at any time for any reason it deems relevant. The declaration and payment of any future dividends or repurchases of the Company’s common stock will be made at the discretion of our Board of Directors and will be dependent upon its financial condition, results of operations, cash flows, capital expenditures, and other factors that may be deemed relevant by the Board of Directors.
A summary of dividend activity for the years ended December 31, 2019 and 2018 was as follows:
| Regular | Special | Total | ||||||||||||||
| Stockholder | Dividend | Dividend | Dividend | |||||||||||||
| Date Declared | Date Paid | Record Date | Amount | Amount | Amount | |||||||||||
| October 30, 2019 | November 26, 2019 | November 14, 2019 | $ | 0.175 | $ | 0.475 | $ | 0.650 | ||||||||
| August 1, 2019 | August 29, 2019 | August 15, 2019 | 0.175 | 0.325 | 0.500 | |||||||||||
| May 1, 2019 | May 29, 2019 | May 15, 2019 | 0.08 | 0.18 | 0.26 | |||||||||||
| March 5, 2019 | March 26, 2019 | March 19, 2019 | 0.08 | 0.00 | 0.08 | |||||||||||
| November 5, 2018 | November 27, 2018 | November 16, 2018 | 0.08 | 0.08 | 0.16 | |||||||||||
| August 2, 2018 | August 29, 2018 | August 16, 2018 | 0.08 | 0.22 | 0.30 | |||||||||||
| May 7, 2018 | June 5, 2018 | May 21, 2018 | 0.08 | 0.04 | 0.12 | |||||||||||
| March 7, 2018 | April 3, 2018 | March 20, 2018 | 0.08 | 0.08 | 0.16 | |||||||||||
Holders of Series A Preferred Stock, when and as authorized by the board of directors of the Company, are entitled to cumulative cash dividends at the rate of 6.875% per annum of the $25,000 liquidation preference ($25.00 per Depositary Share) per year (equivalent to $1,718.75 or $1.71875 per Depositary Share). Dividends will be payable quarterly in arrears, on or about the last day of January, April, July and October. On October 15, 2019, the Company declared a cash dividend representing $0.11458333 per Depositary Share. The dividend was paid on October 31, 2019 to holders of record as of the close of business on October 21, 2019. As of December 31, 2019, dividends in arrears in respect of the Depositary Shares were $673. On January 9, 2020, the Company declared a cash dividend $0.4296875 per Depositary Share, which was paid on January 31, 2020 to holders of record as of the close of business on January 21, 2020.
Our principal sources of liquidity to finance our business is our existing cash on hand, cash flows generated from operating activities, funds available under revolving credit facilities and special purpose financing arrangements.
NOTE 20 — NET CAPITAL REQUIREMENTS
B. Riley FBR, MLV and B. Riley Wealth Management (“BRWM”), the Company’s broker-dealer subsidiaries, are registered with the SEC as broker-dealers and are members of the Financial Industry Regulatory Authority, Inc. (“FINRA”). The Company’s broker-dealer subsidiaries are subject to SEC Uniform Net Capital Rule (Rule 15c3-1) which requires the subsidiaries to maintain minimum net capital and that the ratio of aggregate indebtedness to net capital, both as defined, shall not exceed 15 to 1. As such, they are subject to the minimum net capital requirements promulgated by the SEC. As of December 31, 2019, B. Riley FBR had net capital of $106,283, which was $103,322 in excess of its required net capital of $2,961; MLV had net capital of $642, which was $637 in excess of its required net capital of $5; and BRWM had net capital of $5,187, which was $4,708 in excess of its required net capital of $479.
F-41
NOTE 21 — RELATED PARTY TRANSACTIONS
At December 31, 2019, amounts due from related parties of $5,832 includes $145 from GACP I, L.P. (“GACP I”) and $12 from GACP II, L.P. (“GACP II”) for management fees and other operating expenses, $13 due from B. Riley Principal Merger Corp, a company that consummated its initial public offering on April 11, 2019, and our wholly owned subsidiary, B. Riley Principal Sponsor Co. LLC, is the Sponsor, and $3,846 due from John Ahn, President of Great American Partners, LLC, our indirect wholly owned subsidiary (“GACP”), pursuant to a Secured Line of Promissory Note connected with a Transfer Agreement as further discussed below. At December 31, 2019, the Company had outstanding loan to participations to B. Riley Partners Opportunity Fund, a private equity fund managed by one of our subsidiaries, in the amount of $12,478, and recorded interest expense of $824 during the year ended December 31, 2019 related to B. Riley Partners Opportunity Fund’s loan participations. Our executive officers and board of directors have a 65.3% financial interest, which includes a financial interest of Bryant Riley, our Co-Chief Executive Officer, of 52.8% in the B. Riley Partners Opportunity Fund at December 31, 2019. At December 31, 2018, amounts due from related parties of $1,729 include $194 from GACP I, $724 from GACP II, and $812 from CA Global for management fees, incentive fees and other operating expenses.
On April 1, 2019, the Company entered into a Transfer Agreement (the “Transfer Agreement”) with GACP II, a fund managed by GACP, and John Ahn, the President of GACP. The Transfer Agreement provides for among other things, the transfer to Mr. J. Ahn 55.56% of the Company’s limited partnership interest in GACP II (the “Transferred Interest”), which represents a capital commitment in the aggregate amount of $5,000. In connection with the Transfer Agreement, the Company provided Mr. J. Ahn with a non-recourse, secured line of credit in an aggregate amount of up to $5,003 pursuant to the terms of a Secured Line of Credit Promissory Note (the “Note”) dated April 1, 2019, to fund the purchase price of the Transferred Interest. We also entered into a Security Agreement with Mr. J. Ahn on April 1, 2019, which granted to the Company a security interest in the Transferred Interest to secure Mr. J. Ahn’s obligations under the Note. The Note is subject to an interest rate per annum of 7.00%. As of December 31, 2019, the principal and accrued interest on the Note were $3,798 (amount transferred as of December 31, 2019) and $48, respectively. For the period from April 1, 2019 (inception) to December 31, 2019 interest earned on the note was $48.
The Company periodically participates in loans and financing arrangements for which the Company has an equity ownership and board of director’s representation. The Company may also provide consulting services or investment banking services to raise capital for these companies. These transactions can be summarized as follows:
Sonim
The Company has a loan receivable due from Sonim Technologies, Inc. (“Sonim”) that is included in securities owned with a fair value of $9,603 and $11,916 at December 31, 2019 and 2018, respectively. The principal amount due on the loan at December 31, 2019 was $9,751, interest is payable at 10.0% per annum with a maturity date of September 1, 2022. During the year ended December 31, 2019, the Company received principal payments in the amount of $3,250. A portion of the loan receivable is convertible into common stock of Sonim at $8.87 per share depending on when the Company elects to exercise its’ option to convert the principal balance of the loan into common stock of Sonim.
The original loan was made in October 2017 in connection with the Company’s initial investment in common stock and preferred stock that was purchased from Sonim’s existing shareholders. In October 2017, the Company also entered into a management services agreement with Sonim to provide advisory and consulting services for management fees of up to $200 per year. The Company earned management fees totaling $42, $200 and $50 during the years ended December 31, 2017, 2018 and 2019, respectively. The management services agreement was terminated in September 2019.
Babcock and Wilcox
The Company has a last-out term loan receivable due from Babcock & Wilcox Enterprises, Inc. (“B&W”) that is included in loans receivable with a total carrying value of $109,147 at December 31, 2019. The carrying value of the loan is comprised of the principal amount of $113,330 less original issue discount of $4,183 at December 31, 2019. Interest is payable monthly at the fixed rate of 12.0% per annum. The loan was made to B&W as part of various amendments to B&W’s existing credit agreement with other lenders not related to the Company. In connection with making the loan to B&W, in April 2019 the Company received warrants to purchase 1,666,667 shares of common stock of B&W with an exercise price of $0.01 per share. The option to exercise the warrants expires on April 5, 2022.
One of the Company’s wholly owned subsidiaries entered into a services agreement with B&W that provided for the President of the Company to serve as the Chief Executive Officer of B&W until November 30, 2020 (the “Executive Consulting Agreement”), unless terminated by either party with thirty days written notice. Under this agreement, fees for services provided are $750 per annum, paid monthly. In addition, subject to the achievement of certain performance objectives as determined by B&W’s Compensation Committee of the Board, a bonus or bonuses may also be earned and payable to the Company. In June 2019, the Company was granted a total of $2,000 in cash bonuses by B&W in accordance with the Executive Consulting Agreement.
On January 31, 2020, the Company provided B&W with $30,000 of additional last out term loans pursuant to new amendments to B&W’s existing credit agreement discussed above. Pursuant to the new amendment, the company also agreed upon a term sheet pursuant to which B&W would undertake a refinancing transaction on or prior to May 11, 2020 (the “Refinancing”) and B&W and the existing lenders would amend and restate the credit agreement. As part of the Refinancing, the size of the B&W’s board of directors may also be reduced to five members, with the Company retaining the ability to appoint two members. On January 31, 2020, the Company also entered into a letter agreement with B&W pursuant to which the Company agreed to fund any shortfall in the $200,000 of new debt or equity financing required as part of the terms of the Refinancing to the extent such amounts have not been raised from third parties on the same terms contemplated by the Refinancing.
Maven
The Company has a loan receivable due from theMaven, Inc. (“Maven”) that is included in securities owned with a fair value of $21,150 and $10,077 at December 31, 2019 and 2018, respectively. The Company also has a loan receivable due from theMaven, Inc. (“Maven”) that is included loans receivable with a carrying value of $47,933 at December 31, 2019, which is comprised of the principal balance due in the amount of $49,921, less original issue discount of $1,988. Interest on these loans is payable at 12.0% per annum with maturity dates in June 2022.
F-42
Franchise Group
The Company has a loan receivable due from Vitamin Shoppe, a subsidiary of Franchise Group, Inc., (“Vitamin Shoppe”) that is included in securities owned with a fair value of $4,951 at December 31, 2019. Interest is payable at 13.7% per annum with a maturity date of December 16, 2022.
The Company also entered into a Commitment Letter, Loan Participant Guaranty and CIBC Guarantee with FRG as disclosed above in Note 17 – Commitments and Contingencies.
F-43
NOTE 22 — BUSINESS SEGMENTS
The Company’s business is classified into the Capital Markets segment, Auction and Liquidation segment, Valuation and Appraisal segment, Principal Investments - United Online and magicJack segment and Brands segment. These reportable segments are all distinct businesses, each with a different marketing strategy and management structure.
The following is a summary of certain financial data for each of the Company’s reportable segments:
| Year Ended December 31, | ||||||||||||
| 2019 | 2018 | 2017 | ||||||||||
| Capital Markets segment: | ||||||||||||
| Revenues - Services and fees | $ | 408,637 | $ | 236,789 | $ | 169,967 | ||||||
| Interest income - Loans and securities lending | 77,221 | 38,277 | 19,756 | |||||||||
| Total revenues | 485,858 | 275,066 | 189,723 | |||||||||
| Selling, general and administrative expenses | (269,494 | ) | (227,774 | ) | (150,092 | ) | ||||||
| Restructuring recovery (charge) | 4 | (8,378 | ) | (7,855 | ) | |||||||
| Interest expense - Securities lending and loan participations sold | (32,144 | ) | (23,039 | ) | (12,051 | ) | ||||||
| Depreciation and amortization | (4,974 | ) | (5,723 | ) | (3,794 | ) | ||||||
| Segment income | 179,250 | 10,152 | 15,931 | |||||||||
| Auction and Liquidation segment: | ||||||||||||
| Revenues - Services and fees | 18,296 | 54,923 | 47,376 | |||||||||
| Revenues - Sale of goods | 4,220 | 63 | 3 | |||||||||
| Total revenues | 22,516 | 54,986 | 47,379 | |||||||||
| Direct cost of services | (33,296 | ) | (19,627 | ) | (27,841 | ) | ||||||
| Cost of goods sold | (4,016 | ) | (41 | ) | (2 | ) | ||||||
| Selling, general and administrative expenses | (10,730 | ) | (8,274 | ) | (8,329 | ) | ||||||
| Depreciation and amortization | (7 | ) | (31 | ) | (21 | ) | ||||||
| Segment income | (25,533 | ) | 27,013 | 11,186 | ||||||||
| Valuation and Appraisal segment: | ||||||||||||
| Revenues - Services and fees | 38,821 | 38,705 | 33,331 | |||||||||
| Selling, general and administrative expenses | (28,448 | ) | (27,403 | ) | (23,437 | ) | ||||||
| Depreciation and amortization | (136 | ) | (205 | ) | (181 | ) | ||||||
| Segment income | 10,237 | 11,097 | 9,713 | |||||||||
| Principal Investments - United Online and magicJack segment: | ||||||||||||
| Revenues - Services and fees | 97,147 | 53,659 | 51,439 | |||||||||
| Revenues - Sale of goods | 3,715 | 575 | 304 | |||||||||
| Total revenues | 100,862 | 54,234 | 51,743 | |||||||||
| Direct cost of services | (25,529 | ) | (15,127 | ) | (12,784 | ) | ||||||
| Cost of goods sold | (3,559 | ) | (759 | ) | (396 | ) | ||||||
| Selling, general and administrative expenses | (24,256 | ) | (10,962 | ) | (11,304 | ) | ||||||
| Depreciation and amortization | (12,658 | ) | (7,600 | ) | (7,033 | ) | ||||||
| Restructuring charge | (1,703 | ) | (338 | ) | (723 | ) | ||||||
| Segment income | 33,157 | 19,448 | 19,503 | |||||||||
| Brands segment: | ||||||||||||
| Revenues - Services and fees | 4,055 | — | — | |||||||||
| Selling, general and administrative expenses | (881 | ) | — | — | ||||||||
| Depreciation and amortization | (507 | ) | — | — | ||||||||
| Segment income | 2,667 | — | — | |||||||||
| Consolidated operating income from reportable segments | 199,778 | 67,710 | 56,333 | |||||||||
| Corporate and other expenses (including restructuring recovery of $210 during the year ended December 31, 2018) | (33,127 | ) | (22,326 | ) | (27,489 | ) | ||||||
| Interest income | 1,577 | 1,326 | 420 | |||||||||
| (Loss) income on equity investments | (1,431 | ) | 7,986 | (437 | ) | |||||||
| Interest expense | (50,205 | ) | (33,393 | ) | (8,382 | ) | ||||||
| Income before income taxes | 116,592 | 21,303 | 20,445 | |||||||||
| Provision for income taxes | (34,644 | ) | (4,903 | ) | (8,510 | ) | ||||||
| Net income | 81,948 | 16,400 | 11,935 | |||||||||
| Net income attributable to noncontrolling interests | 337 | 891 | 379 | |||||||||
| Net income attributable to B. Riley Financial, Inc. | 81,611 | 15,509 | 11,556 | |||||||||
| Preferred stock dividends | 264 | — | — | |||||||||
| Net income available to common shareholders | $ | 81,347 | $ | 15,509 | $ | 11,556 | ||||||
F-44
The following table presents revenues by geographical area:
| Year Ended December 31, | ||||||||||||
| 2019 | 2018 | 2017 | ||||||||||
| Revenues: | ||||||||||||
| Revenues - Services and fees: | ||||||||||||
| North America | $ | 566,837 | $ | 389,207 | $ | 301,881 | ||||||
| Australia | 58 | 19 | 940 | |||||||||
| Europe | 61 | 1,329 | 2,020 | |||||||||
| Total Revenues - Services and fees | $ | 566,956 | $ | 390,555 | $ | 304,841 | ||||||
| Revenues - Sale of goods | ||||||||||||
| North America | $ | 7,935 | $ | 638 | $ | 307 | ||||||
| Revenues - Interest income - Loans and securities lending: | ||||||||||||
| North America | $ | 77,221 | $ | 31,798 | $ | 17,028 | ||||||
| Total Revenues: | ||||||||||||
| North America | $ | 651,993 | $ | 421,643 | $ | 319,216 | ||||||
| Australia | 58 | 19 | 940 | |||||||||
| Europe | 61 | 1,329 | 2,020 | |||||||||
| Total Revenues | $ | 652,112 | $ | 422,991 | $ | 322,176 | ||||||
The following table presents long-lived assets, which consists of property and equipment and other assets, by geographical area:
| As of | As of | |||||||
| December 31, | December 31, | |||||||
| 2019 | 2018 | |||||||
| Property and equipment, net: | ||||||||
| North America | $ | 12,727 | $ | 15,489 | ||||
| Europe | — | 34 | ||||||
| Total | $ | 12,727 | $ | 15,523 | ||||
Segment assets are not reported to, or used by, the Company’s Chief Operating Decision Maker to allocate resources to, or assess performance of, the segments and therefore, total segment assets have not been disclosed.
F-45
NOTE 23 — SELECTED QUARTERLY FINANCIAL DATA (UNAUDITED)
| Quarter Ended | ||||||||||||||||
| March 31, | June 30, | September 30, | December 31, | |||||||||||||
| 2019 | 2019 | 2019 | 2019 | |||||||||||||
| Total revenues | $ | 142,128 | $ | 164,684 | $ | 180,063 | $ | 165,237 | ||||||||
| Operating income | $ | 24,978 | $ | 44,255 | $ | 59,851 | $ | 37,567 | ||||||||
| Income before income taxes | $ | 11,083 | $ | 31,598 | $ | 48,553 | $ | 25,358 | ||||||||
| Provision for income taxes | $ | (3,104 | ) | $ | (9,289 | ) | $ | (14,409 | ) | $ | (7,842 | ) | ||||
| Net income | $ | 7,979 | $ | 22,309 | $ | 34,144 | $ | 17,516 | ||||||||
| Net income attributable to B. Riley Financial, Inc. | $ | 8,023 | $ | 22,157 | $ | 34,302 | $ | 17,129 | ||||||||
| Earnings per common share: | ||||||||||||||||
| Basic | $ | 0.31 | $ | 0.84 | $ | 1.29 | $ | 0.64 | ||||||||
| Diluted | $ | 0.30 | $ | 0.82 | $ | 1.21 | $ | 0.59 | ||||||||
| Weighted average common shares outstanding: | ||||||||||||||||
| Basic | 26,217,215 | 26,278,352 | 26,556,223 | 26,547,023 | ||||||||||||
| Diluted | 26,687,531 | 26,896,573 | 28,233,423 | 28,412,871 | ||||||||||||
| Quarter Ended | ||||||||||||||||
| March 31, | June 30, | September 30, | December 31, | |||||||||||||
| 2018 | 2018 | 2018 | 2018 | |||||||||||||
| Total revenues | $ | 95,778 | $ | 125,501 | $ | 99,681 | $ | 102,031 | ||||||||
| Operating income (loss) | $ | 10,602 | $ | 28,478 | $ | 12,838 | $ | (6,534 | ) | |||||||
| Income (loss) before income taxes | $ | 5,831 | $ | 23,178 | $ | 4,768 | $ | (12,474 | ) | |||||||
| (Provision for) benefit from income taxes | $ | (989 | ) | $ | (5,377 | ) | $ | (2,046 | ) | $ | 3,509 | |||||
| Net income (loss) | $ | 4,842 | $ | 17,801 | $ | 2,722 | $ | (8,965 | ) | |||||||
| Net income (loss) attributable to B. Riley Financial, Inc. | $ | 4,503 | $ | 16,997 | $ | 2,814 | $ | (8,805 | ) | |||||||
| Earnings (loss) per common share: | ||||||||||||||||
| Basic | $ | 0.17 | $ | 0.67 | $ | 0.11 | $ | (0.34 | ) | |||||||
| Diluted | $ | 0.17 | $ | 0.64 | $ | 0.10 | $ | (0.34 | ) | |||||||
| Weighted average common shares outstanding: | ||||||||||||||||
| Basic | 26,219,277 | 25,424,178 | 25,968,997 | 26,177,560 | ||||||||||||
| Diluted | 27,271,819 | 26,397,513 | 26,854,261 | 26,177,560 | ||||||||||||
F-46