Attached files
| file | filename |
|---|---|
| EX-99.1 - EX-99.1 - CAMDEN NATIONAL CORP | ex991earningsreleaseq221.htm |
| 8-K - 8-K - CAMDEN NATIONAL CORP | cac-20210727.htm |
 Second Quarter Report - 2021
Dear Fellow Shareholders:
As we mark the halfway point of 2021, we remain committed to delivering upon our strategic investments and our employees’ unwavering dedication to our customers and communities. With a 3% percent increase in total revenue compared to the first half of 2020, it is clear that our investments and focus are producing solid results. We're also encouraged by vaccination rates, tourism recovery, and real estate activity in our markets. While we are all still dealing with the lingering effects of the pandemic, our ongoing conversations with customers reflect optimism about further economic recovery and growth.
We continue to deepen our relationships with customers by providing personalized solutions and financial guidance combined with technology solutions that make banking easier. Recently, we streamlined our personal checking accounts and launched “You Can Ask Us,” an online tool empowering customers to ask us their most common financial questions with follow-up from our team in-person and online.
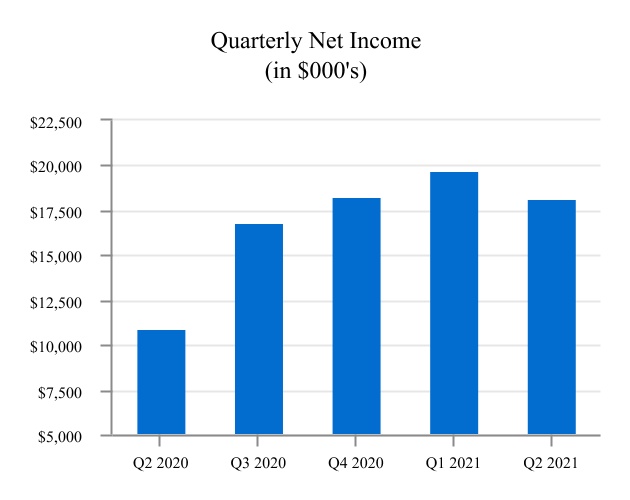
Favorable Financial Metrics and Stability. For the six months ended June 30, 2021, we reported net income of $37.9 million and diluted earnings per share of $2.52, compared to $24.4 million and $1.62, respectively, for the same period last year. For the first six months of 2021, our return on average assets was 1.52% and return on average tangible equity was 17.52%, compared to 1.05% and 12.68%, respectively, for the same period last year.
I’m pleased to report that asset quality remains very strong as of June 30, 2021 with non-performing loans to total loans of 0.26% and loans 30-89 days past due of total loans of 0.02%. Given our continued asset quality strength and improving macroeconomic conditions, we released $5.4 million of allowance, bringing our allowance for credit losses to total loans as of June 30, 2021 to 0.98%. This compares to an allowance for credit losses to total loans of 1.07% as of June 30, 2020 as we recorded an $11.2 million provision to strengthen our balance sheet in light of the pandemic conditions at that time. Our current allowance for credit losses to total loans of 0.98% compares favorably to our pre-pandemic ratio on December 31, 2019 of 1.18% as well as our adoption of CECL at the end of 2020.
At June 30, 2021, our total risk-based capital ratio of 15.26% and common equity tier 1 ratio of 12.94% were each well in excess of regulatory requirements. Our tangible common equity ratio was 8.87% at June 30, 2021. Our strong capital position has allowed us to consistently declare a quarterly cash dividend and to increase cash dividend payments for the past nine years.
Awarded and Recognized for Superior Customer Service and Financial Performance. Earlier this quarter, Forbes announced its 2021 list of World’s Best
Banks, and this year’s rankings included Camden National Bank in the top 10 of the 75 U.S. banks being recognized, out of 4,978 commercial banks and savings institutions insured by the Federal Deposit Insurance Corporation (FDIC) in the United States, as of March 2021. Banks were ranked based on general satisfaction, how likely customers were to recommend them, and key attributes like trust, fees, digital services, and financial advice. Additionally, we were presented with the Raymond James Community Bankers Cup award, which recognizes the top 10% of community banks based on various profitability, operational efficiency, and balance sheet metrics. I am incredibly proud of our employees who make these type of recognitions possible through their tireless dedication to our customers, communities, and shareholders.
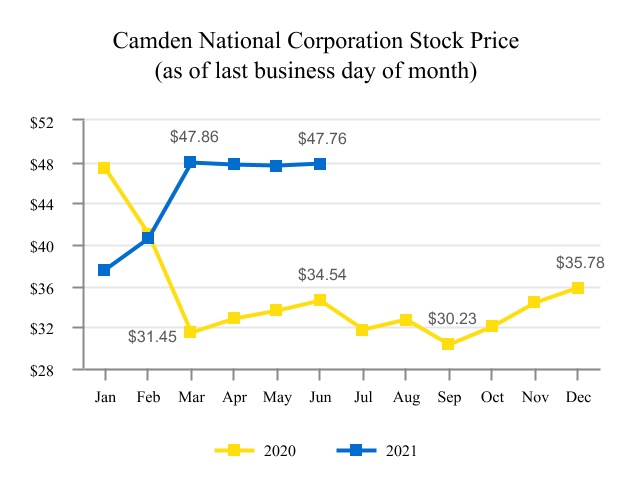
Enhancing Shareholder Value and Services. Camden National’s share price closed at $47.76 on June 30, 2021, representing a 38% increase over the closing share price of $34.54 on June 30, 2020. The Board of Directors approved a dividend of $0.36 per share for the second quarter of 2021, which resulted in a dividend yield of 3.02%, based on Camden National’s closing share price of $47.76, as reported by NASDAQ on June 30, 2021. During the quarter, we welcomed Stephens, Inc. to our group of stock analysts who provide research on our stock. We now have four analysts covering our stock; two, including Stephens, have rated us “overweight” and the other two as “stable.”
Our goal is to provide our shareholders with the best support and service possible. We recently mailed a shareholder communication announcing that we replaced our transfer agent American Stock Transfer & Trust Company, LLC (“AST”) with Broadridge Corporate Issuer Solutions, Inc. (“Broadridge”). Broadridge provides a robust set of services for shareholders to aid us and expand our offerings. Should you need assistance with this transition, please reach out to Broadridge Shareholder Services at shareholder@broadridge.com or 1-877-830-4936. For more information visit www.CamdenNationalCorporation.com.
We are excited about the ongoing opportunities in our markets and look forward to the rest of 2021. Thank you for being a valued shareholder of Camden National Corporation.
Sincerely,

Gregory A. Dufour
President and Chief Executive Officer
Financial Highlights (unaudited)
| Three Months Ended June 30, | Six Months Ended June 30, | |||||||||||||||||||||||||
| (Dollars in thousands, except per share data) | 2021 | 2020 | 2021 | 2020 | ||||||||||||||||||||||
| Earnings and Dividends | ||||||||||||||||||||||||||
| Net interest income | $ | 33,529 | $ | 34,539 | $ | 65,893 | $ | 66,365 | ||||||||||||||||||
| Non-interest income | 11,320 | 12,060 | 26,535 | 23,463 | ||||||||||||||||||||||
| Non-interest expense | (25,590) | (23,509) | (50,489) | (48,070) | ||||||||||||||||||||||
Pre-tax, pre-provision earnings(1) | 19,259 | 23,090 | 41,939 | 41,758 | ||||||||||||||||||||||
| (Credit) provision for credit losses | 3,403 | (9,398) | 5,359 | (11,173) | ||||||||||||||||||||||
| Income before income tax expense | 22,662 | 13,692 | 47,298 | 30,585 | ||||||||||||||||||||||
| Income tax expense | (4,519) | (2,752) | (9,415) | (6,152) | ||||||||||||||||||||||
| Net income | $ | 18,143 | $ | 10,940 | $ | 37,883 | $ | 24,433 | ||||||||||||||||||
| Diluted earnings per share | $ | 1.21 | $ | 0.73 | $ | 2.52 | $ | 1.62 | ||||||||||||||||||
| Cash dividends declared per share | 0.36 | 0.33 | 0.72 | 0.66 | ||||||||||||||||||||||
| Performance Ratios | ||||||||||||||||||||||||||
| Return on average assets | 1.42 | % | 0.90 | % | 1.52 | % | 1.05 | % | ||||||||||||||||||
| Return on average equity | 13.50 | % | 8.81 | % | 14.24 | % | 10.03 | % | ||||||||||||||||||
| Net interest margin (fully-taxable equivalent) | 2.83 | % | 3.11 | % | 2.85 | % | 3.10 | % | ||||||||||||||||||
Efficiency ratio1 | 56.72 | % | 50.13 | % | 50.96 | % | 53.17 | % | ||||||||||||||||||
| Balance sheet (end of period) | ||||||||||||||||||||||||||
| Investments | $ | 1,415,695 | $ | 1,067,737 | ||||||||||||||||||||||
| Loans and loans held for sale | 3,301,056 | 3,362,631 | ||||||||||||||||||||||||
| Allowance for credit losses on loans | 32,060 | 35,539 | ||||||||||||||||||||||||
| Total assets | 5,152,069 | 4,959,016 | ||||||||||||||||||||||||
| Deposits | 4,294,114 | 3,996,358 | ||||||||||||||||||||||||
| Borrowings | 214,744 | 330,229 | ||||||||||||||||||||||||
| Shareholders' equity | 545,548 | 506,467 | ||||||||||||||||||||||||
| Book Value per Share and Capital Ratios | ||||||||||||||||||||||||||
| Book value per share | $ | 36.49 | $ | 33.85 | ||||||||||||||||||||||
Tangible book value per share1 | 29.99 | 27.31 | ||||||||||||||||||||||||
Tangible common equity ratio1 | 8.87 | % | 8.41 | % | ||||||||||||||||||||||
| Tier I leverage capital ratio | 9.48 | % | 8.95 | % | ||||||||||||||||||||||
| Total risk-based capital ratio | 15.26 | % | 14.56 | % | ||||||||||||||||||||||
| Asset Quality | ||||||||||||||||||||||||||
| Allowance for credit losses on loans to total loans | 0.98 | % | 1.07 | % | ||||||||||||||||||||||
| Net charge-offs to average loans (annualized) | 0.03 | % | 0.05 | % | ||||||||||||||||||||||
| Non-performing loans to total loans | 0.26 | % | 0.34 | % | ||||||||||||||||||||||
| Non-performing assets to total assets | 0.17 | % | 0.23 | % | ||||||||||||||||||||||
1 This is a non-GAAP measure. A reconciliation of non-GAAP to GAAP financial measures can be found in the Company's earnings release dated and filed with the SEC on July 27, 2021.