Attached files
| file | filename |
|---|---|
| EX-99.1 - EXHIBIT 99.1 - KITE REALTY GROUP TRUST | tm2122510d2_ex99-1.htm |
| 8-K - FORM 8-K - KITE REALTY GROUP TRUST | tm2122510d2_8k.htm |
Exhibit 99.2

© 2021 Kite Realty Group | kiterealty.com Investor Presentation © 2021 Kite Realty Group | kiterealty.com KITE REALTY GROUP + RPAI STRATEGIC MERGER

© 2021 Kite Realty Group | kiterealty.com Forward Looking Statements This release contains certain forward - looking statements within the meaning of Section 27A of the Securities Act of 1933, as ame nded (the “Securities Act”), and Section 21E of the Securities Exchange Act of 1934, as amended, with respect to the proposed transaction between Kite Realty Group Trust (“KRG”) and Retail Properties of America, I nc. (“RPAI”), including statements regarding the anticipated benefits of the transaction, the anticipated timing of the transaction and the markets of each company. These forward - looking statements generally are identified by the words “believe,” “project,” “expect,” “anticipate,” “estimate,” “intend,” “strategy,” “future,” “opportunity,” “plan,” “may,” “should,” “will,” “would,” “will be,” “will continue,” “will likely result” and simil ar expressions. Forward - looking statements are predictions, projections and other statements about future events that are based on current expectations and assumptions and, as a result, are subject to risks and uncertainties . Currently, one of the most significant factors that could cause actual future events and results of KRG, RPAI and the combine d c ompany to differ materially from the forward - looking statements is the potential adverse effect of the current pandemic of the novel coronavirus (“COVID - 19 pandemic”), including possible resurgences and mutations, on the financ ial condition, result of operations, cash flows and performance of KRG and RPAI and their tenants, the real estate market and the global economy and financial markets. The effects of the COVID - 19 pandemic have caused and may continue to cause many of KRG’s and RPAI’s tenants to close stores, reduce hours or significantly limit service, making it difficult for them to meet their obligations, and therefore has and will continue to i mpa ct KRG and RPAI significantly for the foreseeable future. Many additional factors could cause actual future events and results to differ materially from the forward - looking statements, i ncluding but not limited to: (i) the possibility that KRG shareholders and/or RPAI stockholders do not approve the proposed transaction or that other conditions to the closing of the proposed transaction are not satisfied or wai ved at all or on the anticipated timeline; (ii) failure to realize the anticipated benefits of the proposed transaction, including as a result of delay in completing the proposed transaction; (iii) the risk that RPAI’s business will not be integrated successfully or that such integration may be more difficult, time - consuming or costly than expected; (iv) unexpected costs or liabilities relating to the proposed transaction; (v) potential litigation relating to the pr oposed transaction that could be instituted against KRG or RPAI or their respective trustees, directors or officers and the resulting expense or delay; (vi) the risk that disruptions caused by or relating to the proposed transaction wi ll harm KRG’s or RPAI’s business, including current plans and operations; (vii) the ability of KRG or RPAI to retain and hire key personnel; (viii) potential adverse reactions by tenants or other business partners or changes to busi nes s relationships, including joint ventures, resulting from the announcement or completion of the proposed transaction; (ix) risks relating to the market value of the KRG common shares to be issued in the proposed transacti on; (x) risks associated with third party contracts containing consent and/or other provisions that may be triggered by the proposed transaction; (xi) the impact of public health crises, such as pandemics (including the COVID - 19 pan demic) and epidemics and any related company or government policies and actions intended to protect the health and safety of individuals or government policies or actions intended to maintain the functioning of nation al or global economies and markets; (xii) general economic and market developments and conditions; (xiii) restrictions during the pendency of the proposed transaction or thereafter that may impact KRG’s or RPAI’s ability to pur sue certain business opportunities or strategic transactions; (xiv) either company’s ability to maintain its status as a real estate investment trust for U.S. federal income tax purposes; and (xv) the occurrence of any event, chan ge or other circumstances that could give rise to the termination of the merger agreement relating to the proposed transaction. The foregoing list of factors is not exhaustive. You should carefully consider the foregoing factor s a nd the other risks and uncertainties that affect the businesses of KRG and RPAI described in the “Risk Factors” section of their respective Annual Reports on Form 10 - K, Quarterly Reports on Form 10 - Q and other documents filed by ei ther of them from time to time with the SEC. These filings identify and address other important risks and uncertainties that could cause actual events and results to differ materially from those contained in the forward - look ing statements. Investors are cautioned to interpret many of the risks identified in the “Risk Factors” section of these filings as being heightened as a result of the ongoing and numerous adverse impacts of the COVID - 19 pandemic. F orward - looking statements speak only as of the date they are made. Readers are cautioned not to put undue reliance on forward - looking statements, and KRG and RPAI assume no obligation and do not intend to update or revise these forward - looking statements, whether as a result of new information, future events or otherwise. Neither KRG nor RPAI gives any assurance that either KRG or RPAI will achieve its expectations. Additional Information about the Proposed Transactions and Where to Find It This communication relates to a proposed transaction between KRG and RPAI. In connection with the proposed transaction, KRG w ill file a registration statement on Form S - 4 with the Securities and Exchange Commission (the “SEC”), which will include a document that serves as a joint proxy statement/prospectus of KRG and RPAI. A joint proxy statem ent /prospectus will be sent to all KRG shareholders and all RPAI stockholders. Each party also will file other documents regarding the proposed transaction with the SEC. BEFORE MAKING ANY VOTING DECISION, INVESTORS AND SECURI TY HOLDERS OF KRG AND INVESTORS AND SECURITY HOLDERS OF RPAI ARE URGED TO READ THE REGISTRATION STATEMENT, JOINT PROXY STATEMENT/PROSPECTUS AND ALL OTHER RELEVANT DOCUMENTS FILED OR THAT WIL L B E FILED WITH THE SEC IN CONNECTION WITH THE PROPOSED TRANSACTION AS THEY BECOME AVAILABLE BECAUSE THEY WILL CONTAIN IMPORTANT INFORMATION ABOUT THE PROPOSED TRANSACTION. Investors, KRG shareholders and RPAI stockholders may obtain free copies of the joint proxy statement/prospectus (when availa ble ) and other documents that are filed or will be filed with the SEC by KRG or RPAI through the website maintained by the SEC at www.sec.gov. The documents filed by KRG with the SEC also may be obtained free of charge at KRG ’s investor relations website at http://ir.kiterealty.com/ or upon written request to Investor Relations, Kite Realty Group Trust, 30 S. Meridian Street, Suite 1100, Indianapolis, IN 46204. The documents filed by RPAI wi th the SEC also may be obtained free of charge at RPAI’s website at www.rpai.com under the heading Invest or upon written request to Investor Relations, Retail Properties of America, Inc., 2021 Spring Road, Suite 200 , O ak Brook, IL 60523, or IR@rpai.com. Participants in the Solicitation KRG and RPAI and their respective trustees, directors and executive officers may be deemed to be participants in the solicita tio n of proxies from KRG’s shareholders and RPAI’s stockholders in connection with the proposed transaction. Information about KRG’s trustees and executive officers and their ownership of KRG’s common shares and units of lim ited partnership interest of Kite Realty Group, L.P. is set forth in KRG’s proxy statement for its Annual Meeting of Shareholders on Schedule 14A filed with the SEC on March 31, 2021. Information about RPAI’s directors and e xec utive officers and their ownership of RPAI’s common stock is set forth in RPAI’s proxy statement for its Annual Meeting of Stockholders on Schedule 14A filed with the SEC on March 31, 2021. To the extent that hol din gs of KRG’s or RPAI’s securities have changed since the amounts reported in KRG’s or RPAI’s proxy statement, such changes have been or will be reflected on Statements of Changes in Beneficial Ownership on Form 4 filed wi th the SEC. Additional information regarding the interests of those persons and other persons who may be deemed participants in the proposed transaction may be obtained by reading the joint proxy statement/prospectus re gar ding the proposed transaction when it becomes available. You may obtain free copies of these documents as described in the preceding paragraph. No Offer or Solicitation This communication is not intended to and shall not constitute an offer to sell or the solicitation of an offer to sell or th e s olicitation of an offer to buy any securities or a solicitation of any vote of approval, nor shall there be any sale of securities in any jurisdiction in which such offer, solicitation or sale would be unlawful prior to registration or q ual ification under the securities laws of any such jurisdiction. No offer of securities shall be made except by means of a prospectus meeting the requirements of Section 10 of the Securities Act. SAFE HARBOR KITE REALTY GROUP 2
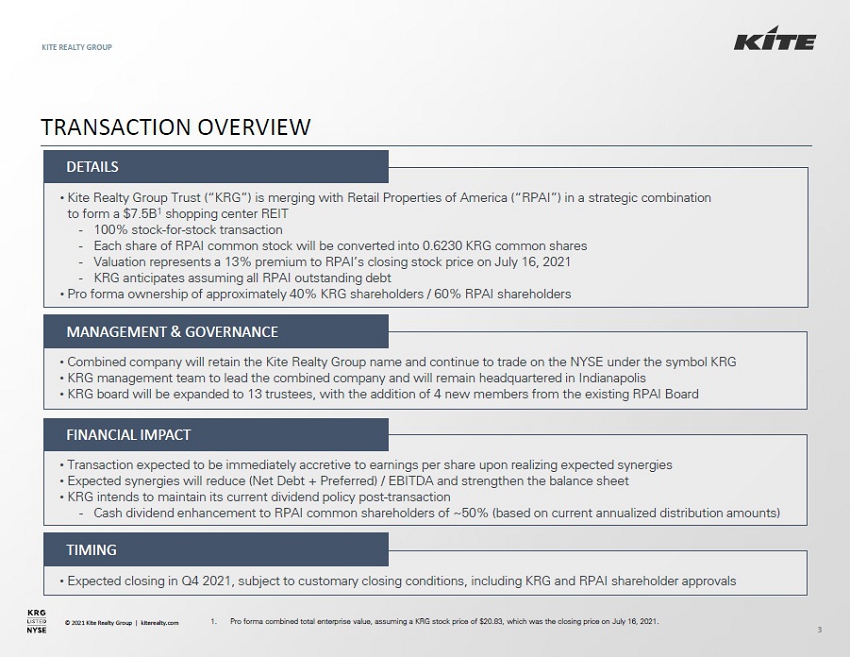
© 2021 Kite Realty Group | kiterealty.com • Transaction expected to be immediately accretive to earnings per share upon realizing expected synergies • Expected synergies will reduce (Net Debt + Preferred) / EBITDA and strengthen the balance sheet • KRG intends to maintain its current dividend policy post - transaction - Cash dividend enhancement to RPAI common shareholders of ~50% (based on current annualized distribution amounts) • Combined company will retain the Kite Realty Group name and continue to trade on the NYSE under the symbol KRG • KRG management team to lead the combined company and will remain headquartered in Indianapolis • KRG board will be expanded to 13 trustees, with the addition of 4 new members from the existing RPAI Board • Kite Realty Group Trust (“KRG”) is merging with Retail Properties of America (“RPAI”) in a strategic combination to form a $7.5B 1 shopping center REIT - 100% stock - for - stock transaction - Each share of RPAI common stock will be converted into 0.6230 shares of KRG common stock - Valuation represents a 13% premium to RPAI’s closing stock price on July 16, 2021 - KRG anticipates assuming all RPAI outstanding debt • Pro forma ownership of approximately 40% KRG shareholders / 60% RPAI shareholders TRANSACTION OVERVIEW KITE REALTY GROUP 3 MANAGEMENT & GOVERNANCE FINANCIAL IMPACT DETAILS • Expected closing in Q4 2021, subject to customary closing conditions, including KRG and RPAI shareholder approvals TIMING 1. Pro forma combined total enterprise value, assuming a KRG stock price of $20.83, which was the closing price on July 16, 2021 .
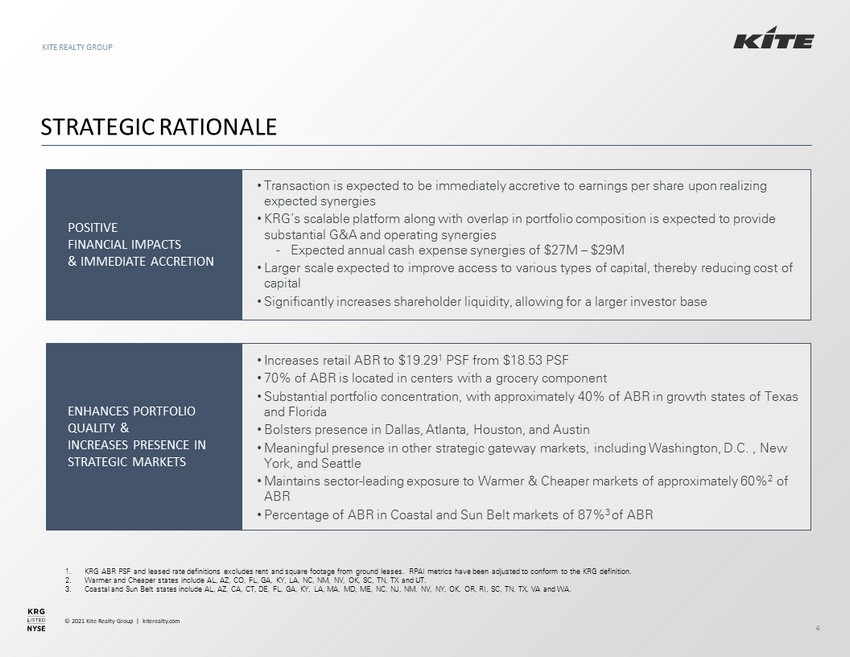
© 2021 Kite Realty Group | kiterealty.com STRATEGIC RATIONALE KITE REALTY GROUP 4 1. KRG ABR PSF and leased rate definitions excludes rent and square footage from ground leases. RPAI metrics have been adjusted to conform to the KRG definition. 2. Warmer and Cheaper states include AL, AZ, CO, FL, GA, KY, LA, NC, NM, NV, OK, SC, TN, TX and UT. 3. Coastal and Sun Belt states include AL, AZ, CA, CT, DE, FL, GA, KY, LA, MA, MD, ME, NC, NJ, NM, NV, NY, OK, OR, RI, SC, TN, T X, VA and WA. • Transaction is expected to be immediately accretive to earnings per share upon realizing expected synergies • KRG’s scalable platform along with overlap in portfolio composition is expected to provide substantial G&A and operating synergies - Expected annual cash expense synergies of $27M – $29M • Larger scale expected to improve access to various types of capital, thereby reducing cost of capital • Significantly increases shareholder liquidity, allowing for a larger investor base POSITIVE FINANCIAL IMPACTS & IMMEDIATE ACCRETION • Increases retail ABR to $19.29 1 PSF from $18.53 PSF • 70% of ABR is located in centers with a grocery component • Substantial portfolio concentration, with approximately 40% of ABR in growth states of Texas and Florida • Bolsters presence in Dallas, Atlanta, Houston, and Austin • Meaningful presence in other strategic gateway markets, including Washington, D.C. , New York, and Seattle • Maintains sector - leading exposure to Warmer & Cheaper markets of approximately 60% 2 of ABR • Percentage of ABR in Coastal and Sun Belt markets of 87% 3 of ABR ENHANCES PORTFOLIO QUALITY & INCREASES PRESENCE IN STRATEGIC MARKETS

© 2021 Kite Realty Group | kiterealty.com STRATEGIC RATIONALE (CONT’D) KITE REALTY GROUP 5 1. Pro forma for assumption of RPAI debt. 2. Pro forma combined total enterprise value, assuming a KRG stock price of $20.83, which was the closing price on July 16, 2021 . • Creates a top 5 shopping center REIT with a pro forma $7.5B 2 total enterprise value • Combination of operating best practices expected to drive NOI improvements • Deepens tenant relationships and increases optionality to a broader mix of open - air retail formats CREATES TOP 5 SHOPPING CENTER REIT STRENGTHENS BALANCE SHEET • Combined balance sheet poised to capture future growth opportunities - Pro forma leverage of 6.0x (Net Debt + Preferred) / EBITDA (pro forma for expected G&A synergies) • No material debt maturities until 2023, with an appropriate maturity ladder going forward 1 • Weighted average interest rate and term of 3.78% and 4.6 years, respectively GENERATES SIGNIFICANT VALUE CREATION OPPORTUNITIES • Presents near - term organic growth opportunities through lease - up of vacancies caused by the pandemic • Combined active development / redevelopment projects provide opportunity for significant cash flow growth over the next few years • KRG’s extensive development expertise in a variety of real estate types provides additional potential value creation for both active and future development projects • Appropriately sized and measured future development pipeline offers additional growth opportunities

© 2021 Kite Realty Group | kiterealty.com Note: Based on public filings from IPO documents, YE 2004, 2012, 2015, 2016 and 1Q’2021 supplemental disclosures. 1. KRG ABR PSF and leased rate definitions excludes rent and square footage from ground leases. RPAI metrics have been adjusted to conform to the KRG definition. 2. Warmer and Cheaper states include AL, AZ, CO, FL, GA, KY, LA, NC, NM, NV, OK, SC, TN, TX and UT. 3. Based on results through March 31, 2021 and assumes KRG’s ground lease portfolio was sold at the beginning of the 1 st quarter. OPTIMIZED REAL ESTATE PORTFOLIOS KITE REALTY GROUP 6 • Both firms have generated shareholder value through recycling capital while creating exceptional portfolios of open - air retail c enters ⁻ RPAI has sold over $3B and reinvested approximately $2B since its IPO, resulting in a refined portfolio and strong financial pos ition ⁻ KRG has continuously evolved since IPO, resulting in a high - quality portfolio, focused market strategy and strong balance sheet KRG PATH RPAI PATH IPO 2015 TODAY IPO 2016 TODAY # of Operating Retail Properties 30 110 83 252 156 102 Total Owned GLA (SF) 3M 15M 12M 34M 26M 20M ABR PSF $10.57 $15.22 $18.53 $14.39 $16.89 $19.76 1 Warmer & Cheaper (% of ABR ) 2 52% 76% 78% 51% 52% 46% Top Region (% of ABR) South 52% South 63% South 62% South 51% South 62% South 62% Top State (% of ABR) TX 27% FL 28% FL 27% TX 24% TX 30% TX 34% Top MSA (% of ABR) Indianapolis 20 % Indianapolis 9% Las Vegas 11% N/A Dallas 20% Dallas 23% (Net Debt + Preferred)/EBITDA 13.2x 7.0x 6.6x 3 7.0x 6.0x 6.0x

© 2021 Kite Realty Group | kiterealty.com 1. KRG ABR PSF and leased rate definitions excludes rent and square footage from ground leases. RPAI metrics have been adjusted to conform to the KRG definition. 2. RPAI metric excludes two single - user retail centers. 3. Warmer and Cheaper states include AL, AZ, CO, FL, GA, KY, LA, NC, NM, NV, OK, SC, TN, TX and UT. 4. Coastal and Sun Belt states include AL, AZ, CA, CT, DE, FL, GA, KY, LA, MA, MD, ME, NC, NJ, NM, NV, NY, OK, OR, RI, SC, TN, T X, VA and WA. 5. KRG and RPAI values based on closing prices on July 16, 2001. Pro forma combined total equity value and enterprise value assu mes a KRG stock price of $20.83, which was the closing price on July 16, 2021. 6. Based on results through March 31, 2021 and assumes KRG’s ground lease portfolio was sold at the beginning of the 1 st quarter. • Combination creates a Top 5 owner of open - air real estate that is well - positioned for future growth WELL - POSITIONED FOR FUTURE GROWTH # of Operating Properties Total Owned GLA ABR PSF 1 Leased % 1 % Exposure to Centers with a Grocer Component 2 % Warmer and Cheaper Markets by ABR 3 % Coastal and Sun Belt Markets by ABR 4 Equity Value ($B) 5 Enterprise Value ($B) 5 (Net Debt + Preferred) / EBITDA 6 KITE REALTY GROUP 7 KRG 83 12M $18.53 90.5% 75% 78% 84% $1.8 $3.0 6.6x RPAI 102 20M $19.76 92.3% 67% 46% 89% $2.8 $4.5 6.0x PRO FORMA 185 32M $19.29 91.6% 70% 58% 87% $4.6 $7.5 6.0x
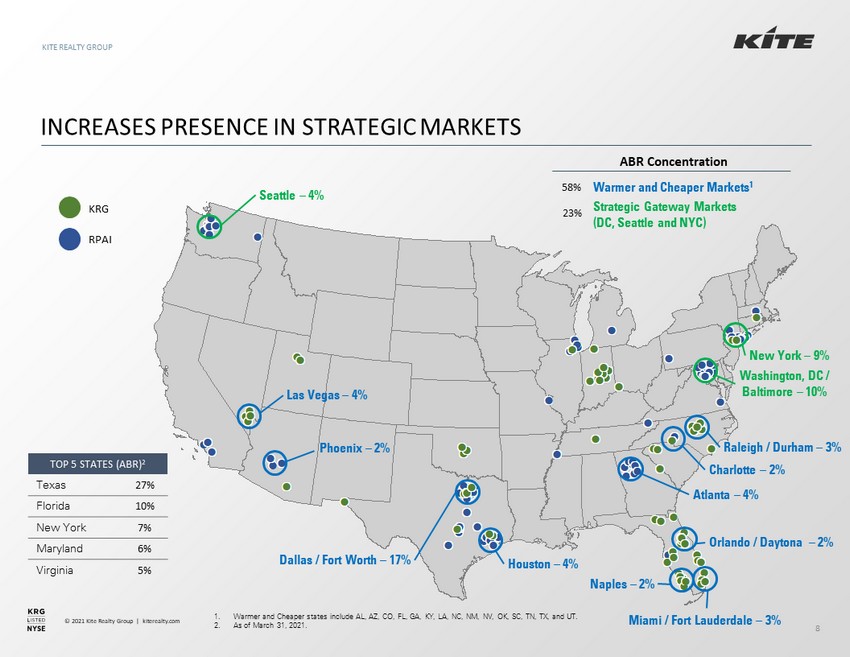
© 2021 Kite Realty Group | kiterealty.com 1414971_1.wor INCREASES PRESENCE IN STRATEGIC MARKETS KITE REALTY GROUP 8 RPAI KRG TOP 5 STATES (ABR) 2 Texas 27% Florida 10% New York 7% Maryland 6% Virginia 5% Las Vegas – 4% Seattle – 4% Dallas / Fort Worth – 17% Houston – 4% Naples – 2% Miami / Fort Lauderdale – 3% Atlanta – 4% Charlotte – 2% Raleigh / Durham – 3% Washington, DC / Baltimore – 10% New York – 9% Phoenix – 2% Warmer and Cheaper Markets 1 Strategic Gateway Markets (DC, Seattle and NYC) 58% 23% 1. Warmer and Cheaper states include AL, AZ, CO, FL, GA, KY, LA, NC, NM, NV, OK, SC, TN, TX, and UT. 2. As of March 31, 2021. ABR Concentration Orlando / Daytona – 2%

© 2021 Kite Realty Group | kiterealty.com $20.5 $15.2 $13.1 $11.6 $7.5 $5.9 $5.2 $3.7 $3.7 $3.6 $3.5 $1.9 $1.4 $1.0 $1.0 KIM + WRI REG FRT BRX KRG + RPAI PECO SITC AKR UE ROIC AAT RPT UBA CDR WSR Note: Market data as of July 16, 2021. Source of peer data is FactSet. MERGER CREATES TOP 5 SHOPPING CENTER REIT BY VALUE… KITE REALTY GROUP 9 TOP 5 SHOPPING CENTER REITs TOTAL ENTERPRISE VALUE ($, B)

© 2021 Kite Realty Group | kiterealty.com $29.95 $22.97 $19.29 $18.79 $15.05 FRT REG KRG + RPAI KIM + WRI BRX ABR PSF 1 Note: Comparison to only top 5 shopping center REITs by total enterprise value. Source of all company data is from supplemen tal disclosures from 1Q 2021. 1. KRG ABR PSF and leased rate definitions excludes rent and square footage from ground leases. RPAI metrics have been adjusted to conform to the KRG definition. 2. 3 - Mile average household income demographics are weighted value and sourced from Green Street as of December 31, 2020, except K R G’s weighted by 1Q 2021 NOI and sourced from PopStats. 3. Based on ABR with the exception of FRT, which is based on GLA. RPAI ABR as of today calculated excluding single - user retail. 4. Based on ABR with the exception of FRT, which is based on GLA. Warmer and Cheaper states include AL, AZ, CO, FL, GA, KY, LA, NC, NM, NV, OK, SC, TN, TX and UT. 5. Based on ABR with the exception of FRT, which is based on GLA. Coastal and Sun Belt states include AL, AZ, CA, CT, DE, FL, GA , K Y, LA, MA, MD, ME, NC, NJ, NM, NV, NY, OK, OR, RI, SC, TN, TX , VA and WA. KITE REALTY GROUP 10 80% 79% 75% 70% 70% REG KIM + WRI FRT KRG + RPAI BRX CENTERS WITH A GROCERY COMPONENT 3 5.9x 6.0x 6.5x 7.1x 7.6x REG KRG + RPAI BRX FRT KIM + WRI (NET DEBT + PREFERRED) / EBITDA …AND A LEADING SHOPPING CENTER REIT BY KEY METRICS # 4 # 3 # 2 $104K $96K $95K $86K $75K FRT REG KRG + RPAI KIM + WRI BRX AVERAGE HHI (3 - MILE) 2 # 3 58% 45% 42% 37% 4% KRG + RPAI KIM + WRI BRX REG FRT WARMER AND CHEAPER EXPOSURE 4 89% 87% 86% 82% 68% REG KRG + RPAI FRT KIM + WRI BRX COASTAL AND SUN BELT EXPOSURE 5 # 2 # 1

© 2021 Kite Realty Group | kiterealty.com Note: Percentages are based on pro forma for the combined company as of March 30, 2021. Remaining 2% of portfolio are unanch ore d or single - tenant assets. DIVERSIFIED ASSET MIX CREATES NEW GROWTH OPPORTUNITIES WHILE MAINTAINING DURABLE CASH FLOW KITE REALTY GROUP 11 • Combination increases property types, expanding offerings to retailers • Maintains grocer - anchored core, which provides ongoing, durable cash flows to the combined company • Majority of ABR coming from community and neighborhood centers COMMUNITY CENTERS ABR % 46% Grocery Component % 83% MIXED - USE CENTERS NEIGHBORHOOD CENTERS LIFESTYLE CENTERS ABR % 16% Grocery Component % 56% ABR % 11% Grocery Component % 89% ABR % 6% Grocery Component % 57% POWER CENTERS ABR % 19% Grocery Component % 48%
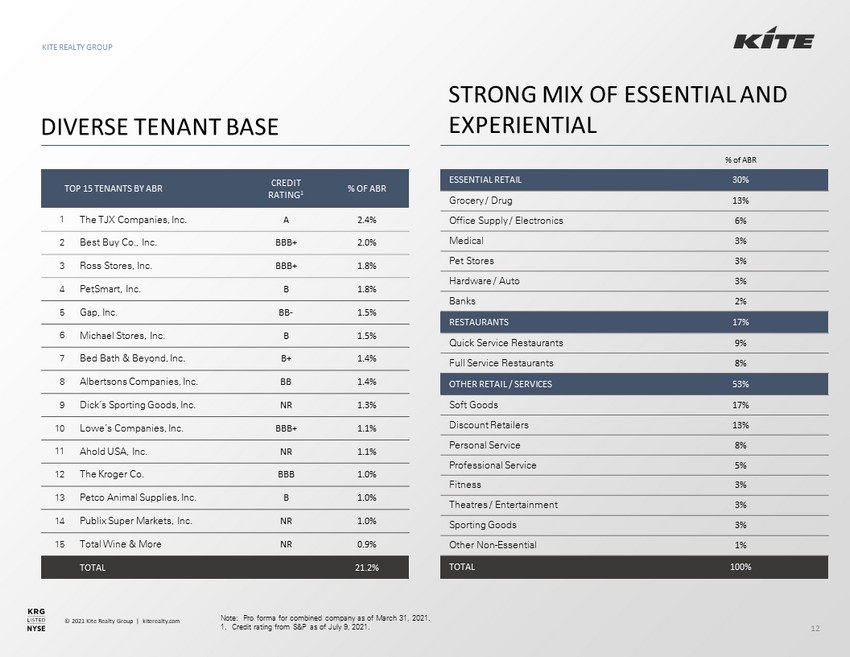
© 2021 Kite Realty Group | kiterealty.com Note: Pro forma for combined company as of March 31, 2021. 1. Credit rating from S&P as of July 9, 2021. TOP 15 TENANTS BY ABR CREDIT RATING 1 % OF ABR 1 The TJX Companies, Inc. A 2.4% 2 Best Buy Co., Inc. BBB+ 2.0% 3 Ross Stores, Inc. BBB+ 1.8% 4 PetSmart, Inc. B 1.8% 5 Gap, Inc. BB - 1.5% 6 Michael Stores, Inc. B 1.5% 7 Bed Bath & Beyond, Inc. B+ 1.4% 8 Albertsons Companies, Inc. BB 1.4% 9 Dick’s Sporting Goods, Inc. NR 1.3% 10 Lowe’s Companies, Inc. BBB+ 1.1% 11 Ahold USA, Inc. NR 1.1% 12 The Kroger Co. BBB 1.0% 13 Petco Animal Supplies, Inc. B 1.0% 14 Publix Super Markets, Inc. NR 1.0% 15 Total Wine & More NR 0.9% TOTAL 21.2% DIVERSE TENANT BASE KITE REALTY GROUP 12 STRONG MIX OF ESSENTIAL AND EXPERIENTIAL % of ABR ESSENTIAL RETAIL 30% Grocery / Drug 13% Office Supply / Electronics 6% Medical 3% Pet Stores 3% Hardware / Auto 3% Banks 2% RESTAURANTS 17% Quick Service Restaurants 9% Full Service Restaurants 8% OTHER RETAIL / SERVICES 53% Soft Goods 17% Discount Retailers 13% Personal Service 8% Professional Service 5% Fitness 3% Theatres / Entertainment 3% Sporting Goods 3% Other Non - Essential 1% TOTAL 100%

© 2021 Kite Realty Group | kiterealty.com Note: Based on active developments listed in 1Q 2021 supplemental reporting materials. 1. Commercial GLA only. 2. Projected ROI for developments is an estimate of the expected stabilized annual operating cash flows to be generated divided by the estimated project costs. VALUE CREATION: ACTIVE DEVELOPMENTS KITE REALTY GROUP 13 • Total active developments are right - sized for the combined company and should provide strong NOI growth prospects • Development pipeline poised to deliver additional value creation in the future PROJECT MSA OWNERSHIP % TOTAL GLA 1 MULTI - FAMILY UNITS EST. STABILIZE DATE TOTAL EQUITY REQUIREMENT REMAINING SPEND EST. RETURN ON PROJECT 2 One Loudoun Downtown – Pad G & H Washington, DC / Baltimore MF = 90% Commercial = 100% 67 378 Q3 2022 $130.0 $45.7 6.0% - 7.0% Circle East Washington, DC / Baltimore MF = Air Rights Sale Commercial = 100% 82 370 Q4 2022 43.0 15.2 7.0% - 8.0% The Shoppes at Quarterfield Washington, DC / Baltimore 100% 58 n/a Q2 2022 10.2 7.4 10.0% - 11.0% Southlake Town Square – Pad Development Dallas 100% 4 n/a Q2 2021 2.3 0.1 12.0% - 15.0% Glendale Town Center Apartments Indianapolis 12% 207 267 Q2 2022 1.2 0.7 7.0% - 8.0% Eddy Street Commons – Phase III South Bend 100% 69 n/a Q1 2022 7.5 5.2 8.5% - 9.5% Glendale Town Center Retail Indianapolis 100% 54 n/a Q1 2022 3.9 3.7 27.0% - 28.0% TOTALS / AVERAGE 541 1,015 $198.1 $78.0 7.0% - 8.0% ($ in M; GLA in ‘000s)

© 2021 Kite Realty Group | kiterealty.com 14 CIRCLE EAST MSA: WASHINGTON, DC / BALTIMORE GLENDALE TOWN CENTER MSA: INDIANAPOLIS, IN EDDY STREET COMMONS AT NOTRE DAME: PHASE III MSA: SOUTH BEND, IN ACTIVE DEVELOPMENTS ONE LOUDOUN DOWNTOWN MSA: WASHINGTON, DC / BALTIMORE

© 2021 Kite Realty Group | kiterealty.com PRUDENT PRO FORMA BALANCE SHEET COMPOSITION 1 KITE REALTY GROUP 15 • The combined company will have a strong capital structure with increased liquidity and an investment grade rating • Well - laddered debt maturity schedule with a weighted average maturity profile of 4.6 years • Pro forma (Net Debt + Preferred) / EBITDA reduced to 6.0x from KRG’s current 6.6x 3 • Improved scale and diversification positions company to become consistent unsecured bond issuer, lowering debt costs • Plan to maintain conservative financial and credit policies, including in relation to development pipeline 62% 33% 3% 2% TOTAL CAPITALIZATION 1. Assumes assumption of all outstanding RPAI debt. 2. Common equity calculated by using 223M shares and units of combined company and KRG stock price as of July 16, 2021. 3. Based on results through March 31, 2021 and assumes KRG’s ground lease portfolio was sold at the beginning of the first quart er. COMMON EQUITY UNSECURED DEBT EXCHANGEABLE NOTES MORTGAGE DEBT 2

© 2021 Kite Realty Group | kiterealty.com Note: Pro forma for combined company, assuming assumption of all outstanding debt of RPAI. Assumes KRG’s 2022 maturities ar e r etired using cash on hand. Dollar figures in millions. 1. Fixed rate debt includes floating rate debt that is swapped to a fixed rate. Includes $155M of KRG debt swapped from a ble nde d fixed rate of 4.52% to a blended floating rate of LIBOR + 3.70%, subsequent to March 31, 2021. PRO FORMA WELL - STAGGERED MATURITY LADDER KITE REALTY GROUP 16 24 193 24 9 12 95 150 430 400 75 100 100 400 200 120 150 250 175 12 10 $- $100 $200 $300 $400 $500 $600 $700 2021 2022 2023 2024 2025 2026 2027 2028 2029 2030 2031 Mortgage Debt Senior Notes Term Loans Exchangeable Notes JV Debt 15% of Total Debt Outstanding Weighted Average Maturity 4.6 years Weighted Average Interest Rate 3.78% Debt Type 91% Unsecured / 9% Secured Rate Type 1 94% Fixed / 6% Floating

© 2021 Kite Realty Group | kiterealty.com KITE REALTY GROUP 17 TOP 5 SHOPPING CENTER REIT Pro forma total enterprise value results in $7.5B company ENHANCED PORTFOLIO QUALITY Entry into strategic markets and bolstered presence in existing markets POSITIVE FINANCIAL IMPACT Immediately accretive to earnings / share plus reduced cost of capital VALUE CREATION OPPORTUNITIES Near - term organic growth through lease - up and robust development pipeline STRONGER BALANCE SHEET Lower pro forma leverage with limited near - term maturities TRANSACTION CREATES A VIRTUOUS CIRCLE OF BENEFITS