Attached files
| file | filename |
|---|---|
| 8-K - 8-K - ONCOR ELECTRIC DELIVERY CO LLC | d214264d8k.htm |
| EX-99.1 - EX-99.1 - ONCOR ELECTRIC DELIVERY CO LLC | d214264dex991.htm |
| EX-10.1 - EX-10.1 - ONCOR ELECTRIC DELIVERY CO LLC | d214264dex101.htm |
Exhibit 99.2
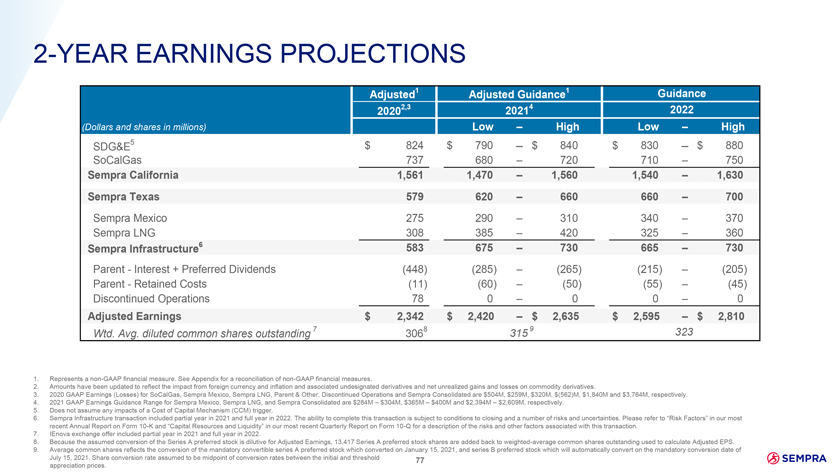
2-YEAR EARNINGS PROJECTIONS Adjusted1 Adjusted Guidance1 Guidance 20202,3 20214 2022 (Dollars and shares in millions) Low – High Low – High SDG&E5 $ 824 $ 790 – $ 840 $ 830 – $ 880 SoCalGas 737 680 – 720 710 – 750 Sempra California 1,561 1,470 – 1,560 1,540 – 1,630 Sempra Texas 579 620 – 660 660 – 700 Sempra Mexico 275 290 – 310 340 – 370 Sempra LNG 308 385 – 420 325 – 360 Sempra Infrastructure6 583 675 – 730 665 – 730 Parent - Interest + Preferred Dividends (448) (285) – (265) (215) – (205) Parent - Retained Costs (11) (60) – (50) (55) – (45) Discontinued Operations 78 0 – 0 0 – 0 Adjusted Earnings $ 2,342 $ 2,420 – $ 2,635 $ 2,595 – $ 2,810 Wtd. Avg. diluted common shares outstanding 7 3068 315 9 323 1. Represents a non-GAAP financial measure. See Appendix for a reconciliation of non-GAAP financial measures. 2. Amounts have been updated to reflect the impact from foreign currency and inflation and associated undesignated derivatives and net unrealized gains and losses on commodity derivatives. 3. 2020 GAAP Earnings (Losses) for SoCalGas, Sempra Mexico, Sempra LNG, Parent & Other, Discontinued Operations and Sempra Consolidated are $504M, $259M, $320M, $(562)M, $1,840M and $3,764M, respectively. 4. 2021 GAAP Earnings Guidance Range for Sempra Mexico, Sempra LNG, and Sempra Consolidated are $284M – $304M, $365M – $400M and $2,394M – $2,609M, respectively. 5. Does not assume any impacts of a Cost of Capital Mechanism (CCM) trigger. 6. Sempra Infrastructure transaction included partial year in 2021 and full year in 2022. The ability to complete this transaction is subject to conditions to closing and a number of risks and uncertainties. Please refer to “Risk Factors” in our most recent Annual Report on Form 10-K and “Capital Resources and Liquidity” in our most recent Quarterly Report on Form 10-Q for a description of the risks and other factors associated with this transaction. 7. IEnova exchange offer included partial year in 2021 and full year in 2022. 8. Because the assumed conversion of the Series A preferred stock is dilutive for Adjusted Earnings, 13,417 Series A preferred stock shares are added back to weighted-average common shares outstanding used to calculate Adjusted EPS. 9. Average common shares reflects the conversion of the mandatory convertible series A preferred stock which converted on January 15, 2021, and series B preferred stock which will automatically convert on the mandatory conversion date of July 15, 2021. Share conversion rate assumed to be midpoint of conversion rates between the initial and threshold 77 appreciation prices.
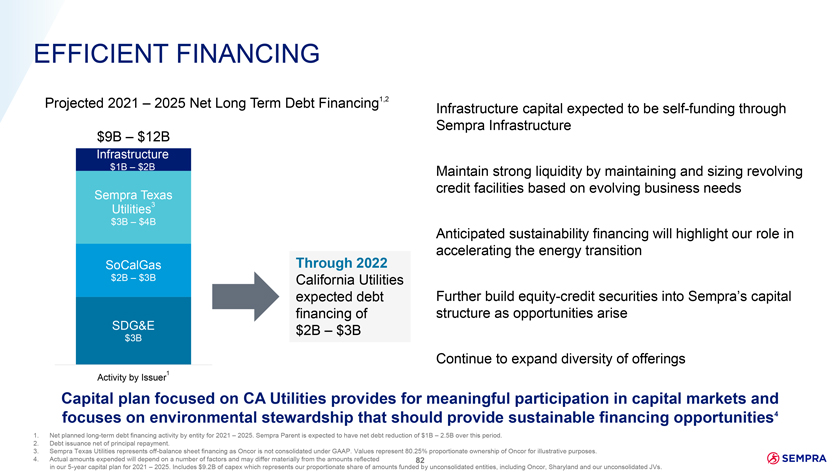
EFFICIENT FINANCING Projected 2021 – 2025 Net Long Term Debt Financing1,2 Infrastructure capital expected to be self-funding through Sempra Infrastructure $9B – $12B Infrastructure $1B – $2B Maintain strong liquidity by maintaining and sizing revolving credit facilities based on evolving business needs Sempra Texas Utilities3 $3B – $4B Anticipated sustainability financing will highlight our role in Through 2022 accelerating the energy transition SoCalGas $2B – $3B California Utilities expected debt Further build equity-credit securities into Sempra’s capital financing of structure as opportunities arise SDG&E $2B – $3B $3B Continue to expand diversity of offerings 1 Activity by Issuer Capital plan focused on CA Utilities provides for meaningful participation in capital markets and focuses on environmental stewardship that should provide sustainable financing opportunities4 1. Net planned long-term debt financing activity by entity for 2021 – 2025. Sempra Parent is expected to have net debt reduction of $1B – 2.5B over this period. 2. Debt issuance net of principal repayment. 3. Sempra Texas Utilities represents off-balance sheet financing as Oncor is not consolidated under GAAP. Values represent 80.25% proportionate ownership of Oncor for illustrative purposes. 4. Actual amounts expended will depend on a number of factors and may differ materially from the amounts reflected 82 in our 5-year capital plan for 2021 – 2025. Includes $9.2B of capex which represents our proportionate share of amounts funded by unconsolidated entities, including Oncor, Sharyland and our unconsolidated JVs.
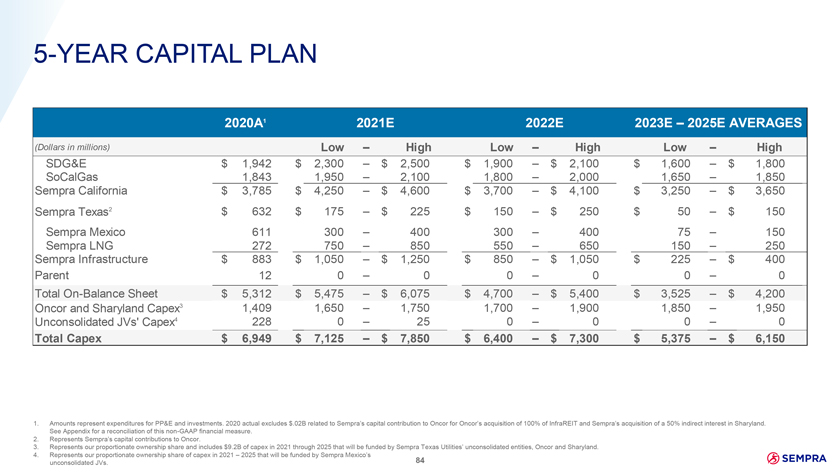
5-YEAR CAPITAL PLAN 2020A1 2021E 2022E 2023E – 2025E AVERAGES (Dollars in millions) Low – High Low – High Low – High SDG&E $ 1,942 $ 2,300 – $ 2,500 $ 1,900 – $ 2,100 $ 1,600 – $ 1,800 SoCalGas 1,843 1,950 – 2,100 1,800 – 2,000 1,650 – 1,850 Sempra California $ 3,785 $ 4,250 – $ 4,600 $ 3,700 – $ 4,100 $ 3,250 – $ 3,650 Sempra Texas2 $ 632 $ 175 – $ 225 $ 150 – $ 250 $ 50 – $ 150 Sempra Mexico 611 300 – 400 300 – 400 75 – 150 Sempra LNG 272 750 – 850 550 – 650 150 – 250 Sempra Infrastructure $ 883 $ 1,050 – $ 1,250 $ 850 – $ 1,050 $ 225 – $ 400 Parent 12 0 – 0 0 – 0 0 – 0 Total On-Balance Sheet $ 5,312 $ 5,475 – $ 6,075 $ 4,700 – $ 5,400 $ 3,525 – $ 4,200 Oncor and Sharyland Capex3 1,409 1,650 – 1,750 1,700 – 1,900 1,850 – 1,950 Unconsolidated JVs’ Capex4 228 0 – 25 0 – 0 0 – 0 Total Capex $ 6,949 $ 7,125 – $ 7,850 $ 6,400 – $ 7,300 $ 5,375 – $ 6,150 1. Amounts represent expenditures for PP&E and investments. 2020 actual excludes $.02B related to Sempra’s capital contribution to Oncor for Oncor’s acquisition of 100% of InfraREIT and Sempra’s acquisition of a 50% indirect interest in Sharyland. See Appendix for a reconciliation of this non-GAAP financial measure. 2. Represents Sempra’s capital contributions to Oncor. 3. Represents our proportionate ownership share and includes $9.2B of capex in 2021 through 2025 that will be funded by Sempra Texas Utilities’ unconsolidated entities, Oncor and Sharyland. 4. Represents our proportionate ownership share of capex in 2021 – 2025 that will be funded by Sempra Mexico’s unconsolidated JVs. 84