Attached files
| file | filename |
|---|---|
| 8-K - 8-K - ONCOR ELECTRIC DELIVERY CO LLC | d214264d8k.htm |
| EX-99.2 - EX-99.2 - ONCOR ELECTRIC DELIVERY CO LLC | d214264dex992.htm |
| EX-10.1 - EX-10.1 - ONCOR ELECTRIC DELIVERY CO LLC | d214264dex101.htm |
Exhibit 99.1
“Oncor is proud to have a long history of service in the State of Texas. As a State, Texas produces the most energy in the United States. At Oncor we understand the fundamental importance of reliability in delivering that energy. We believe that our strong T+D franchise and substantial service territory will allow us to play a pivotal role in developing the critical electric infrastructure needed by our State.” – ALLEN NYE
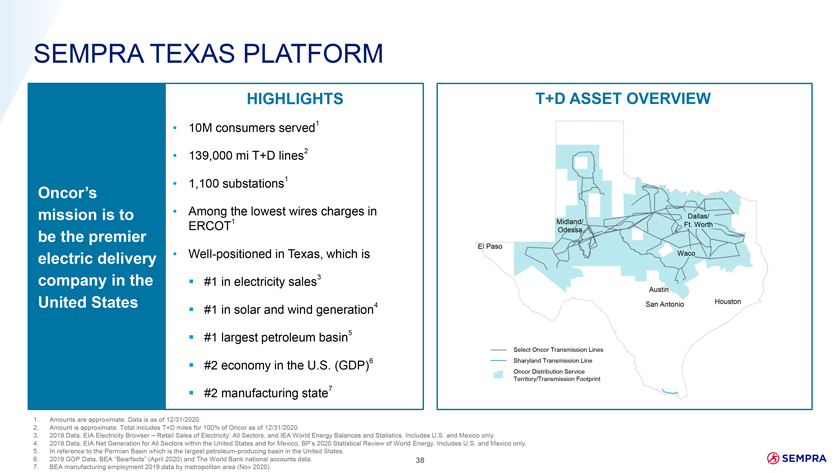
SEMPRA TEXAS PLATFORM HIGHLIGHTS T+D ASSET OVERVIEW • 10M consumers served1 • 139,000 mi T+D lines2 • 1,100 substations1 Oncor’s mission is to • Among the lowest wires charges in Dallas/ ERCOT1 Ft. Worth be the premier electric delivery • Well-positioned in Texas, which is Waco company in the â–ª #1 in electricity sales3 United States â–ª #1 in solar and wind generation4 â–ª #1 largest petroleum basin5 Select Oncor Transmission Lines â–ª #2 economy in the U.S. (GDP)6 Sharyland Transmission Line Oncor Distribution Service Territory/Transmission Footprint â–ª #2 manufacturing state7 1. Amounts are approximate. Data is as of 12/31/2020. 2. Amount is approximate. Total includes T+D miles for 100% of Oncor as of 12/31/2020. 3. 2019 Data. EIA Electricity Browser – Retail Sales of Electricity: All Sectors, and IEA World Energy Balances and Statistics. Includes U.S. and Mexico only. 4. 2019 Data. EIA Net Generation for All Sectors within the United States and for Mexico, BP’s 2020 Statistical Review of World Energy. Includes U.S. and Mexico only. 5. In reference to the Permian Basin which is the largest petroleum-producing basin in the United States. 6. 2019 GDP Data, BEA “Bearfacts” (April 2020) and The World Bank national accounts data. 38 7. BEA manufacturing employment 2019 data by metropolitan area (Nov 2020).
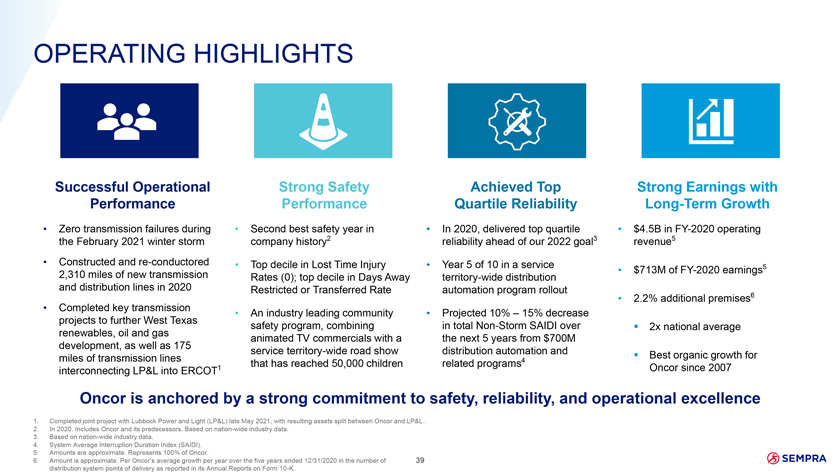
OPERATING HIGHLIGHTS Successful Operational Strong Safety Achieved Top Strong Earnings with Performance Performance Quartile Reliability Long-Term Growth • Zero transmission failures during • Second best safety year in • In 2020, delivered top quartile • $4.5B in FY-2020 operating the February 2021 winter storm company history2 reliability ahead of our 2022 goal3 revenue5 • Constructed and re-conductored • Top decile in Lost Time Injury • Year 5 of 10 in a service 2,310 miles of new transmission • $713M of FY-2020 earnings5 Rates (0); top decile in Days Away territory-wide distribution and distribution lines in 2020 Restricted or Transferred Rate automation program rollout • 2.2% additional premises6 • Completed key transmission • An industry leading community • Projected 10% – 15% decrease projects to further West Texas safety program, combining in total Non-Storm SAIDI over â–ª 2x national average renewables, oil and gas animated TV commercials with a the next 5 years from $700M development, as well as 175 service territory-wide road show distribution automation and â–ª Best organic growth for miles of transmission lines 4 that has reached 50,000 children related programs interconnecting LP&L into ERCOT1 Oncor since 2007 Oncor is anchored by a strong commitment to safety, reliability, and operational excellence 1. Completed joint project with Lubbock Power and Light (LP&L) late May 2021, with resulting assets split between Oncor and LP&L. 2. In 2020. Includes Oncor and its predecessors. Based on nation-wide industry data. 3. Based on nation-wide industry data. 4. System Average Interruption Duration Index (SAIDI). 5. Amounts are approximate. Represents 100% of Oncor. 6. Amount is approximate. Per Oncor’s average growth per year over the five years ended 12/31/2020 in the number of 39 distribution system points of delivery as reported in its Annual Reports on Form 10-K.
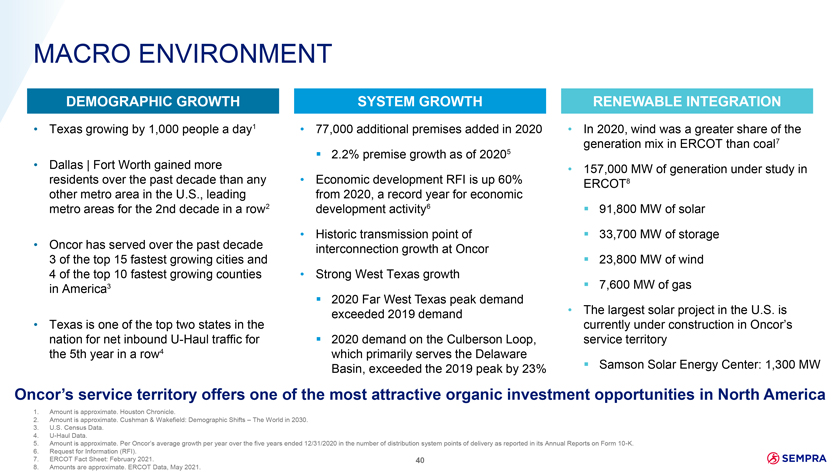
MACRO ENVIRONMENT DEMOGRAPHIC GROWTH SYSTEM GROWTH RENEWABLE INTEGRATION • Texas growing by 1,000 people a day1 • 77,000 additional premises added in 2020 • In 2020, wind was a greater share of the generation mix in ERCOT than coal7 â–ª 2.2% premise growth as of 20205 • Dallas | Fort Worth gained more • 157,000 MW of generation under study in residents over the past decade than any • Economic development RFI is up 60% ERCOT8 other metro area in the U.S., leading from 2020, a record year for economic metro areas for the 2nd decade in a row2 development activity6 â–ª 91,800 MW of solar • Oncor has served over the past decade • Historic transmission point of â–ª 33,700 MW of storage 3 of the top 15 fastest growing cities interconnection growth at Oncor wind and â–ª 23,800 MW of 4 of the top 10 fastest growing counties • Strong West Texas growth in America3 â–ª 7,600 MW of gas â–ª 2020 Far West Texas peak demand • The largest solar project in the U.S. is • Texas is one of the top two states in the exceeded 2019 demand currently under construction in Oncor’s nation for net inbound U-Haul traffic for â–ª 2020 demand on the Culberson Loop, service territory the 5th year in a row4 which primarily serves the Delaware Basin, exceeded the 2019 peak by 23% â–ª Samson Solar Energy Center: 1,300 MW Oncor’s service territory offers one of the most attractive organic investment opportunities in North America 1. Amount is approximate. Houston Chronicle. 2. Amount is approximate. Cushman & Wakefield: Demographic Shifts – The World in 2030. 3. U.S. Census Data. 4. U-Haul Data. 5. Amount is approximate. Per Oncor’s average growth per year over the five years ended 12/31/2020 in the number of distribution system points of delivery as reported in its Annual Reports on Form 10-K. 6. Request for Information (RFI). 7. ERCOT Fact Sheet: February 2021. 40 8. Amounts are approximate. ERCOT Data, May 2021.
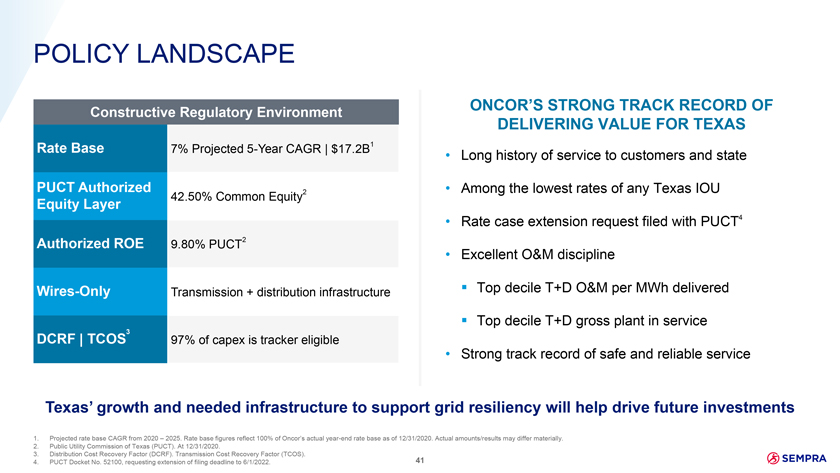
POLICY LANDSCAPE ONCOR’S STRONG TRACK RECORD OF Constructive Regulatory Environment DELIVERING VALUE FOR TEXAS Rate Base 7% Projected 5-Year CAGR | $17.2B1 • Long history of service to customers and state PUCT Authorized 2 • Among the lowest rates of any Texas IOU 42.50% Common Equity Equity Layer • Rate case extension request filed with PUCT4 Authorized ROE 9.80% PUCT2 • Excellent O&M discipline Wires-Only Transmission + distribution infrastructure â–ª Top decile T+D O&M per MWh delivered â–ª Top decile T+D gross plant in service 3 DCRF | TCOS 97% of capex is tracker eligible • Strong track record of safe and reliable service Texas’ growth and needed infrastructure to support grid resiliency will help drive future investments 1. Projected rate base CAGR from 2020 – 2025. Rate base figures reflect 100% of Oncor’s actual year-end rate base as of 12/31/2020. Actual amounts/results may differ materially. 2. Public Utility Commission of Texas (PUCT). At 12/31/2020. 3. Distribution Cost Recovery Factor (DCRF). Transmission Cost Recovery Factor (TCOS). 41 4. PUCT Docket No. 52100, requesting extension of filing deadline to 6/1/2022.
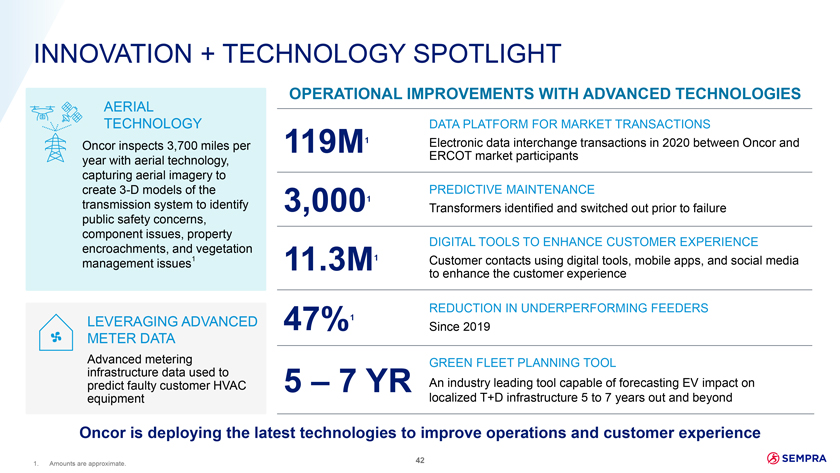
INNOVATION + TECHNOLOGY SPOTLIGHT AERIAL OPERATIONAL IMPROVEMENTS WITH ADVANCED TECHNOLOGIES TECHNOLOGY DATA PLATFORM FOR MARKET TRANSACTIONS Oncor inspects 3,700 miles per 119M1 Electronic data interchange transactions in 2020 between Oncor and year with aerial technology, ERCOT market participants capturing aerial imagery to create 3-D models of the PREDICTIVE MAINTENANCE transmission system to identify 3,0001 Transformers identified and switched out prior to failure public safety concerns, component issues, property DIGITAL TOOLS TO ENHANCE CUSTOMER EXPERIENCE encroachments, and vegetation management issues1 11.3M1 Customer contacts using digital tools, mobile apps, and social media to enhance the customer experience REDUCTION IN UNDERPERFORMING FEEDERS LEVERAGING ADVANCED 47%1 Since 2019 METER DATA Advanced metering GREEN FLEET PLANNING TOOL infrastructure data used to An industry leading tool capable of forecasting EV impact on predict faulty customer HVAC 5 – 7 YR equipment localized T+D infrastructure 5 to 7 years out and beyond Oncor is deploying the latest technologies to improve operations and customer experience 1. Amounts are approximate. 42
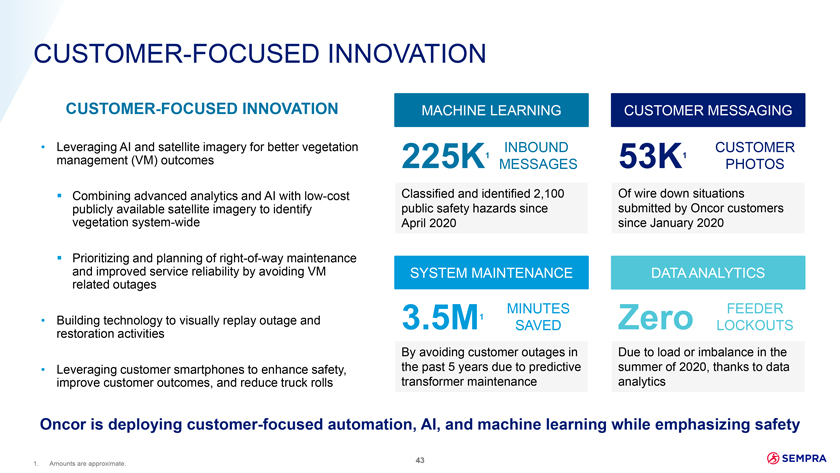
CUSTOMER-FOCUSED INNOVATION CUSTOMER-FOCUSED INNOVATION MACHINE LEARNING CUSTOMER MESSAGING • Leveraging AI and satellite imagery for better vegetation 1 INBOUND 1 CUSTOMER management (VM) outcomes 225K MESSAGES 53K PHOTOS â–ª Combining advanced analytics and AI with low-cost Classified and identified 2,100 Of wire down situations publicly available satellite imagery to identify public safety hazards since submitted by Oncor customers vegetation system-wide April 2020 since January 2020 â–ª Prioritizing and planning of right-of-way maintenance and improved service reliability by avoiding VM SYSTEM MAINTENANCE DATA ANALYTICS related outages MINUTES FEEDER • Building technology to visually replay outage and 3.5M1 Zero SAVED LOCKOUTS restoration activities By avoiding customer outages in Due to load or imbalance in the • Leveraging customer smartphones to enhance safety, the past 5 years due to predictive summer of 2020, thanks to data improve customer outcomes, and reduce truck rolls transformer maintenance analytics Oncor is deploying customer-focused automation, AI, and machine learning while emphasizing safety 1. Amounts are approximate. 43
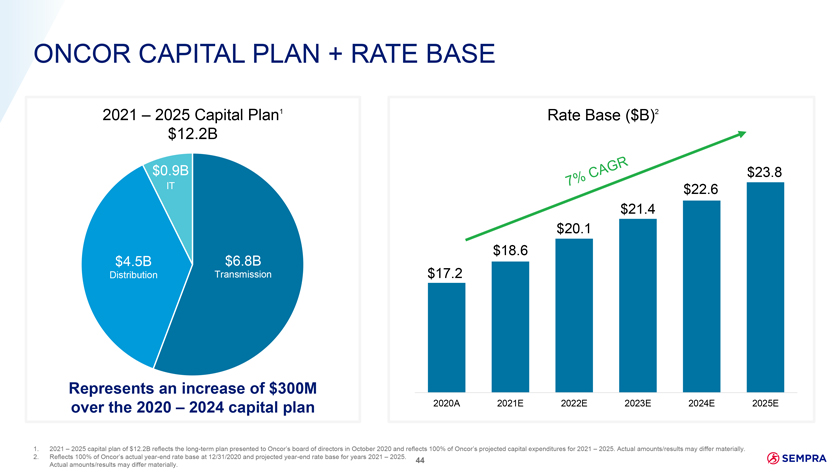
ONCOR CAPITAL PLAN + RATE BASE 2021 – 2025 Capital Plan1 Rate Base ($B)2 $12.2B $0.9B $23.8 IT $22.6 $21.4 $20.1 $18.6 $4.5B $6.8B Distribution Transmission $17.2 Represents an increase of $300M over the 2020 – 2024 capital plan 2020A 2021E 2022E 2023E 2024E 2025E 1. 2021 – 2025 capital plan of $12.2B reflects the long-term plan presented to Oncor’s board of directors in October 2020 and reflects 100% of Oncor’s projected capital expenditures for 2021 – 2025. Actual amounts/results may differ materially. 2. Reflects 100% of Oncor’s actual year-end rate base at 12/31/2020 and projected year-end rate base for years 2021 – 2025. 44 Actual amounts/results may differ materially.
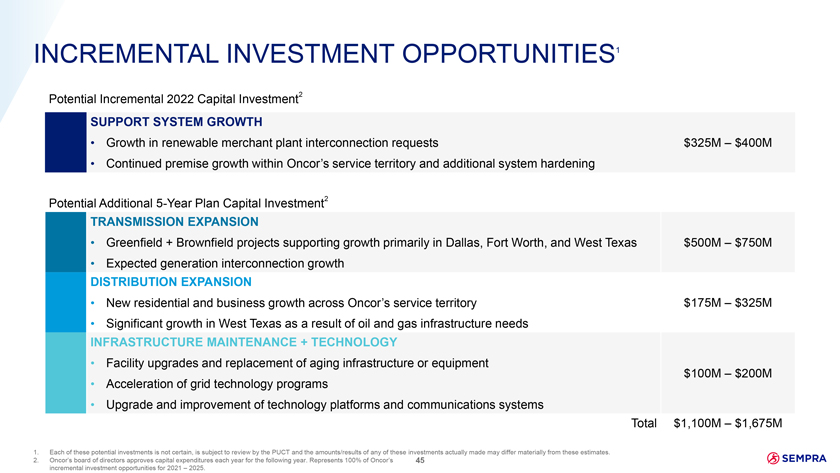
INCREMENTAL INVESTMENT OPPORTUNITIES1 Potential Incremental 2022 Capital Investment2 SUPPORT SYSTEM GROWTH • Growth in renewable merchant plant interconnection requests $325M – $400M • Continued premise growth within Oncor’s service territory and additional system hardening Potential Additional 5-Year Plan Capital Investment2 TRANSMISSION EXPANSION • Greenfield + Brownfield projects supporting growth primarily in Dallas, Fort Worth, and West Texas $500M – $750M • Expected generation interconnection growth DISTRIBUTION EXPANSION • New residential and business growth across Oncor’s service territory $175M – $325M • Significant growth in West Texas as a result of oil and gas infrastructure needs INFRASTRUCTURE MAINTENANCE + TECHNOLOGY • Facility upgrades and replacement of aging infrastructure or equipment $100M – $200M • Acceleration of grid technology programs • Upgrade and improvement of technology platforms and communications systems Total $1,100M – $1,675M 1. Each of these potential investments is not certain, is subject to review by the PUCT and the amounts/results of any of these investments actually made may differ materially from these estimates. 2. Oncor’s board of directors approves capital expenditures each year for the following year. Represents 100% of Oncor’s 45 incremental investment opportunities for 2021 – 2025.
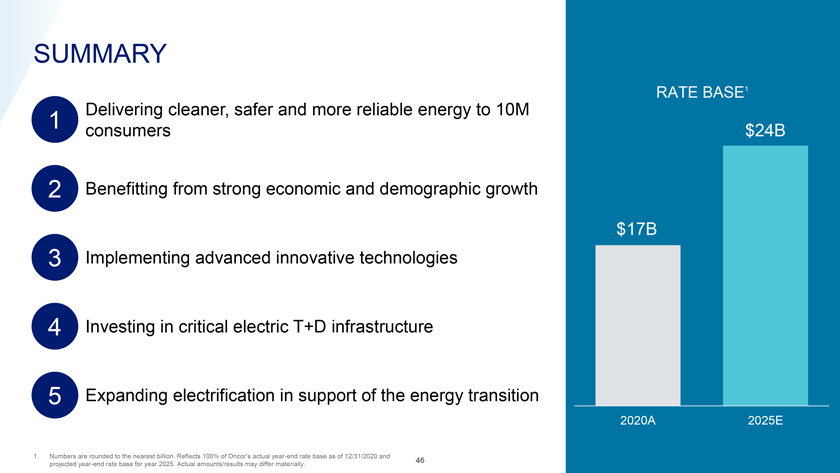
SUMMARY RATE BASE1 1 Delivering cleaner, safer and more reliable energy to 10M consumers $24B 2 Benefitting from strong economic and demographic growth $17B 3 Implementing advanced innovative technologies 4 Investing in critical electric T+D infrastructure 5 Expanding electrification in support of the energy transition 2020A 2025E 1. Numbers are rounded to the nearest billion. Reflects 100% of Oncor’s actual year-end rate base as of 12/31/2020 and 46 projected year-end rate base for year 2025. Actual amounts/results may differ materially.

APPENDIX 47
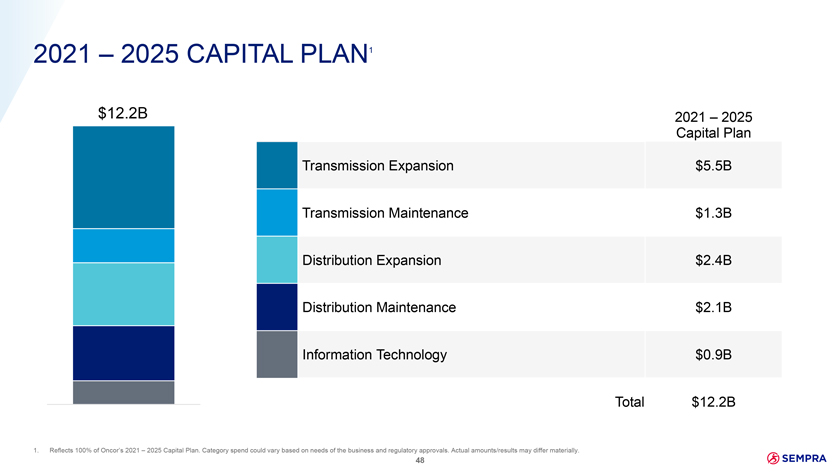
2021 – 2025 CAPITAL PLAN1 $12.2B 2021 – 2025 Capital Plan Transmission Expansion $5.5B Transmission Maintenance $1.3B Distribution Expansion $2.4B Distribution Maintenance $2.1B Information Technology $0.9B Total $12.2B 1. Reflects 100% of Oncor’s 2021 – 2025 Capital Plan. Category spend could vary based on needs of the business and regulatory approvals. Actual amounts/results may differ materially. 48