Attached files
| file | filename |
|---|---|
| EX-99.1 - EXHIBIT 99.1 - CION Investment Corp | tm2120019d1_ex99-1.htm |
| 8-K - FORM 8-K - CION Investment Corp | tm2120019d1_8k.htm |
Exhibit 99.2
CION Investment Corporation Overview & Listing Preparations
Disclosures 2 This presentation has been prepared by CĪON Investment Corporation (the “Company” or “CION”) and may be used for information purposes only . This presentation shall not constitute an offer to sell or the solicitation of any offer to buy any securities . Any such offering of securities will be made only by means of a registration statement (including a prospectus) filed with the U . S . Securities and Exchange Commission (the “SEC”), and only after such registration statement has become effective . No such registration statement has been filed or become effective as of the date of this presentation . The information contained herein remains subject to further updating, revision, and amendment without notice . It should not be relied upon as the basis for making any investment decision, entering into any transaction or for any other purpose . This information is not, and under no circumstances is to be construed as, a prospectus or an offering memorandum as defined under applicable securities legislation . The information contained herein does not set forth all of the terms, conditions and risks of the Company . An investment in the Company is speculative and involves a high degree of risk, which may not be suitable for all investors . Risks and limitations include, but are not limited to, the following : investment instruments may be susceptible to economic downturns ; most of the underlying credit instruments are rated (or would be rated, if rated) below investment grade and considered speculative ; Company’s business and operations may be impacted by fluctuations in the capital markets ; the Company has limited liquidity and there is no guarantee that shareholders will be able to liquidate their investment in the Company to the extent desired or at all . The Company, its investment adviser and their respective subsidiaries and affiliates and their respective employees, officers and agents make no representations as to the completeness and accuracy of any information contained within this written material . As such, they are not responsible for errors and/or omissions with respect to the information contained herein except and as required by law . In considering investment performance information contained in this presentation, bear in mind that past performance is not necessarily indicative of future results and there can be no assurance that the Company will achieve comparable results . Actual realized value of currently unrealized investments will depend on, among other factors, future operating results, the value of the assets and market conditions at the time of disposition, any related transaction costs and the timing and manner of sale, all of which may differ from the assumptions and circumstances on which the current unrealized valuations are based . Accordingly, the actual realized values of unrealized investments may differ materially from the values indicated herein . Certain information contained in this presentation has been obtained from published and non - published sources and/or prepared by third parties and in certain cases has not been updated through the date hereof . Such information has not been independently verified by the Company and the Company does not assume responsibility for the accuracy of such information (or updating the presentation based on facts learned following its issuance) . Forward - Looking Statements This presentation may contain “forward - looking statements” within the meaning of the Private Securities Litigation Reform Act of 1995 . Statements other than statements of historical facts included in this presentation may constitute forward - looking statements and are not guarantees of future performance or results and involve a number of risks and uncertainties . Actual results may differ materially from those in the forward - looking statements as a result of a number of factors, including those described from time to time in filings with the SEC . The Company undertakes no duty to update any forward - looking statement made herein . All forward - looking statements speak only as of the date of this presentation .
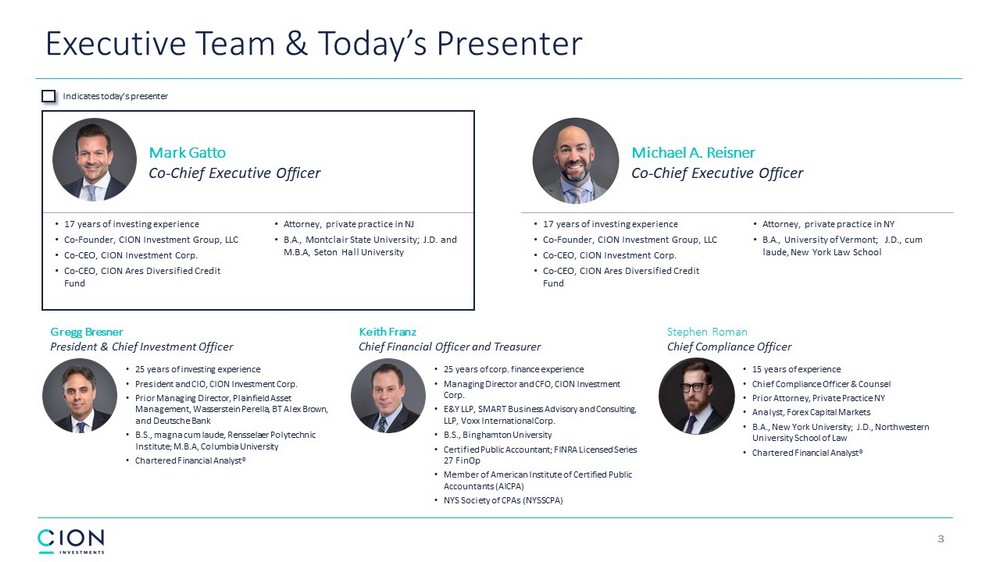
• 17 years of investing experience • Co - Founder, CION Investment Group, LLC • Co - CEO, CION Investment Corp. • Co - CEO, CION Ares Diversified Credit Fund Mark Gatto Co - Chief Executive Officer • Attorney, private practice in NJ • B.A., Montclair State University; J.D. and M.B.A, Seton Hall University • 17 years of investing experience • Co - Founder, CION Investment Group, LLC • Co - CEO, CION Investment Corp. • Co - CEO, CION Ares Diversified Credit Fund Michael A. Reisner Co - Chief Executive Officer • Attorney, private practice in NY • B.A., University of Vermont; J.D., cum laude, New York Law School • 25 years of investing experience • President and CIO, CION Investment Corp. • Prior Managing Director, Plainfield Asset Management, Wasserstein Perella, BT Alex Brown, and Deutsche Bank • B.S., magna cum laude, Rensselaer Polytechnic Institute; M.B.A, Columbia University • Chartered Financial Analyst® Gregg Bresner President & Chief Investment Officer • 25 years of corp. finance experience • Managing Director and CFO, CION Investment Corp. • E&Y LLP, SMART Business Advisory and Consulting, LLP, Voxx International Corp. • B.S., Binghamton University • Certified Public Accountant; FINRA Licensed Series 27 FinOp • Member of American Institute of Certified Public Accountants (AICPA) • NYS Society of CPAs (NYSSCPA) Keith Franz Chief Financial Officer and Treasurer Stephen Roman Chief Compliance Officer • 15 years of experience • Chief Compliance Officer & Counsel • Prior Attorney, Private Practice NY • Analyst, Forex Capital Markets • B.A., New York University; J.D., Northwestern University School of Law • Chartered Financial Analyst® Indicates today’s presenter Executive Team & Today’s Presenter 3
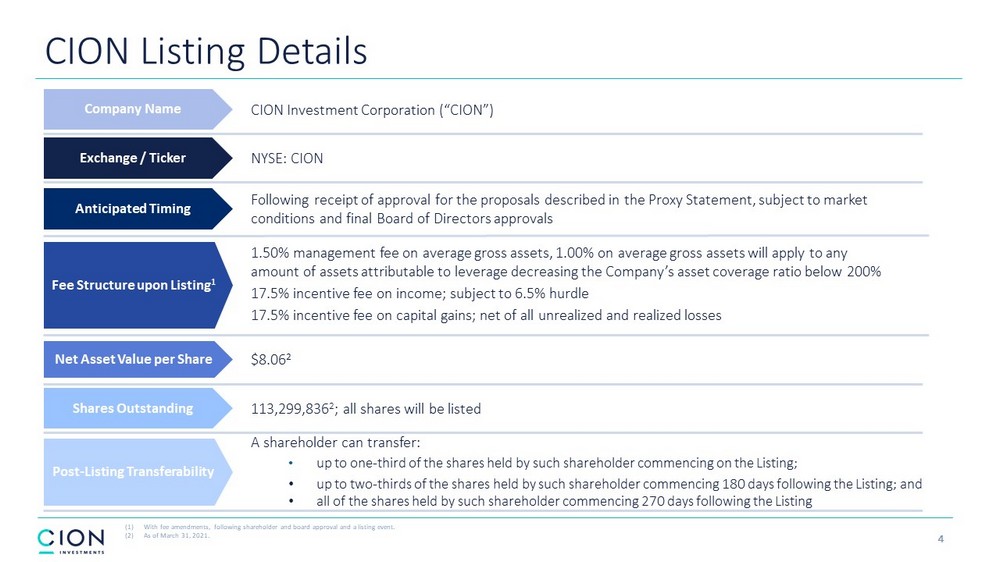
Following receipt of approval for the proposals described in the Proxy Statement, subject to market conditions and final Board of Directors approvals Anticipated Timing 1.50% management fee on average gross assets, 1.00% on average gross assets will apply to any amount of assets attributable to leverage decreasing the Company’s asset coverage ratio below 200% 17.5% incentive fee on income; subject to 6.5% hurdle 17.5% incentive fee on capital gains; net of all unrealized and realized losses Fee Structure upon Listing 1 $8.06 2 Net Asset Value per Share NYSE: CION Exchange / Ticker CION Listing Details CION Investment Corporation (“CION”) Company Name Shares Outstanding 113,299,836 2 ; all shares will be listed Post - Listing Transferability A shareholder can transfer: • up to one - third of the shares held by such shareholder commencing on the Listing; • up to two - thirds of the shares held by such shareholder commencing 180 days following the Listing; and • all of the shares held by such shareholder commencing 270 days following the Listing (1) With fee amendments, following shareholder and board approval and a listing event. (2) As of March 31, 2021. 4
Table of Contents • CION Overview & Fund - to - Date Performance • Why a Direct Listing Makes Sense in Today’s Market • Why CION is Positioned for Success as a Listed BDC • Listing Process Overview • CION vs. Previously Non - Traded BDCs • Market Opportunity & BDC Sector Conditions • CION’s Competitive Edge • Portfolio Highlights 5
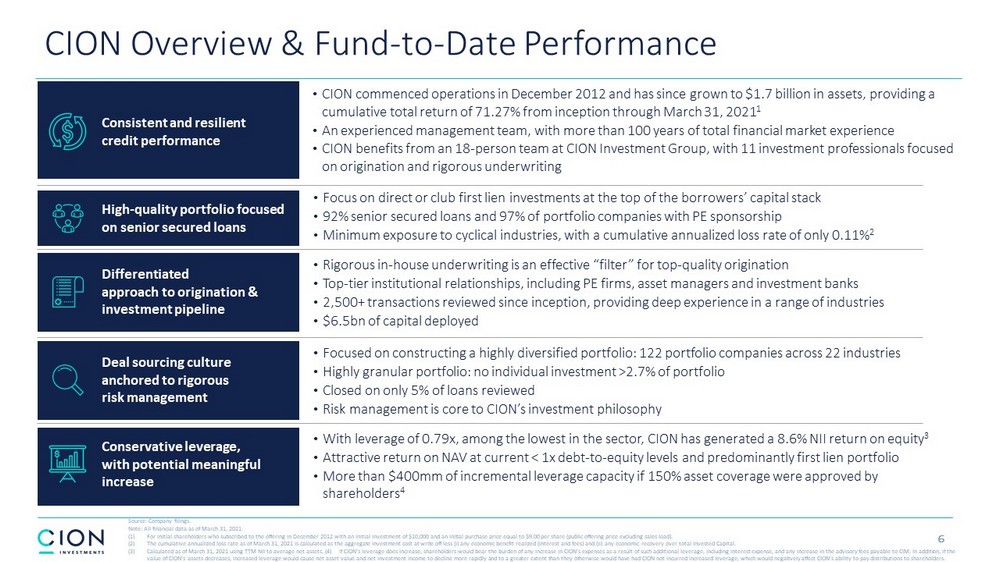
CION Overview & Fund - to - Date Performance • Rigorous in - house underwriting is an effective “filter” for top - quality origination • Top - tier institutional relationships, including PE firms, asset managers and investment banks • 2,500+ transactions reviewed since inception, providing deep experience in a range of industries • $6.5bn of capital deployed Differentiated approach to origination & investment pipeline • Focused on constructing a highly diversified portfolio: 122 portfolio companies across 22 industries • Highly granular portfolio: no individual investment >2.7% of portfolio • Closed on only 5% of loans reviewed • Risk management is core to CION’s investment philosophy Deal sourcing culture anchored to rigorous risk management • CION commenced operations in December 2012 and has since grown to $1.7 billion in assets, providing a cumulative total return of 71.27% from inception through March 31, 2021 1 • An experienced management team, with more than 100 years of total financial market experience • CION benefits from an 18 - person team at CION Investment Group, with 11 investment professionals focused on origination and rigorous underwriting Consistent and resilient credit performance • Focus on direct or club first lien investments at the top of the borrowers’ capital stack • 92% senior secured loans and 97% of portfolio companies with PE sponsorship • Minimum exposure to cyclical industries, with a cumulative annualized loss rate of only 0.11% 2 High - quality portfolio focused on senior secured loans • With leverage of 0.79x, among the lowest in the sector, CION has generated a 8.6% NII return on equity 3 • Attractive return on NAV at current < 1x debt - to - equity levels and predominantly first lien portfolio • More than $400mm of incremental leverage capacity if 150% asset coverage were approved by shareholders 4 Conservative leverage, with potential meaningful increase Source: Company filings. Note: All financial data as of March 31, 2021. (1) For initial shareholders who subscribed to the offering in December 2012 with an initial investment of $10,000 and an initial pu rchase price equal to $9.00 per share (public offering price excluding sales load). (2) The cumulative annualized loss rate as of March 31, 2021 is calculated as the aggregate investment cost at write - off less (i) an y economic benefit realized (interest and fees) and (ii) any economic recovery over total Invested Capital. (3) Calculated as of March 31, 2021 using TTM NII to average net assets. (4) If CION’s leverage does increase, shareholders w oul d bear the burden of any increase in CION’s expenses as a result of such additional leverage, including interest expense, and an y increase in the advisory fees payable to CIM. In addition, if the value of CION’s assets decreases, increased leverage would cause net asset value and net investment income to decline more ra pid ly and to a greater extent than they otherwise would have had CION not incurred increased leverage, which would negatively af fec t CION’s ability to pay distributions to shareholders. 6
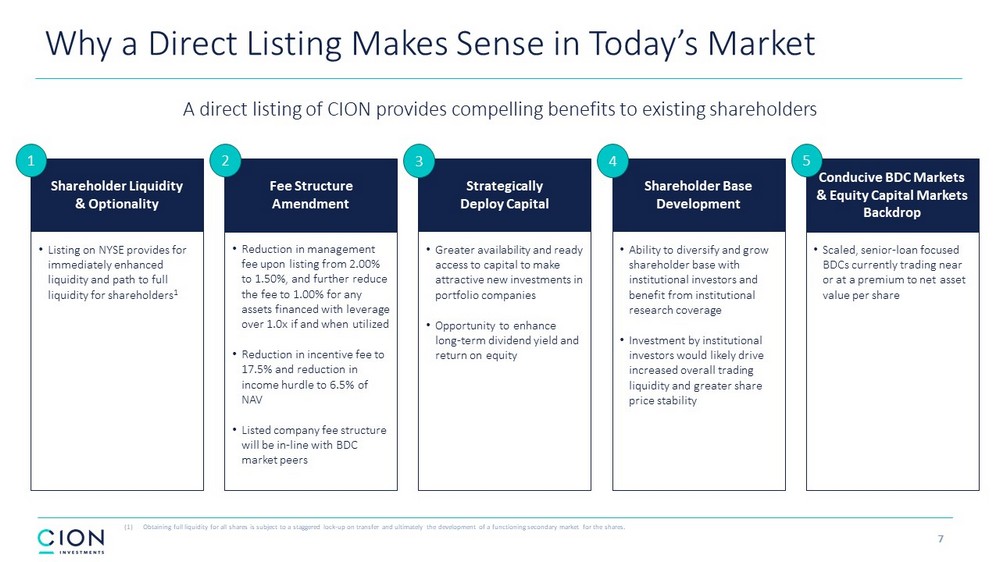
Why a Direct Listing Makes Sense in Today’s Market A direct listing of CION provides compelling benefits to existing shareholders 7 • Listing on NYSE provides for immediately enhanced liquidity and path to full liquidity for shareholders 1 Shareholder Liquidity & Optionality 1 • Ability to diversify and grow shareholder base with institutional investors and benefit from institutional research coverage • Investment by institutional investors would likely drive increased overall trading liquidity and greater share price stability Shareholder Base Development 4 • Greater availability and ready access to capital to make attractive new investments in portfolio companies • Opportunity to enhance long - term dividend yield and return on equity Strategically Deploy Capital 3 • Reduction in management fee upon listing from 2.00% to 1.50%, and further reduce the fee to 1.00% for any assets financed with leverage over 1.0x if and when utilized • Reduction in incentive fee to 17.5% and reduction in income hurdle to 6.5% of NAV • Listed company fee structure will be in - line with BDC market peers Fee Structure Amendment 2 • Scaled, senior - loan focused BDCs currently trading near or at a premium to net asset value per share Conducive BDC Markets & Equity Capital Markets Backdrop 5 (1) Obtaining full liquidity for all shares is subject to a staggered lock - up on transfer and ultimately the development of a functi oning secondary market for the shares.
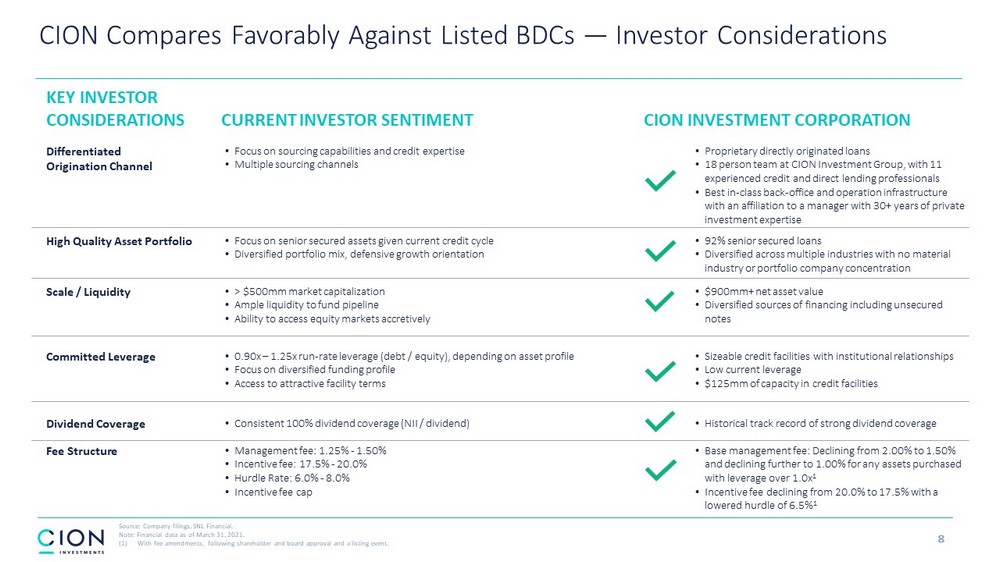
Differentiated Origination Channel • Focus on sourcing capabilities and credit expertise • Multiple sourcing channels • Proprietary directly originated loans • 18 person team at CION Investment Group , with 11 experienced credit and direct lending professionals • Best in - class back - office and operation infrastructure with an affiliation to a manager with 30+ years of private investment expertise High Quality Asset Portfolio • Focus on senior secured assets given current credit cycle • Diversified portfolio mix, defensive growth orientation • 92% senior secured loans • Diversified across multiple industries with no material industry or portfolio company concentration Scale / Liquidity • > $500mm market capitalization • Ample liquidity to fund pipeline • Ability to access equity markets accretively • $900mm+ net asset value • Diversified sources of financing including unsecured notes Committed Leverage • 0.90x – 1.25x run - rate leverage (debt / equity), depending on asset profile • Focus on diversified funding profile • Access to attractive facility terms • Sizeable credit facilities with institutional relationships • Low current leverage • $125mm of capacity in credit facilities Dividend Coverage • Consistent 100% dividend coverage (NII / dividend) • Historical track record of strong dividend coverage Fee Structure • Management fee: 1.25% - 1.50% • Incentive fee: 17.5% - 20.0% • Hurdle Rate: 6.0% - 8.0% • Incentive fee cap • Base management fee: Declining from 2.00% to 1.50% and declining further to 1.00% for any assets purchased with leverage over 1.0x 1 • Incentive fee declining from 20.0% to 17.5% with a lowered hurdle of 6.5% 1 KEY INVESTOR CONSIDERATIONS CURRENT INVESTOR SENTIMENT CION INVESTMENT CORPORATION 8 CION Compares Favorably Against Listed BDCs — Investor Considerations Source: Company filings, SNL Financial. Note: Financial data as of March 31, 2021. (1) With fee amendments, following shareholder and board approval and a listing event.
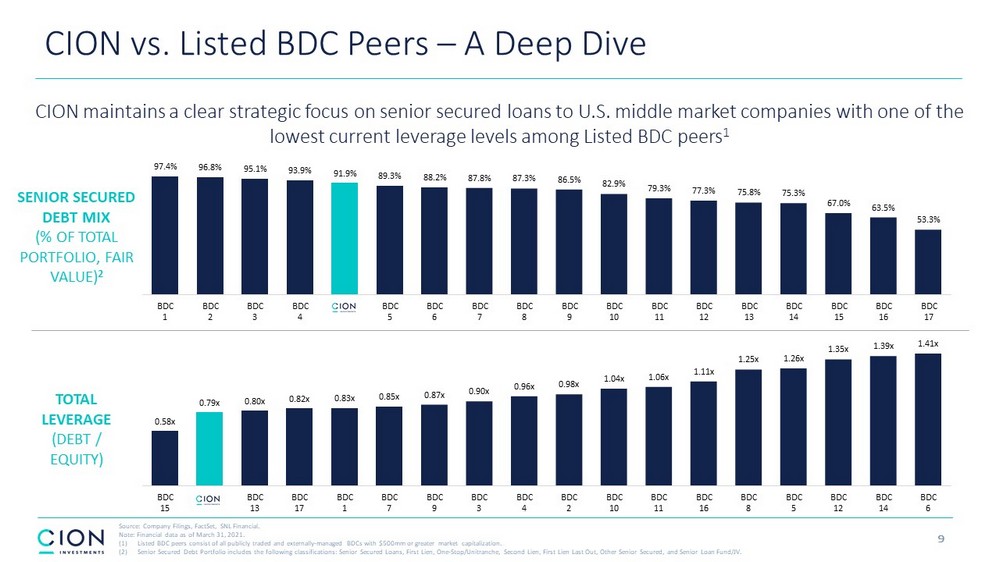
CION vs. Listed BDC Peers – A Deep Dive 9 CION maintains a clear strategic focus on senior secured loans to U.S. middle market companies with one of the lowest current leverage levels among Listed BDC peers 1 SENIOR SECURED DEBT MIX (% OF TOTAL PORTFOLIO, FAIR VALUE) 2 TOTAL LEVERAGE (DEBT / EQUITY) Source: Company Filings, FactSet, SNL Financial. Note: Financial data as of March 31, 2021. (1) Listed BDC peers consist of all publicly traded and externally - managed BDCs with $500mm or greater market capitalization. (2) Senior Secured Debt Portfolio includes the following classifications: Senior Secured Loans, First Lien, One - Stop/Unitranche, Sec ond Lien, First Lien Last Out, Other Senior Secured, and Senior Loan Fund/JV. 0.58x 0.79x 0.80x 0.82x 0.83x 0.85x 0.87x 0.90x 0.96x 0.98x 1.04x 1.06x 1.11x 1.25x 1.26x 1.35x 1.39x 1.41x BDC 15 BDC 13 BDC 17 BDC 1 BDC 7 BDC 9 BDC 3 BDC 4 BDC 2 BDC 10 BDC 11 BDC 16 BDC 8 BDC 5 BDC 12 BDC 14 BDC 6 97.4% 96.8% 95.1% 93.9% 91.9% 89.3% 88.2% 87.8% 87.3% 86.5% 82.9% 79.3% 77.3% 75.8% 75.3% 67.0% 63.5% 53.3% BDC 1 BDC 2 BDC 3 BDC 4 BDC 5 BDC 6 BDC 7 BDC 8 BDC 9 BDC 10 BDC 11 BDC 12 BDC 13 BDC 14 BDC 15 BDC 16 BDC 17
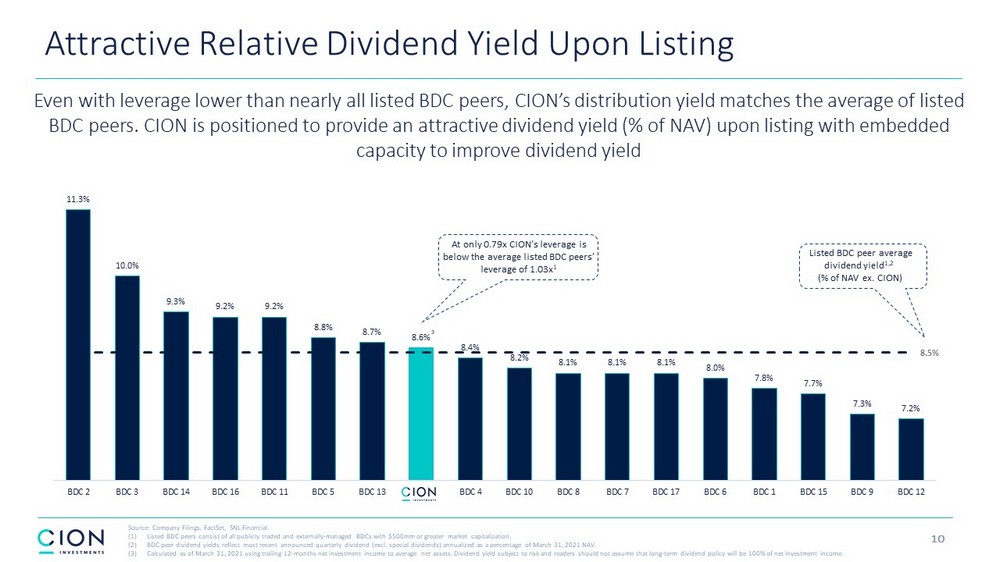
11.3% 10.0% 9.3% 9.2% 9.2% 8.8% 8.7% 8.6% 8.4% 8.2% 8.1% 8.1% 8.1% 8.0% 7.8% 7.7% 7.3% 7.2% 8.5 % BDC 2 BDC 3 BDC 14 BDC 16 BDC 11 BDC 5 BDC 13 BDC 4 BDC 10 BDC 8 BDC 7 BDC 17 BDC 6 BDC 1 BDC 15 BDC 9 BDC 12 Attractive Relative Dividend Yield Upon Listing Even with leverage lower than nearly all listed BDC peers, CION’s distribution yield matches the average of listed BDC peers. CION is positioned to provide an attractive dividend yield (% of NAV) upon listing with embedded capacity to improve dividend yield Source: Company Filings, FactSet, SNL Financial. (1) Listed BDC peers consist of all publicly traded and externally - managed BDCs with $500mm or greater market capitalization. (2) BDC peer dividend yields reflect most recent announced quarterly dividend (excl. special dividends) annualized as a percentag e o f March 31, 2021 NAV. (3) Calculated as of March 31, 2021 using trailing 12 - months net investment income to average net assets. Dividend yield subject to risk and readers should not assume that long - term dividend policy will be 100% of net investment income. 10 Listed BDC peer average dividend yield 1,2 (% of NAV ex. CION) 3 At only 0.79x CION’s leverage is below the average listed BDC peers’ leverage of 1.03x 1
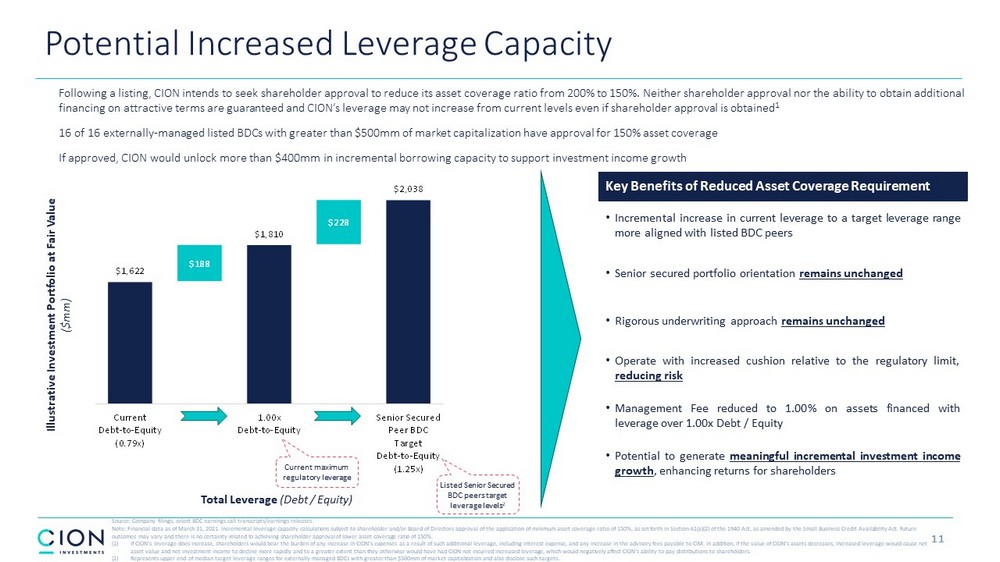
$1,622 $188 $1,810 $228 $2,038 Current Debt-to-Equity (0.79x) 1.00x Debt-to-Equity Senior Secured Peer BDC Target Debt-to-Equity (1.25x) Current maximum regulatory leverage Potential Increased Leverage Capacity 11 Following a listing, CION intends to seek shareholder approval to reduce its asset coverage ratio from 200% to 150%. Neither sha reholder approval nor the ability to obtain additional financing on attractive terms are guaranteed and CION’s leverage may not increase from current levels even if shareholder app rov al is obtained 1 16 of 16 externally - managed listed BDCs with greater than $500mm of market capitalization have approval for 150% asset coverage If approved, CION would unlock more than $400mm in incremental borrowing capacity to support investment income growth Total Leverage (Debt / Equity) Illustrative Investment Portfolio at Fair Value ($mm) Listed Senior Secured BDC peers target leverage levels 2 Key Benefits of Reduced Asset Coverage Requirement • Incremental increase in current leverage to a target leverage range more aligned with listed BDC peers • Senior secured portfolio orientation remains unchanged • Rigorous underwriting approach remains unchanged • Operate with increased cushion relative to the regulatory limit, reducing risk • Management Fee reduced to 1 . 00 % on assets financed with leverage over 1 . 00 x Debt / Equity • Potential to generate meaningful incremental investment income growth , enhancing returns for shareholders Source: Company filings, select BDC earnings call transcripts/earnings releases. Note: Financial data as of March 31, 2021. Incremental leverage capacity calculations subject to shareholder and/or Board of Dir ectors approval of the application of minimum asset coverage ratio of 150%, as set forth in Section 61(a)(2) of the 1940 Act, as amended by the Small Business Credit Availability Act. Future outcomes may vary and there is no certainty related to achieving shareholder approval of lower asset coverage ratio of 150%. (1) If CION’s leverage does increase, shareholders would bear the burden of any increase in CION’s expenses as a result of such a ddi tional leverage, including interest expense, and any increase in the advisory fees payable to CIM. In addition, if the value of CION’s assets decreases, increased leverage would cause net asset value and net investment income to decline more rapidly and to a greater extent than they otherwise would have had CION no t incurred increased leverage, which would negatively affect CION’s ability to pay distributions to shareholders. (2) Represents upper end of median target leverage ranges for externally - managed BDCs with greater than $500mm of market capitalizat ion and also disclose such targets.
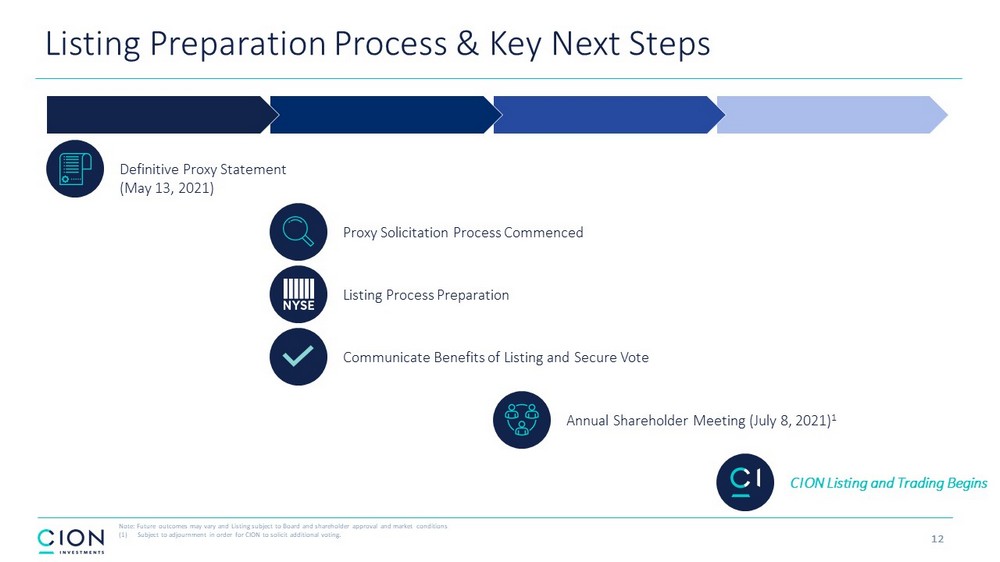
Definitive Proxy Statement (May 13, 2021) Proxy Solicitation Process Commenced Annual Shareholder Meeting (July 8, 2021) 1 Communicate Benefits of Listing and Secure Vote CION Listing and Trading Begins Listing Process Preparation Listing Preparation Process & Key Next Steps Note: Future outcomes may vary and Listing subject to Board and shareholder approval and market conditions (1) Subject to adjournment in order for CION to solicit additional voting. 12
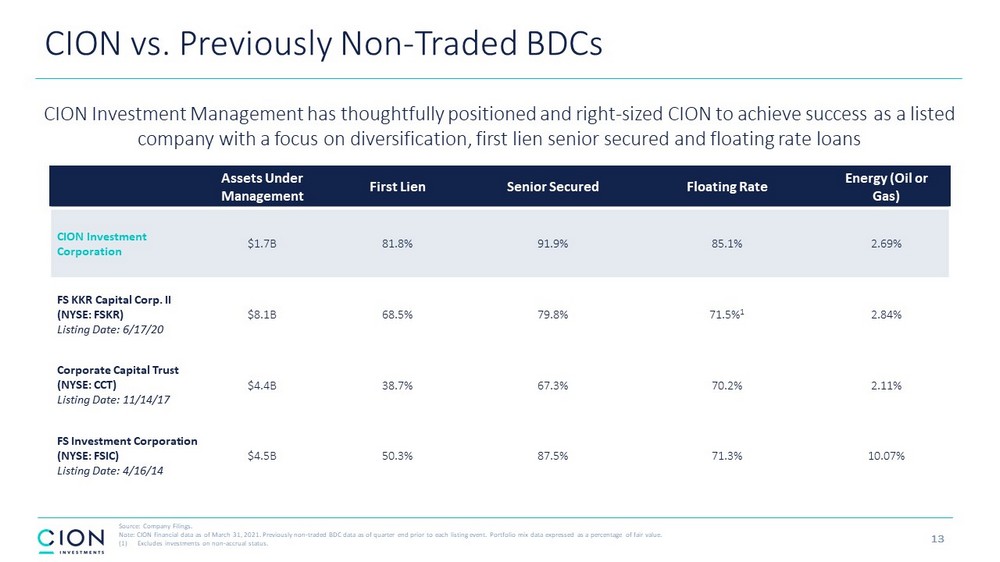
CION vs. Previously Non - Traded BDCs Assets Under Management First Lien Senior Secured Floating Rate Energy (Oil or Gas) CION Investment Corporation $1.7B 81.8% 91.9% 85.1% 2.69% FS KKR Capital Corp. II (NYSE: FSKR) Listing Date: 6/17/20 $8.1B 68.5% 79.8% 71.5% 1 2.84% Corporate Capital Trust (NYSE: CCT) Listing Date: 11/14/17 $4.4B 38.7% 67.3% 70.2% 2.11% FS Investment Corporation (NYSE: FSIC) Listing Date: 4/16/14 $4.5B 50.3% 87.5% 71.3% 10.07% CION Investment Management has thoughtfully positioned and right - sized CION to achieve success as a listed company with a focus on diversification, first lien senior secured and floating rate loans 13 Source: Company Filings. Note: CION financial data as of March 31, 2021. Previously non - traded BDC data as of quarter end prior to each listing event. Po rtfolio mix data expressed as a percentage of fair value. (1) Excludes investments on non - accrual status.
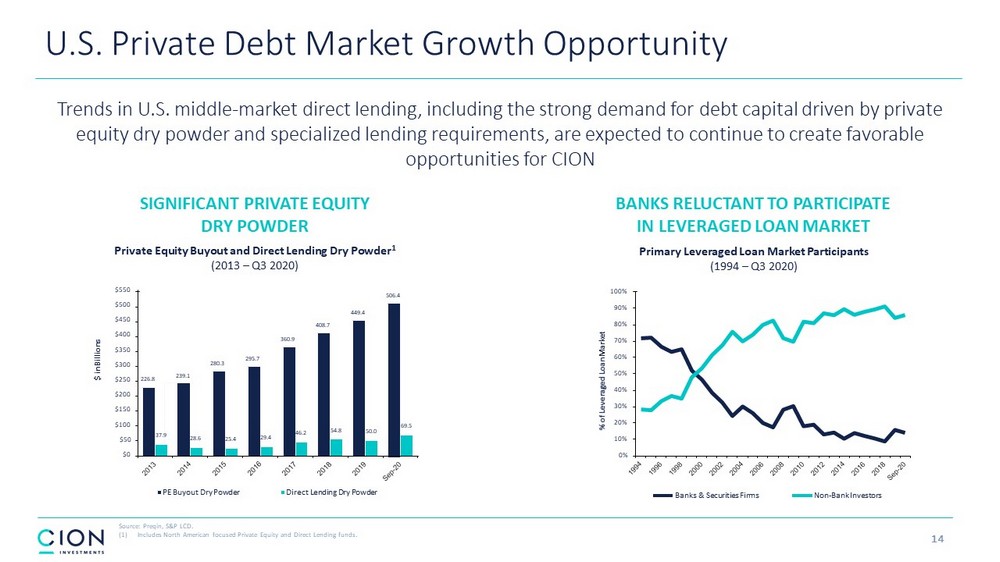
U.S. Private Debt Market Growth Opportunity 14 Source: Preqin, S&P LCD. (1) Includes North American focused Private Equity and Direct Lending funds. Trends in U.S. middle - market direct lending, including the strong demand for debt capital driven by private equity dry powder and specialized lending requirements, are expected to continue to create favorable opportunities for CION Private Equity Buyout and Direct Lending Dry Powder 1 ( 2013 – Q3 2020 ) Primary Leveraged Loan Market Participants ( 1994 – Q3 2020 ) $ in Billions 226 .8 239 .1 280 .3 295 .7 360 .9 408 .7 449 .4 506 .4 37 .9 28 .6 25 .4 29 .4 46 .2 54 .8 50 .0 69 .5 $ 5 5 0 $ 5 0 0 $ 4 5 0 $ 4 0 0 $ 3 5 0 $ 3 0 0 $ 2 5 0 $ 2 0 0 $ 1 5 0 $ 1 0 0 $ 5 0 $0 PE Buyout Dry Powder Direct Lending Dry Powder 0% 1 0 % 2 0 % 3 0 % 4 0 % 5 0 % 6 0 % 7 0 % 8 0 % 9 0 % 1 0 0 % % of Leveraged Loan Market Banks & Securities Firms Non - Bank Investors BANKS RELUCTANT TO PARTICIPATE IN LEVERAGED LOAN MARKET SIGNIFICANT PRIVATE EQUITY DRY POWDER

Source: Company Filings, FactSet, Raymond James, SNL Financial. Note: Market data as of June 3, 2021. Financial data as of March 31, 2021. (1) Scaled, Senior Secured Lending Peers include all externally - managed BDCs with greater than $500mm of market capitalization and 7 5%+ of total portfolio is comprised of senior secured loans (AINV, ARCC, BBDC, BCSF, CCAP, CGBD, FSKR, GBDC, GSBD, NMFC, OCSL, ORCC, TCPC, and TSLX). BDC Market Strength & Growth Trajectory BDC market continues to experience positive momentum • Improving economic conditions fueled by government stimulus and regional economies re - opening have translated into stable - to - improving credit quality within BDC investment portfolios • Access to debt is increasing (especially unsecured debt) at historically low rates . Roughly $ 7 billion of unsecured notes have been issued in the BDC space in 2021 with offering sizes ranging from small (< $ 100 million) to large ( $ 1 billion) • The average P/NAV for scaled, senior secured lending BDCs has climbed from 0 . 89 x at the end of 2020 to 1 . 03 x as of June 3 , 2021 , which marks a recovery to the pre - COVID average P/NAV valuation NAVs trending stable - to - higher • Debt costs are falling, allowing BDCs to expand their return on equity • Dividends are more manageable, having been right sized during recent market disruptions • Improved economic conditions powered by government stimulus BDC Outperformance vs. S&P 500 15 1.03x 0.30 0.50 0.70 0.90 1.10 Jun-18 Dec-18 Jun-19 Dec-19 Jun-20 Dec-20 Jun-21 Scaled, Senior Secured Lending Peers Scaled, Senior Secured - Focused BDCs Trading Levels 1 Price - to - Net Asset Value 61.2% 54.3% 34.3% 80% 100% 120% 140% 160% Jun-20 Aug-20 Oct-20 Dec-20 Feb-21 Apr-21 Jun-21 RJ BDC Index (Equal Weight) RJ BDC Index (Mkt Cap Weight) S&P 500 Total Return
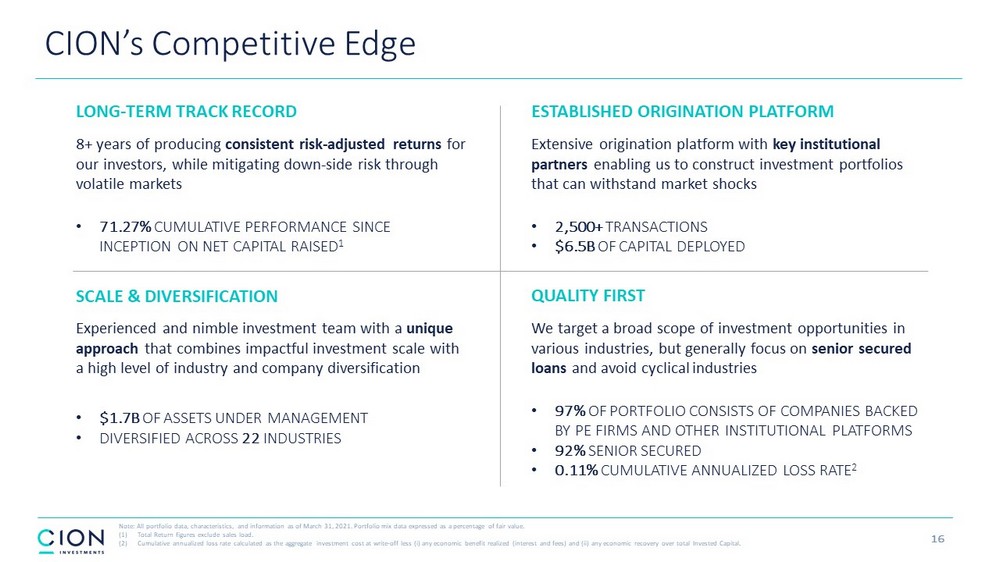
LONG - TERM TRACK RECORD 8+ years of producing consistent risk - adjusted returns for our investors, while mitigating down - side risk through volatile markets • 71.27% CUMULATIVE PERFORMANCE SINCE INCEPTION ON NET CAPITAL RAISED 1 ESTABLISHED ORIGINATION PLATFORM Extensive origination platform with key institutional partners enabling us to construct investment portfolios that can withstand market shocks • 2,500+ TRANSACTIONS • $6.5B OF CAPITAL DEPLOYED QUALITY FIRST We target a broad scope of investment opportunities in various industries, but generally focus on senior secured loans and avoid cyclical industries • 97% OF PORTFOLIO CONSISTS OF COMPANIES BACKED BY PE FIRMS AND OTHER INSTITUTIONAL PLATFORMS • 92% SENIOR SECURED • 0.11% CUMULATIVE ANNUALIZED LOSS RATE 2 SCALE & DIVERSIFICATION Experienced and nimble investment team with a unique approach that combines impactful investment scale with a high level of industry and company diversification • $1.7B OF ASSETS UNDER MANAGEMENT • DIVERSIFIED ACROSS 22 INDUSTRIES 16 CION’s Competitive Edge Note: All portfolio data, characteristics, and information as of March 31, 2021. Portfolio mix data expressed as a percentage of fair value. (1) Total Return figures exclude sales load. (2) Cumulative annualized loss rate calculated as the aggregate investment cost at write - off less (i) any economic benefit realized (interest and fees) and (ii) any economic recovery over total Invested Capital.
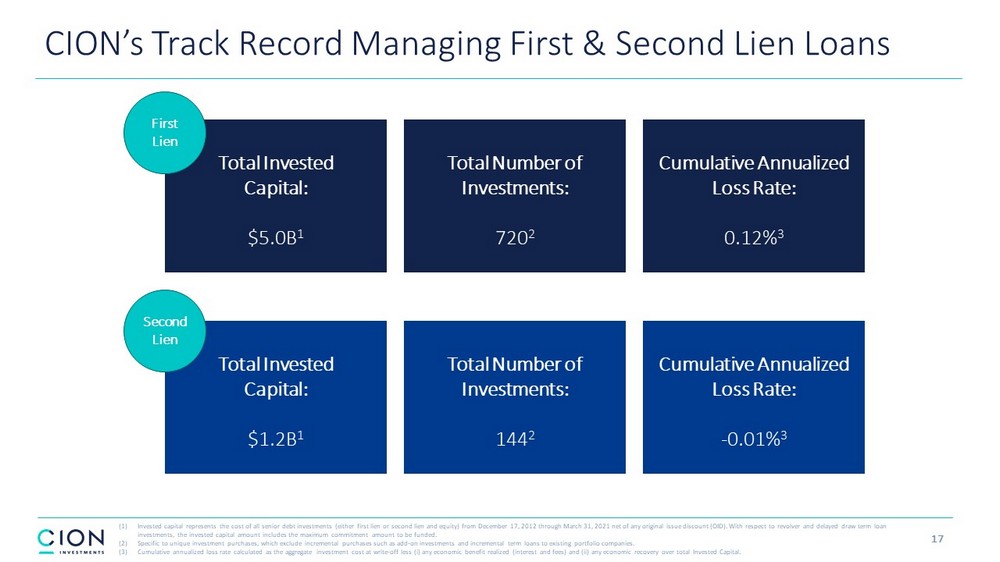
Cumulative Annualized Loss Rate: 0.12 % 3 Total Number of Investments: 720 2 Total Invested Capital: $5.0B 1 First Lien Total Number of Investments: 144 2 Cumulative Annualized Loss Rate: - 0.01% 3 Total Invested Capital: $1.2B 1 Second Lien 17 CION’s Track Record Managing First & Second Lien Loans (1) Invested capital represents the cost of all senior debt investments (either first lien or second lien and equity) from Decemb er 17, 2012 through March 31, 2021 net of any original issue discount (OID). With respect to revolver and delayed draw term loan investments, the invested capital amount includes the maximum commitment amount to be funded. (2) Specific to unique investment purchases, which exclude incremental purchases such as add - on investments and incremental term loa ns to existing portfolio companies. (3) Cumulative annualized loss rate calculated as the aggregate investment cost at write - off less (i) any economic benefit realized (interest and fees) and (ii) any economic recovery over total Invested Capital.
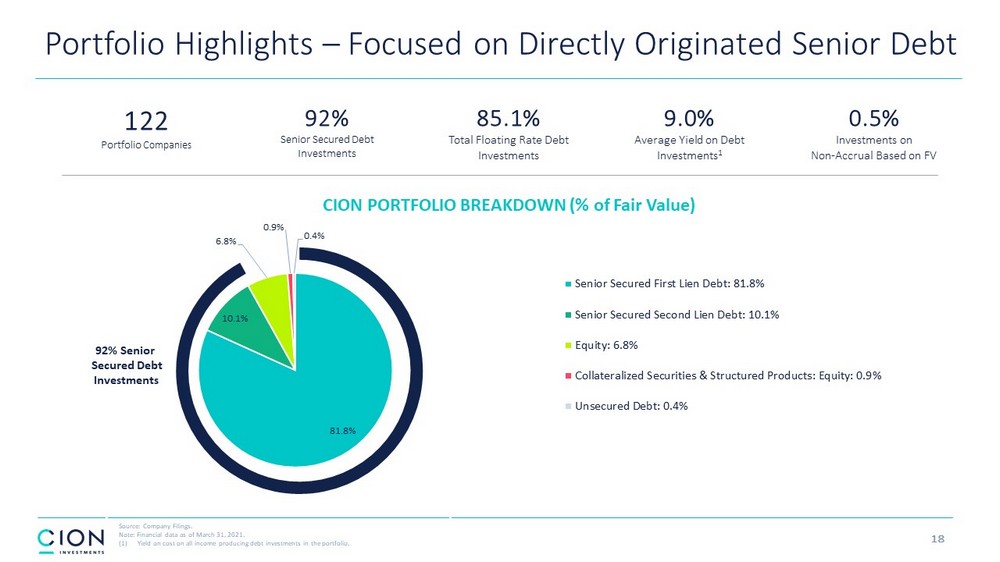
81.8% 10.1% 6.8% 0.9% 0.4% CION PORTFOLIO BREAKDOWN (% of Fair Value) Senior Secured First Lien Debt: 81.8% Senior Secured Second Lien Debt: 10.1% Equity: 6.8% Collateralized Securities & Structured Products: Equity: 0.9% Unsecured Debt: 0.4% 122 Portfolio Companies 92% Senior Secured Debt Investments 85.1% Total Floating Rate Debt Investments 9.0% Average Yield on Debt Investments 1 0.5% Investments on Non - Accrual Based on FV 18 Portfolio Highlights – Focused on Directly Originated Senior Debt Source: Company Filings. Note: Financial data as of March 31, 2021. (1) Yield on cost on all income producing debt investments in the portfolio. 92% Senior Secured Debt Investments
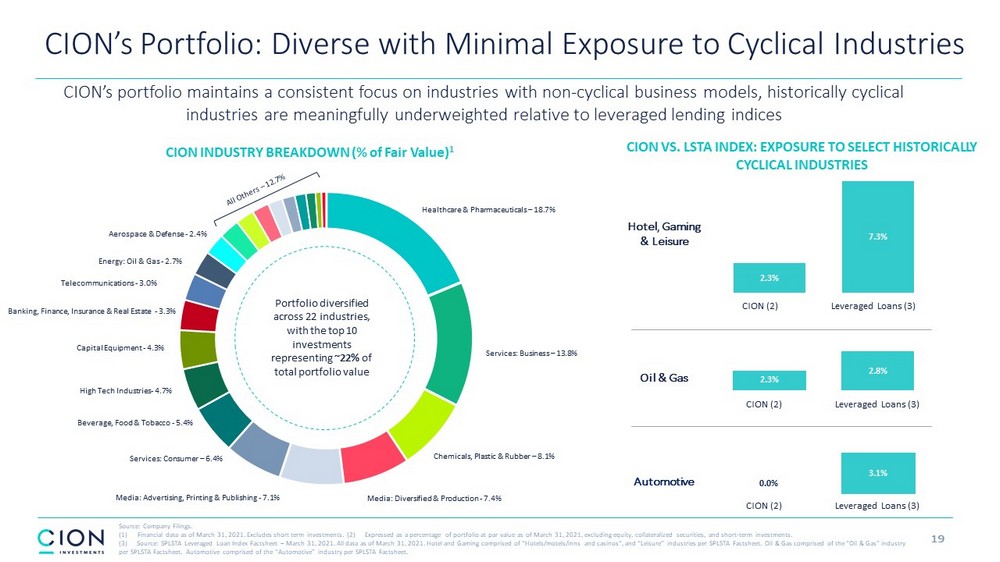
CION INDUSTRY BREAKDOWN (% of Fair Value) 1 Healthcare & Pharmaceuticals – 18.7% Services: Business – 13.8% Chemicals, Plastic & Rubber – 8.1% Media: Advertising, Printing & Publishing - 7.1% Services: Consumer – 6.4% Beverage, Food & Tobacco - 5.4% Capital Equipment - 4.3% Banking, Finance, Insurance & Real Estate - 3.3% Telecommunications - 3.0% Energy: Oil & Gas - 2.7% Aerospace & Defense - 2.4% High Tech Industries - 4.7% Portfolio diversified across 22 industries, with the top 10 investments representing ~22% of total portfolio value CION VS. LSTA INDEX: EXPOSURE TO SELECT HISTORICALLY CYCLICAL INDUSTRIES 19 CION’s Portfolio: Diverse with Minimal Exposure to Cyclical Industries Source: Company Filings. (1) Financial data as of March 31, 2021. Excludes short term investments. (2) Expressed as a percentage of portfolio at par val ue as of March 31, 2021, excluding equity, collateralized securities, and short - term investments. (3) Source: SPLSTA Leveraged Loan Index Factsheet – March 31, 2021. All data as of March 31, 2021. Hotel and Gaming compris ed of “Hotels/motels/inns and casinos”, and “Leisure” industries per SPLSTA Factsheet. Oil & Gas comprised of the “Oil & Gas” in dustry per SPLSTA Factsheet. Automotive comprised of the “Automotive” industry per SPLSTA Factsheet. 2.3% 7.3% CIC(2) Leveraged Loans (3) Hotel, Gaming & Leisure 2.3% 2.8% CIC(2) Leveraged Loans (3) Oil & Gas CION (2) Leveraged Loans (3) CION (2) Leveraged Loans (3) CION (2) Leveraged Loans (3) CION’s portfolio maintains a consistent focus on industries with non - cyclical business models, historically cyclical industries are meaningfully underweighted relative to leveraged lending indices Media: Diversified & Production - 7.4% 0.0% 3.1% Automotive