Attached files
UNITED STATES
SECURITIES AND EXCHANGE COMMISSION
Washington, D.C. 20549
FORM 10-K
[x] | ANNUAL REPORT PURSUANT TO SECTION 13 OR 15(d) OF THE SECURITIES EXCHANGE ACT OF 1934 |
For the fiscal year ended December 31, 2019
OR
[ ] | TRANSITION REPORT PURSUANT TO SECTION 13 OR 15(d) OF THE SECURITIES EXCHANGE ACT OF 1934 |
For the transition period from __________ to __________
Commission file number 000-54755
CĪON Investment Corporation | ||
(Exact name of registrant as specified in its charter) | ||
Maryland | 45-3058280 | |
(State or other jurisdiction of incorporation or organization) | (I.R.S. Employer Identification No.) | |
3 Park Avenue, 36th Floor New York, New York | 10016 | |
(Address of principal executive offices) | (Zip Code) | |
Registrant’s telephone number, including area code (212) 418-4700
Securities registered pursuant to Section 12(b) of the Act:
Title of each class | Trading Symbol(s) | Name of each exchange on which registered | ||
None | Not applicable | Not applicable | ||
Securities registered pursuant to Section 12(g) of the Act:
Common Stock, par value $0.001 per share | ||
(Title of class) | ||
Indicate by check mark if the registrant is a well-known seasoned issuer, as defined in Rule 405 of the Securities Act.
Yes [ ] No [x]
Indicate by check mark if the registrant is not required to file reports pursuant to Section 13 or Section 15(d) of the Act.
Yes [ ] No [x]
Indicate by check mark whether the registrant (1) has filed all reports required to be filed by Section 13 or 15(d) of the Securities Exchange Act of 1934 during the preceding 12 months (or for such shorter period that the registrant was required to file such reports), and (2) has been subject to such filing requirements for the past 90 days.
Yes [x] No [ ]
Indicate by check mark whether the registrant has submitted electronically every Interactive Data File required to be submitted pursuant to Rule 405 of Regulation S-T (§232.405 of this chapter) during the preceding 12 months (or for such shorter period that the registrant was required to submit such files).
Yes [ ] No [ ]
Indicate by check mark whether the registrant is a large accelerated filer, an accelerated filer, a non-accelerated filer, a smaller reporting company, or an emerging growth company. See the definitions of “large accelerated filer,” “accelerated filer,” “smaller reporting company,” and "emerging growth company" in Rule 12b-2 of the Exchange Act.
Large accelerated filer [ ] | Accelerated filer [ ] | |
Non-accelerated filer [x] | Smaller reporting company [ ] | |
Emerging growth company [ ] | ||
If an emerging growth company, indicate by check mark if the registrant has elected not to use the extended transition period for complying with any new or revised financial accounting standards provided pursuant to Section 13(a) of the Exchange Act.
[ ]
Indicate by check mark whether the registrant is a shell company (as defined in Rule 12b-2 of the Act).
Yes [ ] No [x]
There is no established market for the Registrant’s shares of common stock. The Registrant closed the public offering of its shares of common stock on January 25, 2019. The last offering price at which the Registrant issued shares in its continuous follow-on public offering was $9.40 per share. Since the Registrant closed its public offering, it has continued to issue shares pursuant to its distribution reinvestment plan, as amended and restated. The most recent price at which the Registrant has issued shares pursuant to the distribution reinvestment plan, as amended and restated, was $8.34 per share.
The number of shares of the Registrant’s common stock, $0.001 par value, outstanding as of March 13, 2020 was 113,978,282.
Documents Incorporated by Reference
Portions of the Registrant’s Definitive Proxy Statement relating to the Registrant’s 2020 Annual Meeting of Shareholders, to be filed with the Securities and Exchange Commission within 120 days following the end of the Registrant’s fiscal year, are incorporated by reference in Part III of this Annual Report on Form 10-K as indicated herein.
CĪON INVESTMENT CORPORATION
FORM 10-K
TABLE OF CONTENTS
Page | ||
PART I
Forward-Looking Statements
Some of the statements within this Annual Report on Form 10-K constitute forward-looking statements because they relate to future events or our future performance or financial condition. The forward-looking statements contained in this Annual Report on Form 10-K may include statements as to:
• | our future operating results; |
• | our business prospects and the prospects of our portfolio companies; |
• | the impact of the investments that we expect to make; |
• | the ability of our portfolio companies to achieve their objectives; |
• | our current and expected financings and investments; |
• | the adequacy of our cash resources, financing sources and working capital; |
• | the use of borrowed money to finance a portion of our investments; |
• | the timing of cash flows, if any, from the operations of our portfolio companies; |
• | our contractual arrangements and relationships with third parties; |
• | the actual and potential conflicts of interest with CION Investment Management, LLC, or CIM, and Apollo Global Management, Inc., or Apollo, and their respective affiliates; |
• | the ability of CIM's and Apollo Investment Management, L.P.'s, or AIM, a subsidiary of Apollo and a registered investment adviser under the Investment Advisers Act of 1940, as amended, or the Advisers Act, investment professionals to locate suitable investments for us and the ability of CIM to monitor and administer our investments; |
• | the ability of CIM and its affiliates to attract and retain highly talented professionals; |
• | the dependence of our future success on the general economy and its impact on the industries in which we invest; |
• | the effects of a changing interest rate environment; |
• | our ability to source favorable private investments; |
• | our tax status; |
• | the effect of changes to tax legislation and our tax position; |
• | the tax status of the companies in which we invest; and |
• | the timing and amount of distributions and dividends from the companies in which we invest. |
In addition, words such as “anticipate,” “believe,” “expect” and “intend” indicate a forward-looking statement, although not all forward-looking statements include these words. The forward-looking statements contained in this Annual Report on Form 10-K involve risks and uncertainties. Our actual results could differ materially from those implied or expressed in the forward-looking statements for any reason, including the factors set forth in “Risk Factors” in Item 1A of Part I of this Annual Report on Form 10-K. Other factors that could cause actual results to differ materially include:
• | changes in the economy; |
• | risks associated with possible disruption in our operations or the economy generally due to terrorism or natural disasters; and |
• | future changes in laws or regulations and conditions in our operating areas. |
We have based the forward-looking statements on information available to us on the date of this Annual Report on Form 10-K. Except as required by the federal securities laws, we undertake no obligation to revise or update any forward-looking statements, whether as a result of new information, future events or otherwise. You are advised to review any additional disclosures that we may make directly to you or through reports that we in the future may file with the Securities and Exchange Commission, or the SEC, including annual reports on Form 10-K, quarterly reports on Form 10-Q and current reports on Form 8-K. The forward-looking statements contained in this Annual Report on Form 10-K are excluded from the safe harbor protection provided by Section 27A of the Securities Act of 1933, as amended, or the Securities Act, and Section 21E of the Securities Exchange Act of 1934, as amended, or the Exchange Act.
1
Amounts and percentages presented herein may have been rounded for presentation and all dollar amounts, excluding share and per share amounts, are presented in thousands unless otherwise noted.
Item 1. Business
Overview
CĪON Investment Corporation, or the Company, was incorporated under the general corporation laws of the State of Maryland on August 9, 2011. When used in this Annual Report on Form 10-K, the terms “we,” “us,” “our” or similar terms refer to the Company and its consolidated subsidiaries. In addition, the term “portfolio companies” refers to companies in which we have invested, either directly or indirectly through our total return swap, or TRS (described in further detail under “Item 1. Business – Financing Arrangements – Total Return Swap” below).
We are an externally managed, non-diversified closed-end management investment company that has elected to be regulated as a business development company, or BDC, under the Investment Company Act of 1940, as amended, or the 1940 Act. We elected to be treated for federal income tax purposes as a regulated investment company, or RIC, as defined under Subchapter M of the Internal Revenue Code of 1986, as amended, or the Code.
We are managed by CIM, our affiliate and a registered investment adviser under the Advisers Act. Pursuant to an investment advisory agreement with us, CIM oversees the management of our activities and is responsible for making investment decisions for our portfolio. CIM is a joint venture between CION Investment Group, LLC, or CIG, and AIM. Pursuant to the joint venture between CIG and AIM, CIG’s investment professionals provide investment advisory services, including advice, evaluation and recommendations with respect to our investments, and AIM’s investment professionals perform certain services for CIM, which include, among other services, (i) assistance with identifying and providing information about potential investment opportunities for approval by CIM’s investment committee; and (ii) providing (a) trade and settlement support; (b) portfolio and cash reconciliation; (c) market pipeline information regarding syndicated deals, in each case, as reasonably requested by CIM; and (d) monthly valuation reports and support for all broker-quoted investments. All of our investment decisions are the sole responsibility of, and are made at the sole discretion of, CIM’s investment committee, which consists entirely of CIG senior personnel.
Our investment objective is to generate current income and, to a lesser extent, capital appreciation for investors. We seek to meet our investment objective by utilizing the experienced management team of CIM, which includes its access to the relationships and human capital of its affiliates in sourcing, evaluating and structuring transactions, as well as monitoring and servicing our investments. Our portfolio is comprised primarily of investments in senior secured debt, including first lien loans, second lien loans and unitranche loans, and, to a lesser extent, collateralized securities, structured products and other similar securities, unsecured debt and equity, of private and thinly-traded U.S. middle-market companies. See “Item 1. Business – Investment Types” below for a detailed description of the types of investments that may comprise our portfolio. We define middle-market companies as companies that generally possess annual earnings before interest, taxes, depreciation and amortization, or EBITDA, of $50 million or less, with experienced management teams, significant free cash flow, strong competitive positions and potential for growth.
In addition, we may from time to time invest up to 30% of our assets opportunistically in other types of investments, including collateralized securities, structured products and other similar securities and the securities of larger public companies and foreign securities, which may be deemed “non-qualifying assets” for the purpose of complying with investment restrictions under the 1940 Act. See “Item 1. Business - Qualifying Assets” below.
In connection with our debt investments, we may receive equity interests such as warrants or options as additional consideration. We may also purchase equity interests in the form of common or preferred stock in our target companies, either in conjunction with one of our debt investments or through a co-investment with a financial sponsor. We expect that our investments will generally range between $5 million and $50 million each, although investments may vary as the size of our capital base changes and will ultimately be at the discretion of CIM subject to oversight by our board of directors. We have made and intend to make smaller investments in syndicated loan opportunities, which typically include investments in companies with annual EBITDA of greater than $50 million, subject to liquidity and diversification constraints.
To enhance our opportunity for gain, we employ leverage as market conditions permit and at the discretion of CIM. On March 23, 2018, an amendment to Section 61(a) of the 1940 Act was signed into law to permit BDCs to reduce the minimum “asset coverage” ratio to 150% from 200% and, as a result, to potentially increase the ratio of a BDC's debt to equity to a maximum of 2-to-1 from a maximum of 1-to-1, so long as certain approval and disclosure requirements are satisfied. We currently have not determined whether to seek to utilize such additional leverage. For purposes of the asset coverage ratio test applicable to us as a BDC, we treated the outstanding notional amount of the TRS, less the total amount of cash collateral posted by Flatiron Funding, LLC, or Flatiron, under the TRS, as a senior security for the life of that instrument.
2
Portfolio and Investment Activity
As of December 31, 2019, we engaged in the direct purchase of debt securities primarily issued by portfolio companies and lend directly to portfolio companies. The following table summarizes the composition of our investment portfolio at amortized cost and fair value as of December 31, 2019:
December 31, 2019 | |||||||||||
Investments Cost(1) | Investments Fair Value | Percentage of Investment Portfolio | |||||||||
Senior secured first lien debt | $ | 1,388,942 | $ | 1,351,767 | 77.9 | % | |||||
Senior secured second lien debt | 264,280 | 248,253 | 14.3 | % | |||||||
Collateralized securities and structured products - debt | 7,212 | 7,212 | 0.4 | % | |||||||
Collateralized securities and structured products - equity | 16,476 | 14,182 | 0.8 | % | |||||||
Unsecured debt | 4,901 | 4,900 | 0.3 | % | |||||||
Equity | 115,738 | 109,231 | 6.3 | % | |||||||
Subtotal/total percentage | 1,797,549 | 1,735,545 | 100.0 | % | |||||||
Short term investments(2) | 29,527 | 29,527 | |||||||||
Total investments | $ | 1,827,076 | $ | 1,765,072 | |||||||
Number of portfolio companies | 136 | ||||||||||
Purchased at a weighted average price of par | 97.68 | % | |||||||||
Gross annual portfolio yield based upon the purchase price(3) | 9.33 | % | |||||||||
(1) | Represents amortized cost for debt investments and cost for equity investments. Amortized cost represents the original cost adjusted for the amortization of premiums and/or accretion of discounts, as applicable, on our investments. |
(2) | Short term investments represent an investment in a fund that invests in highly liquid investments with average original maturity dates of three months or less. |
(3) | The gross annual portfolio yield does not represent and may be higher than an actual investment return to shareholders because it excludes our expenses and all sales commissions and dealer manager fees and does not consider the cost of leverage. |
As a BDC, we are subject to certain regulatory restrictions in negotiating or investing in certain investments with entities with which we may be prohibited from doing so under the 1940 Act, such as CIM and its affiliates, unless we obtain an exemptive order from the SEC. Furthermore, we are subject to certain regulatory restrictions on investing with AIM and its affiliates in transactions where AIM or its affiliates negotiate terms other than price on our behalf. We are limited in our ability to engage in co-investment transactions with AIM and its affiliates and CIM and its affiliates without exemptive relief from the SEC. Even if we receive exemptive relief, CIM’s investment committee may determine that we should not participate in a co-investment transaction.
Status of Our Continuous Public Offerings
On December 17, 2012, we met our minimum offering requirement of $2,500 in capital raised from persons not affiliated with us, admitted our initial public investors as shareholders and officially commenced operations. Our initial continuous public offering ended on December 31, 2015, and our follow-on continuous public offering commenced on January 25, 2016 and ended on January 25, 2019, the date on which we closed the public offering of our shares. Since commencing our initial continuous public offering on July 2, 2012 and through March 13, 2020, we sold 113,978,282 shares of common stock for corresponding net proceeds of $1,160,273 at an average price per share of $10.18, including shares purchased by our affiliates. The net proceeds received include gross proceeds received from reinvested shareholder distributions of $203,673 pursuant to our distribution reinvestment plan, as amended and restated, for which we issued 22,713,950 shares of common stock, and gross proceeds paid for shares of common stock tendered for repurchase of $198,686 pursuant to our share repurchase program, for which we repurchased 22,227,413 shares of common stock.
3
Distributions
In January 2013, we began authorizing monthly distributions to our shareholders. On February 1, 2014, we changed from semi-monthly closings to weekly closings for the sale of our shares. As a result, from February 1, 2014 through July 17, 2017, our board of directors authorized and declared on a monthly basis a weekly distribution amount per share of our common stock. On July 18, 2017, our board of directors authorized and declared on a quarterly basis a weekly distribution amount per share of our common stock. Effective September 28, 2017, our board of directors delegated to management the authority to determine the amount, record dates, payment dates and other terms of distributions to shareholders, which will be ratified by our board of directors, each on a quarterly basis. Subject to our board of directors’ discretion and applicable legal restrictions, our management intends to continue to authorize and declare, and our board of directors intends to continue to ratify, each on a quarterly basis, a weekly distribution amount per share of our common stock. Declared distributions are paid monthly.
Our board of directors declared or ratified distributions for 53, 52 and 52 record dates during each of the years ended December 31, 2019, 2018 and 2017, respectively. The following table presents cash distributions per share that were declared during the years ended December 31, 2019, 2018 and 2017:
Distributions | ||||||||
Three Months Ended | Per Share | Amount | ||||||
2017 | ||||||||
March 31, 2017 (thirteen record dates) | $ | 0.1829 | $ | 20,123 | ||||
June 30, 2017 (thirteen record dates) | 0.1829 | 20,371 | ||||||
September 30, 2017 (thirteen record dates) | 0.1829 | 20,644 | ||||||
December 31, 2017 (thirteen record dates) | 0.1829 | 20,923 | ||||||
Total distributions for the year ended December 31, 2017 | $ | 0.7316 | $ | 82,061 | ||||
2018 | ||||||||
March 31, 2018 (thirteen record dates) | $ | 0.1829 | $ | 21,002 | ||||
June 30, 2018 (thirteen record dates) | 0.1829 | 21,004 | ||||||
September 30, 2018 (thirteen record dates) | 0.1829 | 20,776 | ||||||
December 31, 2018 (thirteen record dates) | 0.1829 | 20,701 | ||||||
Total distributions for the year ended December 31, 2018 | $ | 0.7316 | $ | 83,483 | ||||
2019 | ||||||||
March 31, 2019 (thirteen record dates) | $ | 0.1829 | $ | 20,772 | ||||
June 30, 2019 (thirteen record dates) | 0.1829 | 20,801 | ||||||
September 30, 2019 (thirteen record dates) | 0.1829 | 20,798 | ||||||
December 31, 2019 (fourteen record dates) | 0.1969 | 22,401 | ||||||
Total distributions for the year ended December 31, 2019 | $ | 0.7456 | $ | 84,772 | ||||
On December 18, 2019, our co-chief executive officers (i) revised the record date for the weekly cash distributions covering the final week of December 2019; (ii) revised the payment date for the weekly cash distributions covering the entire month of December 2019; and (iii) declared regular weekly cash distributions of $0.014067 per share for January 2020 through March 2020. Each distribution was paid or will be paid monthly to shareholders of record as of the weekly record dates set forth below.
4
Record Date | Payment Date | Distribution Amount Per Share | ||
December 3, 2019 | December 27, 2019 | $0.014067 | ||
December 10, 2019 | December 27, 2019 | $0.014067 | ||
December 17, 2019 | December 27, 2019 | $0.014067 | ||
December 24, 2019 | December 27, 2019 | $0.014067 | ||
December 26, 2019 | December 27, 2019 | $0.014067 | ||
January 7, 2020 | January 29, 2020 | $0.014067 | ||
January 14, 2020 | January 29, 2020 | $0.014067 | ||
January 21, 2020 | January 29, 2020 | $0.014067 | ||
January 28, 2020 | January 29, 2020 | $0.014067 | ||
February 4, 2020 | February 26, 2020 | $0.014067 | ||
February 11, 2020 | February 26, 2020 | $0.014067 | ||
February 18, 2020 | February 26, 2020 | $0.014067 | ||
February 25, 2020 | February 26, 2020 | $0.014067 | ||
March 3, 2020 | March 27, 2020 | $0.014067 | ||
March 10, 2020 | March 27, 2020 | $0.014067 | ||
March 17, 2020 | March 27, 2020 | $0.014067 | ||
March 24, 2020 | March 27, 2020 | $0.014067 | ||
March 26, 2020 | March 27, 2020 | $0.014067 | ||
About CIM
CIM is a registered investment adviser and our affiliate. CIM is a joint venture between CIG and AIM and part of the CION Investments group of companies, or CION Investments. We believe that CION Investments is a leading manager of alternative investment solutions that focuses on alternative credit strategies for individual investors. CION Investments is headquartered in New York, with an office in Boston.
Mark Gatto and Michael A. Reisner, together with Keith S. Franz, Gregg A. Bresner and Stephen Roman, form the senior management team of CIM. Both Messrs. Gatto and Reisner have significant managerial and investing experience and serve as our co-chairmen and co-chief executive officers.
CIM’s senior management team has extensive experience in lending to private U.S. middle-market companies and has developed an expertise in using all levels of a firm’s capital structure to produce income-generating investments, focusing on risk management and delivering risk-adjusted returns that typically are collateralized by a company’s business-essential equipment or corporate infrastructure.
About CION Investments
With more than 30 years of experience in the alternative asset management industry, CION Investments, through its managed funds, provides direct secured financing to private and public companies worldwide primarily in industries such as marine, manufacturing, transportation, automotive, energy and power, telecommunications, industrial and mining. CION Investments provides distribution services as well through CION Securities, LLC, or CION Securities, one of our affiliates.
Pursuant to an administration agreement, through March 31, 2018, ICON Capital, LLC, or ICON Capital, furnished us with office facilities and equipment, and clerical, bookkeeping and record keeping services. ICON Capital also oversaw our financial records and prepared our reports to shareholders and reports filed with the SEC. ICON Capital also performed the calculation and publication of our net asset value, and oversaw the preparation and filing of our tax returns, the payment of our expenses and the performance of various third party service providers. Furthermore, ICON Capital provided on our behalf managerial assistance to those portfolio companies to which we were required to provide such assistance.
On April 1, 2018, we entered into an administration agreement with CIM for the purpose of replacing ICON Capital with CIM as our administrator pursuant to the terms of the administration agreement. No other material terms of the administration agreement with ICON Capital were amended in connection with the administration agreement with CIM. On November 5, 2019, our board of directors, including a majority of the board of directors who are not interested persons, approved the renewal of the administration agreement with CIM for a period of twelve months commencing December 17, 2019.
5
About AIM
We believe that AIM possesses skills that will aid us in achieving our investment objective.
AIM is a subsidiary of Apollo (NYSE: APO) and is the investment adviser to Apollo Investment Corporation (NASDAQ: AINV), or AINV. AINV is a publicly traded BDC that invests primarily in various forms of debt investments, including secured and unsecured loan investments and/or equity in private U.S. middle-market companies.
Pursuant to the joint venture between CIG and AIM, AIM’s investment professionals perform certain services for CIM, which include, among other services, (i) assistance with identifying and providing information about potential investment opportunities for approval by CIM’s investment committee; and (ii) providing (a) trade and settlement support; (b) portfolio and cash reconciliation; (c) market pipeline information regarding syndicated deals, in each case, as reasonably requested by CIM; and (d) monthly valuation reports and support for all broker-quoted investments.
Market Opportunity
We believe that the market for lending to private U.S. middle-market companies continues to present a compelling investment opportunity. CIM’s management team has witnessed significant demand for debt capital among middle-market companies that have the characteristics we target. We believe that this demand, coupled with the fragmented availability of funding within our target market, will enable us to achieve favorable transaction pricing. We believe that the following characteristics and market trends support our belief:
•The middle-market is a large addressable market. According to GE Capital’s National Center for the Middle Market 4th Quarter 2019 Middle Market Indicator, there are approximately 200,000 U.S. middle-market companies employing approximately 47.9 million people. The U.S. middle-market accounts for approximately one-third of private sector gross domestic product, or GDP, which, measured on a global scale, would be the third largest global economy. GE defines middle-market companies as those with $10 million to $1 billion in annual revenue, which we believe has significant overlap with our definition of middle-market companies that generally possess EBITDA of $50 million or less.
•Greater demand for non-traditional sources of debt financing. We believe that commercial banks in the U.S., which have traditionally been the primary source of capital to middle-market companies, have experienced consolidation, capital impairments and stricter regulatory scrutiny. Consequently, we believe there is an increasing trend for middle-market companies to seek financing from other sources, such as us.
•Disruptions within the credit markets have reduced middle-market companies’ access to the capital markets for senior debt. While many middle-market companies were previously able to raise senior debt financing through traditional large financial institutions, we believe this approach to financing will become more difficult as implementation of U.S. and international financial reforms, such as Basel 3, are expected to limit the capacity of large financial institutions to hold loans of middle-market companies on their balance sheets.
•There is a large pool of uninvested private equity capital likely to seek additional senior debt capital to finance strategic transactions. We expect that middle-market private equity firms will continue to invest the approximately $778 billion raised since 2010 in middle-market companies, as reported in Pitchbook’s 3Q 2019 U.S. PE Middle Market Report, and that these private equity firms will seek to support their investments with senior loans from other sources, such as us.
•Specialized lending and unfunded private equity commitments drive demand for debt capital. Lending to small- and middle-market companies requires in-depth diligence, credit expertise, structuring experience and active portfolio management. In addition, middle-market companies may require more active monitoring and participation on the lender’s part. As such, we believe that, of the U.S. financial institutions that are not liquidity constrained, few are capable of pursuing a sustained lending strategy successfully. We believe this creates a significant supply/demand imbalance for small and middle-market credit. We also expect that private equity firms will continue to pursue acquisitions and will seek to leverage their equity investments with debt financing, including senior debt, unitranche debt, and mezzanine loans provided by companies such as ours. Historically, according to the S&P LCD Leveraged Lending Review, such leverage has represented approximately 62% of a private equity acquisition. Therefore, adding to the imbalance in the availability of credit is the significant amount of unallocated private equity capital raised since 2010 described above, much of which will require debt financing in the coming years. As depicted in the chart below, almost $1.25 trillion of unfunded private equity commitments were outstanding through the second quarter of 2019 (Source: Pitchbook's 2019 Annual Private Fund Strategies Report).
6
U.S. PE Capital Overhang ($B) by Year
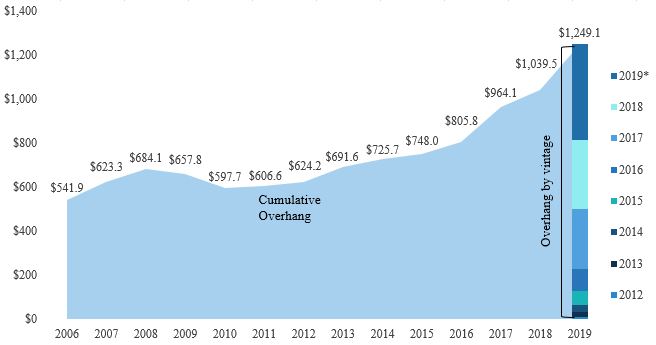
* As of 6/30/2019
•Active private equity focus on small- and middle-market firms. Private equity firms have continued their active roles investing in small- and middle-market companies, and CIM expects this trend to continue. Private equity funds often seek to leverage their investments by combining equity capital with senior secured and mezzanine loans from other sources. Thus, we believe that significant private equity investment in middle-market firms will create substantial investment opportunities for us to fill the role of leverage provider. We believe that the network of relationships between CIM’s senior management team, Apollo’s management team and the private equity community will be a key channel through which we will seek to access significant investment opportunities.
•Middle-market companies compared to larger companies. We believe that middle-market companies compare favorably to larger companies with respect to our investment objective and strategy. According to the GE Capital 2012 National Middle Market Summit Report, almost 70% of middle-market companies were in business for more than 20 years and were, on average, less financially leveraged than large companies. During the economic downturn from 2007 to 2010, surviving middle-market companies created more than two million jobs, as compared to nearly four million jobs eliminated by larger companies.
•Attractive market segment. We believe that the underserved nature of such a large segment of the market can at times create a significant opportunity for investment. In particular, we believe that middle-market companies are more likely to offer attractive economics in terms of transaction pricing (including higher debt yields), upfront and ongoing fees, prepayment penalties and more attractive security features in the form of stricter covenants and quality collateral. In addition, as compared to larger companies, middle-market companies often have simpler capital structures and carry less leverage, thus aiding the structuring and negotiation process and allowing us greater flexibility in structuring favorable transactions.
7
Average Nominal Spread of Leveraged Loans1
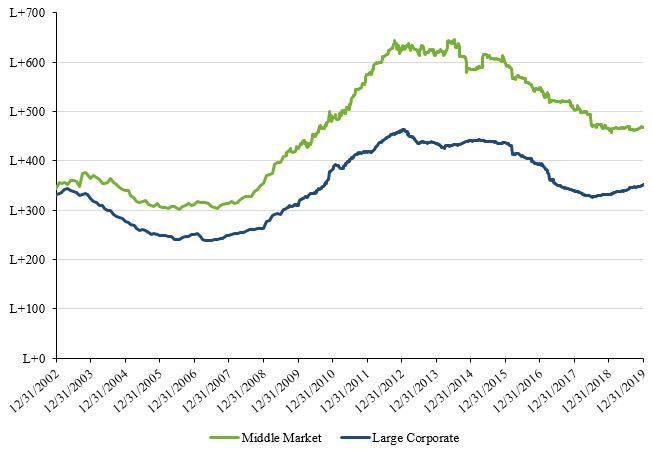
1 Excludes all facilities in default.
Source: S&P Capital IQ LCD and S&P/LSTA Leveraged Loan Index.
8
Average Discounted Spread of Leveraged Loans2
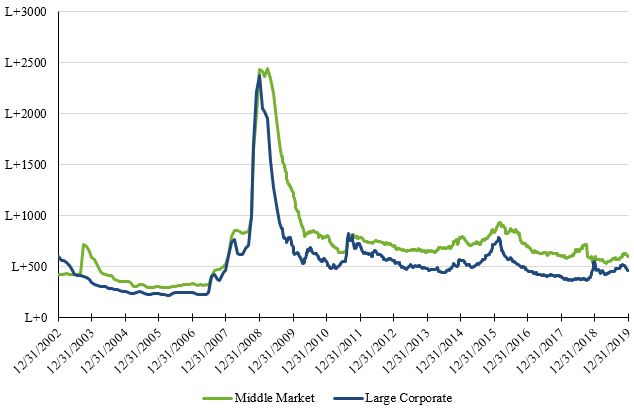
2 Excludes all facilities in default.
Spread calculations have been adjusted to be based off of the bid rather than par (that is assuming that the discounted margin is as a percent of the current market value rather than the par amount of the loan).
Source: S&P Capital IQ LCD and S&P/LSTA Leveraged Loan Index.
Characteristics of and Risks Related to Investments in Private Companies
We have invested and continue to invest primarily in the debt of privately held companies. Investments in private companies pose significantly greater risks as compared to investments in public companies. First, private companies have reduced access to the capital markets, resulting in diminished capital resources and ability to withstand financial distress. Second, the investments themselves are often illiquid. As such, we may have difficulty exiting an investment promptly or at a desired price prior to maturity or outside of a normal amortization schedule. In addition, little public information generally exists about private companies. Finally, these companies often do not have third-party debt ratings or audited financial statements. We must therefore rely on the ability of CIM to obtain adequate information through their due diligence efforts to evaluate the creditworthiness of, and risks involved with, investing in these companies. These companies and their financial information will also generally not be subject to the Sarbanes-Oxley Act of 2002, as amended, or the Sarbanes-Oxley Act, and other rules and regulations that govern public companies that are designed to protect investors.
Investment Strategy
When evaluating an investment, we use the resources of CIM to develop an investment thesis and a proprietary view of a potential company’s value. When identifying prospective portfolio companies, we focus primarily on the following attributes, which we believe will help us generate higher total returns with an acceptable level of risk. These attributes are:
•Leading, defensible market positions that present attractive growth opportunities. We seek to invest in companies that we believe possess advantages in scale, scope, customer loyalty, product pricing or product quality versus their competitors, minimizing sales risk and protecting profitability.
•Companies with leading market positions and strong free cash flows. We seek to invest in the debt of companies that have a leading market position or other significant competitive advantages and significant free cash flow. We believe that such companies are able to maintain consistent cash flow to service and repay our loans and maintain growth or market share.
9
•Investing in middle-market, private companies. We seek to invest in middle-market, private companies that generally possess annual EBITDA of $50 million or less at the time of investment. We do not intend to invest in start-up companies, turnaround situations or companies with speculative business plans.
•Proven management teams with meaningful equity ownership. We focus on investments in which the target company has an experienced management team with an established track record of success. We typically require the portfolio companies to have in place proper incentives to align management’s goals with ours. Generally, we focus on companies in which the management teams have significant equity interests.
•Private equity sponsorship. Often we seek to participate in transactions sponsored by what we believe to be high-quality private equity firms. CIM’s management team believes that a private equity sponsor’s willingness to invest significant sums of equity capital into a company provides an additional level of due diligence investigation and is an implicit endorsement of the quality of the investment. Further, by co-investing with quality private equity firms that commit significant sums of equity capital with junior priority to our debt investments, we may benefit from having due diligence on our investments performed by both parties. Further, strong private equity sponsors with significant investments at risk have the ability and a strong incentive to contribute additional capital in difficult economic times should operational or financial issues arise.
•Broad portfolio. We seek to create a portfolio of companies engaged in a variety of industries and located in a variety of geographic locations, thereby potentially reducing the risk of a downturn in any one industry or geographic location having a disproportionate impact on the value of our portfolio. We are not a “diversified company” as such term is defined under the 1940 Act. Because we are a BDC, we focus on and invest at least 70% of our total assets in U.S. companies, but seek to maintain investments across the various geographic regions of the U.S. To the extent that we invest in foreign companies, we intend to do so in accordance with the limitations under the 1940 Act and only in jurisdictions with established legal frameworks and a history of respecting creditor rights, including the United Kingdom and countries that are members of the European Union, as well as Canada, Australia and Japan. We cannot assure investors that we will be successful in our efforts to maintain a broad portfolio of investments.
•Viable exit strategy. We focus our investment activity primarily in companies whose business models and growth prospects offer attractive exit possibilities, including repayment of our investments, with the potential for capital gain on any equity interest we hold through an initial public offering of common stock, a merger, a sale or other recapitalization.
Moreover, we may acquire investments in the secondary loan market, and, in analyzing such investments, we will employ the same analytical process that we use for our primary investments.
Potential Competitive Advantages
We believe that we offer to our investors the following potential competitive advantages over other capital providers to private U.S. middle-market companies:
•Proven ability to invest in middle-market companies. We believe that CIM has proven its ability to source, structure and manage private investments for us. In addition to its ability to call on its resources, CIM is able to draw upon Apollo’s team of more than 450 investment professionals that have approximately $331 billion of total assets under management as of December 31, 2019. Apollo has developed an expertise in sourcing and investing in debt issued by middle-market companies. We leverage this expertise, which we believe enables us to make investments that offer the most favorable risk/reward characteristics.
•Global platform with seasoned investment professionals. CIM’s senior management team believes that the breadth and depth of its experience, together with the wider resources of the Apollo investment team, who source, structure, execute, monitor and realize upon a broad range of private investments on behalf of Apollo, as well as the specific expertise of Apollo in the BDC arena, provides us with a significant competitive advantage in sourcing attractive investment opportunities worldwide.
•Long-term investment horizon. We believe that our flexibility to make investments with a long-term view provides us with the opportunity to generate favorable returns on invested capital and expands the types of investments that we may consider. The long-term nature of our capital structure helps us avoid disposing of assets at unfavorable prices and we believe makes us a better partner for portfolio companies.
•Transaction sourcing capability. CIM seeks to identify attractive investment opportunities both through active origination channels and through its long-term relationships with Apollo, numerous corporate and fund management teams, members of the financial community and potential corporate partners. We also have access to the experience of CIM’s officers in sourcing middle-market transactions through such persons’ network of originators and underwriters. In addition, CIM seeks to leverage Apollo’s significant access to transaction flow. We believe that the broad networks of CIM and its affiliates will produce a significant amount of investment opportunities for us.
10
•Disciplined, income-oriented investment philosophy. CIM employs a defensive investment approach focused on long-term credit performance and principal protection. This investment approach involves a multi-stage selection process for each investment opportunity as well as ongoing monitoring by CIM of each investment made, with particular emphasis on early detection of credit deterioration. This strategy is designed to maximize current yield and minimize the risk of capital loss while maintaining potential for long-term capital appreciation.
•Ability to utilize a wide range of transaction structures. We believe that each of CIM’s and Apollo’s broad expertise and experience in transaction structuring at all levels of a company’s capital structure affords us numerous tools to manage risk while preserving the opportunity for returns on investments. We attempt to capitalize on this expertise in an effort to produce an investment portfolio that will perform in a broad range of economic conditions. In addition, we believe that the ability to offer several forms of financing makes us an attractive provider of capital to prospective portfolio companies. Such flexible transaction structuring allows a prospective portfolio company to forego the substantial cost of conducting multiple negotiations and undergoing multiple due diligence processes to secure the different types of capital it requires.
Investment Types
There are a number of investment types corresponding to a company’s capital structure. Typically, investors determine the appropriate type of investment based upon their risk and return requirements. Below is a diagram illustrating where these investments lie in a typical target company’s capital structure. First lien debt is situated at the top of the capital structure, and typically has the first claim on the assets and cash flows of the company, followed by second lien debt, mezzanine debt, preferred equity and finally common equity. Due to this priority of cash flows and claims on assets, an investment’s risk increases as it moves further down the capital structure. Investors are usually compensated for this risk associated with junior status in the form of higher returns, either through higher interest payments or potentially higher capital appreciation.
We focus primarily on investments in senior secured debt, including first lien loans, second lien loans and unitranche loans, and, to a lesser extent, collateralized securities, structured products and other similar securities, unsecured debt, including corporate bonds and long-term subordinated loans, referred to as mezzanine loans, and equity. The mix of investments in our portfolio and other aspects regarding the implementation of our strategy may change materially over time.
CIM seeks to tailor our investment focus as market conditions evolve. Depending on market conditions and other factors, we may, as noted above, increase or decrease our exposure to less senior portions of the capital structure, where returns tend to be stronger in a more stable or growing economy, but less secure in weak economic environments. We rely on CIM’s experience to structure investments, potentially using all levels of the capital structure, which we believe will perform in a broad range of economic environments.
Typical Leveraged Capital Structure Diagram
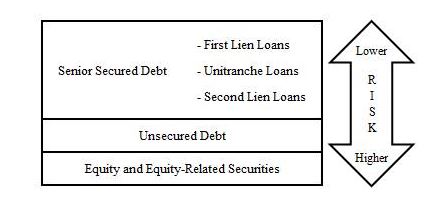
Senior Secured Debt
First Lien Loans
First lien secured loans are situated at the top of the capital structure. Because these loans have priority in payment, they carry the least risk among all investments in a company. Generally, our first lien secured loans are expected to have maturities of three to seven years, offer some form of amortization, and have first priority security interests in the assets of the borrower. We expect that our first lien secured loans typically will have variable interest rates ranging between 4.0% and 9.0% over a standard benchmark, such as the prime rate or the London InterBank Offered Rate, or LIBOR. In some cases, a portion of the total interest may accrue or be paid in kind.
11
Unitranche Loans
Unitranche loans provide all of the debt needed to finance a leveraged buyout or other corporate transaction, both senior and subordinated, but generally in a first lien position, while the borrower generally pays a blended, uniform interest rate rather than different rates for different tranches. Unitranche loans generally require payments of both principal and interest throughout the life of the loan. Unitranche loans generally have contractual maturities of five to six years and interest is generally paid quarterly. Generally, we expect these securities to carry a blended yield that is between first lien secured and subordinated debt interest rates. Unitranche loans provide a number of advantages for borrowers, including the following: simplified documentation, greater certainty of execution and reduced decision-making complexity throughout the life of the loan. In addition, we may receive additional returns from any warrants we may receive in connection with these investments. In some cases, a portion of the total interest may accrue or be paid in kind.
Second Lien Loans
Second lien secured loans are immediately junior to first lien secured loans and have substantially the same maturities, collateral and covenant structures as first lien secured loans. Second lien secured loans, however, are granted a second priority security interest in the assets of the borrower. In return for this junior ranking, second lien secured loans generally offer higher returns compared to first lien secured debt. These higher returns come in the form of higher interest and in some cases the potential for equity participation through warrants, though to a lesser extent than with mezzanine loans. Generally, we expect these loans to carry a fixed rate of 10.0% to 13.0% or a floating current yield of 7.0% to 12.0% over the prime rate or LIBOR. In addition, we may receive additional returns from any warrants we may receive in connection with these investments. In some cases, a portion of the total interest may accrue or be paid in kind.
Unsecured Debt
In addition to first lien loans and second lien loans, we also may invest a portion of our assets in unsecured debt, including corporate bonds and subordinated debt. Unsecured debt investments usually rank junior in priority of payment to first lien loans and second lien loans, but are situated above preferred equity and common stock in the capital structure. In return for their junior status compared to first lien loans and second lien loans, unsecured debt investments typically offer higher returns through both higher interest rates and possible equity ownership in the form of warrants, enabling the lender to participate in the capital appreciation of the borrower. These warrants typically require only a nominal cost to exercise. We intend to generally target unsecured debt with interest-only payments throughout the life of the security, with the principal due at maturity. Typically, unsecured debt investments have maturities of five to ten years. Generally, we expect these securities to carry a fixed rate of 10% to 15%. In addition, we may receive additional returns from any warrants we may receive in connection with these investments. In some cases, a portion of the total interest may accrue or be paid in kind.
Collateralized Securities, Structured Products and Other
We may also invest in collateralized securities, structured products and other similar securities, which may include collateralized debt obligations, or CDOs, collateralized bond obligations, or CBOs, collateralized loan obligations, or CLOs, structured notes and credit-linked notes. These investments may be structured as trusts or other types of pooled investment vehicles. They may also involve the deposit with or purchase by an entity of the underlying investments and the issuance by that entity of one or more classes of securities backed by, or representing interests in, the underlying investments or referencing an indicator related to such investments. CDOs, CBOs and CLOs are types of asset-backed securities issued by special purpose vehicles created to reapportion the risk and return characteristics of a pool of assets. The underlying pool for a CLO, for example, may include domestic and foreign senior loans, senior unsecured loans and subordinate corporate loans.
Equity and Equity-Related Securities
While we intend to maintain our focus on investments in debt securities, from time to time, when we see the potential for significant gains, or in connection with securing particularly favorable terms in a debt investment, we may make non-control investments in preferred or common equity, typically in conjunction with a private equity sponsor we believe to be of high quality. Alternatively, we may hold equity-related securities consisting primarily of warrants or other equity interests generally obtained in connection with our unsecured debt investments. In the future, we may achieve liquidity through a merger or acquisition of a portfolio company, a public offering of a portfolio company’s stock or by exercising our right, if any, to require a portfolio company to repurchase the equity-related securities we hold. With respect to any preferred or common equity investments, we expect to target an annual investment return of at least 20%.
Non-U.S. Securities
We may invest in non-U.S. securities, which may include securities denominated in U.S. dollars or in non-U.S. currencies, to the extent permitted by the 1940 Act.
12
Cash and Cash Equivalents
We may maintain a certain level of cash or equivalent instruments to make follow-on investments if necessary in existing portfolio companies or to take advantage of new opportunities.
Comparison of Targeted Debt Investments to Corporate Bonds
Loans to private companies are debt instruments that can be compared to corporate bonds to aid an investor’s understanding. As with corporate bonds, loans to private companies can range in credit quality depending on security-specific factors, including total leverage, amount of leverage senior to the security in question, variability in the issuer’s cash flows, the quality of assets securing debt and the degree to which such assets cover the subject company’s debt obligations. As is the case in the corporate bond market, we will require greater returns for securities that we perceive to carry increased risk. The companies in which we invest may be leveraged, often as a result of leveraged buyouts or other recapitalization transactions, and, in certain cases, will not be rated by national rating agencies. We believe that our targeted debt investments typically will carry ratings from a nationally recognized statistical ratings organization, or NRSRO, and that such ratings generally will be below investment grade (rated lower than “Baa3” by Moody’s or lower than “BBB-” by S&P). To the extent we make unrated investments, we believe that such investments would likely receive similar ratings if they were to be examined by an NRSRO. Compared to below-investment grade corporate bonds that are typically available to the public, our targeted first lien secured and second lien secured loan investments are higher in the capital structure, have priority in receiving payment, are secured by the issuer’s assets, allow the lender to seize collateral if necessary, and generally exhibit higher rates of recovery in the event of default. Corporate bonds, on the other hand, are often unsecured obligations of the issuer.
The market for loans to private companies possesses several key differences compared to the corporate bond market. For instance, due to a possible lack of debt ratings for certain middle market firms, and also due to the reduced availability of information for private companies, investors must conduct extensive due diligence investigations before committing to an investment. This intensive due diligence process gives the investor significant access to management, which is often not possible in the case of corporate bondholders, who rely on underwriters, debt rating agencies and publicly available information for due diligence reviews and monitoring of corporate issuers. While holding these investments, private debt investors often receive monthly or quarterly updates on the portfolio company’s financial performance, along with possible representation on the company’s board of directors, which allows the investor to take remedial action quickly if conditions happen to deteriorate. Due to reduced liquidity, the relative scarcity of capital and extensive due diligence and expertise required on the part of the investor, we believe that private debt securities typically offer higher returns than corporate bonds of equivalent credit quality.
Operating and Regulatory Structure
Our investment activities are managed by CIM and supervised by our board of directors, a majority of whom are independent. Pursuant to our investment advisory agreement, we pay CIM an annual base management fee based on our gross assets as well as incentive fees based on our performance.
On July 11, 2017, the members of CIM entered into the third amended and restated limited liability company agreement of CIM, or the Third Amended CIM LLC Agreement, for the purpose of creating a joint venture between AIM and CIG. Under the Third Amended CIM LLC Agreement, AIM became a member of CIM and was issued a newly-created class of membership interests in CIM pursuant to which AIM, among other things, shares in the profits, losses, distributions and expenses of CIM with the other members in accordance with the terms of the Third Amended CIM LLC Agreement, which results in CIG and AIM each owning a 50% economic interest in CIM.
On July 10, 2017, our independent directors unanimously approved the termination of the investment sub-advisory agreement with AIM, effective as of July 11, 2017. Although the investment sub-advisory agreement and AIM's engagement as our investment sub-adviser were terminated, AIM's investment professionals continue to perform certain services for CIM and our company, including, without limitation, identifying investment opportunities for approval by CIM’s investment committee. AIM is not paid a separate fee in exchange for such services, but is entitled to receive distributions as a member of CIM as described above.
On December 4, 2017, the members of CIM entered into the fourth amended and restated limited liability company agreement of CIM, or the Fourth Amended CIM LLC Agreement. Under the Fourth Amended CIM LLC Agreement, AIM’s investment professionals perform certain services for CIM, which include, among other services, (i) assistance with identifying and providing information about potential investment opportunities for approval by CIM’s investment committee; and (ii) providing (a) trade and settlement support; (b) portfolio and cash reconciliation; (c) market pipeline information regarding syndicated deals, in each case, as reasonably requested by CIM; and (d) monthly valuation reports and support for all broker-quoted investments.
Pursuant to an administration agreement, CIM provides us with general ledger accounting, fund accounting, investor relations, employee compensation and benefit-related services, and other administrative services. In addition, we have contracted with U.S. Bancorp Fund Services, LLC to provide additional accounting and administrative services.
As a BDC, we are required to comply with certain regulatory requirements. Also, while we are permitted to finance investments using debt, our ability to use debt is limited in certain significant respects pursuant to the 1940 Act. Within the limits of existing regulation, we will adjust our use of debt, according to market conditions, to the level we believe will allow us to generate maximum risk-adjusted returns. We elected to be treated for federal income tax purposes, and intend to qualify annually, as a RIC under Subchapter M of the Code.
13
Sources of Income
The primary means through which our shareholders will receive a return of value is through interest income, dividends and capital gains generated by our investments. In addition to these sources of income, we may receive fees paid by our portfolio companies, including one-time closing fees paid at the time an investment is made and/or monitoring fees paid throughout the term of our investments. Closing fees typically range from 1.0% to 2.0% of the purchase price of an investment, while annual monitoring fees generally range from 0.25% to 1.0% of the purchase price of an investment. In addition, we may generate revenue in the form of commitment or capital structuring fees, monitoring fees, fees for providing managerial assistance and possibly consulting fees and performance-based fees.
Risk Management
We seek to limit the downside potential of our investment portfolio by:
• | applying our investment strategy guidelines for portfolio investments; |
• | requiring a total return on investments (including both interest and potential appreciation) that adequately compensates us for credit risk; |
• | creating and maintaining a broad portfolio of investments, size permitting, with an adequate number of companies, across different industries, with different types of collateral; and |
• | negotiating or seeking debt investments with covenants or features that protect us while affording portfolio companies flexibility in managing their businesses consistent with preservation of capital. |
Such restrictions may include affirmative and negative covenants, default penalties, lien protection, change of control provisions and board rights. We may also enter into interest rate hedging transactions at the sole discretion of CIM. Such transactions will enable us to selectively modify interest rate exposure as market conditions dictate. Furthermore, our ability to engage in hedging transactions may be adversely affected by recent rules adopted by the U.S. Commodity Futures Trading Commission, or CFTC.
Affirmative Covenants
Affirmative covenants require borrowers to take actions that are meant to ensure the solvency of the company, facilitate the lender’s monitoring of the borrower, and ensure payment of interest and loan principal due to lenders. Examples of affirmative covenants include covenants requiring the borrower to maintain adequate insurance, accounting and tax records, and to produce frequent financial reports for the benefit of the lender.
Negative Covenants
Negative covenants impose restrictions on the borrower and are meant to protect lenders from actions that the borrower may take that could harm the credit quality of the lender’s investment. Examples of negative covenants include restrictions on the payment of distributions and restrictions on the issuance of additional debt without the lender’s approval. In addition, certain covenants restrict a borrower’s activities by requiring it to meet certain earnings interest coverage ratio and leverage ratio requirements. These covenants are also referred to as financial or maintenance covenants.
Investment Process
The investment professionals employed by CIM have spent their careers developing the resources necessary to make investments in private companies. Our transaction process is highlighted below.
Our Transaction Process
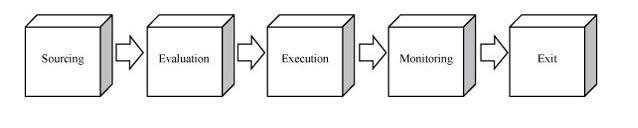
Sourcing
CIM utilizes its access to transaction flow and seeks to leverage AIM’s significant access to transaction flow as well to source transactions. With respect to CIM’s origination channel, CIM seeks to leverage CION Investments' significant industry relationships and investment personnel that actively source new investments. We believe that CIM’s broad networks have produced and will continue to produce a significant pipeline of investment opportunities for us.
14
Evaluation
Initial Review. In its initial review of an investment opportunity to present to us, CIM’s transaction team examines information furnished by the target company and external sources, including rating agencies, if applicable, to determine whether the investment meets our basic investment criteria and other guidelines, within the context of creating and maintaining a broad portfolio of investments, and offers an acceptable probability of attractive returns with identifiable downside risk.
Credit Analysis/Due Diligence. Before undertaking an investment, the transaction team from CIM conducts a thorough due diligence review of the opportunity to ensure the company fits our investment strategy, which may include:
• | a full operational analysis to identify the key risks and opportunities of the target’s business, including a detailed review of historical and projected financial results; |
• | a detailed analysis of industry dynamics, competitive position, regulatory, tax and legal matters; |
• | on-site visits, if deemed necessary, as well as telephone calls and meetings with management and other key personnel; |
• | background checks to further evaluate management and other key personnel; |
• | a review by legal and accounting professionals, environmental or other industry consultants, if necessary; |
• | financial sponsor due diligence, including portfolio company and lender reference checks, if necessary; and |
• | a review of management’s experience and track record. |
When possible, our advisory team seeks to structure transactions in such a way that our target companies are required to bear the costs of due diligence, including those costs related to any outside consulting work we may require.
Execution
Recommendation. CIM seeks to maintain a defensive approach toward its investment recommendations by emphasizing risk control in its transaction process, which includes (1) the pre-review of each opportunity by one of its portfolio managers to assess the general quality, value and fit relative to our portfolio, (2) where possible, transaction structuring with a focus on preservation of capital in varying economic environments and (3) ultimate approval of investment recommendations by CIM’s investment committee.
Approval. After completing its internal transaction process, the CIM transaction team makes formal recommendations for review and approval by CIM's investment committee. In connection with its recommendation, it transmits any relevant underwriting material and other information pertinent to the decision-making process. Each new investment that we make requires the approval of a majority of members of CIM's investment committee.
Monitoring
Portfolio Monitoring. CIM closely monitors our portfolio companies on an ongoing basis, as well as monitors the financial trends of each portfolio company to determine if each is meeting its respective business plans and to assess the appropriate course of action for each company. In addition, depending on the size, nature and performance of the transaction, senior investment professionals of CIM may take board seats or obtain board observation rights for our portfolio companies.
CIM has several methods of evaluating and monitoring the performance and fair value of our investments, which includes, but are not limited to, the assessment of success in adhering to a portfolio company’s business plan and compliance with covenants; periodic and regular contact with portfolio company management and, if appropriate, the financial or strategic sponsor, to discuss financial position, requirements and accomplishments; comparisons to other portfolio companies in the industry; attendance at and participation in board meetings; and review of monthly and quarterly financial statements and financial projections for portfolio companies.
CIM uses an investment rating system to characterize and monitor our expected level of returns on each investment in our portfolio. These ratings are just one of several factors that CIM uses to monitor our portfolio, are not in and of themselves determinative of fair value or revenue recognition and are presented for indicative purposes. CIM rates the credit risk of all investments on a scale of 1 to 5 no less frequently than quarterly. This system is intended primarily to reflect the underlying risk of a portfolio investment relative to our initial cost basis in respect of such portfolio investment (i.e., at the time of acquisition), although it may also take into account under certain circumstances the performance of the portfolio company’s business, the collateral coverage of the investment and other relevant factors.
15
The following is a description of the conditions associated with each investment rating used in this ratings system:
Investment Rating | Description | |
1 | Indicates the least amount of risk to our initial cost basis. The trends and risk factors for this investment since origination or acquisition are generally favorable, which may include the performance of the portfolio company or a potential exit. | |
2 | Indicates a level of risk to our initial cost basis that is similar to the risk to our initial cost basis at the time of origination or acquisition. This portfolio company is generally performing in accordance with our analysis of its business and the full return of principal and interest or dividend is expected. | |
3 | Indicates that the risk to our ability to recoup the cost of such investment has increased since origination or acquisition, but full return of principal and interest or dividend is expected. A portfolio company with an investment rating of 3 requires closer monitoring. | |
4 | Indicates that the risk to our ability to recoup the cost of such investment has increased significantly since origination or acquisition, including as a result of factors such as declining performance and noncompliance with debt covenants, and we expect some loss of interest, dividend or capital appreciation, but still expect an overall positive internal rate of return on the investment. | |
5 | Indicates that the risk to our ability to recoup the cost of such investment has increased materially since origination or acquisition and the portfolio company likely has materially declining performance. Loss of interest or dividend and some loss of principal investment is expected, which would result in an overall negative internal rate of return on the investment. | |
For investments rated 3, 4 or 5, CIM enhances its level of scrutiny over the monitoring of such portfolio company.
CIM monitors and, when appropriate, changes investment ratings assigned to each investment in our portfolio. In connection with our valuation process, CIM reviews these investment ratings on a quarterly basis.
The following table summarizes the composition of our investment portfolio based on the 1 to 5 investment rating scale at fair value as of December 31, 2019 and 2018, excluding short term investments of $29,527 and $12,537, respectively:
December 31, 2019 | December 31, 2018 | |||||||||||||
Investment Rating | Investments Fair Value | Percentage of Investment Portfolio | Investments Fair Value | Percentage of Investment Portfolio | ||||||||||
1 | $ | 154,264 | 8.9 | % | $ | — | — | |||||||
2 | 1,278,576 | 73.7 | % | 1,642,270 | 88.6 | % | ||||||||
3 | 282,140 | 16.3 | % | 181,118 | 9.8 | % | ||||||||
4 | 16,463 | 0.9 | % | 26,412 | 1.4 | % | ||||||||
5 | 4,102 | 0.2 | % | 2,973 | 0.2 | % | ||||||||
$ | 1,735,545 | 100.0 | % | $ | 1,852,773 | 100.0 | % | |||||||
The amount of the investment portfolio in each rating category may vary substantially from period to period resulting primarily from changes in the composition of such portfolio as a result of new investment, repayment and exit activities. In addition, changes in the rating of investments may be made to reflect our expectation of performance and changes in investment values.
Valuation Process. Each quarter, we value investments in our portfolio, and such values are disclosed each quarter in reports filed with the SEC. Investments for which market quotations are readily available are recorded at such market quotations. With respect to investments for which market quotations are not readily available, our board of directors determines the fair value of investments in good faith utilizing the input of our audit committee, CIM, and any other professionals or materials that our board of directors deems worthy and relevant, including independent third-party valuation firms, if applicable.
Managerial Assistance. As a BDC, we must offer, and provide upon request, managerial assistance to certain of our portfolio companies. This assistance could involve, among other things, monitoring the operations of our portfolio companies, participating in board and management meetings, consulting with and advising officers of portfolio companies and providing other organizational and financial guidance. Depending on the nature of the assistance required, CIM will provide such managerial assistance on our behalf to portfolio companies that request this assistance. To the extent fees are paid for these services, we, rather than CIM, will retain any fees paid for such assistance.
16
Exit
Exit Transactions. We seek to invest in companies that can generate consistent cash flow to repay their loans while maintaining growth in their businesses. We expect this internally generated cash flow to be a key means through which we will receive timely payment of interest and loan principal. Additionally, we attempt to invest in portfolio companies whose business models and growth prospects offer attractive exit possibilities via third-party transactions, including sales to strategic or other buyers and initial public offerings of common stock. Such third-party transactions may be particularly important in realizing capital gains through the equity portions of our investments. We also seek to exit investments in secondary market transactions when price targets are achieved or circumstances otherwise warrant.
Financing Arrangements
To seek to enhance our returns, we employ leverage as market conditions permit and at the discretion of CIM. On March 23, 2018, an amendment to Section 61(a) of the 1940 Act was signed into law to permit BDCs to reduce the minimum “asset coverage” ratio to 150% from 200% and, as a result, to potentially increase the ratio of a BDC's debt to equity to a maximum 2-to-1 from a maximum of 1-to-1, so long as certain approval and disclosure requirements are satisfied. We currently have not determined whether to seek to utilize such additional leverage. See Note 9 to our consolidated financial statements contained in this annual report on Form 10-K for additional information regarding our financing arrangements.
Total Return Swap
On December 17, 2012, Flatiron, our wholly-owned, consolidated financing subsidiary, entered into a TRS with Citibank, N.A., or Citibank. Flatiron and Citibank amended the TRS on several occasions, most recently on February 18, 2017 to extend the termination or call date from February 18, 2017 to April 18, 2017. Prior to the call date, the maximum aggregate market value of the portfolio of loans subject to the TRS (determined at the time each such loan became subject to the TRS) was $800,000 and the interest rate payable by Flatiron to Citibank with respect to each loan included in the TRS was a spread of 1.40% per year over the floating rate index specified for each such loan, which would not be less than zero. The agreements between Flatiron and Citibank, which collectively established the TRS, are referred to herein as the TRS Agreement.
A TRS is a contract in which one party agrees to make periodic payments to another party based on the change in the market value of and interest payments from the assets underlying the TRS in return for periodic payments based on a fixed or variable interest rate. A TRS effectively adds leverage to a portfolio by providing investment exposure to a security or market without owning or taking physical custody of such security or investing directly in such market. Because of the unique structure of a TRS, a TRS typically offers lower financing costs than are offered through more traditional borrowing arrangements.
The TRS with Citibank enabled us, through our ownership of Flatiron, to obtain the economic benefit of owning the loans subject to the TRS, without actually owning them, in return for an interest-type payment to Citibank. As such, the TRS was analogous to Flatiron borrowing funds to acquire loans and incurring interest expense to a lender.
On April 18, 2017, the TRS expired in accordance with its terms subsequent to the consummation of the Citibank Credit Facility (as defined and described in Note 9 to our consolidated financial statements contained in this report).
Determination of Net Asset Value
The value of our assets is determined quarterly and at such other times that an event occurs that materially affects the valuation. The valuation is made pursuant to Section 2(a)(41) of the 1940 Act, which requires that we value our assets as follows: (i) the market price for those securities for which a market quotation is readily available, and (ii) for all other securities and assets, at fair value, as determined in good faith by our board of directors. As a BDC, Section 2(a)(41) of the 1940 Act requires the board of directors to determine in good faith the fair value of portfolio securities for which a market price is not readily available, and it does so in conjunction with the application of our valuation procedures by CIM.
There is no single standard for determining fair value in good faith. As a result, determining fair value requires that judgment be applied to the specific facts and circumstances of each asset while employing a valuation process that is consistently followed. Determinations of fair value involve subjective judgments and estimates. Accordingly, the notes to our consolidated financial statements refer to the uncertainty with respect to the possible effect of such valuations, and any change in such valuations in our consolidated financial statements.
17
Regulation
We have elected to be regulated as a BDC under the 1940 Act. A BDC is a special category of investment company under the 1940 Act that was added by Congress to facilitate the flow of capital to private companies and small public companies that do not have efficient or cost-effective access to public capital markets or other conventional forms of corporate financing. BDCs make investments in private or thinly-traded public companies in the form of long-term debt and/or equity capital, with the goal of generating current income or capital growth.
BDCs are closed-end funds that elect to be regulated as BDCs under the 1940 Act. As such, BDCs are subject to only certain provisions of the 1940 Act, as well as the Securities Act and the Exchange Act. BDCs are provided greater flexibility under the 1940 Act than are other investment companies in dealing with their portfolio companies, issuing securities, and compensating their managers. BDCs can be internally or externally managed and may qualify to elect to be taxed as RICs for federal tax purposes. The 1940 Act contains prohibitions and restrictions relating to transactions between BDCs and their affiliates, principal underwriters, and affiliates of those affiliates or underwriters. The 1940 Act requires that a majority of a BDC’s directors be persons other than “interested persons,” as that term is defined in the 1940 Act. In addition, the 1940 Act provides that we may not change the nature of our business so as to cease to be, or withdraw our election as a BDC, unless approved by a majority of our outstanding voting securities.
The 1940 Act defines “a majority of the outstanding voting securities” as the lesser of (i) 67% or more of the voting securities present at a meeting if the holders of more than 50% of our outstanding voting securities are present or represented by proxy or (ii) a majority of our outstanding voting securities.
We are generally not able to issue and sell our common stock at a price below net asset value per share. We may, however, sell our common stock, or warrants, options or rights to acquire our common stock, at a price below the then-current net asset value of our common stock if our board of directors determines that such sale is in our best interests and the best interests of our shareholders, and our shareholders approve such sale. In addition, we may generally issue new shares of our common stock at a price below net asset value in rights offerings to existing shareholders, in payment of distributions and in certain other limited circumstances.
As a BDC, we are subject to certain regulatory restrictions in negotiating or investing in certain investments. For example, we generally are not permitted to co-invest with certain entities affiliated with CIM in transactions originated by CIM or its affiliates unless we obtain an exemptive order from the SEC. Furthermore, we are subject to certain regulatory restrictions on investing with AIM and its affiliates in transactions where AIM or its affiliates negotiate terms other than price on our behalf. We are limited in our ability to engage in co-investment transactions with AIM and its affiliates and CIM and its affiliates without exemptive relief from the SEC.
We may invest up to 100% of our assets in securities acquired directly from issuers in privately negotiated transactions. With respect to such securities, we may, for the purpose of public resale, be deemed an “underwriter” as that term is defined in the Securities Act. We do not intend to acquire securities issued by any investment company that exceed the limits imposed by the 1940 Act. Under these limits, except for registered money market funds, we generally cannot acquire more than 3% of the voting stock of any investment company, invest more than 5% of the value of our total assets in the securities of one investment company or invest more than 10% of the value of our total assets in the securities of more than one investment company. With regard to that portion of our portfolio invested in securities issued by investment companies, it should be noted that such investments might indirectly subject our shareholders to additional expenses as they will indirectly be responsible for the costs and expenses of such companies. None of our investment policies are fundamental and any may be changed without shareholder approval.
Qualifying Assets
Under the 1940 Act, a BDC may not acquire any asset other than assets of the type listed in Section 55(a) of the 1940 Act, which are referred to as qualifying assets, unless, at the time the acquisition is made, qualifying assets represent at least 70% of the company’s total assets. The principal categories of qualifying assets relevant to our business are any of the following:
1. | Securities purchased in transactions not involving any public offering from the issuer of such securities, which issuer (subject to certain limited exceptions) is an eligible portfolio company, or from any person who is, or has been during the preceding 13 months, an affiliated person of an eligible portfolio company, or from any other person, subject to such rules as may be prescribed by the SEC. An eligible portfolio company is defined in the 1940 Act as any issuer that: |
a. | is organized under the laws of, and has its principal place of business in, the U.S.; |
b. | is not an investment company (other than a small business investment company wholly-owned by the BDC) or a company that would be an investment company but for certain exclusions under the 1940 Act; and |
18
c. | satisfies any of the following: |
i. | does not have any class of securities that is traded on a national securities exchange; |
ii. | has a class of securities listed on a national securities exchange, but has an aggregate market value of outstanding voting and non-voting common equity of less than $250 million; |
iii. | is controlled by a BDC or a group of companies including a BDC and the BDC has an affiliated person who is a director of the eligible portfolio company; or |
iv. | is a small and solvent company having total assets of not more than $4.0 million and capital and surplus of not less than $2.0 million. |
2. | Securities of any eligible portfolio company that we control. |
3. | Securities purchased in a private transaction from a U.S. issuer that is not an investment company or from an affiliated person of the issuer, or in transactions incident thereto, if the issuer is in bankruptcy and subject to reorganization or if the issuer, immediately prior to the purchase of its securities, was unable to meet its obligations as they came due without material assistance other than conventional lending or financing arrangements. |
4. | Securities of an eligible portfolio company purchased from any person in a private transaction if there is no ready market for such securities and we already own 60% of the outstanding equity of the eligible portfolio company. |
5. | Securities received in exchange for or distributed on or with respect to securities described in (1) through (4) above, or pursuant to the exercise of warrants or rights relating to such securities. |
6. | Cash, cash equivalents, U.S. government securities or high-quality debt securities maturing in one year or less from the time of investment. |
In addition, a BDC must have been organized and have its principal place of business in the U.S. and must be operated for the purpose of making investments in the types of securities described in (1), (2) or (3) above.
Managerial Assistance to Portfolio Companies
In order to count portfolio securities as qualifying assets for the purpose of the 70% test, we must either control the issuer of the securities or must offer to make available to the issuer of the securities (other than small and solvent companies described above) significant managerial assistance; except that, where we purchase such securities in conjunction with one or more other persons acting together, one of the other persons in the group may make available such managerial assistance. Making available managerial assistance means, among other things, any arrangement whereby the BDC, through its directors, officers or employees, offers to provide, and, if accepted, does so provide, significant guidance and counsel concerning the management, operations or business objectives and policies of a portfolio company. Depending on the nature of the assistance required, CIM will provide such managerial assistance on our behalf to portfolio companies that request this assistance. To the extent fees are paid for these services, we, rather than CIM, will retain any fees paid for such assistance.
Temporary Investments
Pending investment in other types of “qualifying assets,” as described above, our investments may consist of cash, cash equivalents, U.S. government securities or high-quality debt securities maturing in one year or less from the time of investment, which we refer to, collectively, as temporary investments, so that 70% of our assets are qualifying assets. Typically, we will invest in U.S. Treasury bills or in repurchase agreements, provided that such agreements are fully collateralized by cash or securities issued by the U.S. government or its agencies. A repurchase agreement involves the purchase by an investor, such as us, of a specified security and the simultaneous agreement by the seller to repurchase it at an agreed-upon future date and at a price that is greater than the purchase price by an amount that reflects an agreed-upon interest rate. There is no percentage restriction on the proportion of our assets that may be invested in such repurchase agreements. However, if more than 25% of our total assets constitute repurchase agreements from a single counterparty, we may not meet the RIC diversification tests, as further described in the “Taxation as a Regulated Investment Company” section below, in order to qualify as a RIC for federal income tax purposes. Thus, we do not intend to enter into repurchase agreements with a single counterparty in excess of this limit. CIM will monitor the creditworthiness of the counterparties with which we enter into repurchase agreement transactions.
19
Senior Securities
We are permitted, under specified conditions, to issue multiple classes of debt and one class of stock senior to our common stock if our asset coverage, as defined in the 1940 Act, is at least equal to 200% immediately after each such issuance. Recent legislation has modified the 1940 Act by allowing a BDC to increase the maximum amount of leverage it may incur from an asset coverage ratio of 200% to an asset coverage ratio of 150%, if certain requirements are met. In addition, while any senior securities remain outstanding, we must make provisions to prohibit any distribution to our shareholders or the repurchase of such securities or shares unless we meet the applicable asset coverage ratios at the time of the distribution or repurchase. We may also borrow amounts up to 5% of the value of our total assets for temporary or emergency purposes without regard to asset coverage. See “Item 1A. Risk Factors - Risks Related to Business Development Companies - Regulations governing our operation as a BDC and RIC will affect our ability to raise, and the way in which we raise, additional capital or borrow for investment purposes, which may have a negative effect on our growth.”
Code of Ethics
We and CIM have adopted a code of ethics pursuant to Rule 17j-1 under the 1940 Act that establishes procedures for personal investments and restricts certain personal securities transactions. Personnel subject to the code may invest in securities for their personal investment accounts, including securities that may be purchased or held by us, so long as such investments are made in accordance with the code’s requirements. The code of ethics is attached as an exhibit to our Current Report on Form 8-K filed with the SEC on May 3, 2019, which is available on the EDGAR Database on the SEC’s Internet site at http://www.sec.gov. Shareholders may also obtain copies of the code of ethics, after paying a duplicating fee, by electronic request at the following e-mail address: publicinfo@sec.gov.
Compliance Policies and Procedures
We and CIM have adopted and implemented written policies and procedures reasonably designed to prevent violation of the federal securities laws and are required to review these compliance policies and procedures annually for their adequacy and the effectiveness of their implementation. Our Chief Compliance Officer, or CCO, is responsible for administering our policies and procedures and CIM’s chief compliance officer is responsible for administering its policies and procedures.
Proxy Voting Policies and Procedures
We have delegated our proxy voting responsibility to CIM. The proxy voting policies and procedures of CIM are set forth below. The guidelines are reviewed periodically by CIM and our non-interested directors, and, accordingly, are subject to change.
Introduction
As an investment adviser registered under the Advisers Act, CIM has a fiduciary duty to act solely in the best interests of its clients. As part of this duty, it recognizes that it must vote client securities in a timely manner free of conflicts of interest and in the best interests of its clients. These policies and procedures for voting proxies for the investment advisory clients of CIM are intended to comply with Section 206 of, and Rule 206(4)-6 under, the Advisers Act.
Proxy Policies
CIM will vote proxies relating to our securities in a manner that it believes, in its discretion, to be in the best interest of our shareholders. It will review on a case-by-case basis each proposal submitted for a shareholder vote to determine its impact on the portfolio securities held by its clients. Although CIM will generally vote against proposals that may have a negative impact on its clients’ portfolio securities, it may vote for such a proposal if there exists compelling long-term reasons to do so.
The proxy voting decisions of CIM are made by the senior officers who are responsible for monitoring each of its clients’ investments. To ensure that its vote is not the product of a conflict of interest, it will require that: (a) anyone involved in the decision-making process disclose to the chief compliance officer any potential conflict that he or she is aware of and any contact that he or she has had with any interested party regarding a proxy vote and (b) officers and employees involved in the decision making process or vote administration are prohibited from revealing how CIM intends to vote on a proposal in order to reduce any attempted influence from interested parties. The CCO of CIM will work with the appropriate senior officers to resolve any conflict that may arise.
Proxy Voting Records
Shareholders may obtain information, without charge, regarding how CIM voted proxies with respect to our portfolio securities by making a written request for proxy voting information to: Chief Compliance Officer, c/o CĪON Investment Corporation, 3 Park Avenue, 36th Floor, New York, NY 10016.
20
Election to be Taxed as a Regulated Investment Company
We elected to be treated as a RIC under Subchapter M of the Code. As a RIC, we generally will not be subject to corporate-level federal income taxes on any income that we distribute to our shareholders from our tax earnings and profits. To qualify as a RIC, we must, among other things, meet certain source-of-income and asset diversification requirements (as described below). In addition, in order to maintain RIC tax treatment, we must distribute to our shareholders, for each taxable year, at least 90% of our “investment company taxable income,” which is generally our net ordinary income plus the excess, if any, of realized net short-term capital gains over realized net long-term capital losses and determined without regard to any deduction for distributions paid. We refer to this as the Annual Distribution Requirement.
Taxation as a Regulated Investment Company
If we:
• | qualify as a RIC; and |
• | satisfy the Annual Distribution Requirement, |
then we will not be subject to federal income tax on the portion of our income we distribute (or are deemed to distribute) to shareholders. We will be subject to U.S. federal income tax at the regular corporate rates on any income or capital gains not distributed (or deemed distributed) to our shareholders.
We will be subject to a 4.0% nondeductible federal excise tax on certain undistributed income unless we distribute in a timely manner an amount at least equal to the sum of (1) 98.0% of our net ordinary income (taking into account certain deferrals and elections) for each calendar year, (2) 98.2% of our capital gain net income (adjusted for certain ordinary losses) for the one-year period ending October 31 in that calendar year and (3) any ordinary income and capital gain net income recognized, but not distributed, in preceding years and on which we paid no federal income tax, or the Excise Tax Avoidance Requirement.
In order to qualify as a RIC for federal income tax purposes, we must, among other things:
• | continue to qualify as a BDC under the 1940 Act at all times during each taxable year; |
• | derive in each taxable year at least 90% of our gross income from dividends, interest, payments with respect to certain securities, loans, gains from the sale of stock or other securities, net income from certain “qualified publicly traded partnerships,” or other income derived with respect to our business of investing in such stock or securities, or the 90% Income Test; and |
• | diversify our holdings so that at the end of each quarter of the taxable year: |
• | at least 50% of the value of our assets consists of cash, cash equivalents, U.S. government securities, securities of other RICs, and other securities if such other securities of any one issuer do not represent more than 5% of the value of our assets or more than 10% of the outstanding voting securities of the issuer; and |
• | no more than 25% of the value of our assets is invested in the securities, other than U.S. government securities or securities of other RICs, of one issuer, of two or more issuers that are controlled, as determined under applicable Code rules, by us and that are engaged in the same or similar or related trades or businesses or of certain “qualified publicly traded partnerships,” or the Diversification Tests. |
For federal income tax purposes, we may be required to recognize taxable income in circumstances in which we do not receive a corresponding payment in cash. For example, if we hold debt obligations that are treated under applicable tax rules as having original issue discount (such as debt instruments with contractual “payment-in-kind,” or PIK, interest or, in certain cases, increasing interest rates or debt instruments that were issued with warrants), we must include in income each taxable year a portion of the original issue discount that accrues over the life of the obligation, regardless of whether cash representing such income is received by us in the same taxable year. We may also have to include in income other amounts that we have not yet received in cash, such as deferred loan origination fees that are paid after origination of the loan or are paid in non-cash compensation such as warrants or stock. We anticipate that a portion of our income may constitute original issue discount or other income required to be included in taxable income prior to receipt of cash.
Because any original issue discount or other amounts accrued will be included in our investment company taxable income for the year of the accrual, we may be required to make a distribution to our shareholders in order to satisfy the Annual Distribution Requirement, even though we will not have received any corresponding cash amount. As a result, we may have difficulty meeting the Annual Distribution Requirement necessary to qualify for and maintain RIC tax treatment under the Code. We may have to sell some of our investments at times and/or at prices we would not consider advantageous, raise additional debt or equity capital or forego new investment opportunities for this purpose. If we are not able to obtain cash from other sources, we may fail to qualify for RIC tax treatment and thus become subject to corporate-level income tax. Our ability to dispose of assets to meet our distribution requirements may be limited by (1) the illiquid nature of our portfolio and/or (2) other requirements relating to our status as a RIC, including the Diversification Tests. If we dispose of assets in order to meet the Annual Distribution Requirement or the Excise Tax Avoidance Requirement, we may make such dispositions at times that, from an investment standpoint, are not advantageous.
21
Under the 1940 Act, we are not permitted to make distributions to our shareholders while our debt obligations and other senior securities are outstanding unless certain “asset coverage” tests are met. As a result, we may be prohibited from making distributions necessary to satisfy the Annual Distribution Requirement. Even if we are not prohibited from making distributions, our ability to raise additional capital to satisfy the Annual Distribution Requirement may be limited. If we are not able to make sufficient distributions to satisfy the Annual Distribution Requirement, we may fail to qualify for RIC tax treatment and thus become subject to corporate-level income tax.
Certain of our investment practices may be subject to special and complex federal income tax provisions that may, among other things, (1) treat dividends that would otherwise constitute qualified dividend income as non-qualified dividend income, (2) disallow, suspend or otherwise limit the allowance of certain losses or deductions, (3) convert lower-taxed long-term capital gain into higher-taxed short-term capital gain or ordinary income, (4) convert an ordinary loss or a deduction into a capital loss (the deductibility of which is more limited), (5) cause us to recognize income or gain without receipt of a corresponding distribution of cash, (6) adversely affect the time as to when a purchase or sale of stock or securities is deemed to occur, (7) adversely alter the characterization of certain complex financial transactions and (8) produce income that will not be qualifying income for purposes of the 90% Income Test. We intend to monitor our transactions and may make certain tax elections to mitigate the potential adverse effect of these provisions, but there can be no assurance that any adverse effects of these provisions will be mitigated.
If we purchase shares in a passive foreign investment company, or a PFIC, we may be subject to federal income tax on its allocable share of a portion of any “excess distribution” received on, or any gain from the disposition of, such shares even if our allocable share of such income is distributed as a taxable dividend to our shareholders. Additional charges in the nature of interest generally will be imposed on us in respect of deferred taxes arising from any such excess distribution or gain. If we invest in a PFIC and elect to treat the PFIC as a “qualified electing fund” under the Code, or a QEF, in lieu of the foregoing requirements, we will be required to include in income each year our proportionate share of the ordinary earnings and net capital gain of the QEF, even if such income is not distributed by the QEF. Alternatively, we may be able to elect to mark-to-market at the end of each taxable year our shares in a PFIC; in this case, we will recognize as ordinary income our allocable share of any increase in the value of such shares, and as ordinary loss our allocable share of any decrease in such value to the extent that any such decrease does not exceed prior increases included in our income. Under either election, we may be required to recognize in a year income in excess of distributions from PFICs and proceeds from dispositions of PFIC stock during that year, and such income will nevertheless be subject to the Annual Distribution Requirement and will be taken into account for purposes of the 4% excise tax.
Exchange Act and Sarbanes-Oxley Act Compliance
We are subject to the reporting and disclosure requirements of the Exchange Act, including the filing of quarterly, annual and current reports, proxy statements and other required items. In addition, we are subject to the Sarbanes-Oxley Act, which imposes a wide variety of regulatory requirements on publicly-held companies and their insiders. Many of these requirements affect us. For example:
• | pursuant to Rule 13a-14 of the Exchange Act, our co-chief executive officers and our chief financial officer are required to certify the accuracy of the financial statements contained in our periodic reports; |
• | pursuant to Item 307 of Regulation S-K, our periodic reports are required to disclose our conclusions about the effectiveness of our disclosure controls and procedures; and |
• | pursuant to Rule 13a-15 of the Exchange Act, our management is required to prepare a report regarding its assessment of our internal control over financial reporting. |
The Sarbanes-Oxley Act requires us to review our current policies and procedures to determine whether we comply with the Sarbanes-Oxley Act and the regulations promulgated thereunder. We intend to monitor our compliance with all regulations that are adopted under the Sarbanes-Oxley Act and will take actions necessary to ensure that we are in compliance therewith.
As a non-accelerated filer, we are exempt from the provisions of Section 404(b) of the Sarbanes-Oxley Act, which would require that our independent registered public accounting firm provide an attestation report on the effectiveness of our internal control over financial reporting. This may increase the risk that material weaknesses or other deficiencies in our internal control over financial reporting go undetected.
Other
We are periodically examined by the SEC for compliance with the 1940 Act.
We are required to provide and maintain a bond issued by a reputable fidelity insurance company to protect us against larceny and embezzlement. Furthermore, as a BDC, we are prohibited from protecting any director or officer against any liability to us or our shareholders arising from willful misconduct, bad faith, gross negligence or reckless disregard of the duties involved in the conduct of such person’s office.
22
Employees
We do not currently have any employees and we do not currently intend to hire any in the future. The compensation of our chief financial officer and treasurer, Keith S. Franz, and our chief compliance officer and secretary, Stephen Roman, is paid by CIM. We reimburse CIM for the compensation paid to our chief financial officer and his staff and our chief compliance officer and his staff. In the future, CIM may retain additional investment personnel based upon its needs.
Available Information
Within 60 days after the end of each fiscal quarter, we distribute our quarterly report on Form 10-Q to all shareholders of record. In addition, we distribute our annual report on Form 10-K to all shareholders within 120 days after the end of each fiscal year. These reports are available on our website at www.cioninvestments.com and on the SEC’s website at www.sec.gov. Information contained on our website is not incorporated by reference into this Annual Report on Form 10-K and shareholders should not consider information contained on our website to be part of this Annual Report on Form 10-K.
We file with or submit to the SEC annual, quarterly and current reports, proxy statements and other information meeting the informational requirements of the Exchange Act. The SEC maintains an Internet site that contains reports, proxy and information statements and other information filed electronically by us with the SEC, which are available on the SEC’s website at www.sec.gov. Copies of these reports, proxy and information statements and other information may be obtained, after paying a duplicating fee, by electronic request at the following e-mail address: publicinfo@sec.gov.
23
Item 1A. Risk Factors
Owning our common stock involves a number of significant risks. In addition to the other information contained in this Annual Report on Form 10-K, shareholders should consider carefully the following information. If any of the following events occur, our business, financial condition and results of operations could be materially and adversely affected. In such case, the net asset value of our common stock could decline, and shareholders may lose all or part of their investment.
Risks Relating to Our Business and Structure
Our board of directors may change our operating policies and strategies without prior notice or shareholder approval, the effects of which may be adverse to our results of operations and financial condition.
Our board of directors has the authority to modify or waive our current operating policies, investment criteria and strategies without prior notice and without shareholder approval. We cannot predict the effect any changes to our current operating policies, investment criteria and strategies would have on our business, net asset value, operating results and value of our stock. However, the effects might be adverse, which could negatively impact our ability to pay investors distributions and cause investors to lose all or part of their investment.
Price declines in the medium- and large-sized U.S. corporate debt market may adversely affect the fair value of our portfolio, reducing our net asset value through increased net unrealized depreciation.
Conditions in the medium- and large-sized U.S. corporate debt market may deteriorate, as seen during the financial crisis, which may cause pricing levels to similarly decline or be volatile. During the financial crisis, many institutions were forced to raise cash by selling their interests in performing assets in order to satisfy margin requirements or the equivalent of margin requirements imposed by their lenders and/or, in the case of hedge funds and other investment vehicles, to satisfy widespread redemption requests. This resulted in a forced deleveraging cycle of price declines, compulsory sales, and further price declines, with falling underlying credit values, and other constraints resulting from the credit crisis generating further selling pressure. If similar events occurred in the medium- and large-sized U.S. corporate debt market, our net asset value could decline through an increase in unrealized depreciation and incurrence of realized losses in connection with the sale of our investments, which could have a material adverse impact on our business, financial condition and results of operations.
Further downgrades in the U.S. and certain European credit ratings, and the economic crisis in Europe, could materially adversely affect our business, financial condition and results of operations.
In August 2011, Standard and Poor’s lowered its long-term sovereign credit rating on the U.S. from “AAA” to “AA+,” which was affirmed by Standard and Poor’s in June 2018. In January 2012, Standard and Poor’s lowered its long-term sovereign credit ratings for France, Italy, Spain and six other European countries, which negatively impacted global markets and economic conditions. During subsequent periods, Standard and Poor’s further lowered its long-term sovereign credit rating for Spain. Standard and Poor’s subsequently raised its long-term sovereign credit rating on Spain to “BBB,” but its current credit rating still signifies significant ongoing risk. Recent U.S. budget deficit concerns, together with signs of deteriorating sovereign debt conditions in Europe, have increased the possibility of additional credit-rating downgrades and economic slowdowns. The impact of any further downgrade to the U.S. government’s sovereign credit rating, or its perceived creditworthiness, and the impact of the current crisis in Europe with respect to the ability of certain European Union countries to continue to service their sovereign debt obligations is inherently unpredictable and could adversely affect the U.S. and global financial markets and economic conditions. In addition, the economic downturn and the significant government interventions into the financial markets and fiscal stimulus spending over the last several years have contributed to significantly increased U.S. budget deficits. There can be no assurance that future fiscal or monetary measures to aid economic recovery will be effective. These developments and reactions of the credit markets to these developments could cause interest rates and borrowing costs to rise, which may negatively impact our ability to obtain debt financing on favorable terms. In addition, any adverse economic conditions resulting from any further downgrade of the U.S. government’s sovereign credit rating or the economic crisis in Europe could have a material adverse effect on our business, financial condition and results of operations.
Global markets could enter a period of severe disruption and instability due to catastrophic events, such as terrorist attacks, acts of war, natural disasters, and outbreaks of epidemic, pandemic or contagious diseases, which could impair our portfolio companies’ financial positions and operating results and affect the industries in which we invest and, in turn, harm our operating results.
The U.S. and global markets have, from time to time, experienced periods of disruption due to events such as terrorist attacks; acts of war; natural disasters, such as earthquakes, tsunamis, fires, floods or hurricanes; and outbreaks of epidemic, pandemic or contagious diseases. Such events have created, and continue to create, economic and political uncertainties and have contributed to recent global economic instability. In particular, outbreaks of epidemic, pandemic or contagious diseases may cause serious harm to our business, operating results and financial condition. Historically, disease pandemics such as the Ebola virus, Middle East Respiratory Syndrome, Severe Acute Respiratory Syndrome or the H1N1 virus, have diverted resources and priorities towards the treatment of such diseases. In December 2019, a strain of novel coronavirus causing respiratory illness, or the Wuhan Coronavirus, emerged in the city of Wuhan in the Hubei province of China. We are closely monitoring the developments in China, the U.S. and throughout the world, and continually assessing the potential impact on our business and the business of our portfolio companies, including the effects described below. However, the full impact of this outbreak is unknown as of the date of this report.
24
Any prolonged disruptions in the business of our portfolio companies, including a disruption in their supply chains may adversely affect their ability to obtain the necessary raw materials or components to make their products or cause a decline in the demand for their products or services, leading to a negative impact on their operating results. In addition, such events may lead to restrictions on travel to and from the affected areas, making it more difficult for our portfolio companies to conduct their businesses. As a result of pandemic outbreaks, including the Wuhan Coronavirus, businesses can be shut down, supply chains can be interrupted, slowed, or rendered inoperable, and individuals can become ill, quarantined, or otherwise unable to work and/or travel due to health reasons or governmental restrictions. Governmental mandates may require forced shutdowns of our portfolio companies’ facilities for extended or indefinite periods. In addition, these widespread outbreaks of illness, particularly in China, North America, Europe, or other locations significant to the operations of our portfolio companies, could adversely affect their workforce, resulting in serious health issues and absenteeism, and may cause serious harm to our results of operations, business, or prospects.
Furthermore, future terrorist activities, military or security operations, natural disasters, disease outbreaks, pandemics or other similar events could further weaken the domestic/global economies and create additional uncertainties, which may negatively impact our portfolio companies. During these periods of disruption, general economic conditions may deteriorate with material and adverse consequences for the broader financial and credit markets, and the availability of debt and equity capital for the market as a whole, and financial services firms in particular. Such economic adversity could impair our portfolio companies’ financial positions and operating results and affect the industries in which we invest, which could, in turn, harm our operating results. These conditions may reoccur for a prolonged period of time or materially worsen in the future.
Our ability to achieve our investment objective depends on the ability of CIM to manage and support our investment process. If CIM was to lose any members of its senior management team, our ability to achieve our investment objective could be significantly harmed.
Since we have no employees, we depend on the investment expertise, skill and network of business contacts of the broader networks of CIM and its affiliates. CIM evaluates, negotiates, structures, executes, monitors and services our investments. Our future success depends to a significant extent on the continued service and coordination of CIM and its senior management team. The departure of any members of CIM’s senior management team could have a material adverse effect on our ability to achieve our investment objective.
Our ability to achieve our investment objective depends on CIM’s ability to identify and analyze, and to invest in, finance and monitor companies that meet our investment criteria. CIM’s capabilities in structuring the investment process, providing competent, attentive and efficient services to us, and facilitating access to financing on acceptable terms depend on the employment of investment professionals in an adequate number and of adequate sophistication to match the corresponding flow of transactions. To achieve our investment objective, CIM may need to hire, train, supervise and manage new investment professionals to participate in our investment selection and monitoring process. CIM may not be able to find investment professionals in a timely manner or at all. Failure to support our investment process could have a material adverse effect on our business, financial condition and results of operations.
The investment advisory agreement between CIM and us has been approved pursuant to Section 15 of the 1940 Act. In addition, the investment advisory agreement has termination provisions that allow the parties to terminate the agreement. The investment advisory agreement may be terminated at any time, without penalty, by us or by CIM, upon 60 days' notice. If the agreement is terminated, it may adversely affect the quality of our investment opportunities. In addition, in the event such agreement is terminated, it may be difficult for us to replace CIM.
Because our business model depends to a significant extent upon relationships with private equity sponsors, investment banks and commercial banks, the inability of CIM or its affiliates to maintain or develop these relationships, or the failure of these relationships to generate investment opportunities, could adversely affect our business.
CIM depends on its broader organizations’ relationships with private equity sponsors, investment banks and commercial banks, and we rely to a significant extent upon these relationships to provide us with potential investment opportunities. If CIM or its affiliates fail to maintain their existing relationships or develop new relationships with other sponsors or sources of investment opportunities, we may not be able to grow our investment portfolio. In addition, individuals with whom CIM has relationships are not obligated to provide us with investment opportunities, and, therefore, there is no assurance that such relationships will generate investment opportunities for us.
We may face increasing competition for investment opportunities, which could delay deployment of our capital, reduce returns and result in losses.
We compete for investments with other BDCs and investment funds (including private equity funds, mezzanine funds and funds that invest in CLOs, structured notes, derivatives and other types of collateralized securities and structured products), as well as traditional financial services companies such as commercial banks and other sources of funding. Moreover, alternative investment vehicles, such as hedge funds, have invested in areas in which they have not traditionally invested, including making investments in small to mid-sized private U.S. companies. As a result of these new entrants, competition for investment opportunities in small and middle-market private U.S. companies may intensify. Many of our competitors are substantially larger and have considerably greater financial, technical and marketing resources than we do. For example, some competitors may have a lower cost of capital and access to funding sources that are not available to us. In addition, some of our competitors may have higher risk tolerances or different risk assessments than we have. These characteristics could allow our competitors to consider a wider variety of investments, establish more relationships and offer better pricing and more flexible structuring than we are able to do. We may lose investment opportunities if we do not match our competitors’ pricing, terms or structure. If we are forced to match our competitors’ pricing, terms or structure, we may not be able to achieve acceptable returns on our investments or may bear substantial risk of capital loss. A significant part of our competitive advantage stems from the fact that the market for investments in small and middle-market private U.S. companies is underserved by traditional commercial banks and other financial sources. A significant increase in the number and/or the size of our competitors in this target market could force us to accept less attractive investment terms.
25
Furthermore, many of our competitors have greater experience operating under, or are not subject to, the regulatory restrictions that the 1940 Act imposes on us as a BDC.
As required by the 1940 Act, a significant portion of our investment portfolio is and will be recorded at fair value as determined in good faith by our board of directors and, as a result, there is and will be uncertainty as to the value of our portfolio investments.
Under the 1940 Act, we are required to carry our portfolio investments at market value or, if there is no readily available market value, at fair value as determined by our board of directors. There is not a public market for the securities of the privately-held companies in which we invest. Most of our investments will not be publicly traded or actively traded on a secondary market. As a result, we value these securities quarterly at fair value as determined in good faith by our board of directors as required by the 1940 Act.
Certain factors that may be considered in determining the fair value of our investments include investment dealer quotes for securities traded on the secondary market for institutional investors, the nature and realizable value of any collateral, the portfolio company’s earnings and its ability to make payments on its indebtedness, the markets in which the portfolio company does business, comparison to comparable publicly-traded companies, discounted cash flow and other relevant factors. As a result, our determinations of fair value may differ materially from the values that would have been used if a ready market for these non-traded securities existed. Due to this uncertainty, our fair value determinations may cause our net asset value on a given date to materially differ from the value that we may ultimately realize upon the sale of one or more of our investments.
There is a risk that investors in our common stock may not receive distributions or that our distributions may not grow over time.
We may not achieve investment results that will allow us to make a specified level of cash distributions or year-to-year increases in cash distributions. In addition, due to the asset coverage test applicable to us as a BDC, we may be limited in our ability to make distributions.
The amount of any distributions we may make is uncertain and our distributions may exceed our earnings. Therefore, portions of the distributions that we make may represent a return of capital to shareholders that will lower their tax basis in their common stock and reduce the amount of funds we have for investment in targeted assets.
We may fund our cash distributions to shareholders from any sources of funds available to us, including borrowings, net investment income from operations, capital gains proceeds from the sale of assets, non-capital gains proceeds from the sale of assets, dividends or other distributions paid to us on account of preferred and common equity investments in portfolio companies and expense support from CIM, which is subject to recoupment. On January 2, 2018, we entered into an expense support and conditional reimbursement agreement with CIM for the primary purpose of replacing CIG and AIM with CIM as the expense support provider pursuant to the terms of the expense support and conditional reimbursement agreement. On December 20, 2019, we amended and restated the expense support and conditional reimbursement agreement with CIM for purposes of extending the termination date from December 31, 2019 to December 31, 2020. In addition, through December 31, 2014, a portion of our distributions resulted from expense support from CIG, and future distributions may result from expense support from CIM. For the year ended December 31, 2017, none of our distributions resulted from expense support from CIG or AIM. For the years ended December 31, 2018 and 2019, none of our distributions resulted from expense support from CIM. Our ability to pay distributions might be adversely affected by, among other things, the impact of one or more of the risk factors described in this section. In addition, the inability to satisfy the asset coverage test applicable to us as a BDC may limit our ability to pay distributions. All distributions are and will be paid at the discretion of our board of directors and will depend on our earnings, our financial condition, maintenance of our RIC status, compliance with applicable BDC regulations and such other factors as our board of directors may deem relevant from time to time. We cannot assure investors that we will continue to pay distributions to our shareholders in the future. In the event that we encounter delays in locating suitable investment opportunities, we may pay all or a substantial portion of our distributions from the proceeds of our borrowings in anticipation of future cash flow, which may constitute a return of shareholders’ capital. A return of capital is a return of shareholders’ investment, rather than a return of earnings or gains derived from our investment activities. A shareholder will not be subject to immediate taxation on the amount of any distribution treated as a return of capital to the extent of the shareholder’s basis in its shares; however, the shareholder's basis in its shares will be reduced (but not below zero) by the amount of the return of capital, which will result in the shareholder recognizing additional gain (or a lower loss) when the shares are sold. To the extent that the amount of the return of capital exceeds the shareholder's basis in its shares, such excess amount will be treated as gain from the sale of the shareholder’s shares. A shareholder’s basis in the investment will be reduced by the nontaxable amount, which will result in additional gain (or a lower loss) when the shares are sold. Distributions from the proceeds of our borrowings also could reduce the amount of capital we ultimately invest in our portfolio companies.
We have not established any limit on the amount of funds we may use from available sources, such as borrowings, if any, to fund distributions (which may reduce the amount of capital we ultimately invest in assets).
Through December 31, 2014, a portion of our distributions resulted from expense support from CIG, and future distributions may result from expense support from CIM, which is subject to repayment by us within three years. For the year ended December 31, 2017, none of our distributions resulted from expense support from CIG or AIM. For the years ended December 31, 2018 and 2019, none of our distributions resulted from expense support from CIM. The purpose of this arrangement is to reduce our operating expenses and to avoid such distributions being characterized as a return of capital. Shareholders should understand that any such distributions are not based on our investment performance, and can only be sustained if we achieve positive investment performance in future periods and/or CIM continues to provide such expense support. Shareholders should also understand that our future repayments of expense support to CIM will reduce the distributions that they would otherwise receive. There can be no assurance that we will achieve such performance in order to sustain these distributions, or be able to pay distributions at all. CIM has no obligation to provide expense support to us in future periods.
26
Changes in laws or regulations governing our operations may adversely affect our business or cause us to alter our business strategy.
We and our portfolio companies are subject to regulation at the local, state and federal level. New legislation may be enacted or new interpretations, rulings or regulations could be adopted, including those governing the types of investments we are permitted to make, any of which could harm us and our shareholders, potentially with retroactive effect.
Additionally, any changes to the laws and regulations governing our operations relating to permitted investments may cause us to alter our investment strategy to avail ourselves of new or different opportunities. Such changes could result in material differences to our strategies and plans as set forth herein and may result in our investment focus shifting from the areas of expertise of CIM to other types of investments in which CIM may have less expertise or little or no experience. Thus, any such changes, if they occur, could have a material adverse effect on our financial condition and results of operations and the value of a shareholder’s investment.
As a public company, we are subject to regulations not applicable to private companies, such as provisions of the Sarbanes-Oxley Act. Efforts to comply with such regulations will involve significant expenditures, and non-compliance with such regulations may adversely affect us.
As a public company, we are subject to the Sarbanes-Oxley Act, and the related rules and regulations promulgated by the SEC. Our management is required to report on our internal control over financial reporting pursuant to Section 404 of the Sarbanes-Oxley Act. We are required to review on an annual basis our internal control over financial reporting, and on a quarterly and annual basis to evaluate and disclose changes in our internal control over financial reporting. Maintaining an effective system of internal controls may require significant expenditures, which may negatively impact our financial performance and our ability to make distributions. This process also will result in a diversion of our management’s time and attention. We cannot be certain of when our evaluation, testing, and remediation actions will be completed or the impact of the same on our operations. In addition, we may be unable to ensure that the process is effective or that our internal controls over financial reporting are or will be effective in a timely manner. In the event that we are unable to develop or maintain an effective system of internal controls and maintain or achieve compliance with the Sarbanes-Oxley Act and related rules, we may be adversely affected.
The impact of financial reform legislation on us is uncertain.
In light of recent conditions in the U.S. and global financial markets and the U.S. and global economy, legislators, the presidential administration and regulators have increased their focus on the regulation of the financial services industry. The Dodd-Frank Wall Street Reform and Consumer Protection Act, or the Dodd-Frank Act, institutes a wide range of reforms that will have an impact on all financial institutions. Many of the requirements called for in the Dodd-Frank Act will be implemented over time, most of which will be subject to implementing regulations over the course of the next several years. Given the uncertainty associated with the manner in which the provisions of the Dodd-Frank Act will be implemented by the various regulatory agencies and through regulations, the full impact such requirements will have on our business, results of operations or financial condition is unclear. The changes resulting from the Dodd-Frank Act may require us to invest significant management attention and resources to evaluate and make necessary changes in order to comply with new statutory and regulatory requirements. Failure to comply with any such laws, regulations or principles, or changes thereto, may negatively impact our business, results of operations and financial condition. While we cannot predict what effect any changes in the laws or regulations or their interpretations would have on us as a result of the Dodd-Frank Act, these changes could be materially adverse to us and our shareholders.
We may experience fluctuations in our quarterly results.
We could experience fluctuations in our quarterly operating results due to a number of factors, including our ability or inability to make investments in companies that meet our investment criteria, the interest rate payable on the debt securities we acquire, the level of our expenses (including our borrowing costs), variations in and the timing of the recognition of realized and unrealized gains or losses, the degree to which we encounter competition in our markets and general economic conditions. As a result of these factors, results for any previous period should not be relied upon as being indicative of performance in future periods.
Any unrealized losses we experience on our portfolio may be an indication of future realized losses, which could reduce our income available for distribution.
As a BDC, we are required to carry our investments at market value or, if no market value is ascertainable, at the fair value as determined in good faith by our board of directors. Decreases in the market value or fair value of our investments relative to amortized cost will be recorded as unrealized depreciation. Any unrealized losses in our portfolio could be an indication of a portfolio company’s inability to meet its repayment obligations to us with respect to the affected loans. This could result in realized losses in the future and ultimately in reductions of our income available for distribution in future periods. In addition, decreases in the market value or fair value of our investments will reduce our net asset value.
27
Recent legislation may allow us to incur additional leverage.
As a BDC, we are generally not permitted to incur indebtedness unless immediately after such borrowing we have an asset coverage for total borrowings of at least 200% (i.e., the amount of debt may not exceed 50% of the value of our assets). On March 23, 2018, an amendment to Section 61(a) of the 1940 Act was signed into law to permit BDCs to reduce the minimum “asset coverage” ratio to 150% from 200% and, as a result, to potentially increase the ratio of a BDC’s debt to equity to a maximum 2-to-1 from a maximum of 1-to-1, so long as certain approval and disclosure requirements are satisfied. Specifically, a BDC is permitted to apply a lower minimum asset coverage ratio of 150% if: (1) the BDC complies with certain additional asset coverage disclosure requirements; and (2)(A) a “required majority” of the BDC’s directors, as defined in Section 57(o) of the 1940 Act, approves the application of such a lower minimum asset coverage ratio to the BDC, in which case the 150% minimum asset coverage ratio will become effective on the date that is one year after the date of such independent director approval; or (B) the BDC obtains, at a special or annual meeting of its shareholders at which a quorum is present, the approval of more than 50% of the votes cast for the application of such a lower minimum asset coverage ratio to the BDC, in which case the 150% minimum asset coverage ratio will become effective on the first day after the date of such shareholder approval. As a result, we may be able to incur additional indebtedness in the future, and, therefore, your risk of an investment in us may increase. We currently have not determined whether to seek to utilize such additional leverage. If we choose to take advantage of such leverage, we will act in accordance with the requirements set forth in the amended legislation.
Risks Related to CIM and its Affiliates; Risks Related to AIM and its Affiliates
CIM and its affiliates, including our officers and some of our directors, face conflicts of interest caused by compensation arrangements with us and our affiliates, which could result in actions that are not in the best interests of our shareholders.
CIM and its affiliates receive substantial fees from us in return for their services, and these fees could influence the advice provided to us. Among other matters, the decision to utilize leverage will increase our assets and, as a result, will increase the amount of management fees payable to CIM and may increase the amount of subordinated income incentive fees payable to CIM.
We may be obligated to pay CIM incentive compensation even if we incur a net loss due to a decline in the value of our portfolio.
Our investment advisory agreement entitles CIM to receive incentive compensation on income regardless of any capital losses. In such case, we may be required to pay CIM incentive compensation for a fiscal quarter even if there is a decline in the value of our portfolio or if we incur a net loss for that quarter.
Any incentive fee payable by us that relates to our net investment income may be computed and paid on income that may include interest that has been accrued, but not yet received, including original issue discount, which may arise if we receive warrants in connection with the origination of a loan or possibly in other circumstances, or contractual PIK interest, which represents contractual interest added to the loan balance and due at the end of the loan term. To the extent we do not distribute accrued PIK interest, the deferral of PIK interest has the simultaneous effects of increasing the assets under management and increasing the base management fee at a compounding rate, while generating investment income and increasing the incentive fee at a compounding rate. In addition, the deferral of PIK interest would also increase the loan-to-value ratio at a compounding rate if the issuer’s assets do not increase in value, and investments with a deferred interest feature, such as PIK interest, may represent a higher credit risk than loans on which interest must be paid in full in cash on a regular basis.
For example, if a portfolio company defaults on a loan that is structured to provide accrued interest, it is possible that accrued interest previously included in the calculation of the incentive fee will become uncollectible. CIM is not under any obligation to reimburse us for any part of the incentive fee it received that was based on accrued income that we never received as a result of a default by an entity on the obligation that resulted in the accrual of such income, and such circumstances would result in our paying an incentive fee on income we never received.
There may be conflicts of interest related to obligations that CIM’s and Apollo’s respective senior management and investment teams have to other clients.
The members of the senior management and investment teams of both CIM and Apollo serve or may serve as officers, directors or principals of entities that operate in the same or a related line of business as we do, or of investment funds managed by the same personnel. In serving in these multiple capacities, they may have obligations to other clients or investors in those entities, the fulfillment of which may not be in our best interests or in the best interest of our shareholders. Our investment objective may overlap with the investment objectives of such investment funds, accounts or other investment vehicles. In particular, we rely on CIM to manage our day-to-day activities and to implement our investment strategy. CIM and certain of its affiliates are presently, and plan in the future to continue to be, involved with activities that are unrelated to us. As a result of these activities, CIM, its officers and employees and certain of its affiliates will have conflicts of interest in allocating their time between us and other activities in which they are or may become involved, including the management of its affiliated funds. CIM and its officers and employees will devote only as much of its or their time to our business as CIM and its officers and employees, in their judgment, determine is reasonably required, which may be substantially less than their full time.
AIM's investment professionals perform certain services and assist with identifying investment opportunities to CIM. AIM, its affiliates and their respective members, partners, officers and employees will devote as much of their time to our activities as they deem necessary and appropriate. Apollo and its affiliates are not restricted from engaging in other business activities that could be viewed as creating a conflict of interest in that the time and effort of the members of AIM, its affiliates and their officers and employees will not be devoted exclusively to our business.
28
AIM currently acts as investment adviser to AINV, which is also a BDC and is authorized to invest in the same kinds of securities we invest or may invest in, although AINV primarily focuses on providing senior and subordinated debt to companies that are expected to have greater EBITDA than those that are our primary focus. Also, in connection with such business activities, AIM and its affiliates may have existing business relationships or access to material, non-public information that may prevent it from identifying investment opportunities that would otherwise fit within our investment objective. These activities could be viewed as creating a conflict of interest in that the time, effort and ability of the members of AIM, its affiliates and their officers and employees will not be devoted exclusively to our business, but will be allocated between us and such other accounts managed by AIM and its affiliates as AIM deems necessary and appropriate.
It is possible that conflicts of interest will arise from time to time in connection with our prospective and existing investments and AINV or other funds or accounts managed or advised by Apollo, including, without limitation, in circumstances giving rise to the restructuring of an issuer in which we and AINV are investors, as well as follow-on investments or dispositions with respect to such issuer. In such circumstance, it is likely that we and CIM, on the one hand, will be walled off from Apollo and AINV, on the other hand, and accordingly the parties will not collectively discuss or participate in, for example, the restructuring with respect to such issuer. Further, there may also arise instances in which we and AINV are invested in the same issuer and we and/or AINV seeks to dispose of such investment in a transaction that may otherwise require exemptive relief, in which case the parties may need to obtain an exemptive order, the receipt of which cannot be assured.
Our base management and incentive fees may induce CIM to make and identify speculative investments or to incur leverage.
The incentive fee payable by us to CIM may create an incentive for it to make investments on our behalf that are risky or more speculative than would be the case in the absence of such compensation arrangement. The way in which the incentive fee payable to CIM is determined may encourage it to use leverage to increase the return on our investments. The part of the management and incentive fees payable to CIM that relates to our net investment income is computed and paid on income that may include interest income that has been accrued but not yet received in cash, such as market discount, debt instruments with PIK interest, preferred stock with PIK dividends and zero coupon securities. This fee structure may be considered to involve a conflict of interest for CIM to the extent that it may encourage CIM to favor debt financings that provide for deferred interest, rather than current cash payments of interest. In addition, the fact that our base management fee is payable based upon our gross assets, which would include any borrowings for investment purposes, may encourage CIM to use leverage to make additional investments. Under certain circumstances, the use of leverage may increase the likelihood of default, which would disfavor holders of our common stock. Such a practice could result in our investing in more speculative securities than would otherwise be in our best interests, which could result in higher investment losses, particularly during cyclical economic downturns. In addition, since AIM is a member of CIM, AIM's investment professionals may have an incentive to assist with identifying investments that are riskier or more speculative.
CIM relies on key personnel, the loss of any of whom could impair its ability to successfully manage us.
Our future success depends, to a significant extent, on the continued services of the officers and employees of CIM or its affiliates. The loss of services of one or more members of CIM’s management team, including members of our investment committee, could adversely affect our financial condition, business and results of operations.
The compensation we pay to CIM was determined without independent assessment on our behalf, and these terms may be less advantageous to us than if such terms had been the subject of arm’s-length negotiations.
The compensation we pay to CIM was not entered into on an arm’s-length basis with an unaffiliated third party. As a result, the form and amount of such compensation may be less favorable to us than they might have been had these been entered into through arm’s-length transactions with an unaffiliated third party.
CIM’s influence on conducting our operations gives it the ability to increase its fees, which may reduce the amount of cash flow available for distribution to our shareholders.
CIM is paid a base management fee calculated as a percentage of our gross assets and unrelated to net income or any other performance base or measure. CIM may advise us to consummate transactions or conduct our operations in a manner that, in CIM’s reasonable discretion, is in the best interests of our shareholders. These transactions, however, may increase the amount of fees paid to CIM. CIM’s ability to influence the base management fee paid to it by us could reduce the amount of cash flow available for distribution to our shareholders.
29
Risks Related to Business Development Companies
The requirement that we invest a sufficient portion of our assets in qualifying assets could preclude us from investing in accordance with our current business strategy; conversely, the failure to invest a sufficient portion of our assets in qualifying assets could result in our failure to maintain our status as a BDC.
As a BDC, we may not acquire any assets other than “qualifying assets” unless, at the time of and after giving effect to such acquisition, at least 70% of our total assets are qualifying assets. See “Item 1. Business – Regulation.” Therefore, we may be precluded from investing in what we believe are attractive investments if such investments are not qualifying assets. Conversely, if we fail to invest a sufficient portion of our assets in qualifying assets, we could lose our status as a BDC, which would have a material adverse effect on our business, financial condition and results of operations. Similarly, these rules could prevent us from making additional investments in existing portfolio companies, which could result in the dilution of our position, or could require us to dispose of investments at an inopportune time to comply with the 1940 Act. If we were forced to sell non-qualifying investments in the portfolio for compliance purposes, the proceeds from such sale could be significantly less than the current value of such investments.
Failure to maintain our status as a BDC would reduce our operating flexibility.
If we do not remain a BDC, we might be regulated as a registered closed-end investment company under the 1940 Act, which would subject us to substantially more regulatory restrictions under the 1940 Act and correspondingly decrease our operating flexibility.
Regulations governing our operation as a BDC and RIC will affect our ability to raise, and the way in which we raise, additional capital or borrow for investment purposes, which may have a negative effect on our growth.
As a result of the annual distribution requirement to qualify as a RIC, we may need to periodically access the capital markets to raise cash to fund new investments. We may issue “senior securities,” as defined under the 1940 Act, including borrowing money from banks or other financial institutions only in amounts such that our asset coverage, as defined in the 1940 Act, equals at least 200% after such incurrence or issuance. Our ability to issue different types of securities is also limited. Compliance with these requirements may unfavorably limit our investment opportunities and reduce our ability in comparison to other companies to profit from favorable spreads between the rates at which we can borrow and the rates at which we can lend.
We have borrowed for investment purposes. If the value of our assets declines, we may be unable to satisfy the asset coverage test, which would prohibit us from paying distributions and could prevent us from qualifying as a RIC. If we cannot satisfy the asset coverage test, we may be required to sell a portion of our investments and, depending on the nature of our debt financing, repay a portion of our indebtedness at a time when such sales may be disadvantageous.
Under the 1940 Act, we generally are prohibited from issuing or selling our common stock at a price per share, after deducting selling commissions and dealer manager fees, that is below our net asset value per share, which may be a disadvantage as compared with other public companies. We may, however, sell our common stock, or warrants, options or rights to acquire our common stock, at a price below the current net asset value of our common stock if our board of directors, including our independent directors, determine that such sale is in our best interests and the best interests of our shareholders, and our shareholders, as well as those shareholders that are not affiliated with us, approve such sale. In any such case, the price at which our securities are to be issued and sold may not be less than a price that, in the determination of our board of directors, closely approximates the fair value of such securities.
Our ability to enter into transactions with our affiliates is restricted.
We are prohibited under the 1940 Act from participating in certain transactions with certain of our affiliates without the prior approval of a majority of the independent members of our board of directors and, in some cases, the SEC. Any person that owns, directly or indirectly, 5% or more of our outstanding voting securities will be our affiliate for purposes of the 1940 Act and generally we will be prohibited from buying or selling any securities from or to such affiliate, absent the prior approval of our board of directors. The 1940 Act also prohibits certain “joint” transactions with certain of our affiliates, which could include investments in the same portfolio company (whether at the same or closely related times), without prior approval of our board of directors and, in some cases, the SEC. If a person acquires more than 25% of our voting securities, we will be prohibited from buying or selling any security from or to such person or certain of that person’s affiliates, or entering into prohibited joint transactions with such persons, absent the prior approval of the SEC. Similar restrictions limit our ability to transact business with our officers, directors, investment advisers, sub-advisers or their affiliates. As a result of these restrictions, we may be prohibited from buying or selling any security from or to any fund or any portfolio company of a fund managed by CIM or Apollo, or entering into joint arrangements such as certain co-investments with these companies or funds without the prior approval of the SEC, which may limit the scope of investment opportunities that would otherwise be available to us.
30
We are uncertain of our sources for funding our future capital needs; if we cannot obtain debt or equity financing on acceptable terms, our ability to acquire investments and to expand our operations will be adversely affected.
The net proceeds from the sale of common stock was used for our investment opportunities, operating expenses and for payment of various fees and expenses such as base management fees, incentive fees and other expenses. Any working capital reserves we maintain may not be sufficient for investment purposes, and we may require debt or equity financing to operate. Accordingly, in the event that we develop a need for additional capital in the future for investments or for any other reason, these sources of funding may not be available to us. Consequently, if we cannot obtain debt or equity financing on acceptable terms, our ability to acquire investments and to expand our operations will be adversely affected. As a result, we would be less able to create and maintain a broad portfolio of investments and achieve our investment objective, which may negatively impact our results of operations and reduce our ability to make distributions to our shareholders.
We are a non-diversified investment company within the meaning of the 1940 Act, and therefore we are not limited with respect to the proportion of our assets that may be invested in securities of a single issuer.
We are classified as a non-diversified investment company within the meaning of the 1940 Act, which means that we are not limited by the 1940 Act with respect to the proportion of our assets that we may invest in securities of a single issuer. Under the 1940 Act, a “diversified” investment company is required to invest at least 75% of the value of its total assets in cash and cash items, government securities, securities of other investment companies and other securities limited in respect of any one issuer to an amount not greater than 5% of the value of the total assets of such company and no more than 10% of the outstanding voting securities of such issuer. As a non-diversified investment company, we are not subject to this requirement. To the extent that we assume large positions in the securities of a small number of issuers, or within a particular industry, our net asset value may fluctuate to a greater extent than that of a diversified investment company as a result of changes in the financial condition or the market’s assessment of the issuer. We may also be more susceptible to any single economic or regulatory occurrence than a diversified investment company or to a general downturn in the economy. However, we will be subject to the diversification requirements applicable to RICs under Subchapter M of the Code.
Risks Related to Our Investments
Our investments in prospective portfolio companies may be risky, and we could lose all or part of our investment.
We invest or intend to invest in the following types of loans of private and thinly-traded U.S. middle-market companies.
Senior Secured Debt.
First Lien Loans and Second Lien Loans. When we invest in senior secured term debt, including first lien loans and second lien loans, we will generally take a security interest in the available assets of these portfolio companies, including the equity interests of their subsidiaries. We expect this security interest to help mitigate the risk that we will not be repaid. However, there is a risk that the collateral securing our loans may decrease in value over time or lose its entire value, may be difficult to sell in a timely manner, may be difficult to appraise and may fluctuate in value based upon the success of the business and market conditions, including as a result of the inability of the portfolio company to raise additional capital. Also, in some circumstances, our security interest could be subordinated to claims of other creditors. In addition, deterioration in a portfolio company’s financial condition and prospects, including its inability to raise additional capital, may be accompanied by deterioration in the value of the collateral for the loan. Consequently, the fact that a loan is secured does not guarantee that we will receive principal and interest payments according to the loan’s terms, or at all, or that we will be able to collect on the loan should we be forced to enforce our remedies.
Unitranche Loans. We also expect to invest in unitranche loans, which are loans that combine both senior and subordinated financing, generally in a first-lien position. Unitranche loans provide all of the debt needed to finance a leveraged buyout or other corporate transaction, both senior and subordinated, but generally in a first lien position, while the borrower generally pays a blended, uniform interest rate rather than different rates for different tranches. Unitranche debt generally requires payments of both principal and interest throughout the life of the loan. Unitranche debt generally has contractual maturities of five to six years and interest is typically paid quarterly. Generally, we expect these securities to carry a blended yield that is between senior secured and subordinated debt interest rates. Unitranche loans provide a number of advantages for borrowers, including the following: simplified documentation, greater certainty of execution and reduced decision-making complexity throughout the life of the loan. In addition, we may receive additional returns from any warrants we may receive in connection with these investments. In some cases, a portion of the total interest may accrue or be paid in kind. Because unitranche loans combine characteristics of senior and subordinated financing, unitranche loans have risks similar to the risks associated with senior secured debt, including first lien loans and second lien loans, and subordinated debt in varying degrees according to the combination of loan characteristics of the unitranche loan.
Unsecured Debt. Our unsecured debt, including corporate bonds and subordinated, or mezzanine, investments will generally rank junior in priority of payment to senior debt. This may result in a heightened level of risk and volatility or a loss of principal, which could lead to the loss of the entire investment. These investments may involve additional risks that could adversely affect our investment returns. To the extent interest payments associated with such debt are deferred, such debt may be subject to greater fluctuations in valuations, and such debt could subject us and our shareholders to non-cash income, including PIK interest and original issue discount. Loans structured with these features may represent a higher level of credit risk than loans that require interest to be paid in cash at regular intervals during the term of the loan. Since we generally will not receive any principal repayments prior to the maturity of some of our unsecured debt investments, such investments will have greater risk than amortizing loans.
31
Collateralized Securities, Structured Products and Other. We may also invest in collateralized securities, structured products and other similar securities, which may include CDOs, CBOs, CLOs, structured notes and credit-linked notes. Investments in such securities and products involve risks, including, without limitation, credit risk and market risk. Certain of these securities and products may be thinly traded or have a limited trading market. Where our investments in collateralized securities, structured products and other similar securities are based upon the movement of one or more factors, including currency exchange rates, interest rates, reference bonds (or loans) and stock indices, depending on the factor used and the use of multipliers or deflators, changes in interest rates and movement of any factor may cause significant price fluctuations. Additionally, changes in the reference instrument or security may cause the interest rate on such a security or product to be reduced to zero, and any further changes in the reference instrument may then reduce the principal amount payable on maturity of the security or product. Collateralized securities, structured products and other similar securities may be less liquid than other types of securities and more volatile than the reference instrument or security underlying the product.
Equity Investments. We make selected equity investments. In addition, when we invest in senior secured debt, including first lien loans and second lien loans, or unsecured debt, we may acquire warrants to purchase equity securities. Our goal is ultimately to dispose of these equity interests and realize gains upon our disposition of such interests. However, the equity interests we receive may not appreciate in value and, in fact, may decline in value. Accordingly, we may not be able to realize gains from our equity interests, and any gains that we do realize on the disposition of any equity interests may not be sufficient to offset any other losses we experience.
Non-U.S. Securities. We may invest in non-U.S. securities, which may include securities denominated in U.S. dollars or in non-U.S. currencies, to the extent permitted by the 1940 Act. Because evidence of ownership of such securities usually are held outside the United States, we would be subject to additional risks if we invested in non-U.S. securities, which include possible adverse political and economic developments, seizure or nationalization of foreign deposits and adoption of governmental restrictions which might adversely affect or restrict the payment of principal and interest on the non-U.S. securities to investors located outside the country of the issuer, whether from currency blockage or otherwise. Since non-U.S. securities may be purchased with and payable in foreign currencies, the value of these assets as measured in U.S. dollars may be affected unfavorably by changes in current rates and exchange control regulations.
Below-Investment Grade Debt Securities. In addition, we invest in debt securities that are rated below investment grade by rating agencies or that would be rated below investment grade if they were rated. Debt securities rated below investment grade quality are generally regarded as having predominantly speculative characteristics and may carry a greater risk with respect to a borrower’s capacity to pay interest and repay principal. They may also be difficult to value and illiquid.
To the extent original issue discount constitutes a portion of our income, we will be exposed to risks associated with the deferred receipt of cash representing such income.
Our investments may include original issue discount instruments. To the extent original issue discount constitutes a portion of our income, we will be exposed to typical risks associated with such income being required to be included in taxable and accounting income prior to receipt of cash, including the following:
• | Original issue discount instruments may have unreliable valuations because the accruals require judgments about collectability. |
• | Original issue discount instruments may create heightened credit risks because the inducement to trade higher rates for the deferral of cash payments typically represents, to some extent, speculation on the part of the borrower. |
• | For accounting purposes, cash distributions to shareholders representing original issue discount income do not come from paid-in capital, although they may be paid from the offering proceeds. Thus, although a distribution of original issue discount income comes from the cash invested by shareholders, the 1940 Act does not require that shareholders be given notice of this fact. |
• | In the case of PIK “toggle” debt, the PIK election has the simultaneous effects of increasing the assets under management, thus increasing the base management fee, and increasing the investment income, thus increasing the potential for realizing incentive fees. |
• | Since original issue discount will be included in our investment company taxable income for the year of the accrual, we may be required to make a distribution to our shareholders in order to satisfy the annual distribution requirement applicable to RICs, even if we will not have received any corresponding cash amount. As a result, we may have difficulty meeting such annual distribution requirement necessary to obtain and maintain RIC tax treatment under the Code. If we are not able to obtain cash from other sources, and choose not to make a qualifying share distribution, we may fail to qualify for RIC tax treatment and thus become subject to corporate-level income tax. |
• | Original issue discount creates risk of non-refundable cash payments to the advisor based on non-cash accruals that may never be realized. |
32
Our portfolio companies may incur debt that ranks equally with, or senior to, our investments in such companies.
We intend to invest primarily in senior secured debt, including first lien loans, second lien loans and unitranche loans of private and thinly-traded U.S. middle-market companies. Our portfolio companies may have, or may be permitted to incur, other debt that ranks equally with, or senior to, the debt in which we invest. By their terms, such debt instruments may entitle the holders to receive payment of interest or principal on or before the dates on which we are entitled to receive payments with respect to the debt instruments in which we invest. Also, in the event of insolvency, liquidation, dissolution, reorganization or bankruptcy of a portfolio company, holders of debt instruments ranking senior to our investment in that portfolio company would typically be entitled to receive payment in full before we receive any payment or distribution. After repaying such senior creditors, such portfolio company may not have any remaining assets to use for repaying its obligation to us. In the case of debt ranking equally with debt instruments in which we invest, we would have to share on an equal basis any payments or distributions with other creditors holding such debt in the event of an insolvency, liquidation, dissolution, reorganization or bankruptcy of the relevant portfolio company.
There may be circumstances where our debt investments could be subordinated to claims of other creditors or we could be subject to lender liability claims.
If one of our portfolio companies were to file for bankruptcy, depending on the facts and circumstances, including the extent to which we actually provided managerial assistance to that portfolio company, a bankruptcy court might recharacterize our debt investment and subordinate all or a portion of our claim to that of other creditors. We may also be subject to lender liability claims for actions taken by us with respect to a borrower’s business or instances where we exercise control over the borrower.
We generally will not control our portfolio companies.
We do not expect to control most of our portfolio companies, even though we may have board representation or board observation rights, and our debt agreements with such portfolio companies may contain certain restrictive covenants. As a result, we are subject to the risk that a portfolio company in which we invest may make business decisions with which we disagree and the management of such company, as representatives of the holders of the company’s common equity, may take risks or otherwise act in ways that do not serve our interests as debt investors. Due to the lack of liquidity for our investments in non-traded companies, we may not be able to dispose of our interests in our portfolio companies as readily as we would like or at an appropriate valuation. As a result, a portfolio company may make decisions that could decrease the value of our portfolio holdings.
We will be exposed to risks associated with changes in interest rates.
We are subject to financial market risks, including changes in interest rates. General interest rate fluctuations may have a substantial negative impact on our investments and investment opportunities and, accordingly, have a material adverse effect on our ability to achieve our investment objective and our target rate of return on invested capital. In addition, an increase in interest rates would make it more expensive to use debt for our financing needs, if any.
Changes to and replacement of the LIBOR benchmark interest rate could adversely affect our business, financial condition, and results of operations.
Certain financial instruments in which we invest use a floating interest rate based on LIBOR, the offered rate for short-term Eurodollar deposits between large international banks. LIBOR has recently faced scrutiny over concerns that its rate-setting process, which is based on a limited number of interbank transactions, is susceptible to manipulation. As a result, many central banks, including the U.S. Federal Reserve Board, or the Federal Reserve, have begun studying potential replacements for LIBOR and reforms to other interest rate benchmarks. Notably, on July 27, 2017, the U.K. Financial Conduct Authority announced that it intended to stop persuading or compelling banks to submit LIBOR rates after 2021. It is expected that a transition away from the widespread use of LIBOR and similar reference rates to alternative rates based on observable market transactions and other potential interest rate benchmark reforms will occur over the course of the next few years. The Alternative Reference Rates Committee, established by the Federal Reserve, announced the replacement of LIBOR with a new index calculated by short-term repurchase agreements collateralized by U.S. Treasury securities, called the Secured Overnight Financing Rate, or SOFR. The Federal Reserve Bank of New York began publishing SOFR in April 2018. It is uncertain whether SOFR will attain sufficient market traction to supplant LIBOR.
Because the future of LIBOR is uncertain, the impact to us of a transition away from LIBOR cannot presently be determined. The market transition away from LIBOR and other current reference rates to alternative reference rates is complex and could have a range of adverse impacts on our investment program, financial condition and results of operations. Among other negative consequences, this transition could:
• | Adversely impact the pricing, liquidity, value of, return on and trading for a broad array of financial products, including any LIBOR-linked securities, loans and derivatives in which we may invest; |
• | Require extensive negotiations of and/or amendments to agreements and other documentation governing LIBOR-linked investments products; |
33
• | Lead to disputes, litigation or other actions with counterparties or portfolio companies regarding the interpretation and enforceability of “fall back” provisions that provide for an alternative reference rate in the event of LIBOR’s unavailability; or |
• | Cause us to incur additional costs in relation to any of the above factors. |
The risks associated with the above factors are heightened with respect to investments in LIBOR-based products that do not include a fall back provision that addresses how interest rates will be determined if LIBOR stops being published. Other important factors include the pace of the transition, the specific terms of alternative reference rates accepted in the market, the depth of the market for investments based on alternative reference rates, and CIM’s ability to develop appropriate investment and compliance systems capable of addressing alternative reference rates.
International investments create additional risks.
We have made, and expect to continue to make, investments in portfolio companies that are domiciled outside of the United States. We anticipate that up to 30% of our investments may be in assets located in jurisdictions outside the United States. Our investments in foreign portfolio companies are deemed “non-qualifying assets,” which means, as required by the 1940 Act, they may not constitute more than 30% of our total assets at the time of our acquisition of any asset, after giving effect to the acquisition. Notwithstanding that limitation on our ownership of foreign portfolio companies, those investments subject us to many of the same risks as our domestic investments, as well as certain additional risks including the following:
• | foreign governmental laws, rules and policies, including those restricting the ownership of assets in the foreign country or the repatriation of profits from the foreign country to the United States; |
• | foreign currency devaluations that reduce the value of and returns on our foreign investments; |
• | adverse changes in the availability, cost and terms of investments due to the varying economic policies of a foreign country in which we invest; |
• | adverse changes in tax rates, the tax treatment of transaction structures and other changes in operating expenses of a particular foreign country in which we invest; |
• | the assessment of foreign-country taxes (including withholding taxes, transfer taxes and value added taxes, any or all of which could be significant) on income or gains from our investments in the foreign country; |
• | adverse changes in foreign-country laws, including those relating to taxation, bankruptcy and ownership of assets; |
• | changes that adversely affect the social, political and/or economic stability of a foreign country in which we invest; |
• | high inflation in the foreign countries in which we invest, which could increase the costs to us of investing in those countries; |
• | deflationary periods in the foreign countries in which we invest, which could reduce demand for our assets in those countries and diminish the value of such investments and the related investment returns to us; and |
• | legal and logistical barriers in the foreign countries in which we invest that materially and adversely limit our ability to enforce our contractual rights with respect to those investments. |
In addition, we may make investments in countries whose governments or economies may prove unstable. Certain of the countries in which we may invest may have political, economic and legal systems that are unpredictable, unreliable or otherwise inadequate with respect to the implementation, interpretation and enforcement of laws protecting asset ownership and economic interests. In some of the countries in which we may invest, there may be a risk of nationalization, expropriation or confiscatory taxation, which may have an adverse effect on our portfolio companies in those countries and the rates of return we are able to achieve on such investments. We may also lose the total value of any investment which is nationalized, expropriated or confiscated. The financial results and investment opportunities available to us, particularly in developing countries and emerging markets, may be materially and adversely affected by any or all of these political, economic and legal risks.
Second priority liens on collateral securing debt investments that we make to our portfolio companies may be subject to control by senior creditors with first priority liens. If there is a default, the value of the collateral may not be sufficient to repay in full both the first priority creditors and us.
Certain debt investments that we make to portfolio companies may be secured on a second priority basis by the same collateral securing first priority debt of such companies. The first priority liens on the collateral will secure the portfolio company’s obligations under any outstanding senior debt and may secure certain other future debt that may be permitted to be incurred by the company under the agreements governing the loans. The holders of obligations secured by the first priority liens on the collateral will generally control the liquidation of and be entitled to receive proceeds from any realization of the collateral to repay their obligations in full before us. In addition, the value of the collateral in the event of liquidation will depend on market and economic conditions, the availability of buyers and other factors. There can be no assurance that the proceeds, if any, from the sale or sales of all of the collateral would be sufficient to satisfy the debt obligations secured by the second priority liens after payment in full of all obligations secured by the first priority liens on the collateral. If such proceeds are not sufficient to repay amounts outstanding under the debt obligations secured by the second priority liens, then we, to the extent not repaid from the proceeds of the sale of the collateral, will only have an unsecured claim against the company’s remaining assets, if any.
34
The rights we may have with respect to the collateral securing the debt investments we make to our portfolio companies with senior debt outstanding may also be limited pursuant to the terms of one or more intercreditor agreements that we enter into with the holders of senior debt. Under such an intercreditor agreement, at any time that obligations that have the benefit of the first priority liens are outstanding, any of the following actions that may be taken in respect of the collateral will be at the direction of the holders of the obligations secured by the first priority liens: the ability to cause the commencement of enforcement proceedings against the collateral; the ability to control the conduct of such proceedings; the approval of amendments to collateral documents; releases of liens on the collateral; and waivers of past defaults under collateral documents. We may not have the ability to control or direct such actions, even if our rights are adversely affected.
Economic recessions or downturns could impair our portfolio companies and adversely affect our operating results.
Many of our portfolio companies may be susceptible to economic recessions or downturns and may be unable to repay our debt investments during these periods. Therefore, our non-performing assets are likely to increase, and the value of our portfolio is likely to decrease during these periods. Adverse economic conditions may also decrease the value of any collateral securing our senior secured debt. A prolonged recession may further decrease the value of such collateral and result in losses of value in our portfolio and a decrease in our revenues, net income and net asset value. Unfavorable economic conditions also could increase our funding costs, limit our access to the capital markets or result in a decision by lenders not to extend credit to us on terms we deem acceptable. These events could prevent us from increasing investments and adversely affect our operating results.
A covenant breach or other defaults by our portfolio companies may adversely affect our operating results.
A portfolio company’s failure to satisfy financial or operating covenants imposed by us or other lenders could lead to defaults and, potentially, termination of its loans and foreclosure on its secured assets, which could trigger cross-defaults under other agreements and jeopardize a portfolio company’s ability to meet its obligations under the debt or equity securities that we hold. We may incur expenses to the extent necessary to seek recovery upon default or to negotiate new terms, which may include the waiver of certain financial covenants, with a defaulting portfolio company.
Investing in middle-market companies involves a number of significant risks, any one of which could have a material adverse effect on our operating results.
Investments in middle-market companies involve the same risks that apply generally to investments in larger, more established companies. However, such investments have more pronounced risks in that middle-market companies:
• | may have limited financial resources and may be unable to meet their obligations under their debt securities that we hold, which may be accompanied by a deterioration in the value of any collateral and a reduction in the likelihood of us realizing on any guarantees we may have obtained in connection with our investment; |
• | have shorter operating histories, narrower product lines and smaller market shares than larger businesses, which tends to render them more vulnerable to competitors’ actions and changing market conditions, as well as general economic downturns; |
• | are more likely to depend on the management talents and efforts of a small group of persons; therefore, the death, disability, resignation or termination of one or more of these persons could have a material adverse impact on our portfolio company and, in turn, on us; |
• | generally have less predictable operating results, may from time to time be parties to litigation, may be engaged in rapidly changing businesses with products subject to a substantial risk of obsolescence, and may require substantial additional capital to support their operations, finance expansion or maintain their competitive position. In addition, our executive officers, directors and members of CIM may, in the ordinary course of business, be named as defendants in litigation arising from our investments in the portfolio companies; and |
• | may have difficulty accessing the capital markets to meet future capital needs, which may limit their ability to grow or to repay their outstanding indebtedness upon maturity. |
We may not realize gains from our equity investments.
Certain investments that we may make could include warrants or other equity securities. In addition, we may make direct equity investments in portfolio companies. Our goal is ultimately to realize gains upon our disposition of such equity interests. However, the equity interests we receive may not appreciate in value and, in fact, may decline in value. Accordingly, we may not be able to realize gains from our equity interests, and any gains that we do realize on the disposition of any equity interests may not be sufficient to offset any other losses we experience. We also may be unable to realize any value if a portfolio company does not have a liquidity event, such as a sale of the business, recapitalization or public offering, which would allow us to sell the underlying equity interests. We intend to seek puts or similar rights to give us the right to sell our equity securities back to the portfolio company issuer. We may be unable to exercise these put rights for the consideration provided in our investment documents if the issuer is in financial distress.
35
An investment strategy focused primarily on privately-held companies presents certain challenges, including, but not limited to, the lack of available information about these companies.
We have invested and continue to invest primarily in privately-held companies. Investments in private companies pose significantly greater risks than investments in public companies. First, private companies have reduced access to the capital markets, resulting in diminished capital resources and the ability to withstand financial distress. Second, the depth and breadth of experience of management in private companies tends to be less than that at public companies, which makes such companies more likely to depend on the management talents and efforts of a smaller group of persons and/or persons with less depth and breadth of experience. Therefore, the decisions made by such management teams and/or the death, disability, resignation or termination of one or more of these persons could have a material adverse impact on our investments and, in turn, on us. Third, the investments themselves tend to be less liquid. As such, we may have difficulty exiting an investment promptly or at a desired price prior to maturity or outside of a normal amortization schedule. As a result, the relative lack of liquidity and the potential diminished capital resources of our target portfolio companies may affect our investment returns. Fourth, little public information generally exists about private companies. Further, these companies may not have third-party debt ratings or audited financial statements. We must therefore rely on the ability of CIM to obtain adequate information through due diligence to evaluate the creditworthiness and potential returns from investing in these companies. These companies and their financial information will generally not be subject to the Sarbanes-Oxley Act and other rules that govern public companies. If we are unable to uncover all material information about these companies, we may not make a fully informed investment decision, and we may lose money on our investments.
A lack of liquidity in certain of our investments may adversely affect our business.
We have invested and continue to invest in certain companies whose securities are not publicly traded or actively traded on the secondary market, and whose securities are subject to legal and other restrictions on resale or will otherwise be less liquid than publicly-traded securities. The illiquidity of certain of our investments may make it difficult for us to sell these investments when desired. In addition, if we are required to liquidate all or a portion of our portfolio quickly, we may realize significantly less than the value at which we had previously recorded these investments. The reduced liquidity of our investments may make it difficult for us to dispose of them at a favorable price, and, as a result, we may suffer losses.
We may not have the funds or ability to make additional investments in our portfolio companies or to fund our unfunded debt commitments.
We may not have the funds or ability to make additional investments in our portfolio companies or to fund our unfunded debt commitments. After our initial investment in a portfolio company, we may be called upon from time to time to provide additional funds to such company or have the opportunity to increase our investment through the exercise of a warrant to purchase common stock. There is no assurance that we will make, or will have sufficient funds to make, follow-on investments. Any decisions not to make a follow-on investment or any inability on our part to make such an investment may have a negative impact on a portfolio company in need of such an investment, may result in a missed opportunity for us to increase our participation in a successful operation or may reduce the expected return on the investment.
We may acquire various financial instruments for purposes of “hedging” or reducing our risks, which may be costly and ineffective and could reduce our cash available for distribution to our shareholders.
We may seek to hedge against interest rate and currency exchange rate fluctuations and credit risk by using financial instruments such as futures, options, swaps and forward contracts, subject to the requirements of the 1940 Act. These financial instruments may be purchased on exchanges or may be individually negotiated and traded in over-the-counter markets. Use of such financial instruments for hedging purposes may present significant risks, including the risk of loss of the amounts invested. Defaults by the other party to a hedging transaction can result in losses in the hedging transaction. Hedging activities also involve the risk of an imperfect correlation between the hedging instrument and the asset being hedged, which could result in losses both on the hedging transaction and on the instrument being hedged. Use of hedging activities may not prevent significant losses and could increase our losses. Further, hedging transactions may reduce cash available to pay distributions to our shareholders.
Prepayments of our debt investments by our portfolio companies could adversely impact our results of operations and reduce our return on equity.
We are subject to the risk that the investments we make in our portfolio companies may be repaid prior to maturity. When this occurs, we will generally reinvest these proceeds in temporary investments, pending their future investment in new portfolio companies. These temporary investments will typically have substantially lower yields than the debt being prepaid and we could experience significant delays in reinvesting these amounts. Any future investment in a new portfolio company may also be at lower yields than the debt that was repaid. As a result, our results of operations could be materially adversely affected if one or more of our portfolio companies elect to prepay amounts owed to us. Additionally, prepayments, net of prepayment fees, could negatively impact our return on equity.
36
Risks Relating to Debt Financing
Since we have borrowed money, the potential for loss on amounts invested in us is magnified and may increase the risk of investing in us. Borrowed money may also adversely affect the return on our assets, reduce cash available for distribution to our shareholders, and result in losses.
The use of borrowings, also known as leverage, increases the volatility of investments by magnifying the potential for loss on invested equity capital. Since we have used leverage to partially finance our investments, through borrowing from banks, shareholders experience increased risks of investing in our common stock. If the value of our assets decreases, leveraging would cause net asset value to decline more sharply than it otherwise would have had we not leveraged. Similarly, any decrease in our income would cause net income to decline more sharply than it would have had we not borrowed. Such a decline could negatively affect our ability to make distributions to our shareholders. In addition, our shareholders bear the burden of any increase in our expenses as a result of our use of leverage, including interest expenses and any increase in the management or incentive fees payable to CIM.
We may continue to use leverage to finance our investments. The amount of leverage that we employ will depend on CIM’s and our board of directors’ assessment of market and other factors at the time of any proposed borrowing. There can be no assurance that leveraged financing will be available to us on favorable terms or at all. However, to the extent that we continue to use leverage to finance our assets, our financing costs will reduce cash available for distributions to shareholders. Moreover, we may not be able to meet our financing obligations and, to the extent that we cannot, we risk the loss of some or all of our assets to liquidation or sale to satisfy the obligations. In such an event, we may be forced to sell assets at significantly depressed prices due to market conditions or otherwise, which may result in losses.
As a BDC, we generally are required to meet a coverage ratio of total assets to total borrowings and other senior securities, which include all of our borrowings and any preferred stock that we may issue in the future, of at least 200%. If this ratio declines below 200%, we cannot incur additional debt and could be required to sell a portion of our investments to repay some debt when it is disadvantageous to do so. This could have a material adverse effect on our operations and investment activities. Recent legislation has modified the 1940 Act by allowing a BDC to increase the maximum amount of leverage it may incur from an asset coverage ratio of 200% to an asset coverage ratio of 150%, if certain requirements are met. See “Risks Relating to Our Business and Structure - Recent legislation may allow us to incur additional leverage” for more information. Moreover, our ability to make distributions to shareholders may be significantly restricted or we may not be able to make any such distributions whatsoever. The amount of leverage that we will employ will be subject to oversight by our board of directors, a majority of whom are independent directors with no material interests in such transactions.
At December 31, 2019, 2018 and 2017, our borrowings for the BDC coverage ratio were $841,042, $898,542 and $711,465, respectively, and resulted in coverage ratios of 213%, 209% and 249%, respectively. For a detailed discussion on the coverage ratio calculation, refer to Note 14 to our consolidated financial statements included in this report.
Illustration. The following table illustrates the effect of leverage on returns from an investment in our common stock assuming various annual returns, net of expenses. The calculations in the table below are hypothetical and actual returns may be higher or lower than those appearing below. The calculation assumes (i) $1.78 billion in total assets as of December 31, 2019, (ii) a weighted average cost of funds of 4.48%, (iii) $857 million in debt outstanding (i.e., assumes that 88% of the $975 million available to us as of December 31, 2019 under our financing arrangements as of such date is outstanding) and (iv) $952 million in shareholders’ equity. In order to compute the “Corresponding return to shareholders,” the “Assumed Return on Our Portfolio (net of expenses)” is multiplied by the assumed total assets to obtain an assumed return to us. From this amount, the interest expense is calculated by multiplying the assumed weighted average cost of funds times the assumed debt outstanding, and the product is subtracted from the assumed return to us in order to determine the return available to shareholders. The return available to shareholders is then divided by our shareholders’ equity to determine the “Corresponding return to shareholders.” Actual interest payments may be different.
Assumed Return on Our Portfolio (net of expenses) | -10% | -5% | 0% | 5% | 10% | |||||
Corresponding return to shareholders | (23.04)% | (13.54)% | (4.04)% | 5.46% | 14.96% | |||||
Similarly, assuming (i) $1.78 billion in total assets as of December 31, 2019, (ii) a weighted average cost of funds of 4.48% and (iii) $857 million in debt outstanding (i.e., assumes that 88% of the $975 million available to us as of December 31, 2019 under our financing arrangements as of such date is outstanding), our assets would need to yield an annual return (net of expenses) of approximately 2.12% in order to cover the annual interest payments on our outstanding debt.
37
Changes in interest rates may affect our cost of capital and net investment income.
Since we have used debt to finance a portion of our investments, our net investment income will depend, in part, upon the difference between the rate at which we borrow funds and the rate at which we invest those funds. As a result, we can offer no assurance that a significant change in market interest rates will not have a material adverse effect on our net investment income. In periods of rising interest rates when we have debt outstanding, our cost of funds will increase, which could reduce our net investment income. We expect that our long-term fixed-rate investments will be financed primarily with equity and long-term debt. We may use interest rate risk management techniques in an effort to limit our exposure to interest rate fluctuations. These techniques may include various interest rate hedging activities to the extent permitted by the 1940 Act. These activities may limit our ability to participate in the benefits of lower interest rates with respect to the hedged portfolio. Adverse developments resulting from changes in interest rates or hedging transactions could have a material adverse effect on our business, financial condition and results of operations. Also, we have limited experience in entering into hedging transactions, and we will initially have to purchase or develop such expertise.
A rise in the general level of interest rates can be expected to lead to higher interest rates applicable to our debt investments. Accordingly, an increase in interest rates would make it easier for us to meet or exceed the incentive fee hurdle rate and may result in a substantial increase in the amount of incentive fees payable to CIM with respect to pre-incentive fee net investment income.
Federal Income Tax Risks
We will be subject to corporate-level income tax if we are unable to qualify as a RIC under Subchapter M of the Code or to satisfy RIC distribution requirements.
To qualify for and maintain RIC tax treatment under Subchapter M of the Code, we must, among other things, meet the following annual distribution, income source and asset diversification requirements.
• | The annual distribution requirement for a RIC will be satisfied if we distribute to our shareholders on an annual basis at least 90% of our net ordinary income and realized net short-term capital gains in excess of realized net long-term capital losses, if any. Because we use debt financing, we are subject to an asset coverage ratio requirement under the 1940 Act and are subject to certain financial covenants under loan and credit agreements that could, under certain circumstances, restrict us from making distributions necessary to satisfy the distribution requirement. If we are unable to obtain cash from other sources, we could fail to qualify for RIC tax treatment and thus become subject to corporate-level income tax. |
• | The income source requirement will be satisfied if we obtain at least 90% of our income for each taxable year from dividends, interest, gains from the sale of common stock or securities or similar sources. |
• | The asset diversification requirement will be satisfied if we meet certain asset diversification requirements at the end of each quarter of our taxable year. To satisfy this requirement, at least 50% of the value of our assets must consist of cash, cash equivalents, U.S. government securities, securities of other RICs, and other securities if such other securities of any one issuer do not represent more than 5% of the value of our assets or more than 10% of the outstanding voting securities of the issuer; and no more than 25% of the value of our assets can be invested in the securities, other than U.S. government securities or securities of other RICs, of one issuer, of two or more issuers that are controlled, as determined under applicable Code rules, by us and that are engaged in the same or similar or related trades or businesses or of certain “qualified publicly-traded partnerships.” Failure to meet these requirements may result in our having to dispose of certain investments quickly in order to prevent the loss of RIC status. Because most of our investments will be in private companies, and therefore will be relatively illiquid, any such dispositions could be made at disadvantageous prices and could result in substantial losses. |
If we fail to qualify for or maintain RIC tax treatment for any reason and are subject to corporate income tax, the resulting corporate taxes could substantially reduce our net assets, the amount of income available for distribution and the amount of our distributions.
We may have difficulty paying our required distributions if we recognize income before or without receiving cash representing such income.
For federal income tax purposes, we may be required to recognize taxable income in circumstances in which we do not receive a corresponding payment in cash. For example, if we hold debt obligations that are treated under applicable tax rules as having original issue discount (such as debt instruments with PIK interest or, in certain cases, increasing interest rates or debt instruments that were issued with warrants), we must include in income each year a portion of the original issue discount that accrues over the life of the obligation, regardless of whether cash representing such income is received by us in the same taxable year. We may also have to include in income other amounts that we have not yet received in cash, such as deferred loan origination fees that are paid after origination of the loan or are paid in non-cash compensation such as warrants or stock. We anticipate that a portion of our income may constitute original issue discount or other income required to be included in taxable income prior to receipt of cash. Further, we may elect to amortize market discounts and include such amounts in our taxable income in the current year, instead of upon disposition, as an election not to do so would limit our ability to deduct interest expenses for tax purposes.
38
Because any original issue discount or other amounts accrued will be included in our investment company taxable income for the year of the accrual, we may be required to make a distribution to our shareholders in order to satisfy the annual distribution requirement, even though we will not have received any corresponding cash amount. As a result, we may have difficulty meeting the annual distribution requirement necessary to qualify for and maintain RIC tax treatment under Subchapter M of the Code. We may have to sell some of our investments at times and/or at prices we would not consider advantageous, raise additional debt or equity capital or forgo new investment opportunities for this purpose. If we are not able to obtain cash from other sources, we may fail to qualify for or maintain RIC tax treatment and thus become subject to corporate-level income tax.
Deferred PIK interest instruments may have less reliable valuations because these instruments have continuing accruals that require continuing judgment about the collectability of the deferred payments and the value of any associated collateral. In addition, deferred PIK interest instruments create the risk of non-refundable cash payments to our investment adviser based on non-cash accruals that ultimately may not be realized. For accounting purposes, any cash distributions to shareholders representing deferred PIK interest income are not treated as coming from paid-in capital, even though the cash to pay these distributions may come from offering proceeds. Thus, although a distribution of deferred PIK interest may come from the cash invested by shareholders, the 1940 Act does not require that shareholders be given notice of this fact by reporting it as a return of capital.
If we do not qualify as a “publicly offered regulated investment company,” as defined in the Code, shareholders will be taxed as though they received a distribution of some of our expenses.
A “publicly offered regulated investment company” is a RIC whose shares are either (i) continuously offered pursuant to a public offering within the meaning of Section 4 of the Securities Act, (ii) regularly traded on an established securities market or (iii) held by at least 500 persons at all times during the taxable year. If we are not a publicly offered RIC for any period, a non-corporate shareholder’s allocable portion of our affected expenses, including our management fees, will be treated as an additional distribution to the shareholder and will be deductible by such shareholder only to the extent permitted under the limitations described below. For non-corporate shareholders, including individuals, trusts, and estates, significant limitations generally apply to the deductibility of certain expenses of a non-publicly offered RIC, including advisory fees. In particular, these expenses, referred to as miscellaneous itemized deductions, are deductible to an individual only to the extent they exceed 2% of such a shareholder’s adjusted gross income, and are not deductible for alternative minimum tax purposes. While we anticipate that we will constitute a publicly offered RIC, there can be no assurance that we will in fact so qualify for any of our taxable years.
Risks Relating to an Investment in our Common Stock
Our common stock is not currently listed on an exchange or quoted through a quotation system. Therefore, shareholders will have limited liquidity and may not receive a full return of shareholder invested capital if shareholders sell their common stock. We are not obligated to complete a liquidity event by a specified date; therefore, until we complete a liquidity event, it is unlikely that shareholders will be able to sell their common stock.
Our shares are illiquid assets for which there is not currently a secondary market. Prior to the completion of a liquidity event, our share repurchase program provides a limited opportunity for investors to achieve liquidity, subject to certain restrictions and limitations, at a price which may reflect a discount from the purchase price paid for the common stock being repurchased. However, there can be no assurance that we will complete a liquidity event. See “Item 5. Market for Registrant’s Common Equity, Related Shareholder Matters and Issuer Purchases of Equity Securities – Share Repurchase Program” for a detailed description of our share repurchase program.
In making the decision to apply for listing of our common stock, our board of directors will try to determine whether listing our common stock or liquidating our assets will result in greater value for our shareholders. In making a determination of what type of liquidity event is in the best interest of our shareholders, our board of directors, including our independent directors, may consider a variety of criteria, including, but not limited to, maintaining a broad portfolio of investments, portfolio performance, our financial condition, potential access to capital as a listed company, the investment advisory experience of CIM and market conditions for the sale of our assets or listing of our common stock and the potential for shareholder liquidity. If we determine to pursue a listing of our common stock on a national securities exchange in the future, at that time we may consider either an internal or an external management structure. There can be no assurance that we will complete a liquidity event. Until we complete a liquidity event, it is unlikely that shareholders will be able to sell their shares. If our common stock is listed, we cannot assure shareholders that a public trading market will develop. Further, even if we do complete a liquidity event, shareholders may not receive a return of all of their invested capital.
39
Beginning in the first quarter of 2014, we began offering to repurchase shares of our common stock on a quarterly basis. As a result, shareholders have limited opportunities to sell their shares of our common stock and, to the extent they are able to sell their shares of our common stock under the program, they may not be able to recover the amount of their investment in our common stock.
Beginning in the first quarter of 2014, we commenced tender offers to allow shareholders to tender their shares of common stock on a quarterly basis at a price equal to 90% of our public offering price in effect on the date of repurchase; provided that, solely for our quarterly repurchase offer for the fourth quarter of 2015, we repurchased shares from tendering shareholders at a price that was (i) not less than the net asset value per share and (ii) not more than 2.5% greater than the net asset value per share. Commencing with our quarterly repurchase offer for the fourth quarter of 2016 and on a quarterly basis thereafter, we repurchase shares from tendering shareholders at a price equal to the estimated net asset value per share on the date of repurchase. The share repurchase program includes numerous restrictions that limit shareholders’ ability to sell their shares of common stock. We limit the number of shares of common stock repurchased pursuant to our share repurchase program as follows: (1) we currently limit the number of shares of common stock to be repurchased during any calendar year to the number of shares of common stock we can repurchase with the proceeds we receive from the issuance of shares of our common stock pursuant to our fifth amended and restated distribution reinvestment plan, although at the discretion of our board of directors, we may also use cash on hand, cash available from borrowings and cash from liquidation of securities investments as of the end of the applicable period to repurchase shares of common stock; (2) we will not repurchase shares of common stock in any calendar year in excess of 15% of the weighted average number of shares of common stock outstanding in the prior calendar year, or 3.75% in each quarter; (3) unless a shareholder tenders all of his or her shares of common stock, he or she must tender at least 25% of the amount of common stock the shareholder purchased in the offering and must generally maintain a minimum balance of $5,000 subsequent to submitting a portion of his or her shares of common stock for repurchase by us; and (4) to the extent that the number of shares of common stock put to us for repurchase exceeds the number of shares of common stock that we are able to purchase, we will repurchase shares of common stock on a pro rata basis, not on a first-come, first-served basis. Further, we will have no obligation to repurchase shares of common stock if the repurchase would violate the restrictions on distributions under federal law or Maryland law.
Although we have adopted a share repurchase program, we have discretion to not repurchase shares of common stock, to suspend the program, and to cease repurchases.
Our board of directors may amend, suspend or terminate the share repurchase program upon 30 days’ notice. Shareholders may not be able to sell their shares at all in the event our board of directors amends, suspends or terminates the share repurchase program, absent a liquidity event. We will notify shareholders of such developments (1) in our quarterly reports or (2) by means of a separate mailing to shareholders, accompanied by disclosure in a current or periodic report under the Exchange Act. The share repurchase program has many limitations and should not be relied upon as a method to sell shares of common stock promptly or at a desired price.
The timing of our repurchase offers pursuant to our share repurchase program may be at a time that is disadvantageous to our shareholders.
When we make quarterly repurchase offers pursuant to the share repurchase program, the repurchase price will be lower than the price that investors paid for common stock in our offering, unless we experience substantial capital appreciation and capital gains. As a result, to the extent investors have the ability to sell their common stock to us as part of our share repurchase program, the price at which an investor may sell common stock, which will be the estimated net asset value per share on the date of repurchase, may be lower than what an investor paid in connection with the purchase of common stock in our offering.
In addition, in the event an investor chooses to participate in our share repurchase program, the investor will be required to provide us with notice of intent to participate prior to knowing what the estimated net asset value per share will be on the repurchase date. Although an investor will have the ability to withdraw a repurchase request prior to the repurchase date, to the extent an investor seeks to sell common stock to us as part of our periodic share repurchase program, the investor will be required to do so without knowledge of what the repurchase price of our common stock will be on the repurchase date.
A shareholder’s interest in us will be diluted if we issue additional shares of common stock, which could reduce the overall value of an investment in us.
Potential investors will not have preemptive rights to any common stock we issue in the future. Our articles of incorporation authorize us to issue 500,000,000 shares of common stock. Pursuant to our articles of incorporation, a majority of our entire board of directors may amend our articles of incorporation to increase the number of authorized shares of common stock without shareholder approval. To the extent that we issue additional shares of common stock at or below net asset value after an investor purchases shares of our common stock, an investor’s percentage ownership interest in us will be diluted. In addition, depending upon the terms and pricing of any additional offerings and the value of our investments, an investor may also experience dilution in the book value and fair value of his or her shares of common stock.
40
Certain provisions of our articles of incorporation and bylaws could deter takeover attempts and have an adverse impact on the value of our common stock.
Our bylaws exempt us from the Maryland Control Share Acquisition Act, which significantly restricts the voting rights of control shares of a Maryland corporation acquired in a control share acquisition. If our board of directors were to amend our bylaws to repeal this exemption from the Maryland Control Share Acquisition Act, that statute may make it more difficult for a third party to obtain control of us and increase the difficulty of consummating such a transaction. There can be no assurance, however, that we will not so amend our bylaws in such a manner at some time in the future. We will not, however, amend our bylaws to make us subject to the Maryland Control Share Acquisition Act without our board of directors determining that doing so would not conflict with the 1940 Act and obtaining confirmation from the SEC that it does not object to such determination.
Our articles of incorporation and bylaws, as well as certain statutory and regulatory requirements, contain certain provisions that may have the effect of discouraging a third party from attempting to acquire us. Our board of directors may, without shareholder action, authorize the issuance of shares in one or more classes or series, including preferred shares; and our board of directors may, without shareholder action, amend our articles of incorporation to increase the number of our shares, of any class or series, that we have authority to issue. These anti-takeover provisions may inhibit a change of control in circumstances that could give the holders of our common stock the opportunity to realize a premium over the value of our common stock.
Certain provisions of our articles of incorporation complying with the Omnibus Guidelines of the North American Securities Administrators Association will terminate upon a listing of our shares on an exchange or quoted through a quotation system.
In the event that our shares are listed on an exchange or quoted through a quotation system, Article XIII of our current articles of incorporation provides that certain provisions of our articles will no longer apply, including, for example, provisions relating to deferred payments, suitability of investors, votes required for amendments to the articles of incorporation, investment objectives and limitations, conflicts of interest and roll-up transactions. These provisions are required by the Omnibus Guidelines for non-listed public companies and are not required for listed public companies. The elimination of these provisions may mean that shareholders have less protection than they did prior to the listing of our shares.
Investing in our common stock involves a high degree of risk.
The investments we make in accordance with our investment objective may result in a higher amount of risk than alternative investment options and volatility or loss of principal. Our investments in portfolio companies may be highly speculative and aggressive and, therefore, an investment in our common stock may not be suitable for someone with lower risk tolerance.
The net asset value of our common stock may fluctuate significantly.
The net asset value and liquidity, if any, of the market for shares of our common stock may be significantly affected by numerous factors, some of which are beyond our control and may not be directly related to our operating performance. These factors include:
• | changes in regulatory policies or tax guidelines, particularly with respect to RICs or BDCs; |
• | loss of RIC or BDC status; |
• | changes in earnings or variations in operating results; |
• | changes in the value of our portfolio of investments; |
• | changes in accounting guidelines governing valuation of our investments; |
• | any shortfall in revenue or net income or any increase in losses from levels expected by investors; |
• | departure of either of our adviser or certain of its key personnel; |
• | general economic trends and other external factors; and |
• | loss of a major funding source. |
Item 1B. Unresolved Staff Comments
Not applicable.
Item 2. Properties
We do not own any real estate or other physical properties materially important to our operations. Our executive offices are located at 3 Park Avenue, 36th Floor, New York, NY 10016. We believe that our current office facilities are adequate for our business as it is presently conducted.
41
Item 3. Legal Proceedings
We are not currently subject to any material legal proceedings, nor, to our knowledge, is any material legal proceeding threatened against us. From time to time, we may be party to certain legal proceedings in the ordinary course of business, including proceedings relating to the enforcement of our rights under contracts with our portfolio companies and other third parties. While the outcome of these legal proceedings cannot be predicted with certainty, we do not expect that any such proceedings will have a material effect upon our financial condition or results of operations.
Item 4. Mine Safety Disclosures
Not applicable.
42
PART II
Item 5. Market for Registrant’s Common Equity, Related Shareholder Matters and Issuer Purchases of Equity Securities
Our shares are not listed on an exchange or quoted through a quotation system. There is currently no market for our common stock, and we do not expect that a market for our shares will develop in the future. No shares have been authorized for issuance under any equity compensation plans. Under Maryland law, our shareholders generally will not be personally liable for our debts or obligations.
On January 25, 2019, we closed our continuous follow-on public offering of shares to new investors. Following the closing of our continuous follow-on public offering, we have continued to issue shares pursuant to our distribution reinvestment plan, as amended and restated.
Although our common stock is not currently listed on an exchange, we intend to seek to complete a liquidity event within three to five years following the completion of our offering stage or at such earlier time as our board of directors may determine, taking into consideration market conditions and other factors. We will view our offering stage as complete as of the termination date of our most recent public equity offering if we have not conducted a public equity offering in any continuous two-year period. However, there can be no assurance that we will be able to complete a liquidity event.
Set forth below is a chart describing the classes of our securities outstanding as of March 13, 2020:
Title of Class | Amount Authorized | Amount Held by Us or for Our Account | Amount Outstanding Exclusive of Amount Held by Us or for Our Account | |||
Common stock | 500,000,000 | — | 113,978,282 | |||
As of March 13, 2020, we had 21,986 record holders of our common stock.
Share Repurchase Program
Our common stock is not currently listed on any securities exchange. It is unlikely that shareholders will be able to sell their common stock when desired or at a desired price. No shareholder will have the right to require us to repurchase his or her common stock or any portion thereof. Because no public market currently exists for our common stock, shareholders will not be able to liquidate their investment prior to our liquidation or other liquidity event, other than through our share repurchase program, or, in limited circumstances, as a result of transfers of common stock to other eligible investors.
Beginning in the first quarter of 2014, we began offering, and on a quarterly basis thereafter we intend to continue offering, to repurchase common stock on such terms as may be determined by our board of directors in its complete and absolute discretion unless, in the judgment of the independent directors of our board of directors, such repurchases would not be in the best interests of our shareholders or would violate applicable law. We conduct such repurchase offers in accordance with the requirements of Rule 13e-4 of the Exchange Act and the 1940 Act. In months in which we repurchase common stock, we generally conduct repurchases on the last Wednesday in a calendar month. The offer to repurchase common stock is conducted solely through tender offer materials made available to each shareholder.
The board also considers the following factors, among others, in making its determination regarding whether to cause us to continue offering to repurchase shares and under what terms:
· the effect of such repurchases on our qualification as a RIC (including the consequences of any necessary asset sales);
· the liquidity of our assets (including fees and costs associated with disposing of assets);
· our investment plans and working capital requirements;
· the relative economies of scale with respect to our size;
· our history in repurchasing shares or portions thereof; and
· the condition of the securities markets.
On December 8, 2016, we further amended the terms of the share repurchase program, effective as of our quarterly repurchase offer for the fourth quarter of 2016, which commenced in November 2016 and was completed in January 2017. Under the further amended share repurchase program, we will offer to repurchase shares of common stock at a price equal to the estimated net asset value per share determined on each date of repurchase.
43
We currently limit the number of shares of common stock to be repurchased during any calendar year to the number of shares of common stock we can repurchase with the proceeds we receive from the issuance of shares of our common stock pursuant to our fifth amended and restated distribution reinvestment plan. At the discretion of our board of directors, we may also use cash on hand, cash available from borrowings and cash from liquidation of investments as of the end of the applicable period to repurchase common stock. We offer to repurchase such common stock on each date of repurchase at a price equal to the estimated net asset value per share on each date of repurchase.
We do not repurchase common stock, or fractions thereof, if such repurchase causes us to be in violation of the securities or other laws of the U.S., Maryland or any other relevant jurisdiction.
While we have conducted quarterly tender offers as described above, we are not required to do so and may suspend or terminate the share repurchase program at any time, upon 30 days’ notice.
The table below provides information concerning our repurchases of shares of our common stock during the quarter ended December 31, 2019 pursuant to our share repurchase program.
Period | Total Number of Shares Purchased | Average Price Paid per Share | Total Number of Shares Purchased as Part of Publicly Announced Plans or Programs | Maximum Number of Shares That May Yet Be Purchased Under the Plans or Programs | ||||||||||
October 1 to October 31, 2019 | — | $ | — | — | — | |||||||||
November 1 to November 30, 2019 | — | — | — | — | ||||||||||
December 1 to December 31, 2019 | 1,089,259 | 8.22 | 1,089,259 | (1 | ) | |||||||||
Total | 1,089,259 | $ | 8.22 | 1,089,259 | (1 | ) | ||||||||
(1) | See above for a description of the maximum number of shares of our common stock that may be repurchased under our share repurchase program. |
In the event that CIM or any of its affiliates holds common stock in the capacity of a shareholder, any such affiliates may tender common stock for repurchase in connection with any repurchase offer we make on the same basis as any other shareholder. CIG will not tender its common stock for repurchase as long as CIM remains our investment adviser.
Distributions
We did not declare or pay any distributions during 2012. In January 2013, we began authorizing monthly distributions to our shareholders. On February 1, 2014, we changed from semi-monthly closings to weekly closings for the sale of our shares. As a result, from February 1, 2014 through July 17, 2017, our board of directors authorized and declared on a monthly basis a weekly distribution amount per share of our common stock. On July 18, 2017, our board of directors authorized and declared on a quarterly basis a weekly distribution amount per share of our common stock. Effective September 28, 2017, our board of directors delegated to management the authority to determine the amount, record dates, payment dates and other terms of distributions to shareholders, which will be ratified by our board of directors, each on a quarterly basis. Subject to our board of directors’ discretion and applicable legal restrictions, our management intends to continue to authorize and declare, and our board of directors intends to continue to ratify, each on a quarterly basis, a weekly distribution amount per share of our common stock. Declared distributions are paid monthly. We will calculate each shareholder’s specific distribution amount for the period using record and declaration dates and each shareholder’s distributions will begin to accrue on the date we accepted each shareholder’s subscription for shares of our common stock. From time to time, we may also pay interim special distributions in the form of cash or shares of common stock at the discretion of our board of directors. Each year, information regarding the sources of our distributions (i.e., paid from ordinary income, paid from net capital gains on the sale of securities, and/or a return of capital, the latter of which is a nontaxable distribution) will be provided to our shareholders. Our distributions may exceed our earnings. As a result, a portion of the distributions we make may represent a return of capital.
We elected to be treated for federal income tax purposes as a RIC, as defined under Subchapter M of the Code, beginning in 2012.
44
To qualify for and maintain RIC tax treatment, we must, among other things, distribute in respect of each taxable year at least 90% of our net ordinary income and realized net short-term capital gains in excess of realized net long-term capital losses, if any. In order to avoid certain excise taxes imposed on RICs, we are required to distribute in respect of each calendar year an amount at least equal to the sum of (1) 98.0% of our net ordinary income (taking into account certain deferrals and elections) for the calendar year, (2) 98.2% of our capital gains in excess of capital losses, or capital gain net income (adjusted for certain ordinary losses), for the one-year period ending on October 31 of the calendar year and (3) any net ordinary income and capital gain net income from preceding years that were not distributed during such years and on which we paid no federal income tax. We can offer no assurance that we will achieve results that will permit the payment of any cash distributions and, if we issue senior securities, we will be prohibited from making distributions if doing so causes us to fail to maintain the asset coverage ratios stipulated by the 1940 Act or if distributions are limited by the terms of any of our borrowings.
Our board of directors declared or ratified distributions for 53, 52 and 52 record dates during the years ended December 31, 2019, 2018 and 2017, respectively. The following table presents cash distributions per share that were declared during the years ended December 31, 2019, 2018 and 2017:
Distributions | ||||||||
Three Months Ended | Per Share | Amount | ||||||
2017 | ||||||||
March 31, 2017 (thirteen record dates) | $ | 0.1829 | $ | 20,123 | ||||
June 30, 2017 (thirteen record dates) | 0.1829 | 20,371 | ||||||
September 30, 2017 (thirteen record dates) | 0.1829 | 20,644 | ||||||
December 31, 2017 (thirteen record dates) | 0.1829 | 20,923 | ||||||
Total distributions for the year ended December 31, 2017 | $ | 0.7316 | $ | 82,061 | ||||
2018 | ||||||||
March 31, 2018 (thirteen record dates) | $ | 0.1829 | $ | 21,002 | ||||
June 30, 2018 (thirteen record dates) | 0.1829 | 21,004 | ||||||
September 30, 2018 (thirteen record dates) | 0.1829 | 20,776 | ||||||
December 31, 2018 (thirteen record dates) | 0.1829 | 20,701 | ||||||
Total distributions for the year ended December 31, 2018 | $ | 0.7316 | $ | 83,483 | ||||
2019 | ||||||||
March 31, 2019 (thirteen record dates) | $ | 0.1829 | $ | 20,772 | ||||
June 30, 2019 (thirteen record dates) | 0.1829 | 20,801 | ||||||
September 30, 2019 (thirteen record dates) | 0.1829 | 20,798 | ||||||
December 31, 2019 (fourteen record dates) | 0.1969 | 22,401 | ||||||
Total distributions for the year ended December 31, 2019 | $ | 0.7456 | $ | 84,772 | ||||
45
On December 18, 2019, our co-chief executive officers (i) revised the record date for the weekly cash distributions covering the final week of December 2019; (ii) revised the payment date for the weekly cash distributions covering the entire month of December 2019; and (iii) declared regular weekly cash distributions of $0.014067 per share for January 2020 through March 2020. Each distribution was paid or will be paid monthly to shareholders of record as of the weekly record dates set forth below.
Record Date | Payment Date | Distribution Amount Per Share | ||
December 3, 2019 | December 27, 2019 | $0.014067 | ||
December 10, 2019 | December 27, 2019 | $0.014067 | ||
December 17, 2019 | December 27, 2019 | $0.014067 | ||
December 24, 2019 | December 27, 2019 | $0.014067 | ||
December 26, 2019 | December 27, 2019 | $0.014067 | ||
January 7, 2020 | January 29, 2020 | $0.014067 | ||
January 14, 2020 | January 29, 2020 | $0.014067 | ||
January 21, 2020 | January 29, 2020 | $0.014067 | ||
January 28, 2020 | January 29, 2020 | $0.014067 | ||
February 4, 2020 | February 26, 2020 | $0.014067 | ||
February 11, 2020 | February 26, 2020 | $0.014067 | ||
February 18, 2020 | February 26, 2020 | $0.014067 | ||
February 25, 2020 | February 26, 2020 | $0.014067 | ||
March 3, 2020 | March 27, 2020 | $0.014067 | ||
March 10, 2020 | March 27, 2020 | $0.014067 | ||
March 17, 2020 | March 27, 2020 | $0.014067 | ||
March 24, 2020 | March 27, 2020 | $0.014067 | ||
March 26, 2020 | March 27, 2020 | $0.014067 | ||
We have adopted an “opt in” distribution reinvestment plan for our shareholders. As a result, if we make a distribution, our shareholders will receive distributions in cash unless they specifically “opt in” to the fifth amended and restated distribution reinvestment plan so as to have their cash distributions reinvested in additional shares of our common stock.
We have made and intend to make our distributions in the form of cash, out of assets legally available for such purpose, unless shareholders elect to receive their distributions in the form of additional shares of common stock pursuant to our fifth amended and restated distribution reinvestment plan. Any distributions reinvested under the plan will nevertheless remain taxable to U.S. shareholders. We may fund our cash distributions to shareholders in the future from any sources of funds available to us, including borrowings, net investment income from operations, capital gains proceeds from the sale of assets, non-capital gains proceeds from the sale of assets, dividends or other distributions paid to us on account of preferred and common equity investments in portfolio companies and expense support from CIM. On January 2, 2018, we entered into an expense support and conditional reimbursement agreement with CIM for the primary purpose of replacing CIG and AIM with CIM as the expense support provider pursuant to the terms of the expense support and conditional reimbursement agreement. On December 20, 2019, we amended and restated the expense support and conditional reimbursement agreement with CIM for purposes of extending the termination date from December 31, 2019 to December 31, 2020. Through December 31, 2014, a portion of our distributions resulted from expense support from CIG, and future distributions may result from expense support from CIM, which is subject to repayment by us. For the year ended December 31, 2017, none of our distributions resulted from expense support from CIG or AIM. For the years ended December 31, 2018 and 2019, none of our distributions resulted from expense support from CIM. The amount of the distribution for shareholders receiving our common stock will be equal to the fair market value of the stock received. If shareholders hold common stock in the name of a broker or financial intermediary, they should contact the broker or financial intermediary regarding their election to receive distributions in the form of additional common stock.
46
The following table reflects the sources of cash distributions on a GAAP basis that were declared during the years ended December 31, 2019, 2018 and 2017:
Years Ended December 31, | |||||||||||||||||||||||||||||||||
2019 | 2018 | 2017 | |||||||||||||||||||||||||||||||
Source of Distribution | Per Share | Amount | Percentage | Per Share | Amount | Percentage | Per Share | Amount | Percentage | ||||||||||||||||||||||||
Net investment income | $ | 0.7456 | $ | 84,772 | 100.0 | % | $ | 0.7316 | $ | 83,483 | 100.0 | % | $ | 0.6833 | $ | 76,683 | 93.4 | % | |||||||||||||||
Net realized gain on total return swap | |||||||||||||||||||||||||||||||||
Net interest and other income from TRS portfolio | — | — | — | — | — | — | 0.0315 | 3,494 | 4.3 | % | |||||||||||||||||||||||
Net gain on TRS loan sales(1) | — | — | — | — | — | — | 0.0168 | 1,884 | 2.3 | % | |||||||||||||||||||||||
Total distributions | $ | 0.7456 | $ | 84,772 | 100.0 | % | $ | 0.7316 | $ | 83,483 | 100.0 | % | $ | 0.7316 | $ | 82,061 | 100.0 | % | |||||||||||||||
(1) | During the year ended December 31, 2017, we realized losses that were not currently deductible on a tax-basis of $19,334 primarily due to the purchase of loans by Flatiron Funding II that were previously held in the TRS in connection with the TRS refinancing. See Note 9 to our consolidated financial statements included in this report for an additional discussion regarding this purchase. Losses of $10,055 and $12,537 remained non-deductible as of December 31, 2019 and 2018, respectively. |
47
Item 6. Selected Financial Data
The following selected financial data for the years ended December 31, 2019, 2018, 2017, 2016 and 2015 is derived from our audited consolidated financial statements. The data for the years ended December 31, 2019, 2018 and 2017 should be read in conjunction with our consolidated financial statements and related notes thereto and “Item 7. Management’s Discussion and Analysis of Financial Condition and Results of Operations” included elsewhere in this report. Certain reclassifications have been made to conform to the current presentation.
Years Ended December 31, | ||||||||||||||||||||
2019 | 2018 | 2017 | 2016 | 2015 | ||||||||||||||||
Statement of operations data: | ||||||||||||||||||||
Total investment income | $ | 201,103 | $ | 188,138 | $ | 152,432 | $ | 82,276 | $ | 52,964 | ||||||||||
Operating expenses | ||||||||||||||||||||
Total operating expenses | 113,791 | 97,961 | 65,122 | 32,212 | 23,380 | |||||||||||||||
Recoupment of expense support from CIG | — | — | — | 667 | 4,667 | |||||||||||||||
Net operating expenses | 113,791 | 97,961 | 65,122 | 32,879 | 28,047 | |||||||||||||||
Net investment income | 87,312 | 90,177 | 87,310 | 49,397 | 24,917 | |||||||||||||||
Net realized and unrealized (loss) gain on investments, foreign currency and total return swap | (35,468 | ) | (58,867 | ) | (1,411 | ) | 70,276 | (26,359 | ) | |||||||||||
Net increase (decrease) in net assets resulting from operations | $ | 51,844 | $ | 31,310 | $ | 85,899 | $ | 119,673 | $ | (1,442 | ) | |||||||||
Weighted average shares of common stock outstanding(1) | 113,708,479 | 114,140,434 | 112,256,276 | 105,951,017 | 78,501,760 | |||||||||||||||
Per share data:(1) | ||||||||||||||||||||
Net investment income(2) | $ | 0.77 | $ | 0.79 | $ | 0.78 | $ | 0.47 | $ | 0.32 | ||||||||||
Net increase (decrease) in net assets resulting from operations | $ | 0.46 | $ | 0.27 | $ | 0.77 | $ | 1.13 | $ | (0.02 | ) | |||||||||
Distributions declared | $ | 0.75 | $ | 0.73 | $ | 0.73 | $ | 0.73 | $ | 0.73 | ||||||||||
Balance sheet data: | ||||||||||||||||||||
Net assets at the beginning of period | $ | 979,271 | $ | 1,058,691 | $ | 999,763 | $ | 904,326 | $ | 496,389 | ||||||||||
Net assets at end of period | $ | 952,563 | $ | 979,271 | $ | 1,058,691 | $ | 999,763 | $ | 904,326 | ||||||||||
Net asset value per share of common stock at beginning of period | $ | 8.69 | $ | 9.14 | $ | 9.11 | $ | 8.71 | $ | 9.22 | ||||||||||
Net asset value per share of common stock at end of period | $ | 8.40 | $ | 8.69 | $ | 9.14 | $ | 9.11 | $ | 8.71 | ||||||||||
Other data: | ||||||||||||||||||||
Distributions declared | $ | 84,772 | $ | 83,483 | $ | 82,061 | $ | 77,459 | $ | 57,268 | ||||||||||
Total investment return - net asset value(3) | 5.55 | % | 2.98 | % | 8.76 | % | 13.51 | % | 2.13 | % | ||||||||||
Number of investments at period end | 199 | 191 | 186 | 123 | 86 | |||||||||||||||
Total portfolio investment purchases during the period(4) | $ | 563,884 | $ | 1,280,187 | $ | 1,420,747 | $ | 569,893 | $ | 438,217 | ||||||||||
Total portfolio investment sales and prepayments during the period(4) | $ | 668,789 | $ | 895,670 | $ | 951,044 | $ | 229,075 | $ | 113,433 | ||||||||||
(1) | The per share data was derived by using the weighted average shares of common stock outstanding for the years ended December 31, 2019, 2018, 2017, 2016 and 2015, respectively. |
48
(2) | There was no expense support from CIM for the years ended December 31, 2019 or 2018. There was no expense support from CIG or AIM for the years ended December 31, 2017, 2016 or 2015. Net investment income per share also includes expense support recoupments by CIG of $0.01 and $0.06 per share for the years ended December 31, 2016 and 2015, respectively. There was no expense support recoupments by CIG for the years ended December 31, 2019, 2018 or 2017. |
(3) | Total investment return-net asset value is a measure of the change in total value for shareholders who held our common stock at the beginning and end of the period, including distributions paid or payable during the period. Total investment return-net asset value is based on (i) the beginning period net asset value per share on the first day of the period, (ii) the net asset value per share on the last day of the period of (A) one share plus (B) any fractional shares issued in connection with the reinvestment of monthly distributions, and (iii) the value of distributions payable, if any, on the last day of the period. The total investment return-net asset value calculation assumes that monthly cash distributions are reinvested in accordance with our distribution reinvestment plan then in effect as described in Note 5 to our consolidated financial statements included in this report. The total investment return-net asset value does not consider the effect of the sales load from the sale of our common stock. The total investment return-net asset value includes the effect of the issuance of shares at a net offering price that is greater than net asset value per share, which causes an increase in net asset value per share. Total returns covering less than a full year are not annualized. |
(4) | Excludes our short term investments. |
49
Item 7. Management’s Discussion and Analysis of Financial Condition and Results of Operations
The following discussion should be read in conjunction with our consolidated financial statements and related notes and other financial information appearing elsewhere in this Annual Report on Form 10-K. In addition to historical information, the following discussion and other parts of this Annual Report on Form 10-K contain forward-looking information that involves risks and uncertainties.
Overview
We were incorporated under the general corporation laws of the State of Maryland on August 9, 2011 and commenced operations on December 17, 2012 upon raising proceeds of $2,500 from persons not affiliated with us, CIM or Apollo. We are an externally managed, non-diversified closed-end management investment company that has elected to be regulated as a BDC under the 1940 Act. We elected to be treated for federal income tax purposes as a RIC, as defined under Subchapter M of the Code.
Our investment objective is to generate current income and, to a lesser extent, capital appreciation for investors. Our portfolio is comprised primarily of investments in senior secured debt, including first lien loans, second lien loans and unitranche loans, and, to a lesser extent, collateralized securities, structured products and other similar securities, unsecured debt and equity, of private and thinly-traded U.S. middle-market companies. In connection with our debt investments, we may receive equity interests such as warrants or options as additional consideration. We may also purchase equity interests in the form of common or preferred stock in our target companies, either in conjunction with one of our debt investments or through a co-investment with a financial sponsor.
We are managed by CIM, our affiliate and a registered investment adviser. Pursuant to an investment advisory agreement with us, CIM oversees the management of our activities and is responsible for making investment decisions for our portfolio. On November 5, 2019, our board of directors, including a majority of directors who are not interested persons, approved the renewal of the investment advisory agreement with CIM for a period of twelve months commencing December 17, 2019. We and CIM previously engaged AIM to act as our investment sub-adviser.
On July 11, 2017, the members of CIM entered into the Third Amended CIM LLC Agreement for the purpose of creating a joint venture between AIM and CIG. Under the Third Amended CIM LLC Agreement, AIM became a member of CIM and was issued a newly-created class of membership interests in CIM pursuant to which AIM, among other things, shares in the profits, losses, distributions and expenses of CIM with the other members in accordance with the terms of the Third Amended CIM LLC Agreement, which results in CIG and AIM each owning a 50% economic interest in CIM.
On July 10, 2017, our independent directors unanimously approved the termination of the investment sub-advisory agreement with AIM, effective as of July 11, 2017, as part of the new and ongoing relationship among us, CIM and AIM. Although the investment sub-advisory agreement and AIM's engagement as our investment sub-adviser were terminated, AIM's investment professionals continue to perform certain services for CIM and us, including, without limitation, identifying investment opportunities for approval by CIM's investment committee. AIM is not paid a separate fee in exchange for such services, but is entitled to receive distributions as a member of CIM as described above.
On December 4, 2017, the members of CIM entered into the Fourth Amended CIM LLC Agreement. Under the Fourth Amended CIM LLC Agreement. AIM’s investment professionals perform certain services for CIM, which include, among other services, (i) assistance with identifying and providing information about potential investment opportunities for approval by CIM’s investment committee; and (ii) providing (a) trade and settlement support; (b) portfolio and cash reconciliation; (c) market pipeline information regarding syndicated deals, in each case, as reasonably requested by CIM; and (d) monthly valuation reports and support for all broker-quoted investments. All of our investment decisions are the sole responsibility of, and are made at the sole discretion of, CIM's investment committee, which consists entirely of CIG personnel.
We seek to meet our investment objective by utilizing the experienced management team of CIM, which includes its access to the relationships and human capital of its affiliates in sourcing, evaluating and structuring transactions, as well as monitoring and servicing our investments. We focus primarily on the senior secured debt of private and thinly-traded U.S. middle-market companies, which we define as companies that generally possess annual EBITDA of $50 million or less, with experienced management teams, significant free cash flow, strong competitive positions and potential for growth.
Revenue
We primarily generate revenue in the form of interest income on the debt securities that we hold and capital gains on debt or other equity interests that we acquire in portfolio companies. The majority of our senior debt investments bear interest at a floating rate. Interest on debt securities is generally payable quarterly or monthly. In some cases, some of our investments may provide for deferred interest payments or PIK interest. The principal amount of the debt securities and any accrued, but unpaid, interest generally will become due at the maturity date. In addition, we may generate revenue in the form of commitment and capital structuring fees, monitoring fees, fees for providing managerial assistance and possibly consulting fees and performance-based fees. Any such fees generated in connection with our investments will be recognized when earned.
Operating Expenses
50
Our primary operating expenses are the payment of advisory fees and subordinated incentive fees on income under the investment advisory agreement and interest expense on our financing arrangements. Our investment advisory fees compensate CIM for its work in identifying, evaluating, negotiating, executing, monitoring and servicing our investments. We bear all other expenses of our operations and transactions.
Reclassification
In 2018, unamortized original issue discounts, or OID, and market discounts/premiums received upon the early repayment of debt investments were reclassified from net realized gains on investments to interest income. As a result, 2017 amounts have been reclassified to conform to the current presentation.
Portfolio Investment Activity for the Years Ended December 31, 2019 and 2018
The following table summarizes our investment activity, excluding short term investments and PIK securities, for the years ended December 31, 2019 and 2018:
Years Ended December 31, | ||||||||
Net Investment Activity | 2019 | 2018 | ||||||
Purchases and drawdowns | ||||||||
Senior secured first lien debt | $ | 527,869 | $ | 1,134,470 | ||||
Senior secured second lien debt | 28,049 | 128,644 | ||||||
Unsecured debt | 4,900 | — | ||||||
Equity | 74,511 | 17,073 | ||||||
Sales and principal repayments | (740,234 | ) | (895,670 | ) | ||||
Net portfolio activity | $ | (104,905 | ) | $ | 384,517 | |||
The following tables summarize the composition of our investment portfolio at amortized cost and fair value as of December 31, 2019 and 2018:
December 31, 2019 | |||||||||||
Investments Cost(1) | Investments Fair Value | Percentage of Investment Portfolio | |||||||||
Senior secured first lien debt | $ | 1,388,942 | $ | 1,351,767 | 77.9 | % | |||||
Senior secured second lien debt | 264,280 | 248,253 | 14.3 | % | |||||||
Collateralized securities and structured products - debt | 7,212 | 7,212 | 0.4 | % | |||||||
Collateralized securities and structured products - equity | 16,476 | 14,182 | 0.8 | % | |||||||
Unsecured debt | 4,901 | 4,900 | 0.3 | % | |||||||
Equity | 115,738 | 109,231 | 6.3 | % | |||||||
Subtotal/total percentage | 1,797,549 | 1,735,545 | 100.0 | % | |||||||
Short term investments(2) | 29,527 | 29,527 | |||||||||
Total investments | $ | 1,827,076 | $ | 1,765,072 | |||||||
Number of portfolio companies | 136 | ||||||||||
Average annual EBITDA of portfolio companies | $81.7 million | ||||||||||
Median annual EBITDA of portfolio companies | $56.1 million | ||||||||||
Purchased at a weighted average price of par | 97.68 | % | |||||||||
Gross annual portfolio yield based upon the purchase price(3) | 9.33 | % | |||||||||
(1) | Represents amortized cost for debt investments and cost for equity investments. Amortized cost represents the original cost adjusted for the amortization of premiums and/or accretion of discounts, as applicable, on our investments. |
(2) | Short term investments represent an investment in a fund that invests in highly liquid investments with average original maturity dates of three months or less. |
(3) | The gross annual portfolio yield does not represent and may be higher than an actual investment return to shareholders because it excludes our expenses and all sales commissions and dealer manager fees and does not consider the cost of leverage. |
51
December 31, 2018 | |||||||||||
Investments Cost(1) | Investments Fair Value | Percentage of Investment Portfolio | |||||||||
Senior secured first lien debt | $ | 1,492,034 | $ | 1,462,989 | 79.0 | % | |||||
Senior secured second lien debt | 341,595 | 323,365 | 17.4 | % | |||||||
Collateralized securities and structured products - debt | 15,193 | 15,193 | 0.8 | % | |||||||
Collateralized securities and structured products - equity | 16,794 | 14,827 | 0.8 | % | |||||||
Equity | 38,610 | 36,399 | 2.0 | % | |||||||
Subtotal/total percentage | 1,904,226 | 1,852,773 | 100.0 | % | |||||||
Short term investments(2) | 12,537 | 12,537 | |||||||||
Total investments | $ | 1,916,763 | $ | 1,865,310 | |||||||
Number of portfolio companies | 153 | ||||||||||
Average annual EBITDA of portfolio companies | $79.0 million | ||||||||||
Median annual EBITDA of portfolio companies | $56.0 million | ||||||||||
Purchased at a weighted average price of par | 97.35 | % | |||||||||
Gross annual portfolio yield based upon the purchase price(3) | 9.83 | % | |||||||||
(1) | Represents amortized cost for debt investments and cost for equity investments. Amortized cost represents the original cost adjusted for the amortization of premiums and/or accretion of discounts, as applicable, on our investments. |
(2) | Short term investments represent an investment in a fund that invests in highly liquid investments with average original maturity dates of three months or less. |
(3) | The gross annual portfolio yield does not represent and may be higher than an actual investment return to shareholders because it excludes our expenses and all sales commissions and dealer manager fees and does not consider the cost of leverage. |
The following table summarizes the composition of our investment portfolio by the type of interest rate as of December 31, 2019 and 2018, excluding short term investments of $29,527 and $12,537, respectively:
December 31, | ||||||||||||||||||||||
2019 | 2018 | |||||||||||||||||||||
Interest Rate Allocation | Investments Cost | Investments Fair Value | Percentage of Investment Portfolio | Investments Cost | Investments Fair Value | Percentage of Investment Portfolio | ||||||||||||||||
Floating interest rate investments | $ | 1,648,380 | $ | 1,594,594 | 91.8 | % | $ | 1,802,745 | $ | 1,756,777 | 94.8 | % | ||||||||||
Fixed interest rate investments | 66,460 | 65,233 | 3.8 | % | 41,182 | 39,180 | 2.1 | % | ||||||||||||||
Other income producing investments | 30,822 | 30,505 | 1.8 | % | 34,109 | 34,806 | 1.9 | % | ||||||||||||||
Non-income producing equity | 51,887 | 45,213 | 2.6 | % | 26,190 | 22,010 | 1.2 | % | ||||||||||||||
Total investments | $ | 1,797,549 | $ | 1,735,545 | 100.0 | % | $ | 1,904,226 | $ | 1,852,773 | 100.0 | % | ||||||||||
The following table shows the composition of our investment portfolio by industry classification and the percentage, by fair value, of the total assets in such industries as of December 31, 2019 and 2018:
52
December 31, | ||||||||||||||
2019 | 2018 | |||||||||||||
Industry Classification | Investments Fair Value | Percentage of Investment Portfolio | Investments Fair Value | Percentage of Investment Portfolio | ||||||||||
Healthcare & Pharmaceuticals | $ | 294,947 | 17.0 | % | $ | 325,180 | 17.5 | % | ||||||
Media: Diversified & Production | 206,159 | 11.9 | % | 114,303 | 6.2 | % | ||||||||
Services: Business | 191,126 | 11.0 | % | 218,888 | 11.7 | % | ||||||||
Media: Advertising, Printing & Publishing | 120,810 | 7.0 | % | 131,620 | 7.1 | % | ||||||||
Chemicals, Plastics & Rubber | 102,906 | 5.9 | % | 74,575 | 4.0 | % | ||||||||
Services: Consumer | 94,058 | 5.4 | % | 133,210 | 7.2 | % | ||||||||
Capital Equipment | 73,586 | 4.2 | % | 98,994 | 5.3 | % | ||||||||
Beverage, Food & Tobacco | 68,440 | 3.9 | % | 73,494 | 4.0 | % | ||||||||
Diversified Financials | 66,897 | 3.9 | % | 30,020 | 1.6 | % | ||||||||
Banking, Finance, Insurance & Real Estate | 62,738 | 3.6 | % | 57,917 | 3.1 | % | ||||||||
Telecommunications | 61,577 | 3.6 | % | 74,261 | 4.0 | % | ||||||||
High Tech Industries | 60,197 | 3.5 | % | 126,620 | 6.8 | % | ||||||||
Retail | 53,599 | 3.1 | % | 42,450 | 2.3 | % | ||||||||
Energy: Oil & Gas | 48,742 | 2.8 | % | 54,907 | 3.0 | % | ||||||||
Construction & Building | 37,096 | 2.1 | % | 33,483 | 1.8 | % | ||||||||
Consumer Goods: Non-Durable | 33,609 | 1.9 | % | 37,148 | 2.0 | % | ||||||||
Consumer Goods: Durable | 31,705 | 1.8 | % | 35,709 | 1.9 | % | ||||||||
Aerospace & Defense | 30,378 | 1.8 | % | 45,655 | 2.5 | % | ||||||||
Transportation: Cargo | 27,291 | 1.6 | % | 30,614 | 1.7 | % | ||||||||
Hotel, Gaming & Leisure | 25,081 | 1.4 | % | 54,689 | 3.0 | % | ||||||||
Forest Products & Paper | 24,217 | 1.4 | % | 19,525 | 1.1 | % | ||||||||
Metals & Mining | 10,373 | 0.6 | % | 10,333 | 0.6 | % | ||||||||
Automotive | 10,013 | 0.6 | % | 24,645 | 1.3 | % | ||||||||
Environmental Industries | — | — | 2,955 | 0.2 | % | |||||||||
Media: Broadcasting & Subscription | — | — | 1,578 | 0.1 | % | |||||||||
Subtotal/total percentage | 1,735,545 | 100.0 | % | 1,852,773 | 100.0 | % | ||||||||
Short term investments | 29,527 | 12,537 | ||||||||||||
Total investments | $ | 1,765,072 | $ | 1,865,310 | ||||||||||
Our investment portfolio may contain senior secured investments that are in the form of lines of credit, delayed draw term loans, revolving credit facilities, or unfunded commitments, which may require us to provide funding when requested in accordance with the terms of the underlying agreements. As of December 31, 2019 and 2018, our unfunded commitments amounted to $83,694 and $79,078, respectively. As of March 12, 2020, our unfunded commitments amounted to $86,387. Since these commitments may expire without being drawn upon, unfunded commitments do not necessarily represent future cash requirements or future earning assets for us. Refer to the section “Commitments and Contingencies and Off-Balance Sheet Arrangements” for further details on our unfunded commitments.
53
Investment Portfolio Asset Quality
CIM uses an investment rating system to characterize and monitor our expected level of returns on each investment in our portfolio. These ratings are just one of several factors that CIM uses to monitor our portfolio, are not in and of themselves determinative of fair value or revenue recognition and are presented for indicative purposes. CIM rates the credit risk of all investments on a scale of 1 to 5 no less frequently than quarterly. This system is intended primarily to reflect the underlying risk of a portfolio investment relative to our initial cost basis in respect of such portfolio investment (i.e., at the time of acquisition), although it may also take into account under certain circumstances the performance of the portfolio company's business, the collateral coverage of the investment and other relevant factors.
The following is a description of the conditions associated with each investment rating used in this ratings system:
Investment Rating | Description | |
1 | Indicates the least amount of risk to our initial cost basis. The trends and risk factors for this investment since origination or acquisition are generally favorable, which may include the performance of the portfolio company or a potential exit. | |
2 | Indicates a level of risk to our initial cost basis that is similar to the risk to our initial cost basis at the time of origination or acquisition. This portfolio company is generally performing in accordance with our analysis of its business and the full return of principal and interest or dividend is expected. | |
3 | Indicates that the risk to our ability to recoup the cost of such investment has increased since origination or acquisition, but full return of principal and interest or dividend is expected. A portfolio company with an investment rating of 3 requires closer monitoring. | |
4 | Indicates that the risk to our ability to recoup the cost of such investment has increased significantly since origination or acquisition, including as a result of factors such as declining performance and noncompliance with debt covenants, and we expect some loss of interest, dividend or capital appreciation, but still expect an overall positive internal rate of return on the investment. | |
5 | Indicates that the risk to our ability to recoup the cost of such investment has increased materially since origination or acquisition and the portfolio company likely has materially declining performance. Loss of interest or dividend and some loss of principal investment is expected, which would result in an overall negative internal rate of return on the investment. | |
For investments rated 3, 4, or 5, CIM enhances its level of scrutiny over the monitoring of such portfolio company.
The following table summarizes the composition of our investment portfolio based on the 1 to 5 investment rating scale at fair value as of December 31, 2019 and 2018, excluding short term investments of $29,527 and $12,537, respectively:
December 31, | ||||||||||||||
2019 | 2018 | |||||||||||||
Investment Rating | Investments Fair Value | Percentage of Investment Portfolio | Investments Fair Value | Percentage of Investment Portfolio | ||||||||||
1 | $ | 154,264 | 8.9 | % | $ | — | — | |||||||
2 | 1,278,576 | 73.7 | % | 1,642,270 | 88.6 | % | ||||||||
3 | 282,140 | 16.3 | % | 181,118 | 9.8 | % | ||||||||
4 | 16,463 | 0.9 | % | 26,412 | 1.4 | % | ||||||||
5 | 4,102 | 0.2 | % | 2,973 | 0.2 | % | ||||||||
$ | 1,735,545 | 100.0 | % | $ | 1,852,773 | 100.0 | % | |||||||
The amount of the investment portfolio in each rating category may vary substantially from period to period resulting primarily from changes in the composition of such portfolio as a result of new investment, repayment and exit activities. In addition, changes in the rating of investments may be made to reflect our expectation of performance and changes in investment values.
54
Current Investment Portfolio
The following table summarizes the composition of our investment portfolio at fair value as of March 12, 2020:
Investments Fair Value | Percentage of Investment Portfolio | ||||||||
Senior secured first lien debt | $ | 1,335,455 | 79.9 | % | |||||
Senior secured second lien debt | 214,152 | 12.8 | % | ||||||
Collateralized securities and structured products - equity | 13,960 | 0.8 | % | ||||||
Unsecured debt | 4,900 | 0.3 | % | ||||||
Equity | 103,240 | 6.2 | % | ||||||
Subtotal/total percentage | 1,671,707 | 100.0 | % | ||||||
Short term investments(2) | 80,435 | ||||||||
Total investments | $ | 1,752,142 | |||||||
Number of portfolio companies | 137 | ||||||||
Average annual EBITDA of portfolio companies | $81.0 million | ||||||||
Median annual EBITDA of portfolio companies | $54.6 million | ||||||||
Purchased at a weighted average price of par | 97.55 | % | |||||||
Gross annual portfolio yield based upon the purchase price(2) | 9.33 | % | |||||||
(1) | Short term investments represent an investment in a fund that invests in highly liquid investments with average original maturity dates of three months or less. |
(2) | The gross annual portfolio yield does not represent and may be higher than an actual investment return to shareholders because it excludes our expenses and all sales commissions and dealer manager fees and does not consider the cost of leverage. |
Results of Operations for the Years Ended December 31, 2019 and 2018
Our results of operations for the years ended December 31, 2019 and 2018 were as follows:
Years Ended December 31, | |||||||
2019 | 2018 | ||||||
Investment income | $ | 201,103 | $ | 188,138 | |||
Net operating expenses | 113,791 | 97,961 | |||||
Net investment income | 87,312 | 90,177 | |||||
Net realized loss on investments and foreign currency | (24,917 | ) | (5,619 | ) | |||
Net change in unrealized depreciation on investments | (10,551 | ) | (53,248 | ) | |||
Net increase in net assets resulting from operations | $ | 51,844 | $ | 31,310 | |||
Investment Income
For the years ended December 31, 2019 and 2018, we generated investment income of $201,103 and $188,138, respectively, consisting primarily of interest income on investments in senior secured debt, collateralized securities and structured products, and unsecured debt of 171 and 215 portfolio companies held during each respective period. Our average investment portfolio size, excluding our short term investments, increased $113,948, from $1,680,211 during the year ended December 31, 2018 to $1,794,159 during the year ended December 31, 2019, as we deployed the net proceeds from our financing arrangements and the net proceeds from our follow-on continuous public offering, which commenced on January 25, 2016 and ended on January 25, 2019. During 2018, our investment portfolio continued to grow due to equity available to us for investment from our follow-on continuous public offering and amounts borrowed under our financing arrangements. As a result, we believe that reported investment income for the year ended December 31, 2018 is not representative of our stabilized or future performance.
55
Operating Expenses
The composition of our operating expenses for the years ended December 31, 2019 and 2018 was as follows:
Years Ended December 31, | |||||||
2019 | 2018 | ||||||
Management fees | $ | 36,466 | $ | 35,013 | |||
Administrative services expense | 2,650 | 2,704 | |||||
Subordinated incentive fee on income | 20,087 | 8,177 | |||||
General and administrative | 5,057 | 6,450 | |||||
Interest expense | 49,531 | 45,617 | |||||
Total operating expenses | $ | 113,791 | $ | 97,961 | |||
During the year ended December 31, 2019, the increase in interest expense was primarily the result of additional borrowings on our existing financing arrangements, which resulted in an increase in net assets and an increase in management fees. The increase in subordinated incentive fee on income was a result of exceeding our hurdle rate of 1.875% for pre-incentive fee net investment income for each quarter during the year ended December 31, 2019, whereas for the year ended December 31, 2018, we only exceeded our hurdle rate for the three month periods ended September 30, 2018 and December 31, 2018.
The composition of our general and administrative expenses for the years ended December 31, 2019 and 2018 was as follows:
Years Ended December 31, | |||||||
2019 | 2018 | ||||||
Transfer agent expense | $ | 1,289 | $ | 1,315 | |||
Professional fees | 996 | 1,480 | |||||
Valuation expense | 722 | 762 | |||||
Accounting and administrative costs | 567 | 637 | |||||
Director fees and expenses | 472 | 444 | |||||
Insurance expense | 421 | 408 | |||||
Dues and subscriptions | 343 | 667 | |||||
Printing and marketing expense | 102 | 273 | |||||
Due diligence fees | 61 | 182 | |||||
Other expenses | 84 | 282 | |||||
Total general and administrative expense | $ | 5,057 | $ | 6,450 | |||
Net Investment Income
Our net investment income totaled $87,312 and $90,177 for the years ended December 31, 2019 and 2018, respectively. The decrease in net investment income was primarily due to an increase in our subordinated incentive fees and interest expense for the year ended December 31, 2019, partially offset by an increase in investment income during the year ended December 31, 2019 compared to the year ended December 31, 2018.
Net Realized Loss on Investments and Foreign Currency
Our net realized loss on investments and foreign currency totaled $(24,917) and $(5,619) for the years ended December 31, 2019 and 2018, respectively. This change was mainly due to an increase in investment restructurings and the liquidation of certain portfolio companies during the year ended December 31, 2019 compared to the year ended December 31, 2018.
Net Change in Unrealized Depreciation on Investments
The net change in unrealized depreciation on our investments totaled $(10,551) and $(53,248) for the years ended December 31, 2019 and 2018, respectively. This change was driven by a tightening of credit spreads during the year ended December 31, 2019 that positively impacted the fair value of certain of our investments compared to a widening of credit spreads during the year ended December 31, 2018. This change was partially offset by unrealized losses on certain underperforming investments during the year ended December 31, 2019.
56
Net Increase in Net Assets Resulting from Operations
For the years ended December 31, 2019 and 2018, we recorded a net increase in net assets resulting from operations of $51,844 and $31,310, respectively, as a result of our operating activity for the respective periods.
Results of Operations for the Years Ended December 31, 2018 and 2017
Our results of operations for the years ended December 31, 2018 and 2017 were as follows:
Years Ended December 31, | |||||||
2018 | 2017 | ||||||
Investment income | $ | 188,138 | $ | 152,432 | |||
Net operating expenses | 97,961 | 65,122 | |||||
Net investment income | 90,177 | 87,310 | |||||
Net realized loss on investments and foreign currency | (5,619 | ) | (12,305 | ) | |||
Net change in unrealized (depreciation) appreciation on investments | (53,248 | ) | 9,448 | ||||
Net realized loss on total return swap | — | (13,956 | ) | ||||
Net change in unrealized appreciation on total return swap | — | 15,402 | |||||
Net increase in net assets resulting from operations | $ | 31,310 | $ | 85,899 | |||
Investment Income
For the years ended December 31, 2018 and 2017, we generated investment income of $188,138 and $152,432, respectively, consisting primarily of interest income on investments in senior secured debt, collateralized securities and structured products, and unsecured debt of 215 and 214 portfolio companies held during each respective period. Our average investment portfolio size, excluding our short term investments and TRS, increased $416,896, from $1,263,315 during the year ended December 31, 2017 to $1,680,211 during the year ended December 31, 2018, as we deployed the net proceeds from our financing arrangements and the net proceeds from our follow-on continuous public offering, which commenced on January 25, 2016 and ended on January 25, 2019. During 2018, our investment portfolio continued to grow due to equity available to us for investment from our follow-on continuous public offering and amounts borrowed under our financing arrangements. As a result, we believe that reported investment income for the years ended December 31, 2018 and 2017 is not representative of our stabilized or future performance. Interest income earned by loans underlying the TRS was not included in investment income in the consolidated statements of operations, but rather it was recorded as part of net realized loss on total return swap. In lieu of extending the expiration date of the TRS beyond April 18, 2017, we entered into a traditional credit facility with Citibank on March 29, 2017.
Operating Expenses
The composition of our operating expenses for the years ended December 31, 2018 and 2017 was as follows:
Years Ended December 31, | |||||||
2018 | 2017 | ||||||
Management fees | $ | 35,013 | $ | 29,549 | |||
Administrative services expense | 2,704 | 2,160 | |||||
Subordinated incentive fee on income | 8,177 | 3,222 | |||||
General and administrative | 6,450 | 7,116 | |||||
Interest expense | 45,617 | 23,075 | |||||
Total operating expenses | $ | 97,961 | $ | 65,122 | |||
During the year ended December 31, 2018, the increase in management fees was a direct result of the increase in our total assets, while the increase in interest expense was primarily the result of additional borrowings on our existing financing arrangements. The increase in subordinated incentive fees was a result of exceeding our hurdle rate of 1.875% for pre-incentive fee net investment income for the three months ended September 30, 2018 and December 31, 2018.
57
The composition of our general and administrative expenses for the years ended December 31, 2018 and 2017 was as follows:
Years Ended December 31, | |||||||
2018 | 2017 | ||||||
Professional fees | $ | 1,480 | $ | 1,182 | |||
Transfer agent expense | 1,315 | 1,284 | |||||
Valuation expense | 762 | 1,238 | |||||
Dues and subscriptions | 667 | 837 | |||||
Accounting and administrative costs | 637 | 590 | |||||
Director fees and expenses | 444 | 438 | |||||
Insurance expense | 408 | 411 | |||||
Printing and marketing expense | 273 | 374 | |||||
Due diligence fees | 182 | 165 | |||||
Other expenses | 282 | 597 | |||||
Total general and administrative expense | $ | 6,450 | $ | 7,116 | |||
Net Investment Income
Our net investment income totaled $90,177 and $87,310 for the years ended December 31, 2018 and 2017, respectively. The increase in net investment income was primarily due to an increase in the size of our investment portfolio relative to our expenses as we continued to achieve economies of scale due to proceeds received from our follow-on continuous public offering and our financing arrangements.
Net Realized Loss on Investments and Foreign Currency
Our net realized loss on investments and foreign currency totaled $(5,619) and $(12,305) for the years ended December 31, 2018 and 2017, respectively. This change was primarily due to a decrease in realized losses on certain underperforming investments during 2018 compared to 2017.
Net Change in Unrealized (Depreciation) Appreciation on Investments
The net change in unrealized (depreciation) appreciation on our investments totaled $(53,248) and $9,448 for the years ended December 31, 2018 and 2017, respectively. This change was driven by a widening of credit spreads during the year ended December 31, 2018 that negatively impacted the fair value of certain of our investments compared to a tightening of credit spreads during the year ended December 31, 2017.
Net Realized Loss on TRS
Our net realized loss on the TRS totaled $0 and $(13,956) for the years ended December 31, 2018 and 2017, respectively. The components of net realized loss on the TRS are summarized below:
Years Ended December 31, | |||||||
2018 | 2017 | ||||||
Interest and other income from TRS portfolio | $ | — | $ | 6,511 | |||
Interest and other expense from TRS portfolio | — | (3,017 | ) | ||||
Net realized loss on TRS loan sales | — | (17,450 | ) | ||||
Total | $ | — | $ | (13,956 | ) | ||
Net Change in Unrealized Appreciation on TRS
The net change in unrealized appreciation on the TRS totaled $0 and $15,402 for the years ended December 31, 2018 and 2017, respectively. Unrealized appreciation recorded during the year ended December 31, 2017 was primarily due to previously unrealized depreciation becoming realized upon the expiration of the TRS.
Net Increase in Net Assets Resulting from Operations
For the years ended December 31, 2018 and 2017, we recorded a net increase in net assets resulting from operations of $31,310 and $85,899, respectively, as a result of our operating activity for the respective periods.
58
Net Asset Value per Share, Annual Investment Return and Total Return Since Inception
Our net asset value per share was $8.40 and $8.69 on December 31, 2019 and 2018, respectively. After considering (i) the overall changes in net asset value per share, (ii) paid distributions of approximately $0.7456 per share during the year ended December 31, 2019, and (iii) the assumed reinvestment of those distributions in accordance with our distribution reinvestment plan then in effect, the total investment return-net asset value was 5.55% for the twelve-month period ended December 31, 2019. Total investment return-net asset value does not represent and may be higher than an actual return to shareholders because it excludes all sales commissions and dealer manager fees. Total investment return-net asset value is a measure of the change in total value for shareholders who held our common stock at the beginning and end of the period, including distributions paid or payable during the period, and is described further in Note 14 to our consolidated financial statements included in this report.
Initial shareholders who subscribed to the offering in December 2012 with an initial investment of $10,000 and an initial purchase price equal to $9.00 per share (public offering price excluding sales load) have seen an annualized return of 7.23% and a cumulative total return of 63.53% through December 31, 2019 (see chart below). Initial shareholders who subscribed to the offering in December 2012 with an initial investment of $10,000 and an initial purchase price equal to $10.00 per share (the initial public offering price including sales load) have seen an annualized return of 5.64% and a cumulative total return of 47.17% through December 31, 2019. Over the same time period, the S&P/LSTA Leveraged Loan Index, a primary measure of senior debt covering the U.S. leveraged loan market, which currently consists of approximately 1,000 credit facilities throughout numerous industries, recorded an annualized return of 4.24% and a cumulative total return of 33.99%. In addition, the BofA Merrill Lynch US High Yield Index, a primary measure of short-term US dollar denominated below investment grade corporate debt publicly issued in the US domestic market, recorded an annualized return of 5.78% and a cumulative total return of 48.52% over the same period.
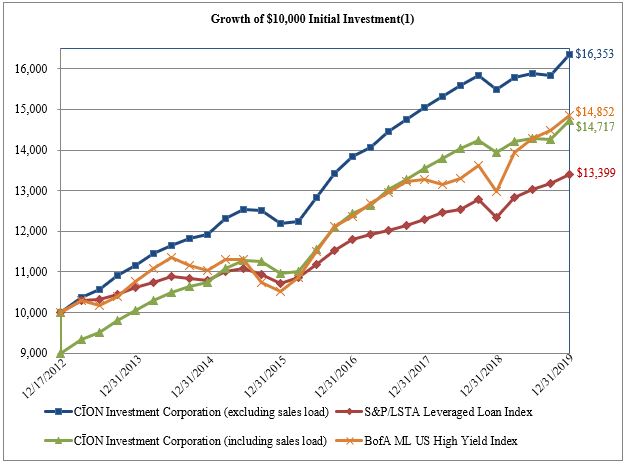
(1) Cumulative performance: December 17, 2012 to December 31, 2019
The calculations for the Growth of $10,000 Initial Investment are based upon (i) an initial investment of $10,000 in our common stock at the beginning of the period, at a share price of $10.00 per share (including sales load) and $9.00 per share (excluding sales load), (ii) assumes reinvestment of monthly distributions in accordance with our distribution reinvestment plan then in effect, (iii) the sale of the entire investment position at the net asset value per share on the last day of the period, and (iv) the distributions declared and payable to shareholders, if any, on the last day of the period.
59
Financial Condition, Liquidity and Capital Resources
We generate cash primarily from cash flows from interest, fees and dividends earned from our investments as well as principal repayments and proceeds from sales of our investments. We also employ leverage to seek to enhance our returns as market conditions permit and at the discretion of CIM. On March 23, 2018, an amendment to Section 61(a) of the 1940 Act was signed into law to permit BDCs to reduce the minimum "asset coverage" ratio from 200% to 150% and, as a result, to potentially increase the ratio of a BDC's debt to equity from a maximum of 1-to-1 to a maximum of 2-to-1, so long as certain approval and disclosure requirements are satisfied. We currently have not determined whether to seek to utilize such additional leverage. We generated cash from the net proceeds from our continuous public offerings. Our initial continuous public offering commenced on July 2, 2012 and ended on December 31, 2015. Our follow-on continuous public offering commenced on January 25, 2016 and ended on January 25, 2019.
As of December 31, 2019 and March 12, 2020, we had $29,527 and $80,435 in short term investments, respectively, invested in a fund that primarily invests in U.S. government securities.
Citibank Credit Facility
As of December 31, 2019 and March 12, 2020, our outstanding borrowings under the Second Amended Citibank Credit Facility were $278,542 and $245,442, respectively, and the aggregate unfunded principal amount in connection with the Second Amended Citibank Credit Facility was $71,458 and $104,558, respectively. For a detailed discussion of our Second Amended Citibank Credit Facility, refer to Note 9 to our consolidated financial statements included in this report.
JPM Credit Facility
As of December 31, 2019 and March 12, 2020, our outstanding borrowings under the Amended JPM Credit Facility were $250,000 and the aggregate unfunded principal amount in connection with the Amended JPM Credit Facility was $25,000. We intend to refinance or further amend the Amended JPM Credit Facility prior to August 24, 2020. For a detailed discussion of our Amended JPM Credit Facility, refer to Note 9 to our consolidated financial statements included in this report.
UBS Facility
As of December 31, 2019 and March 12, 2020, our outstanding borrowings under the amended UBS Facility were $200,000 and no additional principal amount was available for borrowing under the amended UBS Facility. We intend to refinance or extend the amended UBS Facility prior to May 19, 2020. For a detailed discussion of our amended UBS Facility, refer to Note 9 to our consolidated financial statements included in this report.
MS Credit Facility
As of December 31, 2019 and March 12, 2020, our outstanding borrowings under the Amended MS Credit Facility were $112,500 and $122,500, respectively, and the aggregate unfunded principal amount in connection with the Amended MS Credit Facility was $37,500 and $27,500, respectively. For a detailed discussion of our Amended MS Credit Facility, refer to Note 9 to our consolidated financial statements included in this report.
Unfunded Commitments
As of December 31, 2019 and March 12, 2020, our unfunded commitments amounted to $83,694 and $86,387, respectively. For a detailed discussion of our unfunded commitments, refer to Note 12 to our consolidated financial statements included in this report.
RIC Status and Distributions
To qualify for and maintain RIC tax treatment, we must, among other things, distribute in respect of each taxable year at least 90% of our net ordinary income and realized net short-term capital gains in excess of realized net long-term capital losses, if any. In order to avoid certain excise taxes imposed on RICs, we currently intend to distribute in respect of each calendar year an amount at least equal to the sum of (1) 98.0% of our net ordinary income (taking into account certain deferrals and elections) for the calendar year, (2) 98.2% of our capital gains in excess of capital losses, or capital gain net income (adjusted for certain ordinary losses), for the one-year period ending on October 31 of the calendar year and (3) any net ordinary income and capital gain net income from preceding years that were not distributed during such years and on which we paid no federal income tax.
For an additional discussion of our RIC status and distributions, refer to Note 2 and Note 5, respectively, of our consolidated financial statements included in this report.
60
Recent Accounting Pronouncements
See Note 2 to our consolidated financial statements included in this report for a discussion of certain recent accounting pronouncements that are applicable to us.
Critical Accounting Policies
Our consolidated financial statements are prepared in conformity with U.S. generally accepted accounting principles, or GAAP, which requires us to make estimates and assumptions that affect the reported amounts of assets and liabilities at the date of the consolidated financial statements and the reported amounts of revenues and expenses during the reporting periods. Critical accounting policies are those that require the application of management’s most difficult, subjective or complex judgments, often because of the need to make estimates about the effect of matters that are inherently uncertain and that may change in subsequent periods. In preparing the consolidated financial statements, we also utilize available information, including our past history, industry standards and the current economic environment, among other factors, in forming our estimates and judgments, giving due consideration to materiality. Actual results may differ from these estimates. In addition, other companies may utilize different estimates, which may impact the comparability of our results of operations to those of companies in similar businesses.
Valuation of Portfolio Investments
The value of our assets is determined quarterly and at such other times that an event occurs that materially affects the valuation. The valuation is made pursuant to Section 2(a)(41) of the 1940 Act, which requires that we value our assets as follows: (i) the market price for those securities for which a market quotation is readily available, and (ii) for all other securities and assets, at fair value, as determined in good faith by our board of directors. As a BDC, Section 2(a)(41) of the 1940 Act requires the board of directors to determine in good faith the fair value of portfolio securities for which a market price is not readily available, and it does so in conjunction with the application of our valuation procedures by CIM.
There is no single standard for determining fair value in good faith. As a result, determining fair value requires that judgment be applied to the specific facts and circumstances of each asset while employing a valuation process that is consistently followed. Determinations of fair value involve subjective judgments and estimates. Accordingly, the notes to our consolidated financial statements refer to the uncertainty with respect to the possible effect of such valuations, and any change in such valuations in our consolidated financial statements.
Valuation Methods
With respect to investments for which market quotations are not readily available, we undertake a multi-step valuation process each quarter, as described below:
• | our quarterly valuation process begins with each portfolio company or investment being initially valued by certain of CIM’s investment professionals and certain members of its management team, with such valuation taking into account information received from various sources, including independent valuation firms, if applicable; |
• | preliminary valuation conclusions are then documented and discussed with members of CIM’s management team; |
• | designated members of CIM’s management team review the preliminary valuation, and, if applicable, deliver such preliminary valuation to an independent valuation firm for its review; |
• | designated members of CIM’s management team and, if appropriate, the relevant investment professionals meet with the independent valuation firm to discuss the preliminary valuation; |
• | designated members of CIM’s management team respond and supplement the preliminary valuation to reflect any comments provided by the independent valuation firm; |
• | our audit committee meets with members of CIM’s management team and the independent valuation firms to discuss the assistance provided and the results of the independent valuation firms' review; and |
• | our board of directors discusses the valuation and determines the fair value of each investment in our portfolio in good faith based on various statistical and other factors, including the input and recommendation of CIM, the audit committee and any third-party valuation firm, if applicable. |
In addition to the foregoing, certain investments for which a market price is not readily available are evaluated on a quarterly basis by an independent valuation firm and certain other investments are on a rotational basis reviewed by an independent valuation firm. Finally, certain investments are not evaluated by an independent valuation firm unless certain aspects of such investments in the aggregate meet certain criteria.
61
Given the expected types of investments, excluding short term investments and stock of publicly traded companies that are classified as Level 1, management expects our portfolio holdings to be classified as Level 3. Due to the uncertainty inherent in the valuation process, particularly for Level 3 investments, such fair value estimates may differ significantly from the values that would have been used had an active market for the investments existed. In addition, changes in the market environment and other events that may occur over the life of the investments may cause the gains or losses that we ultimately realize on these investments to materially differ from the valuations currently assigned. Inputs used in the valuation process are subject to variability in the future and can result in materially different fair values.
For an additional discussion of our investment valuation process, refer to Note 2 to our consolidated financial statements included in this report.
Related Party Transactions
For a discussion of our relationship with related parties including CION Securities, CIM, ICON Capital, CIG, and AIA and amounts incurred under agreements with such related parties, refer to Note 4 to our consolidated financial statements included in this report.
Contractual Obligations
On August 26, 2016, 34th Street entered into the JPM Credit Facility with JPM, as amended and restated on September 30, 2016, July 11, 2017, November 28, 2017 and May 23, 2018. See Note 9 to our consolidated financial statements for a more detailed description of the JPM Credit Facility.
On March 29, 2017, Flatiron Funding II entered into the Citibank Credit Facility with Citibank, as amended on July 11, 2017 and March 14, 2019. See Note 9 to our consolidated financial statements for a more detailed description of the Citibank Credit Facility.
On May 19, 2017, Murray Hill Funding II entered into the UBS Facility with UBS, as amended on December 1, 2017. See Note 9 to our consolidated financial statements for a more detailed description of the UBS Facility.
On December 19, 2017, 33rd Street entered into the MS Credit Facility with MS, as amended on July 9, 2018 and December 18, 2018. See Note 9 to our consolidated financial statements for a more detailed description of the MS Credit Facility.
Commitments and Contingencies and Off-Balance Sheet Arrangements
Commitments and Contingencies
We have entered into certain contracts with other parties that contain a variety of indemnifications. Our maximum exposure under these arrangements is unknown. However, we have not experienced claims or losses pursuant to these contracts and believe the risk of loss related to such indemnifications to be remote.
Our investment portfolio may contain debt investments that are in the form of lines of credit, delayed draw term loans, revolving credit facilities, or other unfunded commitments, which may require us to provide funding when requested in accordance with the terms of the underlying agreements. For further details on such debt investments, refer to Note 12 to our consolidated financial statements included in this report.
Off-Balance Sheet Arrangements
We currently have no off-balance sheet arrangements, except for those discussed in Note 12 to our consolidated financial statements included in this report.
62
Item 7A. Quantitative and Qualitative Disclosures About Market Risk
We are subject to financial market risks, including changes in interest rates. As of December 31, 2019, 91.8% of our investments paid variable interest rates. A rise in the general level of interest rates can be expected to lead to higher interest rates applicable to our debt investments, especially to the extent that we hold variable rate investments, and to declines in the value of any fixed rate investments we may hold. To the extent that a majority of our investments may be in variable rate investments, an increase in interest rates could make it easier for us to meet or exceed our incentive fee hurdle rate, as defined in our investment advisory agreement, and may result in a substantial increase in our net investment income, and also to the amount of incentive fees payable to CIM with respect to our pre-incentive fee net investment income.
Under the terms of the Amended JPM Credit Facility, advances currently bear interest at a floating rate equal to the three-month LIBOR, plus a spread of 3.00% per year. Under the terms of the Second Amended Citibank Credit Facility, advances currently bear interest at a floating rate equal to the three-month LIBOR plus 2.00%. Pursuant to the terms of the amended UBS Facility, we currently pay a financing fee equal to the three-month LIBOR plus a spread of 3.50%. Under the terms of the Amended MS Credit Facility, advances currently bear interest at a floating rate equal to the three-month LIBOR plus a spread of 3.00% per year. In addition, we may seek to further borrow funds in order to make additional investments. Our net investment income will be impacted, in part, by the difference between the rate at which we borrow funds and the rate at which we invest those funds. As a result, we would be subject to risks relating to changes in market interest rates. In periods of rising interest rates when we have debt outstanding, our cost of funds would increase, which could reduce our net investment income, especially to the extent we hold fixed rate investments. We expect that our long-term investments will be financed primarily with equity and long-term debt. Our interest rate risk management techniques may include various interest rate hedging activities to the extent permitted by the 1940 Act. Adverse developments resulting from changes in interest rates could have a material adverse effect on our business, financial condition and results of operations.
The following table shows the effect over a twelve month period of changes in interest rates on our net interest income, excluding short term investments, assuming no changes in our investment portfolio, the Second Amended Citibank Credit Facility, the Amended JPM Credit Facility, the amended UBS Facility or the Amended MS Credit Facility in effect as of December 31, 2019:
Basis Point Change in Interest Rates | (Decrease) Increase in Net Interest Income(1) | Percentage Change in Net Interest Income | |||||
Down 100 basis points | $ | (6,748 | ) | (5.8 | )% | ||
Down 50 basis points | (3,995 | ) | (3.4 | )% | |||
No change to current base rate (1.91% as of December 31, 2019) | — | — | |||||
Up 50 basis points | 4,351 | 3.7 | % | ||||
Up 100 basis points | 8,679 | 7.5 | % | ||||
Up 200 basis points | 17,334 | 14.9 | % | ||||
Up 300 basis points | 25,990 | 22.3 | % | ||||
(1) | This table assumes no change in defaults or prepayments by portfolio companies over the next twelve months. |
The interest rate sensitivity analysis presented above does not consider the potential impact of the changes in fair value of our fixed rate debt investments and the net asset value of our common stock in the event of sudden changes in interest rates. Approximately 3.8% of our investments paid fixed interest rates as of December 31, 2019. Rising market interest rates will most likely lead to fair value declines for fixed interest rate investments and a decline in the net asset value of our common stock, while declining market interest rates will most likely lead to an increase in the fair value of fixed interest rate investments and an increase in the net asset value of our common stock.
In addition, we may have risk regarding portfolio valuation. See “Item 7. Management’s Discussion and Analysis of Financial Condition and Results of Operations—Critical Accounting Policies—Valuation of Portfolio Investments” and Note 2 to our consolidated financial statements included in this report.
63
Item 8. Consolidated Financial Statements and Supplementary Data
Page | |
64
Report of Independent Registered Public Accounting Firm
To the Shareholders and the Board of Directors of CĪON Investment Corporation
Opinion on the Financial Statements
We have audited the accompanying consolidated balance sheet, including the consolidated schedule of investments, of CĪON Investment Corporation (the Company) as of December 31, 2019 and the related consolidated statements of operations, changes in net assets and cash flows for the year ended December 31, 2019, and the related notes to the consolidated financial statements (collectively, the financial statements). In our opinion, the financial statements present fairly, in all material respects, the financial position of the Company as of December 31, 2019 and the results of its operations and its cash flows for the year ended December 31, 2019 in conformity with accounting principles generally accepted in the United States of America.
Basis for Opinion
These financial statements are the responsibility of the Company’s management. Our responsibility is to express an opinion on the Company’s financial statements based on our audit. We are a public accounting firm registered with the Public Company Accounting Oversight Board (United States) (PCAOB) and are required to be independent with respect to the Company in accordance with U.S. federal securities laws and the applicable rules and regulations of the Securities and Exchange Commission and the PCAOB.
We conducted our audit in accordance with the standards of the PCAOB. Those standards require that we plan and perform the audit to obtain reasonable assurance about whether the financial statements are free of material misstatement, whether due to error or fraud. The Company is not required to have, nor were we engaged to perform, an audit of its internal control over financial reporting. As part of our audit, we are required to obtain an understanding of internal control over financial reporting but not for the purpose of expressing an opinion on the effectiveness of the Company’s internal control over financial reporting. Accordingly, we express no such opinion.
Our audit included performing procedures to assess the risks of material misstatement of the financial statements, whether due to error or fraud, and performing procedures that respond to those risks. Such procedures included examining, on a test basis, evidence regarding the amounts and disclosures in the financial statements. Our audit also included evaluating the accounting principles used and significant estimates made by management, as well as evaluating the overall presentation of the financial statements. Our procedures included confirmation of investments owned as of December 31, 2019 by correspondence with the custodians, loan agents or management of the underlying investments, as applicable, or by other appropriate auditing procedures where replies from these parties, as applicable, were not received. We believe that our audit provides a reasonable basis for our opinion.
/s/ RSM US LLP
We have served as the Company's auditor since 2019.
New York, New York
March 16, 2020
65
Report of Independent Registered Public Accounting Firm
The Shareholders and the Board of Directors of CĪON Investment Corporation
Opinion on the Financial Statements
We have audited the accompanying consolidated balance sheet of CĪON Investment Corporation (the “Company”), including the consolidated schedule of investments, as of December 31, 2018, and the related consolidated statements of operations, changes in net assets and cash flows for each of the two years in the period ended December 31, 2018, and the related notes (collectively referred to as the consolidated financial statements). In our opinion, the consolidated financial statements present fairly, in all material respects, the financial position of CĪON Investment Corporation at December 31, 2018, and the consolidated results of its operations, changes in its net assets, and its cash flows for each of the two years in the period ended December 31, 2018, in conformity with U.S. generally accepted accounting principles.
Basis for Opinion
These financial statements are the responsibility of the Company’s management. Our responsibility is to express an opinion on the Company’s financial statements based on our audits. We are a public accounting firm registered with the Public Company Accounting Oversight Board (United States) (PCAOB) and are required to be independent with respect to the Company in accordance with the U.S. federal securities laws and the applicable rules and regulations of the Securities and Exchange Commission and the PCAOB.
We conducted our audits in accordance with the standards of the PCAOB. Those standards require that we plan and perform the audit to obtain reasonable assurance about whether the financial statements are free of material misstatement, whether due to error or fraud. The Company is not required to have, nor were we engaged to perform, an audit of its internal control over financial reporting. As part of our audits we are required to obtain an understanding of internal control over financial reporting but not for the purpose of expressing an opinion on the effectiveness of the Company’s internal control over financial reporting. Accordingly, we express no such opinion.
Our audits included performing procedures to assess the risks of material misstatement of the financial statements, whether due to error or fraud, and performing procedures that respond to those risks. Such procedures included examining, on a test basis, evidence regarding the amounts and disclosures in the financial statements. Our procedures included confirmation of investments owned as of December 31, 2018, by correspondence with the custodian and brokers, or by other appropriate auditing procedures where replies from others were not received. Our audits also included evaluating the accounting principles used and significant estimates made by management, as well as evaluating the overall presentation of the financial statements. We believe that our audits provide a reasonable basis for our opinion.
/s/ Ernst & Young LLP
We served as the Company’s auditor from 2012 through 2018
New York, New York
March 18, 2019
66
CĪON Investment Corporation
Consolidated Balance Sheets
(in thousands, except share and per share amounts)
December 31, 2019 | December 31, 2018 | |||||||
Assets | ||||||||
Investments, at fair value: | ||||||||
Non-controlled, non-affiliated investments (amortized cost of $1,692,879 and $1,866,316, respectively) | $ | 1,630,243 | $ | 1,823,338 | ||||
Non-controlled, affiliated investments (amortized cost of $88,700 and $50,447, respectively) | 89,326 | 41,972 | ||||||
Controlled investments (amortized cost of $45,497 and $0, respectively) | 45,503 | — | ||||||
Total investments, at fair value (amortized cost of $1,827,076 and $1,916,763, respectively) | 1,765,072 | 1,865,310 | ||||||
Cash | 6,135 | 17,579 | ||||||
Due from counterparty | 3,281 | — | ||||||
Interest receivable on investments | 15,261 | 17,596 | ||||||
Receivable due on investments sold and repaid | 18,552 | 5,787 | ||||||
Dividends receivable on investments | 1,106 | — | ||||||
Prepaid expenses and other assets | 985 | 189 | ||||||
Total assets | $ | 1,810,392 | $ | 1,906,461 | ||||
Liabilities and Shareholders' Equity | ||||||||
Liabilities | ||||||||
Financing arrangements (net of unamortized debt issuance costs of $4,457 and $5,927, respectively) | $ | 836,585 | $ | 892,615 | ||||
Payable for investments purchased | 1,568 | 16,851 | ||||||
Accounts payable and accrued expenses | 815 | 939 | ||||||
Interest payable | 3,163 | 3,960 | ||||||
Accrued management fees | 8,869 | 9,308 | ||||||
Accrued subordinated incentive fee on income | 5,612 | 2,604 | ||||||
Accrued administrative services expense | 1,217 | 913 | ||||||
Total liabilities | 857,829 | 927,190 | ||||||
Commitments and contingencies (Note 4 and Note 12) | ||||||||
Shareholders' Equity | ||||||||
Common stock, $0.001 par value; 500,000,000 shares authorized; | ||||||||
113,381,145 and 112,709,239 shares issued and outstanding, respectively | 113 | 113 | ||||||
Capital in excess of par value | 1,054,913 | 1,048,693 | ||||||
Accumulated distributable losses | (102,463 | ) | (69,535 | ) | ||||
Total shareholders' equity | 952,563 | 979,271 | ||||||
Total liabilities and shareholders' equity | $ | 1,810,392 | $ | 1,906,461 | ||||
Net asset value per share of common stock at end of period | $ | 8.40 | $ | 8.69 | ||||
See accompanying notes to consolidated financial statements.
67
CĪON Investment Corporation
Consolidated Statements of Operations
(in thousands, except share and per share amounts)
Years Ended December 31, | ||||||||||||
2019 | 2018 | 2017 | ||||||||||
Investment income | ||||||||||||
Non-controlled, non-affiliated investments | ||||||||||||
Interest income | $ | 187,104 | $ | 183,108 | $ | 142,011 | ||||||
Fee income | 3,899 | 2,476 | 6,928 | |||||||||
Paid-in-kind interest income | 2,017 | 1,142 | 1,815 | |||||||||
Dividend income | 474 | 165 | — | |||||||||
Non-controlled, affiliated investments | ||||||||||||
Interest income | 1,905 | 1,162 | 947 | |||||||||
Paid-in-kind interest income | 566 | 85 | 731 | |||||||||
Dividend income | 4,015 | — | — | |||||||||
Controlled investments | ||||||||||||
Dividend income | 1,123 | — | — | |||||||||
Total investment income | 201,103 | 188,138 | 152,432 | |||||||||
Operating expenses | ||||||||||||
Management fees | 36,466 | 35,013 | 29,549 | |||||||||
Administrative services expense | 2,650 | 2,704 | 2,160 | |||||||||
Subordinated incentive fee on income | 20,087 | 8,177 | 3,222 | |||||||||
General and administrative | 5,057 | 6,450 | 7,116 | |||||||||
Interest expense | 49,531 | 45,617 | 23,075 | |||||||||
Total operating expenses | 113,791 | 97,961 | 65,122 | |||||||||
Net investment income | 87,312 | 90,177 | 87,310 | |||||||||
Realized and unrealized (losses) gains | ||||||||||||
Net realized (losses) gains on: | ||||||||||||
Non-controlled, non-affiliated investments | (13,594 | ) | (5,634 | ) | (12,469 | ) | ||||||
Non-controlled, affiliated investments | (11,184 | ) | — | — | ||||||||
Total return swap | — | — | (13,956 | ) | ||||||||
Foreign currency | (139 | ) | 15 | 164 | ||||||||
Net realized losses | (24,917 | ) | (5,619 | ) | (26,261 | ) | ||||||
Net change in unrealized (depreciation) appreciation on: | ||||||||||||
Non-controlled, non-affiliated investments | (19,658 | ) | (48,662 | ) | 14,360 | |||||||
Non-controlled, affiliated investments | 9,101 | (4,586 | ) | (4,912 | ) | |||||||
Controlled investments | 6 | — | — | |||||||||
Total return swap | — | — | 15,402 | |||||||||
Net change in unrealized (depreciation) appreciation | (10,551 | ) | (53,248 | ) | 24,850 | |||||||
Net realized and unrealized losses | (35,468 | ) | (58,867 | ) | (1,411 | ) | ||||||
Net increase in net assets resulting from operations | $ | 51,844 | $ | 31,310 | $ | 85,899 | ||||||
Per share information—basic and diluted | ||||||||||||
Net increase in net assets per share resulting from operations | $ | 0.46 | $ | 0.27 | $ | 0.77 | ||||||
Weighted average shares of common stock outstanding | 113,708,479 | 114,140,434 | 112,256,276 | |||||||||
See accompanying notes to consolidated financial statements.
68
CĪON Investment Corporation
Consolidated Statements of Changes in Net Assets
(in thousands, except share and per share amounts)
Years Ended December 31, | ||||||||||||
2019 | 2018 | 2017 | ||||||||||
Changes in net assets from operations: | ||||||||||||
Net investment income | $ | 87,312 | $ | 90,177 | $ | 87,310 | ||||||
Net realized loss on investments | (24,778 | ) | (5,634 | ) | (12,469 | ) | ||||||
Net realized (loss) gain on foreign currency | (139 | ) | 15 | 164 | ||||||||
Net change in unrealized (depreciation) appreciation on investments | (10,551 | ) | (53,248 | ) | 9,448 | |||||||
Net realized loss on total return swap | — | — | (13,956 | ) | ||||||||
Net change in unrealized appreciation on total return swap | — | — | 15,402 | |||||||||
Net increase in net assets resulting from operations | 51,844 | 31,310 | 85,899 | |||||||||
Changes in net assets from shareholders' distributions: | ||||||||||||
Distributions to shareholders | (84,772 | ) | (83,483 | ) | (82,061 | ) | ||||||
Net decrease in net assets from shareholders' distributions | (84,772 | ) | (83,483 | ) | (82,061 | ) | ||||||
Changes in net assets from capital share transactions: | ||||||||||||
Issuance of common stock, net of issuance costs of $296, $1,168 and $2,193, respectively | 6,219 | 31,064 | 55,838 | |||||||||
Reinvestment of shareholders' distributions | 35,800 | 38,732 | 39,658 | |||||||||
Repurchase of common stock | (35,799 | ) | (97,043 | ) | (40,406 | ) | ||||||
Net increase (decrease) in net assets resulting from capital share transactions | 6,220 | (27,247 | ) | 55,090 | ||||||||
Total (decrease) increase in net assets | (26,708 | ) | (79,420 | ) | 58,928 | |||||||
Net assets at beginning of period | 979,271 | 1,058,691 | 999,763 | |||||||||
Net assets at end of period | $ | 952,563 | $ | 979,271 | $ | 1,058,691 | ||||||
Net asset value per share of common stock at end of period | $ | 8.40 | $ | 8.69 | $ | 9.14 | ||||||
Shares of common stock outstanding at end of period | 113,381,145 | 112,709,239 | 115,781,751 | |||||||||
See accompanying notes to consolidated financial statements.
69
CĪON Investment Corporation
Consolidated Statements of Cash Flows
(in thousands)
Years Ended December 31, | ||||||||||||
2019 | 2018 | 2017 | ||||||||||
Operating activities: | ||||||||||||
Net increase in net assets resulting from operations | $ | 51,844 | $ | 31,310 | $ | 85,899 | ||||||
Adjustments to reconcile net increase in net assets resulting from | ||||||||||||
operations to net cash provided by (used in) operating activities: | ||||||||||||
Net accretion of discount on investments | (16,081 | ) | (18,387 | ) | (16,655 | ) | ||||||
Proceeds from principal repayment of investments | 423,091 | 639,787 | 558,594 | |||||||||
Purchase of investments | (563,884 | ) | (1,280,187 | ) | (1,423,490 | ) | ||||||
(Increase) decrease in short term investments, net | (16,989 | ) | 194,010 | (136,049 | ) | |||||||
Paid-in-kind interest and dividends | (7,072 | ) | (1,227 | ) | (2,546 | ) | ||||||
Proceeds from sale of investments | 245,698 | 255,883 | 392,450 | |||||||||
Net realized loss on investments | 24,778 | 5,634 | 12,469 | |||||||||
Net change in unrealized depreciation (appreciation) on investments | 10,551 | 53,248 | (9,448 | ) | ||||||||
Net change in unrealized appreciation on total return swap | — | — | (15,402 | ) | ||||||||
Amortization of debt issuance costs | 2,898 | 3,208 | 1,853 | |||||||||
(Increase) decrease in due from counterparty | (3,281 | ) | — | 143,335 | ||||||||
(Increase) decrease in interest receivable on investments | 2,481 | (5,039 | ) | (5,740 | ) | |||||||
(Increase) decrease in dividends receivable on investments | (1,106 | ) | — | — | ||||||||
(Increase) decrease in receivable due on investments sold and repaid | (12,765 | ) | 23,737 | (29,524 | ) | |||||||
(Increase) decrease in receivable due on total return swap | — | — | 4,187 | |||||||||
(Increase) decrease in prepaid expenses and other assets | (796 | ) | 654 | (625 | ) | |||||||
Increase (decrease) in payable for investments purchased | (15,283 | ) | (19,588 | ) | 20,602 | |||||||
Increase (decrease) in accounts payable and accrued expenses | (124 | ) | (493 | ) | (84 | ) | ||||||
Increase (decrease) in interest payable | (797 | ) | 1,649 | 1,447 | ||||||||
Increase (decrease) in accrued management fees | (439 | ) | 1,487 | 2,040 | ||||||||
Increase (decrease) in accrued administrative services expense | 304 | 357 | (126 | ) | ||||||||
Increase (decrease) in due to CIG - offering costs | — | (4 | ) | (41 | ) | |||||||
Increase (decrease) in subordinated incentive fee on income payable | 3,008 | (618 | ) | 3,222 | ||||||||
Net cash provided by (used in) operating activities | 126,036 | (114,579 | ) | (413,632 | ) | |||||||
Financing activities: | ||||||||||||
Gross proceeds from issuance of common stock | 6,515 | 32,232 | 58,031 | |||||||||
Commissions and dealer manager fees paid | (296 | ) | (1,168 | ) | (2,195 | ) | ||||||
Repurchase of common stock | (35,799 | ) | (97,043 | ) | (40,406 | ) | ||||||
Shareholders' distributions paid | (48,972 | ) | (44,751 | ) | (42,403 | ) | ||||||
Borrowings under financing arrangements | 313,000 | 292,077 | 487,042 | |||||||||
Repayment of financing arrangements | (370,500 | ) | (105,000 | ) | — | |||||||
Debt issuance costs paid | (1,428 | ) | (543 | ) | (7,129 | ) | ||||||
Net cash (used in) provided by financing activities | (137,480 | ) | 75,804 | 452,940 | ||||||||
Net (decrease) increase in cash and restricted cash | (11,444 | ) | (38,775 | ) | 39,308 | |||||||
Cash and restricted cash, beginning of period | 17,579 | 56,354 | 17,046 | |||||||||
Cash and restricted cash, end of period | $ | 6,135 | $ | 17,579 | $ | 56,354 | ||||||
Supplemental disclosure of cash flow information | ||||||||||||
Cash paid for interest | $ | 47,413 | $ | 40,750 | $ | 19,832 | ||||||
Supplemental non-cash financing activities: | ||||||||||||
Reinvestment of shareholders' distributions | $ | 35,800 | $ | 38,732 | $ | 39,658 | ||||||
Restructuring of portfolio investment | $ | 71,445 | $ | — | $ | — | ||||||
See accompanying notes to consolidated financial statements.
70
CĪON Investment Corporation
Consolidated Schedule of Investments
December 31, 2019
(in thousands)
Portfolio Company(a) | Index Rate(b) | Industry | Principal/ Par Amount/ Units(e) | Cost(d) | Fair Value(c) | |||||||||||
Senior Secured First Lien Debt - 141.9% | ||||||||||||||||
Academy, Ltd., L+400, 1.00% LIBOR Floor, 7/1/2022(p) | 1 Month LIBOR | Retail | $ | 14,236 | $ | 12,656 | $ | 11,815 | ||||||||
ACProducts, Inc., L+550, 0.00% LIBOR Floor, 2/15/2024(p) | 1 Month LIBOR | Construction & Building | 4,906 | 4,693 | 4,900 | |||||||||||
Adams Publishing Group, LLC, L+750, 1.00% LIBOR Floor, 7/2/2023(o)(q) | 3 Month LIBOR | Media: Advertising, Printing & Publishing | 13,353 | 13,245 | 13,286 | |||||||||||
Adams Publishing Group, LLC, 0.38% Unfunded, 7/2/2020(o) | None | Media: Advertising, Printing & Publishing | 1,600 | — | (8 | ) | ||||||||||
Adapt Laser Acquisition, Inc., L+800, 1.00% LIBOR Floor, 12/31/2023(o) | 3 Month LIBOR | Capital Equipment | 11,640 | 11,640 | 10,956 | |||||||||||
Adapt Laser Acquisition, Inc., 0.50% Unfunded, 12/31/2023 | None | Capital Equipment | 2,000 | — | (118 | ) | ||||||||||
Aegis Toxicology Sciences Corp., L+550, 1.00% LIBOR Floor, 5/9/2025(p) | 3 Month LIBOR | Healthcare & Pharmaceuticals | 9,875 | 9,706 | 9,357 | |||||||||||
AIS Holdco, LLC, L+500, 0.00% LIBOR Floor, 8/15/2025(p) | 3 Month LIBOR | Banking, Finance, Insurance & Real Estate | 5,382 | 5,322 | 5,005 | |||||||||||
Alchemy US Holdco 1, LLC, L+550,10/10/2025(p) | 1 Month LIBOR | Construction & Building | 7,800 | 7,697 | 7,685 | |||||||||||
Allen Media Broadcasting LLC, L+625, 1.00% LIBOR Floor, 7/3/2024(o)(q) | 2 Month LIBOR | Media: Diversified & Production | 24,688 | 24,070 | 25,058 | |||||||||||
Allen Media, LLC, L+650, 1.00% LIBOR Floor, 8/30/2023(o)(p)(q)(r) | 3 Month LIBOR | Media: Diversified & Production | 67,124 | 65,820 | 67,795 | |||||||||||
ALM Media, LLC, L+650, 1.00% LIBOR Floor, 11/25/2024(o)(q) | 3 Month LIBOR | Media: Advertising, Printing & Publishing | 20,000 | 19,607 | 19,600 | |||||||||||
AMCP Staffing Intermediate Holdings III, LLC, L+675, 1.50% LIBOR Floor, 9/24/2025(r) | 3 Month LIBOR | Services: Business | 10,000 | 9,943 | 9,950 | |||||||||||
AMCP Staffing Intermediate Holdings III, LLC, L+675, 1.50% LIBOR Floor, 9/24/2025 | 3 Month LIBOR | Services: Business | 539 | 539 | 536 | |||||||||||
AMCP Staffing Intermediate Holdings III, LLC, 0.50% Unfunded, 9/24/2025 | None | Services: Business | 1,059 | — | (5 | ) | ||||||||||
American Clinical Solutions LLC, 7.00%, 12/31/2022 | None | Healthcare & Pharmaceuticals | 3,500 | 3,395 | 3,395 | |||||||||||
American Clinical Solutions LLC, 2.00%, 12/31/2022(x) | None | Healthcare & Pharmaceuticals | 6,000 | 4,192 | 4,192 | |||||||||||
American Media, LLC, L+775, 0.00% LIBOR Floor, 12/31/2023(o) | 3 Month LIBOR | Media: Advertising, Printing & Publishing | 15,471 | 15,146 | 15,316 | |||||||||||
American Media, LLC, L+775, 0.00% LIBOR Floor, 12/31/2023 | 3 Month LIBOR | Media: Advertising, Printing & Publishing | 1,574 | 1,539 | 1,559 | |||||||||||
American Media, LLC, 0.50% Unfunded, 12/31/2023 | None | Media: Advertising, Printing & Publishing | 128 | — | (1 | ) | ||||||||||
American Teleconferencing Services, Ltd., L+650, 1.00% LIBOR Floor, 12/8/2021(o)(p)(q)(r) | 3 Month LIBOR | Telecommunications | 19,549 | 18,570 | 11,631 | |||||||||||
Analogic Corp., L+600, 1.00% LIBOR Floor, 6/21/2024(q)(r) | 1 Month LIBOR | Healthcare & Pharmaceuticals | 24,321 | 23,928 | 24,078 | |||||||||||
Anthem Sports & Entertainment Inc., L+950, 1.00% LIBOR Floor, 9/9/2024(o)(x) | 3 Month LIBOR | Media: Diversified & Production | 12,624 | 12,470 | 12,498 | |||||||||||
Anthem Sports & Entertainment Inc., L+950, 1.00% LIBOR Floor, 9/9/2024 | 3 Month LIBOR | Media: Diversified & Production | 833 | 833 | 833 | |||||||||||
Anthem Sports & Entertainment Inc., 0.50% Unfunded, 9/9/2024 | None | Media: Diversified & Production | 1,333 | — | — | |||||||||||
APC Automotive Technologies, LLC, L+500, 1.00% LIBOR Floor, 5/10/2025(p)(q) | 3 Month LIBOR | Automotive | 8,892 | 8,551 | 8,692 | |||||||||||
APC Automotive Technologies, LLC, L+500, 1.00% LIBOR Floor, 5/10/2024(p)(q) | 3 Month LIBOR | Automotive | 2,780 | 2,624 | 1,321 | |||||||||||
APCO Holdings, LLC, L+550, 0.00% LIBOR Floor, 6/9/2025(p) | 1 Month LIBOR | Banking, Finance, Insurance & Real Estate | 10,827 | 10,735 | 10,773 | |||||||||||
Ascent Resources - Marcellus, LLC, L+650, 1.00% LIBOR Floor, 3/30/2023 | 1 Month LIBOR | Energy: Oil & Gas | 712 | 712 | 673 | |||||||||||
Associated Asphalt Partners, LLC, L+525, 1.00% LIBOR Floor, 4/5/2024(p) | 1 Month LIBOR | Construction & Building | 10,738 | 10,599 | 9,973 | |||||||||||
Avison Young (USA) Inc., L+500, 0.00% LIBOR Floor, 1/31/2026(h)(p) | 3 Month LIBOR | Banking, Finance, Insurance & Real Estate | 9,900 | 9,719 | 9,745 | |||||||||||
Bi-Lo, LLC, L+800, 1.00% LIBOR Floor, 5/31/2024(p)(q) | 2 Month LIBOR | Retail | 12,864 | 12,535 | 12,639 | |||||||||||
Cadence Aerospace, LLC, L+650, 1.00% LIBOR Floor, 11/14/2023(q)(r) | 3 Month LIBOR | Aerospace & Defense | 30,685 | 30,430 | 30,378 | |||||||||||
See accompanying notes to consolidated financial statements.
71
CĪON Investment Corporation
Consolidated Schedule of Investments
December 31, 2019
(in thousands)
Portfolio Company(a) | Index Rate(b) | Industry | Principal/ Par Amount/ Units(e) | Cost(d) | Fair Value(c) | ||||||||
Cardinal US Holdings, Inc., L+500, 1.00% LIBOR Floor, 7/31/2023(p) | 3 Month LIBOR | Services: Business | 8,309 | 7,915 | 8,226 | ||||||||
CB URS Holdings Corp., L+575, 1.00% LIBOR Floor, 9/1/2024(p)(r) | 1 Month LIBOR | Transportation: Cargo | 16,410 | 16,327 | 14,687 | ||||||||
Central Security Group, Inc., L+563, 1.00% LIBOR Floor, 10/6/2021(p)(r) | 1 Month LIBOR | Services: Consumer | 19,416 | 19,424 | 16,892 | ||||||||
Charming Charlie LLC, 20.00%, 5/15/2020(t)(u) | None | Retail | 845 | 754 | 472 | ||||||||
Charming Charlie LLC, L+1200, 1.00% LIBOR Floor, 4/24/2023(t)(u)(x) | 1 Month LIBOR | Retail | 2,936 | — | — | ||||||||
Charming Charlie LLC, L+1200, 1.00% LIBOR Floor, 4/24/2023(t)(u)(x) | 1 Month LIBOR | Retail | 3,595 | — | — | ||||||||
CHC Solutions Inc., 12.00%, 7/20/2023(x) | None | Healthcare & Pharmaceuticals | 7,347 | 7,347 | 7,347 | ||||||||
CircusTrix Holdings, LLC, L+550, 1.00% LIBOR Floor, 12/16/2021(q)(r) | 1 Month LIBOR | Hotel, Gaming & Leisure | 17,896 | 17,728 | 17,538 | ||||||||
CircusTrix Holdings, LLC, L+550, 1.00% LIBOR Floor, 12/16/2021 | 1 Month LIBOR | Hotel, Gaming & Leisure | 2,424 | 2,424 | 2,375 | ||||||||
CircusTrix Holdings, LLC, 1.00% Unfunded, 12/16/2021 | None | Hotel, Gaming & Leisure | 2,892 | — | (58 | ) | |||||||
Country Fresh Holdings, LLC, L+500, 1.00% LIBOR Floor, 4/29/2023 | 3 Month LIBOR | Beverage, Food & Tobacco | 694 | 653 | 694 | ||||||||
Country Fresh Holdings, LLC, L+500, 1.00% LIBOR Floor, 4/29/2023 | 3 Month LIBOR | Beverage, Food & Tobacco | 414 | 413 | 414 | ||||||||
Country Fresh Holdings, LLC, 1.00% Unfunded, 4/29/2023 | None | Beverage, Food & Tobacco | 327 | — | — | ||||||||
Crown Subsea Communications Holdings, Inc., L+600, 0.00% LIBOR Floor, 11/2/2025(p) | 1 Month LIBOR | Capital Equipment | 5,788 | 5,685 | 5,781 | ||||||||
David's Bridal, LLC, L+600, 1.00% LIBOR Floor, 6/30/2023(x) | 3 Month LIBOR | Retail | 698 | 584 | 698 | ||||||||
Deluxe Entertainment Services, Inc., L+650, 1.00% LIBOR Floor, 3/25/2024(j)(u)(x) | 3 Month LIBOR | Media: Diversified & Production | 23,656 | 23,656 | 28,978 | ||||||||
DMT Solutions Global Corp., L+700, 0.00% LIBOR Floor, 7/2/2024(p)(r) | 6 Month LIBOR | Services: Business | 18,500 | 18,061 | 18,038 | ||||||||
Eagle Family Foods Group LLC, L+650, 1.00% LIBOR Floor, 6/14/2024(r) | 6 Month LIBOR | Beverage, Food & Tobacco | 14,775 | 14,518 | 14,332 | ||||||||
Entertainment Studios P&A LLC, 6.35%, 5/18/2037(l) | None | Media: Diversified & Production | 14,448 | 14,346 | 13,942 | ||||||||
Entertainment Studios P&A LLC, 5.00%, 5/18/2037(l) | None | Media: Diversified & Production | — | — | 2,381 | ||||||||
EnTrans International, LLC, L+600, 0.00% LIBOR Floor, 11/1/2024(p)(r) | 1 Month LIBOR | Capital Equipment | 27,750 | 27,512 | 26,918 | ||||||||
ES Chappaquiddick LLC, 10.00%, 5/18/2022 | None | Media: Diversified & Production | 925 | 925 | 937 | ||||||||
Evergreen Skills Lux S.À.R.L., L+475, 1.00% LIBOR Floor, 4/28/2021(h)(p) | 3 Month LIBOR | High Tech Industries | 10,077 | 9,810 | 7,860 | ||||||||
Extreme Reach, Inc., L+750, 0.00% LIBOR Floor, 3/29/2024(q) | 1 Month LIBOR | Media: Diversified & Production | 17,126 | 17,047 | 17,040 | ||||||||
Extreme Reach, Inc., 0.50% Unfunded, 3/29/2024 | None | Media: Diversified & Production | 1,744 | (1 | ) | (9 | ) | ||||||
F+W Media, Inc., L+650, 1.50% LIBOR Floor, 5/24/2022(t)(u)(x) | 1 Month LIBOR | Media: Diversified & Production | 1,176 | 1,125 | — | ||||||||
Flavors Holdings Inc., L+575, 1.00% LIBOR Floor, 4/3/2020(o)(q) | 3 Month LIBOR | Consumer Goods: Non-Durable | 13,388 | 13,187 | 13,288 | ||||||||
Foundation Consumer Healthcare, LLC, L+550, 1.00% LIBOR Floor, 11/2/2023(o)(q)(r) | 3 Month LIBOR | Healthcare & Pharmaceuticals | 46,523 | 46,104 | 46,523 | ||||||||
Foundation Consumer Healthcare, LLC, 0.50% Unfunded, 11/2/2023 | None | Healthcare & Pharmaceuticals | 4,211 | (20 | ) | — | |||||||
Genesis Healthcare, Inc., L+600, 0.50% LIBOR Floor, 3/6/2023(h)(o)(r) | 1 Month LIBOR | Healthcare & Pharmaceuticals | 30,000 | 29,783 | 29,475 | ||||||||
Geo Parent Corp., L+525, 0.00% LIBOR Floor, 12/19/2025(p) | 1 Month LIBOR | Services: Business | 14,888 | 14,752 | 14,850 | ||||||||
Geon Performance Solutions, LLC, L+625, 1.63% LIBOR Floor, 10/25/2024(o) | 1 Month LIBOR | Chemicals, Plastics & Rubber | 22,414 | 22,259 | 22,414 | ||||||||
Geon Performance Solutions, LLC, 0.50% Unfunded, 10/25/2024 | None | Chemicals, Plastics & Rubber | 2,586 | — | — | ||||||||
Harland Clarke Holdings Corp., L+475, 1.00% LIBOR Floor, 11/3/2023(p)(r) | 3 Month LIBOR | Services: Business | 13,180 | 13,134 | 10,538 | ||||||||
Healogics, Inc., L+425, 1.00% LIBOR Floor, 7/1/2021(p) | 3 Month LIBOR | Healthcare & Pharmaceuticals | 4,749 | 4,632 | 4,251 | ||||||||
See accompanying notes to consolidated financial statements.
72
CĪON Investment Corporation
Consolidated Schedule of Investments
December 31, 2019
(in thousands)
Portfolio Company(a) | Index Rate(b) | Industry | Principal/ Par Amount/ Units(e) | Cost(d) | Fair Value(c) | |||||||||
Hilliard, Martinez & Gonzales, LLP, L+1800, 2.00% LIBOR Floor, 12/17/2022(x) | 1 Month LIBOR | Services: Consumer | 15,000 | 14,850 | 14,850 | |||||||||
Homer City Generation, L.P., L+1100, 1.00% LIBOR Floor, 4/5/2023(o) | 3 Month LIBOR | Energy: Oil & Gas | 14,444 | 13,953 | 13,812 | |||||||||
HUMC Holdco, LLC, 9.00%, 6/26/2020 | None | Healthcare & Pharmaceuticals | 10,000 | 9,972 | 9,950 | |||||||||
Hummel Station LLC, L+600, 1.00% LIBOR Floor, 10/27/2022(p) | 1 Month LIBOR | Energy: Oil & Gas | 9,761 | 9,456 | 9,224 | |||||||||
Hyperion Materials & Technologies, Inc., L+550, 1.00% LIBOR Floor, 8/28/2026(o) | 1 Month LIBOR | Chemicals, Plastics & Rubber | 10,000 | 9,805 | 9,850 | |||||||||
Independent Pet Partners Intermediate Holdings, LLC, L+900, 1.00% LIBOR Floor, 11/19/2023 | 3 Month LIBOR | Retail | 12,064 | 11,892 | 11,672 | |||||||||
Independent Pet Partners Intermediate Holdings, LLC, 1.00% Unfunded, 11/19/2023 | None | Retail | 7,852 | — | (255 | ) | ||||||||
Infinity Sales Group, LLC, L+1050, 1.00% LIBOR Floor, 11/23/2022(o) | 1 Month LIBOR | Services: Business | 6,820 | 6,670 | 6,820 | |||||||||
InfoGroup Inc., L+500, 1.00% LIBOR Floor, 4/3/2023(p)(q)(r) | 3 Month LIBOR | Media: Advertising, Printing & Publishing | 15,756 | 15,743 | 14,968 | |||||||||
Instant Web, LLC, L+650, 0.00% LIBOR Floor, 12/15/2022(o)(q)(r) | 1 Month LIBOR | Media: Advertising, Printing & Publishing | 37,683 | 37,603 | 36,552 | |||||||||
Instant Web, LLC, 0.50% Unfunded, 12/15/2022 | None | Media: Advertising, Printing & Publishing | 2,704 | — | (81 | ) | ||||||||
International Seaways, Inc., L+600, 1.00% LIBOR Floor, 6/22/2022(h)(p) | 1 Month LIBOR | Transportation: Cargo | 6,782 | 6,705 | 6,782 | |||||||||
Isagenix International, LLC, L+575, 1.00% LIBOR Floor, 6/14/2025(p) | 3 Month LIBOR | Beverage, Food & Tobacco | 13,866 | 13,750 | 11,093 | |||||||||
Island Medical Management Holdings, LLC, L+650, 1.00% LIBOR Floor, 9/1/2022(q) | 1 Month LIBOR | Healthcare & Pharmaceuticals | 11,814 | 11,722 | 11,534 | |||||||||
Jab Wireless, Inc., L+800, 0.00% LIBOR Floor, 5/2/2023(r) | 1 Month LIBOR | Telecommunications | 13,700 | 13,700 | 13,700 | |||||||||
Jenny C Acquisition, Inc., L+1050, 0.00% LIBOR Floor, 10/1/2024(o) | 3 Month LIBOR | Services: Consumer | 9,899 | 9,812 | 9,662 | |||||||||
JP Intermediate B, LLC, L+550, 1.00% LIBOR Floor, 11/20/2025(p) | 3 Month LIBOR | Beverage, Food & Tobacco | 16,152 | 15,841 | 13,730 | |||||||||
KLO Intermediate Holdings, LLC, L+775, 1.50% LIBOR Floor, 4/7/2022(t)(x) | 1 Month LIBOR | Chemicals, Plastics & Rubber | 7,499 | 7,028 | 2,250 | |||||||||
KLO Intermediate Holdings, LLC, L+775, 1.50% LIBOR Floor, 4/7/2022(t)(x) | 1 Month LIBOR | Chemicals, Plastics & Rubber | 4,583 | 4,303 | 458 | |||||||||
KNB Holdings Corp., L+550, 1.00% LIBOR Floor, 4/26/2024(p)(r) | 3 Month LIBOR | Consumer Goods: Durable | 8,293 | 8,180 | 6,427 | |||||||||
Labvantage Solutions Ltd., E+750, 1.00% EURIBOR Floor, 12/29/2020(h) | 1 Month EURIBOR | High Tech Industries | € | 3,705 | 4,153 | 4,155 | ||||||||
Labvantage Solutions Inc., L+750, 1.00% LIBOR Floor, 12/29/2020(q) | 1 Month LIBOR | High Tech Industries | 3,566 | 3,556 | 3,566 | |||||||||
LAV Gear Holdings, Inc., L+550, 1.00% LIBOR Floor, 10/31/2024(o)(q) | 3 Month LIBOR | Services: Business | 17,361 | 17,132 | 17,057 | |||||||||
LAV Gear Holdings, Inc., L+550, 1.00% LIBOR Floor, 10/31/2024 | 3 Month LIBOR | Services: Business | 4,286 | 4,228 | 4,211 | |||||||||
LAV Gear Holdings, Inc., 1.00% Unfunded, 4/7/2021 | None | Services: Business | 864 | (8 | ) | (15 | ) | |||||||
LD Intermediate Holdings, Inc., L+588, 1.00% LIBOR Floor, 12/9/2022(p) | 3 Month LIBOR | High Tech Industries | 4,694 | 4,446 | 4,705 | |||||||||
Lift Brands, Inc., L+700, 1.00% LIBOR Floor, 4/16/2023(o)(q)(r)(x) | 3 Month LIBOR | Services: Consumer | 43,321 | 42,649 | 42,130 | |||||||||
Lift Brands, Inc., L+700, 1.00% LIBOR Floor, 4/16/2023 | 3 Month LIBOR | Services: Consumer | 1,050 | 1,050 | 1,021 | |||||||||
Lift Brands, Inc., 1.00% Unfunded, 4/16/2023 | None | Services: Consumer | 3,950 | — | (109 | ) | ||||||||
Longview Power, LLC, L+600, 1.00% LIBOR Floor, 4/13/2021(o)(q) | 3 Month LIBOR | Energy: Oil & Gas | 17,745 | 16,376 | 14,551 | |||||||||
Manna Pro Products, LLC, L+600, 0.00% LIBOR Floor, 12/8/2023(o) | 1 Month LIBOR | Retail | 3,439 | 3,439 | 3,405 | |||||||||
Manna Pro Products, LLC, 1.00% Unfunded, 5/31/2021 | None | Retail | 5,528 | — | (55 | ) | ||||||||
Mimeo.com, Inc., L+700, 1.00% LIBOR Floor, 12/21/2023(o)(r) | 3 Month LIBOR | Services: Business | 22,310 | 22,310 | 22,310 | |||||||||
Mimeo.com, Inc., L+700, 1.00% LIBOR Floor, 12/21/2023 | 3 Month LIBOR | Services: Business | 1,500 | 1,500 | 1,500 | |||||||||
Mimeo.com, Inc., 0.25% Unfunded, 12/21/2020 | None | Services: Business | 10,000 | — | — | |||||||||
Mimeo.com, Inc., 1.00% Unfunded, 12/21/2023 | None | Services: Business | 1,500 | — | — | |||||||||
See accompanying notes to consolidated financial statements.
73
CĪON Investment Corporation
Consolidated Schedule of Investments
December 31, 2019
(in thousands)
Portfolio Company(a) | Index Rate(b) | Industry | Principal/ Par Amount/ Units(e) | Cost(d) | Fair Value(c) | ||||||||
Moss Holding Company, L+625, 1.00% LIBOR Floor, 4/17/2023(o)(q) | 3 Month LIBOR | Services: Business | 19,657 | 19,419 | 19,264 | ||||||||
Moss Holding Company, 6.25% Unfunded, 4/17/2023 | None | Services: Business | 106 | — | (2 | ) | |||||||
Moss Holding Company, 0.50% Unfunded, 4/17/2023 | None | Services: Business | 2,126 | — | (43 | ) | |||||||
Moxie Patriot LLC, L+575, 1.00% LIBOR Floor, 12/19/2020(p) | 3 Month LIBOR | Energy: Oil & Gas | 9,799 | 9,792 | 9,554 | ||||||||
Murray Energy Corp., L+725, 1.00% LIBOR Floor, 10/17/2022(t) | 3 Month LIBOR | Metals & Mining | 3,574 | 3,562 | 771 | ||||||||
Murray Energy Corp., L+1100, 2.00% LIBOR Floor, 7/29/2020(p) | 1 Month LIBOR | Metals & Mining | 662 | 643 | 668 | ||||||||
NewsCycle Solutions, Inc., L+700, 1.00% LIBOR Floor, 12/29/2022(q)(r) | 1 Month LIBOR | Media: Advertising, Printing & Publishing | 14,868 | 14,764 | 14,719 | ||||||||
One Call Corp., L+525, 1.00% LIBOR Floor, 11/25/2022(p) | 3 Month LIBOR | Healthcare & Pharmaceuticals | 7,915 | 7,582 | 7,598 | ||||||||
Palmetto Solar, LLC, 12.00%, 12/12/2024 | None | High Tech Industries | 858 | 566 | 835 | ||||||||
Palmetto Solar, LLC, 0.75% Unfunded, 12/12/2021 | None | High Tech Industries | 19,142 | — | (526 | ) | |||||||
Petroflow Energy Corp., L+800, 1.00% LIBOR Floor, 6/29/2019(o)(t)(u)(x) | 1 Month LIBOR | Energy: Oil & Gas | 642 | 223 | 10 | ||||||||
PFS Holding Corp., L+350, 1.00% LIBOR Floor, 1/31/2021 | 3 Month LIBOR | Retail | 3,097 | 2,738 | 2,079 | ||||||||
PH Beauty Holdings III. Inc., L+500, 0.00% LIBOR Floor, 9/28/2025(p) | 1 Month LIBOR | Consumer Goods: Non-Durable | 4,888 | 4,845 | 4,692 | ||||||||
Pixelle Specialty Solutions LLC, L+600, 1.00% LIBOR Floor, 10/31/2024(p) | 1 Month LIBOR | Forest Products & Paper | 24,775 | 24,244 | 24,217 | ||||||||
Plano Molding Company, LLC, L+750, 1.00% LIBOR Floor, 5/12/2021(o) | 1 Month LIBOR | Consumer Goods: Non-Durable | 6,010 | 5,979 | 5,770 | ||||||||
Polymer Additives, Inc., L+600, 0.00% LIBOR Floor, 7/31/2025(o)(p) | 1 Month LIBOR | Chemicals, Plastics & Rubber | 19,800 | 19,462 | 18,068 | ||||||||
Polymer Process Holdings, Inc., L+600, 0.00% LIBOR Floor, 5/1/2026(p) | 1 Month LIBOR | Chemicals, Plastics & Rubber | 19,888 | 19,513 | 19,589 | ||||||||
Rhino Energy LLC, L+1000, 1.00% LIBOR Floor, 12/27/2022(r) | 1 Month LIBOR | Metals & Mining | 9,387 | 9,149 | 8,918 | ||||||||
Securus Technologies Holdings, Inc., L+450, 1.00% LIBOR Floor, 11/1/2024(p) | 1 Month LIBOR | Telecommunications | 3,990 | 2,897 | 3,940 | ||||||||
SEK Holding Co LLC, L+1150, 0.00% LIBOR Floor, 3/14/2022(o)(x) | 1 Month LIBOR | Banking, Finance, Insurance & Real Estate | 15,415 | 15,179 | 14,510 | ||||||||
Sequoia Healthcare Management, LLC, 12.75%, 8/21/2023(o)(q) | None | Healthcare & Pharmaceuticals | 9,103 | 9,031 | 8,875 | ||||||||
SIMR, LLC, L+1700, 2.00% LIBOR Floor, 9/7/2023(o)(u)(x) | 1 Month LIBOR | Healthcare & Pharmaceuticals | 15,091 | 14,853 | 14,205 | ||||||||
Smart & Final Inc., L+675, 0.00% LIBOR Floor, 6/20/2025(p) | 1 Month LIBOR | Retail | 9,950 | 9,091 | 9,627 | ||||||||
Sorenson Communications, LLC, L+650, 0.00% LIBOR Floor, 4/30/2024(p) | 3 Month LIBOR | Telecommunications | 12,536 | 12,089 | 12,473 | ||||||||
Spinal USA, Inc. / Precision Medical Inc., L+950, 1.00% LIBOR Floor, 6/30/2021(o) | 3 Month LIBOR | Healthcare & Pharmaceuticals | 12,654 | 12,653 | 12,464 | ||||||||
Spinal USA, Inc. / Precision Medical Inc., L+950, 1.00% LIBOR Floor, 6/30/2021(o)(x) | 3 Month LIBOR | Healthcare & Pharmaceuticals | 563 | 563 | 555 | ||||||||
Spinal USA, Inc. / Precision Medical Inc., L+950, 1.00% LIBOR Floor, 6/30/2021(o)(x) | 3 Month LIBOR | Healthcare & Pharmaceuticals | 542 | 493 | 533 | ||||||||
Stats Intermediate Holdings, LLC, L+525, 0.00% LIBOR Floor, 7/12/2026(p) | 3 Month LIBOR | High Tech Industries | 10,000 | 9,789 | 9,775 | ||||||||
STG-Fairway Acquisitions, Inc., L+525, 1.00% LIBOR Floor, 6/30/2022(p)(q) | 1 Month LIBOR | Services: Business | 3,929 | 3,866 | 3,929 | ||||||||
Teladoc, Inc., 0.50% Unfunded, 7/14/2020(h) | None | High Tech Industries | 1,250 | (8 | ) | — | |||||||
Telestream Holdings Corp., L+645, 1.00% LIBOR Floor, 3/24/2022(k)(o) | 2 Month LIBOR | High Tech Industries | 8,769 | 8,668 | 8,593 | ||||||||
Tenere Inc., L+1000, 1.00% LIBOR Floor, 12/23/2021(o)(q) | 3 Month LIBOR | Capital Equipment | 28,480 | 28,196 | 28,480 | ||||||||
Tensar Corp., L+475, 1.00% LIBOR Floor, 7/9/2021(p) | 3 Month LIBOR | Chemicals, Plastics & Rubber | 12,980 | 12,632 | 12,363 | ||||||||
The Pasha Group, L+750, 1.00% LIBOR Floor, 1/26/2023(q) | 2 Month LIBOR | Transportation: Cargo | 5,764 | 5,647 | 5,822 | ||||||||
The Pay-O-Matic Corp., L+900, 0.00% LIBOR Floor, 4/5/2021(g)(o) | 3 Month LIBOR | Services: Consumer | 9,612 | 9,568 | 9,612 | ||||||||
See accompanying notes to consolidated financial statements.
74
CĪON Investment Corporation
Consolidated Schedule of Investments
December 31, 2019
(in thousands)
Portfolio Company(a) | Index Rate(b) | Industry | Principal/ Par Amount/ Units(e) | Cost(d) | Fair Value(c) | |||||||||
Therapure Biopharma Inc., L+875, 0.50% LIBOR Floor, 12/1/2021(h) | 1 Month LIBOR | Healthcare & Pharmaceuticals | 13,913 | 13,882 | 13,148 | |||||||||
Volta Charging, LLC, 12.00%, 6/19/2024 | None | Media: Diversified & Production | 10,000 | 10,000 | 10,000 | |||||||||
Volta Charging, LLC, 12.00%, 6/19/2024 | None | Media: Diversified & Production | 2,000 | 1,961 | 2,000 | |||||||||
Volta Charging, LLC, 0.00% Unfunded, 6/19/2021(s) | None | Media: Diversified & Production | 10,000 | — | — | |||||||||
Wok Holdings Inc., L+650, 0.00% LIBOR Floor, 3/1/2026(p) | 6 Month LIBOR | Beverage, Food & Tobacco | 12,903 | 12,736 | 13,064 | |||||||||
Woodstream Corp., L+600, 1.00% LIBOR Floor, 5/29/2022(r) | 1 Month LIBOR | Consumer Goods: Non-Durable | 9,300 | 9,300 | 9,300 | |||||||||
Woodstream Corp., L+600, 1.00% LIBOR Floor, 5/29/2022 | 1 Month LIBOR | Consumer Goods: Non-Durable | 559 | 559 | 559 | |||||||||
Total Senior Secured First Lien Debt | 1,388,942 | 1,351,767 | ||||||||||||
Senior Secured Second Lien Debt - 26.1% | ||||||||||||||
1A Smart Start LLC, L+825, 1.00% LIBOR Floor, 8/21/2022(o)(q) | 1 Month LIBOR | High Tech Industries | 13,800 | 13,618 | 13,593 | |||||||||
Access CIG, LLC, L+775, 0.00% LIBOR Floor, 2/27/2026(q) | 1 Month LIBOR | Services: Business | 17,250 | 17,126 | 17,207 | |||||||||
Albany Molecular Research, Inc., L+700, 1.00% LIBOR Floor, 8/30/2025(o) | 1 Month LIBOR | Healthcare & Pharmaceuticals | 10,000 | 9,842 | 9,975 | |||||||||
American Residential Services LLC, L+800, 1.00% LIBOR Floor, 12/31/2022(o) | 1 Month LIBOR | Construction & Building | 5,180 | 5,142 | 5,128 | |||||||||
Carestream Health, Inc., L+950, 1.00% LIBOR Floor, 6/7/2021(q) | 1 Month LIBOR | Healthcare & Pharmaceuticals | 10,662 | 10,662 | 10,102 | |||||||||
Country Fresh Holdings, LLC, L+850, 1.00% LIBOR Floor, 4/29/2024(x) | 3 Month LIBOR | Beverage, Food & Tobacco | 2,028 | 2,028 | 2,028 | |||||||||
Dayton Superior Corp., L+700, 2.00% LIBOR Floor, 12/4/2024 | 3 Month LIBOR | Construction & Building | 1,507 | 1,507 | 1,507 | |||||||||
Deluxe Entertainment Services Inc., L+850, 1.00% LIBOR Floor, 9/25/2024(p)(u)(x) | 1 Month LIBOR | Media: Diversified & Production | 9,890 | 9,675 | 9,717 | |||||||||
EagleTree-Carbide Acquisition Corp., L+850, 1.00% LIBOR Floor, 8/28/2025(o)(q) | 3 Month LIBOR | Consumer Goods: Durable | 25,000 | 24,695 | 24,750 | |||||||||
Evergreen Skills Lux S.À.R.L., L+825, 1.00% LIBOR Floor, 4/28/2022(h)(q)(t) | 3 Month LIBOR | High Tech Industries | 9,999 | 8,147 | 2,833 | |||||||||
Global Tel*Link Corp., L+825, 0.00% LIBOR Floor, 11/29/2026(q) | 1 Month LIBOR | Telecommunications | 11,500 | 11,312 | 11,586 | |||||||||
LSCS Holdings, Inc., L+825, 0.00% LIBOR Floor, 3/16/2026(o) | 3 Month LIBOR | Services: Business | 11,891 | 11,655 | 11,831 | |||||||||
Mayfield Agency Borrower Inc., L+850, 0.00% LIBOR Floor, 3/2/2026(o)(q)(r) | 1 Month LIBOR | Banking, Finance, Insurance & Real Estate | 20,000 | 19,723 | 20,200 | |||||||||
Medical Solutions Holdings, Inc., L+838, 1.00% LIBOR Floor, 6/16/2025(o) | 1 Month LIBOR | Healthcare & Pharmaceuticals | 10,000 | 9,877 | 9,650 | |||||||||
MedPlast Holdings, Inc., L+775, 0.00% LIBOR Floor, 7/2/2026(r) | 3 Month LIBOR | Healthcare & Pharmaceuticals | 6,750 | 6,690 | 6,383 | |||||||||
Ministry Brands, LLC, L+925, 1.00% LIBOR Floor, 6/2/2023(o)(q) | 2 Month LIBOR | Services: Business | 7,000 | 6,932 | 7,000 | |||||||||
Niacet Corp., E+875, 1.00% EURIBOR Floor, 8/1/2024(h) | 1 Month EURIBOR | Chemicals, Plastics & Rubber | € | 7,489 | 7,985 | 8,314 | ||||||||
Patterson Medical Supply, Inc., L+850, 1.00% LIBOR Floor, 8/28/2023(o) | 3 Month LIBOR | Healthcare & Pharmaceuticals | 13,500 | 13,419 | 11,813 | |||||||||
PetroChoice Holdings, Inc., L+875, 1.00% LIBOR Floor, 8/21/2023(o) | 3 Month LIBOR | Chemicals, Plastics & Rubber | 10,000 | 9,860 | 9,600 | |||||||||
PFS Holding Corp., L+725, 1.00% LIBOR Floor, 1/31/2022(p)(t) | 3 Month LIBOR | Retail | 4,998 | 4,272 | — | |||||||||
Premiere Global Services, Inc., L+950, 1.00% LIBOR Floor, 6/6/2024(o)(x) | 3 Month LIBOR | Telecommunications | 3,070 | 2,960 | 1,074 | |||||||||
Securus Technologies Holdings, Inc., L+825, 1.00% LIBOR Floor, 11/1/2025(q) | 1 Month LIBOR | Telecommunications | 2,942 | 2,916 | 2,836 | |||||||||
STG-Fairway Acquisitions, Inc., L+925, 1.00% LIBOR Floor, 6/30/2023(o) | 1 Month LIBOR | Services: Business | 5,000 | 4,957 | 5,000 | |||||||||
TMK Hawk Parent, Corp., L+800, 1.00% LIBOR Floor, 8/28/2025(o) | 3 Month LIBOR | Services: Business | 13,393 | 13,122 | 12,924 | |||||||||
TouchTunes Interactive Networks, Inc, L+825, 1.00% LIBOR Floor, 5/29/2022(q) | 1 Month LIBOR | Hotel, Gaming & Leisure | 5,226 | 5,201 | 5,226 | |||||||||
Winebow Holdings, Inc., L+750, 1.00% LIBOR Floor, 1/2/2022(o) | 1 Month LIBOR | Beverage, Food & Tobacco | 12,823 | 12,689 | 10,467 | |||||||||
See accompanying notes to consolidated financial statements.
75
CĪON Investment Corporation
Consolidated Schedule of Investments
December 31, 2019
(in thousands)
Portfolio Company(a) | Index Rate(b) | Industry | Principal/ Par Amount/ Units(e) | Cost(d) | Fair Value(c) | ||||||||
Zest Acquisition Corp., L+750, 1.00% LIBOR Floor, 3/14/2026(q) | 1 Month LIBOR | Healthcare & Pharmaceuticals | 15,000 | 14,870 | 14,063 | ||||||||
Zywave Inc., L+900, 1.00% LIBOR Floor, 11/17/2023(o) | 3 Month LIBOR | High Tech Industries | 3,445 | 3,398 | 3,446 | ||||||||
Total Senior Secured Second Lien Debt | 264,280 | 248,253 | |||||||||||
Collateralized Securities and Structured Products - Debt - 0.7% | |||||||||||||
Deutsche Bank AG Frankfurt CRAFT 2015-2 Class Credit Linked Note, L+925, 1/16/2022(h) | 3 Month LIBOR | Diversified Financials | 7,212 | 7,212 | 7,212 | ||||||||
Total Collateralized Securities and Structured Products - Debt | 7,212 | 7,212 | |||||||||||
Collateralized Securities and Structured Products - Equity - 1.5% | |||||||||||||
APIDOS CLO XVI Subordinated Notes, 6.39% Estimated Yield, 1/19/2025(h) | (f) | Diversified Financials | 9,000 | 3,762 | 2,125 | ||||||||
CENT CLO 19 Ltd. Subordinated Notes, 37.72% Estimated Yield, 10/29/2025(h) | (f) | Diversified Financials | 2,000 | 1,163 | 782 | ||||||||
Galaxy XV CLO Ltd. Class A Subordinated Notes, 6.78% Estimated Yield, 4/15/2025(h) | (f) | Diversified Financials | 4,000 | 2,229 | 1,730 | ||||||||
Ivy Hill Middle Market Credit Fund VIII, Ltd. Subordinated Loan, 11.84% Estimated Yield, 2/2/2026(h) | (f) | Diversified Financials | 10,000 | 9,322 | 9,545 | ||||||||
Total Collateralized Securities and Structured Products - Equity | 16,476 | 14,182 | |||||||||||
Unsecured Debt - 0.5% | |||||||||||||
WPLM Acquisition Corp., 15.00%, 11/24/2025(x) | None | Media: Advertising, Printing & Publishing | 5,000 | 4,901 | 4,900 | ||||||||
Total Unsecured Debt | 4,901 | 4,900 | |||||||||||
Equity - 11.5% | |||||||||||||
Anthem Sports and Entertainment Inc., Class A Preferred Stock Warrants(s) | Media: Diversified & Production | 769 Units | 205 | 226 | |||||||||
Anthem Sports and Entertainment Inc., Class B Preferred Stock Warrants(s) | Media: Diversified & Production | 135 Units | — | — | |||||||||
Anthem Sports and Entertainment Inc., Common Stock Warrants(s) | Media: Diversified & Production | 2,508 Units | — | — | |||||||||
Ascent Resources - Marcellus, LLC, Common Shares(s) | Energy: Oil & Gas | 511,255 Units | 1,642 | 914 | |||||||||
Ascent Resources - Marcellus, LLC, Warrants(s) | Energy: Oil & Gas | 132,367 Units | 13 | 4 | |||||||||
Avaya Holdings Corp., Common Stock(i)(p)(s) | Telecommunications | 321,260 Units | 5,285 | 4,337 | |||||||||
BCP Great Lakes Fund LP, Partnership Interests (31.7% ownership)(h)(v) | Diversified Financials | N/A | 14,208 | 14,238 | |||||||||
CHC Medical Partners, Inc., Series C Preferred Stock, 12% Dividend(w) | Healthcare & Pharmaceuticals | 2,727,273 Units | 5,139 | 5,245 | |||||||||
CION SOF Funding, LLC, Membership Interests (87.5% ownership)(h)(v) | Diversified Financials | N/A | 31,289 | 31,265 | |||||||||
Conisus Holdings, Inc., Series B Preferred Stock, 12% Dividend(u)(w) | Healthcare & Pharmaceuticals | 12,677,833 Units | 13,215 | 13,270 | |||||||||
Conisus Holdings, Inc., Common Stock(s)(u) | Healthcare & Pharmaceuticals | 4,914,556 Units | 200 | 1,426 | |||||||||
Country Fresh Holdings, LLC, Common Stock(s) | Beverage, Food & Tobacco | 2,985 Units | 5,249 | 2,618 | |||||||||
David's Bridal, Inc., Series A Preferred Stock(s) | Retail | 1,396 Units | 140 | 141 | |||||||||
David's Bridal, Inc., Series B Preferred Stock(s) | Retail | 4,183 Units | 410 | 410 | |||||||||
David's Bridal, Inc., Common Stock(s) | Retail | 39,423 Units | — | — | |||||||||
David's Bridal, Inc., Reallocation Rights(s) | Retail | 7,500 Units | — | — | |||||||||
Dayton HoldCo, LLC, Common Stock(s) | Construction & Building | 37,264 Units | 4,136 | 7,903 | |||||||||
DESG Holdings, Inc., Common Stock(j)(s)(u) | Media: Diversified & Production | 1,268,143 Units | 13,662 | 14,763 | |||||||||
See accompanying notes to consolidated financial statements.
76
CĪON Investment Corporation
Consolidated Schedule of Investments
December 31, 2019
(in thousands)
Portfolio Company(a) | Industry | Principal/ Par Amount/ Units(e) | Cost(d) | Fair Value(c) | ||||||||||
HDNet Holdco LLC, Preferred Unit Call Option(s) | Media: Diversified & Production | 1 Unit | — | — | ||||||||||
Independent Pet Partners Intermediate Holdings, LLC, Class A Preferred Units(s) | Retail | 1,000,000 Units | 1,000 | 950 | ||||||||||
Independent Pet Partners Intermediate Holdings, LLC, Warrants(s) | Retail | 155,880 Units | — | 1 | ||||||||||
Mooregate ITC Acquisition, LLC, Class A Units(s) | High Tech Industries | 500 Units | 563 | 151 | ||||||||||
Mount Logan Capital Inc., Common Stock(h)(i)(s)(u) | Banking, Finance, Insurance & Real Estate | 980,284 Units | 3,335 | 2,505 | ||||||||||
NS NWN Acquisition, LLC, Voting Units(s) | High Tech Industries | 346 Units | 393 | 585 | ||||||||||
NS NWN Acquisition, LLC, Class A Preferred Units(s) | High Tech Industries | 111 Units | 110 | 331 | ||||||||||
NSG Co-Invest (Bermuda) LP, Partnership Interests(h)(s) | Consumer Goods: Durable | 1,575 Units | 1,000 | 528 | ||||||||||
Palmetto Solar, LLC, Warrants(s) | High Tech Industries | 346,694 Units | 295 | 295 | ||||||||||
Rhino Energy LLC, Warrants(s) | Metals & Mining | 170,972 Units | 280 | 16 | ||||||||||
SIMR Parent, LLC, Class B Common Units(s)(u) | Healthcare & Pharmaceuticals | 12,283,000 Units | 8,002 | 3,980 | ||||||||||
Spinal USA, Inc. / Precision Medical Inc., Warrants(o)(s) | Healthcare & Pharmaceuticals | 14,181,915 Units | 5,806 | 1,560 | ||||||||||
Tenere Inc., Warrants(s) | Capital Equipment | N/A | 161 | 1,569 | ||||||||||
Total Equity | 115,738 | 109,231 | ||||||||||||
Short Term Investments - 3.1%(m) | ||||||||||||||
First American Treasury Obligations Fund, Class Z Shares, 1.49% (n) | 29,527 | 29,527 | ||||||||||||
Total Short Term Investments | 29,527 | 29,527 | ||||||||||||
TOTAL INVESTMENTS - 185.3% | $ | 1,827,076 | 1,765,072 | |||||||||||
LIABILITIES IN EXCESS OF OTHER ASSETS - (85.3%) | (812,509 | ) | ||||||||||||
NET ASSETS - 100% | $ | 952,563 | ||||||||||||
a. | All of the Company’s investments are issued by eligible U.S. portfolio companies, as defined in the Investment Company Act of 1940, as amended, or the 1940 Act, except for investments specifically identified as non-qualifying per note h. below. Unless specifically identified in note x. below, investments do not contain a paid-in-kind, or PIK, interest provision. |
b. | The 1, 2, 3 and 6 month London Interbank Offered Rate, or LIBOR, rates were 1.76%, 1.83%, 1.91% and 1.91%, respectively, as of December 31, 2019. The actual LIBOR rate for each loan listed may not be the applicable LIBOR rate as of December 31, 2019, as the loan may have been priced or repriced based on a LIBOR rate prior to or subsequent to December 31, 2019. The 1 month Euro Interbank Offered Rate, or EURIBOR, rate was (0.51%) as of December 31, 2019. |
c. | Fair value determined in good faith by the Company’s board of directors (see Note 10) using significant unobservable inputs unless otherwise noted. |
d. | Represents amortized cost for debt securities and cost for equity investments. |
e. | Denominated in U.S. dollars unless otherwise noted. |
f. | The CLO subordinated notes are considered equity positions in the CLO vehicles and are not rated. Equity investments are entitled to recurring distributions, which are generally equal to the remaining cash flow of the payments made by the underlying vehicle's securities less contractual payments to debt holders and expenses. The estimated yield indicated is based upon a current projection of the amount and timing of these recurring distributions and the estimated amount of repayment of principal upon termination. Such projections are periodically reviewed and adjusted, and the estimated yield may not ultimately be realized. |
g. | As a result of an arrangement between the Company and the other lenders in the syndication, the Company is entitled to less interest than the stated interest rate of this loan, which is reflected in this schedule, in exchange for a higher payment priority. |
h. | The investment or a portion thereof is not a qualifying asset under the 1940 Act. A business development company may not acquire any asset other than qualifying assets, unless, at the time the acquisition is made, qualifying assets represent at least 70% of the company’s total assets as defined under Section 55 of the 1940 Act. As of December 31, 2019, 91.5% of the Company’s total assets represented qualifying assets. |
i. | Fair value determined using level 1 inputs. |
j. | Position or a portion thereof unsettled as of December 31, 2019. |
See accompanying notes to consolidated financial statements.
77
CĪON Investment Corporation
Consolidated Schedule of Investments
December 31, 2019
(in thousands)
k. | In addition to the interest earned based on the stated interest rate of this loan, which is the amount reflected in this schedule, the Company may be entitled to receive additional amounts as a result of an arrangement between the Company and the other lenders in the syndication in exchange for a lower payment priority. |
l. | In addition to the interest earned based on the stated interest rate of this loan, which is the amount reflected in this schedule, the Company may be entitled to receive additional residual amounts. |
m. | Short term investments represent an investment in a fund that invests in highly liquid investments with average original maturity dates of three months or less. |
n. | 7-day effective yield as of December 31, 2019. |
o. | Investment or a portion thereof held within the Company’s wholly-owned consolidated subsidiary, 34th Street Funding, LLC, or 34th Street, and was pledged as collateral supporting the amounts outstanding under the credit facility with JPMorgan Chase Bank, National Association, or JPM, as of December 31, 2019 (see Note 9). |
p. | Investment or a portion thereof held within the Company’s wholly-owned consolidated subsidiary, Flatiron Funding II, LLC, or Flatiron Funding II, and was pledged as collateral supporting the amounts outstanding under the credit facility with Citibank, N.A., or Citibank, as of December 31, 2019 (see Note 9). |
q. | Investment or a portion thereof held within the Company’s wholly-owned consolidated subsidiary, Murray Hill Funding II, LLC, or Murray Hill Funding II, and was pledged as collateral supporting the amounts outstanding under the repurchase agreement with UBS AG, or UBS, as of December 31, 2019 (see Note 9). |
r. | Investment or a portion thereof held within the Company’s wholly-owned consolidated subsidiary, 33rd Street Funding, LLC, or 33rd Street, and was pledged as collateral supporting the amounts outstanding under the credit facility with Morgan Stanley N.A., or MS, as of December 31, 2019 (see Note 9). |
s. | Non-income producing security. |
t. | Investment or a portion thereof was on non-accrual status as of December 31, 2019. |
See accompanying notes to consolidated financial statements.
78
CĪON Investment Corporation
Consolidated Schedule of Investments
December 31, 2019
(in thousands)
u. | Investment determined to be an affiliated investment as defined in the 1940 Act as the Company owns between 5% and 25% of the portfolio company’s outstanding voting securities but does not control the portfolio company. Fair value as of December 31, 2018 and 2019, along with transactions during the year ended December 31, 2019 in these affiliated investments are as follows: |
Year Ended December 31, 2019 | Year Ended December 31, 2019 | |||||||||||||||||||||||||||||||
Non-Controlled, Affiliated Investments | Fair Value at December 31, 2018 | Gross Additions (Cost)(1) | Gross Reductions (Cost)(2) | Net Unrealized Gain (Loss) | Fair Value at December 31, 2019 | Net Realized Gain (Loss) | Interest Income(3) | Dividend Income | ||||||||||||||||||||||||
Charming Charlie, LLC | ||||||||||||||||||||||||||||||||
First Lien Term Loan B1 | $ | 1,021 | $ | — | $ | (2,619 | ) | $ | 1,598 | $ | — | $ | (2,619 | ) | $ | — | $ | — | ||||||||||||||
First Lien Term Loan B2 | 1,249 | — | (1,912 | ) | 663 | — | (1,912 | ) | — | — | ||||||||||||||||||||||
Vendor Payment Financing Facility | 157 | 890 | (293 | ) | (282 | ) | 472 | — | 57 | — | ||||||||||||||||||||||
Common Stock | — | — | (1,302 | ) | 1,302 | — | (1,302 | ) | — | — | ||||||||||||||||||||||
Conisus Holdings, Inc. | ||||||||||||||||||||||||||||||||
Series B Preferred Stock(w) | 10,903 | 4,015 | — | (1,648 | ) | 13,270 | — | — | 4,015 | |||||||||||||||||||||||
Common Stock | 197 | — | — | 1,229 | 1,426 | — | — | — | ||||||||||||||||||||||||
DESG Holdings, Inc. | ||||||||||||||||||||||||||||||||
First Lien Term Loan | — | 23,656 | — | 5,322 | 28,978 | — | 303 | — | ||||||||||||||||||||||||
Second Lien Term Loan | — | 9,675 | — | 42 | 9,717 | — | 162 | — | ||||||||||||||||||||||||
Common Stock | — | 13,662 | — | 1,101 | 14,763 | — | — | — | ||||||||||||||||||||||||
F+W Media, Inc. | ||||||||||||||||||||||||||||||||
First Lien DIP Term Loan | — | 521 | (521 | ) | — | — | — | 101 | — | |||||||||||||||||||||||
First Lien Term Loan B-1 | 1,137 | 51 | (43 | ) | (1,145 | ) | — | — | 51 | — | ||||||||||||||||||||||
First Lien Term Loan B-2 | 161 | — | (2,759 | ) | 2,598 | — | (2,759 | ) | — | — | ||||||||||||||||||||||
Common Stock | — | — | — | — | — | — | — | — | ||||||||||||||||||||||||
Mount Logan Capital Inc. | ||||||||||||||||||||||||||||||||
Common Stock | 2,645 | — | — | (140 | ) | 2,505 | — | — | — | |||||||||||||||||||||||
SIMR, LLC | ||||||||||||||||||||||||||||||||
First Lien Term Loan | 14,757 | 452 | (619 | ) | (385 | ) | 14,205 | — | 1,778 | — | ||||||||||||||||||||||
SIMR Parent, LLC | ||||||||||||||||||||||||||||||||
Class B Common Units | 7,382 | 502 | — | (3,904 | ) | 3,980 | — | — | — | |||||||||||||||||||||||
Petroflow Energy Corp. | ||||||||||||||||||||||||||||||||
First Lien Term Loan | 2,363 | — | (2,511 | ) | 158 | 10 | — | 19 | — | |||||||||||||||||||||||
TexOak Petro Holdings LLC | ||||||||||||||||||||||||||||||||
Second Lien Term Loan | — | — | (2,592 | ) | 2,592 | — | (2,592 | ) | — | — | ||||||||||||||||||||||
Membership Interests | — | — | — | — | — | — | — | — | ||||||||||||||||||||||||
Totals | $ | 41,972 | $ | 53,424 | $ | (15,171 | ) | $ | 9,101 | $ | 89,326 | $ | (11,184 | ) | $ | 2,471 | $ | 4,015 | ||||||||||||||
(1) | Gross additions include increases in the cost basis of investments resulting from new portfolio investments, PIK interest, the amortization of unearned income, the exchange of one or more existing securities for one or more new securities and the movement of an existing portfolio company into this category from a different category. |
(2) | Gross reductions include decreases in the cost basis of investments resulting from principal collections related to investment repayments or sales, the exchange of one or more existing securities for one or more new securities and the movement of an existing portfolio company out of this category into a different category. |
(3) | Includes PIK interest income. |
See accompanying notes to consolidated financial statements.
79
CĪON Investment Corporation
Consolidated Schedule of Investments
December 31, 2019
(in thousands)
v. | Investment determined to be a controlled investment as defined in the 1940 Act as the Company is deemed to exercise a controlling influence over the management or policies of the portfolio company due to beneficially owning, either directly or through one or more controlled companies, more than 25% of the outstanding voting securities of such portfolio company. Fair value as of December 31, 2018 and 2019, along with transactions during the year ended December 31, 2019 in these controlled investments are as follows: |
Year Ended December 31, 2019 | Year Ended December 31, 2019 | |||||||||||||||||||||||||||||||
Controlled Investments | Fair Value at December 31, 2018 | Gross Additions (Cost)(1) | Gross Reductions (Cost)(2) | Net Unrealized Gain (Loss) | Fair Value at December 31, 2019 | Net Realized Gain (Loss) | Interest Income(3) | Dividend Income | ||||||||||||||||||||||||
BCP Great Lakes Fund LP | ||||||||||||||||||||||||||||||||
Membership Interests | $ | — | $ | 14,208 | $ | — | $ | 30 | $ | 14,238 | $ | — | $ | — | $ | 47 | ||||||||||||||||
CION SOF Funding, LLC | ||||||||||||||||||||||||||||||||
Membership Interests | — | 31,289 | — | (24 | ) | 31,265 | — | — | 1,076 | |||||||||||||||||||||||
Totals | $ | — | $ | 45,497 | $ | — | $ | 6 | $ | 45,503 | $ | — | $ | — | $ | 1,123 | ||||||||||||||||
(1) | Gross additions include increases in the cost basis of investments resulting from new portfolio investments, PIK interest, the amortization of unearned income, the exchange of one or more existing securities for one or more new securities and the movement of an existing portfolio company into this category from a different category. |
(2) | Gross reductions include decreases in the cost basis of investments resulting from principal collections related to investment repayments or sales, the exchange of one or more existing securities for one or more new securities and the movement of an existing portfolio company out of this category into a different category. |
(3) | Includes PIK interest income. |
w. | For the year ended December 31, 2019, non-cash dividend income of $4,015 and $474 was recorded on the Company's investment in Conisus Holdings, Inc. and CHC Medical Partners, Inc., respectively. |
See accompanying notes to consolidated financial statements.
80
x. | For the year ended December 31, 2019, the following investments contain a PIK interest provision whereby the issuer has either the option or the obligation to make interest payments with the issuance of additional securities: |
Interest Rate | ||||||||
Portfolio Company | Investment Type | Cash | PIK | All-in-Rate | ||||
American Clinical Solutions LLC | Senior Secured First Lien Debt | — | 2.00% | 2.00% | ||||
Anthem Sports & Entertainment Inc. | Senior Secured First Lien Debt | 8.69% | 2.75% | 11.44% | ||||
Charming Charlie | Senior Secured First Lien Debt | 7.05% | 5.00% | 12.05% | ||||
Charming Charlie | Senior Secured First Lien Debt | 3.05% | 9.00% | 12.05% | ||||
CHC Solutions Inc. | Senior Secured First Lien Debt | 8.00% | 4.00% | 12.00% | ||||
Country Fresh Holdings, LLC | Senior Secured Second Lien Debt | — | 10.44% | 10.44% | ||||
David's Bridal, LLC | Senior Secured First Lien Debt | 1.00% | 6.92% | 7.92% | ||||
Deluxe Entertainment Services, Inc. | Senior Secured First Lien Debt | 6.71% | 1.50% | 8.21% | ||||
Deluxe Entertainment Services, Inc. | Senior Secured Second Lien Debt | 7.71% | 2.50% | 10.21% | ||||
F+W Media, Inc. | Senior Secured First Lien Debt | — | 8.21% | 8.21% | ||||
Hilliard, Martinez & Gonzales, LLP | Senior Secured First Lien Debt | — | 20.00% | 20.00% | ||||
KLO Intermediate Holdings, LLC | Senior Secured First Lien Debt | — | 9.50% | 9.50% | ||||
Lift Brands, Inc. | Senior Secured First Lien Debt | 9.10% | 0.50% | 9.60% | ||||
Petroflow Energy Corp. | Senior Secured First Lien Debt | — | 9.71% | 9.71% | ||||
Premiere Global Services, Inc. | Senior Secured Second Lien Debt | 0.50% | 10.98% | 11.48% | ||||
SEK Holding Co LLC | Senior Secured First Lien Debt | 9.77% | 3.50% | 13.27% | ||||
SIMR, LLC | Senior Secured First Lien Debt | 12.00% | 7.00% | 19.00% | ||||
Spinal USA, Inc. / Precision Medical Inc. | Senior Secured First Lien Debt | — | 11.30% | 11.30% | ||||
WPLM Acquisition Corp., | Unsecured Note | — | 15.00% | 15.00% | ||||
See accompanying notes to consolidated financial statements.
81
CĪON Investment Corporation
Consolidated Schedule of Investments
December 31, 2018
(in thousands)
Portfolio Company(a) | Index Rate(b) | Industry | Principal/ Par Amount/ Units(e) | Cost(d) | Fair Value(c) | |||||||||||
Senior Secured First Lien Debt - 149.4% | ||||||||||||||||
Academy, Ltd., L+400, 1.00% LIBOR Floor, 7/1/2022(q) | 3 Month LIBOR | Retail | $ | 14,411 | $ | 12,124 | $ | 9,718 | ||||||||
Achilles Acquisition LLC, L+400, 0.00% LIBOR Floor, 10/11/2025 | 1 Month LIBOR | High Tech Industries | 739 | 739 | 730 | |||||||||||
Achilles Acquisition LLC, 1.00% Unfunded, 1/11/2020 | None | High Tech Industries | 43 | — | (1 | ) | ||||||||||
Adams Publishing Group, LLC, L+750, 1.00% LIBOR Floor, 7/2/2023(p)(r) | 3 Month LIBOR | Media: Advertising, Printing & Publishing | 17,034 | 16,854 | 16,864 | |||||||||||
Adams Publishing Group, LLC, 0.38% Unfunded, 7/2/2020(p) | None | Media: Advertising, Printing & Publishing | 2,069 | — | (21 | ) | ||||||||||
Adapt Laser Acquisition, Inc., L+800, 1.00% LIBOR Floor, 12/31/2023 | 3 Month LIBOR | Capital Equipment | 12,000 | 12,000 | 12,000 | |||||||||||
Adapt Laser Acquisition, Inc., L+800, 1.00% LIBOR Floor, 12/31/2023 | 3 Month LIBOR | Capital Equipment | 500 | 500 | 500 | |||||||||||
Adapt Laser Acquisition, Inc., 0.50% Unfunded, 12/31/2023 | None | Capital Equipment | 1,500 | — | — | |||||||||||
Aegis Toxicology Sciences Corp., L+550, 1.00% LIBOR Floor, 5/9/2025(q) | 3 Month LIBOR | Healthcare & Pharmaceuticals | 9,975 | 9,780 | 9,526 | |||||||||||
AIS Holdco, LLC, L+500, 0.00% LIBOR Floor, 8/15/2025(q) | 3 Month LIBOR | Banking, Finance, Insurance & Real Estate | 5,521 | 5,451 | 5,438 | |||||||||||
Alchemy US Holdco 1, LLC, L+550, 10/10/2025(q) | 1 Month LIBOR | Construction & Building | 8,000 | 7,882 | 7,680 | |||||||||||
Allen Media, LLC, L+650, 1.00% LIBOR Floor, 8/30/2023(p)(r)(s) | 3 Month LIBOR | Media: Diversified & Production | 80,000 | 78,115 | 77,700 | |||||||||||
ALM Media, LLC, L+450, 1.00% LIBOR Floor, 7/31/2020(q) | 3 Month LIBOR | Media: Advertising, Printing & Publishing | 13,272 | 12,459 | 11,912 | |||||||||||
American Clinical Solutions LLC, 12.50%, 6/11/2020(u)(w) | None | Healthcare & Pharmaceuticals | 9,293 | 8,968 | 7,435 | |||||||||||
American Media, Inc., L+800, 1.00% LIBOR Floor, 8/24/2020(p) | 3 Month LIBOR | Media: Advertising, Printing & Publishing | 18,503 | 18,451 | 19,428 | |||||||||||
American Media, Inc., 0.50% Unfunded, 8/24/2020 | None | Media: Advertising, Printing & Publishing | 1,778 | (22 | ) | 89 | ||||||||||
American Teleconferencing Services, Ltd., L+650, 1.00% LIBOR Floor, 12/8/2021(p)(q)(r)(s) | 3 Month LIBOR | Telecommunications | 20,152 | 18,779 | 15,114 | |||||||||||
Analogic Corp., L+600, 1.00% LIBOR Floor, 6/21/2024(s) | 1 Month LIBOR | Healthcare & Pharmaceuticals | 29,925 | 29,368 | 29,626 | |||||||||||
AP Exhaust Acquisition, LLC, L+500, 1.00% LIBOR Floor, 5/10/2024(q)(r) | 3 Month LIBOR | Automotive | 10,544 | 9,955 | 9,595 | |||||||||||
APCO Holdings, LLC, L+550, 0.00% LIBOR Floor, 6/9/2025(q) | 1 Month LIBOR | Banking, Finance, Insurance & Real Estate | 11,427 | 11,317 | 11,313 | |||||||||||
Ascent Resources - Marcellus, LLC, L+650, 1.00% LIBOR Floor, 3/30/2023 | 1 Month LIBOR | Energy: Oil & Gas | 712 | 712 | 714 | |||||||||||
Associated Asphalt Partners, LLC, L+525, 1.00% LIBOR Floor, 4/5/2024(q) | 1 Month LIBOR | Construction & Building | 10,833 | 10,666 | 10,494 | |||||||||||
Bi-Lo, LLC, L+800, 1.00% LIBOR Floor, 5/31/2024(k)(r) | 3 Month LIBOR | Retail | 2,000 | 1,950 | 1,917 | |||||||||||
Cadence Aerospace, LLC, L+650, 1.00% LIBOR Floor, 11/14/2023(r)(s) | 3 Month LIBOR | Aerospace & Defense | 25,960 | 25,732 | 25,440 | |||||||||||
Canam Construction Inc., L+500, 1.00% LIBOR Floor, 7/1/2024 | 1 Month LIBOR | Construction & Building | 4,975 | 4,963 | 4,875 | |||||||||||
Cardinal US Holdings, Inc., L+500, 1.00% LIBOR Floor, 7/31/2023(q) | 3 Month LIBOR | Services: Business | 8,394 | 7,905 | 8,268 | |||||||||||
CB URS Holdings Corp., L+525, 1.00% LIBOR Floor, 9/1/2024(q)(s) | 1 Month LIBOR | Transportation: Cargo | 14,437 | 14,371 | 14,149 | |||||||||||
Central Security Group, Inc., L+563, 1.00% LIBOR Floor, 10/6/2021(q)(s) | 1 Month LIBOR | Services: Consumer | 24,660 | 24,682 | 24,167 | |||||||||||
Charming Charlie LLC, L+1000, 1.00% LIBOR Floor, 4/24/2023(u)(v)(w) | 3 Month LIBOR | Retail | 3,288 | 1,912 | 1,249 | |||||||||||
Charming Charlie LLC, L+1000, 1.00% LIBOR Floor, 4/24/2023(u)(v)(w) | 3 Month LIBOR | Retail | 2,686 | 2,619 | 1,021 | |||||||||||
Charming Charlie LLC, 20.00%, 5/15/2019(v) | None | Retail | 157 | 157 | 157 | |||||||||||
Charming Charlie LLC, 2.50% Unfunded, 5/15/2019(v) | None | Retail | 1,938 | — | — | |||||||||||
CHC Solutions Inc., 12.00%, 7/20/2023(w) | None | Healthcare & Pharmaceuticals | 7,057 | 7,057 | 7,057 | |||||||||||
CircusTrix Holdings, LLC, L+550, 1.00% LIBOR Floor, 12/16/2021(r)(s) | 1 Month LIBOR | Hotel, Gaming & Leisure | 25,900 | 25,609 | 25,382 | |||||||||||
See accompanying notes to consolidated financial statements.
82
CĪON Investment Corporation
Consolidated Schedule of Investments
December 31, 2018
(in thousands)
Portfolio Company(a) | Index Rate(b) | Industry | Principal/ Par Amount/ Units(e) | Cost(d) | Fair Value(c) | |||||||||
CircusTrix Holdings, LLC, 1.00% Unfunded, 12/27/2019 | None | Hotel, Gaming & Leisure | 5,573 | — | (111 | ) | ||||||||
Confie Seguros Holding II Co., L+475, 1.00% LIBOR Floor, 4/16/2022(q) | 3 Month LIBOR | Banking, Finance, Insurance & Real Estate | 15,371 | 15,285 | 15,227 | |||||||||
Country Fresh Holdings, LLC, L+500, 1.00% LIBOR Floor, 3/31/2023(s) | 3 Month LIBOR | Beverage, Food & Tobacco | 9,859 | 9,716 | 8,133 | |||||||||
Covenant Surgical Partners, Inc., L+450, 0.00% LIBOR Floor, 10/4/2024(q) | 3 Month LIBOR | Healthcare & Pharmaceuticals | 917 | 915 | 903 | |||||||||
Crown Subsea Communications Holdings, Inc., L+600, 0.00% LIBOR Floor, 11/2/2025(q) | 1 Month LIBOR | Capital Equipment | 8,000 | 7,843 | 7,720 | |||||||||
David's Bridal, Inc., L+400, 1.25% LIBOR Floor, 10/11/2019(q)(u) | 1 Month LIBOR | Retail | 3,406 | 3,137 | 1,822 | |||||||||
Dayton Superior Corp., L+1400, 1.00% LIBOR Floor, 11/15/2021(q)(w) | 3 Month LIBOR | Construction & Building | 6,398 | 5,929 | 5,358 | |||||||||
DBRS, Inc., L+525, 1.00% LIBOR Floor, 3/4/2022(i)(q) | 3 Month LIBOR | Services: Business | 5,846 | 5,700 | 5,803 | |||||||||
Del Frisco's Restaurant Group, Inc., L+600, 0.00% LIBOR Floor, 6/27/2025(i)(p)(q) | 1 Month LIBOR | Retail | 9,975 | 9,911 | 9,227 | |||||||||
Deluxe Entertainment Services Group Inc., L+550, 1.00% LIBOR Floor, 2/28/2020(q) | 3 Month LIBOR | Media: Diversified & Production | 16,071 | 16,014 | 14,223 | |||||||||
DFC Global Facility Borrower II LLC, L+1075, 1.00% LIBOR Floor, 9/27/2022 | 1 Month LIBOR | Services: Consumer | 24,683 | 24,570 | 24,683 | |||||||||
DFC Global Facility Borrower II LLC, 0.50% Unfunded, 9/27/2019 | None | Services: Consumer | 5,317 | — | — | |||||||||
DMT Solutions Global Corp., L+700, 0.00% LIBOR Floor, 7/2/2024(q)(s) | 3 Month LIBOR | Services: Business | 19,500 | 18,955 | 18,720 | |||||||||
Eagle Family Foods Group LLC, L+650, 1.00% LIBOR Floor, 6/14/2024(s) | 3 Month LIBOR | Beverage, Food & Tobacco | 14,925 | 14,615 | 14,776 | |||||||||
Eastman Kodak Company, L+625, 1.00% LIBOR Floor, 9/3/2019(i)(q) | 3 Month LIBOR | Consumer Goods: Durable | 1,965 | 1,963 | 1,859 | |||||||||
Elemica, Inc., L+700, 1.00% LIBOR Floor, 7/7/2021(p)(r) | 1 Month LIBOR | High Tech Industries | 17,063 | 16,810 | 16,892 | |||||||||
Elemica, Inc., 0.50% Unfunded, 7/7/2021 | None | High Tech Industries | 2,500 | (32 | ) | (25 | ) | |||||||
Emmis Operating Company, L+750, 1.00% LIBOR Floor, 4/18/2019(q) | 1 Month LIBOR | Media: Broadcasting & Subscription | 1,364 | 1,339 | 1,337 | |||||||||
Entertainment Studios P&A LLC, 6.22%, 5/18/2037(m) | None | Media: Diversified & Production | 17,465 | 17,315 | 17,115 | |||||||||
Entertainment Studios P&A LLC, 5.00%, 5/18/2037(m) | None | Media: Diversified & Production | — | — | 2,864 | |||||||||
EnTrans International, LLC, L+600, 0.00% LIBOR Floor, 11/1/2024(q)(s) | 1 Month LIBOR | Capital Equipment | 30,000 | 29,704 | 29,850 | |||||||||
Episerver Inc., E+600, 0.00% EURIBOR Floor, 10/9/2024 | 1 Month EURIBOR | High Tech Industries | € | 13,077 | 14,700 | 14,661 | ||||||||
ES Chappaquiddick LLC, 10.00%, 5/18/2022 | None | Media: Diversified & Production | 1,076 | 1,076 | 1,103 | |||||||||
Evergreen Skills Lux S.À.R.L., L+475, 1.00% LIBOR Floor, 4/28/2021(i)(q) | 1 Month LIBOR | High Tech Industries | 10,183 | 9,729 | 8,283 | |||||||||
F+W Media, Inc., L+650, 1.50% LIBOR Floor, 5/24/2022(v)(w) | 1 Month LIBOR | Media: Diversified & Production | 1,117 | 1,117 | 1,137 | |||||||||
F+W Media, Inc., L+1000, 1.50% LIBOR Floor, 5/24/2022(p)(u)(v)(w) | 1 Month LIBOR | Media: Diversified & Production | 3,058 | 2,759 | 161 | |||||||||
Flavors Holdings Inc., L+575, 1.00% LIBOR Floor, 4/3/2020(p) | 3 Month LIBOR | Consumer Goods: Non-Durable | 7,967 | 7,485 | 7,410 | |||||||||
Foundation Consumer Healthcare, LLC, L+650, 1.00% LIBOR Floor, 11/2/2023(p)(r)(s) | 3 Month LIBOR | Healthcare & Pharmaceuticals | 41,121 | 40,858 | 41,121 | |||||||||
Foundation Consumer Healthcare, LLC, 0.50% Unfunded, 11/2/2023 | None | Healthcare & Pharmaceuticals | 4,211 | (26 | ) | — | ||||||||
Genesis Healthcare, Inc., L+600, 0.50% LIBOR Floor, 3/6/2023(i)(p)(s) | 1 Month LIBOR | Healthcare & Pharmaceuticals | 35,000 | 34,695 | 34,650 | |||||||||
Geo Parent Corp., L+550, 0.00% LIBOR Floor, 12/19/2025(k) | 2 Month LIBOR | Services: Business | 15,000 | 14,850 | 14,925 | |||||||||
Global Tel*Link Corp., L+425, 0.00% LIBOR Floor, 11/29/2025(q) | 3 Month LIBOR | Telecommunications | 4,000 | 3,980 | 3,895 | |||||||||
Harland Clarke Holdings Corp., L+475, 1.00% LIBOR Floor, 11/3/2023(q)(s) | 3 Month LIBOR | Services: Business | 14,022 | 13,964 | 12,602 | |||||||||
Healogics, Inc., L+425, 1.00% LIBOR Floor, 7/1/2021(q) | 3 Month LIBOR | Healthcare & Pharmaceuticals | 4,799 | 4,608 | 4,352 | |||||||||
Homer City Generation, L.P., L+1100, 1.00% LIBOR Floor, 4/5/2023(p) | 1 Month LIBOR | Energy: Oil & Gas | 9,151 | 8,769 | 8,785 | |||||||||
See accompanying notes to consolidated financial statements.
83
CĪON Investment Corporation
Consolidated Schedule of Investments
December 31, 2018
(in thousands)
Portfolio Company(a) | Index Rate(b) | Industry | Principal/ Par Amount/ Units(e) | Cost(d) | Fair Value(c) | |||||||||
Hummel Station LLC, L+600, 1.00% LIBOR Floor, 10/27/2022(q) | 3 Month LIBOR | Energy: Oil & Gas | 9,860 | 9,457 | 9,515 | |||||||||
Infinity Sales Group, LLC, L+1050, 1.00% LIBOR Floor, 11/23/2020(p) | 3 Month LIBOR | Services: Business | 7,873 | 7,517 | 7,676 | |||||||||
InfoGroup Inc., L+500, 1.00% LIBOR Floor, 4/3/2023(q)(r)(s) | 3 Month LIBOR | Media: Advertising, Printing & Publishing | 15,918 | 15,904 | 15,759 | |||||||||
Instant Web, LLC, L+650, 0.00% LIBOR Floor, 12/15/2022(p)(r)(s) | 1 Month LIBOR | Media: Advertising, Printing & Publishing | 39,189 | 39,098 | 38,797 | |||||||||
Instant Web, LLC, 0.50% Unfunded, 12/15/2022 | None | Media: Advertising, Printing & Publishing | 2,704 | — | (27 | ) | ||||||||
Intermedia Holdings, Inc., L+600, 1.00% LIBOR Floor, 7/21/2025(q) | 1 Month LIBOR | High Tech Industries | 12,500 | 12,383 | 12,344 | |||||||||
International Seaways, Inc., L+600, 1.00% LIBOR Floor, 6/22/2022(i)(q) | 1 Month LIBOR | Transportation: Cargo | 9,499 | 9,356 | 9,404 | |||||||||
Isagenix International, LLC, L+575, 1.00% LIBOR Floor, 6/14/2025(q) | 3 Month LIBOR | Beverage, Food & Tobacco | 14,625 | 14,488 | 14,040 | |||||||||
Island Medical Management Holdings, LLC, L+650, 1.00% LIBOR Floor, 9/1/2022(r) | 1 Month LIBOR | Healthcare & Pharmaceuticals | 11,953 | 11,833 | 10,996 | |||||||||
ITC Service Group Acquisition LLC, L+950, 0.50% LIBOR Floor, 5/26/2021(l)(p) | 1 Month LIBOR | High Tech Industries | 11,250 | 11,119 | 11,025 | |||||||||
Jab Wireless, Inc., L+800, 0.00% LIBOR Floor, 5/2/2023(s) | 1 Month LIBOR | Telecommunications | 19,850 | 19,850 | 19,850 | |||||||||
Jackson Hewitt Tax Service Inc., L+625, 0.00% LIBOR Floor, 5/30/2023(s) | 1 Month LIBOR | Services: Consumer | 17,888 | 17,888 | 17,888 | |||||||||
JP Intermediate B, LLC, L+550, 1.00% LIBOR Floor, 11/20/2025(q) | 3 Month LIBOR | Beverage, Food & Tobacco | 15,000 | 14,852 | 14,438 | |||||||||
Key Surgical LLC, L+475, 1.00% LIBOR Floor, 6/1/2023 | 3 Month LIBOR | Healthcare & Pharmaceuticals | 997 | 979 | 979 | |||||||||
KLO Intermediate Holdings, LLC, L+775, 1.50% LIBOR Floor, 4/7/2022(r) | 1 Month LIBOR | Chemicals, Plastics & Rubber | 7,122 | 7,059 | 6,694 | |||||||||
KLO Intermediate Holdings, LLC, L+775, 1.50% LIBOR Floor, 4/7/2022(r) | 1 Month LIBOR | Chemicals, Plastics & Rubber | 4,123 | 4,087 | 3,876 | |||||||||
KNB Holdings Corp., L+550, 1.00% LIBOR Floor, 4/26/2024(q)(s) | 3 Month LIBOR | Consumer Goods: Durable | 13,513 | 13,294 | 13,175 | |||||||||
Labvantage Solutions Inc., L+750, 1.00% LIBOR Floor, 12/29/2020(r) | 1 Month LIBOR | High Tech Industries | 4,078 | 4,056 | 4,037 | |||||||||
Labvantage Solutions Ltd., E+750, 1.00% EURIBOR Floor, 12/29/2020(i) | 1 Month EURIBOR | High Tech Industries | € | 4,065 | 4,546 | 4,616 | ||||||||
Lannett Company, Inc., L+538, 1.00% LIBOR Floor, 11/25/2022(i)(q) | 1 Month LIBOR | Healthcare & Pharmaceuticals | 6,974 | 6,876 | 5,754 | |||||||||
LD Intermediate Holdings, Inc., L+588, 1.00% LIBOR Floor, 12/9/2022(q) | 3 Month LIBOR | High Tech Industries | 4,954 | 4,619 | 4,496 | |||||||||
Lift Brands, Inc., L+700, 1.00% LIBOR Floor, 4/16/2023(p)(r)(s) | 3 Month LIBOR | Services: Consumer | 45,513 | 44,641 | 44,375 | |||||||||
Lift Brands, Inc., 1.00% Unfunded, 4/16/2023 | None | Services: Consumer | 4,150 | — | (104 | ) | ||||||||
Logix Holding Company, LLC, L+575, 1.00% LIBOR Floor, 12/22/2024(q) | 1 Month LIBOR | Telecommunications | 4,988 | 4,942 | 4,950 | |||||||||
Longview Power, LLC, L+600, 1.00% LIBOR Floor, 4/13/2021(p)(r) | 3 Month LIBOR | Energy: Oil & Gas | 14,923 | 13,057 | 12,647 | |||||||||
LTCG Holdings Corp., L+500, 1.00% LIBOR Floor, 6/6/2020(q) | 1 Month LIBOR | Services: Business | 5,911 | 5,727 | 5,837 | |||||||||
Mimeo.com, Inc., L+700, 1.00% LIBOR Floor, 12/21/2023(p)(s) | 3 Month LIBOR | Services: Business | 43,000 | 43,000 | 43,000 | |||||||||
Mimeo.com, Inc., 0.25% Unfunded, 12/21/2020 | None | Services: Business | 10,000 | — | — | |||||||||
Mimeo.com, Inc., 1.00% Unfunded, 12/21/2023 | None | Services: Business | 3,000 | — | — | |||||||||
Ministry Brands, LLC, L+400, 1.00% LIBOR Floor, 12/2/2022(r) | 1 Month LIBOR | Services: Business | 11,992 | 11,935 | 11,992 | |||||||||
Ministry Brands, LLC, L+100, 1.00% LIBOR Floor Unfunded, 10/18/2020 | 3 Month LIBOR | Services: Business | 2,924 | — | — | |||||||||
Moss Holding Company, L+675, 1.00% LIBOR Floor, 4/17/2023(p)(r) | 3 Month LIBOR | Services: Business | 18,687 | 18,422 | 18,407 | |||||||||
Moss Holding Company, 0.50% Unfunded, 4/17/2023 | None | Services: Business | 2,232 | — | (33 | ) | ||||||||
Moxie Patriot LLC, L+575, 1.00% LIBOR Floor, 12/19/2020(q) | 3 Month LIBOR | Energy: Oil & Gas | 9,901 | 9,886 | 9,703 | |||||||||
MRO Holdings, Inc., L+475, 1.00% LIBOR Floor, 10/25/2023(q) | 3 Month LIBOR | Aerospace & Defense | 4,445 | 4,408 | 4,412 | |||||||||
MRP Generation Holdings, LLC, L+700, 1.00% LIBOR Floor, 10/18/2022(q) | 3 Month LIBOR | Energy: Oil & Gas | 2,214 | 2,180 | 2,137 | |||||||||
See accompanying notes to consolidated financial statements.
84
CĪON Investment Corporation
Consolidated Schedule of Investments
December 31, 2018
(in thousands)
Portfolio Company(a) | Index Rate(b) | Industry | Principal/ Par Amount/ Units(e) | Cost(d) | Fair Value(c) | ||||||||
Murray Energy Corp., L+725, 1.00% LIBOR Floor, 10/17/2022(q) | 3 Month LIBOR | Metals & Mining | 3,592 | 3,543 | 3,038 | ||||||||
NewsCycle Solutions, Inc., L+700, 1.00% LIBOR Floor, 12/29/2022(r)(s) | 1 Month LIBOR | Media: Advertising, Printing & Publishing | 20,884 | 20,698 | 20,466 | ||||||||
One Call Corp., L+525, 1.00% LIBOR Floor, 11/25/2022(q) | 1 Month LIBOR | Healthcare & Pharmaceuticals | 8,012 | 7,579 | 7,151 | ||||||||
Orbcomm Inc., 8.00%, 4/1/2024(p) | None | Telecommunications | 9,237 | 9,237 | 9,557 | ||||||||
OTG Management, LLC, L+700, 1.00% LIBOR Floor, 8/26/2021 | 3 Month LIBOR | Beverage, Food & Tobacco | 267 | 221 | 250 | ||||||||
OTG Management, LLC, 1.00% Unfunded, 4/10/2020 | None | Beverage, Food & Tobacco | 514 | — | (33 | ) | |||||||
P.F. Chang's China Bistro, Inc., L+500, 1.00% LIBOR Floor, 9/1/2022(q) | 3 Month LIBOR | Beverage, Food & Tobacco | 14,837 | 14,545 | 14,837 | ||||||||
PDI TA Holdings, Inc., L+450, 1.00% LIBOR Floor, 10/24/2024 | 3 Month LIBOR | High Tech Industries | 1,999 | 1,970 | 1,989 | ||||||||
PDI TA Holdings, Inc., L+450, 1.00% LIBOR Floor, 10/24/2024 | 3 Month LIBOR | High Tech Industries | 877 | 878 | 873 | ||||||||
PDI TA Holdings, Inc., 0.50% Unfunded, 10/24/2019 | None | High Tech Industries | 104 | — | (1 | ) | |||||||
Petroflow Energy Corp., L+800, 1.00% LIBOR Floor, 6/29/2019(p)(u)(v)(w) | 1 Month LIBOR | Energy: Oil & Gas | 3,068 | 2,734 | 2,363 | ||||||||
PFS Holding Corp., L+350, 1.00% LIBOR Floor, 1/31/2021 | 1 Month LIBOR | Retail | 3,129 | 2,486 | 1,721 | ||||||||
PH Beauty Holdings III. Inc., L+500, 0.00% LIBOR Floor, 9/28/2025(q) | 1 Month LIBOR | Consumer Goods: Non-Durable | 9,975 | 9,877 | 9,626 | ||||||||
Photonis Technologies SAS, L+750, 1.00% LIBOR Floor, 9/18/2019(i)(q) | 3 Month LIBOR | Aerospace & Defense | 6,397 | 6,060 | 5,965 | ||||||||
Pixelle Specialty Solutions LLC, L+600, 1.00% LIBOR Floor, 10/31/2024(q) | 1 Month LIBOR | Forest Products & Paper | 20,000 | 19,511 | 19,525 | ||||||||
Plano Molding Company, LLC, L+750, 1.00% LIBOR Floor, 5/12/2021(p) | 1 Month LIBOR | Consumer Goods: Non-Durable | 6,071 | 6,020 | 5,570 | ||||||||
Polymer Additives, Inc., L+600, 0.00% LIBOR Floor, 7/31/2025(p)(q) | 1 Month LIBOR | Chemicals, Plastics & Rubber | 20,000 | 19,619 | 18,500 | ||||||||
Rhino Energy LLC, L+1000, 1.00% LIBOR Floor, 12/27/2020(s) | 1 Month LIBOR | Metals & Mining | 7,262 | 6,909 | 7,189 | ||||||||
Sequoia Healthcare Management, LLC, L+850, 1.75% LIBOR Floor, 8/21/2023(p)(r) | 1 Month LIBOR | Healthcare & Pharmaceuticals | 9,851 | 9,758 | 9,753 | ||||||||
SG Acquisition, Inc., L+500, 1.00% LIBOR Floor, 3/29/2024(q) | 3 Month LIBOR | Banking, Finance, Insurance & Real Estate | 3,495 | 3,469 | 3,482 | ||||||||
Shift PPC LLC, L+450, 1.00% LIBOR Floor, 12/22/2021(r) | 6 Month LIBOR | High Tech Industries | 4,191 | 4,119 | 4,191 | ||||||||
SIMR, LLC, L+900, 2.00% LIBOR Floor, 9/7/2023(p)(v) | 1 Month LIBOR | Healthcare & Pharmaceuticals | 15,312 | 15,020 | 14,757 | ||||||||
Spinal USA, Inc. / Precision Medical Inc., L+950, 1.00% LIBOR Floor, 9/30/2020(p) | 3 Month LIBOR | Healthcare & Pharmaceuticals | 12,776 | 12,745 | 12,648 | ||||||||
Spinal USA, Inc. / Precision Medical Inc., L+950, 1.00% LIBOR Floor, 12/31/2021(p)(w) | 3 Month LIBOR | Healthcare & Pharmaceuticals | 481 | 480 | 476 | ||||||||
Sprint Industrial Holdings, LLC, L+575, 1.25% LIBOR Floor, 5/14/2019(p) | 3 Month LIBOR | Energy: Oil & Gas | 7,940 | 7,853 | 7,582 | ||||||||
STG-Fairway Acquisitions, Inc., L+525, 1.00% LIBOR Floor, 6/30/2022(q) | 3 Month LIBOR | Services: Business | 3,929 | 3,845 | 3,889 | ||||||||
STL Parent Corp., L+700, 0.00% LIBOR Floor, 12/6/2022(r)(s) | 1 Month LIBOR | Capital Equipment | 20,000 | 19,306 | 19,400 | ||||||||
Studio Movie Grill Holdings, LLC, L+725, 1.00% LIBOR Floor, 9/30/2020(f)(p) | 3 Month LIBOR | Hotel, Gaming & Leisure | 23,418 | 23,352 | 23,418 | ||||||||
Teladoc, Inc., 0.50% Unfunded, 7/14/2020 | None | High Tech Industries | 1,250 | (25 | ) | — | |||||||
Telestream Holdings Corp., L+645, 1.00% LIBOR Floor, 3/24/2022(l)(p) | 3 Month LIBOR | High Tech Industries | 8,460 | 8,322 | 8,207 | ||||||||
Tenere Inc., L+1000, 1.00% LIBOR Floor, 12/23/2021(p)(r) | 3 Month LIBOR | Capital Equipment | 30,080 | 29,630 | 29,328 | ||||||||
Tensar Corp., L+475, 1.00% LIBOR Floor, 7/9/2021(q) | 3 Month LIBOR | Chemicals, Plastics & Rubber | 12,980 | 12,426 | 12,753 | ||||||||
The Pasha Group, L+750, 1.00% LIBOR Floor, 1/26/2023(r) | 1 Month LIBOR | Transportation: Cargo | 7,018 | 6,836 | 7,061 | ||||||||
The Pay-O-Matic Corp., L+900, 0.00% LIBOR Floor, 4/5/2021(h)(p) | 3 Month LIBOR | Services: Consumer | 22,425 | 22,241 | 22,201 | ||||||||
TherapeuticsMD, Inc., L+775, 1.50% LIBOR Floor, 5/1/2023(i)(s) | 1 Month LIBOR | Healthcare & Pharmaceuticals | 15,000 | 14,865 | 14,850 | ||||||||
See accompanying notes to consolidated financial statements.
85
CĪON Investment Corporation
Consolidated Schedule of Investments
December 31, 2018
(in thousands)
Portfolio Company(a) | Index Rate(b) | Industry | Principal/ Par Amount/ Units(e) | Cost(d) | Fair Value(c) | |||||||||
TherapeuticsMD, Inc., 0.00% Unfunded, 12/31/2019(i)(t) | None | Healthcare & Pharmaceuticals | 10,000 | (88 | ) | (100 | ) | |||||||
TherapeuticsMD, Inc., 0.00% Unfunded, 5/31/2019(i)(t) | None | Healthcare & Pharmaceuticals | 15,000 | (132 | ) | (150 | ) | |||||||
Therapure Biopharma Inc., L+875, 0.50% LIBOR Floor, 12/1/2021(i) | 1 Month LIBOR | Healthcare & Pharmaceuticals | 15,000 | 14,952 | 14,625 | |||||||||
Vertex Aerospace Services Corp., L+475, 0.00% LIBOR Floor, 6/29/2025(q) | 1 Month LIBOR | Aerospace & Defense | 9,913 | 9,864 | 9,838 | |||||||||
Woodstream Corp., L+625, 1.00% LIBOR Floor, 5/29/2022(s) | 3 Month LIBOR | Consumer Goods: Non-Durable | 14,542 | 14,542 | 14,542 | |||||||||
Woodstream Corp., 0.50% Unfunded, 5/29/2021 | None | Consumer Goods: Non-Durable | 559 | — | — | |||||||||
Total Senior Secured First Lien Debt | 1,492,034 | 1,462,989 | ||||||||||||
Senior Secured Second Lien Debt - 33.0% | ||||||||||||||
1A Smart Start LLC, L+825, 1.00% LIBOR Floor, 8/21/2022(p)(r) | 1 Month LIBOR | High Tech Industries | 17,800 | 17,494 | 17,266 | |||||||||
ABG Intermediate Holdings 2 LLC, L+775, 1.00% LIBOR Floor, 9/29/2025(p) | 1 Month LIBOR | Retail | 9,897 | 9,846 | 9,749 | |||||||||
Access CIG, LLC, L+775, 0.00% LIBOR Floor, 2/27/2026(r) | 3 Month LIBOR | Services: Business | 17,250 | 17,116 | 17,099 | |||||||||
ALM Media, LLC, L+800, 1.00% LIBOR Floor, 7/30/2021(p)(r) | 3 Month LIBOR | Media: Advertising, Printing & Publishing | 10,344 | 10,279 | 8,353 | |||||||||
American Residential Services LLC, L+800, 1.00% LIBOR Floor, 12/31/2022(p) | 1 Month LIBOR | Construction & Building | 5,180 | 5,150 | 5,076 | |||||||||
Argon Medical Devices Holdings, Inc., L+800, 0.00% LIBOR Floor, 1/23/2026(p) | 1 Month LIBOR | Healthcare & Pharmaceuticals | 14,400 | 14,329 | 14,256 | |||||||||
Carestream Health, Inc., L+950, 1.00% LIBOR Floor, 6/7/2021(r) | 1 Month LIBOR | Healthcare & Pharmaceuticals | 10,662 | 10,662 | 10,502 | |||||||||
Drew Marine Group, Inc., L+700, 1.00% LIBOR Floor, 5/19/2021(i)(p) | 1 Month LIBOR | Chemicals, Plastics & Rubber | 9,500 | 9,474 | 9,512 | |||||||||
EagleTree-Carbide Acquisition Corp., L+850, 1.00% LIBOR Floor, 8/28/2025(r) | 3 Month LIBOR | Consumer Goods: Durable | 20,000 | 19,734 | 20,000 | |||||||||
Emerald 3 Ltd., L+700, 1.00% LIBOR Floor, 5/16/2022(i)(p) | 3 Month LIBOR | Environmental Industries | 3,000 | 2,985 | 2,955 | |||||||||
Evergreen Skills Lux S.À.R.L., L+825, 1.00% LIBOR Floor, 4/28/2022(i)(r) | 1 Month LIBOR | High Tech Industries | 9,999 | 7,709 | 5,550 | |||||||||
Flexera Software LLC, L+725, 1.00% LIBOR Floor, 2/26/2026(r) | 1 Month LIBOR | High Tech Industries | 3,462 | 3,446 | 3,423 | |||||||||
Global Tel*Link Corp., L+825, 0.00% LIBOR Floor, 11/29/2026(r) | 3 Month LIBOR | Telecommunications | 11,500 | 11,300 | 11,270 | |||||||||
GOBP Holdings, Inc., L+725, 0.00% LIBOR Floor, 10/22/2026(r) | 3 Month LIBOR | Retail | 5,000 | 4,950 | 4,969 | |||||||||
LSCS Holdings, Inc., L+825, 0.00% LIBOR Floor, 3/16/2026(p) | 1 Month LIBOR | Services: Business | 11,891 | 11,640 | 11,831 | |||||||||
Mayfield Agency Borrower Inc., L+850, 0.00% LIBOR Floor, 3/2/2026(p)(r)(s) | 1 Month LIBOR | Banking, Finance, Insurance & Real Estate | 20,000 | 19,710 | 19,812 | |||||||||
Medical Solutions Holdings, Inc., L+825, 1.00% LIBOR Floor, 6/16/2025(p) | 1 Month LIBOR | Healthcare & Pharmaceuticals | 10,000 | 9,867 | 9,925 | |||||||||
MedPlast Holdings, Inc., L+775, 0.00% LIBOR Floor, 7/2/2026(s) | 3 Month LIBOR | Healthcare & Pharmaceuticals | 6,750 | 6,687 | 6,581 | |||||||||
Ministry Brands, LLC, L+925, 1.00% LIBOR Floor, 6/2/2023(p)(r) | 1 Month LIBOR | Services: Business | 7,000 | 6,918 | 7,000 | |||||||||
Niacet Corp., E+875, 1.00% EURIBOR Floor, 8/1/2024(i) | 1 Month EURIBOR | Chemicals, Plastics & Rubber | € | 7,489 | 7,955 | 8,503 | ||||||||
Patterson Medical Supply, Inc., L+850, 1.00% LIBOR Floor, 8/28/2023(p) | 3 Month LIBOR | Healthcare & Pharmaceuticals | 13,500 | 13,404 | 12,352 | |||||||||
PDI TA Holdings, Inc., L+850, 1.00% LIBOR Floor, 10/24/2025 | 3 Month LIBOR | High Tech Industries | 2,267 | 2,224 | 2,245 | |||||||||
PDI TA Holdings, Inc., 0.50% Unfunded, 10/24/2019 | None | High Tech Industries | 133 | — | (1 | ) | ||||||||
PetroChoice Holdings, Inc., L+875, 1.00% LIBOR Floor, 8/21/2023(p) | 3 Month LIBOR | Chemicals, Plastics & Rubber | 15,000 | 14,742 | 14,737 | |||||||||
PFS Holding Corp., L+725, 1.00% LIBOR Floor, 1/31/2022(q)(u) | 1 Month LIBOR | Retail | 4,998 | 4,716 | 900 | |||||||||
Premiere Global Services, Inc., L+950, 1.00% LIBOR Floor, 6/6/2022(p) | 3 Month LIBOR | Telecommunications | 3,000 | 2,917 | 2,100 | |||||||||
See accompanying notes to consolidated financial statements.
86
CĪON Investment Corporation
Consolidated Schedule of Investments
December 31, 2018
(in thousands)
Portfolio Company(a) | Index Rate(b) | Industry | Principal/ Par Amount/ Units(e) | Cost(d) | Fair Value(c) | ||||||||
PT Intermediate Holdings III, LLC, L+800, 1.00% LIBOR Floor, 12/8/2025(r) | 3 Month LIBOR | Services: Business | 9,375 | 9,295 | 9,281 | ||||||||
Securus Technologies Holdings, Inc., L+825, 1.00% LIBOR Floor, 11/1/2025(r) | 1 Month LIBOR | Telecommunications | 2,942 | 2,914 | 2,847 | ||||||||
SESAC Holdco II LLC, L+725, 1.00% LIBOR Floor, 2/23/2025(r) | 1 Month LIBOR | Media: Broadcasting & Subscription | 250 | 248 | 241 | ||||||||
STG-Fairway Acquisitions, Inc., L+925, 1.00% LIBOR Floor, 6/30/2023(p)(r) | 3 Month LIBOR | Services: Business | 10,000 | 9,898 | 9,600 | ||||||||
TexOak Petro Holdings LLC, 8.00%, 12/29/2019(u)(v)(w) | None | Energy: Oil & Gas | 7,804 | 2,592 | — | ||||||||
TMK Hawk Parent, Corp., L+800, 1.00% LIBOR Floor, 8/28/2025(p) | 2 Month LIBOR | Services: Business | 13,393 | 13,092 | 12,991 | ||||||||
TouchTunes Interactive Networks, Inc, L+825, 1.00% LIBOR Floor, 5/29/2022(r) | 1 Month LIBOR | Hotel, Gaming & Leisure | 6,000 | 5,958 | 6,000 | ||||||||
U.S. Renal Care, Inc., L+800, 1.00% LIBOR Floor, 12/29/2023(p) | 3 Month LIBOR | Healthcare & Pharmaceuticals | 5,000 | 4,931 | 4,787 | ||||||||
Wand Intermediate I LP, L+725, 1.00% LIBOR Floor, 9/19/2022(p) | 2 Month LIBOR | Automotive | 15,050 | 14,971 | 15,050 | ||||||||
Winebow Holdings, Inc., L+750, 1.00% LIBOR Floor, 1/2/2022(p) | 1 Month LIBOR | Beverage, Food & Tobacco | 12,823 | 12,636 | 7,053 | ||||||||
Zest Acquisition Corp., L+750, 1.00% LIBOR Floor, 3/13/2026(r) | 1 Month LIBOR | Healthcare & Pharmaceuticals | 15,000 | 14,863 | 14,550 | ||||||||
Zywave Inc., L+900, 1.00% LIBOR Floor, 11/17/2023(p) | 3 Month LIBOR | High Tech Industries | 5,000 | 4,943 | 5,000 | ||||||||
Total Senior Secured Second Lien Debt | 341,595 | 323,365 | |||||||||||
Collateralized Securities and Structured Products - Debt - 1.6% | |||||||||||||
Deutsche Bank AG Frankfurt CRAFT 2015-2 Class Credit Linked Note, L+925, 1/16/2022(i) | 3 Month LIBOR | Diversified Financials | 15,193 | 15,193 | 15,193 | ||||||||
Total Collateralized Securities and Structured Products - Debt | 15,193 | 15,193 | |||||||||||
Collateralized Securities and Structured Products - Equity - 1.5% | |||||||||||||
APIDOS CLO XVI Subordinated Notes, 0.02% Estimated Yield, 1/19/2025(i) | (g) | Diversified Financials | 9,000 | 3,799 | 2,488 | ||||||||
CENT CLO 19 Ltd. Subordinated Notes, 16.86% Estimated Yield, 10/29/2025(i) | (g) | Diversified Financials | 2,000 | 1,163 | 1,026 | ||||||||
Galaxy XV CLO Ltd. Class A Subordinated Notes, 9.02% Estimated Yield, 4/15/2025(i) | (g) | Diversified Financials | 4,000 | 2,334 | 1,889 | ||||||||
Ivy Hill Middle Market Credit Fund VIII, Ltd. Subordinated Loan, 11.84% Estimated Yield, 2/2/2026(f)(i) | (g) | Diversified Financials | 10,000 | 9,498 | 9,424 | ||||||||
Total Collateralized Securities and Structured Products - Equity | 16,794 | 14,827 | |||||||||||
Equity - 3.7% | |||||||||||||
Ascent Resources - Marcellus, LLC, Common Shares(t) | Energy: Oil & Gas | 511,255 Units | 1,642 | 1,457 | |||||||||
Ascent Resources - Marcellus, LLC, Warrants(t) | Energy: Oil & Gas | 132,367 Units | 13 | 4 | |||||||||
Avaya Holdings Corp., Common Stock(j)(q)(t) | Telecommunications | 321,260 Units | 5,285 | 4,678 | |||||||||
Charming Charlie LLC, Common Stock(t)(v) | Retail | 30,046,243 Units | 1,302 | — | |||||||||
CHC Medical Partners, Inc., Series C Preferred Stock, 12% Dividend | Healthcare & Pharmaceuticals | 1,818,182 Units | 3,000 | 3,236 | |||||||||
Conisus Holdings, Inc., Series B Preferred Stock, 12% Dividend(u)(v) | Healthcare & Pharmaceuticals | 12,677,833 Units | 9,200 | 10,903 | |||||||||
Conisus Holdings, Inc., Common Stock(t)(v) | Healthcare & Pharmaceuticals | 4,914,556 Units | 200 | 197 | |||||||||
F+W Media, Inc., Common Stock(t)(v) | Media: Diversified & Production | 31,211 Units | — | — | |||||||||
Mooregate ITC Acquisition, LLC, Class A Units(t) | High Tech Industries | 500 Units | 563 | 90 | |||||||||
Mount Logan Capital Inc., Common Stock(i)(j)(v) | Banking, Finance, Insurance & Real Estate | 7,842,273 Units | 3,335 | 2,645 | |||||||||
NS NWN Acquisition, LLC, Voting Units(t) | High Tech Industries | 404 Units | 393 | 730 | |||||||||
NSG Co-Invest (Bermuda) LP, Partnership Interests(i)(t) | Consumer Goods: Durable | 1,575 Units | 1,000 | 675 | |||||||||
Rhino Energy LLC, Warrants(t) | Metals & Mining | 170,972 Units | 280 | 106 | |||||||||
See accompanying notes to consolidated financial statements.
87
CĪON Investment Corporation
Consolidated Schedule of Investments
December 31, 2018
(in thousands)
Portfolio Company(a) | Industry | Principal/ Par Amount/ Units(e) | Cost(d) | Fair Value(c) | ||||||||
SIMR Parent, LLC, Class B Common Units(t)(v) | Healthcare & Pharmaceuticals | 7,500,000 Units | 7,500 | 7,382 | ||||||||
Spinal USA, Inc. / Precision Medical Inc., Warrants(p)(t) | Healthcare & Pharmaceuticals | 9,317,237 Units | 4,736 | 4,100 | ||||||||
Tenere Inc., Warrant(t) | Capital Equipment | N/A | 161 | 196 | ||||||||
TexOak Petro Holdings LLC, Membership Interests(t)(v) | Energy: Oil & Gas | 60,000 Units | — | — | ||||||||
Total Equity | 38,610 | 36,399 | ||||||||||
Short Term Investments - 1.3%(n) | ||||||||||||
First American Treasury Obligations Fund, Class Z Shares, 2.36%(o) | 12,537 | 12,537 | ||||||||||
Total Short Term Investments | 12,537 | 12,537 | ||||||||||
TOTAL INVESTMENTS - 190.5% | $ | 1,916,763 | 1,865,310 | |||||||||
LIABILITIES IN EXCESS OF OTHER ASSETS - (90.5%) | (886,039 | ) | ||||||||||
NET ASSETS - 100% | $ | 979,271 | ||||||||||
a. | All of the Company’s investments are issued by eligible U.S. portfolio companies, as defined in the 1940 Act, except for investments specifically identified as non-qualifying per note i. below. Unless specifically identified in note w. below, investments do not contain a PIK interest provision. |
b. | The 1, 2, 3 and 6 month LIBOR rates were 2.52%, 2.62%, 2.80% and 2.87%, respectively, as of December 31, 2018. The actual LIBOR rate for each loan listed may not be the applicable LIBOR rate as of December 31, 2018, as the loan may have been priced or repriced based on a LIBOR rate prior to or subsequent to December 31, 2018. The 1 month EURIBOR rate was (0.41%) as of December 31, 2018. |
c. | Fair value determined in good faith by the Company’s board of directors (see Note 10) using significant unobservable inputs unless otherwise noted. |
d. | Represents amortized cost for debt securities and cost for equity investments. |
e. | Denominated in U.S. dollars unless otherwise noted. |
f. | As of December 31, 2018, the Company was committed, upon the satisfaction of certain conditions, to fund additional amounts in connection with this investment. See Note 12 for additional information. |
g. | The CLO subordinated notes are considered equity positions in the CLO vehicles and are not rated. Equity investments are entitled to recurring distributions, which are generally equal to the remaining cash flow of the payments made by the underlying vehicle's securities less contractual payments to debt holders and expenses. The estimated yield indicated is based upon a current projection of the amount and timing of these recurring distributions and the estimated amount of repayment of principal upon termination. Such projections are periodically reviewed and adjusted, and the estimated yield may not ultimately be realized. |
h. | As a result of an arrangement between the Company and the other lenders in the syndication, the Company is entitled to less interest than the stated interest rate of this loan, which is reflected in this schedule, in exchange for a higher payment priority. |
i. | The investment or a portion thereof is not a qualifying asset under the 1940 Act. A business development company may not acquire any asset other than qualifying assets, unless, at the time the acquisition is made, qualifying assets represent at least 70% of the company’s total assets as defined under Section 55 of the 1940 Act. As of December 31, 2018, 90.7% of the Company’s total assets represented qualifying assets. |
j. | Fair value determined using level 1 inputs. |
k. | Position or a portion thereof unsettled as of December 31, 2018. |
l. | In addition to the interest earned based on the stated interest rate of this loan, which is the amount reflected in this schedule, the Company may be entitled to receive additional amounts as a result of an arrangement between the Company and other lenders in the syndication in exchange for a lower payment priority. |
m. | In addition to the interest earned based on the stated interest rate of this loan, which is the amount reflected in this schedule, the Company may be entitled to receive additional residual amounts. |
See accompanying notes to consolidated financial statements.
88
CĪON Investment Corporation
Consolidated Schedule of Investments
December 31, 2018
(in thousands)
n. | Short term investments represent an investment in a fund that invests in highly liquid investments with average original maturity dates of three months or less. |
o. | 7-day effective yield as of December 31, 2018. |
p. | Investment or a portion thereof held within the Company’s wholly-owned consolidated subsidiary, 34th Street, and was pledged as collateral supporting the amounts outstanding under the credit facility with JPM as of December 31, 2018 (see Note 9). |
q. | Investment or a portion thereof held within the Company’s wholly-owned consolidated subsidiary, Flatiron Funding II, and was pledged as collateral supporting the amounts outstanding under the credit facility with Citibank as of December 31, 2018 (see Note 9). |
r. | Investment or a portion thereof held within the Company’s wholly-owned consolidated subsidiary, Murray Hill Funding II, and was pledged as collateral supporting the amounts outstanding under the repurchase agreement with UBS as of December 31, 2018 (see Note 9). |
s. | Investment or a portion thereof held within the Company’s wholly-owned consolidated subsidiary, 33rd Street, and was pledged as collateral supporting the amounts outstanding under the credit facility with MS as of December 31, 2018 (see Note 9). |
t. | Non-income producing security. |
u. | Investment was on non-accrual status as of December 31, 2018. |
See accompanying notes to consolidated financial statements.
89
CĪON Investment Corporation
Consolidated Schedule of Investments
December 31, 2018
(in thousands)
v. | Investment determined to be an affiliated investment as defined in the 1940 Act as the Company owns between 5% and 25% of the portfolio company’s outstanding voting securities but does not control the portfolio company. Fair value as of December 31, 2017 and 2018, along with transactions during the year ended December 31, 2018 in these affiliated investments are as follows: |
Year Ended December 31, 2018 | Year Ended December 31, 2018 | |||||||||||||||||||||||||||
Non-Controlled, Affiliated Investments | Fair Value at December 31, 2017 | Gross Additions (Cost)(1) | Gross Reductions (Cost)(2) | Net Unrealized (Loss) Gain | Fair Value at December 31, 2018 | Net Realized Gain (Loss) | Interest Income(3) | |||||||||||||||||||||
Charming Charlie, LLC | ||||||||||||||||||||||||||||
First Lien Term Loan B1 | $ | — | $ | 2,619 | $ | — | $ | (1,598 | ) | $ | 1,021 | $ | — | $ | 99 | |||||||||||||
First Lien Term Loan B2 | — | 1,912 | — | (663 | ) | 1,249 | — | 191 | ||||||||||||||||||||
Vendor Payment Financing Facility | — | 157 | — | — | 157 | — | 44 | |||||||||||||||||||||
Common Stock | — | 1,302 | — | (1,302 | ) | — | — | — | ||||||||||||||||||||
Conisus Holdings, Inc. | ||||||||||||||||||||||||||||
Series B Preferred Stock | 9,300 | — | — | 1,603 | 10,903 | — | — | |||||||||||||||||||||
Common Stock | 175 | — | — | 22 | 197 | — | — | |||||||||||||||||||||
F+W Media, Inc. | ||||||||||||||||||||||||||||
First Lien Term Loan B-1 | 1,169 | 103 | (100 | ) | (35 | ) | 1,137 | — | 95 | |||||||||||||||||||
First Lien Term Loan B-2 | 1,498 | 16 | — | (1,353 | ) | 161 | — | 39 | ||||||||||||||||||||
Common Stock | — | — | — | — | — | — | — | |||||||||||||||||||||
Mount Logan Capital Inc. | ||||||||||||||||||||||||||||
Common Stock | — | 3,335 | — | (690 | ) | 2,645 | — | — | ||||||||||||||||||||
SIMR, LLC | ||||||||||||||||||||||||||||
First Lien Term Loan | — | 15,020 | — | (263 | ) | 14,757 | — | 580 | ||||||||||||||||||||
SIMR Parent, LLC | ||||||||||||||||||||||||||||
Class B Common Units | — | 7,500 | — | (118 | ) | 7,382 | — | |||||||||||||||||||||
Petroflow Energy Corp. | ||||||||||||||||||||||||||||
First Lien Term Loan | 3,391 | 63 | (902 | ) | (189 | ) | 2,363 | — | 199 | |||||||||||||||||||
TexOak Petro Holdings LLC | ||||||||||||||||||||||||||||
Second Lien Term Loan | — | — | — | — | — | — | — | |||||||||||||||||||||
Membership Interests | — | — | — | — | — | — | — | |||||||||||||||||||||
Totals | $ | 15,533 | $ | 32,027 | $ | (1,002 | ) | $ | (4,586 | ) | $ | 41,972 | $ | — | $ | 1,247 | ||||||||||||
(1) | Gross additions include increases in the cost basis of investments resulting from new portfolio investments, PIK interest, the amortization of unearned income, the exchange of one or more existing securities for one or more new securities and the movement of an existing portfolio company into this category from a different category. |
(2) | Gross reductions include decreases in the cost basis of investments resulting from principal collections related to investment repayments or sales, the exchange of one or more existing securities for one or more new securities and the movement of an existing portfolio company out of this category into a different category. |
(3) | Includes PIK interest income. |
See accompanying notes to consolidated financial statements.
90
CĪON Investment Corporation
Consolidated Schedule of Investments
December 31, 2018
(in thousands)
w. | For the year ended December 31, 2018, the following investments contain a PIK interest provision whereby the issuer has either the option or the obligation to make interest payments with the issuance of additional securities: |
Interest Rate | Interest Amount | |||||||||||||||||||
Portfolio Company | Investment Type | Cash | PIK | All-in-Rate | Cash | PIK | Total | |||||||||||||
American Clinical Solutions LLC(u) | Senior Secured First Lien Debt | 10.50% | 2.00% | 12.50% | $ | 326 | $ | 168 | $ | 494 | ||||||||||
Charming Charlie LLC(u) | Senior Secured First Lien Debt | 6.00% | 5.00% | 11.00% | $ | 98 | $ | — | $ | 98 | ||||||||||
Charming Charlie LLC(u) | Senior Secured First Lien Debt | 2.00% | 9.00% | 11.00% | $ | 54 | $ | — | $ | 54 | ||||||||||
CHC Solutions Inc. | Senior Secured First Lien Debt | 8.00% | 4.00% | 12.00% | $ | 258 | $ | 129 | $ | 387 | ||||||||||
Dayton Superior Corp. | Senior Secured First Lien Debt | 9.00% | 6.00% | 15.00% | $ | 578 | $ | 194 | $ | 772 | ||||||||||
F+W Media, Inc.(u) | Senior Secured First Lien Debt | — | 11.50% | 11.50% | $ | — | $ | 24 | $ | 24 | ||||||||||
F+W Media, Inc. | Senior Secured First Lien Debt | — | 8.00% | 8.00% | $ | — | $ | 95 | $ | 95 | ||||||||||
Lonestar Prospects, Ltd.(x) | Senior Secured First Lien Debt | 9.50% | 1.00% | 10.50% | $ | 190 | $ | 27 | $ | 217 | ||||||||||
Petroflow Energy Corp.(u) | Senior Secured First Lien Debt | 3.00% | 6.00% | 9.00% | $ | 70 | $ | — | $ | 70 | ||||||||||
Rimini Street, Inc.(x) | Senior Secured First Lien Debt | 12.00% | 3.00% | 15.00% | $ | 1,228 | $ | 278 | $ | 1,506 | ||||||||||
Sequoia Healthcare Management, LLC(x) | Senior Secured First Lien Debt | 12.00% | 4.00% | 16.00% | $ | 370 | $ | 171 | $ | 541 | ||||||||||
Spinal USA, Inc. / Precision Medical Inc. | Senior Secured First Lien Debt | — | 10.50% | 10.50% | $ | — | $ | 40 | $ | 40 | ||||||||||
TexOak Petro Holdings LLC(u) | Senior Secured Second Lien Debt | — | 8.00% | 8.00% | $ | — | $ | — | $ | — | ||||||||||
Visual Edge Technology, Inc.(x) | Subordinated Note | — | 12.50% | 12.50% | $ | — | $ | 224 | $ | 224 | ||||||||||
x. | Prior to December 31, 2018, the Company exited this investment. |
See accompanying notes to consolidated financial statements.
91
CĪON Investment Corporation
Notes to Consolidated Financial Statements
December 31, 2019
(in thousands, except share and per share amounts)
Note 1. Organization and Principal Business
CĪON Investment Corporation, or the Company, was incorporated under the general corporation laws of the State of Maryland on August 9, 2011. On December 17, 2012, the Company successfully raised gross proceeds from unaffiliated outside investors of at least $2,500, or the minimum offering requirement, and commenced operations. The Company is an externally managed, non-diversified closed-end management investment company that has elected to be regulated as a business development company, or BDC, under the 1940 Act. The Company elected to be treated for federal income tax purposes as a regulated investment company, or RIC, as defined under Subchapter M of the Internal Revenue Code of 1986, as amended, or the Code.
The Company’s investment objective is to generate current income and, to a lesser extent, capital appreciation for investors. The Company’s portfolio is comprised primarily of investments in senior secured debt, including first lien loans, second lien loans and unitranche loans, and, to a lesser extent, collateralized securities, structured products and other similar securities, unsecured debt and equity, of private and thinly-traded U.S. middle-market companies.
The Company is managed by CION Investment Management, LLC, or CIM, a registered investment adviser and an affiliate of the Company. Pursuant to an investment advisory agreement with the Company, CIM oversees the management of the Company’s activities and is responsible for making investment decisions for the Company’s investment portfolio. On November 5, 2019, the board of directors of the Company, including a majority of the board of directors who are not interested persons, approved the renewal of the investment advisory agreement with CIM for a period of twelve months commencing December 17, 2019. The Company and CIM previously engaged Apollo Investment Management, L.P., or AIM, a subsidiary of Apollo Global Management, Inc., or, together with its subsidiaries, Apollo, a leading global alternative investment manager, to act as the Company’s investment sub-adviser.
On July 11, 2017, the members of CIM entered into a third amended and restated limited liability company agreement of CIM, or the Third Amended CIM LLC Agreement, for the purpose of creating a joint venture between AIM and CION Investment Group, LLC, or CIG, an affiliate of the Company. Under the Third Amended CIM LLC Agreement, AIM became a member of CIM and was issued a newly-created class of membership interests in CIM pursuant to which AIM, among other things, shares in the profits, losses, distributions and expenses of CIM with the other members in accordance with the terms of the Third Amended CIM LLC Agreement, which results in CIG and AIM each owning a 50% economic interest in CIM.
On July 10, 2017, the Company’s independent directors unanimously approved the termination of the investment sub-advisory agreement with AIM, effective as of July 11, 2017. Although the investment sub-advisory agreement and AIM's engagement as the Company’s investment sub-adviser were terminated, AIM's investment professionals continue to perform certain services for CIM and the Company, including, without limitation, identifying investment opportunities for approval by CIM's investment committee. AIM is not paid a separate fee in exchange for such services, but is entitled to receive distributions as a member of CIM as described above.
On December 4, 2017, the members of CIM entered into a fourth amended and restated limited liability company agreement of CIM, or the Fourth Amended CIM LLC Agreement. Under the Fourth Amended CIM LLC Agreement, AIM's investment professionals perform certain services for CIM, which include, among other services, (i) assistance with identifying and providing information about potential investment opportunities for approval by CIM’s investment committee; and (ii) providing (a) trade and settlement support; (b) portfolio and cash reconciliation; (c) market pipeline information regarding syndicated deals, in each case, as reasonably requested by CIM; and (d) monthly valuation reports and support for all broker-quoted investments. All of the Company's investment decisions are the sole responsibility of, and are made at the sole discretion of, CIM's investment committee, which consists entirely of CIG senior personnel.
Note 2. Summary of Significant Accounting Policies
Basis of Presentation and Consolidation
The accompanying consolidated financial statements of the Company have been prepared in accordance with U.S. generally accepted accounting principles, or GAAP, and include the accounts of the Company and its wholly-owned subsidiaries. The Company is considered an investment company as defined in Accounting Standards Codification Topic 946, Financial Services – Investment Companies, or ASC 946. Accordingly, the required disclosures as outlined in ASC 946 are included in the Company’s consolidated financial statements. In the opinion of management, all adjustments (consisting of normal recurring adjustments) considered necessary for a fair presentation have been included. All intercompany balances and transactions have been eliminated in consolidation. The Company does not consolidate its interest in CION SOF Funding, LLC, or CION SOF. See Note 7 for a description of the Company’s investment in CION SOF.
The Company evaluates subsequent events through the date that the consolidated financial statements are issued.
92
CĪON Investment Corporation
Notes to Consolidated Financial Statements
December 31, 2019
(in thousands, except share and per share amounts)
Reclassification
Unamortized original issue discounts, or OID, and market discounts/premiums received upon the early repayment of debt investments have been reclassified from net realized gains on investments to interest income. As a result, prior year amounts have been reclassified to conform to the current presentation.
Recently Announced Accounting Standards
In August 2018, the Financial Accounting Standards Board, or the FASB, issued ASU 2018-13, Changes to the Disclosure Requirements for Fair Value Measurement, or ASU 2018-13, which modifies the disclosure requirements for fair value measurements in Topic 820 by removing, modifying, or adding certain disclosures. ASU 2018-13 is effective for all entities for fiscal years, and interim periods within those fiscal years, beginning after December 15, 2019. The Company is in the process of evaluating the impact that this guidance will have on its consolidated financial statements.
Cash and Cash Equivalents
Cash and cash equivalents include cash in banks and highly liquid investments with original maturity dates of three months or less. The Company’s cash and cash equivalents are held principally at one financial institution and at times may exceed insured limits. The Company periodically evaluates the creditworthiness of this institution and has not experienced any losses on such deposits.
Foreign Currency Translations
The accounting records of the Company are maintained in U.S. dollars. All assets and liabilities denominated in foreign currencies are translated into U.S. dollars based on the foreign exchange rate on the date of valuation. The Company does not isolate that portion of the results of operations resulting from changes in foreign exchange rates on investments from the fluctuations arising from changes in market prices of securities held. Changes in the relationship of foreign currencies to the U.S. dollar can significantly affect the value of these investments and therefore the earnings of the Company.
Short Term Investments
Short term investments include an investment in a U.S. Treasury obligations fund, which seeks to provide current income and daily liquidity by purchasing U.S. Treasury securities and repurchase agreements that are collateralized by such securities. The Company had $29,527 and $12,537 of such investments at December 31, 2019 and 2018, respectively, which are included in investments, at fair value on the accompanying consolidated balance sheets and on the consolidated schedules of investments.
Offering Costs
Offering costs included, among other things, legal fees and other costs pertaining to the preparation of the Company’s registration statements in connection with the continuous public offerings of the Company’s shares. Certain initial offering costs that were funded by CIG on behalf of the Company were submitted by CIG for reimbursement upon meeting the minimum offering requirement on December 17, 2012. These costs were capitalized and amortized over a twelve month period as an adjustment to capital in excess of par value. All other offering costs were expensed as incurred by the Company. The Company's follow-on continuous public offering ended on January 25, 2019.
Income Taxes
The Company elected to be treated for federal income tax purposes as a RIC under Subchapter M of the Code. To qualify and maintain qualification as a RIC, the Company must, among other things, meet certain source of income and asset diversification requirements and distribute to shareholders, for each taxable year, at least 90% of the Company’s “investment company taxable income”, which is generally equal to the sum of the Company’s net ordinary income plus the excess, if any, of realized net short-term capital gains over realized net long-term capital losses. If the Company continues to qualify as a RIC and continues to satisfy the annual distribution requirement, the Company will not be subject to corporate level federal income taxes on any income that the Company distributes to its shareholders. The Company intends to make distributions in an amount sufficient to maintain RIC status each year and to avoid any federal income taxes on income. The Company will also be subject to nondeductible federal excise taxes if the Company does not distribute at least 98.0% of net ordinary income, 98.2% of capital gains, if any, and any recognized and undistributed income from prior years for which it paid no federal income taxes.
Two of the Company’s wholly-owned consolidated subsidiaries, View ITC, LLC and View Rise, LLC, or collectively the Taxable Subsidiaries, have elected to be treated as taxable entities for U.S. federal income tax purposes. As a result, the Taxable Subsidiaries are not consolidated with the Company for income tax purposes and may generate income tax expense or benefit, and the related tax assets and liabilities, as a result of its ownership of certain portfolio investments. The income tax expense or benefit, if any, and the related tax assets and liabilities, where material, are reflected in the Company’s consolidated financial statements. There were no deferred tax assets or liabilities as of December 31, 2019.
93
CĪON Investment Corporation
Notes to Consolidated Financial Statements
December 31, 2019
(in thousands, except share and per share amounts)
Book/tax differences relating to permanent differences are reclassified among the Company’s capital accounts, as appropriate. Additionally, the tax character of distributions is determined in accordance with income tax regulations that may differ from GAAP (see Note 15).
Uncertainty in Income Taxes
The Company evaluates its tax positions to determine if the tax positions taken meet the minimum recognition threshold for the purposes of measuring and recognizing tax liabilities in the consolidated financial statements. Recognition of a tax benefit or liability with respect to an uncertain tax position is required only when the position is “more likely than not” to be sustained assuming examination by the taxing authorities. The Company recognizes interest and penalties, if any, related to unrecognized tax benefits as income tax expense in the consolidated statements of operations. The Company did not have any uncertain tax positions during the periods presented herein.
The Company is subject to examination by U.S. federal, New York State, New York City and Maryland income tax jurisdictions for 2016, 2017 and 2018.
Use of Estimates
The preparation of the consolidated financial statements in conformity with GAAP requires the Company to make estimates and assumptions that affect the reported amounts of assets and liabilities and the disclosure of contingent assets and liabilities at the date of the consolidated financial statements and the reported amounts of revenues and expenses during the reporting period. Actual results may materially differ from those estimates.
Valuation of Portfolio Investments
The fair value of the Company’s investments is determined quarterly in good faith by the Company’s board of directors pursuant to its consistently applied valuation procedures and valuation process in accordance with Accounting Standards Codification Topic 820, Fair Value Measurements and Disclosure, or ASC 820. ASC 820 defines fair value as the price that would be received from the sale of an asset or paid to transfer a liability in an orderly transaction between market participants at the measurement date. ASC 820 also establishes a three-tier fair value hierarchy that prioritizes and ranks the level of market price observability of inputs used in measuring investments at fair value. Inputs used to measure these fair values are classified into the following hierarchy:
Level 1 - Quoted prices in active markets for identical assets or liabilities, accessible by the Company at the measurement date.
Level 2 - Quoted prices for similar assets or liabilities in active markets, or quoted prices for identical or similar assets or liabilities in markets that are not active, or other observable inputs other than quoted prices.
Level 3 - | Unobservable inputs for the asset or liability. The inputs used in the determination of fair value may require significant management judgment or estimation. Such information may be the result of consensus pricing information or broker quotes that include a disclaimer that the broker would not be held to such a price in an actual transaction. The non-binding nature of consensus pricing and/or quotes accompanied by the disclaimer would result in classification as a Level 3 asset, assuming no additional corroborating evidence. |
Market price observability is affected by a number of factors, including the type of investment and the characteristics specific to the investment. Investments with readily available active quoted prices or for which fair value can be measured from actively quoted prices generally will have a higher degree of market price observability and a lesser degree of judgment used in measuring fair value.
Based on the observability of the inputs used in the valuation techniques, the Company is required to provide disclosures on fair value measurements according to the fair value hierarchy. The level in the fair value hierarchy for each fair value measurement has been determined based on the lowest level of input that is significant to the fair value measurement. Our assessment of the significance of a particular input to the fair value measurement in its entirety requires judgment and considers factors specific to each investment. The level assigned to the investment valuations may not be indicative of the risk or liquidity associated with investing in such investments. Because of the inherent uncertainties of valuation, the values reflected in the financial statements may differ materially from the value that would be received upon an actual sale of such investments. In addition, changes in the market environment and other events that may occur over the life of the investments may cause the gains or losses that the Company ultimately realizes on these investments to materially differ from the valuations currently assigned.
The Company’s investments, excluding short term investments, consist primarily of debt securities that are traded on a private over-the-counter market for institutional investments. CIM attempts to obtain market quotations from at least two brokers or dealers for each investment (if available, otherwise from a principal market maker or a primary market dealer or other independent pricing service). CIM utilizes mid-market pricing to determine fair value unless a different point within the range is more representative. Because of the private nature of this marketplace (meaning actual transactions are not publicly reported) and the non-binding nature of consensus pricing and/or quotes, the Company believes that these valuation inputs result in Level 3 classification within the fair value hierarchy.
94
CĪON Investment Corporation
Notes to Consolidated Financial Statements
December 31, 2019
(in thousands, except share and per share amounts)
Notwithstanding the foregoing, if in the reasonable judgment of CIM, the price of any investment held by the Company and determined in the manner described above does not accurately reflect the fair value of such investment, CIM will value such investment at a price that reflects such investment’s fair value and report such change in the valuation to the board of directors or its designee as soon as practicable. Investments that carry certain restrictions on sale will typically be valued at a discount from the public market value of the investment.
Any investments that are not publicly traded or for which a market price is not otherwise readily available are valued at a price that reflects its fair value. With respect to such investments, if CIM is unable to obtain market quotations, the investments are reviewed and valued using one or more of the following types of analyses:
i. | Market comparable statistics and public trading multiples discounted for illiquidity, minority ownership and other factors for companies with similar characteristics. |
ii. | Valuations implied by third-party investments in the applicable portfolio companies. |
iii. | Discounted cash flow analysis, including a terminal value or exit multiple. |
Determination of fair value involves subjective judgments and estimates. Accordingly, these notes to the Company’s consolidated financial statements refer to the uncertainty with respect to the possible effect of such valuations, and any change in such valuations, on the Company’s consolidated financial statements. Below is a description of factors that the Company’s board of directors may consider when valuing the Company’s equity and debt investments where a market price is not readily available:
• | the size and scope of a portfolio company and its specific strengths and weaknesses; |
• | prevailing interest rates for like securities; |
• | expected volatility in future interest rates; |
• | leverage; |
• | call features, put features and other relevant terms of the debt; |
• | the borrower’s ability to adequately service its debt; |
• | the fair market value of the portfolio company in relation to the face amount of its outstanding debt; |
• | the quality of collateral securing the Company’s debt investments; |
• | multiples of earnings before interest, taxes, depreciation and amortization, or EBITDA, cash flows, net income, revenues or, in some cases, book value or liquidation value; and |
• | other factors deemed applicable. |
All of these factors may be subject to adjustment based upon the particular circumstances of a portfolio company or the Company’s actual investment position. For example, adjustments to EBITDA may take into account compensation to previous owners, or acquisition, recapitalization, and restructuring expenses or other related or non-recurring items. The choice of analyses and the weight assigned to such factors may vary across investments and may change within an investment if events occur that warrant such a change.
The discounted cash flow model deemed appropriate by CIM is prepared for the applicable investments and reviewed by designated members of CIM’s management team. Such models are prepared at least quarterly or on an as needed basis. The model uses the estimated cash flow projections for the underlying investments and an appropriate discount rate is determined based on the latest financial information available for the borrower, prevailing market trends, comparable analysis and other inputs. The model, key assumptions, inputs, and results are reviewed by designated members of CIM’s management team with final approval from the board of directors.
Consistent with the Company’s valuation policy, the Company evaluates the source of inputs, including any markets in which the Company’s investments are trading, in determining fair value.
The Company periodically benchmarks the broker quotes from the brokers or dealers against the actual prices at which the Company purchases and sells its investments. Based on the results of the benchmark analysis and the experience of the Company’s management in purchasing and selling these investments, the Company believes that these quotes are reliable indicators of fair value. The Company may also use other methods to determine fair value for securities for which it cannot obtain market quotations through brokers or dealers, including the use of an independent valuation firm. Designated members of CIM’s management team and the Company's board of directors review and approve the valuation determinations made with respect to these investments in a manner consistent with the Company’s valuation process.
95
CĪON Investment Corporation
Notes to Consolidated Financial Statements
December 31, 2019
(in thousands, except share and per share amounts)
As a practical expedient, the Company uses net asset value, or NAV, as the fair value for its equity investments in CION SOF and BCP Great Lakes Fund LP. CION SOF and BCP Great Lakes Fund LP records their underlying investments at fair value on a quarterly basis in accordance with ASC 820.
Revenue Recognition
Securities transactions are accounted for on the trade date. The Company records interest and dividend income on an accrual basis beginning on the trade settlement date or the ex-dividend date, respectively, to the extent that the Company expects to collect such amounts. For investments in equity tranches of collateralized loan obligations, the Company records income based on the effective interest rate determined using the amortized cost and estimated cash flows, which is updated periodically. Loan origination fees, OID, and market discounts/premiums are recorded and such amounts are amortized as adjustments to interest income over the respective term of the loan using the effective interest rate method. Upon the prepayment of a loan or security, prepayment premiums, any unamortized loan origination fees, OID, or market discounts/premiums are recorded as interest income.
The Company may have investments in its investment portfolio that contain a PIK interest provision. PIK interest is accrued as interest income if the portfolio company valuation indicates that such PIK interest is collectible and recorded as interest receivable up to the interest payment date. On the interest payment dates, the Company will capitalize the accrued interest receivable attributable to PIK as additional principal due from the borrower. Additional PIK securities typically have the same terms, including maturity dates and interest rates, as the original securities. In order to maintain RIC status, substantially all of this income must be paid out to shareholders in the form of distributions, even if the Company has not collected any cash. For additional information on investments that contain a PIK interest provision, see the consolidated schedules of investments as of December 31, 2019 and 2018.
Loans and debt securities, including those that are individually identified as being impaired under Accounting Standards Codification 310, Receivables, or ASC 310, are generally placed on non-accrual status immediately if, in the opinion of management, principal or interest is not likely to be paid, or when principal or interest is past due 90 days or more. Interest accrued but not collected at the date a loan or security is placed on non-accrual status is reversed against interest income. Interest income is recognized on non-accrual loans or debt securities only to the extent received in cash. However, where there is doubt regarding the ultimate collectibility of principal, cash receipts, whether designated as principal or interest, are thereafter applied to reduce the carrying value of the loan or debt security. Loans or securities are restored to accrual status only when interest and principal payments are brought current and future payments are reasonably assured.
Dividend income on preferred equity securities is recorded on an accrual basis to the extent that such amounts are payable by the portfolio company and are expected to be collected. Dividend income on common equity securities is recorded on the record date for private portfolio companies or on the ex-dividend date for publicly-traded portfolio companies.
The Company may receive fees for capital structuring services that are fixed based on contractual terms, are normally paid at the closing of the investments, are generally non-recurring and non-refundable and are recognized as revenue when earned upon closing of the investment. The services that CIM provides vary by investment, but generally include reviewing existing credit facilities, arranging bank financing, arranging equity financing, structuring financing from multiple lenders, structuring financing from multiple equity investors, restructuring existing loans, raising equity and debt capital, and providing general financial advice, which concludes upon closing of the investment. In certain instances where the Company is invited to participate as a co-lender in a transaction and does not provide significant services in connection with the investment, a portion of loan fees paid to the Company in such situations will be deferred and amortized over the estimated life of the loan as interest income.
Other income includes amendment fees that are fixed based on contractual terms and are generally non-recurring and non-refundable and are recognized as revenue when earned upon closing of the transaction. Other income also includes fees for managerial assistance and other consulting services, loan guarantees, commitments, and other services rendered by the Company to its portfolio companies. Such fees are fixed based on contractual terms and are recognized as fee income when earned.
Net Realized Gains or Losses and Net Change in Unrealized Appreciation or Depreciation
Gains or losses on the sale of investments are calculated by using the weighted-average method. The Company measures realized gains or losses by the difference between the net proceeds from the sale and the weighted-average amortized cost of the investment, without regard to unrealized appreciation or depreciation previously recognized, but considering unamortized upfront fees. Net change in unrealized appreciation or depreciation reflects the change in portfolio investment values during the reporting period, including any reversal of previously recorded unrealized appreciation or depreciation when gains or losses are realized.
Derivative Instruments
The Company recognizes all derivative instruments as assets or liabilities at fair value in its consolidated financial statements. Derivative contracts entered into by the Company are not designated as hedging instruments, and as a result, the Company presents changes in fair value through current period earnings.
96
CĪON Investment Corporation
Notes to Consolidated Financial Statements
December 31, 2019
(in thousands, except share and per share amounts)
Derivative instruments are measured in terms of the notional contract amount and derive their value based upon one or more underlying instruments. Derivative instruments are subject to various risks similar to non-derivative instruments including market, credit, liquidity and operational risks. For additional information on the Company's derivative instruments, see Note 8.
Capital Gains Incentive Fee
Pursuant to the terms of the investment advisory agreement the Company entered into with CIM, the incentive fee on capital gains earned on liquidated investments of the Company’s investment portfolio during operations is determined and payable in arrears as of the end of each calendar year. Such fee equals 20% of the Company’s incentive fee capital gains (i.e., the Company’s realized capital gains on a cumulative basis from inception, calculated as of the end of each calendar year, computed net of all realized capital losses and unrealized capital depreciation on a cumulative basis), less the aggregate amount of any previously paid capital gains incentive fees. On a cumulative basis and to the extent that all realized capital losses and unrealized capital depreciation exceed realized capital gains as well as the aggregate realized net capital gains for which a fee has previously been paid, the Company would not be required to pay CIM a capital gains incentive fee. On a quarterly basis, the Company accrues for the capital gains incentive fee by calculating such fee as if it were due and payable as of the end of such period.
CIM did not take any incentive fees with respect to the Company’s TRS. For purposes of computing the capital gains incentive fee, CIM became entitled to a capital gains incentive fee upon the termination of the TRS, at which point all gains and losses of the underlying loans constituting the reference assets of the TRS were realized. However, realized losses exceeded realized gains on the underlying loans, resulting in no capital gains incentive fees on the TRS. Any net unrealized gains on the TRS were reflected in total assets on the Company’s consolidated balance sheets and included in the computation of the base management fee. Any net unrealized losses on the TRS were reflected in total liabilities on the Company’s consolidated balance sheets and excluded in the computation of the base management fee.
While the investment advisory agreement with CIM neither includes nor contemplates the inclusion of unrealized gains in the calculation of the capital gains incentive fee, pursuant to an interpretation of the American Institute for Certified Public Accountants, or AICPA, Technical Practice Aid for investment companies, the Company accrues capital gains incentive fees on unrealized gains. This accrual reflects the incentive fees that would be payable to CIM if the Company’s entire investment portfolio was liquidated at its fair value as of the balance sheet date even though CIM is not entitled to an incentive fee with respect to unrealized gains unless and until such gains are actually realized.
Net Increase (Decrease) in Net Assets per Share
Net increase (decrease) in net assets per share is calculated based upon the daily weighted average number of shares of common stock outstanding during the reporting period.
Distributions
Distributions to shareholders are recorded as of the record date. The amount paid as a distribution is declared by the Company's co-chief executive officers and ratified by the board of directors on a quarterly basis. Net realized capital gains, if any, are distributed at least annually.
Note 3. Share Transactions
The Company’s initial continuous public offering commenced on July 2, 2012 and ended on December 31, 2015. The Company’s follow-on continuous public offering commenced on January 25, 2016 and ended on January 25, 2019.
The following table summarizes transactions with respect to shares of the Company’s common stock during the years ended December 31, 2019, 2018 and 2017:
Years Ended December 31, | ||||||||||||||||||||
2019 | 2018 | 2017 | ||||||||||||||||||
Shares | Amount | Shares | Amount | Shares | Amount | |||||||||||||||
Gross shares/proceeds from the offering | 696,264 | $ | 6,515 | 3,375,660 | $ | 32,232 | 6,086,836 | $ | 58,031 | |||||||||||
Reinvestment of distributions | 4,217,705 | 35,800 | 4,272,518 | 38,732 | 4,342,113 | 39,658 | ||||||||||||||
Total gross shares/proceeds | 4,913,969 | 42,315 | 7,648,178 | 70,964 | 10,428,949 | 97,689 | ||||||||||||||
Sales commissions and dealer manager fees | — | (296 | ) | — | (1,168 | ) | — | (2,193 | ) | |||||||||||
Net shares/proceeds | 4,913,969 | 42,019 | 7,648,178 | 69,796 | 10,428,949 | 95,496 | ||||||||||||||
Share repurchase program | (4,242,063 | ) | (35,799 | ) | (10,720,690 | ) | (97,043 | ) | (4,434,755 | ) | (40,406 | ) | ||||||||
Net shares/proceeds from (for) share transactions | 671,906 | $ | 6,220 | (3,072,512 | ) | $ | (27,247 | ) | 5,994,194 | $ | 55,090 | |||||||||
97
CĪON Investment Corporation
Notes to Consolidated Financial Statements
December 31, 2019
(in thousands, except share and per share amounts)
During the years ended December 31, 2019, 2018 and 2017, the Company sold 4,913,969, 7,648,178 and 10,428,949 shares, respectively, at an average price per share of $8.61, $9.28 and $9.37, respectively.
Since commencing its initial continuous public offering on July 2, 2012 and through December 31, 2019, the Company sold 113,381,145 shares of common stock for net proceeds of $1,155,287 at an average price per share of $10.19. The net proceeds include gross proceeds received from reinvested shareholder distributions of $198,664, for which the Company issued 22,114,000 shares of common stock, and gross proceeds paid for shares of common stock tendered for repurchase of $198,663, for which the Company repurchased 22,224,600 shares of common stock.
During the period from January 1, 2020 to March 13, 2020, the Company received gross proceeds of $5,009 from reinvested shareholder distributions, for which the Company issued 599,950 shares of common stock.
To ensure that the offering price per share, net of sales commissions and dealer manager fees, equaled or exceeded the net asset value per share on each subscription closing date and distribution reinvestment date, certain of the Company’s directors increased the offering price per share of common stock on certain dates. Due to a decline in the Company’s net asset value per share to an amount more than 2.5% below the Company’s then-current net offering price, certain of the Company’s directors decreased the offering price per share of common stock effective January 2, 2019 and January 9, 2019 from $9.50 to $9.45 and from $9.45 to $9.40, respectively.
Share Repurchase Program
On a quarterly basis, the Company offers, and intends to continue offering, to repurchase shares on such terms as may be determined by the Company’s board of directors in its complete and absolute discretion unless, in the judgment of the independent directors of the Company’s board of directors, such repurchases would not be in the best interests of the Company’s shareholders or would violate applicable law.
The Company currently limits the number of shares to be repurchased during any calendar year to the number of shares it can repurchase with the proceeds it receives from the issuance of shares pursuant to its fifth amended and restated distribution reinvestment plan. At the discretion of the Company’s board of directors, it may also use cash on hand, cash available from borrowings and cash from liquidation of investments as of the end of the applicable period to repurchase shares. The Company currently offers to repurchase such shares at a price equal to the estimated net asset value per share on each date of repurchase.
Any periodic repurchase offers are subject in part to the Company’s available cash and compliance with the BDC and RIC qualification and diversification rules promulgated under the 1940 Act and the Code, respectively. While the Company conducts quarterly tender offers as described above, it is not required to do so and may suspend or terminate the share repurchase program at any time, upon 30 days’ notice.
The following table summarizes the share repurchases completed during the years ended December 31, 2018 and 2019:
Three Months Ended | Repurchase Date | Shares Repurchased | Percentage of Shares Tendered That Were Repurchased | Repurchase Price Per Share | Aggregate Consideration for Repurchased Shares | ||||||||||
2018 | |||||||||||||||
March 31, 2018 | January 3, 2018 | 2,014,536 | 100% | $ | 9.12 | $ | 18,379 | ||||||||
June 30, 2018 | April 4, 2018 | 2,352,580 | 100% | 9.15 | 21,525 | ||||||||||
September 30, 2018 | July 5, 2018 | 2,507,596 | 100% | 9.06 | 22,724 | ||||||||||
September 26, 2018 | 2,086,133 | 100% | 9.06 | 18,907 | |||||||||||
December 31, 2018 | December 26, 2018 | 1,759,845 | 63% | 8.81 | 15,508 | ||||||||||
Total for the year ended December 31, 2018 | 10,720,690 | $ | 97,043 | ||||||||||||
2019 | |||||||||||||||
March 31, 2019 | March 27, 2019 | 1,078,856 | 30% | $ | 8.68 | $ | 9,361 | ||||||||
June 30, 2019 | June 26, 2019 | 1,038,641 | 15% | 8.59 | 8,926 | ||||||||||
September 30, 2019 | September 25, 2019 | 1,035,307 | 15% | 8.27 | 8,562 | ||||||||||
December 31, 2019 | December 26, 2019 | 1,089,259 | 17% | 8.22 | 8,950 | ||||||||||
Total for the year ended December 31, 2019 | 4,242,063 | $ | 35,799 | ||||||||||||
98
CĪON Investment Corporation
Notes to Consolidated Financial Statements
December 31, 2019
(in thousands, except share and per share amounts)
Note 4. Transactions with Related Parties
For the years ended December 31, 2019, 2018 and 2017, fees and other expenses incurred by the Company related to CIM and its affiliates were as follows:
Years Ended December 31, | ||||||||||||||||
Entity | Capacity | Description | 2019 | 2018 | 2017 | |||||||||||
CION Securities, LLC | Dealer manager | Dealer manager fees(1) | $ | 121 | $ | 525 | $ | 988 | ||||||||
CIM | Investment adviser | Management fees(2) | 36,466 | 35,013 | 29,549 | |||||||||||
CIM | Investment adviser | Incentive fees(2) | 20,087 | 8,177 | 3,222 | |||||||||||
CIM | Administrative services provider | Administrative services expense(2) | 2,650 | 2,243 | — | |||||||||||
ICON Capital, LLC | Administrative services provider | Administrative services expense(2) | — | 461 | 2,160 | |||||||||||
Apollo Investment Administration, L.P. | Administrative services provider | Transaction costs(2) | 146 | — | — | |||||||||||
$ | 59,470 | $ | 46,419 | $ | 35,919 | |||||||||||
(1) Amounts charged directly to equity.
(2) Amounts charged directly to operations.
On December 28, 2016, the Company entered into an amended and restated follow-on dealer manager agreement with CIM and CION Securities, LLC (formerly, ICON Securities, LLC), or CION Securities, in connection with the Company's follow-on continuous public offering, which ended on January 25, 2019. Under the amended and restated dealer manager agreement, the dealer manager fee was reduced from up to 3% to up to 2% of gross offering proceeds and selling commissions to the selling dealers were reduced from up to 7% to up to 3% of gross offering proceeds. Such costs were charged against capital in excess of par value when incurred. Since commencing its initial continuous public offering on July 2, 2012 through January 25, 2019, the Company paid or accrued sales commissions of $65,278 to the selling dealers and dealer manager fees of $32,628 to CION Securities.
The Company has entered into an investment advisory agreement with CIM. On November 5, 2019, the board of directors of the Company, including a majority of the board of directors who are not interested persons, approved the renewal of the investment advisory agreement for a period of twelve months commencing December 17, 2019. Pursuant to the investment advisory agreement, CIM is paid an annual base management fee equal to 2.0% of the average value of the Company’s gross assets, less cash and cash equivalents, and an incentive fee based on the Company’s performance, as described below. The base management fee is payable quarterly in arrears and is calculated based on the two most recently completed calendar quarters. The incentive fee consists of two parts. The first part, which is referred to as the subordinated incentive fee on income, is calculated and payable quarterly in arrears based on “pre-incentive fee net investment income” for the immediately preceding quarter and is subject to a hurdle rate, measured quarterly and expressed as a rate of return on adjusted capital, as defined in the investment advisory agreement, equal to 1.875% per quarter, or an annualized rate of 7.5%. The Company receives 100% of pre-incentive fee net investment income once the hurdle rate is exceeded until the annualized rate of 9.375% is exceeded, at which point the Company receives 20% of all pre-incentive fee net investment income. For the years ended December 31, 2019 and 2018, the Company recorded subordinated incentive fees on income of $20,087 and $8,177, respectively, which are payable to CIM. As of December 31, 2019 and 2018, the liability recorded for subordinated incentive fees was $5,612 and $2,604, respectively. The second part of the incentive fee, which is referred to as the capital gains incentive fee, is described in Note 2.
The Company accrues the capital gains incentive fee based on net realized gains and net unrealized appreciation; however, under the terms of the investment advisory agreement, the fee payable to CIM is based on net realized gains and unrealized depreciation and no such fee is payable with respect to unrealized appreciation unless and until such appreciation is actually realized. For the years ended December 31, 2019, 2018 and 2017, the Company had no liability for and did not record any capital gains incentive fees.
With respect to the TRS, CIM became entitled to receive a capital gains incentive fee upon the termination of the TRS, at which point all net gains and losses of the underlying loans constituting the reference assets of the TRS were realized. However, CIM did not take any incentive fees with respect to the Company’s TRS as realized losses exceeded realized gains on the underlying loans upon termination. See Note 2 for an additional discussion of CIM’s entitlement to receive payment of incentive fees.
99
CĪON Investment Corporation
Notes to Consolidated Financial Statements
December 31, 2019
(in thousands, except share and per share amounts)
Under the terms of the investment advisory agreement, CIM and certain of its affiliates, which includes CIG, are entitled to receive reimbursement of up to 1.5% of the gross proceeds raised until all offering and organizational costs have been reimbursed. The Company’s payment of offering and organizational costs will not exceed 1.5% of the actual gross proceeds raised from the offerings (without giving effect to any potential expense support from CIG and its affiliates, which includes CIM). With respect to any reimbursements for offering and organizational costs, the Company interprets the 1.5% limit based on actual gross proceeds raised at the time of such reimbursement. In addition, the Company will not issue any of its shares or other securities for services or for property other than cash or securities except as a dividend or distribution to its security holders or in connection with a reorganization.
Reinvestment of shareholder distributions and share repurchases are excluded from the gross proceeds from the Company’s offerings for purposes of determining the total amount of offering and organizational costs that can be paid by the Company. As of December 31, 2019, the Company raised gross offering proceeds of $1,155,287, of which it can pay up to $17,329 in offering and organizational costs (which represents 1.5% of the actual gross offering proceeds raised). Through December 31, 2019, the Company paid $10,702 of such costs, leaving an additional $6,627 that can be paid.
The Company entered into an administration agreement with CIM’s affiliate, ICON Capital, LLC, or ICON Capital, pursuant to which ICON Capital furnished the Company with administrative services including accounting, investor relations and other administrative services necessary to conduct its day-to-day operations. ICON Capital was reimbursed for administrative expenses it incurred on the Company’s behalf in performing its obligations, provided that such reimbursement was for the lower of ICON Capital’s actual costs or the amount that the Company would have been required to pay for comparable administrative services in the same geographic location. Such costs were reasonably allocated to the Company on the basis of assets, revenues, time records or other reasonable methods. The Company did not reimburse ICON Capital for any services for which it received a separate fee or for rent, depreciation, utilities, capital equipment or other administrative items allocated to a person with a controlling interest in ICON Capital.
On April 1, 2018, the Company entered into an administration agreement with CIM for the purpose of replacing ICON Capital with CIM as the Company's administrator pursuant to the terms of the administration agreement. No other material terms of the administration agreement with ICON Capital were amended in connection with the administration agreement with CIM. On November 5, 2019, the board of directors of the Company, including a majority of the board of directors who are not interested persons, approved the renewal of the administration agreement with CIM for a period of twelve months commencing December 17, 2019.
On January 1, 2019, the Company entered into a servicing agreement with CIM’s affiliate, Apollo Investment Administration, L.P., or AIA, pursuant to which AIA furnishes the Company with administrative services including, but not limited to, loan and high yield trading services, trade and settlement support, and monthly valuation reports and support for all broker quoted investments. AIA is reimbursed for administrative expenses it incurs on the Company’s behalf in performing its obligations, provided that such reimbursement is reasonable, and costs and expenses incurred are documented. The servicing agreement may be terminated at any time, without the payment of any penalty, by either party, upon 60 days' written notice to the other party.
On January 30, 2013, the Company entered into the expense support and conditional reimbursement agreement with CIG, whereby CIG agreed to provide expense support to the Company in an amount that is sufficient to: (1) ensure that no portion of the Company’s distributions to shareholders will be paid from its offering proceeds or borrowings, and/or (2) reduce the Company’s operating expenses until it has achieved economies of scale sufficient to ensure that it bears a reasonable level of expense in relation to its investment income. On December 16, 2015, the Company further amended and restated the expense support and conditional reimbursement agreement for purposes of including AIM as a party to the agreement. On January 2, 2018, the Company entered into an expense support and conditional reimbursement agreement with CIM for purposes of, among other things, replacing CIG and AIM with CIM as the expense support provider pursuant to the terms of the expense support and conditional reimbursement agreement. On December 20, 2019, the Company and CIM amended the expense support and conditional reimbursement agreement to extend the termination date of such agreement from December 31, 2019 to December 31, 2020.
Pursuant to the expense support and conditional reimbursement agreement, the Company will have a conditional obligation to reimburse CIM for any amounts funded by CIM under such agreement (i) if expense support amounts funded by CIM exceed operating expenses incurred during any fiscal quarter, (ii) if the sum of the Company’s net investment income for tax purposes, net capital gains and the amount of any dividends and other distributions paid to the Company on account of investments in portfolio companies (to the extent not included in net investment income or net capital gains for tax purposes) exceeds the distributions paid by the Company to shareholders, and (iii) during any fiscal quarter occurring within three years of the date on which CIM funded such amount. The obligation to reimburse CIM for any expense support provided by CIM under such agreement is further conditioned by the following: (i) in the period in which reimbursement is sought, the ratio of operating expenses to average net assets, when considering the reimbursement, cannot exceed the ratio of operating expenses to average net assets, as defined, for the period when the expense support was provided; (ii) in the period when reimbursement is sought, the annualized distribution rate cannot fall below the annualized distribution rate for the period when the expense support was provided; and (iii) the expense support can only be reimbursed within three years from the date the expense support was provided.
100
CĪON Investment Corporation
Notes to Consolidated Financial Statements
December 31, 2019
(in thousands, except share and per share amounts)
Expense support, if any, will be determined as appropriate to meet the objectives of the expense support and conditional reimbursement agreement. For the years ended December 31, 2019 and 2018, the Company did not receive any expense support from CIM. For the year ended December 31, 2017, the Company did not receive any expense support from CIG or AIM. See Note 5 for additional information on the sources of the Company’s distributions. The Company may or may not be requested to reimburse any expense support provided in the future.
The Company or CIM may terminate the expense support and conditional reimbursement agreement at any time. CIM has indicated that it expects to continue such expense support to ensure that the Company bears a reasonable level of expenses in relation to its income. If the Company terminates the investment advisory agreement with CIM, the Company may be required to repay all unreimbursed expense support funded by CIM within three years of the date of termination. There will be no acceleration or increase of such repayment obligation at termination of the investment advisory agreement with CIM. The specific amount of expense support provided by CIM, if any, will be determined at the end of each quarter. There can be no assurance that the expense support and conditional reimbursement agreement will remain in effect or that CIM will support any portion of the Company’s expenses in future quarters.
As of December 31, 2019 and 2018, the total liability payable to CIM and its affiliates was $15,771 and $12,825, respectively, which primarily related to fees earned by CIM during the three months ended December 31, 2019 and 2018, respectively.
Because CIM’s senior management team is comprised of substantially the same personnel as the senior management team of the Company’s affiliate, ICON Capital, which is the investment manager to certain equipment finance funds, or equipment funds, such members of senior management provide investment advisory and management services to the equipment funds in addition to the Company. In the event that CIM undertakes to provide investment advisory services to other clients in the future, it will strive to allocate investment opportunities in a fair and equitable manner consistent with the Company’s investment objective and strategies so that the Company will not be disadvantaged in relation to any other client of the investment adviser or its senior management team. However, it is currently possible that some investment opportunities will be provided to other clients of CIM rather than to the Company.
Indemnifications
The investment advisory agreement, the administration agreement and the dealer manager agreement each provide certain indemnifications from the Company to the other relevant parties to such agreements. The Company’s maximum exposure under these agreements is unknown. However, the Company has not experienced claims or losses pursuant to these agreements and believes the risk of loss related to such indemnifications to be remote.
Note 5. Distributions
From February 1, 2014 through July 17, 2017, the Company’s board of directors authorized and declared on a monthly basis a weekly distribution amount per share of common stock. On July 18, 2017, the Company's board of directors authorized and declared on a quarterly basis a weekly distribution amount per share of common stock. Effective September 28, 2017, the Company's board of directors delegated to management the authority to determine the amount, record dates, payment dates and other terms of distributions to shareholders, which will be ratified by the board of directors, each on a quarterly basis. Declared distributions are paid monthly.
The Company’s board of directors declared or ratified distributions for 53, 52, and 52 record dates during each of the years ended December 31, 2019, 2018 and 2017, respectively.
101
CĪON Investment Corporation
Notes to Consolidated Financial Statements
December 31, 2019
(in thousands, except share and per share amounts)
The following table presents cash distributions per share that were declared during the years ended December 31, 2019, 2018 and 2017:
Distributions | ||||||||
Three Months Ended | Per Share | Amount | ||||||
2017 | ||||||||
March 31, 2017 (thirteen record dates) | $ | 0.1829 | $ | 20,123 | ||||
June 30, 2017 (thirteen record dates) | 0.1829 | 20,371 | ||||||
September 30, 2017 (thirteen record dates) | 0.1829 | 20,644 | ||||||
December 31, 2017 (thirteen record dates) | 0.1829 | 20,923 | ||||||
Total distributions for the year ended December 31, 2017 | $ | 0.7316 | $ | 82,061 | ||||
2018 | ||||||||
March 31, 2018 (thirteen record dates) | $ | 0.1829 | $ | 21,002 | ||||
June 30, 2018 (thirteen record dates) | 0.1829 | 21,004 | ||||||
September 30, 2018 (thirteen record dates) | 0.1829 | 20,776 | ||||||
December 31, 2018 (thirteen record dates) | 0.1829 | 20,701 | ||||||
Total distributions for the year ended December 31, 2018 | $ | 0.7316 | $ | 83,483 | ||||
2019 | ||||||||
March 31, 2019 (thirteen record dates) | $ | 0.1829 | $ | 20,772 | ||||
June 30, 2019 (thirteen record dates) | 0.1829 | 20,801 | ||||||
September 30, 2019 (thirteen record dates) | 0.1829 | 20,798 | ||||||
December 31, 2019 (fourteen record dates) | 0.1969 | 22,401 | ||||||
Total distributions for the year ended December 31, 2019 | $ | 0.7456 | $ | 84,772 | ||||
102
CĪON Investment Corporation
Notes to Consolidated Financial Statements
December 31, 2019
(in thousands, except share and per share amounts)
On December 18, 2019, the Company’s co-chief executive officers (i) revised the record date for the weekly cash distributions covering the final week of December 2019; (ii) revised the payment date for the weekly cash distributions covering the entire month of December 2019; and (iii) declared regular weekly cash distributions of $0.014067 per share for January 2020 through March 2020. Each distribution was paid or will be paid monthly to shareholders of record as of the weekly record dates set forth below.
Record Date | Payment Date | Distribution Amount Per Share | ||
December 3, 2019 | December 27, 2019 | $0.014067 | ||
December 10, 2019 | December 27, 2019 | $0.014067 | ||
December 17, 2019 | December 27, 2019 | $0.014067 | ||
December 24, 2019 | December 27, 2019 | $0.014067 | ||
December 26, 2019 | December 27, 2019 | $0.014067 | ||
January 7, 2020 | January 29, 2020 | $0.014067 | ||
January 14, 2020 | January 29, 2020 | $0.014067 | ||
January 21, 2020 | January 29, 2020 | $0.014067 | ||
January 28, 2020 | January 29, 2020 | $0.014067 | ||
February 4, 2020 | February 26, 2020 | $0.014067 | ||
February 11, 2020 | February 26, 2020 | $0.014067 | ||
February 18, 2020 | February 26, 2020 | $0.014067 | ||
February 25, 2020 | February 26, 2020 | $0.014067 | ||
March 3, 2020 | March 27, 2020 | $0.014067 | ||
March 10, 2020 | March 27, 2020 | $0.014067 | ||
March 17, 2020 | March 27, 2020 | $0.014067 | ||
March 24, 2020 | March 27, 2020 | $0.014067 | ||
March 26, 2020 | March 27, 2020 | $0.014067 | ||
The Company has adopted an “opt in” distribution reinvestment plan for shareholders. As a result, if the Company makes a distribution, shareholders will receive distributions in cash unless they specifically “opt in” to the fifth amended and restated distribution reinvestment plan so as to have their cash distributions reinvested in additional shares of the Company’s common stock.
On December 8, 2016, the Company amended and restated its distribution reinvestment plan pursuant to the fifth amended and restated distribution reinvestment plan, or the Fifth Amended DRIP. The Fifth Amended DRIP became effective as of, and first applied to the reinvestment of cash distributions paid on, February 1, 2017. Under the Fifth Amended DRIP, cash distributions to participating shareholders will be reinvested in additional shares of common stock at a purchase price equal to the estimated net asset value per share of common stock as of the date of issuance.
The Company may fund its cash distributions to shareholders from any sources of funds available to the Company, including borrowings, net investment income from operations, capital gains proceeds from the sale of assets, non-capital gains proceeds from the sale of assets, dividends or other distributions paid to it on account of preferred and common equity investments in portfolio companies and expense support from CIM, which is subject to repayment by the Company within three years. The Company has not established limits on the amount of funds it may use from available sources to make distributions. For the years ended December 31, 2019 and 2018, none of the Company's distributions resulted from expense support from CIM. For the year ended December 31, 2017, none of the Company's distributions resulted from expense support from CIG or AIM. The purpose of this arrangement is to avoid such distributions being characterized as a return of capital. Shareholders should understand that any such distributions are not based on the Company’s investment performance, and can only be sustained if the Company achieves positive investment performance in future periods and/or CIM provides such expense support. Shareholders should also understand that the Company’s future repayments of expense support will reduce the distributions that they would otherwise receive. There can be no assurance that the Company will achieve such performance in order to sustain these distributions, or be able to pay distributions at all. CIM has no obligation to provide expense support to the Company in future periods.
103
CĪON Investment Corporation
Notes to Consolidated Financial Statements
December 31, 2019
(in thousands, except share and per share amounts)
The following table reflects the sources of cash distributions on a GAAP basis that the Company has declared on its shares of common stock during the years ended December 31, 2019, 2018 and 2017:
Years Ended December 31, | |||||||||||||||||||||||||||||||||
2019 | 2018 | 2017 | |||||||||||||||||||||||||||||||
Source of Distribution | Per Share | Amount | Percentage | Per Share | Amount | Percentage | Per Share | Amount | Percentage | ||||||||||||||||||||||||
Net investment income | $ | 0.7456 | $ | 84,772 | 100.0 | % | $ | 0.7316 | $ | 83,483 | 100.0 | % | $ | 0.6833 | $ | 76,683 | 93.4 | % | |||||||||||||||
Net realized gain on total return swap | |||||||||||||||||||||||||||||||||
Net interest and other income from TRS portfolio | — | — | — | — | — | — | 0.0315 | 3,494 | 4.3 | % | |||||||||||||||||||||||
Net gain on TRS loan sales(1) | — | — | — | — | — | — | 0.0168 | 1,884 | 2.3 | % | |||||||||||||||||||||||
Total distributions | $ | 0.7456 | $ | 84,772 | 100.0 | % | $ | 0.7316 | $ | 83,483 | 100.0 | % | $ | 0.7316 | $ | 82,061 | 100.0 | % | |||||||||||||||
(1) | During the year ended December 31, 2017, the Company realized losses that were not then deductible on a tax-basis of $19,334 primarily due to the purchase of loans by Flatiron Funding II in connection with the TRS refinancing that were previously held in the TRS. As of December 31, 2018 and 2019, realized losses of $12,537 and $10,055, respectively, related to the TRS refinancing remained non-deductible on a tax-basis. See Note 9 for an additional discussion regarding this purchase. |
Note 6. Investments
The composition of the Company’s investment portfolio as of December 31, 2019 and 2018 at amortized cost and fair value was as follows:
December 31, 2019 | December 31, 2018 | |||||||||||||||||||||
Cost(1) | Fair Value | Percentage of Investment Portfolio | Cost(1) | Fair Value | Percentage of Investment Portfolio | |||||||||||||||||
Senior secured first lien debt | $ | 1,388,942 | $ | 1,351,767 | 77.9 | % | $ | 1,492,034 | $ | 1,462,989 | 79.0 | % | ||||||||||
Senior secured second lien debt | 264,280 | 248,253 | 14.3 | % | 341,595 | 323,365 | 17.4 | % | ||||||||||||||
Collateralized securities and structured products - debt | 7,212 | 7,212 | 0.4 | % | 15,193 | 15,193 | 0.8 | % | ||||||||||||||
Collateralized securities and structured products - equity | 16,476 | 14,182 | 0.8 | % | 16,794 | 14,827 | 0.8 | % | ||||||||||||||
Unsecured debt | 4,901 | 4,900 | 0.3 | % | — | — | — | |||||||||||||||
Equity | 115,738 | 109,231 | 6.3 | % | 38,610 | 36,399 | 2.0 | % | ||||||||||||||
Subtotal/total percentage | 1,797,549 | 1,735,545 | 100.0 | % | 1,904,226 | 1,852,773 | 100.0 | % | ||||||||||||||
Short term investments(2) | 29,527 | 29,527 | 12,537 | 12,537 | ||||||||||||||||||
Total investments | $ | 1,827,076 | $ | 1,765,072 | $ | 1,916,763 | $ | 1,865,310 | ||||||||||||||
(1) | Cost represents the original cost adjusted for the amortization of premiums and/or accretion of discounts, as applicable, for debt investments and cost for equity investments. |
(2) | Short term investments represent an investment in a fund that invests in highly liquid investments with average original maturity dates of three months or less. |
104
CĪON Investment Corporation
Notes to Consolidated Financial Statements
December 31, 2019
(in thousands, except share and per share amounts)
The following tables show the composition of the Company’s investment portfolio by industry classification and geographic dispersion, and the percentage, by fair value, of the total investment portfolio assets in such industries and geographies as of December 31, 2019 and 2018:
December 31, 2019 | December 31, 2018 | |||||||||||||
Industry Classification | Investments at Fair Value | Percentage of Investment Portfolio | Investments at Fair Value | Percentage of Investment Portfolio | ||||||||||
Healthcare & Pharmaceuticals | $ | 294,947 | 17.0 | % | $ | 325,180 | 17.5 | % | ||||||
Media: Diversified & Production | 206,159 | 11.9 | % | 114,303 | 6.2 | % | ||||||||
Services: Business | 191,126 | 11.0 | % | 218,888 | 11.7 | % | ||||||||
Media: Advertising, Printing & Publishing | 120,810 | 7.0 | % | 131,620 | 7.1 | % | ||||||||
Chemicals, Plastics & Rubber | 102,906 | 5.9 | % | 74,575 | 4.0 | % | ||||||||
Services: Consumer | 94,058 | 5.4 | % | 133,210 | 7.2 | % | ||||||||
Capital Equipment | 73,586 | 4.2 | % | 98,994 | 5.3 | % | ||||||||
Beverage, Food & Tobacco | 68,440 | 3.9 | % | 73,494 | 4.0 | % | ||||||||
Diversified Financials | 66,897 | 3.9 | % | 30,020 | 1.6 | % | ||||||||
Banking, Finance, Insurance & Real Estate | 62,738 | 3.6 | % | 57,917 | 3.1 | % | ||||||||
Telecommunications | 61,577 | 3.6 | % | 74,261 | 4.0 | % | ||||||||
High Tech Industries | 60,197 | 3.5 | % | 126,620 | 6.8 | % | ||||||||
Retail | 53,599 | 3.1 | % | 42,450 | 2.3 | % | ||||||||
Energy: Oil & Gas | 48,742 | 2.8 | % | 54,907 | 3.0 | % | ||||||||
Construction & Building | 37,096 | 2.1 | % | 33,483 | 1.8 | % | ||||||||
Consumer Goods: Non-Durable | 33,609 | 1.9 | % | 37,148 | 2.0 | % | ||||||||
Consumer Goods: Durable | 31,705 | 1.8 | % | 35,709 | 1.9 | % | ||||||||
Aerospace & Defense | 30,378 | 1.8 | % | 45,655 | 2.5 | % | ||||||||
Transportation: Cargo | 27,291 | 1.6 | % | 30,614 | 1.7 | % | ||||||||
Hotel, Gaming & Leisure | 25,081 | 1.4 | % | 54,689 | 3.0 | % | ||||||||
Forest Products & Paper | 24,217 | 1.4 | % | 19,525 | 1.1 | % | ||||||||
Metals & Mining | 10,373 | 0.6 | % | 10,333 | 0.6 | % | ||||||||
Automotive | 10,013 | 0.6 | % | 24,645 | 1.3 | % | ||||||||
Environmental Industries | — | — | 2,955 | 0.2 | % | |||||||||
Media: Broadcasting & Subscription | — | — | 1,578 | 0.1 | % | |||||||||
Subtotal/total percentage | 1,735,545 | 100.0 | % | 1,852,773 | 100.0 | % | ||||||||
Short term investments | 29,527 | 12,537 | ||||||||||||
Total investments | $ | 1,765,072 | $ | 1,865,310 | ||||||||||
105
CĪON Investment Corporation
Notes to Consolidated Financial Statements
December 31, 2019
(in thousands, except share and per share amounts)
December 31, 2019 | December 31, 2018 | |||||||||||||
Geographic Dispersion(1) | Investments at Fair Value | Percentage of Investment Portfolio | Investments at Fair Value | Percentage of Investment Portfolio | ||||||||||
United States | $ | 1,656,031 | 95.4 | % | $ | 1,740,168 | 93.9 | % | ||||||
Canada | 27,648 | 1.7 | % | 27,122 | 1.6 | % | ||||||||
Cayman Islands | 14,182 | 0.8 | % | 14,827 | 0.8 | % | ||||||||
Luxembourg | 10,693 | 0.6 | % | 13,833 | 0.7 | % | ||||||||
Netherlands | 8,314 | 0.5 | % | 18,015 | 1.0 | % | ||||||||
Germany | 7,212 | 0.4 | % | 15,193 | 0.8 | % | ||||||||
Marshall Islands | 6,782 | 0.4 | % | 9,404 | 0.5 | % | ||||||||
Cyprus | 4,155 | 0.2 | % | 4,616 | 0.2 | % | ||||||||
Bermuda | 528 | — | 675 | — | ||||||||||
France | — | — | 5,965 | 0.3 | % | |||||||||
United Kingdom | — | — | 2,955 | 0.2 | % | |||||||||
Subtotal/total percentage | 1,735,545 | 100.0 | % | 1,852,773 | 100.0 | % | ||||||||
Short term investments | 29,527 | 12,537 | ||||||||||||
Total investments | $ | 1,765,072 | $ | 1,865,310 | ||||||||||
(1) | The geographic dispersion is determined by the portfolio company's country of domicile. |
As of December 31, 2019 and 2018, investments on non-accrual status represented 0.4% and 1.4%, respectively, of the Company's investment portfolio on a fair value basis.
The Company’s investment portfolio may contain senior secured investments that are in the form of lines of credit, delayed draw term loans, revolving credit facilities, or unfunded commitments, which may require the Company to provide funding when requested in accordance with the terms of the underlying agreements. As of December 31, 2019 and 2018, the Company’s unfunded commitments amounted to $83,694 and $79,078, respectively. As of March 12, 2020, the Company’s unfunded commitments amounted to $86,387. Since these commitments may expire without being drawn upon, unfunded commitments do not necessarily represent future cash requirements or future earning assets for the Company. Refer to Note 12 for further details on the Company’s unfunded commitments.
Note 7. CION SOF
CION SOF was organized on May 21, 2019 as a Delaware limited liability company, and commenced operations on October 2, 2019 when the Company and BCP Special Opportunities Fund I, LP, or BCP, entered into the limited liability company agreement of CION SOF for purposes of establishing the manner in which the parties would invest in and co-manage CION SOF. CION SOF invests primarily in senior secured loans of U.S. middle-market companies. The Company and BCP contributed a portfolio of loans to CION SOF representing membership equity of $31,289 and $4,470, respectively, in exchange for 87.5% and 12.5% of the membership interests of CION SOF, respectively. The Company and BCP are not required to make any additional capital contributions to CION SOF. The Company’s equity investment in CION SOF is not redeemable. All portfolio and other material decisions regarding CION SOF must be submitted to its board of managers, which is comprised of four members, two of whom were selected by the Company and the other two were selected by BCP. Further, all portfolio and other material decisions require the affirmative vote of at least one board member from the Company and one board member from BCP.
The Company also serves as administrative agent to CION SOF to provide loan servicing functions and other administrative services. In certain cases, these loan servicing functions and other administrative services may be performed by CIM.
On October 2, 2019, CION SOF entered into a senior secured credit facility with MS, or the SOF Credit Facility, for borrowings of up to a maximum amount of $75,000. Advances under the SOF Credit Facility are available through October 2, 2022 and bear interest at a floating rate equal to the three-month LIBOR, plus a spread of (i) 3.0% per year through October 1, 2022 and (i) 3.5% per year thereafter through October 2, 2024. CION SOF's obligations to MS under the SOF Credit Facility are secured by a first priority security interest in all of the assets of CION SOF. On October 2, 2019, CION SOF drew down $64,702 of borrowings under the SOF Credit Facility. As of December 31, 2019, the principal amount outstanding on the SOF Credit Facility was $60,702. The obligations of CION SOF under the SOF Credit Facility are non-recourse to the Company.
106
CĪON Investment Corporation
Notes to Consolidated Financial Statements
December 31, 2019
(in thousands, except share and per share amounts)
For the year ended December 31, 2019, the Company recorded $1,076 in dividend income from its equity interest in CION SOF.
In accordance with ASU 2015-02, Consolidation, the Company has determined that CION SOF is a variable interest entity, or VIE. However, the Company is not the primary beneficiary and therefore does not consolidate CION SOF. The Company's maximum exposure to losses from CION SOF is limited to its equity contribution to CION SOF.
The following table sets forth the individual investments in CION SOF's portfolio as of December 31, 2019:
Portfolio Company | Index Rate(a) | Industry | Principal/ Par Amount/ Units | Cost(b) | Fair Value | |||||||||||
Senior Secured First Lien Debt | ||||||||||||||||
Allen Media, LLC, L+650, 1.00% LIBOR Floor, 8/30/2023 | 3 Month LIBOR | Media: Diversified & Production | $ | 5,920 | $ | 5,738 | $ | 5,979 | ||||||||
Analogic Corp., L+600, 1.00% LIBOR Floor, 6/21/2024 | 1 Month LIBOR | Healthcare & Pharmaceuticals | 4,923 | 4,876 | 4,874 | |||||||||||
Anthem Sports & Entertainment Inc., L+950, 1.00% LIBOR Floor, 9/9/2024 | 3 Month LIBOR | Media: Diversified & Production | 3,978 | 3,939 | 3,938 | |||||||||||
Cadence Aerospace, LLC, L+650, 1.00% LIBOR Floor, 11/14/2023 | 3 Month LIBOR | Aerospace & Defense | 4,987 | 4,892 | 4,937 | |||||||||||
Central Security Group, Inc., L+563, 1.00% LIBOR Floor, 10/6/2021 | 1 Month LIBOR | Services: Consumer | 4,987 | 4,876 | 4,339 | |||||||||||
CircusTrix Holdings, LLC, L+550, 1.00% LIBOR Floor, 12/16/2021 | 1 Month LIBOR | Hotel, Gaming & Leisure | 5,985 | 5,877 | 5,865 | |||||||||||
Extreme Reach, Inc., L+750, 0.00% LIBOR Floor, 3/29/2024 | 1 Month LIBOR | Media: Diversified & Production | 4,909 | 4,839 | 4,885 | |||||||||||
Genesis Healthcare, Inc., L+600, 0.50% LIBOR Floor, 3/6/2023 | 1 Month LIBOR | Healthcare & Pharmaceuticals | 5,000 | 4,905 | 4,913 | |||||||||||
Jab Wireless, Inc., L+800, 0.00% LIBOR Floor, 5/2/2023 | 1 Month LIBOR | Telecommunications | 6,000 | 6,000 | 6,000 | |||||||||||
LAV Gear Holdings, Inc., L+550, 1.00% LIBOR Floor, 10/31/2024 | 3 Month LIBOR | Services: Business | 4,987 | 4,891 | 4,900 | |||||||||||
Manna Pro Products, LLC, L+600, 0.00% LIBOR Floor, 12/8/2023 | 1 Month LIBOR | Retail | 5,985 | 5,927 | 5,925 | |||||||||||
NewsCycle Solutions, Inc., L+700, 1.00% LIBOR Floor, 12/29/2022 | 1 Month LIBOR | Media: Advertising, Printing & Publishing | 4,933 | 4,886 | 4,883 | |||||||||||
PH Beauty Holdings III. Inc., L+500, 0.00% LIBOR Floor, 9/28/2025 | 1 Month LIBOR | Consumer Goods: Non-Durable | 4,987 | 4,722 | 4,788 | |||||||||||
Polymer Process Holdings, Inc., L+600, 0.00% LIBOR Floor, 5/1/2026 | 1 Month LIBOR | Chemicals, Plastics & Rubber | 4,987 | 4,914 | 4,913 | |||||||||||
Woodstream Corp., L+600, 1.00% LIBOR Floor, 5/29/2022 | 1 Month LIBOR | Consumer Goods: Non-Durable | 5,000 | 4,976 | 5,000 | |||||||||||
Total Senior Secured First Lien Debt | 76,258 | 76,139 | ||||||||||||||
Senior Secured Second Lien Debt | ||||||||||||||||
1A Smart Start LLC, L+825, 1.00% LIBOR Floor, 8/21/2022 | 1 Month LIBOR | High Tech Industries | 4,000 | 3,907 | 3,940 | |||||||||||
ABG Intermediate Holdings 2 LLC, L+775, 1.00% LIBOR Floor, 9/29/2025 | 1 Month LIBOR | Retail | 3,000 | 3,005 | 3,000 | |||||||||||
PetroChoice Holdings, Inc., L+875, 1.00% LIBOR Floor, 8/21/2023 | 3 Month LIBOR | Chemicals, Plastics & Rubber | 5,000 | 4,928 | 4,800 | |||||||||||
STG-Fairway Acquisitions, Inc., L+925, 1.00% LIBOR Floor, 6/30/2023 | 1 Month LIBOR | Services: Business | 5,000 | 4,809 | 5,000 | |||||||||||
Total Senior Secured Second Lien Debt | 16,649 | 16,740 | ||||||||||||||
Short Term Investments(c) | ||||||||||||||||
First American Treasury Obligations Fund, Class Z Shares, 1.49%(d) | 2,757 | 2,757 | ||||||||||||||
Total Short Term Investments | 2,757 | 2,757 | ||||||||||||||
TOTAL INVESTMENTS | $ | 95,664 | $ | 95,636 | ||||||||||||
a. | The 1 and 3 month LIBOR rates were 1.76% and 1.91%, respectively, as of December 31, 2019. The actual LIBOR rate for each loan listed may not be the applicable LIBOR rate as of December 31, 2019, as the loan may have been priced or repriced based on a LIBOR rate prior to or subsequent to December 31, 2019. |
b. | Represents amortized cost for debt securities and cost for equity investments. |
c. | Short term investments represent an investment in a fund that invests in highly liquid investments with average original maturity dates of three months or less. |
d. | 7-day effective yield as of December 31, 2019. |
107
CĪON Investment Corporation
Notes to Consolidated Financial Statements
December 31, 2019
(in thousands, except share and per share amounts)
The following tables include certain summarized financial information for CION SOF as of December 31, 2019 and for the period from October 2, 2019 through December 31, 2019:
Selected Balance Sheet Information: | December 31, 2019 | |||
Investments, at fair value (amortized cost of $95,664) | $ | 95,636 | ||
Cash and other assets | 363 | |||
Receivable for investments sold and repaid | 80 | |||
Interest receivable on investments | 727 | |||
Total assets | $ | 96,806 | ||
Credit facility (net of unamortized debt issuance costs of $1,123) | 59,579 | |||
Other liabilities | 1,495 | |||
Total liabilities | $ | 61,074 | ||
Members' capital | 35,732 | |||
Total liabilities and members' capital | $ | 96,806 | ||
Selected Statement of Operations Information: | Period from October 2, 2019 (Commencement of Operations) through December 31, 2019 | |||
Total revenues | $ | 2,326 | ||
Total expenses | 1,095 | |||
Net change in unrealized depreciation on investments | (28 | ) | ||
Net increase in net assets | $ | 1,203 | ||
Note 8. Derivative Instruments
In the normal course of business and subject to the requirements of the 1940 Act, the Company enters into derivative instruments as part of its investment strategy.
Credit Default Swap
On October 14, 2016, the Company entered into a credit default swap with JPMorgan Chase Bank N.A., with a base notional amount of €22,000, to purchase protection with respect to Deutsche Bank AG exposure. The swap terminated on March 20, 2017.
Total Return Swap
On December 17, 2012, the Company, through its wholly-owned consolidated subsidiary, Flatiron Funding, LLC, or Flatiron, entered into a TRS with Citibank. Flatiron and Citibank amended the TRS on several occasions, most recently on February 18, 2017, to extend the termination or call date from February 18, 2017 to April 18, 2017. Prior to the call date, the maximum aggregate market value of the portfolio of loans subject to the TRS (determined at the time each such loan became subject to the TRS) was $800,000 and the interest rate payable by Flatiron to Citibank with respect to each loan included in the TRS was a spread of 1.40% per year over the floating rate index specified for each such loan, which would not be less than zero. On April 18, 2017, the TRS expired in accordance with its terms. The agreements between Flatiron and Citibank, which collectively established the TRS, are referred to herein as the TRS Agreement.
The value of the TRS was based on the increase or decrease in the value of the loans underlying the TRS, as determined by the Company. The loans underlying the TRS were valued in the same manner as loans owned by the Company. As of December 31, 2017, Citibank returned all cash collateral to Flatiron.
108
CĪON Investment Corporation
Notes to Consolidated Financial Statements
December 31, 2019
(in thousands, except share and per share amounts)
Realized gains and losses on the TRS are composed of any gains or losses on loans underlying the TRS as well as net interest and fees earned during the period. For the years ended December 31, 2019, 2018 and 2017, net realized loss on the TRS consisted of the following:
Years Ended December 31, | ||||||||||||
2019 | 2018 | 2017 | ||||||||||
Interest and other income from TRS portfolio | $ | — | $ | — | $ | 6,511 | ||||||
Interest and other expense from TRS portfolio | — | — | (3,017 | ) | ||||||||
Net loss on TRS loan sales | — | — | (17,450 | ) | ||||||||
Net realized loss(1) | $ | — | $ | — | $ | (13,956 | ) | |||||
(1) Net realized loss is reflected in net realized loss on total return swap on the Company's consolidated statements of operations and in net increase in net assets resulting from operations on the Company's consolidated statements of cash flows.
On March 29, 2017, Flatiron Funding II purchased certain loans underlying the TRS with a notional value of $363,860 in connection with the TRS refinancing. See Note 9 for additional information on Flatiron Funding II and the Citibank Credit Facility.
Note 9. Financing Arrangements
The following table presents summary information with respect to the Company’s outstanding financing arrangements as of December 31, 2019:
Financing Arrangement | Type of Financing Arrangement | Rate | Amount Outstanding | Amount Available | Maturity Date | |||||||||
Citibank Credit Facility | Revolving Credit Facility | L+2.00% | $ | 278,542 | $ | 71,458 | March 30, 2022 | |||||||
JPM Credit Facility | Term Loan Credit Facility | L+3.00% | 250,000 | 25,000 | August 24, 2021 | |||||||||
UBS Facility | Repurchase Agreement | L+3.50% | 200,000 | — | May 19, 2020 | |||||||||
MS Credit Facility | Revolving Credit Facility | L+3.00% | 112,500 | 37,500 | December 19, 2022 | |||||||||
$ | 841,042 | $ | 133,958 | |||||||||||
Citibank Credit Facility
On March 29, 2017, Flatiron Funding II entered into a senior secured credit facility with Citibank. The senior secured credit facility with Citibank, or the Citibank Credit Facility, provided for a revolving credit facility in an aggregate principal amount of $325,000, subject to compliance with a borrowing base. On July 11, 2017, Flatiron Funding II amended the Citibank Credit Facility, or the Amended Citibank Credit Facility, with Citibank to make certain immaterial administrative amendments as a result of the termination of AIM as the Company's investment sub-advisor as discussed in Note 1.
On March 14, 2019, Flatiron Funding II further amended the Citibank Credit Facility, or the Second Amended Citibank Credit Facility, with Citibank to (i) increase the aggregate principal amount available for borrowings from $325,000 to $350,000, subject to compliance with a borrowing base, (ii) extend the reinvestment period for two years until March 29, 2021 and (iii) extend the maturity date until March 30, 2022.
As of December 31, 2018, the principal amount outstanding on the Amended Citibank Credit Facility was $298,542. As of December 31, 2019 and March 12, 2020, the principal amount outstanding on the Second Amended Citibank Credit Facility was $278,542 and $245,442, respectively.
Advances under the Second Amended Citibank Credit Facility bear interest at a floating rate equal to (1) the higher of (a) the Citibank prime rate, (b) the federal funds rate plus 1.5% or (c) the three-month LIBOR plus 1.0%, plus (2) a spread of (a) 2% per year during the period from and including March 29, 2017 and the earlier of March 29, 2021 and the date the Second Amended Citibank Credit Facility matures, or (b) 3% per year during the period from the date the Second Amended Citibank Credit Facility matures until all obligations under the Second Amended Citibank Credit Facility have been paid in full. Interest is payable quarterly in arrears. All advances under the Second Amended Citibank Credit Facility will mature, and all accrued and unpaid interest thereunder will be due and payable, by no later than March 30, 2022. Flatiron Funding II may prepay advances pursuant to the terms and conditions of the credit and security agreement. Flatiron Funding II must repay 50% of advances under the Second Amended Citibank Credit Facility outstanding on March 29, 2021 by September 15, 2021. In addition, Flatiron Funding II will be subject to a non-usage fee of 0.75% per year (subject to an increase to 2% in certain circumstances) on the amount, if any, of the aggregate principal amount available under the Second Amended Citibank Credit Facility that has not been borrowed. The non-usage fees, if any, are payable quarterly in arrears. Flatiron Funding II incurred certain customary costs and expenses in connection with obtaining and amending the Citibank Credit Facility.
109
CĪON Investment Corporation
Notes to Consolidated Financial Statements
December 31, 2019
(in thousands, except share and per share amounts)
The Company incurred debt issuance costs of $3,373 in connection with obtaining and amending the Citibank Credit Facility, which were recorded as a direct reduction to the outstanding balance of the Second Amended Citibank Credit Facility, which is included in the Company’s consolidated balance sheets and will amortize to interest expense over the term of the Second Amended Citibank Credit Facility. At December 31, 2019, the unamortized portion of the debt issuance costs was $1,551.
Flatiron Funding II purchased loans and other corporate debt securities with a fair value of $354,967 on the closing date pursuant to master participation and assignment agreements between Flatiron Funding II and each of 15th Street Loan Funding LLC and 15th Street Loan Funding 2 LLC, each a special purpose subsidiary of Citibank. 15th Street Loan Funding LLC and 15th Street Loan Funding 2 LLC held loans and other corporate debt securities in connection with the total return swap between Citibank and Flatiron, which expired in accordance with its terms on April 18, 2017. Flatiron Funding II’s obligations to Citibank under the Second Amended Citibank Credit Facility are secured by a first priority security interest in all of the assets of Flatiron Funding II. The obligations of Flatiron Funding II under the Second Amended Citibank Credit Facility are non-recourse to the Company, and the Company’s exposure under the Second Amended Citibank Credit Facility is limited to the value of the Company’s investment in Flatiron Funding II.
In connection with the Second Amended Citibank Credit Facility, Flatiron Funding II has made certain representations and warranties and is required to comply with various covenants, reporting requirements and other customary requirements for similar facilities. As of and for the year ended December 31, 2019, Flatiron Funding II was in compliance with all covenants and reporting requirements.
For the year ended December 31, 2019 and 2018, the components of interest expense, average borrowings, and weighted average interest rate for the Second Amended Citibank Credit Facility were as follows:
Year Ended December 31, 2019 | Year Ended December 31, 2018 | |||||||
Stated interest expense | $ | 12,783 | $ | 13,186 | ||||
Non-usage fee | 467 | 94 | ||||||
Amortization of deferred financing costs | 682 | 647 | ||||||
Total interest expense | $ | 13,932 | $ | 13,927 | ||||
Weighted average interest rate(1) | 4.60 | % | 4.17 | % | ||||
Average borrowings | $ | 283,681 | $ | 312,591 | ||||
(1) Includes the stated interest expense and non-usage fee, if any, on the unused portion of the Second Amended Citibank Credit Facility and is annualized for periods covering less than one year.
JPM Credit Facility
On August 26, 2016, 34th Street entered into a senior secured credit facility with JPM. The senior secured credit facility with JPM, or the JPM Credit Facility, provided for borrowings in an aggregate principal amount of $150,000, of which $25,000 may be funded as a revolving credit facility, each subject to conditions described in the JPM Credit Facility. On August 26, 2016, 34th Street drew down $57,000 of borrowings under the JPM Credit Facility. On August 21, 2018, 34th Street drew down $25,577 of additional borrowings under the Amended JPM Credit Facility (as defined below).
On September 30, 2016, July 11, 2017, November 28, 2017 and May 23, 2018, 34th Street amended and restated the JPM Credit Facility, or the Amended JPM Credit Facility, with JPM. Under the Amended JPM Credit Facility entered into on September 30, 2016, the aggregate principal amount available for borrowings was increased from $150,000 to $225,000, of which $25,000 may be funded as a revolving credit facility, subject to conditions described in the Amended JPM Credit Facility. On September 30, 2016, 34th Street drew down $167,423 of additional borrowings under the Amended JPM Credit Facility, a portion of which was used to purchase the portfolio of loans from Credit Suisse Park View BDC, Inc. Under the Amended JPM Credit Facility entered into on July 11, 2017 and November 28, 2017, certain immaterial administrative amendments were made as a result of the termination of AIM as the Company's investment sub-adviser as discussed in Note 1. Under the Amended JPM Credit Facility entered into on May 23, 2018, the aggregate principal amount available for borrowings was increased from $225,000 to $275,000, of which $25,000 may be funded as a revolving credit facility, subject to conditions described in the Amended JPM Credit Facility, the reinvestment period was extended until August 24, 2020 and the maturity date was extended to August 24, 2021.
As of December 31, 2019 and 2018, the principal amount outstanding on the Amended JPM Credit Facility was $250,000.
110
CĪON Investment Corporation
Notes to Consolidated Financial Statements
December 31, 2019
(in thousands, except share and per share amounts)
Advances under the Amended JPM Credit Facility bear interest at a floating rate equal to the three-month LIBOR, plus a spread of 3.00% per year, which was reduced from 3.50% under the Amended JPM Credit Facility entered into on May 23, 2018. Interest is payable quarterly in arrears. All advances under the Amended JPM Credit Facility will mature, and all accrued and unpaid interest thereunder will be due and payable, by no later than August 24, 2021. 34th Street may prepay advances pursuant to the terms and conditions of the Amended JPM Credit Facility, subject to a 1% premium in certain circumstances. In addition, 34th Street will be subject to a non-usage fee of 1.0% per year on the amount, if any, of the aggregate principal amount available under the Amended JPM Credit Facility that has not been borrowed during the period from August 23, 2018, and ending on, but excluding, August 24, 2020. The non-usage fees, if any, are payable quarterly in arrears.
The Company contributed loans and other corporate debt securities to 34th Street in exchange for 100% of the membership interests of 34th Street, and may contribute additional loans and other corporate debt securities to 34th Street in the future. 34th Street’s obligations to JPM under the Amended JPM Credit Facility are secured by a first priority security interest in all of the assets of 34th Street. The obligations of 34th Street under the Amended JPM Credit Facility are non-recourse to the Company, and the Company’s exposure under the Amended JPM Credit Facility is limited to the value of the Company’s investment in 34th Street.
In connection with the Amended JPM Credit Facility, 34th Street has made certain representations and warranties and is required to comply with various covenants, reporting requirements and other customary requirements for similar facilities. As of and for the year ended December 31, 2019, 34th Street was in compliance with all covenants and reporting requirements.
The Company incurred debt issuance costs of $4,052 in connection with obtaining and amending the JPM Credit Facility, which were recorded as a direct reduction to the outstanding balance of the Amended JPM Credit Facility, which is included in the Company’s consolidated balance sheet as of December 31, 2019 and will amortize to interest expense over the term of the Amended JPM Credit Facility. At December 31, 2019, the unamortized portion of the debt issuance costs was $1,001.
For the years ended December 31, 2019 and 2018, the components of interest expense, average borrowings, and weighted average interest rate for the Amended JPM Credit Facility were as follows:
Year Ended December 31, 2019 | Year Ended December 31, 2018 | |||||||
Stated interest expense | $ | 13,769 | $ | 12,634 | ||||
Non-usage fee | 253 | 157 | ||||||
Amortization of deferred financing costs | 764 | 1,103 | ||||||
Total interest expense | $ | 14,786 | $ | 13,894 | ||||
Weighted average interest rate(1) | 5.53 | % | 5.40 | % | ||||
Average borrowings | $ | 250,000 | $ | 233,743 | ||||
(1) Includes the stated interest expense and non-usage fee, if any, on the unused portion of the Amended JPM Credit Facility and is annualized for periods covering less than one year.
UBS Facility
On May 19, 2017, the Company, through two newly-formed, wholly-owned, special-purpose financing subsidiaries, entered into a financing arrangement with UBS pursuant to which up to $125,000 was made available to the Company.
Pursuant to the financing arrangement, assets in the Company's portfolio may be contributed from time to time to Murray Hill Funding II, through Murray Hill Funding, LLC, or Murray Hill Funding, each a newly-formed, wholly-owned, special-purpose financing subsidiary of the Company. On May 19, 2017, the Company contributed assets to Murray Hill Funding II. The assets held by Murray Hill Funding II secure the obligations of Murray Hill Funding II under Class A Notes, or the Notes, issued by Murray Hill Funding II. Pursuant to an Indenture, dated May 19, 2017, between Murray Hill Funding II and U.S. Bank National Association, or U.S. Bank, as trustee, or the Indenture, the aggregate principal amount of Notes that may be issued by Murray Hill Funding II from time to time was $192,308. Murray Hill Funding purchased the Notes issued by Murray Hill Funding II at a purchase price equal to their par value. Murray Hill Funding makes capital contributions to Murray Hill Funding II to, among other things, maintain the value of the portfolio of assets held by Murray Hill Funding II.
111
CĪON Investment Corporation
Notes to Consolidated Financial Statements
December 31, 2019
(in thousands, except share and per share amounts)
Principal on the Notes will be due and payable on the stated maturity date of May 19, 2027. Pursuant to the Indenture, Murray Hill Funding II has made certain representations and warranties and is required to comply with various covenants, reporting requirements and other customary requirements for similar transactions. The Indenture contains events of default customary for similar transactions, including, without limitation: (a) the failure to make principal payments on the Notes at their stated maturity or any earlier redemption date or to make interest payments on the Notes and such failure is not cured within three business days; (b) the failure to disburse amounts in accordance with the priority of payments and such failure is not cured within three business days; and (c) the occurrence of certain bankruptcy and insolvency events with respect to Murray Hill Funding II or Murray Hill Funding.
Murray Hill Funding, in turn, entered into a repurchase transaction with UBS, pursuant to the terms of a Global Master Repurchase Agreement and the related Annex and Master Confirmation thereto, each dated May 19, 2017, or collectively, the UBS Facility. Pursuant to the UBS Facility, on May 19, 2017 and June 19, 2017, UBS purchased Notes held by Murray Hill Funding for an aggregate purchase price equal to 65% of the principal amount of Notes purchased. Subject to certain conditions, the maximum principal amount of Notes that may be purchased under the UBS Facility was $192,308. Accordingly, the aggregate maximum amount payable to Murray Hill Funding under the UBS Facility would not exceed $125,000. Murray Hill Funding will repurchase the Notes sold to UBS under the UBS Facility by no later than May 19, 2020. The repurchase price paid by Murray Hill Funding to UBS will be equal to the purchase price paid by UBS for the repurchased Notes (giving effect to any reductions resulting from voluntary partial prepayment(s)). If the UBS Facility is accelerated prior to May 19, 2020 due to an event of default or a mandatory or voluntary full payment by Murray Hill Funding, then Murray Hill Funding must pay to UBS a fee equal to the present value of the spread portion of the financing fees that would have been payable to UBS from the date of acceleration through May 19, 2020 had the acceleration not occurred. The financing fee under the UBS Facility is equal to the three-month LIBOR plus a spread of up to 3.50% per year for the relevant period.
On December 1, 2017, Murray Hill Funding II amended and restated the Indenture, or the Amended Indenture, pursuant to which the aggregate principal amount of Notes that may be issued by Murray Hill Funding II was increased from $192,308 to $266,667. Murray Hill Funding will purchase the Notes to be issued by Murray Hill Funding II from time to time. On December 1, 2017, Murray Hill Funding entered into a First Amended and Restated Master Confirmation to the Global Master Repurchase Agreement, or the Amended Master Confirmation, which sets forth the terms of the repurchase transaction between Murray Hill Funding and UBS under the UBS Facility. As part of the Amended Master Confirmation, on December 15, 2017 and April 2, 2018, UBS purchased the increased aggregate principal amount of Notes held by Murray Hill Funding for an aggregate purchase price equal to 75% of the principal amount of Notes issued. As a result of the Amended Master Confirmation, the aggregate maximum amount payable to Murray Hill Funding and made available to the Company under the UBS Facility was increased from $125,000 to $200,000. No other material terms of the UBS Facility were revised in connection with the amended UBS Facility, or the Amended UBS Facility.
UBS may require Murray Hill Funding to post cash collateral if, without limitation, the sum of the market value of the portfolio of assets and the cash and eligible investments held by Murray Hill Funding II, together with any posted cash collateral, is less than the required margin amount under the UBS Facility; provided, however, that Murray Hill Funding will not be required to post cash collateral with UBS until such market value has declined at least 10% from the initial market value of the portfolio assets.
The Company has no contractual obligation to post any such cash collateral or to make any payments to UBS on behalf of Murray Hill Funding. The Company may, but is not obligated to, increase its investment in Murray Hill Funding for the purpose of funding any cash collateral or payment obligations for which Murray Hill Funding becomes obligated in connection with the Amended UBS Facility. The Company’s exposure under the Amended UBS Facility is limited to the value of the Company’s investment in Murray Hill Funding.
Pursuant to the Amended UBS Facility, Murray Hill Funding has made certain representations and warranties and is required to comply with various covenants, reporting requirements and other customary requirements for similar transactions. The Amended UBS Facility contains events of default customary for similar financing transactions, including, without limitation: (a) failure to transfer the Notes to UBS on the applicable purchase date or repurchase the Notes from UBS on the applicable repurchase date; (b) failure to pay certain fees and make-whole amounts when due; (c) failure to post cash collateral as required; (d) the occurrence of insolvency events with respect to Murray Hill Funding; and (e) the admission by Murray Hill Funding of its inability to, or its intention not to, perform any of its obligations under the Amended UBS Facility.
Murray Hill Funding paid an upfront fee and incurred certain other customary costs and expenses totaling $2,637 in connection with obtaining the Amended UBS Facility, which were recorded as a direct reduction to the outstanding balance of the Amended UBS Facility, which is included in the Company’s consolidated balance sheets and will amortize to interest expense over the term of the Amended UBS Facility. At December 31, 2019, the unamortized portion of the upfront fee and other expenses was $360.
As of December 31, 2019, Notes in the aggregate principal amount of $266,667 had been purchased by Murray Hill Funding from Murray Hill Funding II and subsequently sold to UBS under the Amended UBS Facility for aggregate proceeds of $200,000. The carrying amount outstanding under the Amended UBS Facility approximates its fair value. The Company funded each purchase of Notes by Murray Hill Funding through a capital contribution to Murray Hill Funding. As of December 31, 2019, the amount due at maturity under the Amended UBS Facility was $200,000. The Notes issued by Murray Hill Funding II and purchased by Murray Hill Funding eliminate in consolidation on the Company’s consolidated financial statements.
112
CĪON Investment Corporation
Notes to Consolidated Financial Statements
December 31, 2019
(in thousands, except share and per share amounts)
As of December 31, 2019, the fair value of assets held by Murray Hill Funding II was $332,619.
For the years ended December 31, 2019 and 2018, the components of interest expense, average borrowings, and weighted average interest rate for the Amended UBS Facility were as follows:
Year Ended December 31, 2019 | Year Ended December 31, 2018 | |||||||
Stated interest expense | $ | 11,951 | $ | 10,934 | ||||
Amortization of deferred financing costs | 940 | 940 | ||||||
Total interest expense | $ | 12,891 | $ | 11,874 | ||||
Weighted average interest rate(1) | 5.89 | % | 5.66 | % | ||||
Average borrowings | $ | 200,000 | $ | 190,651 | ||||
(1) Includes the stated interest expense and non-usage fee, if any, on the unused portion of the Amended UBS Facility and is annualized for periods covering less than one year.
MS Credit Facility
On December 19, 2017, 33rd Street entered into a senior secured credit facility, or the MS Credit Facility, with MS. The MS Credit Facility provided for a revolving credit facility in an aggregate principal amount of up to $200,000, subject to compliance with a borrowing base.
Advances under the MS Credit Facility will be available through December 19, 2020 and will bear interest at a floating rate equal to the three-month LIBOR, plus a spread of (i) 3.0% per year through December 19, 2020 and (ii) 3.5% per year thereafter through December 19, 2022. Interest is payable quarterly in arrears. All advances under the MS Credit Facility will mature, and all accrued and unpaid interest thereunder will be due and payable, by no later than December 19, 2022. In addition, 33rd Street will be subject to a non-usage fee of 0.75% per year that accrues for each day of an accrual period on the amount by which $200,000 exceeds the greater of (x) the aggregate principal amount, if any, of the advances outstanding on such day and (y) during the period from June 20, 2018 through December 19, 2020, 75% of $200,000 (or such smaller amount if the committed facility amount is reduced pursuant to the terms and conditions of the loan and servicing agreement). The non-usage fees, if any, are payable quarterly in arrears. 33rd Street incurred certain customary costs and expenses in connection with obtaining the MS Credit Facility.
On July 9, 2018, 33rd Street amended and restated the MS Credit Facility to make certain immaterial administrative amendments. 33rd Street further amended and restated the MS Credit Facility, or the Amended MS Credit Facility, with MS on December 18, 2018. Pursuant to the amendment, 33rd Street may prepay advances pursuant to the terms and conditions of the loan and servicing agreement subject to a 1% premium if the amount of the Amended MS Credit Facility is reduced or terminated on or prior to December 19, 2020.
Pursuant to the terms of the loan and servicing agreement, on March 15, 2019, 33rd Street reduced the aggregate principal amount available for borrowings under the Amended MS Credit Facility from $200,000 to $150,000.
In connection with the Amended MS Credit Facility, 33rd Street has made certain representations and warranties and is required to comply with various covenants, reporting requirements and other customary requirements for similar facilities. The Amended MS Credit Facility contains customary events of default for similar financing transactions, including, without limitation: (a) the failure to make any payment when due and thereafter (other than with respect to payments of principal and interest), within one business day following the earlier of (i) 33rd Street becoming aware of such failure; or (ii) notice of such default is provided by MS; (b) the insolvency or bankruptcy of 33rd Street, the Company or CIM; (c) a change of control of 33rd Street shall have occurred or CIM ceases to be the investment advisor of the Company; (d) the failure by 33rd Street to make any payment when due in connection with any of its other indebtedness having an aggregate value of at least $500, or any other default by 33rd Street of any agreement related to such indebtedness; (e) any representation, warranty, condition or agreement of 33rd Street, the Company or CIM under the loan and servicing agreement is incorrect or not performed, which if capable of being cured, is not cured within 30 days; and (f) the failure to satisfy certain financial covenants, which if capable of being cured, is not cured within the time period specified in the loan and servicing agreement. Upon the occurrence and during the continuation of an event of default, MS may declare the outstanding advances and all other obligations under the Amended MS Credit Facility immediately due and payable.
The Company contributed loans and other corporate debt securities to 33rd Street in exchange for 100% of the membership interests of 33rd Street, and may contribute additional loans and other corporate debt securities to 33rd Street in the future. 33rd Street’s obligations to MS under the Amended MS Credit Facility are secured by a first priority security interest in all of the assets of 33rd Street. The obligations of 33rd Street under the Amended MS Credit Facility are non-recourse to the Company, and the Company's exposure under the Amended MS Credit Facility is limited to the value of the Company's investment in 33rd Street. 33rd Street has appointed CIM to manage its portfolio.
113
CĪON Investment Corporation
Notes to Consolidated Financial Statements
December 31, 2019
(in thousands, except share and per share amounts)
On June 5, 2018, June 12, 2018 and June 28, 2018, 33rd Street drew down $25,000, $75,000 and $50,000 of borrowings under the MS Credit Facility, respectively. On May 8, 2019, May 23, 2019, July 29, 2019 and November 6, 2019, 33rd Street repaid $20,000, $5,000, $10,000 and $2,500 of borrowings under the MS Credit Facility, respectively. As of December 31, 2019 and 2018, the principal amount outstanding on the Amended MS Credit Facility was $112,500 and $150,000, respectively. As of March 12, 2020, the principal amount outstanding on the Amended MS Credit Facility was $122,500.
33rd Street paid an upfront fee and incurred certain other customary costs and expenses totaling $2,591 in connection with obtaining and amending the MS Credit Facility, which the Company initially recorded as prepaid expenses and other assets on the Company’s consolidated balance sheets and will amortize to interest expense over the term of the Amended MS Credit Facility. On June 5, 2018, unamortized upfront fees were recorded as a direct reduction to the outstanding balance of the Amended MS Credit Facility, which is included in the Company’s consolidated balance sheet as of December 31, 2019. At December 31, 2019, the unamortized portion of the upfront fee and other expenses was $1,544.
For the years ended December 31, 2019 and 2018, the components of interest expense, average borrowings, and weighted average interest rate for the Amended MS Credit Facility were as follows:
Year Ended December 31, 2019 | Year Ended December 31, 2018 | |||||||
Stated interest expense | $ | 7,173 | $ | 4,451 | ||||
Non-usage fee | 237 | 953 | ||||||
Amortization of deferred financing costs | 512 | 518 | ||||||
Total interest expense | $ | 7,922 | $ | 5,922 | ||||
Weighted average interest rate(1) | 5.65 | % | 6.46 | % | ||||
Average borrowings | $ | 129,247 | $ | 81,712 | ||||
(1) Includes the stated interest expense and non-usage fee, if any, on the unused portion of the Amended MS Credit Facility and is annualized for periods covering less than one year.
Note 10. Fair Value of Financial Instruments
The following table presents fair value measurements of the Company’s portfolio investments as of December 31, 2019 and 2018, according to the fair value hierarchy:
December 31, 2019(1) | December 31, 2018 | ||||||||||||||||||||||||||||||
Level 1 | Level 2 | Level 3 | Total | Level 1 | Level 2 | Level 3 | Total | ||||||||||||||||||||||||
Senior secured first lien debt | $ | — | $ | — | $ | 1,351,767 | $ | 1,351,767 | $ | — | $ | — | $ | 1,462,989 | $ | 1,462,989 | |||||||||||||||
Senior secured second lien debt | — | — | 248,253 | 248,253 | — | — | 323,365 | 323,365 | |||||||||||||||||||||||
Collateralized securities and structured products - debt | — | — | 7,212 | 7,212 | — | — | 15,193 | 15,193 | |||||||||||||||||||||||
Collateralized securities and structured products - equity | — | — | 14,182 | 14,182 | — | — | 14,827 | 14,827 | |||||||||||||||||||||||
Unsecured debt | — | — | 4,900 | 4,900 | — | — | — | — | |||||||||||||||||||||||
Equity | 6,842 | — | 56,886 | 63,728 | 7,323 | — | 29,076 | 36,399 | |||||||||||||||||||||||
Short term investments | 29,527 | — | — | 29,527 | 12,537 | — | — | 12,537 | |||||||||||||||||||||||
Total Investments | $ | 36,369 | $ | — | $ | 1,683,200 | $ | 1,719,569 | $ | 19,860 | $ | — | $ | 1,845,450 | $ | 1,865,310 | |||||||||||||||
(1) Excludes the Company's $31,265 investment in CION SOF and $14,238 investment in BCP Great Lakes Fund LP, which were measured at NAV.
114
CĪON Investment Corporation
Notes to Consolidated Financial Statements
December 31, 2019
(in thousands, except share and per share amounts)
The following tables provide a reconciliation of the beginning and ending balances for investments that use Level 3 inputs for the years ended December 31, 2019 and 2018:
Year Ended December 31, 2019 | ||||||||||||||||||||||||||||
Senior Secured First Lien Debt | Senior Secured Second Lien Debt | Collateralized Securities and Structured Products - Debt | Collateralized Securities and Structured Products - Equity | Unsecured Debt | Equity | Total | ||||||||||||||||||||||
Beginning balance, December 31, 2018 | $ | 1,462,989 | $ | 323,365 | $ | 15,193 | $ | 14,827 | $ | — | $ | 29,076 | $ | 1,845,450 | ||||||||||||||
Investments purchased(1) | 529,939 | 28,250 | — | — | 4,900 | 33,668 | 596,757 | |||||||||||||||||||||
Net realized loss | (19,528 | ) | (2,738 | ) | (475 | ) | — | — | (2,037 | ) | (24,778 | ) | ||||||||||||||||
Net change in unrealized (depreciation) appreciation | (8,130 | ) | 2,203 | — | (327 | ) | (1 | ) | (3,821 | ) | (10,076 | ) | ||||||||||||||||
Accretion of discount | 14,734 | 1,346 | — | — | 1 | — | 16,081 | |||||||||||||||||||||
Sales and principal repayments(1) | (628,237 | ) | (104,173 | ) | (7,506 | ) | (318 | ) | — | — | (740,234 | ) | ||||||||||||||||
Ending balance, December 31, 2019 | $ | 1,351,767 | $ | 248,253 | $ | 7,212 | $ | 14,182 | $ | 4,900 | $ | 56,886 | $ | 1,683,200 | ||||||||||||||
Change in net unrealized depreciation on investments still held as of December 31, 2019(2) | $ | (20,908 | ) | $ | (2,549 | ) | $ | — | $ | (327 | ) | $ | (1 | ) | $ | (5,122 | ) | $ | (28,907 | ) | ||||||||
(1) Includes non-cash restructured securities.
(2) Included in net change in unrealized (depreciation) appreciation on investments in the consolidated statements of operations.
Year Ended December 31, 2018 | ||||||||||||||||||||||||||||
Senior Secured First Lien Debt | Senior Secured Second Lien Debt | Collateralized Securities and Structured Products - Debt | Collateralized Securities and Structured Products - Equity | Unsecured Debt | Equity | Total | ||||||||||||||||||||||
Beginning balance, December 31, 2017 | $ | 1,100,336 | $ | 333,944 | $ | 25,289 | $ | 18,525 | $ | 7,639 | $ | 16,277 | $ | 1,502,010 | ||||||||||||||
Investments purchased | 1,135,574 | 128,644 | — | — | — | 13,737 | 1,277,955 | |||||||||||||||||||||
Net realized (loss) gain | (243 | ) | (5,916 | ) | 367 | 137 | 21 | — | (5,634 | ) | ||||||||||||||||||
Net change in unrealized (depreciation) appreciation | (40,869 | ) | (9,268 | ) | 122 | (659 | ) | 14 | (938 | ) | (51,598 | ) | ||||||||||||||||
Accretion of discount | 15,133 | 2,888 | 362 | — | 4 | — | 18,387 | |||||||||||||||||||||
Sales and principal repayments | (746,942 | ) | (126,927 | ) | (10,947 | ) | (3,176 | ) | (7,678 | ) | — | (895,670 | ) | |||||||||||||||
Ending balance, December 31, 2018 | $ | 1,462,989 | $ | 323,365 | $ | 15,193 | $ | 14,827 | $ | — | $ | 29,076 | $ | 1,845,450 | ||||||||||||||
Change in net unrealized (depreciation) appreciation on investments still held as of December 31, 2018(1) | $ | (34,996 | ) | $ | (14,160 | ) | $ | 295 | $ | (1,086 | ) | $ | — | $ | (1,111 | ) | $ | (51,058 | ) | |||||||||
(1) | Included in net change in unrealized (depreciation) appreciation on investments in the consolidated statements of operations. |
115
CĪON Investment Corporation
Notes to Consolidated Financial Statements
December 31, 2019
(in thousands, except share and per share amounts)
Significant Unobservable Inputs
The valuation techniques and significant unobservable inputs used in recurring Level 3 fair value measurements of investments as of December 31, 2019 and 2018 were as follows:
December 31, 2019 | ||||||||||||||||
Fair Value | Valuation Techniques/ Methodologies | Unobservable Inputs | Range | Weighted Average(1) | ||||||||||||
Senior secured first lien debt | $ | 1,115,676 | Discounted Cash Flow | Discount Rates | 5.0% | - | 24.7% | 10.0% | ||||||||
225,310 | Broker Quotes | Broker Quotes | N/A | N/A | ||||||||||||
7,591 | Market Comparable Approach | EBITDA Multiple | 5.25x | - | 9.00x | 7.49x | ||||||||||
3,190 | Other(2) | Other(2) | N/A | N/A | ||||||||||||
Senior secured second lien debt | 139,363 | Discounted Cash Flow | Discount Rates | 9.0% | - | 14.9% | 11.0% | |||||||||
107,816 | Broker Quotes | Broker Quotes | N/A | N/A | ||||||||||||
1,074 | Market Comparable Approach | EBITDA Multiple | 5.25x | - | 7.55x | 7.55x | ||||||||||
Collateralized securities and structured products - debt | 7,212 | Other(2) | Other(2) | N/A | N/A | |||||||||||
Collateralized securities and structured products - equity | 11,274 | Discounted Cash Flow | Discount Rates | 12.5% | - | 16.0% | 13.0% | |||||||||
2,908 | Other(2) | Other(2) | N/A | N/A | ||||||||||||
Unsecured debt | 4,900 | Discounted Cash Flow | Discount Rates | 15.5% | N/A | |||||||||||
Equity | 33,230 | Market Comparable Approach | EBITDA Multiple | 4.50x | - | 13.00x | 7.18x | |||||||||
9,456 | Revenue Multiple | 0.30x | - | 3.50x | 0.77x | |||||||||||
13,270 | Discounted Cash Flow | Discount Rates | 21.6% | N/A | ||||||||||||
914 | Broker Quotes | Broker Quotes | N/A | N/A | ||||||||||||
16 | Options Pricing Model | Expected Volatility | 60.0% | - | 92.0% | 61.7% | ||||||||||
Total | $ | 1,683,200 | ||||||||||||||
(1) | Weighted average amounts are based on the estimated fair values. |
(2) | Fair value based on expected outcome of proposed corporate transactions and/or other factors. |
116
CĪON Investment Corporation
Notes to Consolidated Financial Statements
December 31, 2019
(in thousands, except share and per share amounts)
December 31, 2018 | ||||||||||||||||
Fair Value | Valuation Techniques/ Methodologies | Unobservable Inputs | Range | Weighted Average(1) | ||||||||||||
Senior secured first lien debt | $ | 959,417 | Discounted Cash Flow | Discount Rates | 3.0% | - | 32.5% | 10.6% | ||||||||
497,641 | Broker Quotes | Broker Quotes | N/A | N/A | ||||||||||||
2,270 | Market Comparable Approach | EBITDA Multiple | 4.00x | - | 5.00x | 4.00x | ||||||||||
1,298 | Revenue Multiple | 0.15x | - | 0.20x | 0.18x | |||||||||||
2,363 | Other(2) | Other(2) | N/A | N/A | ||||||||||||
Senior secured second lien debt | 170,578 | Discounted Cash Flow | Discount Rates | 9.6% | - | 25.7% | 11.9% | |||||||||
145,734 | Broker Quotes | Broker Quotes | N/A | N/A | ||||||||||||
7,053 | Market Comparable Approach | EBITDA Multiple | 8.25x | - | 9.25x | 8.79x | ||||||||||
Collateralized securities and structured products - debt | 15,193 | Discounted Cash Flow | Discount Rates | 11.0% | N/A | |||||||||||
Collateralized securities and structured products - equity | 14,827 | Discounted Cash Flow | Discount Rates | 13.3% | - | 15.0% | 13.9% | |||||||||
Equity | 24,077 | Market Comparable Approach | EBITDA Multiple | 4.00x | - | 10.00x | 7.96x | |||||||||
3,236 | Revenue Multiple | 0.15x | 1.25x | 1.00x | ||||||||||||
1,461 | Broker Quotes | Broker Quotes | N/A | N/A | ||||||||||||
302 | Options Pricing Model | Expected Volatility | 33.0% | - | 110.7% | 56.7% | ||||||||||
Total | $ | 1,845,450 | ||||||||||||||
(1) | Weighted average amounts are based on the estimated fair values. |
(2) | Fair value based on expected outcome of proposed corporate transactions and/or other factors. |
The significant unobservable inputs used in the fair value measurement of the Company’s senior secured first lien debt, senior secured second lien debt, collateralized securities and structured products, unsecured debt and equity are discount rates, EBITDA multiples, revenue multiples, broker quotes and expected volatility. A significant increase or decrease in discount rates would result in a significantly lower or higher fair value measurement, respectively. A significant increase or decrease in the EBITDA multiples, revenue multiples, expected proceeds from proposed corporate transactions, broker quotes and expected volatility would result in a significantly higher or lower fair value measurement, respectively.
Note 11. General and Administrative Expense
General and administrative expense consisted of the following items for the years ended December 31, 2019, 2018 and 2017:
Years Ended December 31, | ||||||||||||
2019 | 2018 | 2017 | ||||||||||
Transfer agent expense | $ | 1,289 | $ | 1,315 | $ | 1,284 | ||||||
Professional fees | 996 | 1,480 | 1,182 | |||||||||
Valuation expense | 722 | 762 | 1,238 | |||||||||
Accounting and administrative costs | 567 | 637 | 590 | |||||||||
Director fees and expenses | 472 | 444 | 438 | |||||||||
Insurance expense | 421 | 408 | 411 | |||||||||
Dues and subscriptions | 343 | 667 | 837 | |||||||||
Printing and marketing expense | 102 | 273 | 374 | |||||||||
Due diligence fees | 61 | 182 | 165 | |||||||||
Other expenses | 84 | 282 | 597 | |||||||||
Total general and administrative expense | $ | 5,057 | $ | 6,450 | $ | 7,116 | ||||||
117
CĪON Investment Corporation
Notes to Consolidated Financial Statements
December 31, 2019
(in thousands, except share and per share amounts)
Note 12. Commitments and Contingencies
The Company entered into certain contracts with related and other parties that contain a variety of indemnifications. The Company’s maximum exposure under these arrangements is unknown. However, the Company has not experienced claims or losses pursuant to these contracts and believes the risk of loss related to such indemnifications to be remote.
As of December 31, 2019 and 2018, the Company’s unfunded commitments were as follows:
Unfunded Commitments | December 31, 2019(1) | December 31, 2018(1) | ||||||
Palmetto Solar, LLC | $ | 19,142 | $ | — | ||||
Mimeo.com, Inc. | 11,500 | 13,000 | ||||||
Volta Charging, LLC | 10,000 | — | ||||||
Independent Pet Partners Intermediate Holdings, LLC | 7,852 | — | ||||||
Manna Pro Products, LLC | 5,528 | — | ||||||
Foundation Consumer Healthcare, LLC | 4,211 | 4,211 | ||||||
Lift Brands, Inc. | 3,950 | 4,150 | ||||||
CircusTrix Holdings, LLC | 2,892 | 5,573 | ||||||
Instant Web, LLC | 2,704 | 2,704 | ||||||
Echo US Holdings, LLC | 2,586 | — | ||||||
Moss Holding Company | 2,232 | 2,232 | ||||||
Adapt Laser Acquisition, Inc. | 2,000 | 1,500 | ||||||
Extreme Reach, Inc. | 1,744 | — | ||||||
Adams Publishing Group, LLC | 1,600 | 2,069 | ||||||
Anthem Sports & Entertainment Inc. | 1,333 | — | ||||||
Teladoc, Inc. | 1,250 | 1,250 | ||||||
AMCP Staffing Intermediate Holdings III, LLC | 1,059 | — | ||||||
LAV Gear Holdings, Inc. | 864 | — | ||||||
BCP Great Lakes Fund LP | 792 | — | ||||||
Country Fresh Holdings, LLC | 327 | — | ||||||
American Media, Inc. | 128 | 1,778 | ||||||
TherapeuticsMD, Inc. | — | 25,000 | ||||||
DFC Global Facility Borrower II LLC | — | 5,317 | ||||||
Ministry Brands, LLC | — | 2,924 | ||||||
Elemica, Inc. | — | 2,500 | ||||||
Charming Charlie, LLC | — | 1,938 | ||||||
Ivy Hill Middle Market Credit Fund VIII, Ltd. | — | 1,111 | ||||||
Woodstream Corp. | — | 559 | ||||||
OTG Management, LLC | — | 514 | ||||||
Studio Movie Grill Holdings, LLC | — | 468 | ||||||
PDI TA Holdings, Inc. | — | 237 | ||||||
Achilles Acquisition, LLC | — | 43 | ||||||
Total | $ | 83,694 | $ | 79,078 | ||||
(1) | Unless otherwise noted, the funding criteria for these unfunded commitments had not been met at the date indicated. |
118
CĪON Investment Corporation
Notes to Consolidated Financial Statements
December 31, 2019
(in thousands, except share and per share amounts)
Unfunded commitments to provide funds to companies are not recorded on the Company’s consolidated balance sheets. Since these commitments may expire without being drawn upon, unfunded commitments do not necessarily represent future cash requirements or future earning assets for the Company. The Company intends to use cash on hand, short term investments, proceeds from borrowings, and other liquid assets to fund these commitments should the need arise. For information on the companies to which the Company is committed to fund additional amounts as of December 31, 2019 and 2018, refer to the table above and the consolidated schedules of investments. As of March 12, 2020, the Company was committed, upon the satisfaction of certain conditions, to fund an additional $86,387.
The Company will fund its unfunded commitments from the same sources it uses to fund its investment commitments that are funded at the time they are made (i.e., advances from its financing arrangements and/or cash flows from operations). The Company will not fund its unfunded commitments from future net proceeds generated by securities offerings, if any. The Company follows a process to manage its liquidity and ensure that it has available capital to fund its unfunded commitments. Specifically, the Company prepares detailed analyses of the level of its unfunded commitments relative to its then available liquidity on a daily basis. These analyses are reviewed and discussed on a weekly basis by the Company's executive officers and senior members of CIM (including members of the investment committee) and are updated on a “real time” basis in order to ensure that the Company has adequate liquidity to satisfy its unfunded commitments.
Note 13. Fee Income
Fee income consists of commitment fees, amendment fees, capital structuring fees and administrative agent fees. The following table summarizes the Company’s fee income for the years ended December 31, 2019, 2018 and 2017:
Years Ended December 31, | |||||||||||
2019 | 2018 | 2017 | |||||||||
Amendment fees | $ | 2,033 | $ | 984 | $ | 5,997 | |||||
Capital structuring and other fees | 1,731 | 280 | — | ||||||||
Commitment fees | 80 | 1,157 | 931 | ||||||||
Administrative agent fees | 55 | 55 | — | ||||||||
Total | $ | 3,899 | $ | 2,476 | $ | 6,928 | |||||
Administrative agent fees are recurring income as long as the Company remains the administrative agent for the related investment. Income from all other fees was non-recurring.
119
CĪON Investment Corporation
Notes to Consolidated Financial Statements
December 31, 2019
(in thousands, except share and per share amounts)
Note 14. Financial Highlights
The following is a schedule of financial highlights as of and for the years ended December 31, 2019, 2018, 2017, 2016 and 2015:
Years Ended December 31, | ||||||||||||||||||||
2019 | 2018 | 2017 | 2016 | 2015 | ||||||||||||||||
Per share data:(1) | ||||||||||||||||||||
Net asset value at beginning of period | $ | 8.69 | $ | 9.14 | $ | 9.11 | $ | 8.71 | $ | 9.22 | ||||||||||
Results of operations: | ||||||||||||||||||||
Net investment income(2) | 0.77 | 0.79 | 0.78 | 0.47 | 0.32 | |||||||||||||||
Net realized (loss) gain and net change in unrealized (depreciation) appreciation on investments and (loss) gain on foreign currency(3) | (0.31 | ) | (0.51 | ) | (0.03 | ) | 0.21 | (0.17 | ) | |||||||||||
Net realized gain and net change in unrealized appreciation on total return swap | — | — | 0.01 | 0.45 | — | |||||||||||||||
Net increase in net assets resulting from operations(3) | 0.46 | 0.28 | 0.76 | 1.13 | 0.15 | |||||||||||||||
Shareholder distributions: | ||||||||||||||||||||
Distributions from net investment income | (0.75 | ) | (0.73 | ) | (0.68 | ) | (0.45 | ) | (0.32 | ) | ||||||||||
Distributions from net realized gains | — | — | (0.05 | ) | (0.28 | ) | (0.40 | ) | ||||||||||||
Distributions in excess of net investment income(4) | — | — | — | — | (0.01 | ) | ||||||||||||||
Net decrease in net assets from shareholders' distributions | (0.75 | ) | (0.73 | ) | (0.73 | ) | (0.73 | ) | (0.73 | ) | ||||||||||
Capital share transactions: | ||||||||||||||||||||
Issuance of common stock above net asset value(5) | — | — | — | — | 0.07 | |||||||||||||||
Repurchases of common stock(6) | — | — | — | — | — | |||||||||||||||
Net increase in net assets resulting from capital share transactions | — | — | — | — | 0.07 | |||||||||||||||
Net asset value at end of period | $ | 8.40 | $ | 8.69 | $ | 9.14 | $ | 9.11 | $ | 8.71 | ||||||||||
Shares of common stock outstanding at end of period | 113,381,145 | 112,709,239 | 115,781,751 | 109,787,557 | 103,814,361 | |||||||||||||||
Total investment return-net asset value(7) | 5.55 | % | 2.98 | % | 8.76 | % | 13.51 | % | 2.13 | % | ||||||||||
Net assets at beginning of period | $ | 979,271 | $ | 1,058,691 | $ | 999,763 | $ | 904,326 | $ | 496,389 | ||||||||||
Net assets at end of period | $ | 952,563 | $ | 979,271 | $ | 1,058,691 | $ | 999,763 | $ | 904,326 | ||||||||||
Average net assets | $ | 967,323 | $ | 1,035,861 | $ | 1,026,998 | $ | 936,739 | $ | 719,358 | ||||||||||
Ratio/Supplemental data: | ||||||||||||||||||||
Ratio of net investment income to average net assets(8) | 9.03 | % | 8.71 | % | 8.50 | % | 5.27 | % | 3.46 | % | ||||||||||
Ratio of gross operating expenses to average net assets(9) | 11.76 | % | 9.46 | % | 6.34 | % | 3.51 | % | 3.90 | % | ||||||||||
Ratio of expenses (before expense support from CIG and recoupment of expense support) to average net assets(10) | 11.76 | % | 9.46 | % | 6.34 | % | 3.44 | % | 3.25 | % | ||||||||||
Ratio of net expense recoupments to average net assets(11) | — | — | — | 0.07 | % | 0.65 | % | |||||||||||||
Ratio of net operating expenses to average net assets | 11.76 | % | 9.46 | % | 6.34 | % | 3.51 | % | 3.90 | % | ||||||||||
Portfolio turnover rate(12) | 31.59 | % | 52.46 | % | 68.07 | % | 29.78 | % | 20.94 | % | ||||||||||
Asset coverage ratio(13) | 2.13 | 2.09 | 2.49 | 3.04 | 2.84 | |||||||||||||||
(1) | The per share data for the years ended December 31, 2019, 2018, 2017, 2016 and 2015 was derived by using the weighted average shares of common stock outstanding during each period. |
(2) | Net investment income per share includes expense support recoupments by CIG of $0.01 and $0.06 per share for the years ended December 31, 2016 and 2015, respectively. There was no expense support recoupments by CIG for the years ended December 31, 2019, 2018 or 2017. |
120
CĪON Investment Corporation
Notes to Consolidated Financial Statements
December 31, 2019
(in thousands, except share and per share amounts)
(3) | The amount shown for net realized (loss) gain and net change in unrealized (depreciation) appreciation on investments is the balancing figure derived from the other figures in the schedule. The amount shown at this caption for a share outstanding throughout the period may not agree with the change in the aggregate gains and losses in portfolio securities for the period because of the timing of sales and repurchases of the Company’s shares in relation to fluctuating market values for the portfolio. As a result, net increase in net assets resulting from operations in this schedule may vary from the consolidated statements of operations. |
(4) | Distributions in excess of net investment income represent certain expenses, which are not deductible on a tax-basis. Certain offering expenses reduce GAAP basis net investment income, but do not reduce tax basis net investment income. These tax-related adjustments represent additional net investment income available for distribution for tax purposes. |
(5) | The continuous issuance of shares of common stock may have caused an incremental increase in net asset value per share due to the sale of shares at the then prevailing public offering price and the receipt of net proceeds per share by the Company in excess of net asset value per share on each subscription closing date. The per share impact of the continuous issuance of shares of common stock was an increase to net asset value of less than $0.01 per share during the years ended December 31, 2019, 2018, 2017 and 2016. |
(6) | Repurchases of common stock may cause an incremental decrease in net asset value per share due to the repurchase of shares at a price in excess of net asset value per share on each repurchase date. The per share impact of repurchases of common stock was a decrease to net asset value of less than $0.01 per share during the years ended December 31, 2019, 2018, 2017, 2016 and 2015. |
(7) | Total investment return-net asset value is a measure of the change in total value for shareholders who held the Company’s common stock at the beginning and end of the period, including distributions paid or payable during the period. Total investment return-net asset value is based on (i) the beginning period net asset value per share on the first day of the period, (ii) the net asset value per share on the last day of the period of (A) one share plus (B) any fractional shares issued in connection with the reinvestment of monthly distributions, and (iii) the value of distributions payable, if any, on the last day of the period. The total investment return-net asset value calculation assumes that monthly cash distributions are reinvested in accordance with the Company's distribution reinvestment plan then in effect as described in Note 5. The total investment return-net asset value does not consider the effect of the sales load from the sale of the Company’s common stock. The total investment return-net asset value includes the effect of the issuance of shares at a net offering price that is greater than net asset value per share, which causes an increase in net asset value per share. Total returns covering less than a full year are not annualized. |
(8) | Excluding the impact of expense support from CIG and/or the recoupment of expense support by CIG during the period, the ratio of net investment income to average net assets would have been 5.34% and 4.11% for the years ended December 31, 2016 and 2015, respectively. |
(9) | Ratio of gross operating expenses to average net assets does not include expense support provided by CIM or CIG and/or AIM, if any. |
(10) | The ratio of gross expense recoupments by CIG to average net assets for the years ended December 31, 2016 and 2015 was 0.07% and 0.65%, respectively. |
(11) | In order to record an obligation to reimburse CIM for expense support provided, the ratio of gross operating expenses to average net assets, when considering the recoupment, in the period in which recoupment is sought, cannot exceeded the ratio of gross operating expenses to average net assets for the period when the expense support was provided. For purposes of this calculation, gross operating expenses include all expenses borne by the Company, except for offering and organizational costs, base management fees, incentive fees, administrative services expenses, other general and administrative expenses owed to CIM and its affiliates and interest expense. For the years ended December 31, 2019, 2018, 2017, 2016 and 2015, the ratio of gross operating expenses to average net assets, when considering recoupment of expense support, was 0.52%, 0.57%, 0.63%, 0.59% and 0.63%, respectively. |
(12) | Portfolio turnover rate is calculated using the lesser of year-to-date sales or purchases over the average of the invested assets at fair value, excluding short term investments, and is not annualized. |
(13) | Asset coverage ratio is equal to (i) the sum of (a) net assets at the end of the period and (b) total senior securities outstanding at the end of the period (excluding unfunded commitments), divided by (ii) total senior securities outstanding at the end of the period. For purposes of the asset coverage ratio test applicable to the Company as a BDC, the Company treated the outstanding TRS notional amount at the end of the period, less the total amount of cash collateral posted by Flatiron under the TRS, as well as unfunded commitments, as senior securities. |
Note 15. Income Taxes
It is the Company's policy to comply with all requirements of the Code applicable to RICs and to distribute substantially all of its taxable income to its shareholders. In addition, by distributing during each calendar year substantially all of its net investment income, net realized capital gains and certain other amounts, if any, the Company intends not to be subject to corporate level federal income tax or federal excise taxes. Accordingly, no federal income tax provision was required for the years ended December 31, 2019 or 2018.
Income and capital gain distributions are determined in accordance with the Code and federal tax regulations, which may differ from amounts determined in accordance with GAAP. These book/tax differences, which could be material, are primarily due to differing treatments of income and gains on various investments held by the Company. Permanent book/tax differences result in reclassifications to capital in excess of par value, accumulated undistributed net investment income and accumulated undistributed realized gain on investments.
As of December 31, 2019 and 2018, the Company made the following reclassifications of permanent book and tax basis differences:
Capital Accounts | December 31, 2019 | December 31, 2018 | ||||||
Paid-in-capital in excess of par value | $ | — | $ | (194 | ) | |||
Accumulated losses | — | 194 | ||||||
121
CĪON Investment Corporation
Notes to Consolidated Financial Statements
December 31, 2019
(in thousands, except share and per share amounts)
These permanent differences are primarily due to the reclassification of nondeductible expenses. These reclassifications had no effect on net assets.
The determination of the tax attributes of the Company’s distributions is made annually as of the end of the Company’s fiscal year based upon the Company’s taxable income for the full year and distributions paid for the full year. The tax characteristics of distributions to shareholders are reported to shareholders annually on Form 1099-DIV and were as follows for the years ended December 31, 2019, 2018 and 2017:
Years Ended December 31, | |||||||||||||||||||||
2019 | 2018 | 2017 | |||||||||||||||||||
Amount | Percentage | Amount | Percentage | Amount | Percentage | ||||||||||||||||
Ordinary income(1) | $ | 84,772 | 100.0 | % | $ | 83,483 | 100.0 | % | $ | 81,134 | 98.9 | % | |||||||||
Realized long term capital gains | — | — | — | — | 927 | 1.1 | % | ||||||||||||||
Total | $ | 84,772 | 100.0 | % | $ | 83,483 | 100.0 | % | $ | 82,061 | 100.0 | % | |||||||||
(1) | Includes net short term capital gains and realized gains on total return swap of $9, $3,828 and $5,484 for the years ended December 31, 2019, 2018 and 2017, respectively. |
See Note 5, Distributions, for further information.
As of December 31, 2019 and 2018, the components of accumulated earnings on a tax basis were as follows:
December 31, 2019 | December 31, 2018 | ||||||
Undistributed ordinary income | $ | 2,959 | $ | 7,127 | |||
Other accumulated losses | (1,810 | ) | (2,933 | ) | |||
Undistributed long term capital gains | — | — | |||||
Net unrealized depreciation on investments and total return swap | (103,765 | ) | (73,729 | ) | |||
$ | (102,616 | ) | $ | (69,535 | ) | ||
As of December 31, 2019, the aggregate gross unrealized appreciation for all securities in which there was an excess of value over tax cost was $24,416; the aggregate gross unrealized depreciation for all securities in which there was an excess of tax cost over value was $128,181; the net unrealized depreciation was $103,765; and the aggregate cost of securities for Federal income tax purposes was $1,868,837.
As of December 31, 2018, the aggregate gross unrealized appreciation for all securities in which there was an excess of value over tax cost was $11,059; the aggregate gross unrealized depreciation for all securities in which there was an excess of tax cost over value was $84,788; the net unrealized depreciation was $73,729; and the aggregate cost of securities for Federal income tax purposes was $1,939,039.
122
CĪON Investment Corporation
Notes to Consolidated Financial Statements
December 31, 2019
(in thousands, except share and per share amounts)
Note 16. Selected Quarterly Financial Data (unaudited)
The following is the selected quarterly financial data as of and for the years ended December 31, 2019 and 2018. The following information reflects all adjustments, which are of a normal recurring nature, considered necessary for a fair presentation. The operating results for any quarter are not necessarily indicative of results for any future period:
Quarter Ended | March 31, 2019 | June 30, 2019 | September 30, 2019 | December 31, 2019 | ||||||||||||
Investment income | $ | 51,171 | $ | 49,519 | $ | 49,775 | $ | 50,638 | ||||||||
Net investment income | 21,539 | 21,661 | 21,662 | 22,450 | ||||||||||||
Net realized and unrealized (loss) gain on investments and foreign currency | (5,123 | ) | (13,514 | ) | (23,884 | ) | 7,053 | |||||||||
Net increase (decrease) in net assets resulting from operations | 16,416 | 8,147 | (2,222 | ) | 29,503 | |||||||||||
Net increase (decrease) in net assets resulting from operations per share of common stock(1) | 0.14 | 0.07 | (0.02 | ) | 0.26 | |||||||||||
Net asset value per share of common stock at end of quarter | 8.65 | 8.54 | 8.34 | 8.40 | ||||||||||||
Weighted average shares of common stock outstanding | 113,624,760 | 113,747,617 | 113,729,902 | 113,730,464 | ||||||||||||
Quarter Ended | March 31, 2018 | June 30, 2018 | September 30, 2018 | December 31, 2018 | ||||||||||||
Investment income | $ | 41,162 | $ | 43,623 | $ | 54,417 | $ | 48,936 | ||||||||
Net investment income | 21,862 | 22,035 | 24,872 | 21,048 | ||||||||||||
Net realized and unrealized loss on investments and foreign currency | (2,129 | ) | (4,017 | ) | (9,515 | ) | (43,206 | ) | ||||||||
Net increase (decrease) in net assets resulting from operations | 19,733 | 18,018 | 15,357 | (21,798 | ) | |||||||||||
Net increase (decrease) in net assets resulting from operations per share of common stock(1) | 0.17 | 0.16 | 0.14 | (0.19 | ) | |||||||||||
Net asset value per share of common stock at end of quarter | 9.13 | 9.11 | 9.06 | 8.69 | ||||||||||||
Weighted average shares of common stock outstanding | 114,849,958 | 114,830,847 | 113,490,567 | 113,230,595 | ||||||||||||
(1) | The sum of the quarterly amounts do not necessarily equal amounts reported for the years ended December 31, 2019 and 2018. This is due to changes in the number of weighted-average shares outstanding and the effects of rounding for each period. |
123
Item 9. Changes in and Disagreements With Accountants on Accounting and Financial Disclosure
None.
Item 9A. Controls and Procedures
Evaluation of disclosure controls and procedures
In connection with the preparation of this Annual Report on Form 10-K for the year ended December 31, 2019, we carried out an evaluation, under the supervision and with the participation of our management, including our Co-Chief Executive Officers and our Chief Financial Officer, of the effectiveness of the design and operation of our disclosure controls and procedures as of the end of the period covered by this report pursuant to Rule 13a-15(b) and Rule 15d-15(b) of the Securities Exchange Act of 1934, as amended. Based on the foregoing evaluation, the Co-Chief Executive Officers and the Chief Financial Officer concluded that our disclosure controls and procedures were effective.
In designing and evaluating our disclosure controls and procedures, we recognized that disclosure controls and procedures, no matter how well conceived and operated, can provide only reasonable, not absolute, assurance that the objectives of the disclosure controls and procedures are met. Our disclosure controls and procedures have been designed to meet reasonable assurance standards. Disclosure controls and procedures cannot detect or prevent all error and fraud. Some inherent limitations in disclosure controls and procedures include costs of implementation, faulty decision-making, simple error and mistake. Additionally, controls can be circumvented by the individual acts of some persons, by collusion of two or more people, or by management override of the controls. The design of any system of controls is based, in part, upon certain assumptions about the likelihood of future events, and there can be no assurance that any design will succeed in achieving its stated goals under all anticipated and unanticipated future conditions. Over time, controls may become inadequate because of changes in conditions, or the degree of compliance with established policies or procedures.
Management's Annual Report on Internal Control Over Financial Reporting
Our management is responsible for establishing and maintaining adequate internal control over financial reporting. As defined in Exchange Act Rules 13a-15(f) and 15d-15(f), internal control over financial reporting is a process designed by, or under the supervision of, our principal executive and principal financial officers, or persons performing similar functions, and effected by our board of directors, management and other personnel, to provide reasonable assurance regarding the reliability of financial reporting and the preparation of consolidated financial statements for external purposes in accordance with GAAP.
Our internal control over financial reporting includes those policies and procedures that:
1. | Pertain to the maintenance of records that, in reasonable detail, accurately and fairly reflect our transactions and our dispositions of assets; |
2. | Provide reasonable assurance that our transactions are recorded as necessary to permit preparation of consolidated financial statements in accordance with generally accepted accounting principles, and that our receipts and expenditures are being made only in accordance with authorizations of our management and board of directors; and |
3. | Provide reasonable assurance regarding prevention or timely detection of unauthorized acquisition, use or disposition of our assets that could have a material effect on the consolidated financial statements. |
Because of its inherent limitations, a system of internal control over financial reporting can provide only reasonable assurance with respect to financial statement preparation and presentation and may not prevent or detect misstatements. Also, projections of any evaluation of effectiveness to future periods are subject to the risk that controls may become inadequate because of changes in conditions, or that the degree of compliance with the policies or procedures may deteriorate.
In connection with the preparation of our annual consolidated financial statements, our management has conducted an assessment of the effectiveness of our internal control over financial reporting based on the framework set forth in Internal Control-Integrated Framework issued by the Committee of Sponsoring Organizations of the Treadway Commission (“COSO”) in 2013. Management's assessment included an evaluation of the design of our internal control over financial reporting and testing of the operational effectiveness of those controls. Based on this evaluation, we have concluded that, as of December 31, 2019, our internal control over financial reporting was effective to provide reasonable assurance regarding the reliability of financial reporting and the preparation of financial statements for external purposes in accordance with GAAP.
Pursuant to rules established by the SEC, this annual report does not include an attestation report of our independent registered public accounting firm regarding internal control over financial reporting.
Changes in internal control over financial reporting
There have been no changes in our internal control over financial reporting during the three months ended December 31, 2019 that have materially affected, or are reasonably likely to materially affect, our internal control over financial reporting.
124
Item 9B. Other Information
Not applicable.
125
PART III
We will file a Definitive Proxy Statement for our 2020 Annual Meeting of Shareholders with the SEC pursuant to Regulation 14A promulgated under the Exchange Act, not later than 120 days after the end of our fiscal year. Accordingly, certain information required by Part III has been omitted under General Instruction G(3) to Form 10-K. Only those sections of our Definitive Proxy Statement that specifically address the items set forth herein are incorporated by reference.
Item 10. Directors, Executive Officers and Corporate Governance
The information required by Item 10 is hereby incorporated by reference from our Definitive Proxy Statement relating to our 2020 Annual Meeting of Shareholders, to be filed with the SEC within 120 days following the end of our fiscal year.
Item 11. Executive Compensation
The information required by Item 11 is hereby incorporated by reference from our Definitive Proxy Statement relating to our 2020 Annual Meeting of Shareholders, to be filed with the SEC within 120 days following the end of our fiscal year.
Item 12. Security Ownership of Certain Beneficial Owners and Management and Related Shareholder Matters
The information required by Item 12 is hereby incorporated by reference from our Definitive Proxy Statement relating to our 2020 Annual Meeting of Shareholders, to be filed with the SEC within 120 days following the end of our fiscal year.
Item 13. Certain Relationships and Related Transactions, and Director Independence
The information required by Item 13 is hereby incorporated by reference from our Definitive Proxy Statement relating to our 2020 Annual Meeting of Shareholders, to be filed with the SEC within 120 days following the end of our fiscal year.
Item 14. Principal Accounting Fees and Services
The information required by Item 14 is hereby incorporated by reference from our Definitive Proxy Statement relating to our 2020 Annual Meeting of Shareholders, to be filed with the SEC within 120 days following the end of our fiscal year.
126
PART IV
Item 15. Exhibits, Financial Statement Schedules
(a) 1. Financial Statements
See the index to consolidated financial statements included as Item 8 to this Annual Report on Form 10-K hereof.
2. Financial Statement Schedules
Schedules not listed above have been omitted because they are not applicable or the information required to be set forth therein is included in the consolidated financial statements or notes thereto.
3. Exhibits
Exhibit Number | Description of Document | |
2.1 | ||
3.1 | ||
3.2 | ||
4.1 | ||
4.2 | ||
4.3 | ||
10.1 | ||
10.2 | ||
10.3 | ||
10.4 | ||
10.5 | ||
10.6 | ||
10.7 | ||
10.8 | ||
127
Exhibit Number | Description of Document | |
10.9 | ||
10.10 | ||
10.11 | ||
10.12 | ||
10.13 | ||
10.14 | ||
10.15 | ||
10.16 | ||
10.17 | ||
10.18 | ||
10.19 | ||
10.20 | ||
10.21 | ||
10.22 | ||
10.23 | ||
10.24 | ||
128
Exhibit Number | Description of Document | |
10.25 | ||
10.26 | ||
10.27 | ||
10.28 | ||
10.29 | ||
31.1 | ||
31.2 | ||
31.3 | ||
32.1 | ||
32.2 | ||
32.3 | ||
129
Item 16. Form 10-K Summary
None.
130
SIGNATURES
Pursuant to the requirements of Section 13 or 15(d) of the Securities Exchange Act of 1934, the registrant has duly caused this report to be signed on its behalf by the undersigned, thereunto duly authorized.
Date: March 16, 2020
CĪON Investment Corporation
(Registrant)
By: /s/ Michael A. Reisner
Michael A. Reisner
Co-Chief Executive Officer
By: /s/ Mark Gatto
Mark Gatto
Co-Chief Executive Officer
Pursuant to the requirements of the Securities Exchange Act of 1934, this report has been signed below by the following persons on behalf of the registrant and in the capacities and on the dates indicated.
Date: March 16, 2020
CĪON Investment Corporation
(Registrant)
By: /s/ Michael A. Reisner
Michael A. Reisner
Co-Chief Executive Officer and Director
(Principal Executive Officer)
By: /s/ Mark Gatto
Mark Gatto
Co-Chief Executive Officer and Director
(Principal Executive Officer)
By: /s/ Keith S. Franz
Keith S. Franz
Chief Financial Officer
(Principal Financial and Accounting Officer)
By: /s/ Robert A. Breakstone
Robert A. Breakstone
Director
By: /s/ Peter I. Finlay
Peter I. Finlay
Director
By: /s/ Aron I. Schwartz
Aron I. Schwartz
Director
By: /s/ Earl V. Hedin
Earl V. Hedin
Director
131