Attached files
| file | filename |
|---|---|
| 8-K - 8-K - CITIZENS & NORTHERN CORP | cznc-20210615x8k.htm |
Exhibit 99.1
| Piper Sandler & Co. Virtual Philly Bank Bonanza June 15, 2021 |

| CAUTION REGARDING FORWARD LOOKING STATEMENTS This presentation contains forward-looking statements within the meaning of the Private Securities Litigation Reform Act of 1995 that relate to future events or the future performance of the Company. Forward-looking statements are not guarantees of performance or results. These forward-looking statements are based on the current beliefs and expectations of the respective management of the Company and are inherently subject to significant business, economic and competitive uncertainties and contingencies, many of which are beyond their respective control and which may be heightened by the novel coronavirus, or COVID-19 pandemic. In addition, these forward-looking statements are subject to assumptions with respect to future business strategies and decisions that are subject to change. Actual results may differ materially from the anticipated results discussed or implied in these forward-looking statements because of numerous possible uncertainties. Words like "may," "plan," "contemplate," "anticipate," "believe," "intend," "continue," "expect," "project," "predict," "estimate," "could," "should," "would," "will," and similar expressions, should be considered as identifying forward-looking statements, although other phrasing may be used. Such forward-looking statements involve risks and uncertainties and may not be realized due to a variety of factors. Additional factors that could cause actual results to differ materially from those expressed in the forward- looking statements are discussed in the reports (such as Annual Reports on Form 10-K and Quarterly Reports on Form 10-Q) filed by the Company with the Securities and Exchange Commission. You should consider such factors and not place undue reliance on such forward-looking statements. No obligation is undertaken by the Company to update such forward-looking statements to reflect events or circumstances occurring after the issuance of this presentation. NON-GAAP FINANCIAL MEASURES Statements included in this presentation include non-GAAP financial measures and should be read along with the accompanying tables under the section titled “Non-GAAP Reconciliations.” The Company uses non-GAAP financial measures to analyze its performance. Management believes that non-GAAP financial measures provide additional useful information that allows readers to evaluate the ongoing performance of the Company and provide meaningful comparison to its peers. Non-GAAP financial measures should not be considered as an alternative to any measure of performance or financial condition as promulgated under GAAP, and investors should consider the Company’s performance and financial condition as reported under GAAP and all other relevant information when assessing the performance or financial condition of the Company. Non-GAAP financial measures have limitations as analytical tools, and investors should not consider them in isolation or as a substitute for analysis of the results or financial condition as reported under GAAP. Legal Disclaimer 2 |
| • Citizens & Northern Corporation (“C&N”) is a bank holding company with assets of approximately $2.3 billion at March 31, 2021. It was founded in 1987 and has been listed on the NASDAQ since 2005. C&N’s principal subsidiary is Citizens & Northern Bank (“C&N Bank”). • Headquartered in Wellsboro, PA, C&N Bank has 29 full service branches. C&N Bank was founded in 1864. • 25 branches in the Northern Tier of PA and Steuben County, NY • 4 branches in Southeastern PA • In 2019, the Company acquired Monument Bancorp, Inc. ($376m assets) • In 2020, the Company acquired Covenant Financial, Inc. ($608m assets) • Commercial and other lending services are provided from dedicated offices in Elmira, NY (Chemung County), and York, PA (York County). • Trust services and investment and insurance products are offered through C&N’s Wealth Management Group. At March 31, 2021, trust assets under management totaled over $1.1 billion. • C&N has a track record of consistently strong earnings performance with diverse revenue sources. • C&N has historically exceeded both regulatory well capitalized minimums and higher internal capital requirements, and the capital plan is projected to continue this trend. • C&N’s common stock trades on the NASDAQ Capital Market Securities under the symbol CZNC. At June 10, 2021, the market capitalization was $398 million. • The closing market price on June 10, 2021 was $24.82, or 11.3X annualized first quarter 2021 earnings and 163% of tangible common book value per share at March 31, 2021. Based on the most recent quarterly dividend of $0.27 per share and the closing market price on June 10, 2021, the annualized dividend yield was 4.35%. C&N Franchise Overview 3 |
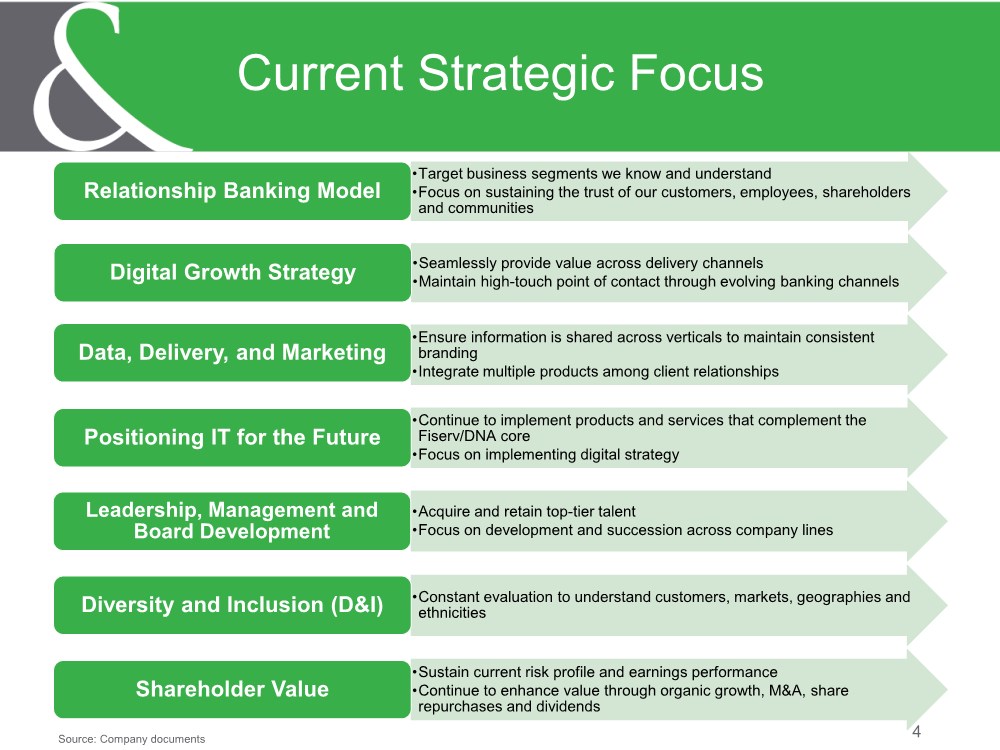
| 4 Current Strategic Focus Source: Company documents •Target business segments we know and understand •Focus on sustaining the trust of our customers, employees, shareholders and communities Relationship Banking Model •Seamlessly provide value across delivery channels •Maintain high-touch point of contact through evolving banking channels Digital Growth Strategy •Ensure information is shared across verticals to maintain consistent branding •Integrate multiple products among client relationships Data, Delivery, and Marketing •Continue to implement products and services that complement the Fiserv/DNA core •Focus on implementing digital strategy Positioning IT for the Future •Acquire and retain top-tier talent •Focus on development and succession across company lines Leadership, Management and Board Development •Constant evaluation to understand customers, markets, geographies and ethnicities Diversity and Inclusion (D&I) •Sustain current risk profile and earnings performance •Continue to enhance value through organic growth, M&A, share repurchases and dividends Shareholder Value |
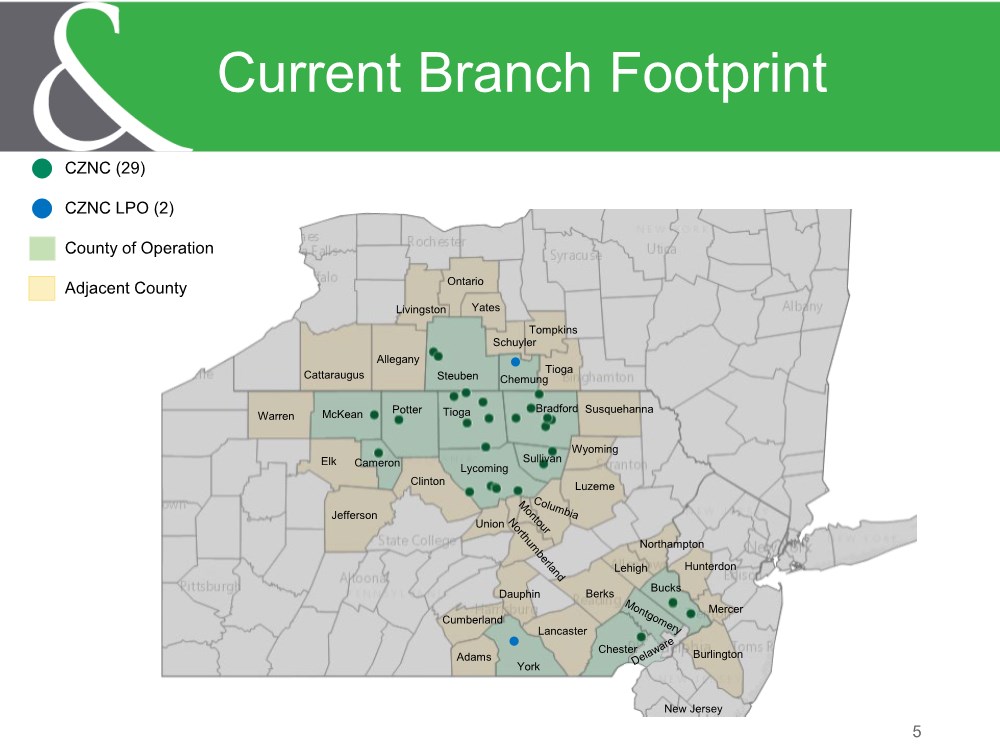
| 5 Current Branch Footprint CZNC (29) CZNC LPO (2) County of Operation Adjacent County Cattaraugus Allegany Steuben Chemung Tompkins Schuyler Yates Ontario Livingston Tioga Susquehanna Wyoming Luzeme Jefferson Elk McKean Potter Tioga Bradford Warren Lycoming Sullivan Clinton Cameron Union Dauphin Cumberland Adams York Lancaster Berks Lehigh Northampton Hunterdon Mercer Burlington Chester Bucks New Jersey |
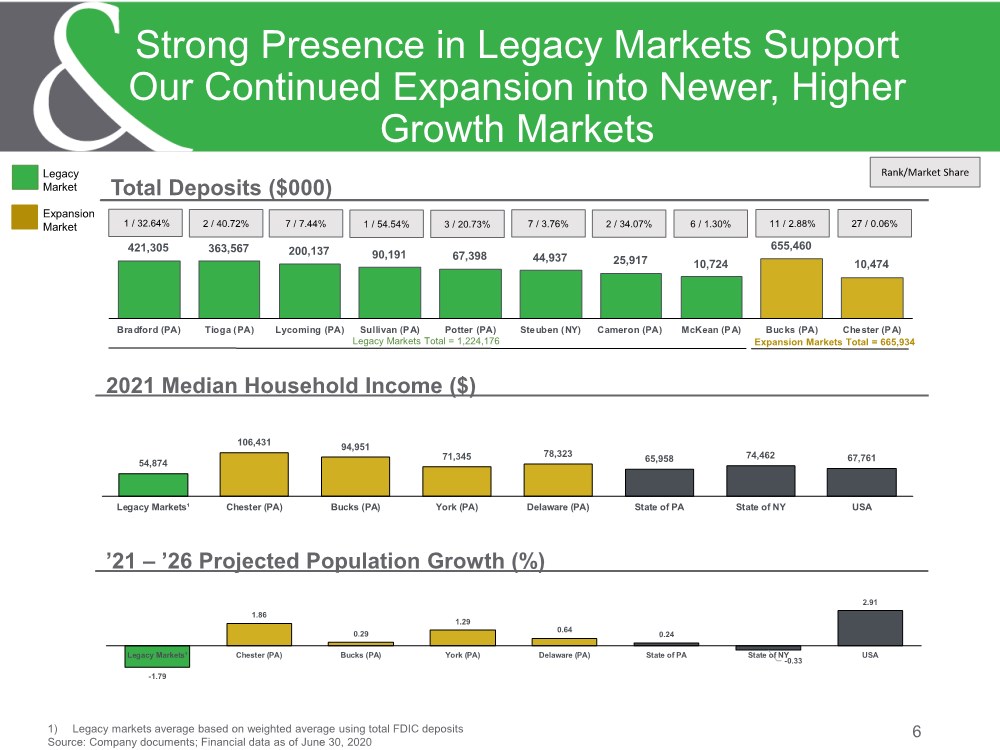
| 1) Legacy markets average based on weighted average using total FDIC deposits Source: Company documents; Financial data as of June 30, 2020 6 Strong Presence in Legacy Markets Support Our Continued Expansion into Newer, Higher Growth Markets Total Deposits ($000) 2021 Median Household Income ($) ’21 – ’26 Projected Population Growth (%) 421,305 363,567 200,137 90,191 67,398 44,937 25,917 10,724 655,460 10,474 Bradford (PA) Tioga (PA) Lycoming (PA) Sullivan (PA) Potter (PA) Steuben (NY) Cameron (PA) McKean (PA) Bucks (PA) Che ster (P A) 54,874 106,431 94,951 71,345 78,323 65,958 74,462 67,761 Legacy Markets¹ Chester (PA) Bucks (PA) York (PA) Delaware (PA) State of PA State of NY USA Rank/Market Share 1 / 32.64% 2 / 40.72% 7 / 7.44% 1 / 54.54% 3 / 20.73% 7 / 3.76% 2 / 34.07% 6 / 1.30% 27 / 0.06% Legacy Market Expansion Market Expansion Markets Total = 665,934 Legacy Markets Total = 1,224,176 -1.79 1.86 0.29 1.29 0.64 0.24 -0.33 2.91 Legacy Markets¹ Chester (PA) Bucks (PA) York (PA) Delaware (PA) State of PA State of NY USA 11 / 2.88% |
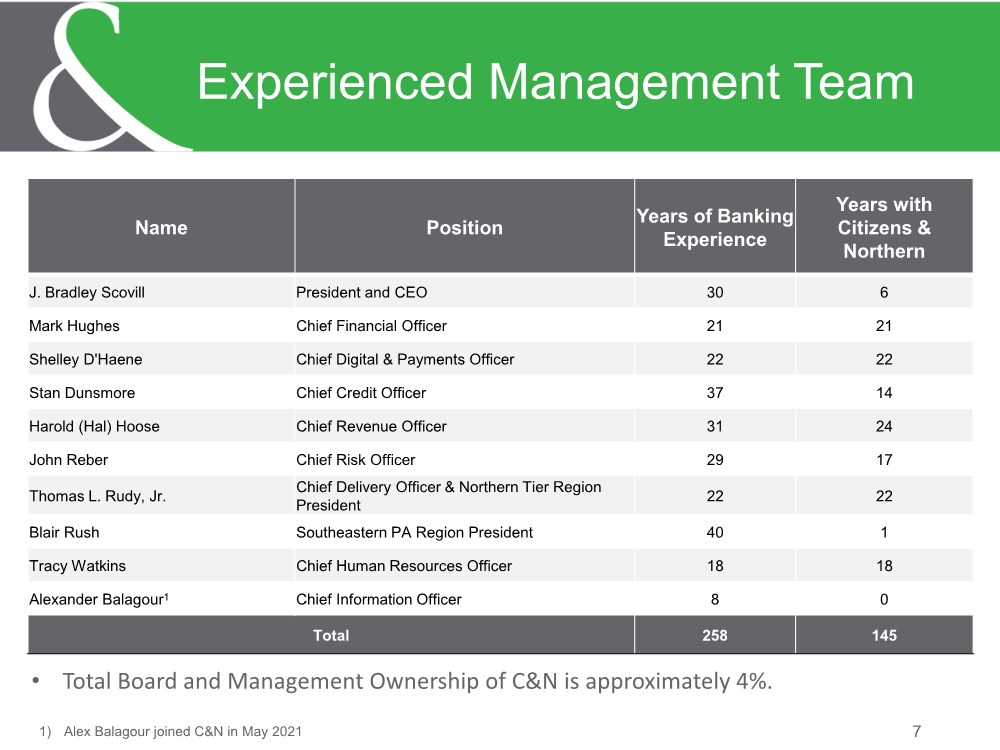
| 7 Experienced Management Team Name Position Years of Banking Experience Years with Citizens & Northern J. Bradley Scovill President and CEO 30 6 Mark Hughes Chief Financial Officer 21 21 Shelley D'Haene Chief Digital & Payments Officer 22 22 Stan Dunsmore Chief Credit Officer 37 14 Harold (Hal) Hoose Chief Revenue Officer 31 24 John Reber Chief Risk Officer 29 17 Thomas L. Rudy, Jr. Chief Delivery Officer & Northern Tier Region President 22 22 Blair Rush Southeastern PA Region President 40 1 Tracy Watkins Chief Human Resources Officer 18 18 Alexander Balagour1 Chief Information Officer 8 0 Total 258 145 1) Alex Balagour joined C&N in May 2021 • Total Board and Management Ownership of C&N is approximately 4%. |
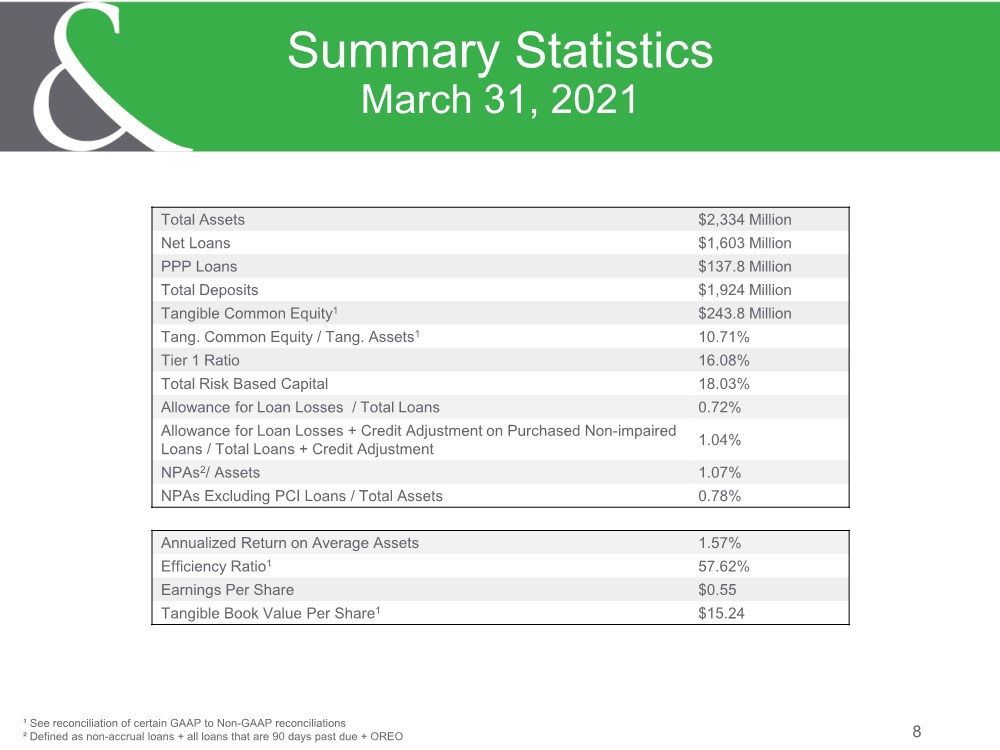
| 8 Summary Statistics March 31, 2021 Total Assets $2,334 Million Net Loans $1,603 Million PPP Loans $137.8 Million Total Deposits $1,924 Million Tangible Common Equity1 $243.8 Million Tang. Common Equity / Tang. Assets1 10.71% Tier 1 Ratio 16.08% Total Risk Based Capital 18.03% Allowance for Loan Losses / Total Loans 0.72% Allowance for Loan Losses + Credit Adjustment on Purchased Non-impaired Loans / Total Loans + Credit Adjustment 1.04% NPAs2/ Assets 1.07% NPAs Excluding PCI Loans / Total Assets 0.78% Annualized Return on Average Assets 1.57% Efficiency Ratio1 57.62% Earnings Per Share $0.55 Tangible Book Value Per Share1 $15.24 ¹ See reconciliation of certain GAAP to Non-GAAP reconciliations ² Defined as non-accrual loans + all loans that are 90 days past due + OREO |
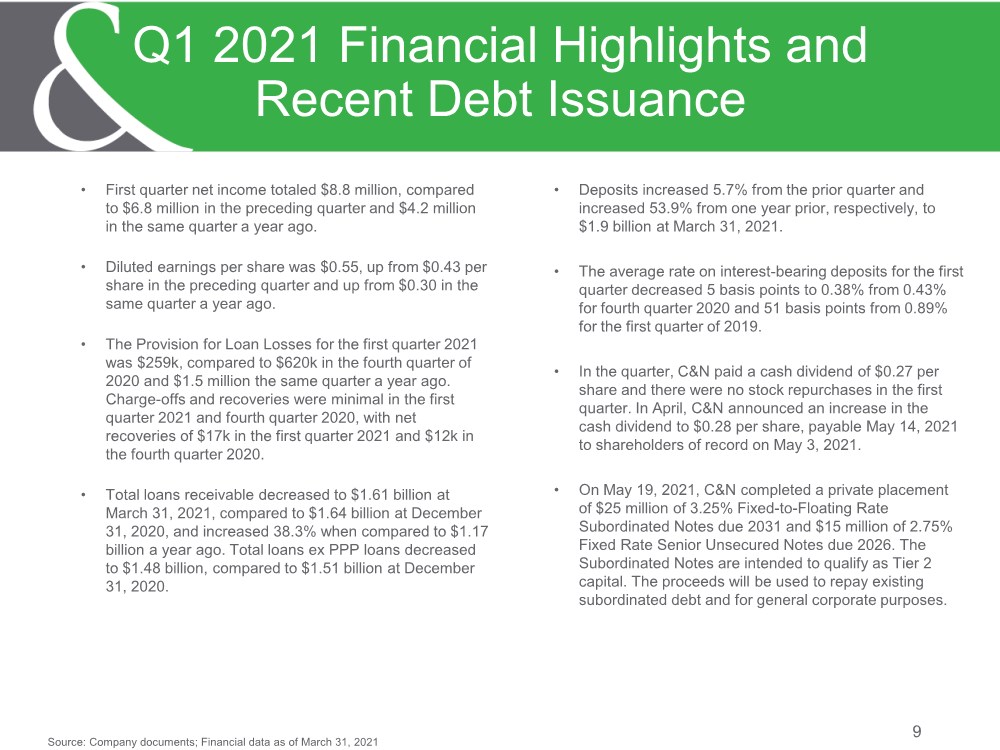
| • First quarter net income totaled $8.8 million, compared to $6.8 million in the preceding quarter and $4.2 million in the same quarter a year ago. • Diluted earnings per share was $0.55, up from $0.43 per share in the preceding quarter and up from $0.30 in the same quarter a year ago. • The Provision for Loan Losses for the first quarter 2021 was $259k, compared to $620k in the fourth quarter of 2020 and $1.5 million the same quarter a year ago. Charge-offs and recoveries were minimal in the first quarter 2021 and fourth quarter 2020, with net recoveries of $17k in the first quarter 2021 and $12k in the fourth quarter 2020. • Total loans receivable decreased to $1.61 billion at March 31, 2021, compared to $1.64 billion at December 31, 2020, and increased 38.3% when compared to $1.17 billion a year ago. Total loans ex PPP loans decreased to $1.48 billion, compared to $1.51 billion at December 31, 2020. 9 Q1 2021 Financial Highlights and Recent Debt Issuance • Deposits increased 5.7% from the prior quarter and increased 53.9% from one year prior, respectively, to $1.9 billion at March 31, 2021. • The average rate on interest-bearing deposits for the first quarter decreased 5 basis points to 0.38% from 0.43% for fourth quarter 2020 and 51 basis points from 0.89% for the first quarter of 2019. • In the quarter, C&N paid a cash dividend of $0.27 per share and there were no stock repurchases in the first quarter. In April, C&N announced an increase in the cash dividend to $0.28 per share, payable May 14, 2021 to shareholders of record on May 3, 2021. • On May 19, 2021, C&N completed a private placement of $25 million of 3.25% Fixed-to-Floating Rate Subordinated Notes due 2031 and $15 million of 2.75% Fixed Rate Senior Unsecured Notes due 2026. The Subordinated Notes are intended to qualify as Tier 2 capital. The proceeds will be used to repay existing subordinated debt and for general corporate purposes. Source: Company documents; Financial data as of March 31, 2021 |
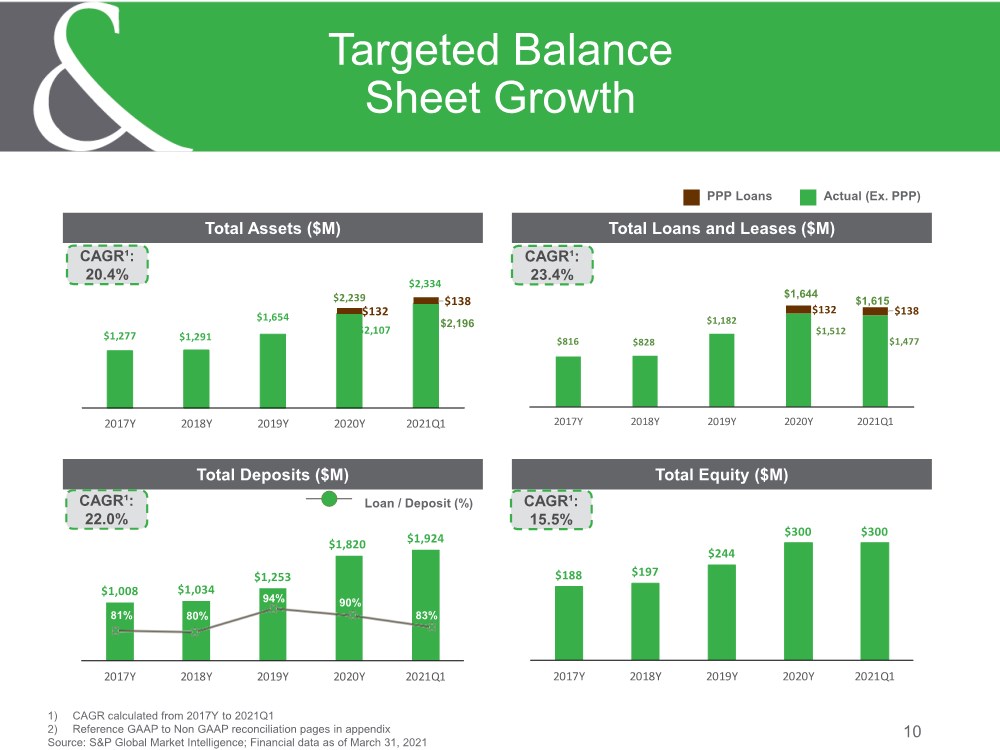
| 10 Targeted Balance Sheet Growth Total Assets ($M) Total Deposits ($M) Total Loans and Leases ($M) Total Equity ($M) $816 $828 $1,182 $1,512 $1,477 $132 $138 2017Y 2018Y 2019Y 2020Y 2021Q1 $1,277 $1,291 $1,654 $2,107 $2,334 $132 $138 $2,239 2017Y 2018Y 2019Y 2020Y 2021Q1 $1,008 $1,034 $1,253 $1,820 $1,924 2017Y 2018Y 2019Y 2020Y 2021Q1 $188 $197 $244 $300 $300 2017Y 2018Y 2019Y 2020Y 2021Q1 CAGR¹: 20.4% CAGR¹: 22.0% Loan / Deposit (%) Actual (Ex. PPP) PPP Loans 1) CAGR calculated from 2017Y to 2021Q1 2) Reference GAAP to Non GAAP reconciliation pages in appendix Source: S&P Global Market Intelligence; Financial data as of March 31, 2021 90% 94% 80% 81% CAGR¹: 23.4% $1,644 $1,615 83% $2,196 CAGR¹: 15.5% |
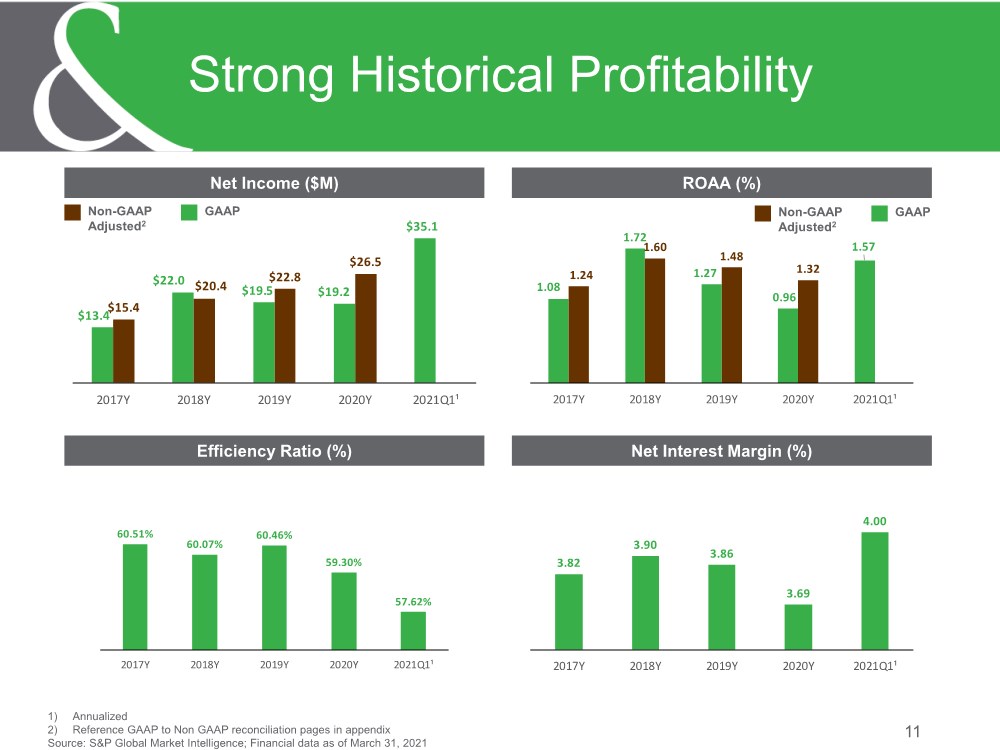
| 3.82 3.90 3.86 3.69 4.00 2017Y 2018Y 2019Y 2020Y 2021Q1¹ 60.51% 60.07% 60.46% 59.30% 57.62% 2017Y 2018Y 2019Y 2020Y 2021Q1¹ 1.08 1.72 1.27 0.96 1.57 1.24 1.60 1.48 1.32 2017Y 2018Y 2019Y 2020Y 2021Q1¹ $13.4 $22.0 $19.5 $19.2 $35.1 $15.4 $20.4 $22.8 $26.5 2017Y 2018Y 2019Y 2020Y 2021Q1¹ 11 Strong Historical Profitability Net Income ($M) Efficiency Ratio (%) ROAA (%) Net Interest Margin (%) 1) Annualized 2) Reference GAAP to Non GAAP reconciliation pages in appendix Source: S&P Global Market Intelligence; Financial data as of March 31, 2021 GAAP Non-GAAP Adjusted2 GAAP Non-GAAP Adjusted2 |
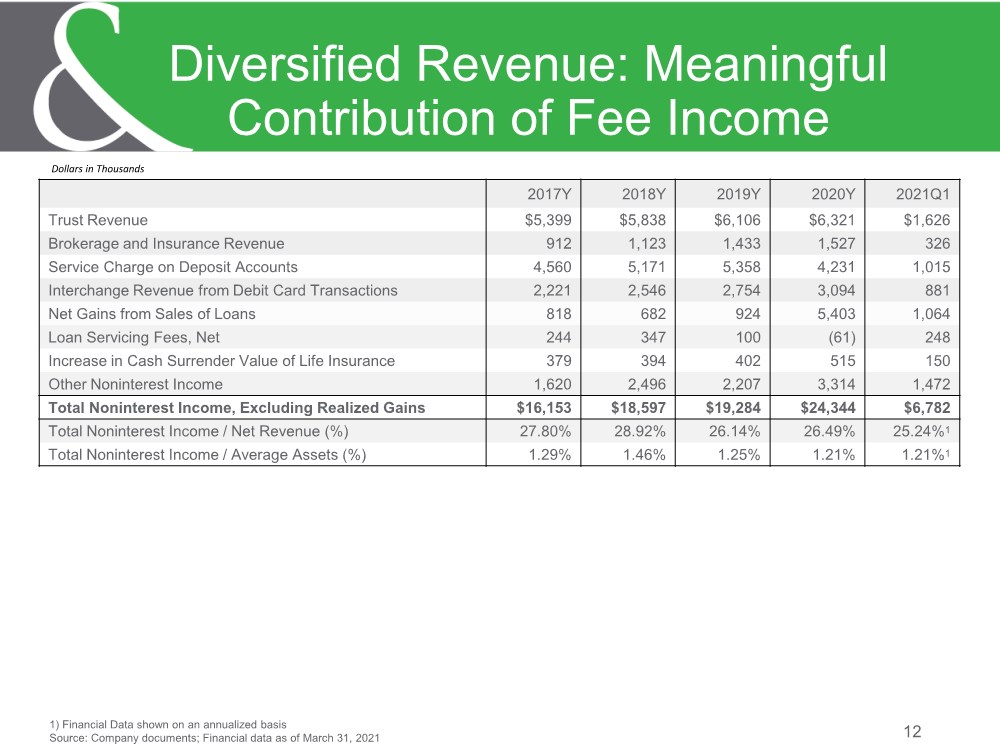
| 12 Diversified Revenue: Meaningful Contribution of Fee Income 1) Financial Data shown on an annualized basis Source: Company documents; Financial data as of March 31, 2021 2017Y 2018Y 2019Y 2020Y 2021Q1 Trust Revenue $5,399 $5,838 $6,106 $6,321 $1,626 Brokerage and Insurance Revenue 912 1,123 1,433 1,527 326 Service Charge on Deposit Accounts 4,560 5,171 5,358 4,231 1,015 Interchange Revenue from Debit Card Transactions 2,221 2,546 2,754 3,094 881 Net Gains from Sales of Loans 818 682 924 5,403 1,064 Loan Servicing Fees, Net 244 347 100 (61) 248 Increase in Cash Surrender Value of Life Insurance 379 394 402 515 150 Other Noninterest Income 1,620 2,496 2,207 3,314 1,472 Total Noninterest Income, Excluding Realized Gains $16,153 $18,597 $19,284 $24,344 $6,782 Total Noninterest Income / Net Revenue (%) 27.80% 28.92% 26.14% 26.49% 25.24%1 Total Noninterest Income / Average Assets (%) 1.29% 1.46% 1.25% 1.21% 1.21%1 Dollars in Thousands |
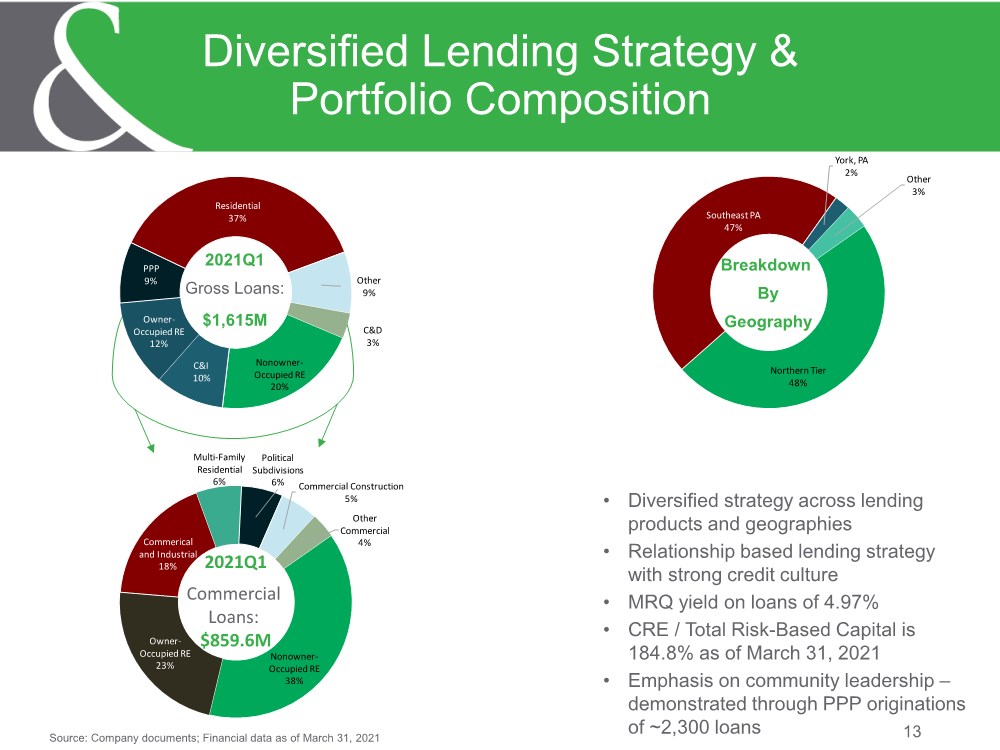
| Nonowner- Occupied RE 38% Owner- Occupied RE 23% Commerical and Industrial 18% Multi-Family Residential 6% Political Subdivisions 6% Commercial Construction 5% Other Commercial 4% Northern Tier 48% Southeast PA 47% York, PA 2% Other 3% • Diversified strategy across lending products and geographies • Relationship based lending strategy with strong credit culture • MRQ yield on loans of 4.97% • CRE / Total Risk-Based Capital is 184.8% as of March 31, 2021 • Emphasis on community leadership – demonstrated through PPP originations of ~2,300 loans 13 Diversified Lending Strategy & Portfolio Composition Nonowner- Occupied RE 20% C&I 10% Owner- Occupied RE 12% PPP 9% Residential 37% Other 9% C&D 3% 2021Q1 Gross Loans: $1,615M Source: Company documents; Financial data as of March 31, 2021 Breakdown By Geography 2021Q1 Commercial Loans: $859.6M |
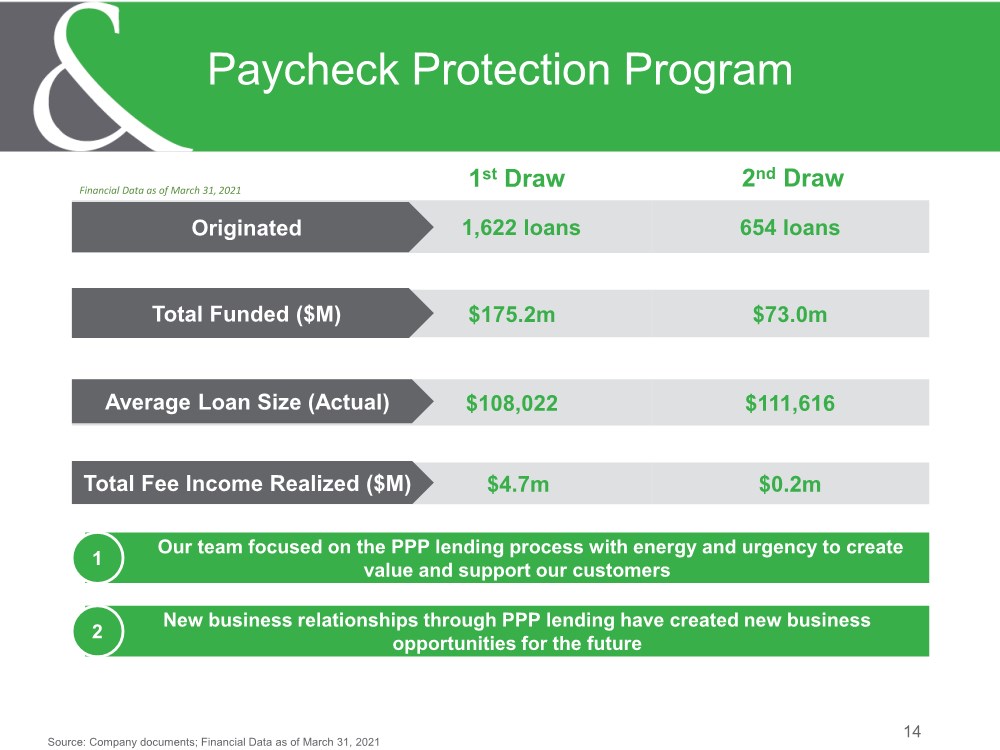
| 14 Paycheck Protection Program Source: Company documents; Financial Data as of March 31, 2021 1,622 loans 654 loans $175.2m $73.0m $108,022 $111,616 $4.7m $0.2m Originated Average Loan Size (Actual) Total Funded ($M) Total Fee Income Realized ($M) Our team focused on the PPP lending process with energy and urgency to create value and support our customers 1 New business relationships through PPP lending have created new business opportunities for the future 2 1st Draw 2nd Draw Financial Data as of March 31, 2021 |
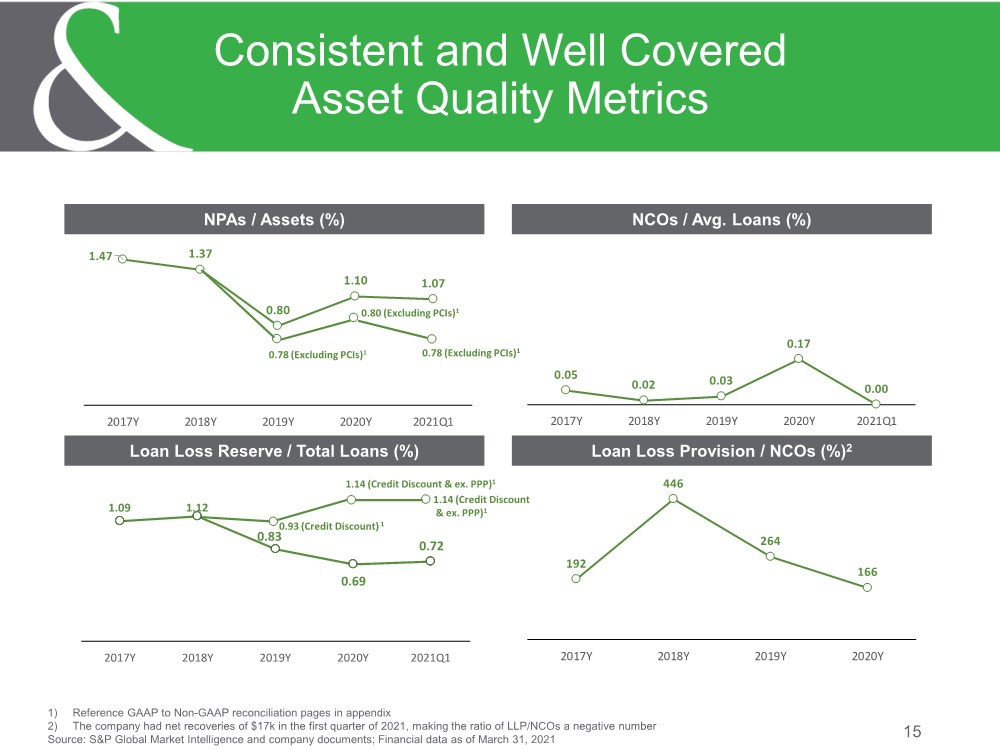
| 1.47 1.37 0.80 1.10 1.07 2017Y 2018Y 2019Y 2020Y 2021Q1 15 Consistent and Well Covered Asset Quality Metrics 1) Reference GAAP to Non-GAAP reconciliation pages in appendix 2) The company had net recoveries of $17k in the first quarter of 2021, making the ratio of LLP/NCOs a negative number Source: S&P Global Market Intelligence and company documents; Financial data as of March 31, 2021 NPAs / Assets (%) Loan Loss Reserve / Total Loans (%) NCOs / Avg. Loans (%) 0.05 0.02 0.03 0.17 0.00 2017Y 2018Y 2019Y 2020Y 2021Q1 Loan Loss Provision / NCOs (%)2 192 446 264 166 2017Y 2018Y 2019Y 2020Y 1.14 (Credit Discount & ex. PPP)1 0.93 (Credit Discount) 1 1.14 (Credit Discount & ex. PPP)1 0.78 (Excluding PCIs)1 0.80 (Excluding PCIs)1 0.78 (Excluding PCIs)1 1.09 1.12 0.83 0.69 0.72 2017Y 2018Y 2019Y 2020Y 2021Q1 |
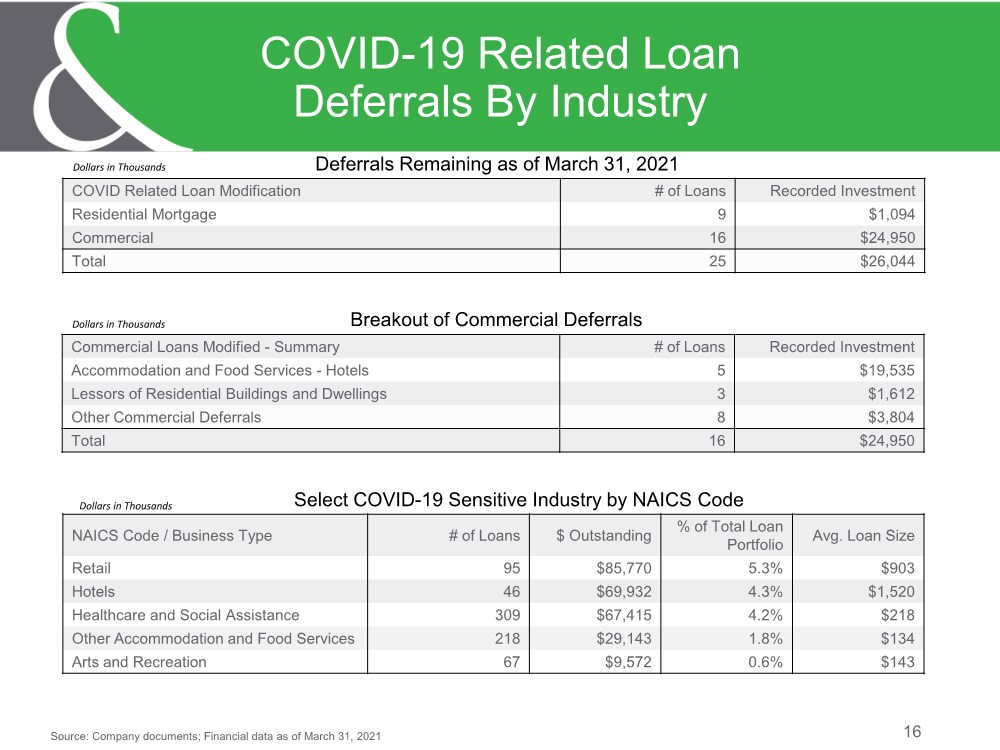
| 16 COVID-19 Related Loan Deferrals By Industry Source: Company documents; Financial data as of March 31, 2021 COVID Related Loan Modification # of Loans Recorded Investment Residential Mortgage 9 $1,094 Commercial 16 $24,950 Total 25 $26,044 Deferrals Remaining as of March 31, 2021 Dollars in Thousands Commercial Loans Modified - Summary # of Loans Recorded Investment Accommodation and Food Services - Hotels 5 $19,535 Lessors of Residential Buildings and Dwellings 3 $1,612 Other Commercial Deferrals 8 $3,804 Total 16 $24,950 Dollars in Thousands Breakout of Commercial Deferrals NAICS Code / Business Type # of Loans $ Outstanding % of Total Loan Portfolio Avg. Loan Size Retail 95 $85,770 5.3% $903 Hotels 46 $69,932 4.3% $1,520 Healthcare and Social Assistance 309 $67,415 4.2% $218 Other Accommodation and Food Services 218 $29,143 1.8% $134 Arts and Recreation 67 $9,572 0.6% $143 Dollars in Thousands Select COVID-19 Sensitive Industry by NAICS Code |
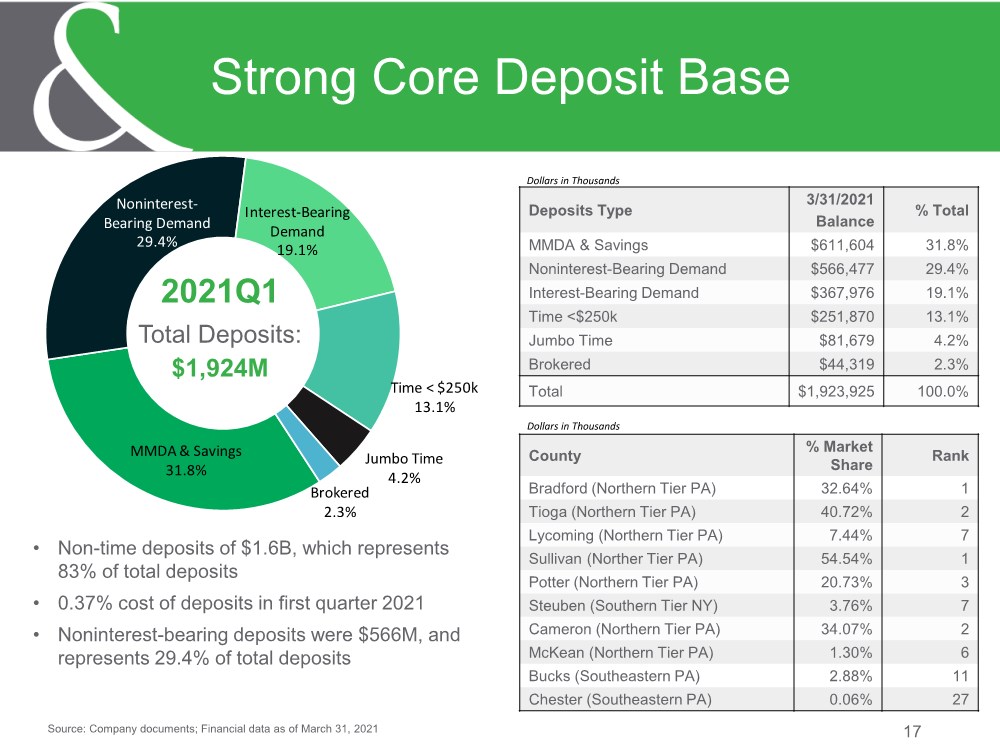
| 17 Strong Core Deposit Base Source: Company documents; Financial data as of March 31, 2021 • Non-time deposits of $1.6B, which represents 83% of total deposits • 0.37% cost of deposits in first quarter 2021 • Noninterest-bearing deposits were $566M, and represents 29.4% of total deposits MMDA & Savings 31.8% Noninterest- Bearing Demand 29.4% Interest-Bearing Demand 19.1% Time < $250k 13.1% Jumbo Time 4.2% Brokered 2.3% 2021Q1 Total Deposits: $1,924M Deposits Type 3/31/2021 Balance % Total MMDA & Savings $611,604 31.8% Noninterest-Bearing Demand $566,477 29.4% Interest-Bearing Demand $367,976 19.1% Time <$250k $251,870 13.1% Jumbo Time $81,679 4.2% Brokered $44,319 2.3% Total $1,923,925 100.0% Dollars in Thousands County % Market Share Rank Bradford (Northern Tier PA) 32.64% 1 Tioga (Northern Tier PA) 40.72% 2 Lycoming (Northern Tier PA) 7.44% 7 Sullivan (Norther Tier PA) 54.54% 1 Potter (Northern Tier PA) 20.73% 3 Steuben (Southern Tier NY) 3.76% 7 Cameron (Northern Tier PA) 34.07% 2 McKean (Northern Tier PA) 1.30% 6 Bucks (Southeastern PA) 2.88% 11 Chester (Southeastern PA) 0.06% 27 Dollars in Thousands |
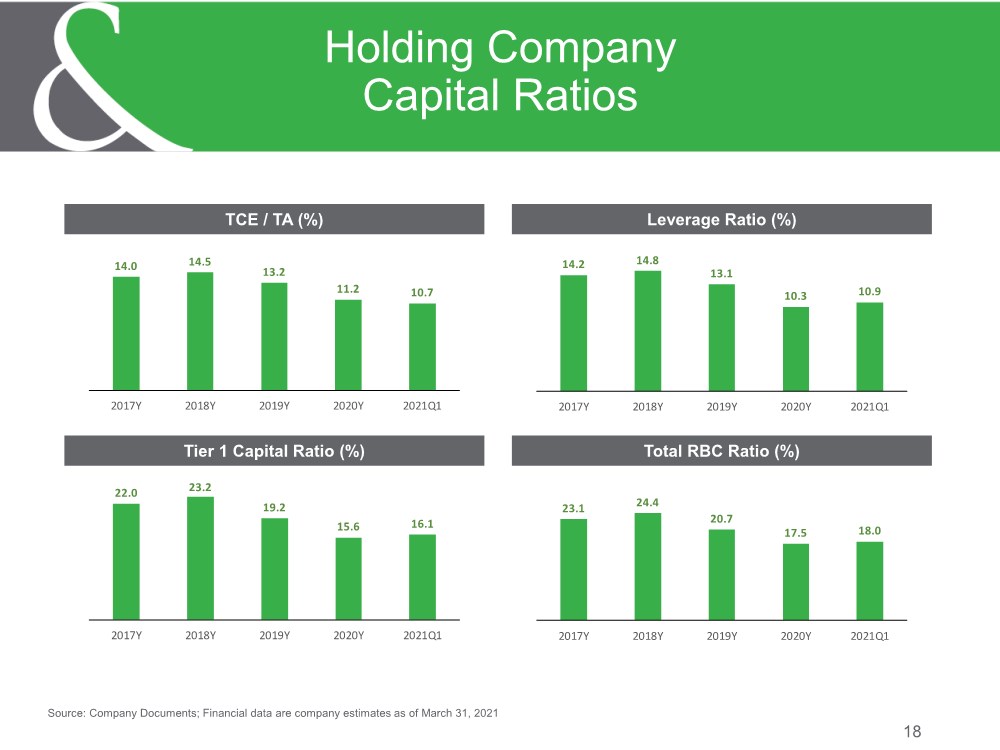
| 18 Holding Company Capital Ratios TCE / TA (%) Tier 1 Capital Ratio (%) Leverage Ratio (%) Total RBC Ratio (%) Source: Company Documents; Financial data are company estimates as of March 31, 2021 14.0 14.5 13.2 11.2 10.7 2017Y 2018Y 2019Y 2020Y 2021Q1 22.0 23.2 19.2 15.6 16.1 2017Y 2018Y 2019Y 2020Y 2021Q1 14.2 14.8 13.1 10.3 10.9 2017Y 2018Y 2019Y 2020Y 2021Q1 23.1 24.4 20.7 17.5 18.0 2017Y 2018Y 2019Y 2020Y 2021Q1 |
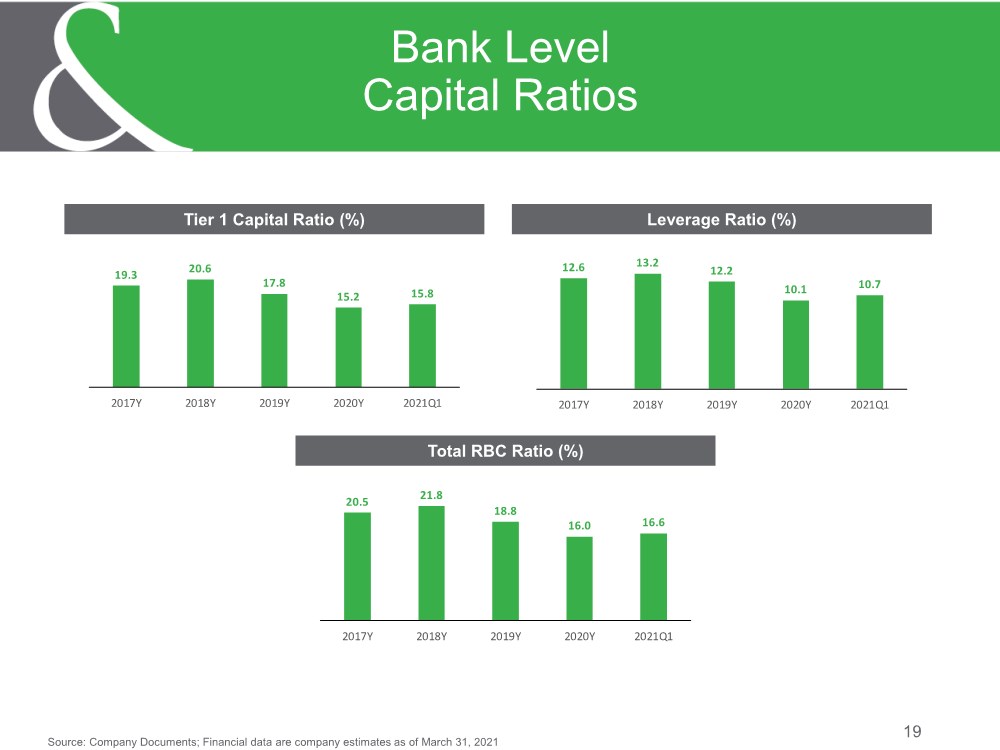
| 19 Bank Level Capital Ratios Tier 1 Capital Ratio (%) Leverage Ratio (%) Total RBC Ratio (%) Source: Company Documents; Financial data are company estimates as of March 31, 2021 19.3 20.6 17.8 15.2 15.8 2017Y 2018Y 2019Y 2020Y 2021Q1 12.6 13.2 12.2 10.1 10.7 2017Y 2018Y 2019Y 2020Y 2021Q1 20.5 21.8 18.8 16.0 16.6 2017Y 2018Y 2019Y 2020Y 2021Q1 |
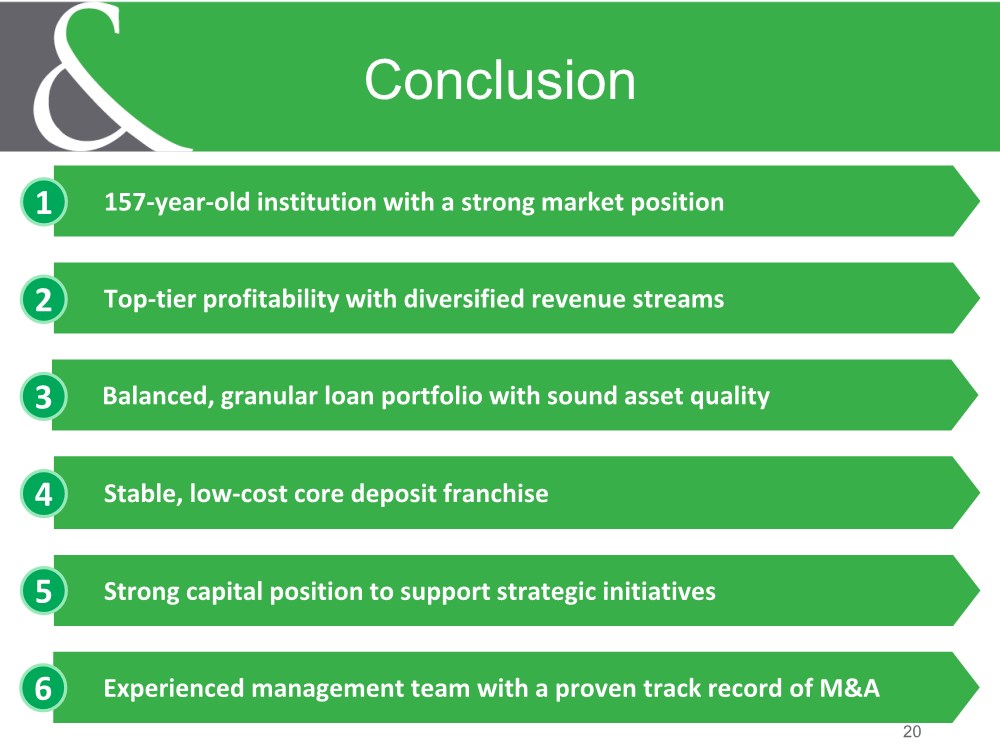
| 20 Conclusion 157-year-old institution with a strong market position Top-tier profitability with diversified revenue streams Balanced, granular loan portfolio with sound asset quality Stable, low-cost core deposit franchise Strong capital position to support strategic initiatives 1 2 3 4 5 Experienced management team with a proven track record of M&A 6 |
| Appendix 21 |

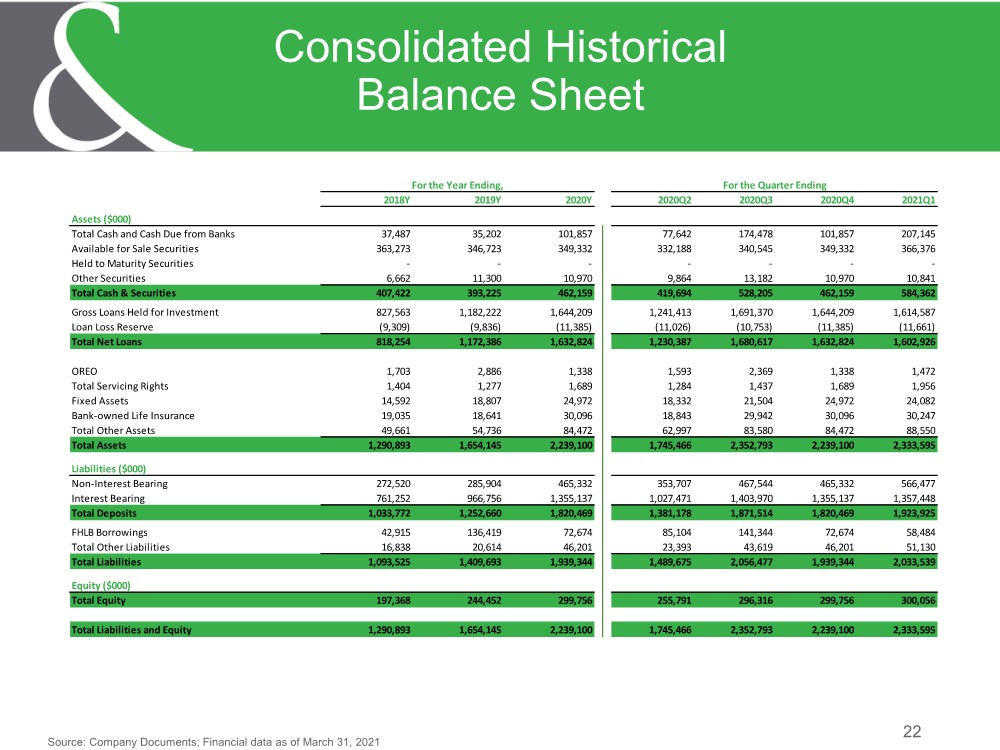
| 22 Consolidated Historical Balance Sheet Source: Company Documents; Financial data as of March 31, 2021 For the Year Ending, For the Quarter Ending 2018Y 2019Y 2020Y 2020Q2 2020Q3 2020Q4 2021Q1 Assets ($000) Total Cash and Cash Due from Banks 37,487 35,202 101,857 77,642 174,478 101,857 207,145 Available for Sale Securities 363,273 346,723 349,332 332,188 340,545 349,332 366,376 Held to Maturity Securities - - - - - - - Other Securities 6,662 11,300 10,970 9,864 13,182 10,970 10,841 Total Cash & Securities 407,422 393,225 462,159 419,694 528,205 462,159 584,362 Gross Loans Held for Investment 827,563 1,182,222 1,644,209 1,241,413 1,691,370 1,644,209 1,614,587 Loan Loss Reserve (9,309) (9,836) (11,385) (11,026) (10,753) (11,385) (11,661) Total Net Loans 818,254 1,172,386 1,632,824 1,230,387 1,680,617 1,632,824 1,602,926 OREO 1,703 2,886 1,338 1,593 2,369 1,338 1,472 Total Servicing Rights 1,404 1,277 1,689 1,284 1,437 1,689 1,956 Fixed Assets 14,592 18,807 24,972 18,332 21,504 24,972 24,082 Bank-owned Life Insurance 19,035 18,641 30,096 18,843 29,942 30,096 30,247 Total Other Assets 49,661 54,736 84,472 62,997 83,580 84,472 88,550 Total Assets 1,290,893 1,654,145 2,239,100 1,745,466 2,352,793 2,239,100 2,333,595 Liabilities ($000) Non-Interest Bearing 272,520 285,904 465,332 353,707 467,544 465,332 566,477 Interest Bearing 761,252 966,756 1,355,137 1,027,471 1,403,970 1,355,137 1,357,448 Total Deposits 1,033,772 1,252,660 1,820,469 1,381,178 1,871,514 1,820,469 1,923,925 FHLB Borrowings 42,915 136,419 72,674 85,104 141,344 72,674 58,484 Total Other Liabilities 16,838 20,614 46,201 23,393 43,619 46,201 51,130 Total Liabilities 1,093,525 1,409,693 1,939,344 1,489,675 2,056,477 1,939,344 2,033,539 Equity ($000) Total Equity 197,368 244,452 299,756 255,791 296,316 299,756 300,056 Total Liabilities and Equity 1,290,893 1,654,145 2,239,100 1,745,466 2,352,793 2,239,100 2,333,595 |
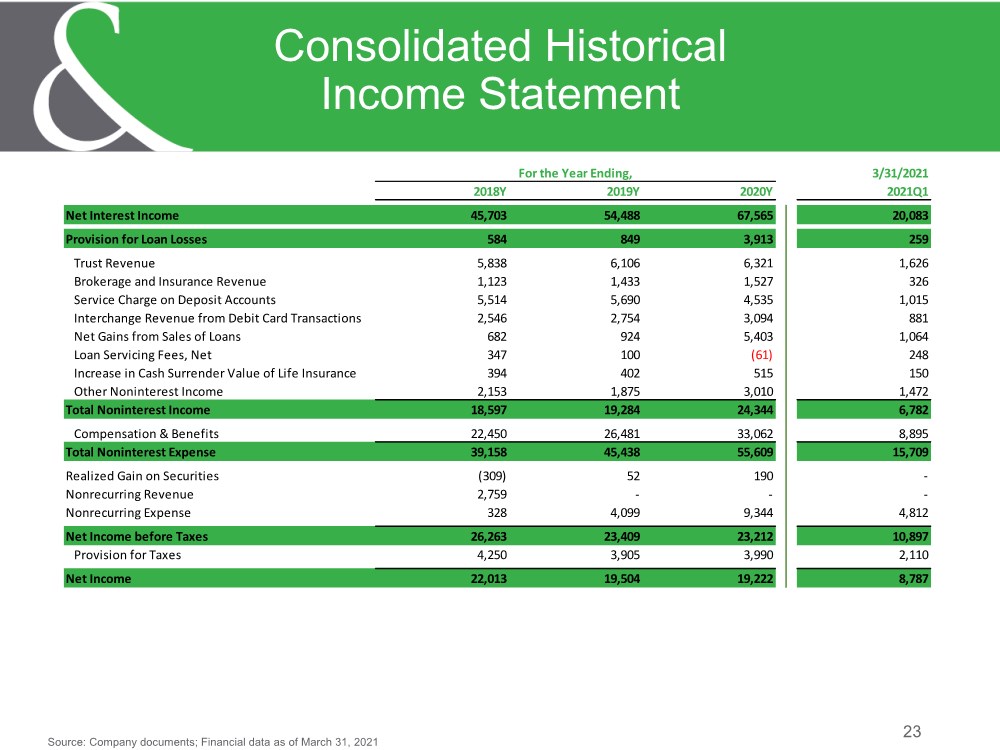
| 23 Consolidated Historical Income Statement Source: Company documents; Financial data as of March 31, 2021 For the Year Ending, 3/31/2021 2018Y 2019Y 2020Y 2021Q1 Net Interest Income 45,703 54,488 67,565 20,083 Provision for Loan Losses 584 849 3,913 259 Trust Revenue 5,838 6,106 6,321 1,626 Brokerage and Insurance Revenue 1,123 1,433 1,527 326 Service Charge on Deposit Accounts 5,514 5,690 4,535 1,015 Interchange Revenue from Debit Card Transactions 2,546 2,754 3,094 881 Net Gains from Sales of Loans 682 924 5,403 1,064 Loan Servicing Fees, Net 347 100 (61) 248 Increase in Cash Surrender Value of Life Insurance 394 402 515 150 Other Noninterest Income 2,153 1,875 3,010 1,472 Total Noninterest Income 18,597 19,284 24,344 6,782 Compensation & Benefits 22,450 26,481 33,062 8,895 Total Noninterest Expense 39,158 45,438 55,609 15,709 Realized Gain on Securities (309) 52 190 - Nonrecurring Revenue 2,759 - - - Nonrecurring Expense 328 4,099 9,344 4,812 Net Income before Taxes 26,263 23,409 23,212 10,897 Provision for Taxes 4,250 3,905 3,990 2,110 Net Income 22,013 19,504 19,222 8,787 |
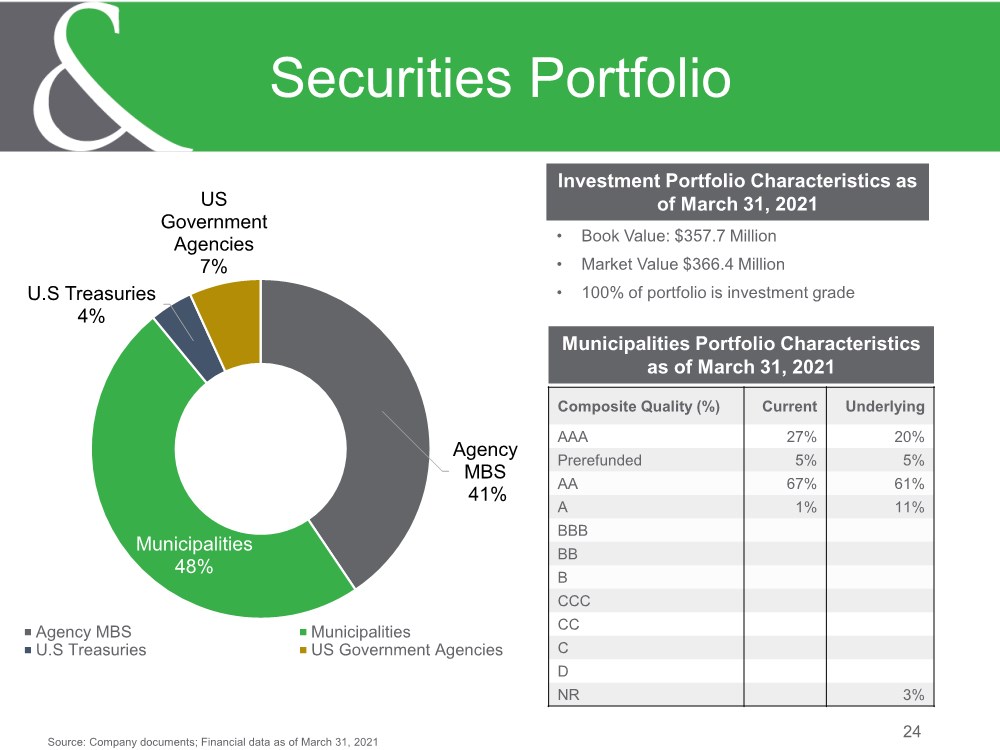
| Investment Portfolio Characteristics as of March 31, 2021 24 Securities Portfolio Source: Company documents; Financial data as of March 31, 2021 Agency MBS 41% Municipalities 48% U.S Treasuries 4% US Government Agencies 7% Agency MBS Municipalities U.S Treasuries US Government Agencies • Book Value: $357.7 Million • Market Value $366.4 Million • 100% of portfolio is investment grade Composite Quality (%) Current Underlying AAA 27% 20% Prerefunded 5% 5% AA 67% 61% A 1% 11% BBB BB B CCC CC C D NR 3% Municipalities Portfolio Characteristics as of March 31, 2021 |
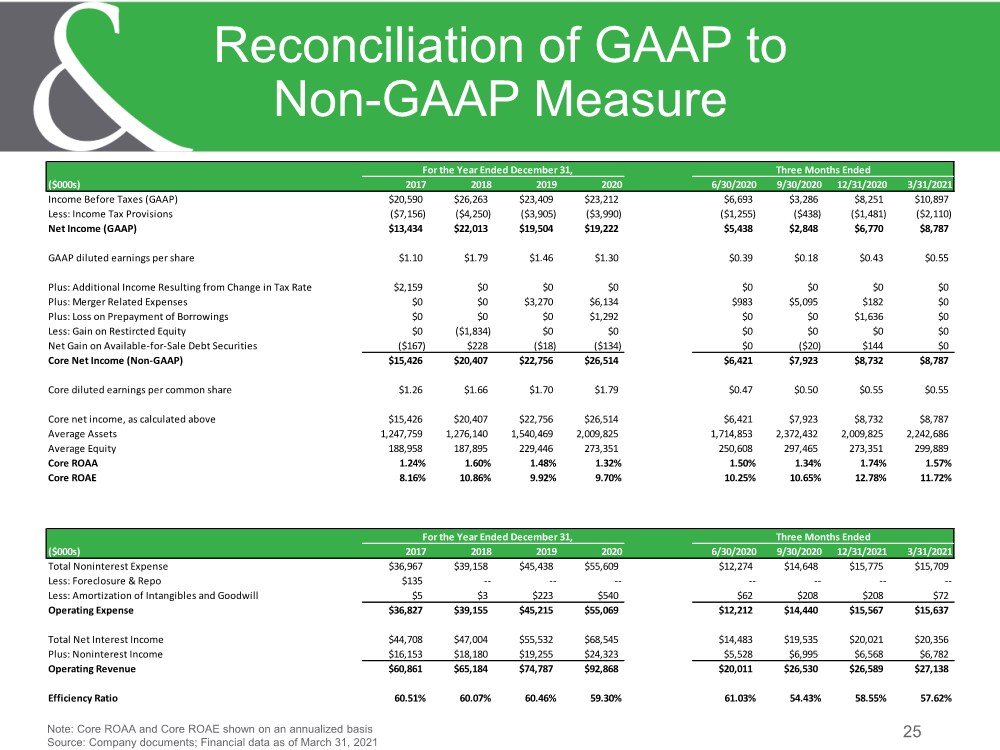
| 25 Reconciliation of GAAP to Non-GAAP Measure Note: Core ROAA and Core ROAE shown on an annualized basis Source: Company documents; Financial data as of March 31, 2021 For the Year Ended December 31, Three Months Ended ($000s) 2017 2018 2019 2020 6/30/2020 9/30/2020 12/31/2020 3/31/2021 Income Before Taxes (GAAP) $20,590 $26,263 $23,409 $23,212 $6,693 $3,286 $8,251 $10,897 Less: Income Tax Provisions ($7,156) ($4,250) ($3,905) ($3,990) ($1,255) ($438) ($1,481) ($2,110) Net Income (GAAP) $13,434 $22,013 $19,504 $19,222 $5,438 $2,848 $6,770 $8,787 GAAP diluted earnings per share $1.10 $1.79 $1.46 $1.30 $0.39 $0.18 $0.43 $0.55 Plus: Additional Income Resulting from Change in Tax Rate $2,159 $0 $0 $0 $0 $0 $0 $0 Plus: Merger Related Expenses $0 $0 $3,270 $6,134 $983 $5,095 $182 $0 Plus: Loss on Prepayment of Borrowings $0 $0 $0 $1,292 $0 $0 $1,636 $0 Less: Gain on Restircted Equity $0 ($1,834) $0 $0 $0 $0 $0 $0 Net Gain on Available-for-Sale Debt Securities ($167) $228 ($18) ($134) $0 ($20) $144 $0 Core Net Income (Non-GAAP) $15,426 $20,407 $22,756 $26,514 $6,421 $7,923 $8,732 $8,787 Core diluted earnings per common share $1.26 $1.66 $1.70 $1.79 $0.47 $0.50 $0.55 $0.55 Core net income, as calculated above $15,426 $20,407 $22,756 $26,514 $6,421 $7,923 $8,732 $8,787 Average Assets 1,247,759 1,276,140 1,540,469 2,009,825 1,714,853 2,372,432 2,009,825 2,242,686 Average Equity 188,958 187,895 229,446 273,351 250,608 297,465 273,351 299,889 Core ROAA 1.24% 1.60% 1.48% 1.32% 1.50% 1.34% 1.74% 1.57% Core ROAE 8.16% 10.86% 9.92% 9.70% 10.25% 10.65% 12.78% 11.72% For the Year Ended December 31, Three Months Ended ($000s) 2017 2018 2019 2020 6/30/2020 9/30/2020 12/31/2021 3/31/2021 Total Noninterest Expense $36,967 $39,158 $45,438 $55,609 $12,274 $14,648 $15,775 $15,709 Less: Foreclosure & Repo $135 -- -- -- -- -- -- -- Less: Amortization of Intangibles and Goodwill $5 $3 $223 $540 $62 $208 $208 $72 Operating Expense $36,827 $39,155 $45,215 $55,069 $12,212 $14,440 $15,567 $15,637 Total Net Interest Income $44,708 $47,004 $55,532 $68,545 $14,483 $19,535 $20,021 $20,356 Plus: Noninterest Income $16,153 $18,180 $19,255 $24,323 $5,528 $6,995 $6,568 $6,782 Operating Revenue $60,861 $65,184 $74,787 $92,868 $20,011 $26,530 $26,589 $27,138 Efficiency Ratio 60.51% 60.07% 60.46% 59.30% 61.03% 54.43% 58.55% 57.62% |
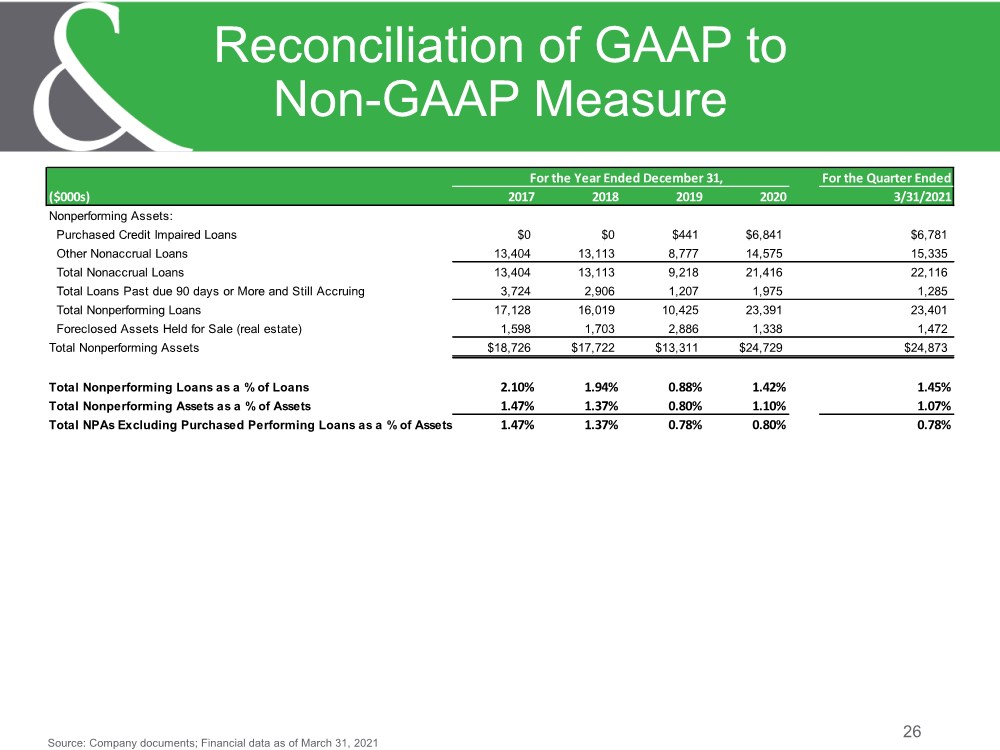
| 26 Reconciliation of GAAP to Non-GAAP Measure Source: Company documents; Financial data as of March 31, 2021 For the Year Ended December 31, For the Quarter Ended ($000s) 2017 2018 2019 2020 3/31/2021 Nonperforming Assets: Purchased Credit Impaired Loans $0 $0 $441 $6,841 $6,781 Other Nonaccrual Loans 13,404 13,113 8,777 14,575 15,335 Total Nonaccrual Loans 13,404 13,113 9,218 21,416 22,116 Total Loans Past due 90 days or More and Still Accruing 3,724 2,906 1,207 1,975 1,285 Total Nonperforming Loans 17,128 16,019 10,425 23,391 23,401 Foreclosed Assets Held for Sale (real estate) 1,598 1,703 2,886 1,338 1,472 Total Nonperforming Assets $18,726 $17,722 $13,311 $24,729 $24,873 Total Nonperforming Loans as a % of Loans 2.10% 1.94% 0.88% 1.42% 1.45% Total Nonperforming Assets as a % of Assets 1.47% 1.37% 0.80% 1.10% 1.07% Total NPAs Excluding Purchased Performing Loans as a % of Assets 1.47% 1.37% 0.78% 0.80% 0.78% |
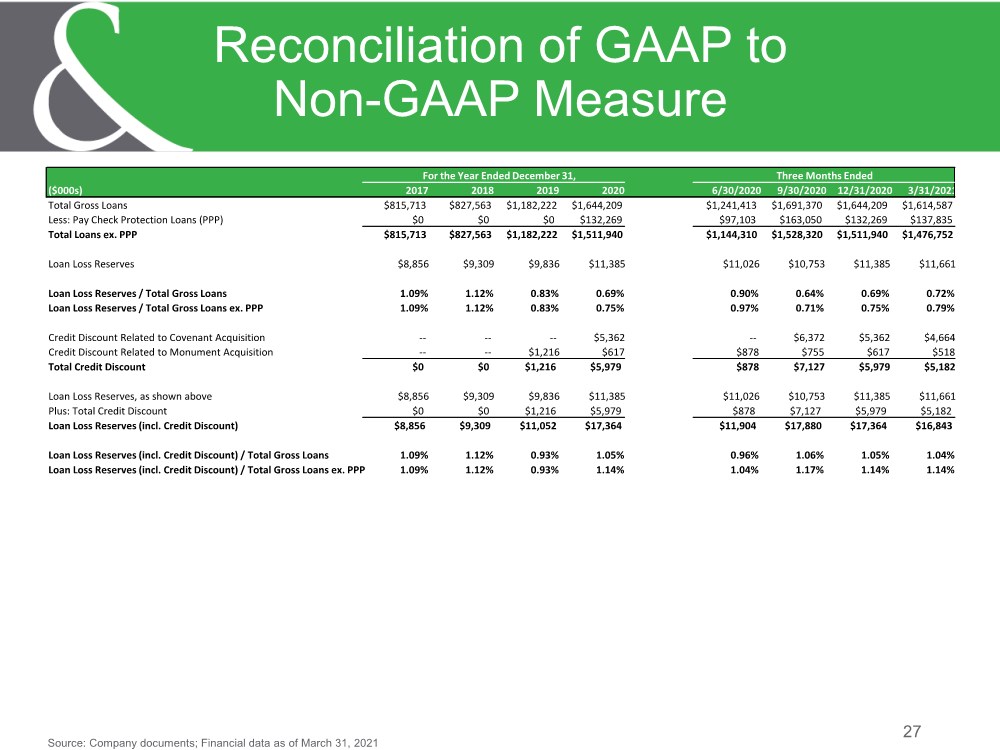
| 27 Reconciliation of GAAP to Non-GAAP Measure Source: Company documents; Financial data as of March 31, 2021 For the Year Ended December 31, Three Months Ended ($000s) 2017 2018 2019 2020 6/30/2020 9/30/2020 12/31/2020 3/31/2021 Total Gross Loans $815,713 $827,563 $1,182,222 $1,644,209 $1,241,413 $1,691,370 $1,644,209 $1,614,587 Less: Pay Check Protection Loans (PPP) $0 $0 $0 $132,269 $97,103 $163,050 $132,269 $137,835 Total Loans ex. PPP $815,713 $827,563 $1,182,222 $1,511,940 $1,144,310 $1,528,320 $1,511,940 $1,476,752 Loan Loss Reserves $8,856 $9,309 $9,836 $11,385 $11,026 $10,753 $11,385 $11,661 Loan Loss Reserves / Total Gross Loans 1.09% 1.12% 0.83% 0.69% 0.90% 0.64% 0.69% 0.72% Loan Loss Reserves / Total Gross Loans ex. PPP 1.09% 1.12% 0.83% 0.75% 0.97% 0.71% 0.75% 0.79% Credit Discount Related to Covenant Acquisition -- -- -- $5,362 -- $6,372 $5,362 $4,664 Credit Discount Related to Monument Acquisition -- -- $1,216 $617 $878 $755 $617 $518 Total Credit Discount $0 $0 $1,216 $5,979 $878 $7,127 $5,979 $5,182 Loan Loss Reserves, as shown above $8,856 $9,309 $9,836 $11,385 $11,026 $10,753 $11,385 $11,661 Plus: Total Credit Discount $0 $0 $1,216 $5,979 $878 $7,127 $5,979 $5,182 Loan Loss Reserves (incl. Credit Discount) $8,856 $9,309 $11,052 $17,364 $11,904 $17,880 $17,364 $16,843 Loan Loss Reserves (incl. Credit Discount) / Total Gross Loans 1.09% 1.12% 0.93% 1.05% 0.96% 1.06% 1.05% 1.04% Loan Loss Reserves (incl. Credit Discount) / Total Gross Loans ex. PPP 1.09% 1.12% 0.93% 1.14% 1.04% 1.17% 1.14% 1.14% |
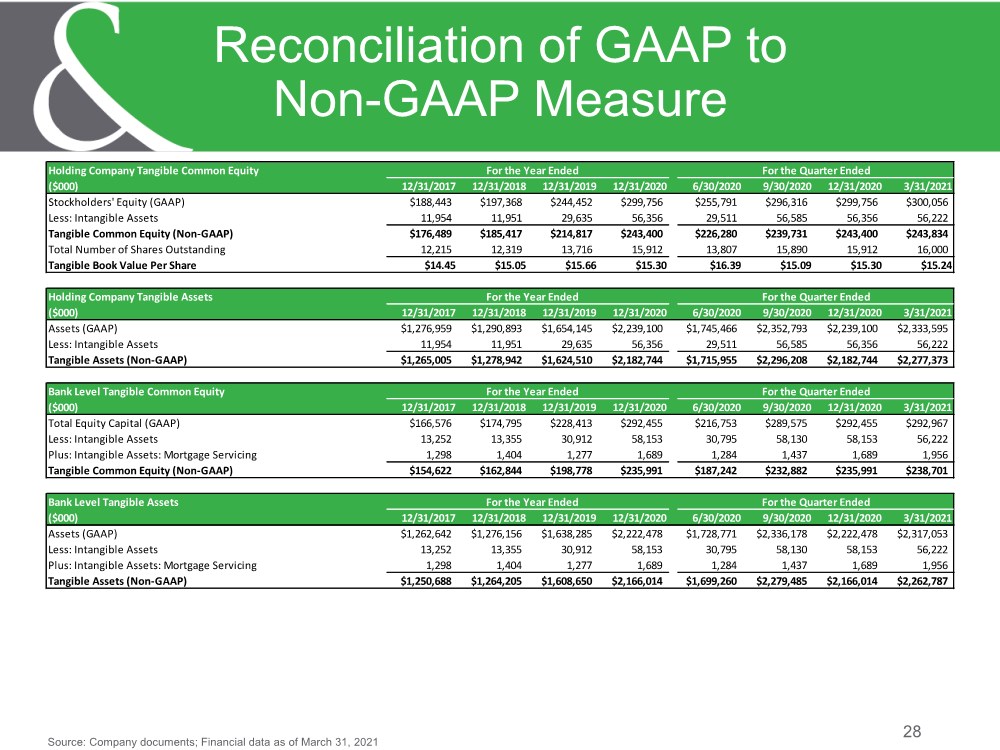
| 28 Reconciliation of GAAP to Non-GAAP Measure Source: Company documents; Financial data as of March 31, 2021 Holding Company Tangible Common Equity For the Year Ended For the Quarter Ended ($000) 12/31/2017 12/31/2018 12/31/2019 12/31/2020 6/30/2020 9/30/2020 12/31/2020 3/31/2021 Stockholders' Equity (GAAP) $188,443 $197,368 $244,452 $299,756 $255,791 $296,316 $299,756 $300,056 Less: Intangible Assets 11,954 11,951 29,635 56,356 29,511 56,585 56,356 56,222 Tangible Common Equity (Non-GAAP) $176,489 $185,417 $214,817 $243,400 $226,280 $239,731 $243,400 $243,834 Total Number of Shares Outstanding 12,215 12,319 13,716 15,912 13,807 15,890 15,912 16,000 Tangible Book Value Per Share $14.45 $15.05 $15.66 $15.30 $16.39 $15.09 $15.30 $15.24 Holding Company Tangible Assets For the Year Ended For the Quarter Ended ($000) 12/31/2017 12/31/2018 12/31/2019 12/31/2020 6/30/2020 9/30/2020 12/31/2020 3/31/2021 Assets (GAAP) $1,276,959 $1,290,893 $1,654,145 $2,239,100 $1,745,466 $2,352,793 $2,239,100 $2,333,595 Less: Intangible Assets 11,954 11,951 29,635 56,356 29,511 56,585 56,356 56,222 Tangible Assets (Non-GAAP) $1,265,005 $1,278,942 $1,624,510 $2,182,744 $1,715,955 $2,296,208 $2,182,744 $2,277,373 Bank Level Tangible Common Equity For the Year Ended For the Quarter Ended ($000) 12/31/2017 12/31/2018 12/31/2019 12/31/2020 6/30/2020 9/30/2020 12/31/2020 3/31/2021 Total Equity Capital (GAAP) $166,576 $174,795 $228,413 $292,455 $216,753 $289,575 $292,455 $292,967 Less: Intangible Assets 13,252 13,355 30,912 58,153 30,795 58,130 58,153 56,222 Plus: Intangible Assets: Mortgage Servicing 1,298 1,404 1,277 1,689 1,284 1,437 1,689 1,956 Tangible Common Equity (Non-GAAP) $154,622 $162,844 $198,778 $235,991 $187,242 $232,882 $235,991 $238,701 Bank Level Tangible Assets For the Year Ended For the Quarter Ended ($000) 12/31/2017 12/31/2018 12/31/2019 12/31/2020 6/30/2020 9/30/2020 12/31/2020 3/31/2021 Assets (GAAP) $1,262,642 $1,276,156 $1,638,285 $2,222,478 $1,728,771 $2,336,178 $2,222,478 $2,317,053 Less: Intangible Assets 13,252 13,355 30,912 58,153 30,795 58,130 58,153 56,222 Plus: Intangible Assets: Mortgage Servicing 1,298 1,404 1,277 1,689 1,284 1,437 1,689 1,956 Tangible Assets (Non-GAAP) $1,250,688 $1,264,205 $1,608,650 $2,166,014 $1,699,260 $2,279,485 $2,166,014 $2,262,787 |
| Thank You 29 |