Attached files
| file | filename |
|---|---|
| EX-99.1 - PRESS RELEASE - Vertex Energy Inc. | ex99-1.htm |
| 8-K - CURRENT REPORT - Vertex Energy Inc. | vtnr-8k_051321.htm |
Exhibit 99.2

May 2021 First Quarter 2021 Results Conference Call

Disclaimer This document may contain forward - looking statements including words such as “may,” “can,” “could,” “should,” “predict,” “aim,” “potential,” “continue,” “opportunity,” “intend,” “goal,” “estimate,” “expect,” “expectations,” “project,” “projections,” “plans,” “anticipates,” “believe,” “think,” “confident,” “scheduled,” or similar expressions, as well as information about management’s view of Vertex Energy’s future expectations, plans and prospects, within the safe harbor provisions under the Private Securities Litigation Reform Act of 1995 . These statements involve known and unknown risks, uncertainties and other factors which may cause the results of Vertex Energy, its divisions and concepts to be materially different than those expressed or implied in such statements . Should one or more of these risks or uncertainties occur, or should underlying assumptions prove incorrect, Vertex Energy's business, plans, prospects, financial condition, liquidity, cash flows, projections and results could differ materially from those expressed in any forward - looking statement . While forward - looking statements reflect our good faith beliefs, they are not guarantees of future performance . New risks and uncertainties arise over time, and it is not possible for us to predict the occurrence of those matters or the manner in which they may affect us . These risk factors and others are included from time to time in documents Vertex Energy files with the Securities and Exchange Commission, including, but not limited to, its Form 10 - Ks, Form 10 - Qs and Form 8 - Ks, available at the SEC’s website at www . sec . gov . Other unknown or unpredictable factors also could have material adverse effects on Vertex Energy’s future results . Except as required by law, Vertex Energy expressly disclaims any obligation or undertaking to update any forward - looking statements to reflect any change in its expectations with regard thereto or any change in events, conditions or circumstances on which any statement is based . The forward - looking statements included in this presentation are made only as of the date hereof . Vertex Energy cannot guarantee future results, levels of activity, performance or achievements . Accordingly, you should not place undue reliance on these forward - looking statements . Finally, Vertex Energy undertakes no obligation to update these statements after the date of this presentation, except as required by law, and also undertakes no obligation to update or correct information prepared by third parties that are not paid for by Vertex Energy . Industry Information Information regarding market and industry statistics contained in this presentation is based on information available to us that we believe is accurate . It is generally based on publications that are not produced for investment or economic analysis . Use of Non - GAAP Financial Information This presentation discusses “EBITDA”, “Adjusted EBITDA” and free cash flow . EBITDA represents net income before interest, taxes, depreciation and amortization . Adjusted EBITDA is defined as EBITDA before stock - based compensation expense and gain (loss) on change in value of derivative warrant liability and unrealized gains and losses on derivative instruments for hedging activities . Free cash flow represents net cash provided by (used in) operating activities, less capital expenditures . These measurements have not been audited, are not recognized in accordance with generally accepted accounting principles (GAAP) and should not be viewed as an alternative to GAAP measures of performance . EBITDA, Adjusted EBITDA and free cash flow are presented because we believe they provide additional useful information to investors due to the various noncash items during the period . EBITDA, Adjusted EBITDA and free cash flows have limitations as analytical tools, and you should not consider them in isolation, or as a substitute for analysis of our operating results as reported under GAAP . The Company’s presentation of these measures should not be construed as an inference that future results will be unaffected by unusual or nonrecurring items . See also “Non - GAAP Reconciliation — Reconciliation of Net Loss attributable to Vertex Energy, Inc . , to EBITDA, Adjusted EBITDA and Free Cash Flow”, in the Appendix, below . 2

Business Update

Executive Summary 1Q21 performance and 2Q21 outlook 4 1Q21 Performance Key Performance Indicators Strategic Initiatives Progress Update Management Outlook 2Q21 Guidance Base oil prices at elevated levels Group II posted prices have increased more than 15% on a y/y through the end of April; expect prices to remain elevated, benefiting the Heartland refinery Planned turnarounds in 2Q21 Anticipate 10 and 3 days of planned maintenance, respectively, at Marrero and Heartland during the second quarter 2021 2Q21 financial outlook Anticipate total Adjusted EBITDA in the range of $2.5 million to $3.0 million, including impact of planned maintenance Full - year 2021 financial outlook Anticipate positive free cash flow, net income and Adjusted EBITDA Strong financial performance Generated y/y growth in net income and adjusted EBITDA supported by improved refined product margins, higher base oil prices, increased used motor oil (UMO) collections, reduced collections expense and strong operational reliability Exceptional operational reliability Total throughputs at the Marrero refinery increased on both a sequential and year - over - year basis in the first quarter; Heartland refinery operated at peak capacity during the first quarter, given higher selling prices on Group II+ base oil. Solid collections growth. Total UMO collections increased 17% on a year - over - year basis to 10.4 million gallons, exceeding pre - pandemic levels Low - carbon energy transition focus Actively evaluating organic and inorganic growth opportunities that position us to support the global transition toward low - carbon solutions Myrtle Grove oil reclamation project Myrtle Grove has begun to receive distressed hydrocarbon streams that will be pretreated and reclaimed as feedstock for sale into third - party industrial markets and at the Marrero refinery Myrtle Grove renewable diesel project This project is under evaluation, as we continue to consider the construction of a pre - treatment facility capable of sourcing and stabilizing non - conforming organic oils used in the production of renewable diesel fuel

Adjusted EBITDA Performance Bridge 1Q21 benefited from improved refining margins, higher sales volumes and continued cost discipline 5 1Q20 vs. 1Q21 Adjusted EBITDA Bridge ($MM) • Adjusted EBITDA improved more than 4x on a y/y basis in 1Q21 • Improved refining margins; 11% y/y improvement in WTI - HSFO spread in 1Q21; significant base oil price escalation • Improved demand for refined products, as commercial activity accelerates • Continued progress within Metals business; +$1.0 million y/y improvement • Business development, new division costs and Myrtle Grove start - up offset areas of improvement $6.5 $4.2

Higher Commodity Prices, Improved Refined Product Margins Base oil prices continue to climb higher on tight supply and increase commercial demand 6 Improved Distillate Margins Benefit Marrero USGC 3% HSFO Less West Texas Intermediate (WTI) vs. Crude Oil ($/Barrel); High Sulfur Fuel Oil is a Proxy for Used Motor Oil (UMO) Price; WTI is a Proxy For Product Prices (1) (1)CME Group (April 2021) (2) Market base oil prices (April 2021) Higher Base Oil Prices Benefit Heartland Group II+ Base Oil has increased more than 150% on a y/y basis through April 2021 (2) • Higher crude oil prices have contributed to commodity price escalation • Marrero refinery benefiting from y/y improvement in spread between WTI and high sulfur fuel oil • Heartland benefiting from material increase in Group II base oil prices • Group II base oil prices +150% y/y in April - 21 ($7) ($6) ($5) ($4) ($3) ($2) ($1) $0 $1 Apr-20 Jun-20 Aug-20 Oct-20 Dec-20 Feb-21 Apr-21 Jun-21 Aug-21 Oct-21 Dec-21 Feb-22 Actual Futures $0.00 $0.50 $1.00 $1.50 $2.00 $2.50 $3.00 $3.50 $4.00 $4.50 1Q20 2Q20 3Q20 4Q20 1Q21 Apr-21

Key Financial Metrics Record Adjusted EBITDA reflects strong operational execution, improved refining economics 7 Total Revenues ($MM) Adjusted EBITDA ($MM) Operating Income (Loss) ($MM) Net Income (Loss) Attributable to Vertex ($MM) • Return to profitability reflects continued cost controls and improved commercial execution • Significant y/y improvement in refined product margin per barrel • Marrero and Heartland both operated at full capacity in 1Q21 – no operational disruptions $1.0 $5.0 $0.8 ($8.1) 1Q20 1Q21 TTM 1Q20 TTM 1Q21 $2.7 $1.0 $2.7 ($14.0) 1Q20 1Q21 TTM 1Q20 TTM 1Q21 $1.6 $6.5 $6.5 $0.2 1Q20 1Q21 TTM 1Q20 TTM 1Q21 $36.2 $58.0 $160.2 $156.9 1Q20 1Q21 TTM 1Q20 TTM 1Q21
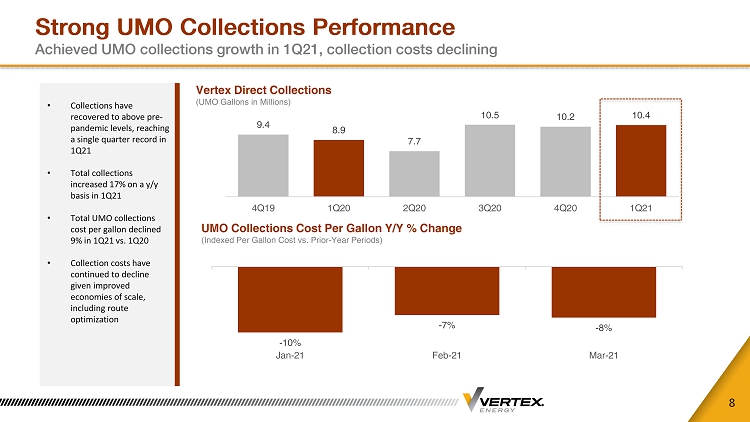
Strong UMO Collections Performance Achieved UMO collections growth in 1Q21, collection costs declining 8 Vertex Direct Collections (UMO Gallons in Millions) UMO Collections Cost Per Gallon Y/Y % Change (Indexed Per Gallon Cost vs. Prior - Year Periods) • Collections have recovered to above pre - pandemic levels, reaching a single quarter record in 1Q21 • Total collections increased 17% on a y/y basis in 1Q21 • Total UMO collections cost per gallon declined 9% in 1Q21 vs. 1Q20 • Collection costs have continued to decline given improved economies of scale, including route optimization - 10% - 7% - 8% Jan-21 Feb-21 Mar-21 9.4 8.9 7.7 10.5 10.2 10.4 4Q19 1Q20 2Q20 3Q20 4Q20 1Q21

Refinery Utilization Update Both Marrero and Heartland operated at peak capacity 9 (1) Utilization defined as total refinery throughputs divided by nameplate capacity of the refinery Marrero Refinery Capacity Utilization Rate (1) Heartland Refinery Capacity Utilization Rate (1) • Strongest utilization since 2Q19, driven by strong operational execution; incentivized by improved refined product margins • 10 - day turnaround scheduled at Marrero in 2Q21 • Elevated base oil prices incentivized high production rates • 3 - day turnaround scheduled at Heartland in 2Q21 96% 103% 82% 100% 97% 62% 90% 75% 102% 1Q19 2Q19 3Q19 4Q19 1Q20 2Q20 3Q20 4Q20 1Q21 100% 97% 108% 103% 103% 78% 99% 109% 101% 1Q19 2Q19 3Q19 4Q19 1Q20 2Q20 3Q20 4Q20 1Q21
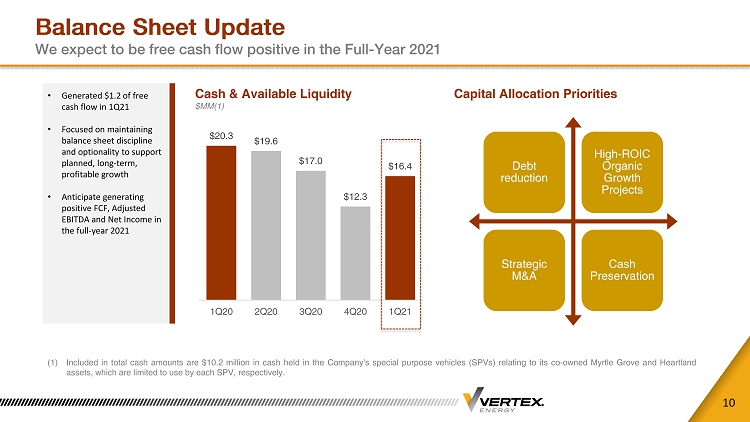
Balance Sheet Update We expect to be free cash flow positive in the Full - Year 2021 10 (1) Included in total cash amounts are $ 10 . 2 million in cash held in the Company’s special purpose vehicles (SPVs) relating to its co - owned Myrtle Grove and Heartland assets, which are limited to use by each SPV, respectively . Cash & Available Liquidity $MM(1) Capital Allocation Priorities Debt reduction High - ROIC Organic Growth Projects Strategic M&A Cash Preservation • Generated $1.2 of free cash flow in 1Q21 • Focused on maintaining balance sheet discipline and optionality to support planned, long - term, profitable growth • Anticipate generating positive FCF, Adjusted EBITDA and Net Income in the full - year 2021 $20.3 $19.6 $17.0 $12.3 $16.4 1Q20 2Q20 3Q20 4Q20 1Q21

APPENDIX
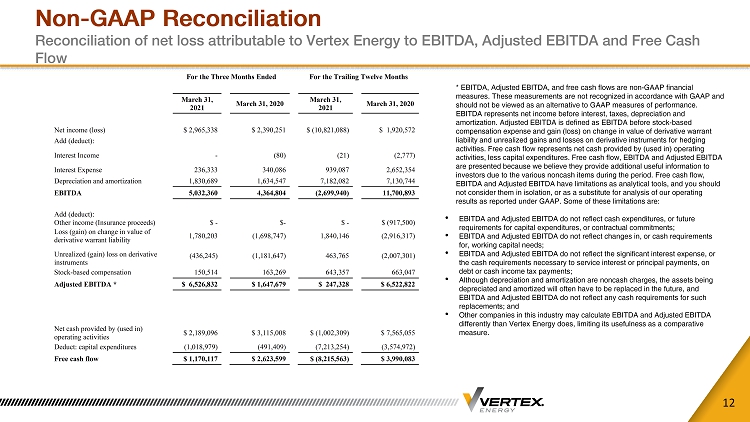
Non - GAAP Reconciliation Reconciliation of net loss attributable to Vertex Energy to EBITDA, Adjusted EBITDA and Free Cash Flow 12 * EBITDA, Adjusted EBITDA, and free cash flows are non - GAAP financial measures. These measurements are not recognized in accordance with GAAP and should not be viewed as an alternative to GAAP measures of performance. EBITDA represents net income before interest, taxes, depreciation and amortization. Adjusted EBITDA is defined as EBITDA before stock - based compensation expense and gain (loss) on change in value of derivative warrant liability and unrealized gains and losses on derivative instruments for hedging activities. Free cash flow represents net cash provided by (used in) operating activities, less capital expenditures. Free cash flow, EBITDA and Adjusted EBITDA are presented because we believe they provide additional useful information to investors due to the various noncash items during the period. Free cash flow, EBITDA and Adjusted EBITDA have limitations as analytical tools, and you should not consider them in isolation, or as a substitute for analysis of our operating results as reported under GAAP. Some of these limitations are: • EBITDA and Adjusted EBITDA do not reflect cash expenditures, or future requirements for capital expenditures, or contractual commitments; • EBITDA and Adjusted EBITDA do not reflect changes in, or cash requirements for, working capital needs; • EBITDA and Adjusted EBITDA do not reflect the significant interest expense, or the cash requirements necessary to service interest or principal payments, on debt or cash income tax payments; • Although depreciation and amortization are noncash charges, the assets being depreciated and amortized will often have to be replaced in the future, and EBITDA and Adjusted EBITDA do not reflect any cash requirements for such replacements; and • Other companies in this industry may calculate EBITDA and Adjusted EBITDA differently than Vertex Energy does, limiting its usefulness as a comparative measure. For the Three Months Ended For the Trailing Twelve Months March 31, 2021 March 31, 2020 March 31, 2021 March 31, 2020 Net income (loss) $ 2,965,338 $ 2,390,251 $ (10,821,088) $ 1,920,572 Add (deduct): Interest Income - (80) (21) (2,777) Interest Expense 236,333 340,086 939,087 2,652,354 Depreciation and amortization 1,830,689 1,634,547 7,182,082 7,130,744 EBITDA 5,032,360 4,364,804 (2,699,940) 11,700,893 Add (deduct): Other income (Insurance proceeds) $ - $- $ - $ (917,500) Loss (gain) on change in value of derivative warrant liability 1,780,203 (1,698,747) 1,840,146 (2,916,317) Unrealized (gain) loss on derivative instruments (436,245) (1,181,647) 463,765 (2,007,301) Stock-based compensation 150,514 163,269 643,357 663,047 Adjusted EBITDA * $ 6,526,832 $ 1,647,679 $ 247,328 $ 6,522,822 Net cash provided by (used in) operating activities $ 2,189,096 $ 3,115,008 $ (1,002,309) $ 7,565,055 Deduct: capital expenditures (1,018,979) (491,409) (7,213,254) (3,574,972) Free cash flow $ 1,170,117 $ 2,623,599 $ (8,215,563) $ 3,990,083