Attached files
| file | filename |
|---|---|
| EX-99.1 - EX-99.1 - LHC Group, Inc | d353306dex991.htm |
| 8-K - 8-K - LHC Group, Inc | lhcg-8k_20210505.htm |

Supplemental Financial Information First Quarter Ended March 31, 2021 May 5, 2021 Exhibit 99.2
Forward-Looking Statements This presentation contains “forward-looking statements” (as defined in the Securities Litigation Reform Act of 1995) regarding, among other things, future events or the future financial performance of the Company. Words such as “anticipate,” “expect,” “project,” “intend,” “believe,” “will,” “estimate,” “may,” “could,” “should,” “outlook,” and “guidance” and words and terms of similar substance used in connection with any discussion of future plans, actions, events or results identify forward-looking statements. Forward-looking statements are based on information currently available to the Company and involve estimates, expectations and projections. Investors are cautioned that all such forward-looking statements are subject to risks and uncertainties that could cause actual events or results to differ materially from the events or results described in the forward-looking statements, including, but not limited to, the risks and uncertainties related to the COVID-19 pandemic and those otherwise described in our filings with the Securities and Exchange Commission, including our most recent Annual Report on Form 10-K and subsequent Quarterly Reports on Form 10-Q and Current Reports on Form 8-K. Many of these risks, uncertainties and assumptions are beyond the Company’s ability to control or predict. Because of these risks, uncertainties and assumptions, investors should not place undue reliance on these forward-looking statements. Non-GAAP Financial Information This presentation includes certain financial measures that were not prepared in accordance with U.S. generally accepted accounting principles (“GAAP”), including EBITDA and Adjusted EBITDA. The company uses these non-GAAP financial measures in operating its business because management believes they are less susceptible to variances in actual operating performance that can result from the excluded items. The company presents these financial measures to investors because they believe they are useful to investors in evaluating the primary factors that drive the company's operating performance. The items excluded from these non-GAAP measures are important in understanding LHC Group’s financial performance, and any non-GAAP measures presented should not be considered in isolation of, or as an alternative to, GAAP financial measures. Since these non-GAAP financial measures are not measures determined in accordance with GAAP, have no standardized meaning prescribed by GAAP and are susceptible to varying calculations, these measures, as presented, may not be comparable to other similarly titled measures of other companies. EBITDA of LHC Group is defined as net income (loss) before income tax benefit (expense), interest expense, and depreciation and amortization expense. Adjusted EBITDA of LHC Group is defined as net income (loss) before income tax expense benefit (expense), depreciation and amortization expense, and transaction costs related to previous transactions. 2 Please visit the Investors section on our website at Investor.LHCgroup.com for additional information on LHC Group and the industry. Nasdaq: LHCG
Table of Contents 3 Overview & Policy Tailwinds 4 - 8 Differentiated Strategies 9 - 16 First Quarter Consolidated Results Segment Results Guidance, Liquidity & Outlook Appendix LHC Group Overview Commentary on Q1 2021 At Home Care Policy Tailwinds Differentiated Strategy Leading to Quality Growth Multiple Organic and Inorganic Growth Levers Building Blocks of Long-Term Earnings Growth Recruiting and Retention Sequential Operational Trends Continue to Improve Home Health and Hospice Growth Industry-Leading Quality and Patient Satisfaction 17 - 20 2021 Adjusted Consolidated Results Adjusted Consolidated Results – 2021 vs 2020 Adjustments to Net Income 21 - 28 Three Months Ended March 31, 2021 Home Health Home Health Revenue Factors Hospice Home and Community Based Services Facility-Based Services Healthcare Innovations 29 - 32 Full Year 2021 Guidance Debt and Liquidity Metrics Focus for 2021 33 - 35 Non-GAAP Reconciliations

4 Overview & Policy Tailwinds
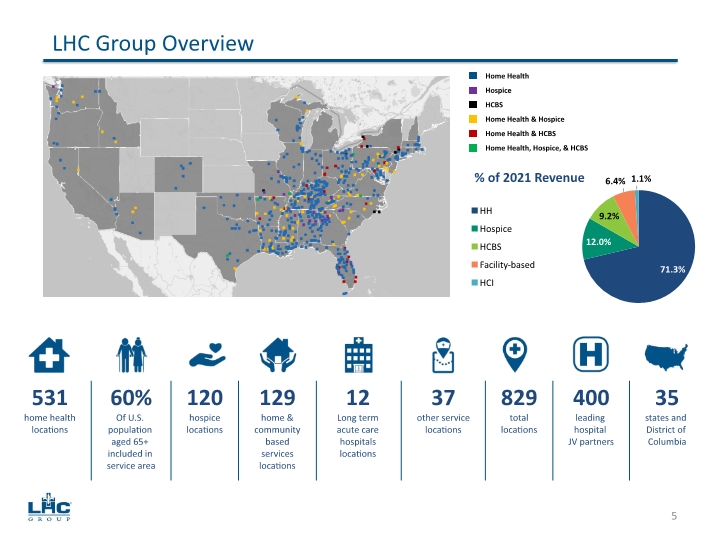
Home Health Hospice HCBS Home Health & Hospice Home Health & HCBS Home Health, Hospice, & HCBS LHC Group Overview 5 531 home health locations 60% Of U.S. population aged 65+ included in service area 120 hospice locations 129 home & community based services locations 12 Long term acute care hospitals locations 37 other service locations 829 total locations 400 leading hospital JV partners 35 states and District of Columbia
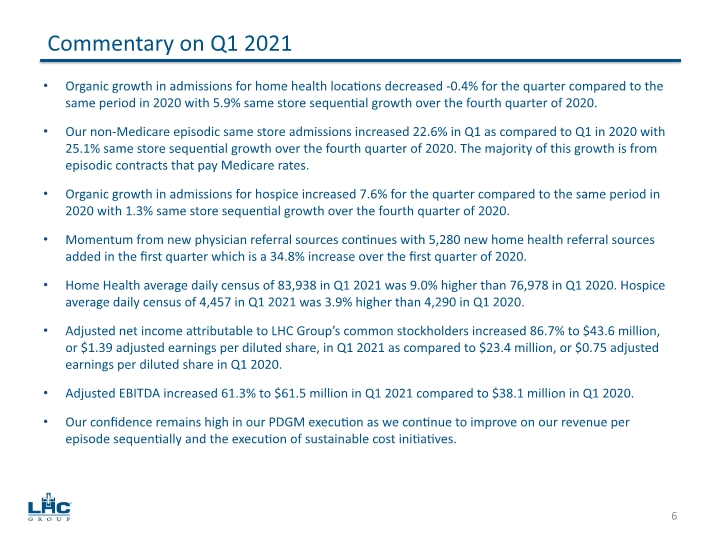
Organic growth in admissions for home health locations decreased -0.4% for the quarter compared to the same period in 2020 with 5.9% same store sequential growth over the fourth quarter of 2020. Our non-Medicare episodic same store admissions increased 22.6% in Q1 as compared to Q1 in 2020 with 25.1% same store sequential growth over the fourth quarter of 2020. The majority of this growth is from episodic contracts that pay Medicare rates. Organic growth in admissions for hospice increased 7.6% for the quarter compared to the same period in 2020 with 1.3% same store sequential growth over the fourth quarter of 2020. Momentum from new physician referral sources continues with 5,280 new home health referral sources added in the first quarter which is a 34.8% increase over the first quarter of 2020. Home Health average daily census of 83,938 in Q1 2021 was 9.0% higher than 76,978 in Q1 2020. Hospice average daily census of 4,457 in Q1 2021 was 3.9% higher than 4,290 in Q1 2020. Adjusted net income attributable to LHC Group’s common stockholders increased 86.7% to $43.6 million, or $1.39 adjusted earnings per diluted share, in Q1 2021 as compared to $23.4 million, or $0.75 adjusted earnings per diluted share in Q1 2020. Adjusted EBITDA increased 61.3% to $61.5 million in Q1 2021 compared to $38.1 million in Q1 2020. Our confidence remains high in our PDGM execution as we continue to improve on our revenue per episode sequentially and the execution of sustainable cost initiatives. Commentary on Q1 2021 6
On April 14, President Biden signed into law a bill extending relief through year end for the home health, hospice and other health care sectors from the statutory Medicare 2% sequestration provider payment cut. On April 20, Sec. of Health and Human Services Becerra signed an Administrative Order extending the declaration of the Public Health Emergency for an additional 90 days through July 20th thereby extending significant flexibilities for the provision of home health services previously afforded administratively. Flexibilities include a temporary waiver of the home health Medicare homebound requirement, telehealth and remote patient certification flexibilities. Extends the suspension of site neutral payment for LTCHs. The Biden administration continues to promote the expansion of home health services, including HCBS services, as a portion of its infrastructure proposal known currently as the American Jobs Plan. This plan includes a proposal to expand HCBS and related services with an outlay of $400 billion over 10 years. The HCBS Access Act proposed by Sens. Hassan, Brown and Casey and Congresswoman Dingell proposes to create an entitlement of HCBS and eliminate the need for state waivers. On April 16, Senators Hassan, Brown, and Casey and Congresswoman Dingell circulated a draft, called the HCBS Access Act, of a proposal to create a new, mandatory entitlement under the Social Security Act for HCBS services. This proposed legislation, among other things, increases the FMAP for HCBS services to 100%, nationalizes a presumption for patients in favor of in-home care as opposed to institutional care and eventually eliminates state Medicaid waivers/State Plans in favor of a new national program. Relatedly, these members of Congress solicited formal comment on the legislation indicating a component of their consideration will be methods to increase payment for providers of HCBS community-based services and a plan to address workforce and minimum wage issues. At Home Care Policy Tailwinds 7
Senator Casey introduced legislation known as the PACE Plus Act significantly expanding Programs for All-Inclusive Care for the Elderly (PACE), a Medicare and Medicaid program that helps keep people in their homes and communities instead of nursing homes. Congress has previously acknowledged the value of this program and urged CMS to “move forward expeditiously” to expand this program. On April 22, a bipartisan group of Senators introduced the new version of the Home Health Emergency Access to Telehealth (HEAT) Act that would give CMS the authority to issue a waiver allowing for telehealth visits to count towards in-person visits as included on the plan of care only during a PHE. The HEAT Act, which seeks to provide reimbursement for telehealth visits, was originally introduced in both the House and Senate in October 2020. Several states in which we operate enacted legislation in Q1 to operationalize recently passed federal legislation enabling nurse practitioners to certify Medicare home health services. Proposed FY22 regulations for Hospice and LTCHs have recently been released. The Hospice rule includes an increase to the MBI of 2.3% with some significant changes to the quality of care measures, and inclusion of recent legislation affecting program integrity issues. CMS expects LTACH-PPS payments to increase by 1.4%. LTACH-PPS payments for fiscal year 2022 for discharges paid using the standard LTACH payment rate is expected to increase by 1.2% due primarily to the annual standard Federal rate update for fiscal year 2022 of 2.2% and a projected 0.8% decrease in high cost outlier payments. LTACH-PPS payments for fiscal year 2022 for discharges paid the site neutral payment rate is expected to increase by 3%. At Home Care Policy Tailwinds continued 8
9 Differentiated Strategies
Joint ventures drive organic growth and margin improvement Same store growth for JV locations averaged 200 basis points higher than non-JV locations for the years 2016-2019. Revenue growth rate for JVs average 10% to 15% in year 2 and 3. Margins for JV locations average 100 to 200 basis points higher than non-JV locations. Continued focus on growth in episodic admissions and rate improvement on non-Medicare admissions Non-Medicare episodic admissions grew by 32.7% in 2020 compared to 2019; and by 20.6% in Q1 2021 as compared to Q1 2020. Improved rate-per-visit by 8% in 2020 over 2019 and 12% over the last three years; and by 3.7% in Q1 2021 as compared to Q1 2020. Continued focus on quality and patient satisfaction to drive higher referrals Increased new home health physician referral sources by 22% in 2020 over 2019; and by 34.8% in Q1 2021 as compared to Q1 2020. Untapped growth in home health and hospice co-locations remains top priority 81 hospice locations co-located with home health out of 120 total hospice locations, or 68%. Up from 77 locations in 2020, 63 locations in 2019 and 58 locations in 2018. Currently averaging 15% to 16% of home health census that gets discharged to hospice. Continue with strategic rollout strategy for HCBS 55 HCBS locations co-located with home health out of 129 total HCBS locations, or 43%. Grow HCBS in markets with value-based arrangements with JV partners and payors. Differentiated Strategy Leading to Quality Growth 10
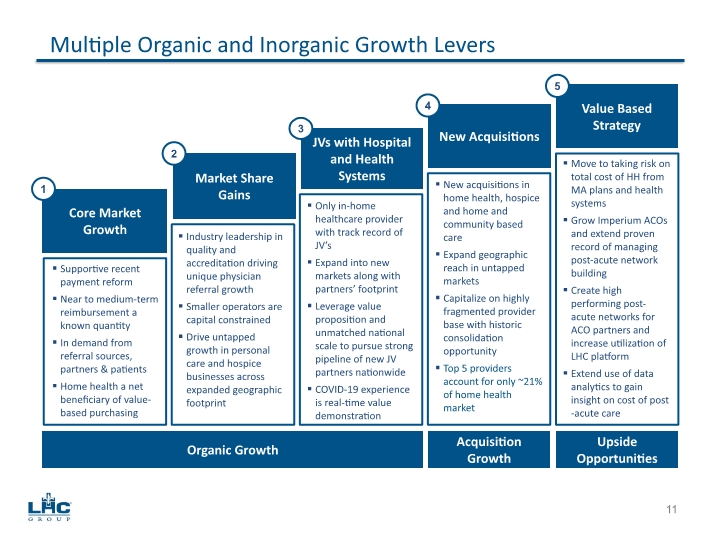
Multiple Organic and Inorganic Growth Levers Organic Growth Acquisition Growth Upside Opportunities Move to taking risk on total cost of HH from MA plans and health systems Grow Imperium ACOs and extend proven record of managing post-acute network building Create high performing post-acute networks for ACO partners and increase utilization of LHC platform Extend use of data analytics to gain insight on cost of post-acute care Core Market Growth Market Share Gains JVs with Hospital and Health Systems New Acquisitions Value Based Strategy New acquisitions in home health, hospice and home and community based care Expand geographic reach in untapped markets Capitalize on highly fragmented provider base with historic consolidation opportunity Top 5 providers account for only ~21% of home health market Only in-home healthcare provider with track record of JV’s Expand into new markets along with partners’ footprint Leverage value proposition and unmatched national scale to pursue strong pipeline of new JV partners nationwide COVID-19 experience is real-time value demonstration Industry leadership in quality and accreditation driving unique physician referral growth Smaller operators are capital constrained Drive untapped growth in personal care and hospice businesses across expanded geographic footprint Supportive recent payment reform Near to medium-term reimbursement a known quantity In demand from referral sources, partners & patients Home health a net beneficiary of value-based purchasing 1 2 3 4 5 11
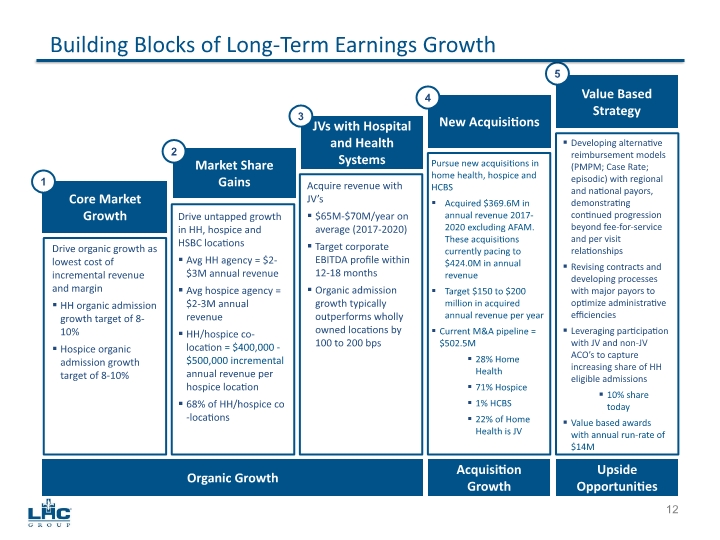
Building Blocks of Long-Term Earnings Growth Developing alternative reimbursement models (PMPM; Case Rate; episodic) with regional and national payors, demonstrating continued progression beyond fee-for-service and per visit relationships Revising contracts and developing processes with major payors to optimize administrative efficiencies Leveraging participation with JV and non-JV ACO’s to capture increasing share of HH eligible admissions 10% share today Value based awards with annual run-rate of $14M Core Market Growth Market Share Gains JVs with Hospital and Health Systems New Acquisitions Value Based Strategy Pursue new acquisitions in home health, hospice and HCBS Acquired $369.6M in annual revenue 2017-2020 excluding AFAM. These acquisitions currently pacing to $424.0M in annual revenue Target $150 to $200 million in acquired annual revenue per year Current M&A pipeline = $502.5M 28% Home Health 71% Hospice 1% HCBS 22% of Home Health is JV Acquire revenue with JV’s $65M-$70M/year on average (2017-2020) Target corporate EBITDA profile within 12-18 months Organic admission growth typically outperforms wholly owned locations by 100 to 200 bps Drive untapped growth in HH, hospice and HSBC locations Avg HH agency = $2-$3M annual revenue Avg hospice agency = $2-3M annual revenue HH/hospice co-location = $400,000 - $500,000 incremental annual revenue per hospice location 68% of HH/hospice co-locations Drive organic growth as lowest cost of incremental revenue and margin HH organic admission growth target of 8-10% Hospice organic admission growth target of 8-10% 1 2 3 4 5 12 Organic Growth Acquisition Growth Upside Opportunities
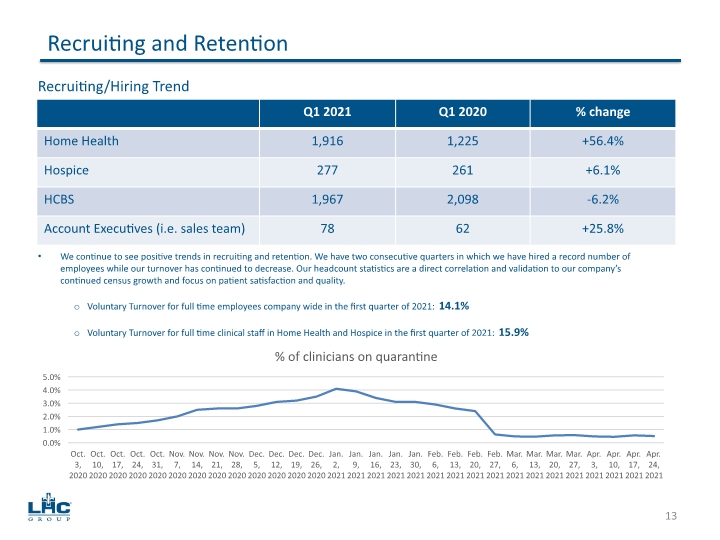
Recruiting and Retention 13 We continue to see positive trends in recruiting and retention. We have two consecutive quarters in which we have hired a record number of employees while our turnover has continued to decrease. Our headcount statistics are a direct correlation and validation to our company’s continued census growth and focus on patient satisfaction and quality. Voluntary Turnover for full time employees company wide in the first quarter of 2021: 14.1% Voluntary Turnover for full time clinical staff in Home Health and Hospice in the first quarter of 2021: 15.9% Recruiting/Hiring Trend
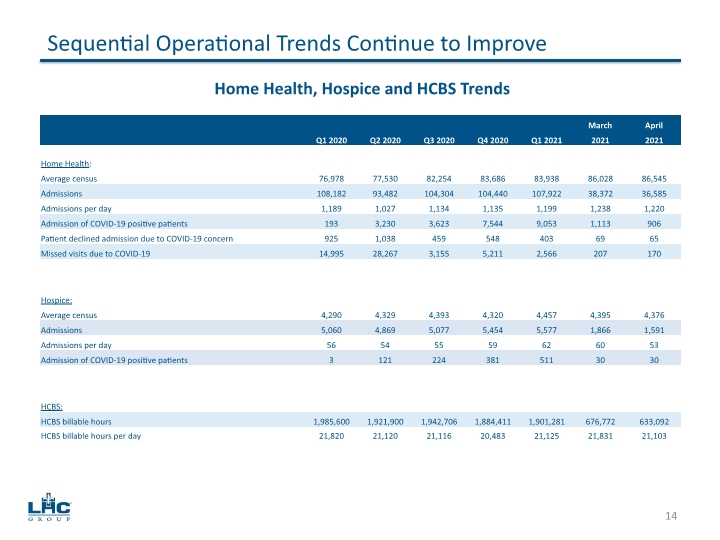
Sequential Operational Trends Continue to Improve 14 Home Health, Hospice and HCBS Trends
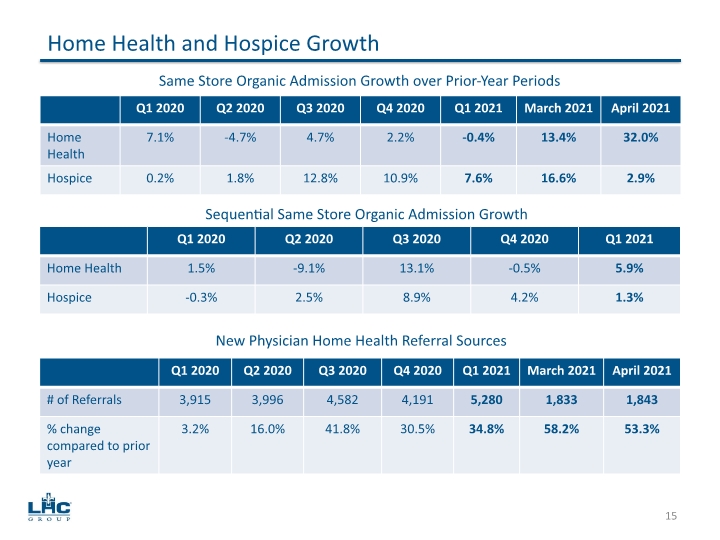
15 Home Health and Hospice Growth Same Store Organic Admission Growth over Prior-Year Periods Sequential Same Store Organic Admission Growth New Physician Home Health Referral Sources
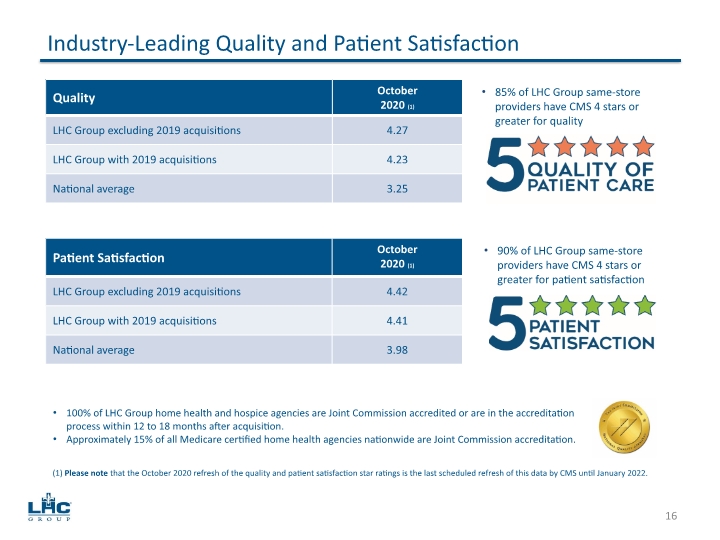
Industry-Leading Quality and Patient Satisfaction 85% of LHC Group same-store providers have CMS 4 stars or greater for quality 16 100% of LHC Group home health and hospice agencies are Joint Commission accredited or are in the accreditation process within 12 to 18 months after acquisition. Approximately 15% of all Medicare certified home health agencies nationwide are Joint Commission accreditation. 90% of LHC Group same-store providers have CMS 4 stars or greater for patient satisfaction (1) Please note that the October 2020 refresh of the quality and patient satisfaction star ratings is the last scheduled refresh of this data by CMS until January 2022.
17 First Quarter Consolidated Results
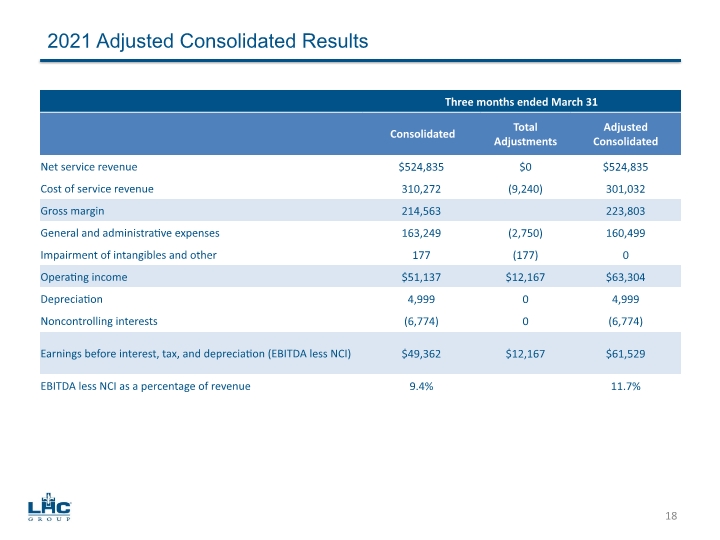
2021 Adjusted Consolidated Results 18
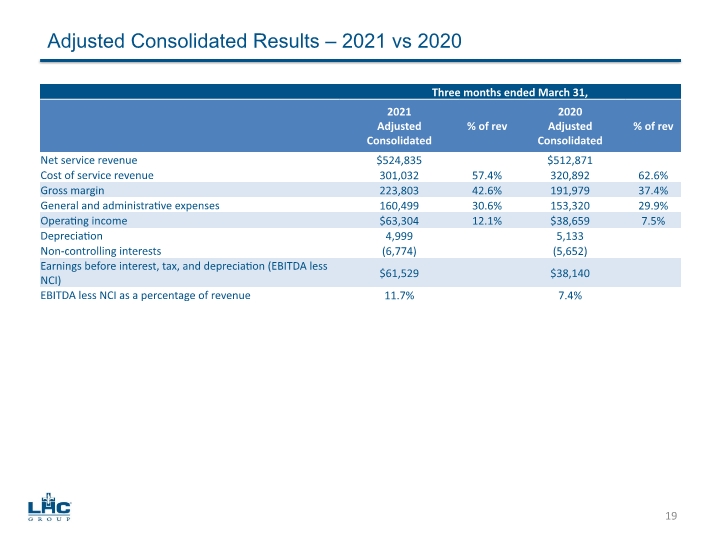
Adjusted Consolidated Results – 2021 vs 2020 19
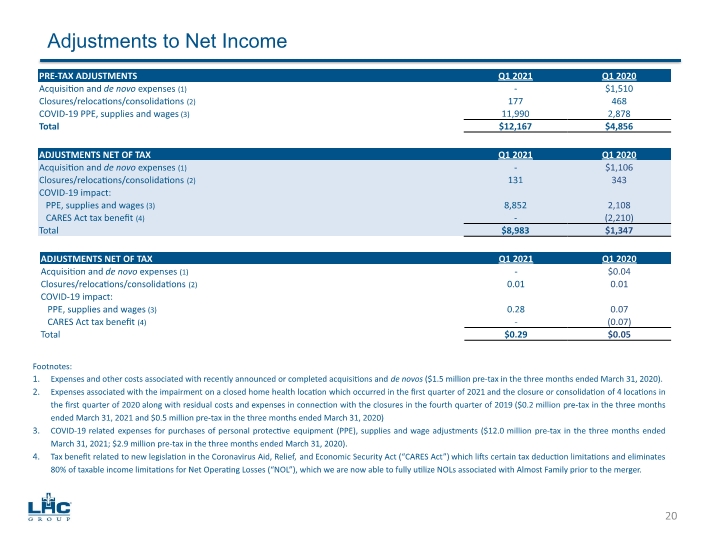
Adjustments to Net Income 20
21 Segment Results
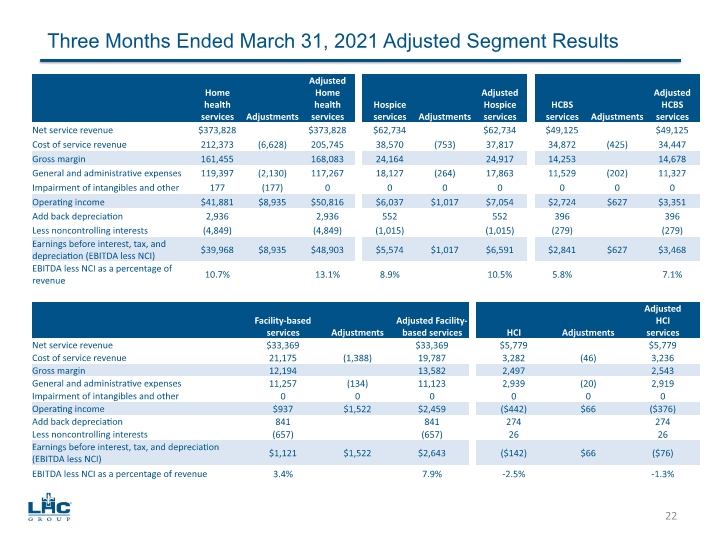
Three Months Ended March 31, 2021 Adjusted Segment Results 22
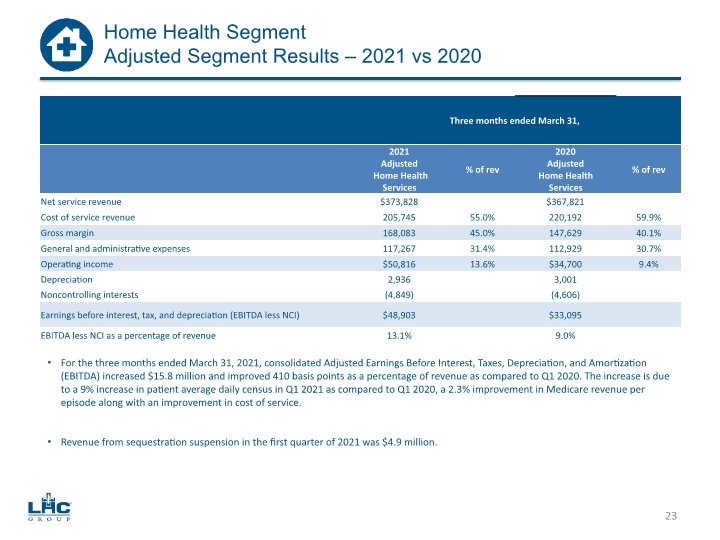
23 Home Health Segment Adjusted Segment Results – 2021 vs 2020 For the three months ended March 31, 2021, consolidated Adjusted Earnings Before Interest, Taxes, Depreciation, and Amortization (EBITDA) increased $15.8 million and improved 410 basis points as a percentage of revenue as compared to Q1 2020. The increase is due to a 9% increase in patient average daily census in Q1 2021 as compared to Q1 2020, a 2.3% improvement in Medicare revenue per episode along with an improvement in cost of service. Revenue from sequestration suspension in the first quarter of 2021 was $4.9 million.
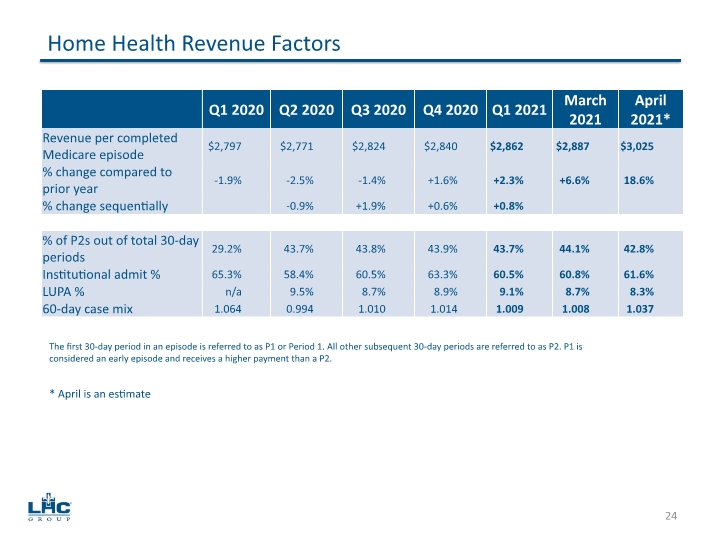
24 Home Health Revenue Factors The first 30-day period in an episode is referred to as P1 or Period 1. All other subsequent 30-day periods are referred to as P2. P1 is considered an early episode and receives a higher payment than a P2. * April is an estimate
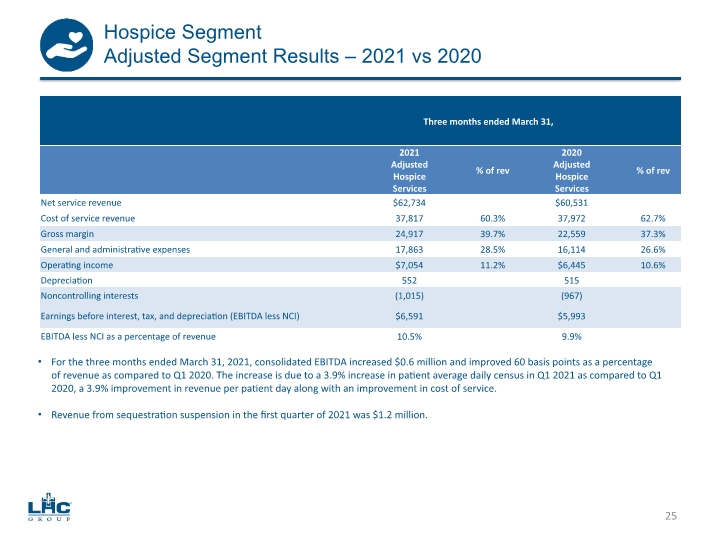
25 Hospice Segment Adjusted Segment Results – 2021 vs 2020 For the three months ended March 31, 2021, consolidated EBITDA increased $0.6 million and improved 60 basis points as a percentage of revenue as compared to Q1 2020. The increase is due to a 3.9% increase in patient average daily census in Q1 2021 as compared to Q1 2020, a 3.9% improvement in revenue per patient day along with an improvement in cost of service. Revenue from sequestration suspension in the first quarter of 2021 was $1.2 million.
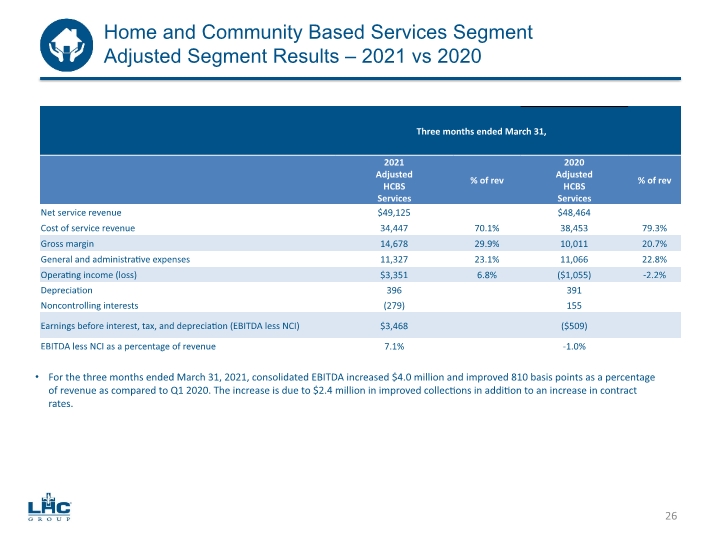
26 Home and Community Based Services Segment Adjusted Segment Results – 2021 vs 2020 For the three months ended March 31, 2021, consolidated EBITDA increased $4.0 million and improved 810 basis points as a percentage of revenue as compared to Q1 2020. The increase is due to $2.4 million in improved collections in addition to an increase in contract rates.
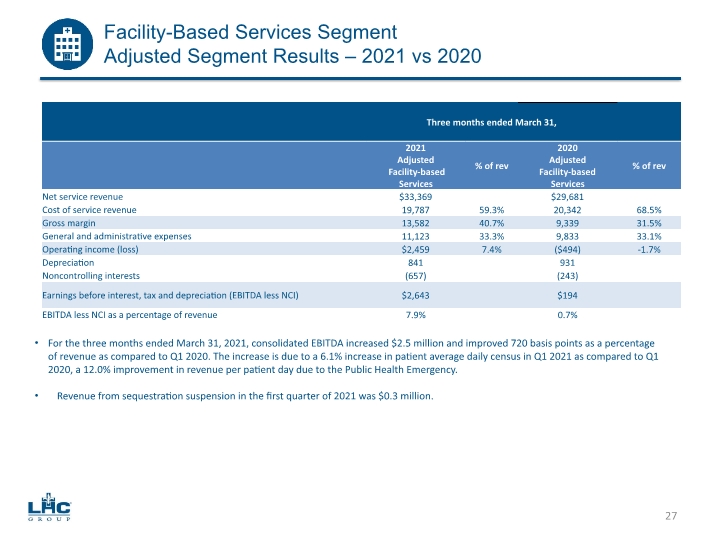
Facility-Based Services Segment Adjusted Segment Results – 2021 vs 2020 27 For the three months ended March 31, 2021, consolidated EBITDA increased $2.5 million and improved 720 basis points as a percentage of revenue as compared to Q1 2020. The increase is due to a 6.1% increase in patient average daily census in Q1 2021 as compared to Q1 2020, a 12.0% improvement in revenue per patient day due to the Public Health Emergency. Revenue from sequestration suspension in the first quarter of 2021 was $0.3 million.
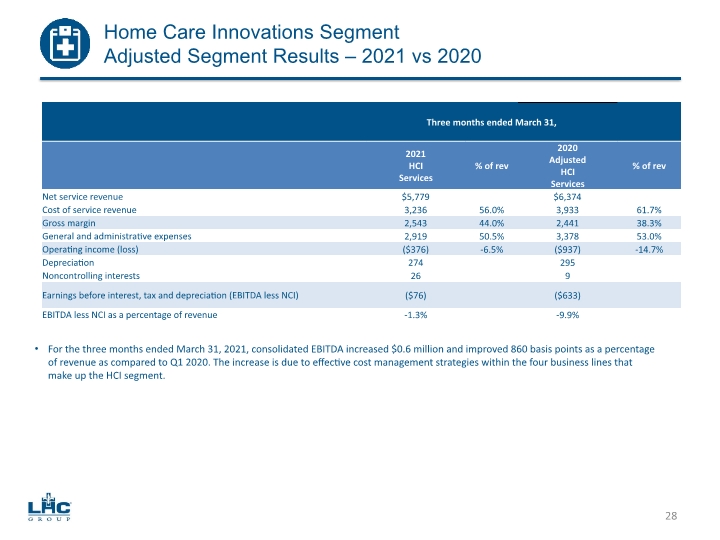
Home Care Innovations Segment Adjusted Segment Results – 2021 vs 2020 28 For the three months ended March 31, 2021, consolidated EBITDA increased $0.6 million and improved 860 basis points as a percentage of revenue as compared to Q1 2020. The increase is due to effective cost management strategies within the four business lines that make up the HCI segment.

29 Guidance, Liquidity & Outlook
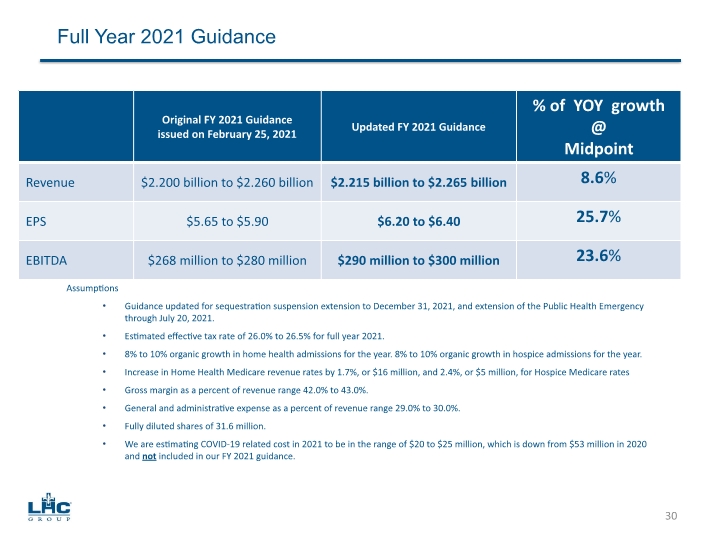
Assumptions Guidance updated for sequestration suspension extension to December 31, 2021, and extension of the Public Health Emergency through July 20, 2021. Estimated effective tax rate of 26.0% to 26.5% for full year 2021. 8% to 10% organic growth in home health admissions for the year. 8% to 10% organic growth in hospice admissions for the year. Increase in Home Health Medicare revenue rates by 1.7%, or $16 million, and 2.4%, or $5 million, for Hospice Medicare rates Gross margin as a percent of revenue range 42.0% to 43.0%. General and administrative expense as a percent of revenue range 29.0% to 30.0%. Fully diluted shares of 31.6 million. We are estimating COVID-19 related cost in 2021 to be in the range of $20 to $25 million, which is down from $53 million in 2020 and not included in our FY 2021 guidance. Full Year 2021 Guidance 30
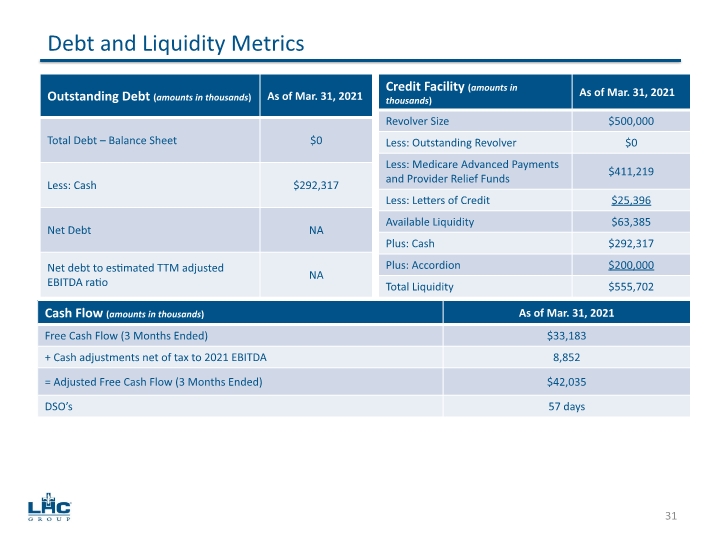
Debt and Liquidity Metrics 31
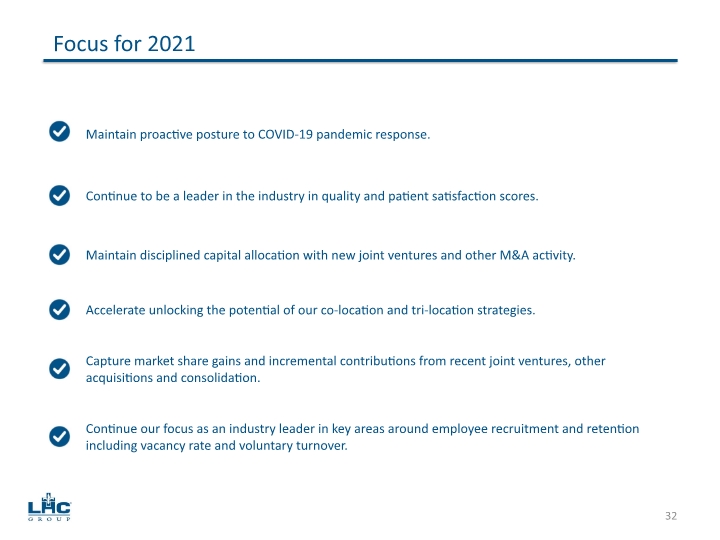
Focus for 2021 32 Maintain disciplined capital allocation with new joint ventures and other M&A activity. Accelerate unlocking the potential of our co-location and tri-location strategies. Maintain proactive posture to COVID-19 pandemic response. Continue to be a leader in the industry in quality and patient satisfaction scores. Capture market share gains and incremental contributions from recent joint ventures, other acquisitions and consolidation. Continue our focus as an industry leader in key areas around employee recruitment and retention including vacancy rate and voluntary turnover.
33 Appendix
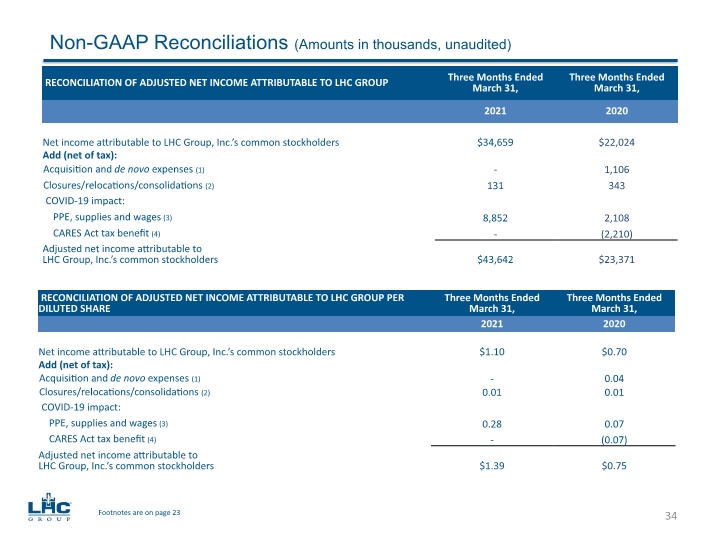
Non-GAAP Reconciliations (Amounts in thousands, unaudited) 34 Footnotes are on page 23
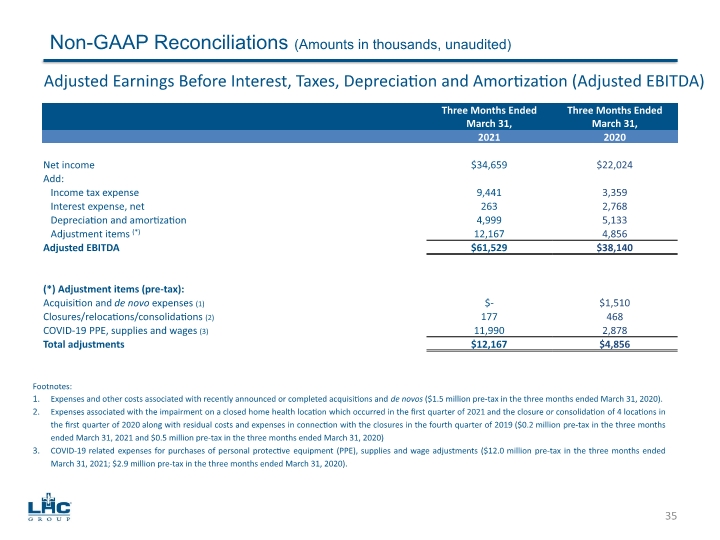
Non-GAAP Reconciliations (Amounts in thousands, unaudited) 35 Adjusted Earnings Before Interest, Taxes, Depreciation and Amortization (Adjusted EBITDA)
