Attached files
| file | filename |
|---|---|
| 8-K - 8-K - ASSOCIATED BANC-CORP | asb-20210506.htm |
May 6, 2021 Associated Banc-Corp Second Quarter 2021 Investor Presentation Exhibit 99.1
1 Forward-Looking Statements Important note regarding forward-looking statements: Statements made in this presentation which are not purely historical are forward-looking statements, as defined in the Private Securities Litigation Reform Act of 1995. This includes any statements regarding management’s plans, objectives, or goals for future operations, products or services, and forecasts of its revenues, earnings, or other measures of performance. Such forward-looking statements may be identified by the use of words such as “believe,” “expect,” “anticipate,” “plan,” “estimate,” “should,” “will,” “intend,” "target,“ “outlook,” “guidance,” or similar expressions. Forward-looking statements are based on current management expectations and, by their nature, are subject to risks and uncertainties. Actual results may differ materially from those contained in the forward-looking statements. Factors which may cause actual results to differ materially from those contained in such forward-looking statements include those identified in the Company’s most recent Form 10-K and subsequent Form 10-Qs and other SEC filings, and such factors are incorporated herein by reference. Trademarks: All trademarks, service marks, and trade names referenced in this material are official trademarks and the property of their respective owners. Presentation: Within the charts and tables presented, certain segments, columns and rows may not sum to totals shown due to rounding. Non-GAAP Measures: This presentation includes certain non-GAAP financial measures. These non-GAAP measures are provided in addition to, and not as substitutes for, measures of our financial performance determined in accordance with GAAP. Our calculation of these non-GAAP measures may not be comparable to similarly titled measures of other companies due to potential differences between companies in the method of calculation. As a result, the use of these non-GAAP measures has limitations and should not be considered superior to, in isolation from, or as a substitute for, related GAAP measures. Reconciliations of these non-GAAP financial measures to the most directly comparable GAAP financial measures can be found at the end of this presentation.
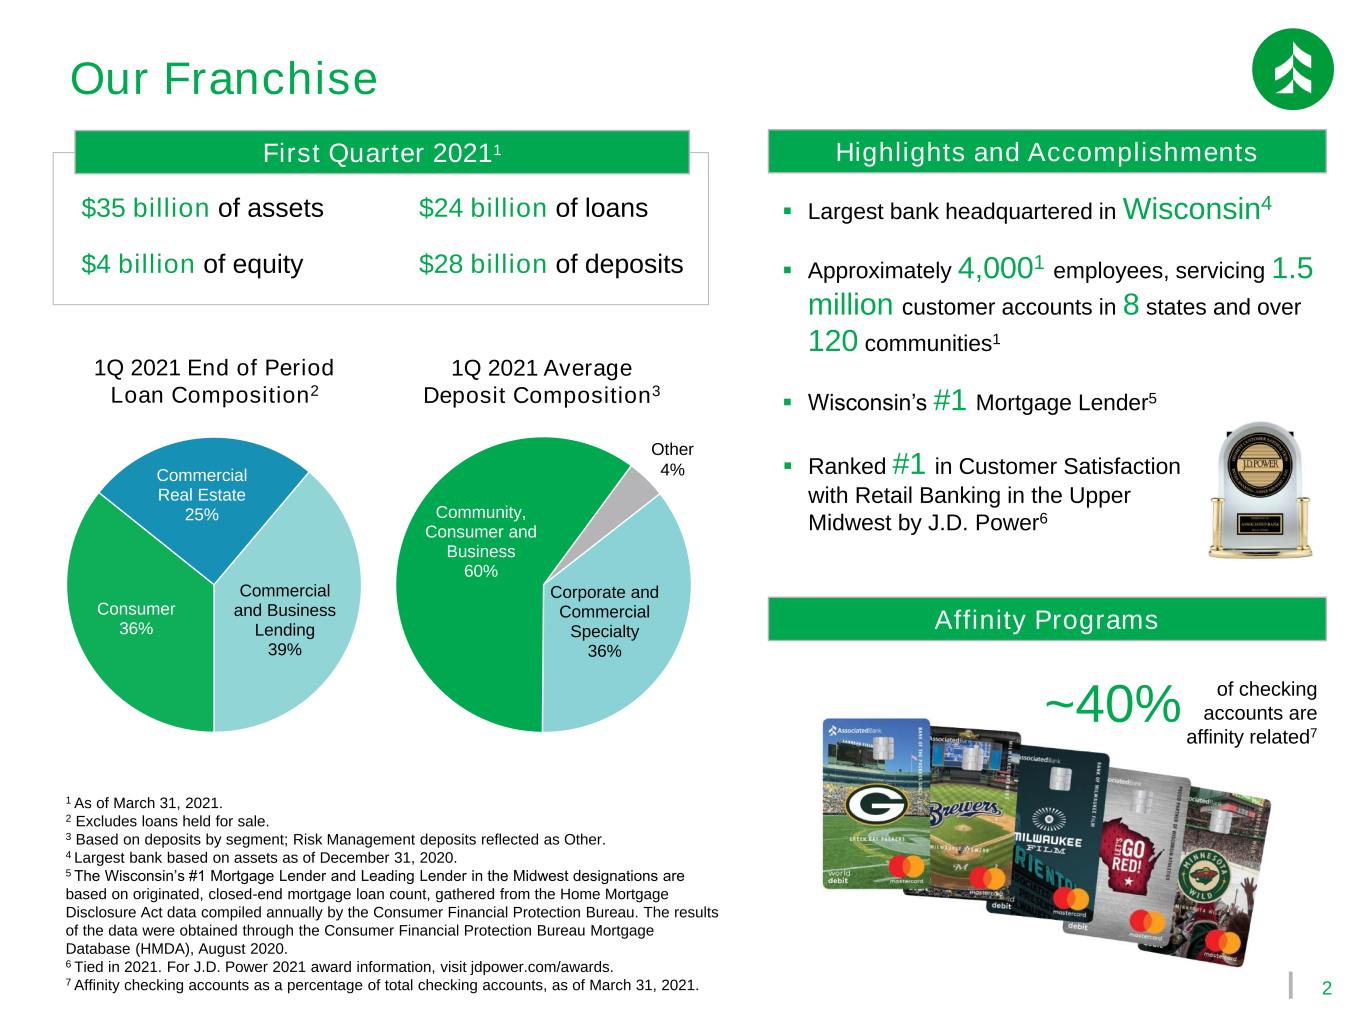
2 Our Franchise Consumer 36% Commercial Real Estate 25% Commercial and Business Lending 39% $35 billion of assets $24 billion of loans $4 billion of equity $28 billion of deposits 1 As of March 31, 2021. 2 Excludes loans held for sale. 3 Based on deposits by segment; Risk Management deposits reflected as Other. 4 Largest bank based on assets as of December 31, 2020. 5 The Wisconsin’s #1 Mortgage Lender and Leading Lender in the Midwest designations are based on originated, closed-end mortgage loan count, gathered from the Home Mortgage Disclosure Act data compiled annually by the Consumer Financial Protection Bureau. The results of the data were obtained through the Consumer Financial Protection Bureau Mortgage Database (HMDA), August 2020. 6 Tied in 2021. For J.D. Power 2021 award information, visit jdpower.com/awards. 7 Affinity checking accounts as a percentage of total checking accounts, as of March 31, 2021. First Quarter 20211 Affinity Programs 1Q 2021 End of Period Loan Composition2 ▪ Largest bank headquartered in Wisconsin4 ▪ Approximately 4,0001 employees, servicing 1.5 million customer accounts in 8 states and over 120 communities1 ▪ Wisconsin’s #1 Mortgage Lender5 Highlights and Accomplishments ~40% of checking accounts are affinity related7 1Q 2021 Average Deposit Composition3 Corporate and Commercial Specialty 36% Community, Consumer and Business 60% Other 4% ▪ Ranked #1 in Customer Satisfaction with Retail Banking in the Upper Midwest by J.D. Power6
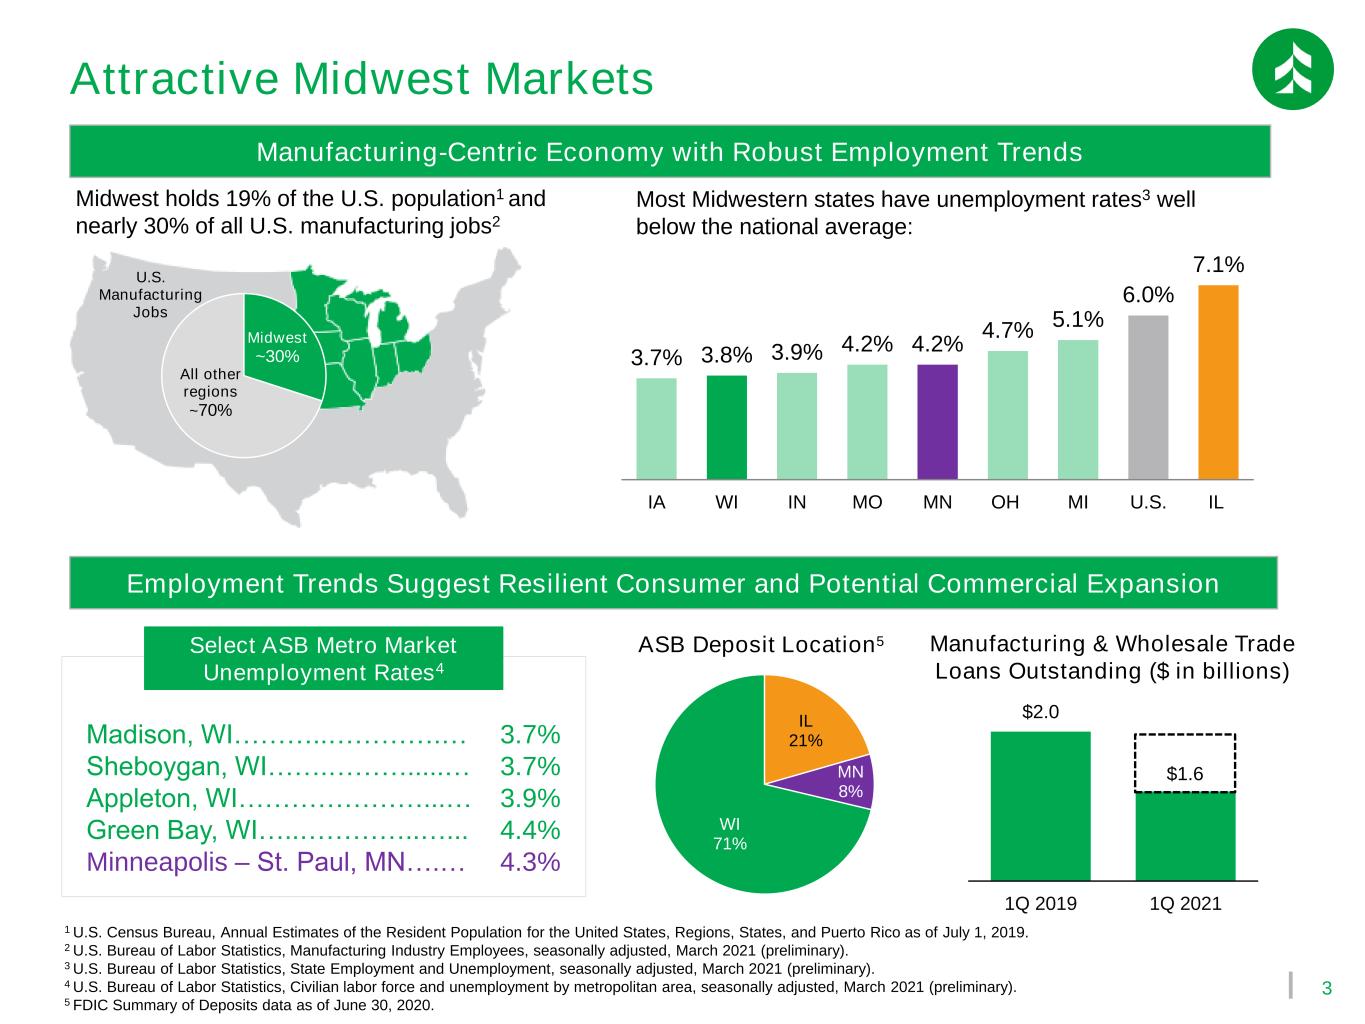
3 Midwest ~30% All other regions ~70% U.S. Manufacturing Jobs Attractive Midwest Markets Manufacturing-Centric Economy with Robust Employment Trends Midwest holds 19% of the U.S. population1 and nearly 30% of all U.S. manufacturing jobs2 Employment Trends Suggest Resilient Consumer and Potential Commercial Expansion 3.7% 3.8% 3.9% 4.2% 4.2% 4.7% 5.1% 6.0% 7.1% IA WI IN MO MN OH MI U.S. IL 1 U.S. Census Bureau, Annual Estimates of the Resident Population for the United States, Regions, States, and Puerto Rico as of July 1, 2019. 2 U.S. Bureau of Labor Statistics, Manufacturing Industry Employees, seasonally adjusted, March 2021 (preliminary). 3 U.S. Bureau of Labor Statistics, State Employment and Unemployment, seasonally adjusted, March 2021 (preliminary). 4 U.S. Bureau of Labor Statistics, Civilian labor force and unemployment by metropolitan area, seasonally adjusted, March 2021 (preliminary). 5 FDIC Summary of Deposits data as of June 30, 2020. Most Midwestern states have unemployment rates3 well below the national average: Madison, WI………..………….… Sheboygan, WI…….……….....… Appleton, WI…………………...… Green Bay, WI…..…………..…... Minneapolis – St. Paul, MN….… 3.7% 3.7% 3.9% 4.4% 4.3% Select ASB Metro Market Unemployment Rates4 IL 21% MN 8% WI 71% ASB Deposit Location5 $2.0 $1.6 1Q 2019 1Q 2021 Manufacturing & Wholesale Trade Loans Outstanding ($ in billions)

4 Positioned for Growth ...and have proactively managed costs... ▪ Further rationalized our branch network by 9%1 ▪ Reduced staffing levels by 14%1 ▪ Back office streamlining drove additional savings ...while putting the pandemic behind us in 1Q... ▪ Potential problem loans, nonaccrual loans and net charge-offs all declined during the quarter ▪ Negative provision of $23 million ▪ $28 million net reserve release ...driving increased capital flexibility ▪ Regulatory capital ratios remain strong ▪ Maintaining capital cushion to support C&BL line draws ▪ Capacity to fund additional loan growth moving forward We have ample opportunity for expansion... ▪ Commercial line utilization at historic lows ▪ C&BL line draws expected to widen spreads Quarterly noninterest expense down 9% YoY CET1 up 140 basis points YoY Active loan deferrals represent 0.15% of total loans at 1Q Over $7 billion of unfunded C&BL loan commitments 1 Down from 6/30/2020. Embracing Growth Proactively Managing Costs Improving Credit Position Capacity to Grow $5,551 $7,233 1Q 2020 1Q 2021 (C&BL Unfunded Loan Commitments) (Noninterest expense) (Active loan deferrals) (CET1 Ratio) $192 $175 1Q 2020 1Q 2021 $1,588 $37 2Q 2020 1Q 2021 9.36% 10.76% 1Q 2020 1Q 2021 ($ in millions)
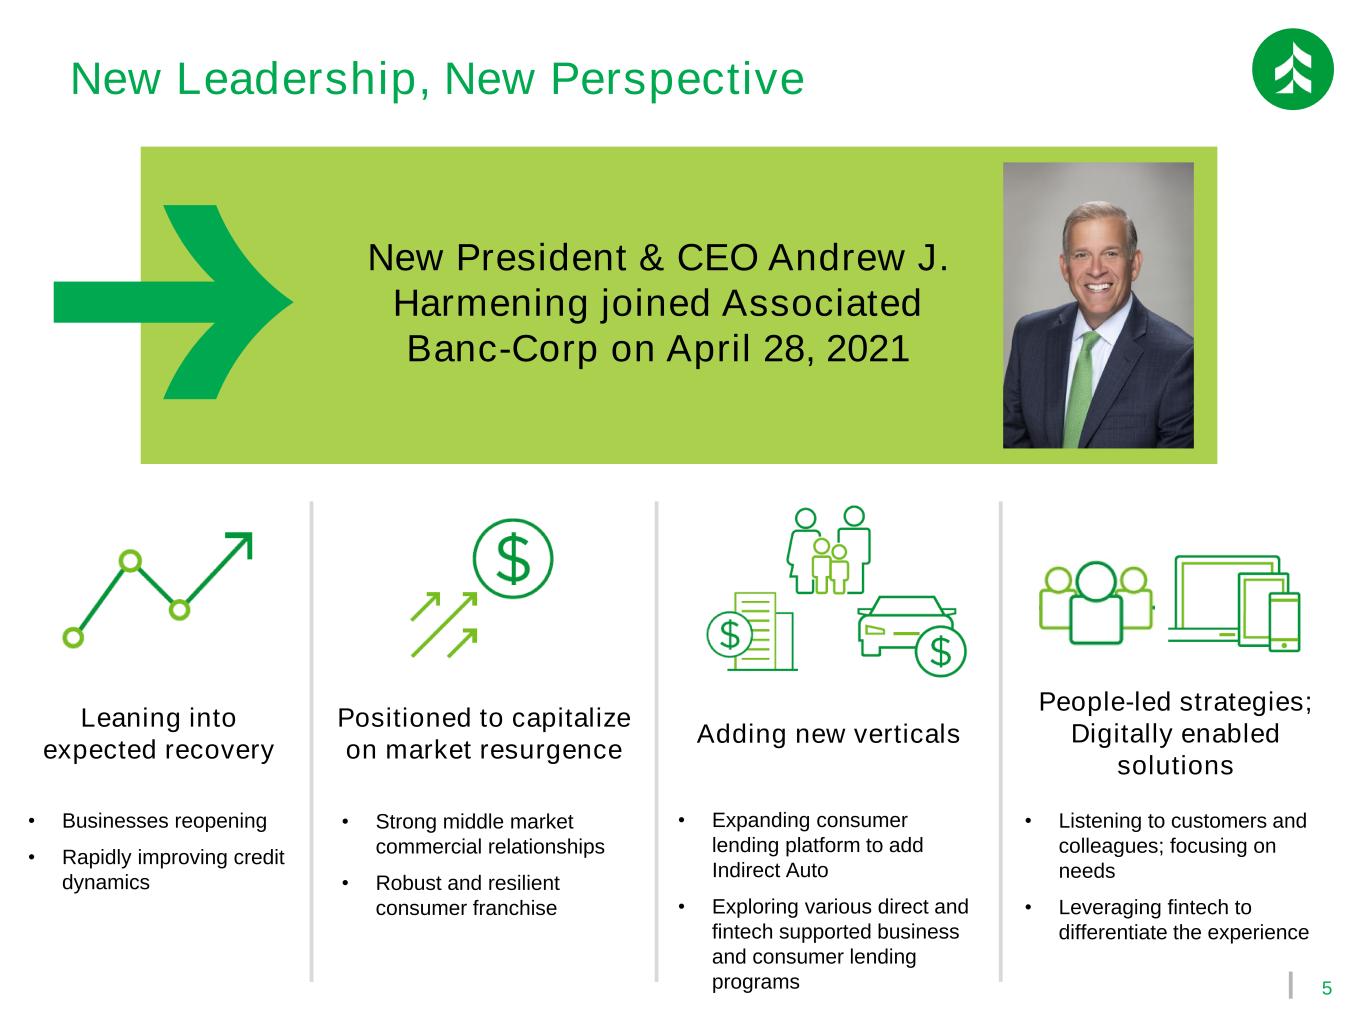
5 New Leadership, New Perspective New President & CEO Andrew J. Harmening joined Associated Banc-Corp on April 28, 2021 Leaning into expected recovery Adding new verticals Positioned to capitalize on market resurgence • Businesses reopening • Rapidly improving credit dynamics • Expanding consumer lending platform to add Indirect Auto • Exploring various direct and fintech supported business and consumer lending programs • Strong middle market commercial relationships • Robust and resilient consumer franchise People-led strategies; Digitally enabled solutions • Listening to customers and colleagues; focusing on needs • Leveraging fintech to differentiate the experience
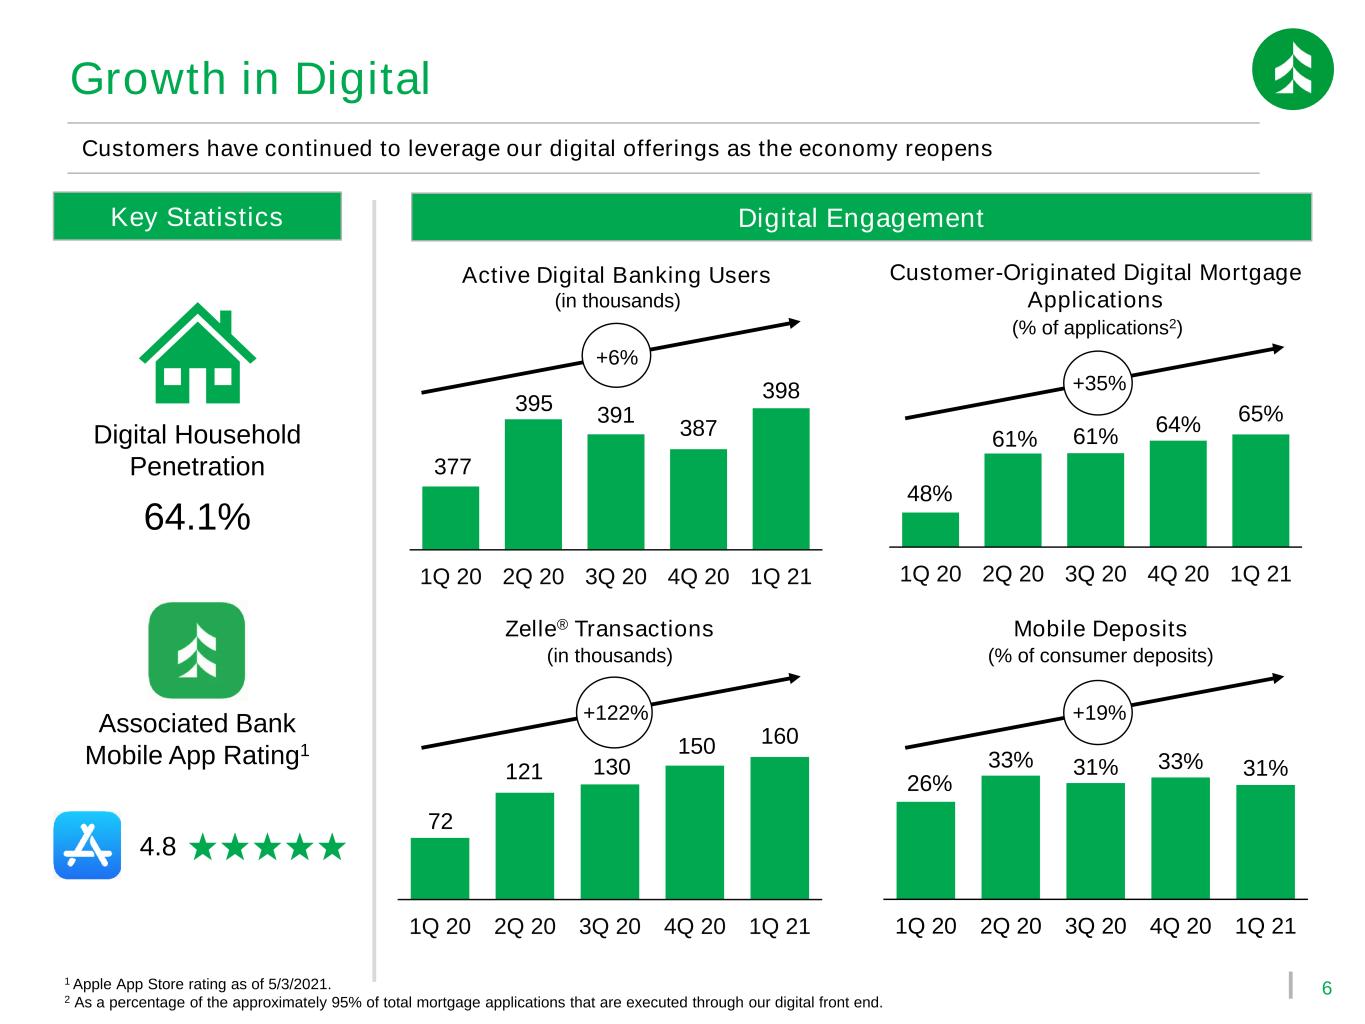
6 377 395 391 387 398 1Q 20 2Q 20 3Q 20 4Q 20 1Q 21 Customer-Originated Digital Mortgage Applications 26% 33% 31% 33% 31% 1Q 20 2Q 20 3Q 20 4Q 20 1Q 21 Growth in Digital Digital Engagement Customers have continued to leverage our digital offerings as the economy reopens Active Digital Banking Users (in thousands) Mobile Deposits 72 121 130 150 160 1Q 20 2Q 20 3Q 20 4Q 20 1Q 21 Zelle® Transactions (in thousands) Key Statistics Digital Household Penetration 64.1% Associated Bank Mobile App Rating1 4.8 1 Apple App Store rating as of 5/3/2021. 2 As a percentage of the approximately 95% of total mortgage applications that are executed through our digital front end. (% of consumer deposits) +6% +122% 48% 61% 61% 64% 65% 1Q 20 2Q 20 3Q 20 4Q 20 1Q 21 (% of applications2) +35% +19%
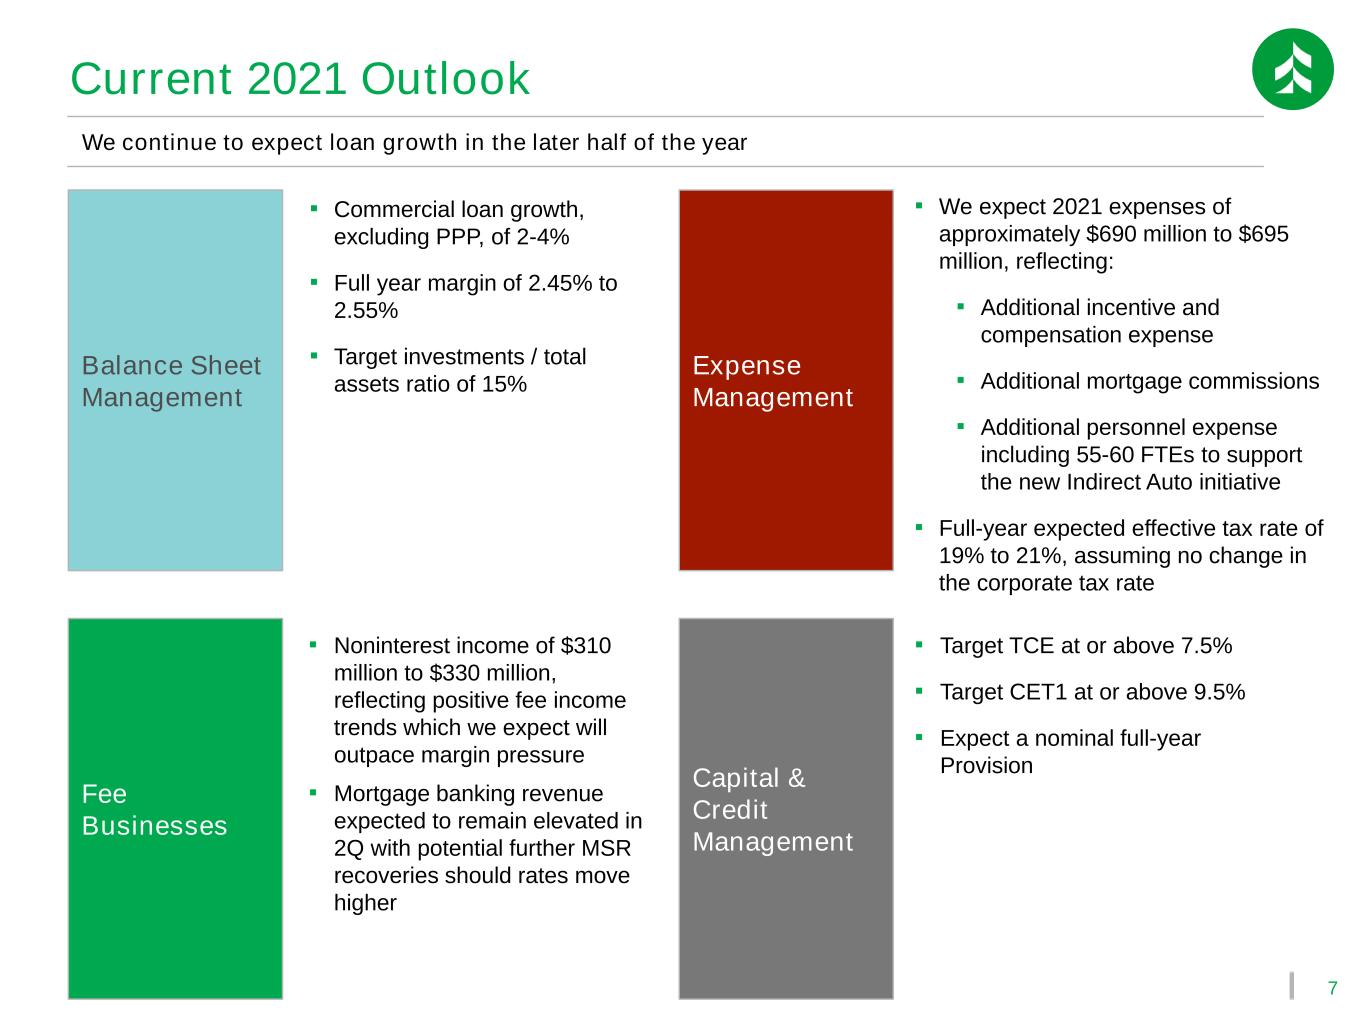
7 Balance Sheet Management ▪ Commercial loan growth, excluding PPP, of 2-4% ▪ Full year margin of 2.45% to 2.55% ▪ Target investments / total assets ratio of 15% Fee Businesses ▪ Noninterest income of $310 million to $330 million, reflecting positive fee income trends which we expect will outpace margin pressure ▪ Mortgage banking revenue expected to remain elevated in 2Q with potential further MSR recoveries should rates move higher Expense Management ▪ We expect 2021 expenses of approximately $690 million to $695 million, reflecting: ▪ Additional incentive and compensation expense ▪ Additional mortgage commissions ▪ Additional personnel expense including 55-60 FTEs to support the new Indirect Auto initiative ▪ Full-year expected effective tax rate of 19% to 21%, assuming no change in the corporate tax rate Capital & Credit Management ▪ Target TCE at or above 7.5% ▪ Target CET1 at or above 9.5% ▪ Expect a nominal full-year Provision We continue to expect loan growth in the later half of the year Current 2021 Outlook

Financial Trends
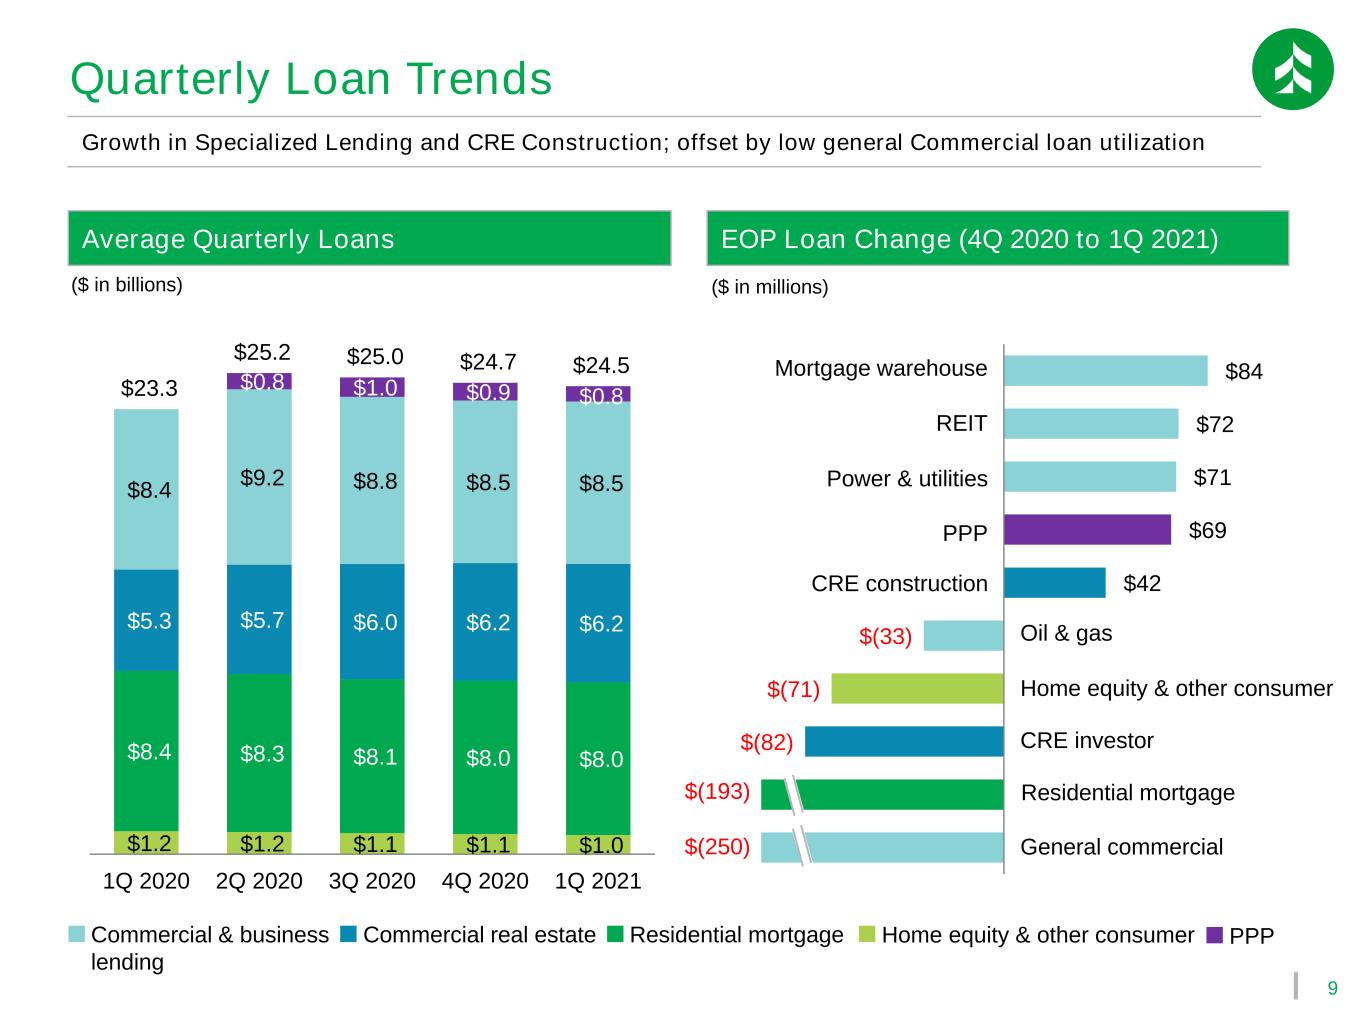
9 $1.2 $1.2 $1.1 $1.1 $1.0 $8.4 $8.3 $8.1 $8.0 $8.0 $5.3 $5.7 $6.0 $6.2 $6.2 $8.4 $9.2 $8.8 $8.5 $8.5 $0.8 $1.0 $0.9 $0.8 $23.3 $25.2 $25.0 $24.7 $24.5 1Q 2020 2Q 2020 3Q 2020 4Q 2020 1Q 2021 $(82) $(71) $(33) $42 $69 $71 $72 $84 Quarterly Loan Trends CRE investor Residential mortgage Home equity & other consumer General commercial REIT Power & utilities ($ in millions) Oil & gas Growth in Specialized Lending and CRE Construction; offset by low general Commercial loan utilization CRE construction Average Quarterly Loans ($ in billions) EOP Loan Change (4Q 2020 to 1Q 2021) Commercial & business lending Commercial real estate Residential mortgage Home equity & other consumer PPP Mortgage warehouse PPP $(193) $(250)
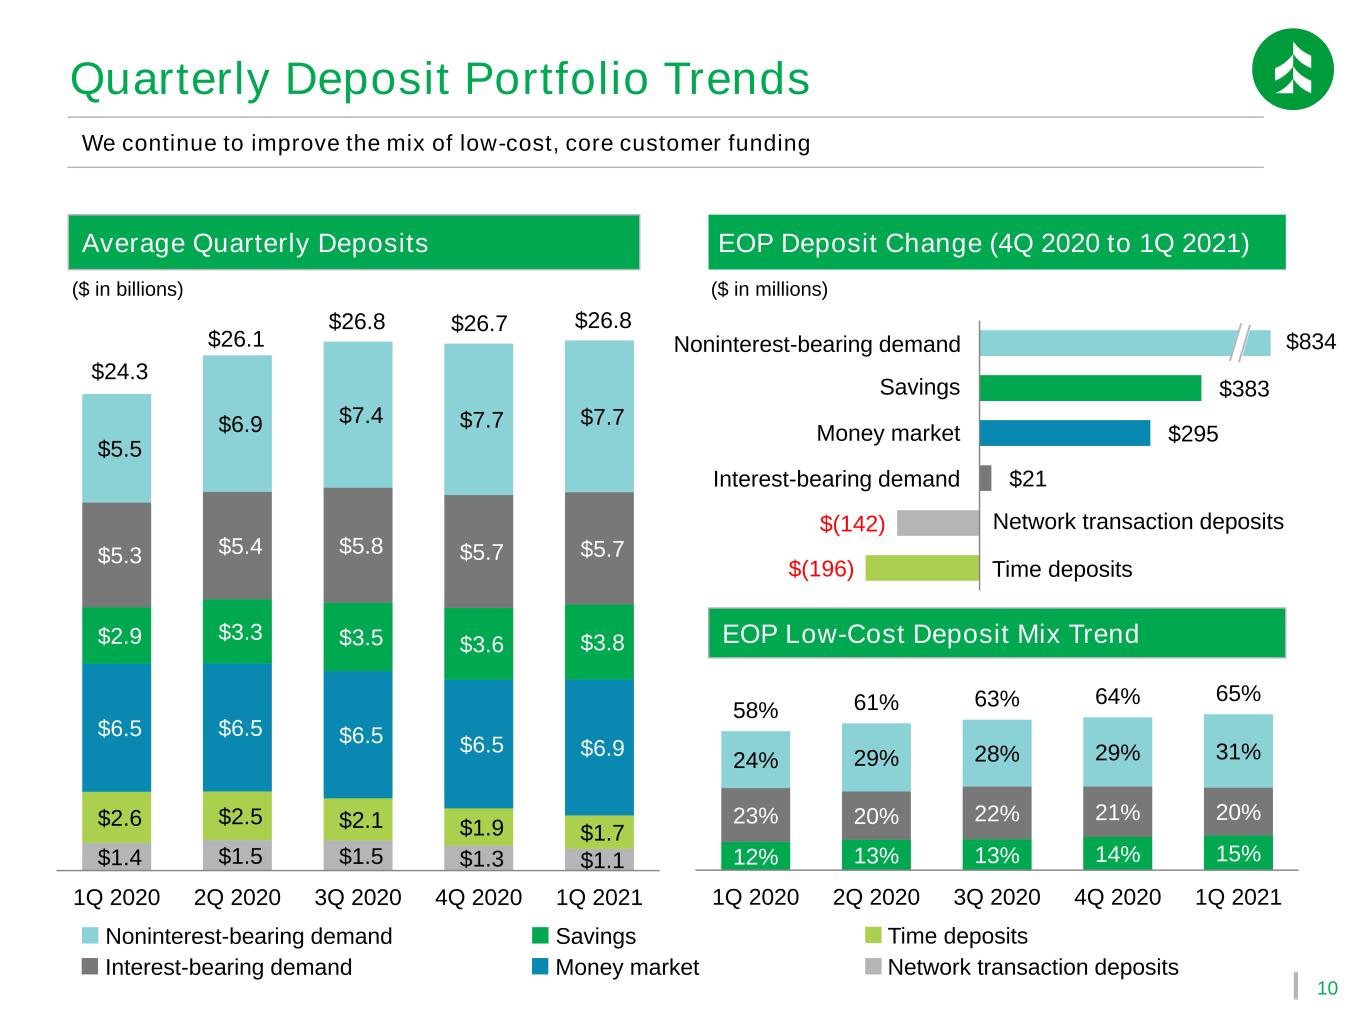
10 $1.4 $1.5 $1.5 $1.3 $1.1 $2.6 $2.5 $2.1 $1.9 $1.7 $6.5 $6.5 $6.5 $6.5 $6.9 $2.9 $3.3 $3.5 $3.6 $3.8 $5.3 $5.4 $5.8 $5.7 $5.7 $5.5 $6.9 $7.4 $7.7 $7.7 $24.3 $26.1 $26.8 $26.7 $26.8 1Q 2020 2Q 2020 3Q 2020 4Q 2020 1Q 2021 Quarterly Deposit Portfolio Trends ($ in billions) Average Quarterly Deposits Time depositsSavings Money market EOP Deposit Change (4Q 2020 to 1Q 2021) Network transaction deposits We continue to improve the mix of low-cost, core customer funding Noninterest-bearing demand Interest-bearing demand $(196) $(142) $21 $295 $383 ($ in millions) EOP Low-Cost Deposit Mix Trend 12% 13% 13% 14% 15% 23% 20% 22% 21% 20% 24% 29% 28% 29% 31% 58% 61% 63% 64% 65% 1Q 2020 2Q 2020 3Q 2020 4Q 2020 1Q 2021 Noninterest-bearing demand Savings Money market Network transaction deposits Time deposits Interest-bearing demand $834

11 Net Interest Income and Yield Trends Quarterly NII and Monthly NIM 4.34% 3.24% 2.93% 2.88% 2.91% 3.85% 2.80% 2.59% 2.69% 2.57% 3.33% 3.04% 3.06% 3.00% 2.79% 2.86% 2.41% 1.90% 1.94% 1.81% 1.06% 0.60% 0.52% 0.43% 0.40% 0.65% 0.10% 0.08% 0.07% 0.07% 1.63% 1.44% 1.21% 0.97% 0.74% 1Q 2020 2Q 2020 3Q 2020 4Q 2020 1Q 2021 $190 $182 $188 $176 2.71% 2.30% 2.35% 2.56% 2.36% Apr May Jun July Aug Sep Oct Nov Dec Jan Feb Mar Average Yields ($ in millions) 1Q margin dipped as declining mortgage and C&I spreads outpaced declining liability costs Total residential mortgage loans Commercial and business lending loans excluding PPP Commercial real estate loans Total interest- bearing liabilities1 Time deposits Net interest income Net interest margin Total interest-bearing deposits excluding Time 2Q 2020 3Q 2020 4Q 2020 1Q 2021 1 Reflects approximately $1 billion repayment of FHLB advances in 3Q and $1 billion repayment of PPPLF in 4Q. Investments
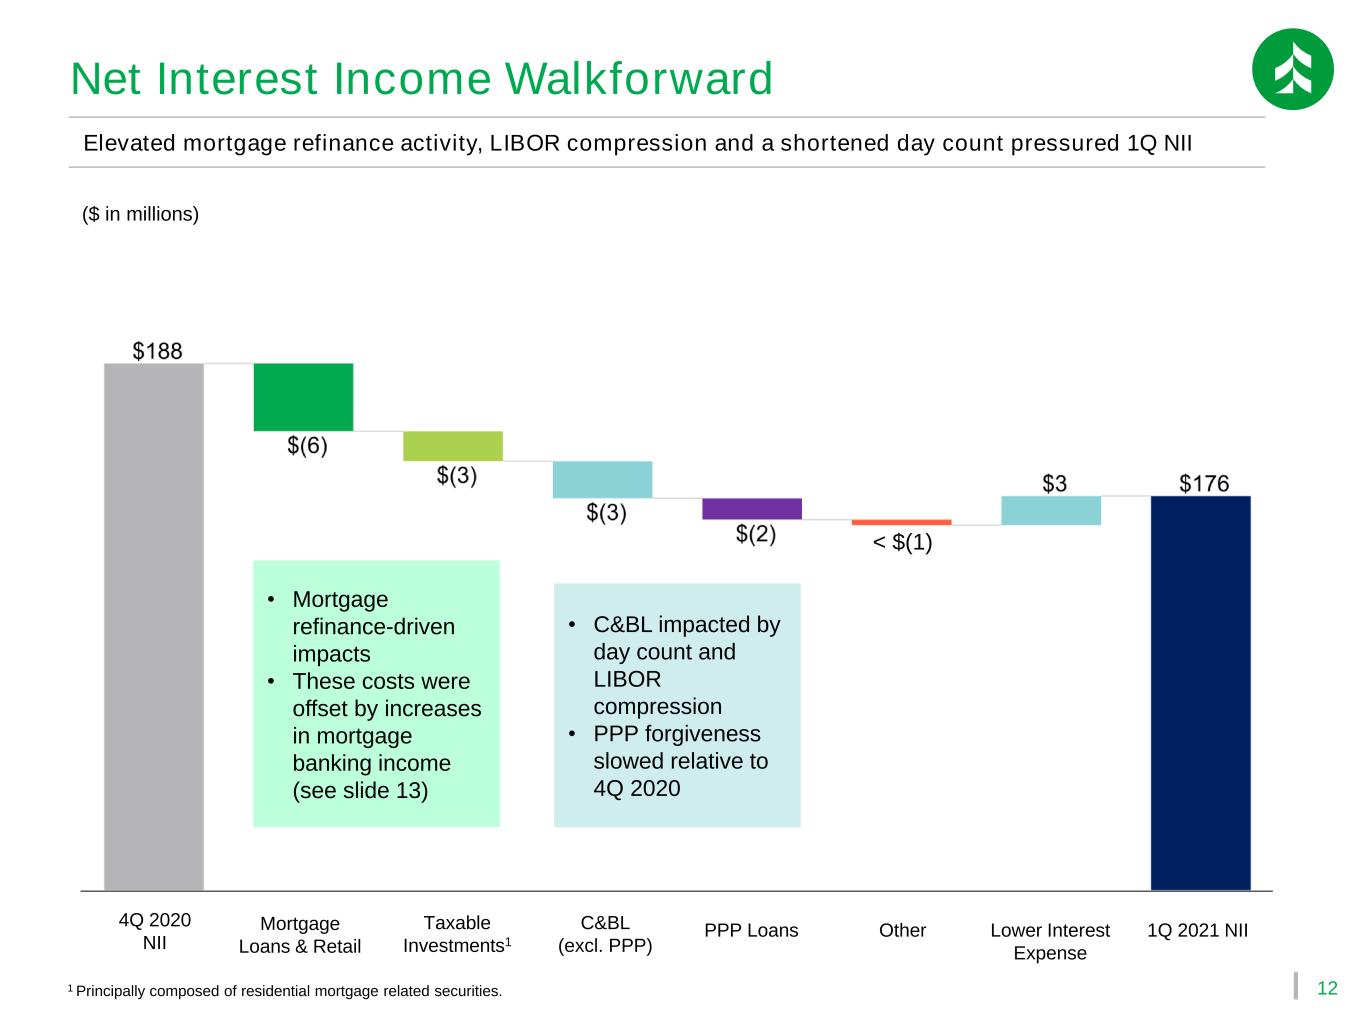
12 Net Interest Income Walkforward Elevated mortgage refinance activity, LIBOR compression and a shortened day count pressured 1Q NII 1 Principally composed of residential mortgage related securities. • Mortgage refinance-driven impacts • These costs were offset by increases in mortgage banking income (see slide 13) • C&BL impacted by day count and LIBOR compression • PPP forgiveness slowed relative to 4Q 2020 4Q 2020 NII C&BL (excl. PPP) Taxable Investments1 Mortgage Loans & Retail PPP Loans Lower Interest Expense Other 1Q 2021 NII < $(1) ($ in millions)
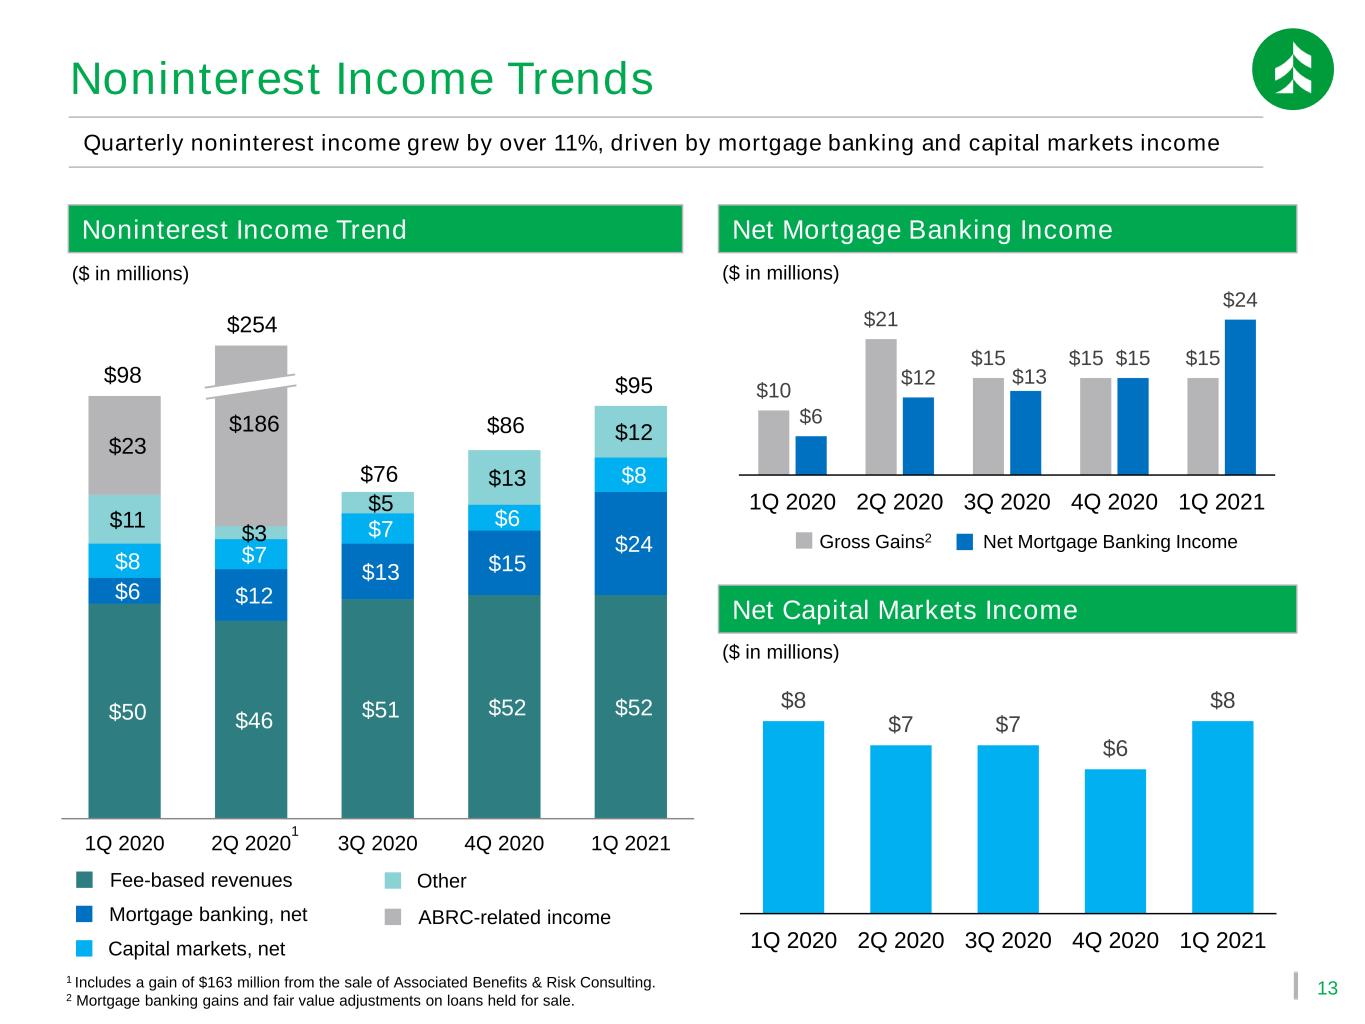
13 $10 $21 $15 $15 $15 $6 $12 $13 $15 $24 1Q 2020 2Q 2020 3Q 2020 4Q 2020 1Q 2021 $50 $46 $51 $52 $52 $6 $12 $13 $15 $24 $8 $7 $7 $6 $8 $11 $3 $5 $13 $12 $23 $186 1Q 2020 2Q 2020 3Q 2020 4Q 2020 1Q 2021 $254 $98 $76 $86 $95 Noninterest Income Trends Net Mortgage Banking IncomeNoninterest Income Trend ($ in millions) ($ in millions) ($ in millions) Net Capital Markets Income Quarterly noninterest income grew by over 11%, driven by mortgage banking and capital markets income Fee-based revenues Capital markets, net Mortgage banking, net Other Net Mortgage Banking IncomeGross Gains2 $8 $7 $7 $6 $8 1Q 2020 2Q 2020 3Q 2020 4Q 2020 1Q 2021 1 1 Includes a gain of $163 million from the sale of Associated Benefits & Risk Consulting. 2 Mortgage banking gains and fair value adjustments on loans held for sale. ABRC-related income
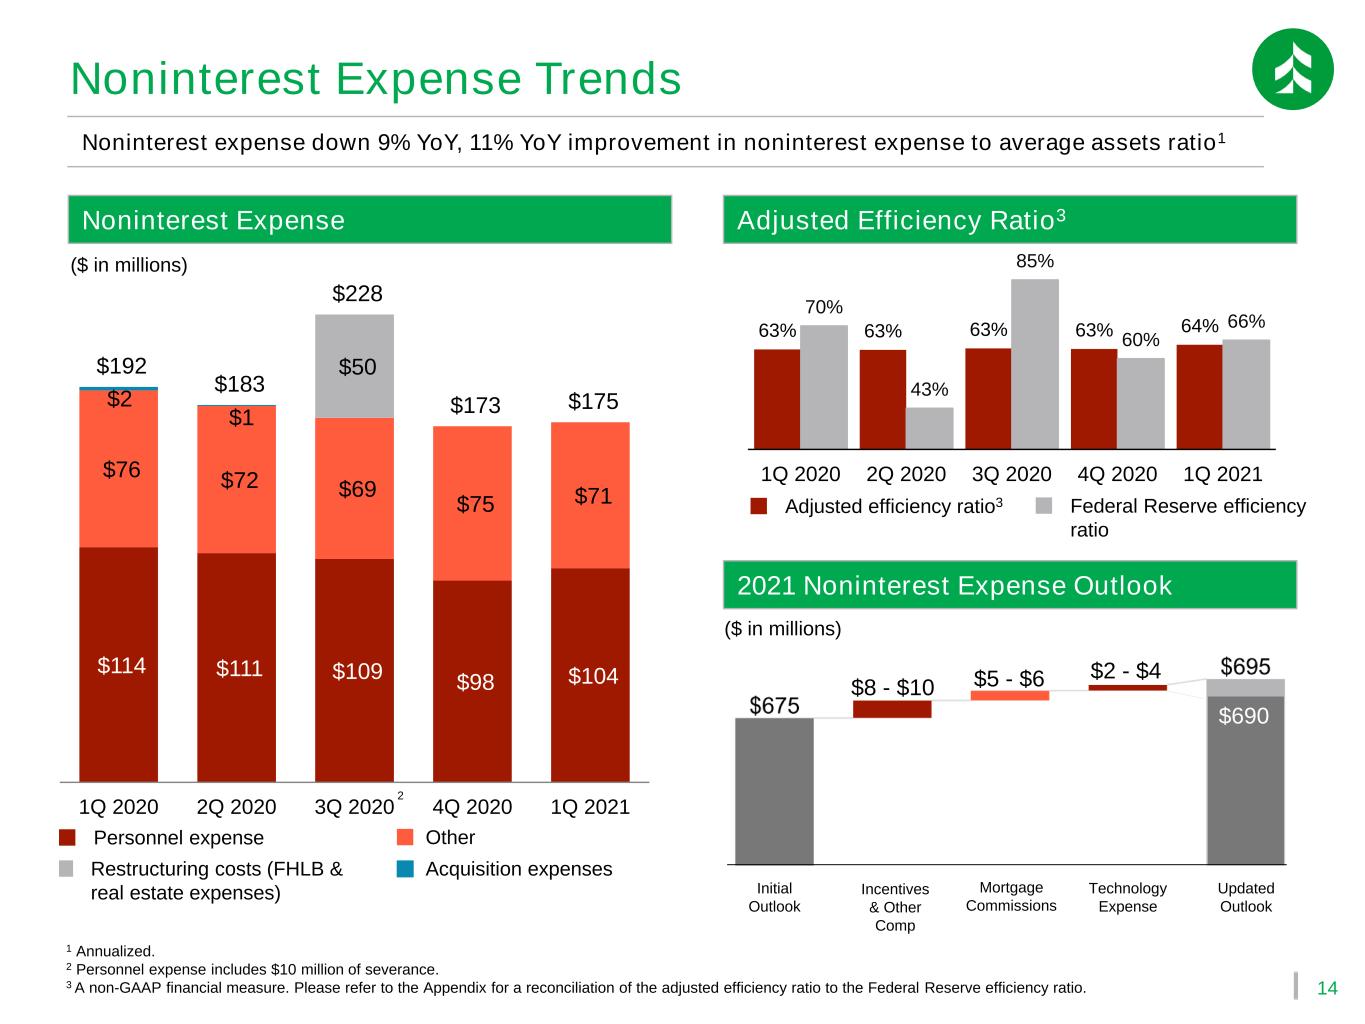
14 $114 $111 $109 $98 $104 $76 $72 $69 $75 $71 $2 $1 $50 $192 $183 $228 $173 $175 1Q 2020 2Q 2020 3Q 2020 4Q 2020 1Q 2021 Noninterest Expense Trends Adjusted Efficiency Ratio3Noninterest Expense 1 Annualized. 2 Personnel expense includes $10 million of severance. 3 A non-GAAP financial measure. Please refer to the Appendix for a reconciliation of the adjusted efficiency ratio to the Federal Reserve efficiency ratio. ($ in millions) Noninterest expense down 9% YoY, 11% YoY improvement in noninterest expense to average assets ratio1 Personnel expense Other Acquisition expensesRestructuring costs (FHLB & real estate expenses) 2 Federal Reserve efficiency ratio 63% 63% 63% 63% 64% 70% 43% 85% 60% 66% 1Q 2020 2Q 2020 3Q 2020 4Q 2020 1Q 2021 Adjusted efficiency ratio3 Initial Outlook Technology Expense Incentives & Other Comp Mortgage Commissions Updated Outlook $2 - $4$5 - $6$8 - $10 $690 2021 Noninterest Expense Outlook ($ in millions)

15 First Quarter ACLL ▪ Allowance for credit losses on loans (ACLL) decreased $28 million at the end of 1Q 2021 from 4Q 2020 ▪ 1Q 2021 provision of negative $23 million, down $40 million from 4Q 2020 ▪ CECL forward looking assumptions based on Moody’s March 2021 Baseline forecast 1 Includes funded and unfunded reserve for loans, excludes reserve for HTM securities. ($ in thousands) ACLL / Total Loans ACLL1 decreased $28 million and covered 1.67% of loan balances at the end of 1Q 2021 Allowance Update 0.98% 1.55% 1.62% 1.73% 1.77% 1.76% 1.67% 12/31/19 CECL Day 1 3/31/20 6/30/20 9/30/20 12/31/20 3/31/21 ACLL 1 ACLL 1 / Loans ACLL 1 ACLL 1 / Loans ACLL 1 ACLL 1 / Loans Loan Category C&BL - excl. Oil & Gas 92,203$ 1.19% 122,994$ 1.48% 118,841$ 1.43% C&BL Oil & Gas 68,687 14.08% 53,650 18.12% 42,683$ 16.52% PPP Loans - - 531 0.07% 607$ 0.07% CRE - Investor 43,331 1.14% 94,071 2.17% 89,894$ 2.11% CRE - Construction 58,261 4.10% 78,080 4.24% 73,552$ 3.91% Residential Mortgage 50,175 0.62% 42,996 0.55% 45,215$ 0.59% Other Consumer 41,768 3.47% 39,154 3.84% 32,921$ 3.47% Total 354,425$ 1.55% 431,478$ 1.76% 403,714$ 1.67% Total (excl. PPP Loans) 354,425$ 1.55% 430,946$ 1.82% 403,107$ 1.73% CECL Day 1 12/31/2020 3/31/2021
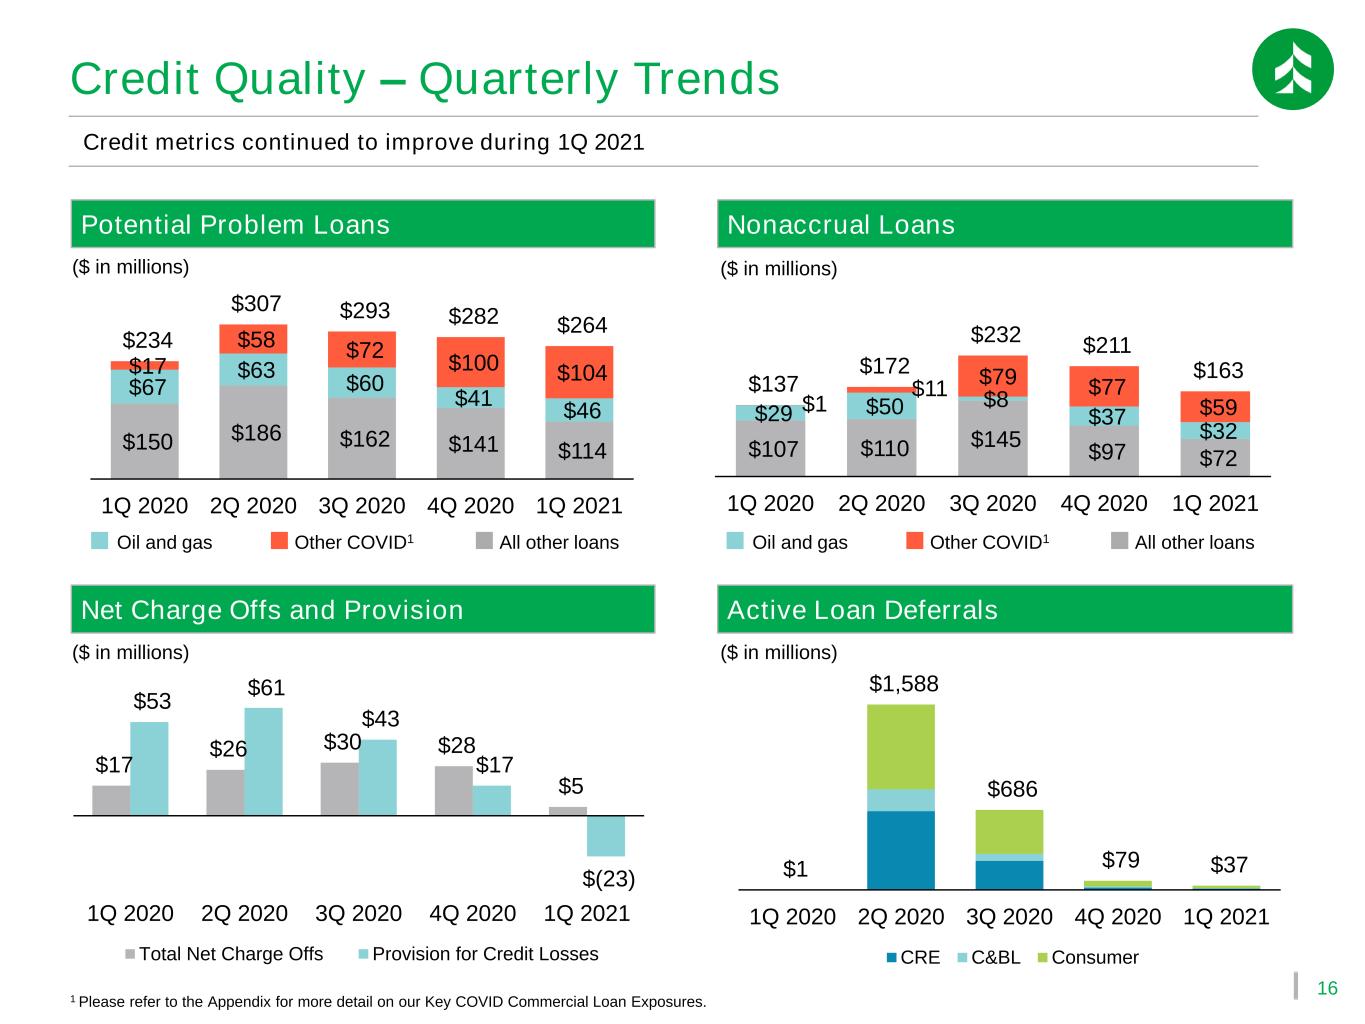
16 Credit Quality – Quarterly Trends $107 $110 $145 $97 $72 $29 $50 $8 $37 $32 $1 $11 $79 $77 $59 $137 $172 $232 $211 $163 1Q 2020 2Q 2020 3Q 2020 4Q 2020 1Q 2021 $150 $186 $162 $141 $114 $67 $63 $60 $41 $46 $17 $58 $72 $100 $104 $234 $307 $293 $282 $264 1Q 2020 2Q 2020 3Q 2020 4Q 2020 1Q 2021 Credit metrics continued to improve during 1Q 2021 ($ in millions) ($ in millions) ($ in millions) 1 Please refer to the Appendix for more detail on our Key COVID Commercial Loan Exposures. Potential Problem Loans Nonaccrual Loans Active Loan DeferralsNet Charge Offs and Provision Oil and gas All other loansOther COVID1 Oil and gas All other loansOther COVID1 $1 $1,588 $686 $79 $37 1Q 2020 2Q 2020 3Q 2020 4Q 2020 1Q 2021 CRE C&BL Consumer ($ in millions) $17 $26 $30 $28 $5 $53 $61 $43 $17 $(23) 1Q 2020 2Q 2020 3Q 2020 4Q 2020 1Q 2021 Total Net Charge Offs Provision for Credit Losses
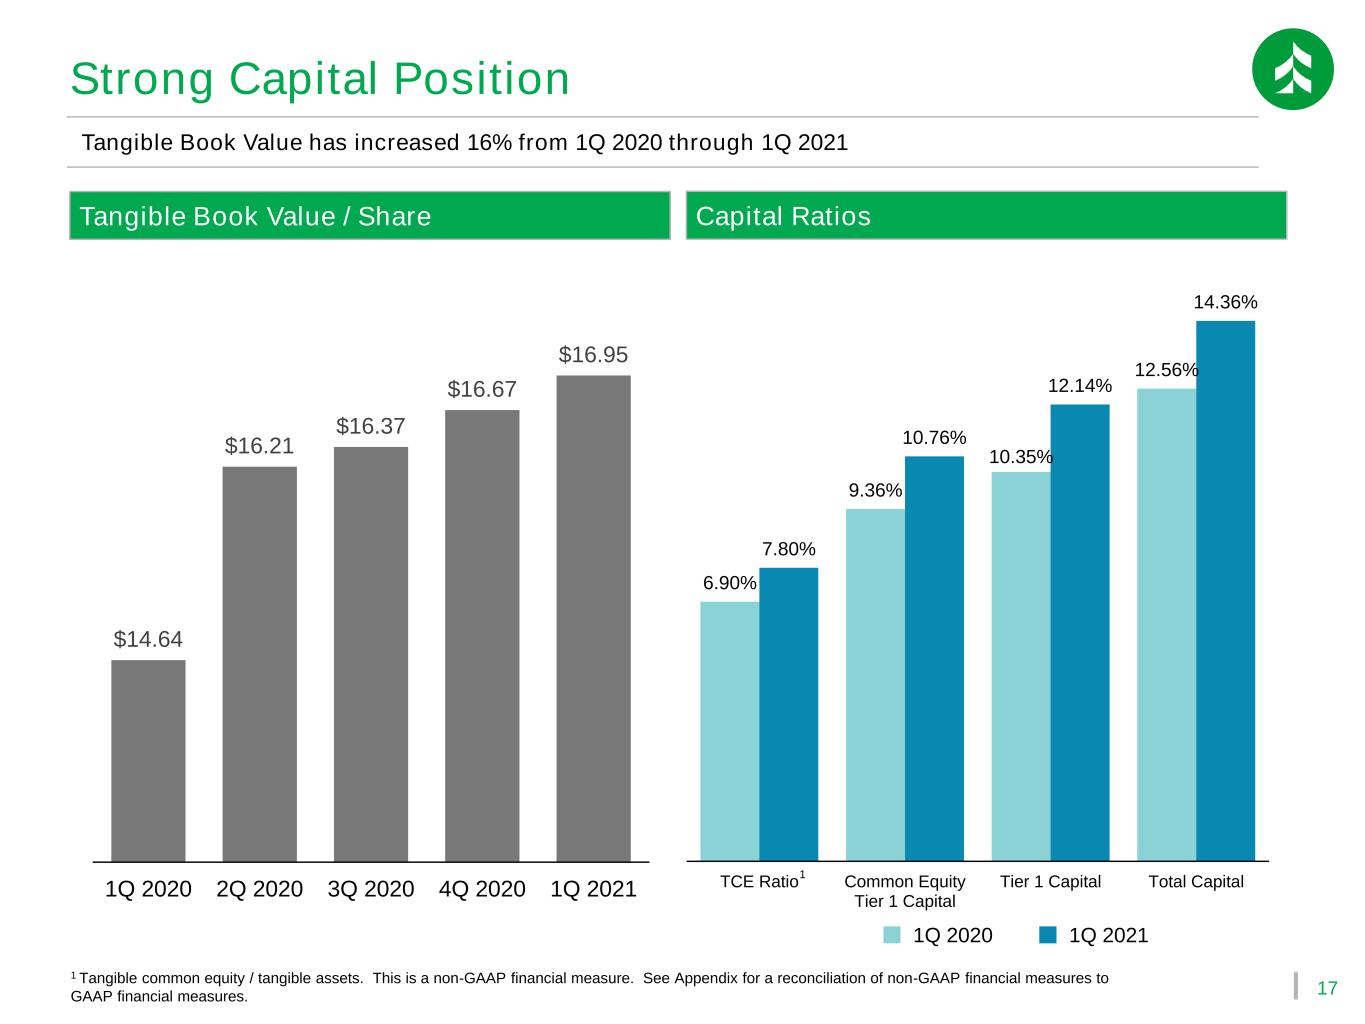
17 6.90% 9.36% 10.35% 12.56% 7.80% 10.76% 12.14% 14.36% TCE Ratio Common Equity Tier 1 Capital Tier 1 Capital Total Capital 1 Tangible common equity / tangible assets. This is a non-GAAP financial measure. See Appendix for a reconciliation of non-GAAP financial measures to GAAP financial measures. Capital Ratios 1Q 2020 Tangible Book Value has increased 16% from 1Q 2020 through 1Q 2021 1Q 2021 Strong Capital Position Tangible Book Value / Share $14.64 $16.21 $16.37 $16.67 $16.95 1Q 2020 2Q 2020 3Q 2020 4Q 2020 1Q 2021 1

Appendix
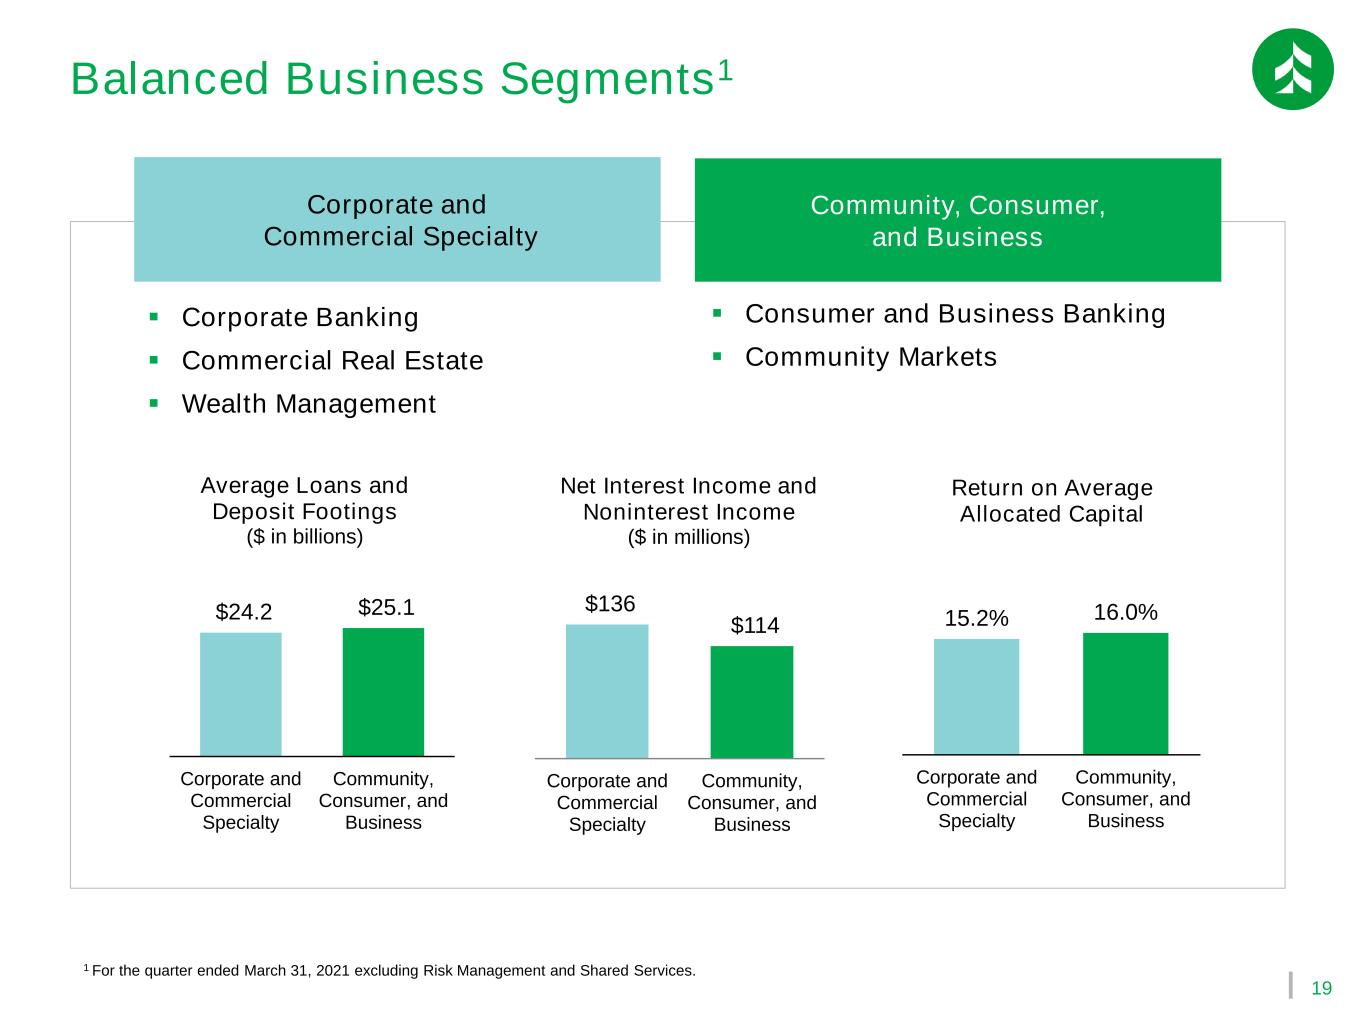
19 Balanced Business Segments1 15.2% 16.0% Corporate and Commercial Specialty Community, Consumer, and Business Return on Average Allocated Capital Community, Consumer, and Business Corporate and Commercial Specialty $136 $114 Corporate and Commercial Specialty Community, Consumer, and Business Net Interest Income and Noninterest Income ($ in millions) $24.2 $25.1 Corporate and Commercial Specialty Community, Consumer, and Business Average Loans and Deposit Footings ($ in billions) ▪ Corporate Banking ▪ Commercial Real Estate ▪ Wealth Management ▪ Consumer and Business Banking ▪ Community Markets 1 For the quarter ended March 31, 2021 excluding Risk Management and Shared Services.

20 Branch Optimization Trend We have consistently optimized our branch network over the last decade Pro Forma Branch Count Trend1 205 202 185 31 26 19 20 17 7 279 270 238 237 226 215 217 213 236 248 228 2010 2011 2012 2013 2014 2015 2016 2017 2018 2019 2020 ASB BKMU (58) HBAN (32) FNB (9) 2 1 Branch count at year end. Parenthetical amounts reflect amount at acquisition. 2 Branch count after branch sales and consolidations in December 2020. One additional branch sale closed in 1Q 2021. 3 Based on total period end deposits and branch count at year end. ▪ Continued migration to mobile and online channels has reduced the centricity of branches to our distribution strategy ▪ Declining foot traffic in branches and customer behavior shifts have created additional opportunities to optimize our branch network over time ▪ The COVID pandemic and new technology have only accelerated these trends $55 $116 2010 2020 Avg. Deposits / Branch3 ($ in millions)
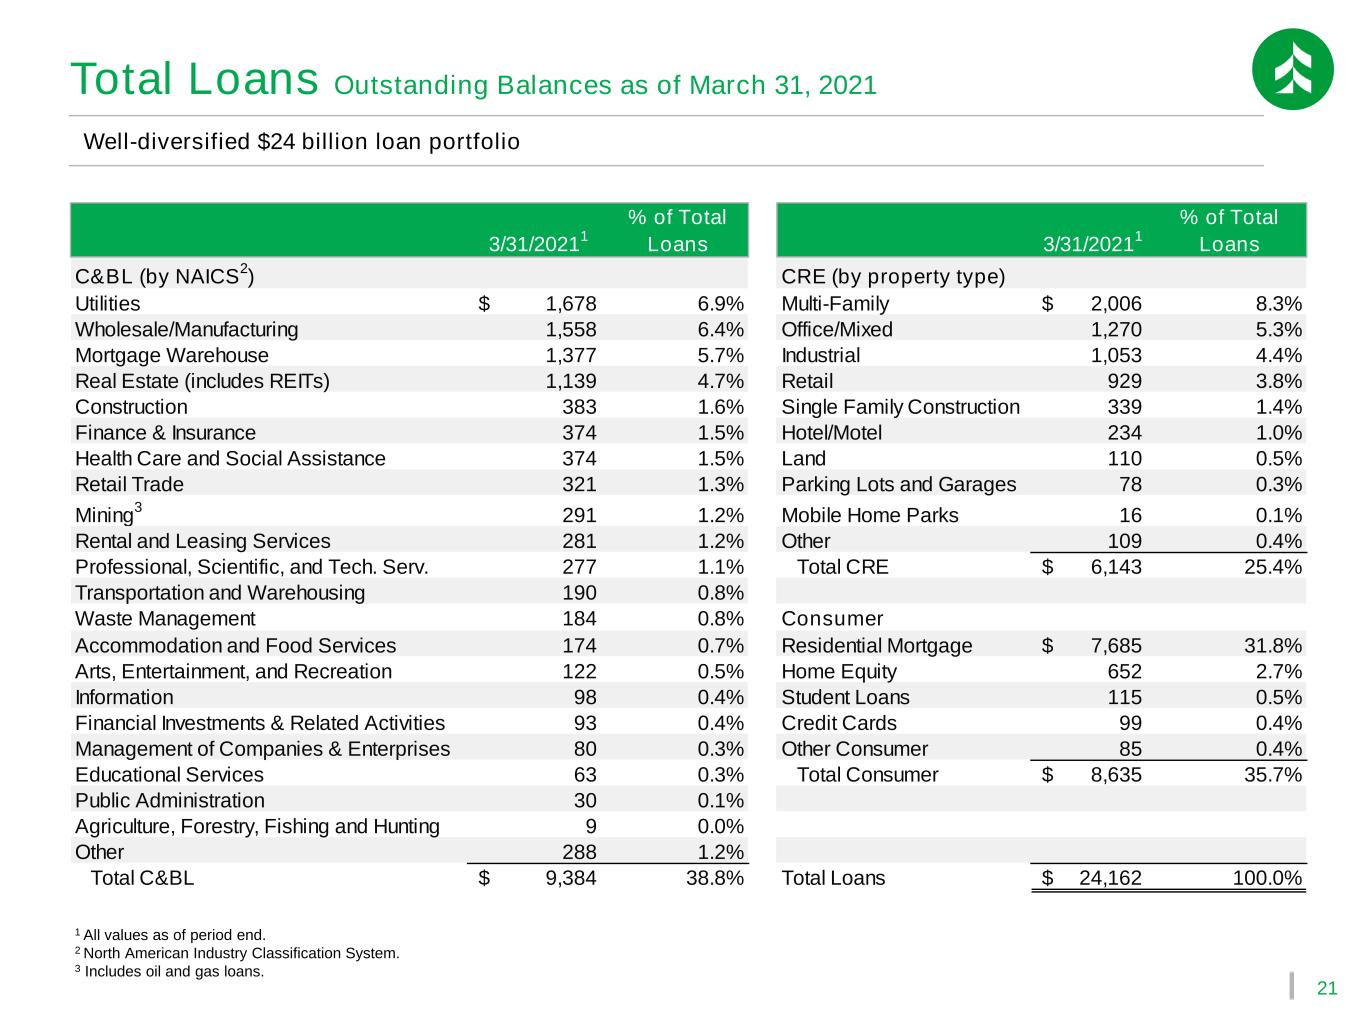
21 Total Loans Outstanding Balances as of March 31, 2021 1 All values as of period end. 2 North American Industry Classification System. 3 Includes oil and gas loans. Well-diversified $24 billion loan portfolio ($ in millions) 3/31/2021 1 % of Total Loans 3/31/2021 1 % of Total Loans C&BL (by NAICS 2 ) CRE (by property type) Utilities 1,678$ 6.9% Multi-Family 2,006$ 8.3% Wholesale/Manufacturing 1,558 6.4% Office/Mixed 1,270 5.3% Mortgage Warehouse 1,377 5.7% Industrial 1,053 4.4% Real Estate (includes REITs) 1,139 4.7% Retail 929 3.8% Construction 383 1.6% Single Family Construction 339 1.4% Finance & Insurance 374 1.5% Hotel/Motel 234 1.0% Health Care and Social Assistance 374 1.5% Land 110 0.5% Retail Trade 321 1.3% Parking Lots and Garages 78 0.3% Mining 3 291 1.2% Mobile Home Parks 16 0.1% Rental and Leasing Services 281 1.2% Other 109 0.4% Professional, Scientific, and Tech. Serv. 277 1.1% Total CRE 6,143$ 25.4% Transportation and Warehousing 190 0.8% Waste Management 184 0.8% Consumer Accommodation and Food Services 174 0.7% Residential Mortgage 7,685$ 31.8% Arts, Entertainment, and Recreation 122 0.5% Home Equity 652 2.7% Information 98 0.4% Student Loans 115 0.5% Financial Investments & Related Activities 93 0.4% Credit Cards 99 0.4% Management of Companies & Enterprises 80 0.3% Other Consumer 85 0.4% Educational Services 63 0.3% Total Consumer 8,635$ 35.7% Public Administration 30 0.1% Agriculture, Forestry, Fishing and Hunting 9 0.0% Other 288 1.2% Total C&BL 9,384$ 38.8% Total Loans 24,162$ 100.0%
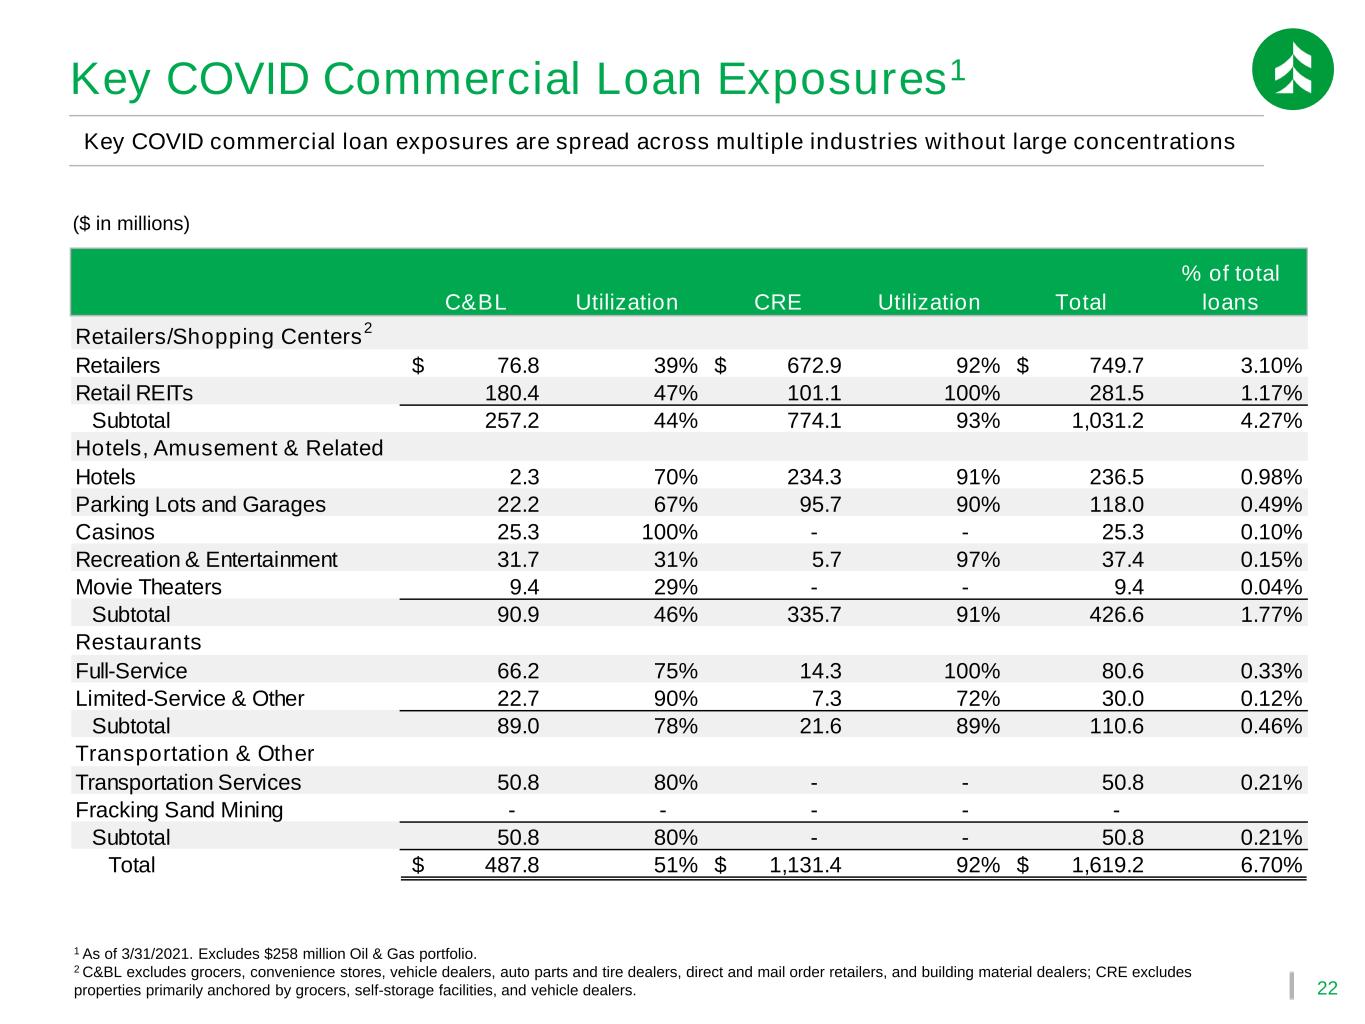
22 1 As of 3/31/2021. Excludes $258 million Oil & Gas portfolio. 2 C&BL excludes grocers, convenience stores, vehicle dealers, auto parts and tire dealers, direct and mail order retailers, and building material dealers; CRE excludes properties primarily anchored by grocers, self-storage facilities, and vehicle dealers. Key COVID commercial loan exposures are spread across multiple industries without large concentrations ($ in millions) Key COVID Commercial Loan Exposures1 C&BL Utilization CRE Utilization Total % of total loans Retailers/Shopping Centers 2 Retailers 76.8$ 39% 672.9$ 92% 749.7$ 3.10% Retail REITs 180.4 47% 101.1 100% 281.5 1.17% Subtotal 257.2 44% 774.1 93% 1,031.2 4.27% Hotels, Amusement & Related Hotels 2.3 70% 234.3 91% 236.5 0.98% Parking Lots and Garages 22.2 67% 95.7 90% 118.0 0.49% Casinos 25.3 100% - - 25.3 0.10% Recreation & Entertainment 31.7 31% 5.7 97% 37.4 0.15% Movie Theaters 9.4 29% - - 9.4 0.04% Subtotal 90.9 46% 335.7 91% 426.6 1.77% Restaurants Full-Service 66.2 75% 14.3 100% 80.6 0.33% Limited-Service & Other 22.7 90% 7.3 72% 30.0 0.12% Subtotal 89.0 78% 21.6 89% 110.6 0.46% Transportation & Other Transportation Services 50.8 80% - - 50.8 0.21% Fracking Sand Mining - - - - - Subtotal 50.8 80% - - 50.8 0.21% Total 487.8$ 51% 1,131.4$ 92% 1,619.2$ 6.70%
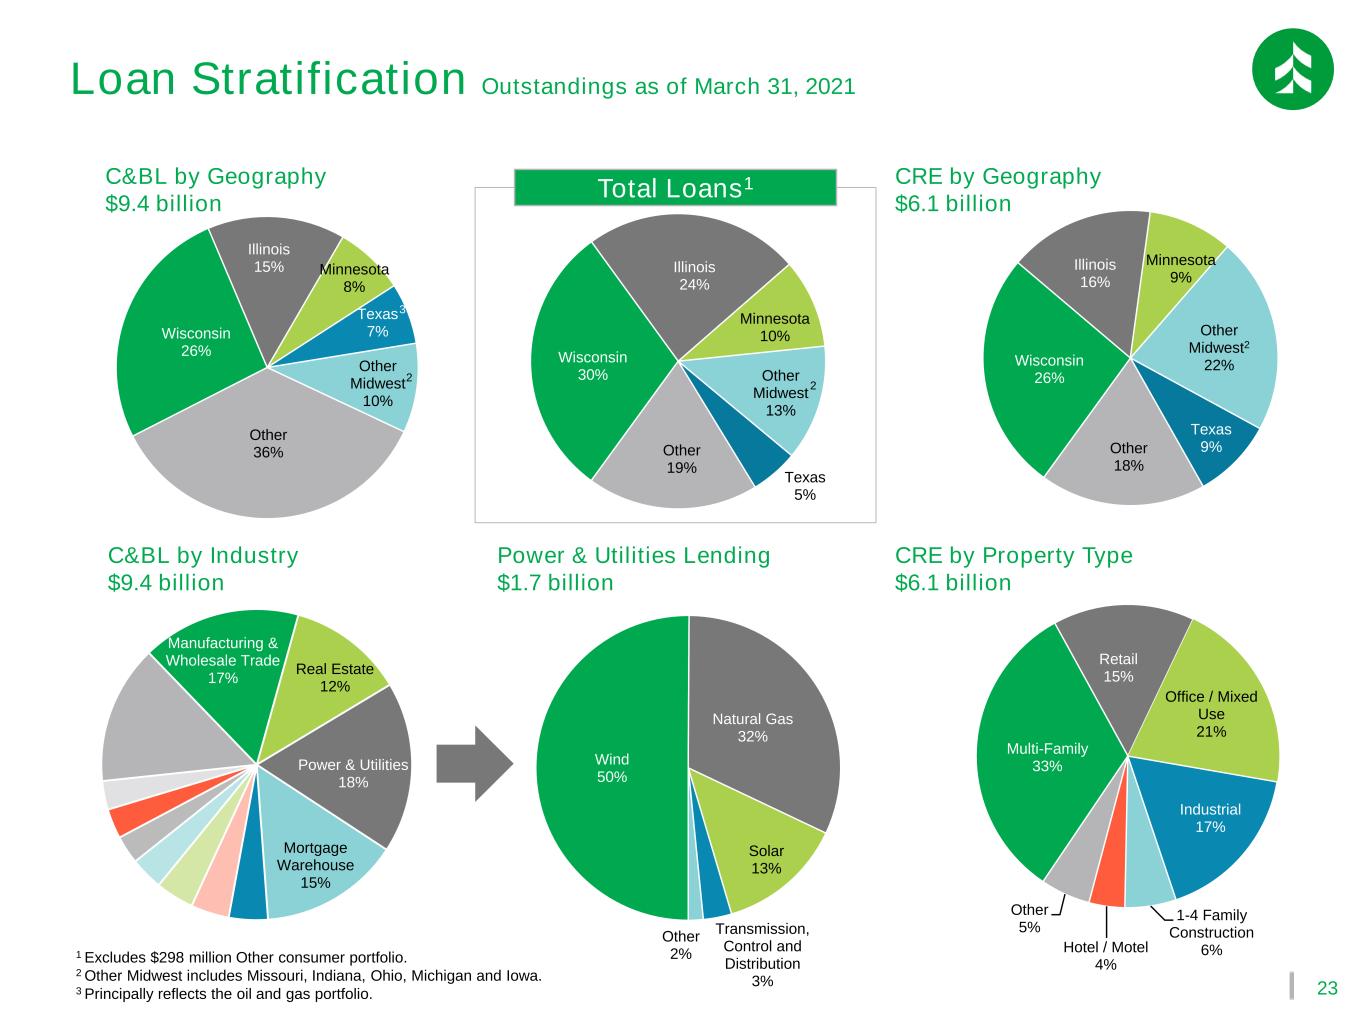
23 Manufacturing & Wholesale Trade 17% Real Estate 12% Power & Utilities 18% Mortgage Warehouse 15% 1 Excludes $298 million Other consumer portfolio. 2 Other Midwest includes Missouri, Indiana, Ohio, Michigan and Iowa. 3 Principally reflects the oil and gas portfolio. C&BL by Geography $9.4 billion CRE by Geography $6.1 billion Multi-Family 33% Retail 15% Office / Mixed Use 21% Industrial 17% 1-4 Family Construction 6%Hotel / Motel 4% Other 5% Wind 50% Natural Gas 32% Solar 13% Transmission, Control and Distribution 3% Other 2% Wisconsin 26% Illinois 15% Minnesota 8% Texas 7% Other Midwest 10% Other 36% Wisconsin 26% Illinois 16% Minnesota 9% Other Midwest2 22% Texas 9%Other 18% Total Loans1 Wisconsin 30% Illinois 24% Minnesota 10% Other Midwest 13% Texas 5% Other 19% C&BL by Industry $9.4 billion Power & Utilities Lending $1.7 billion CRE by Property Type $6.1 billion 3 2 2 Loan Stratification Outstandings as of March 31, 2021
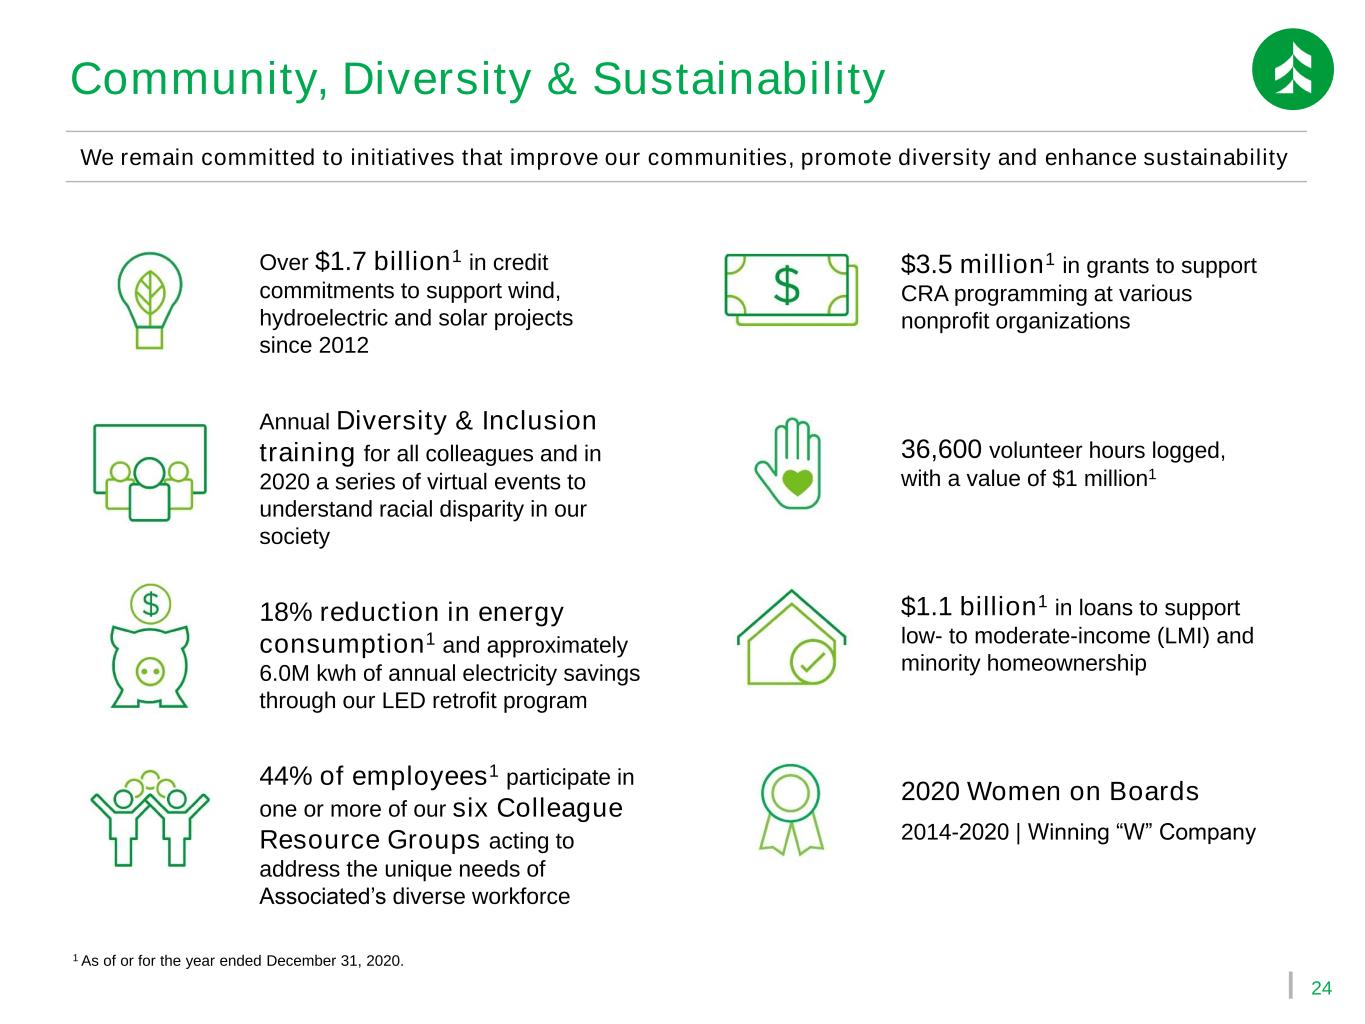
24 Community, Diversity & Sustainability We remain committed to initiatives that improve our communities, promote diversity and enhance sustainability Over $1.7 billion1 in credit commitments to support wind, hydroelectric and solar projects since 2012 Annual Diversity & Inclusion training for all colleagues and in 2020 a series of virtual events to understand racial disparity in our society 18% reduction in energy consumption1 and approximately 6.0M kwh of annual electricity savings through our LED retrofit program 44% of employees1 participate in one or more of our six Colleague Resource Groups acting to address the unique needs of Associated’s diverse workforce $3.5 million1 in grants to support CRA programming at various nonprofit organizations 1 As of or for the year ended December 31, 2020. 36,600 volunteer hours logged, with a value of $1 million1 $1.1 billion1 in loans to support low- to moderate-income (LMI) and minority homeownership 2020 Women on Boards 2014-2020 | Winning “W” Company
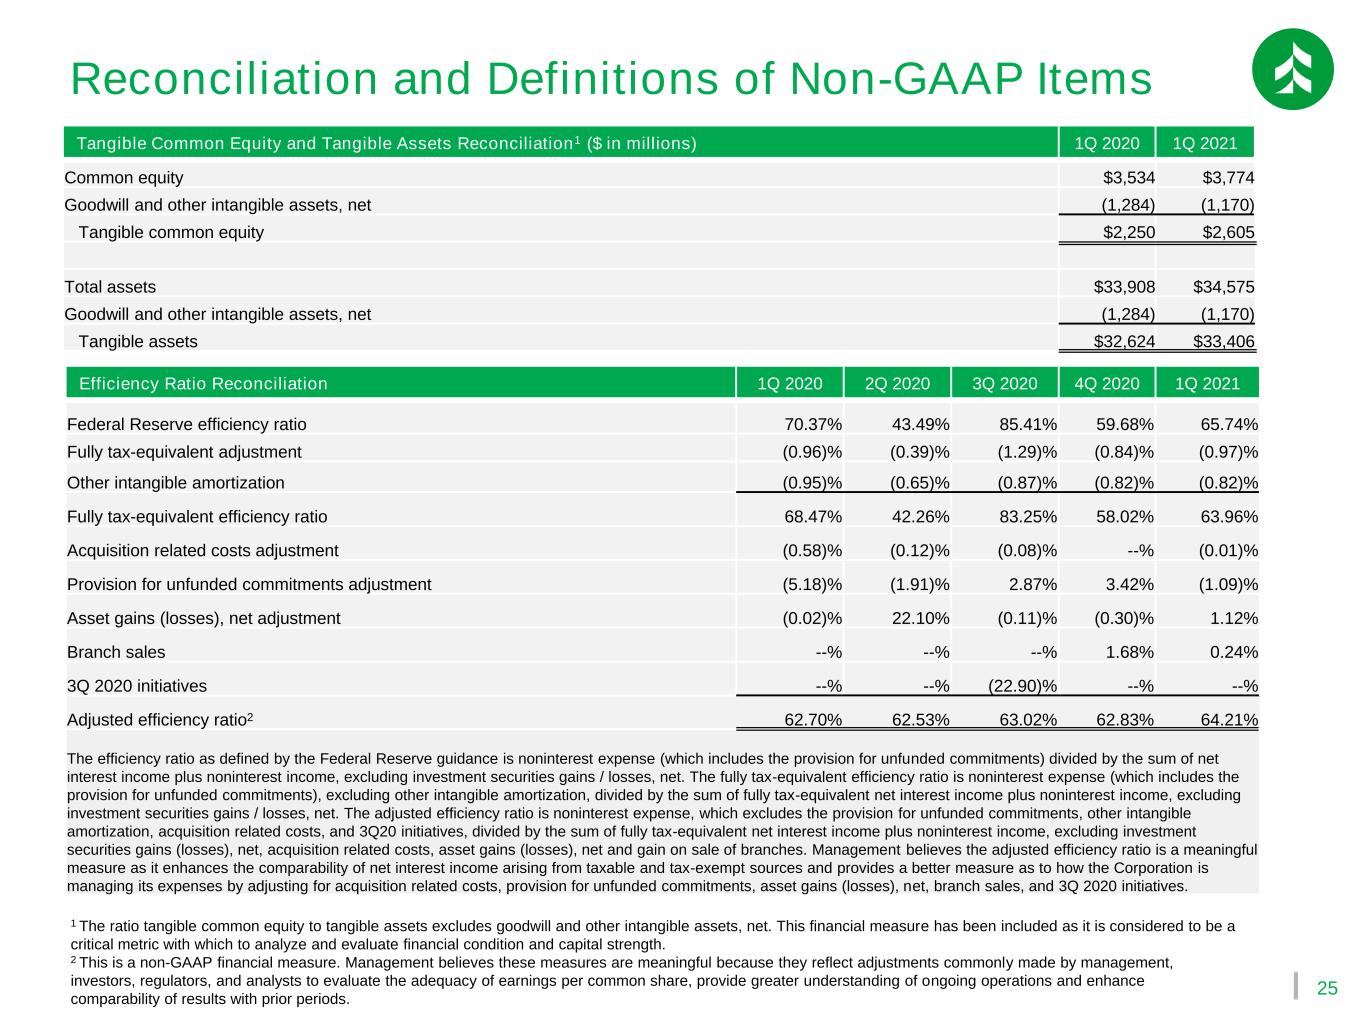
25 Reconciliation and Definitions of Non-GAAP Items 1 The ratio tangible common equity to tangible assets excludes goodwill and other intangible assets, net. This financial measure has been included as it is considered to be a critical metric with which to analyze and evaluate financial condition and capital strength. 2 This is a non-GAAP financial measure. Management believes these measures are meaningful because they reflect adjustments commonly made by management, investors, regulators, and analysts to evaluate the adequacy of earnings per common share, provide greater understanding of ongoing operations and enhance comparability of results with prior periods. Tangible Common Equity and Tangible Assets Reconciliation1 ($ in millions) 1Q 2020 1Q 2021 Common equity $3,534 $3,774 Goodwill and other intangible assets, net (1,284) (1,170) Tangible common equity $2,250 $2,605 Total assets $33,908 $34,575 Goodwill and other intangible assets, net (1,284) (1,170) Tangible assets $32,624 $33,406 Efficiency Ratio Reconciliation 1Q 2020 2Q 2020 3Q 2020 4Q 2020 1Q 2021 Federal Reserve efficiency ratio 70.37% 43.49% 85.41% 59.68% 65.74% Fully tax-equivalent adjustment (0.96)% (0.39)% (1.29)% (0.84)% (0.97)% Other intangible amortization (0.95)% (0.65)% (0.87)% (0.82)% (0.82)% Fully tax-equivalent efficiency ratio 68.47% 42.26% 83.25% 58.02% 63.96% Acquisition related costs adjustment (0.58)% (0.12)% (0.08)% --% (0.01)% Provision for unfunded commitments adjustment (5.18)% (1.91)% 2.87% 3.42% (1.09)% Asset gains (losses), net adjustment (0.02)% 22.10% (0.11)% (0.30)% 1.12% Branch sales --% --% --% 1.68% 0.24% 3Q 2020 initiatives --% --% (22.90)% --% --% Adjusted efficiency ratio2 62.70% 62.53% 63.02% 62.83% 64.21% The efficiency ratio as defined by the Federal Reserve guidance is noninterest expense (which includes the provision for unfunded commitments) divided by the sum of net interest income plus noninterest income, excluding investment securities gains / losses, net. The fully tax-equivalent efficiency ratio is noninterest expense (which includes the provision for unfunded commitments), excluding other intangible amortization, divided by the sum of fully tax-equivalent net interest income plus noninterest income, excluding investment securities gains / losses, net. The adjusted efficiency ratio is noninterest expense, which excludes the provision for unfunded commitments, other intangible amortization, acquisition related costs, and 3Q20 initiatives, divided by the sum of fully tax-equivalent net interest income plus noninterest income, excluding investment securities gains (losses), net, acquisition related costs, asset gains (losses), net and gain on sale of branches. Management believes the adjusted efficiency ratio is a meaningful measure as it enhances the comparability of net interest income arising from taxable and tax-exempt sources and provides a better measure as to how the Corporation is managing its expenses by adjusting for acquisition related costs, provision for unfunded commitments, asset gains (losses), net, branch sales, and 3Q 2020 initiatives.
