Attached files
| file | filename |
|---|---|
| 8-K - 8-K - PEAPACK GLADSTONE FINANCIAL CORP | pgc-8k_20210504.htm |

Welcome to Our 2021 Annual Meeting Celebrating 100 Years Exhibit 99.1
Statement Regarding Forward-Looking Information This presentation contains forward-looking statements within the meaning of the Private Securities Litigation Reform Act of 1995. Such statements are not historical facts and may include expressions about Management’s strategies and Management’s expectations about financial results, new and existing programs and products, investments, relationships, opportunities and market conditions. These statements may be identified by such forward-looking terminology as “expect,” “look,” “believe,” “anticipate,” “may,” or similar statements or variations of such terms. Actual results may differ materially from such forward-looking statements. Factors that may cause actual results to differ materially from those contemplated by such forward-looking statements include, but are not limited to: 1) our inability to successfully grow our business and implement our strategic plan, including an inability to generate revenues to offset the increased personnel and other costs related to the strategic plan; 2) the impact of anticipated higher operating expenses in 2020 and beyond; 3) our inability to successfully integrate wealth management firm acquisitions; 4) our inability to manage our growth; 5) our inability to successfully integrate our expanded employee base; 6) an unexpected decline in the economy, in particular in our New Jersey and New York market areas; 7) declines in our net interest margin caused by the interest rate environment (including the shape of yield curve) and our highly competitive market; 8) declines in the value in our investment portfolio; 9) higher than expected increases in our allowance for loan and lease losses; 10) higher than expected increases in loan and lease losses or in the level of nonperforming loans; 11) unexpected changes in interest rates; 12) an unexpected decline in real estate values within our market areas; 13) legislative and regulatory actions (including the impact of the Dodd-Frank Wall Street Reform and Consumer Protection Act, Basel III and related regulations) that may result in increased compliance costs; 14) changes in monetary policy by the Federal Reserve Board; 15) changes to legislation or policy, including tax or accounting matters; 16) successful cyberattacks against our IT infrastructure and that of our IT providers; 17) higher than expected FDIC insurance premiums; 18) adverse weather conditions; 19) our inability to successfully generate business in new geographic markets; 20) our inability to execute upon new business initiatives; 21) our lack of liquidity to fund our various cash obligations; 22) reduction in our lower-cost funding sources; 23) our inability to adapt to technological changes; 24) claims and litigation pertaining to fiduciary responsibility, environmental laws and other matters; 25) effects related to a prolonged shutdown of the federal government that could impact SBA and other government lending programs; and 26) other unexpected material adverse changes in our operations or earnings. Further, given its ongoing and dynamic nature, it is difficult to predict the full impact of the COVID-19 outbreak on our business. The extent of such impact will depend on future developments, which are highly uncertain, including when the coronavirus can be controlled and abated and whether the gradual reopening of businesses will result in a meaningful increase in economic activity. As the result of the COVID-19 pandemic and the related adverse local and national economic consequences, we could be subject to any of the following risks, any of which could have a material, adverse effect on our business, financial condition, liquidity, and results of operations: 1) demand for our products and services may decline, making it difficult to grow assets and income; 2) if the economy is unable to substantially reopen, and high levels of unemployment continue for an extended period of time, loan delinquencies, problem assets, and foreclosures may increase, resulting in increased charges and reduced income; 3) collateral for loans, especially real estate, may decline in value, which could cause loan losses to increase; 4) our allowance for loan losses may have to be increased if borrowers experience financial difficulties, which will adversely affect our net income; 5) the net worth and liquidity of loan guarantors may decline, impairing their ability to honor commitments to us; 6) a material decrease in net income or a net loss over several quarters could result in a decrease in the rate of our quarterly cash dividend; 7) our wealth management revenues may decline with continuing market turmoil; 8) our cyber security risks are increased as the result of an increase in the number of employees working remotely; and 9) FDIC premiums may increase if the agency experience additional resolution costs. The Company undertakes no duty to update any forward-looking statement to conform the statement to actual results or changes in the Company’s expectations. Although we believe that the expectations reflected in the forward-looking statements are reasonable, the Company cannot guarantee future results, levels of activity, performance or achievements. 2
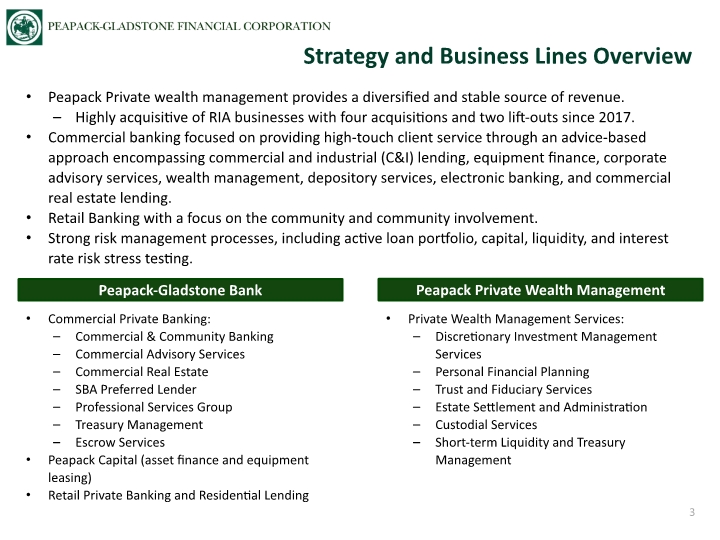
Peapack Private wealth management provides a diversified and stable source of revenue. Highly acquisitive of RIA businesses with four acquisitions and two lift-outs since 2017. Commercial banking focused on providing high-touch client service through an advice-based approach encompassing commercial and industrial (C&I) lending, equipment finance, corporate advisory services, wealth management, depository services, electronic banking, and commercial real estate lending. Retail Banking with a focus on the community and community involvement. Strong risk management processes, including active loan portfolio, capital, liquidity, and interest rate risk stress testing. Strategy and Business Lines Overview 3 Peapack-Gladstone Bank Peapack Private Wealth Management Commercial Private Banking: Commercial & Community Banking Commercial Advisory Services Commercial Real Estate SBA Preferred Lender Professional Services Group Treasury Management Escrow Services Peapack Capital (asset finance and equipment leasing) Retail Private Banking and Residential Lending Private Wealth Management Services: Discretionary Investment Management Services Personal Financial Planning Trust and Fiduciary Services Estate Settlement and Administration Custodial Services Short-term Liquidity and Treasury Management
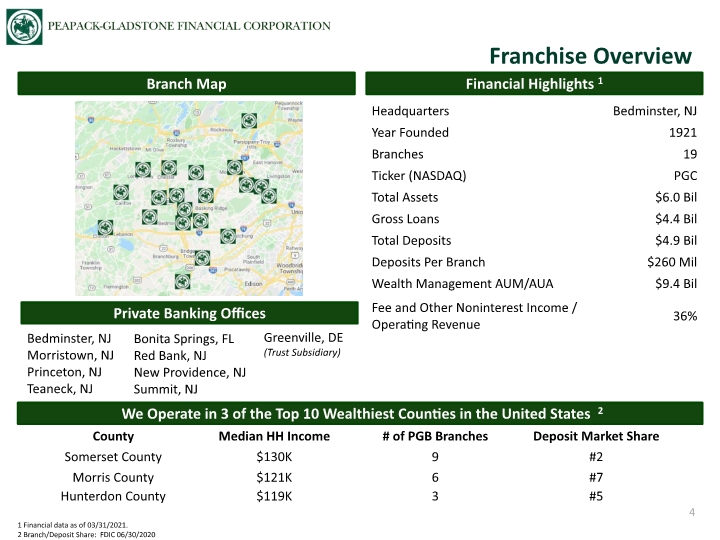
Financial Highlights 1 Branch Map Franchise Overview 4 Private Banking Offices Bedminster, NJ Morristown, NJ Princeton, NJ Teaneck, NJ Bonita Springs, FL Red Bank, NJ New Providence, NJ Summit, NJ We Operate in 3 of the Top 10 Wealthiest Counties in the United States 2 1 Financial data as of 03/31/2021. 2 Branch/Deposit Share: FDIC 06/30/2020 Greenville, DE (Trust Subsidiary)
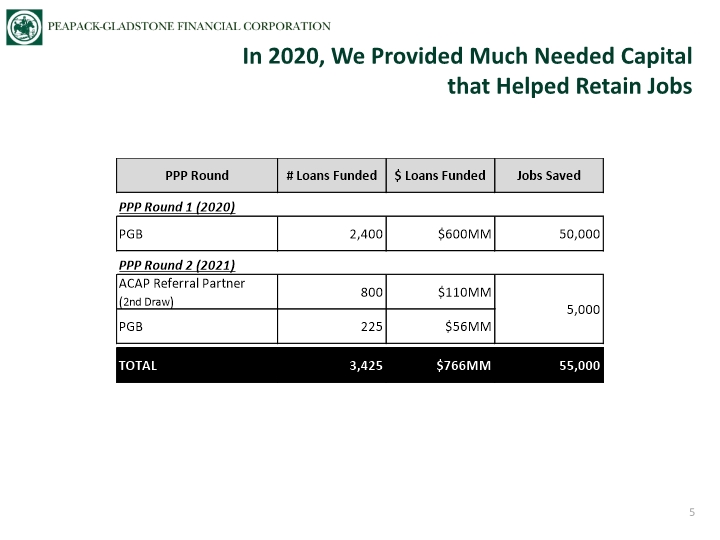
In 2020, We Provided Much Needed Capital that Helped Retain Jobs 5
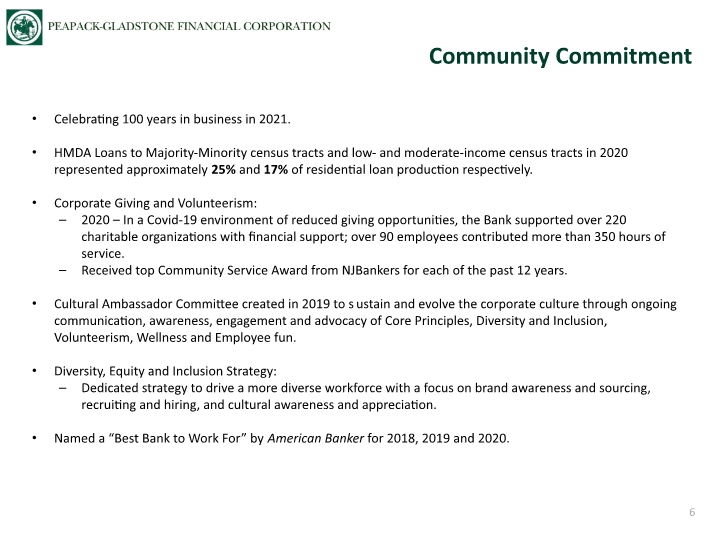
Celebrating 100 years in business in 2021. HMDA Loans to Majority-Minority census tracts and low- and moderate-income census tracts in 2020 represented approximately 25% and 17% of residential loan production respectively. Corporate Giving and Volunteerism: 2020 – In a Covid-19 environment of reduced giving opportunities, the Bank supported over 220 charitable organizations with financial support; over 90 employees contributed more than 350 hours of service. Received top Community Service Award from NJBankers for each of the past 12 years. Cultural Ambassador Committee created in 2019 to sustain and evolve the corporate culture through ongoing communication, awareness, engagement and advocacy of Core Principles, Diversity and Inclusion, Volunteerism, Wellness and Employee fun. Diversity, Equity and Inclusion Strategy: Dedicated strategy to drive a more diverse workforce with a focus on brand awareness and sourcing, recruiting and hiring, and cultural awareness and appreciation. Named a “Best Bank to Work For” by American Banker for 2018, 2019 and 2020. Community Commitment 6
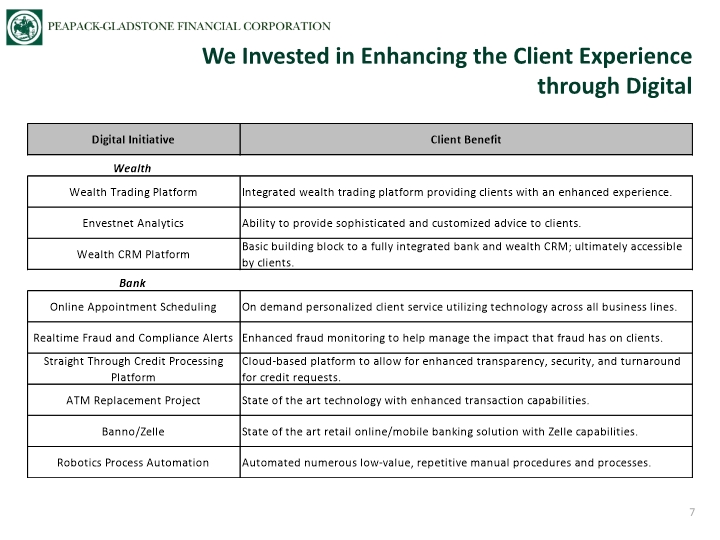
We Invested in Enhancing the Client Experience through Digital 7
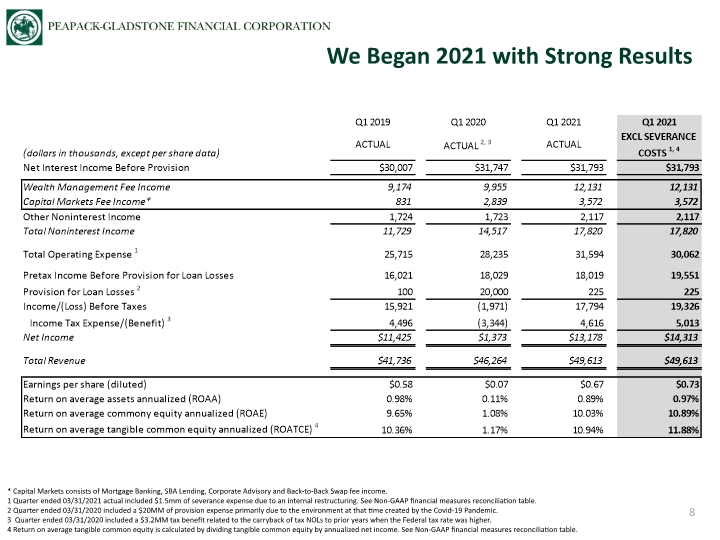
We Began 2021 with Strong Results 8 * Capital Markets consists of Mortgage Banking, SBA Lending, Corporate Advisory and Back-to-Back Swap fee income. 1 Quarter ended 03/31/2021 actual included $1.5mm of severance expense due to an internal restructuring. See Non-GAAP financial measures reconciliation table. 2 Quarter ended 03/31/2020 included a $20MM of provision expense primarily due to the environment at that time created by the Covid-19 Pandemic. 3 Quarter ended 03/31/2020 included a $3.2MM tax benefit related to the carryback of tax NOLs to prior years when the Federal tax rate was higher. 4 Return on average tangible common equity is calculated by dividing tangible common equity by annualized net income. See Non-GAAP financial measures reconciliation table.
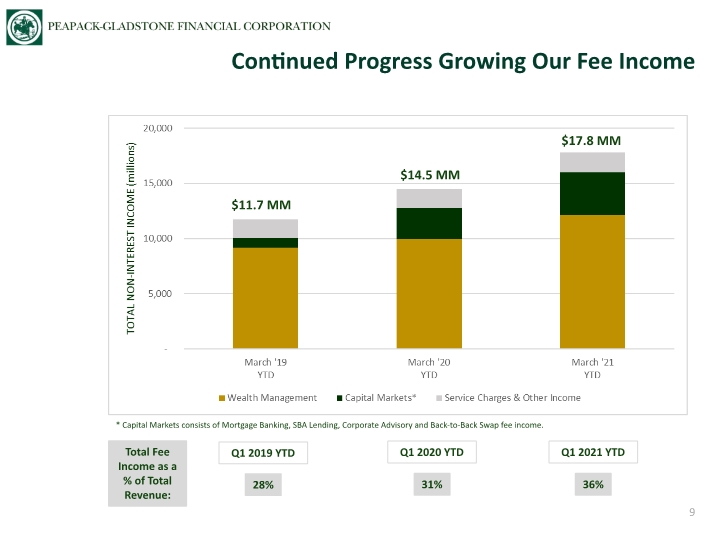
Continued Progress Growing Our Fee Income 9 * Capital Markets consists of Mortgage Banking, SBA Lending, Corporate Advisory and Back-to-Back Swap fee income. $11.7 MM $14.5 MM $17.8 MM Total Fee Income as a % of Total Revenue: 28% 31% 36% Q1 2019 YTD Q1 2020 YTD Q1 2021 YTD
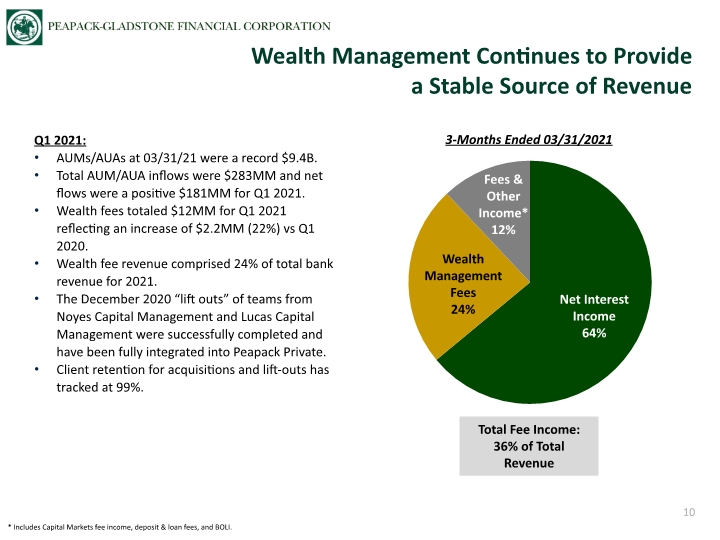
Q1 2021: AUMs/AUAs at 03/31/21 were a record $9.4B. Total AUM/AUA inflows were $283MM and net flows were a positive $181MM for Q1 2021. Wealth fees totaled $12MM for Q1 2021 reflecting an increase of $2.2MM (22%) vs Q1 2020. Wealth fee revenue comprised 24% of total bank revenue for 2021. The December 2020 “lift outs” of teams from Noyes Capital Management and Lucas Capital Management were successfully completed and have been fully integrated into Peapack Private. Client retention for acquisitions and lift-outs has tracked at 99%. Wealth Management Continues to Provide a Stable Source of Revenue 10 Net Interest Income 64% Wealth Management Fees 24% Fees & Other Income* 12% 3-Months Ended 03/31/2021 Total Fee Income: 36% of Total Revenue * Includes Capital Markets fee income, deposit & loan fees, and BOLI.
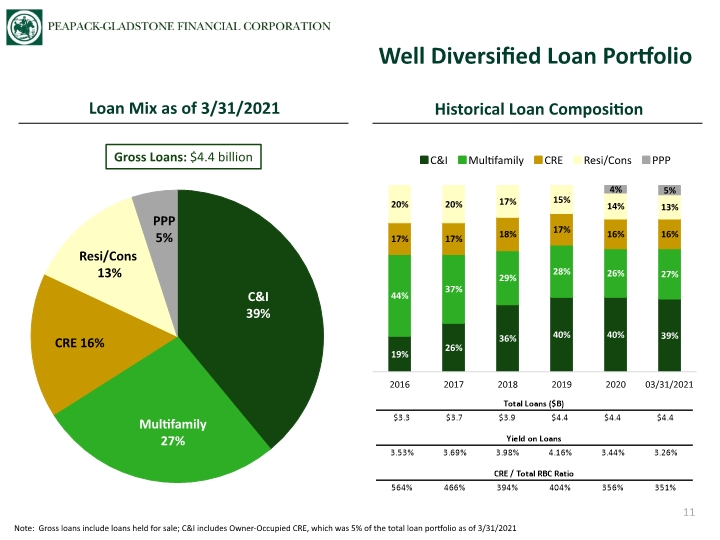
11 Well Diversified Loan Portfolio Gross Loans: $4.4 billion Note: Gross loans include loans held for sale; C&I includes Owner-Occupied CRE, which was 5% of the total loan portfolio as of 3/31/2021 Loan Mix as of 3/31/2021 Historical Loan Composition
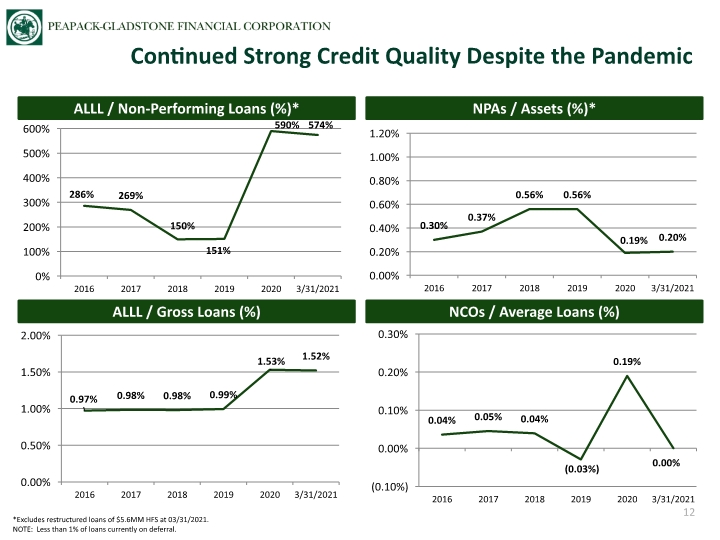
NPAs / Assets (%)* ALLL / Non-Performing Loans (%)* NCOs / Average Loans (%) ALLL / Gross Loans (%) Continued Strong Credit Quality Despite the Pandemic 12 *Excludes restructured loans of $5.6MM HFS at 03/31/2021. NOTE: Less than 1% of loans currently on deferral.
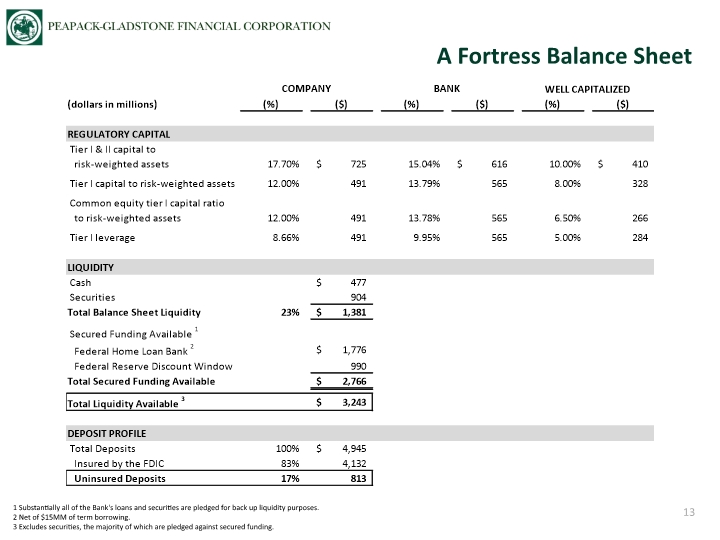
A Fortress Balance Sheet 13 1 Substantially all of the Bank's loans and securities are pledged for back up liquidity purposes. 2 Net of $15MM of term borrowing. 3 Excludes securities, the majority of which are pledged against secured funding.
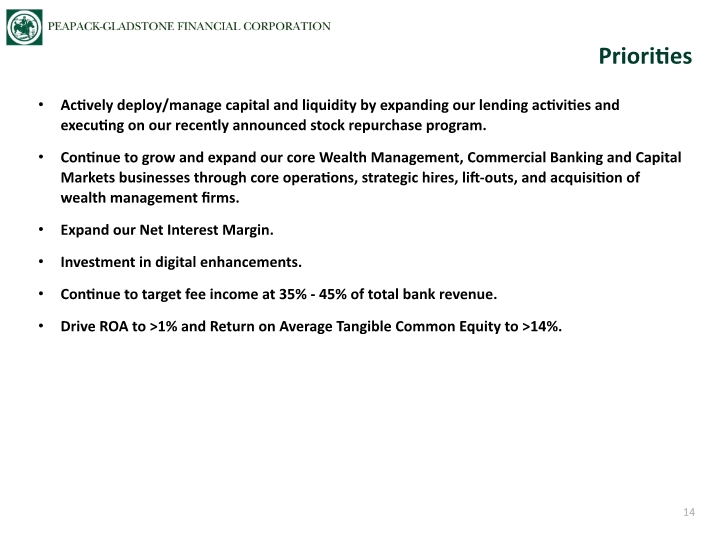
Actively deploy/manage capital and liquidity by expanding our lending activities and executing on our recently announced stock repurchase program. Continue to grow and expand our core Wealth Management, Commercial Banking and Capital Markets businesses through core operations, strategic hires, lift-outs, and acquisition of wealth management firms. Expand our Net Interest Margin. Investment in digital enhancements. Continue to target fee income at 35% - 45% of total bank revenue. Drive ROA to >1% and Return on Average Tangible Common Equity to >14%. Priorities 14
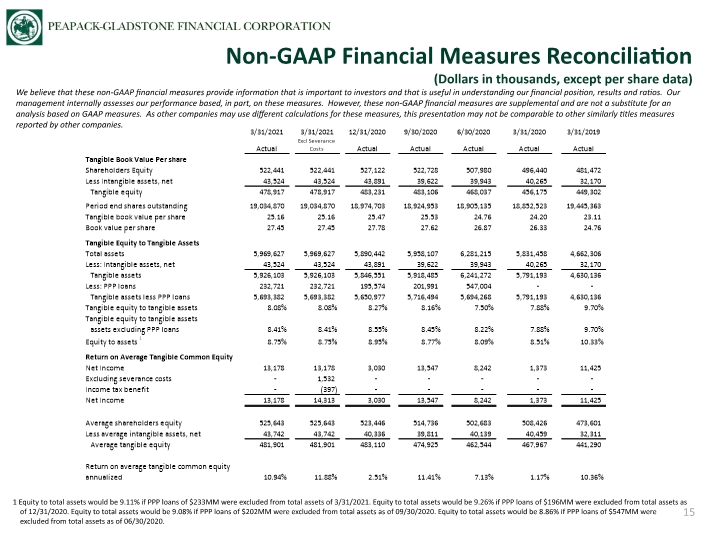
Non-GAAP Financial Measures Reconciliation (Dollars in thousands, except per share data) 15 We believe that these non-GAAP financial measures provide information that is important to investors and that is useful in understanding our financial position, results and ratios. Our management internally assesses our performance based, in part, on these measures. However, these non-GAAP financial measures are supplemental and are not a substitute for an analysis based on GAAP measures. As other companies may use different calculations for these measures, this presentation may not be comparable to other similarly titles measures reported by other companies. 1 Equity to total assets would be 9.11% if PPP loans of $233MM were excluded from total assets of 3/31/2021. Equity to total assets would be 9.26% if PPP loans of $196MM were excluded from total assets as of 12/31/2020. Equity to total assets would be 9.08% if PPP loans of $202MM were excluded from total assets as of 09/30/2020. Equity to total assets would be 8.86% if PPP loans of $547MM were excluded from total assets as of 06/30/2020.

Q&A 2021 Annual Meeting Celebrating 100 Years
