Attached files
| file | filename |
|---|---|
| EX-99.2 - EX-99.2 - CAMDEN NATIONAL CORP | ex992presentationq121.htm |
| EX-99.1 - EX-99.1 - CAMDEN NATIONAL CORP | ex991earningsreleaseq121.htm |
| 8-K - 8-K - CAMDEN NATIONAL CORP | cac-20210427.htm |
 First Quarter Report - 2021
Dear Fellow Shareholders:
A few short weeks ago, we acknowledged the one year mark of the pandemic which has impacted nearly every facet of daily life for our communities, customers, and employees. We also recognized how—as a team—we successfully met our major priorities in response to the pandemic: ensuring the health and safety of our customers and employees, providing support to our communities, and protecting the financial strength of our company. Through each of the changes, twists and turns over the past year, I continued to be proud of our dedicated employees who have supported each other so that we could be there for all of the constituents we serve.
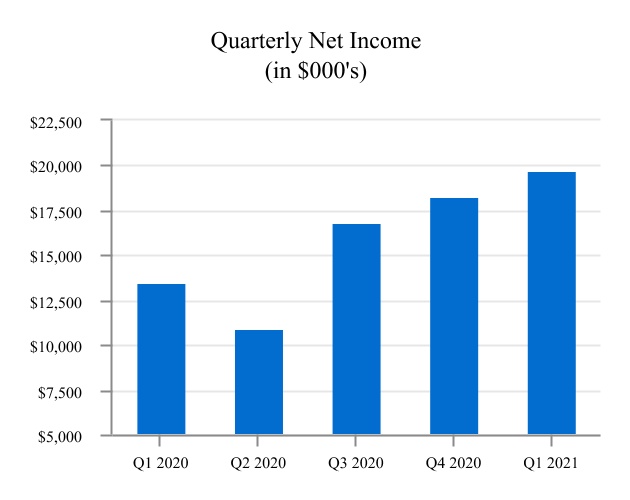
Financial Strength and Resiliency. For the first three months of 2021, we reported net income of $19.7 million, a quarterly record and 46% greater than the first three months of 2020. These results were driven by a release of provision for credit losses of $2.0 million, as compared to the addition of provision of $1.8 million for the first three months of 2020, and $3.6 million of higher mortgage banking income. We cautiously approached the credit implications of the pandemic, recording a $9.4 million provision for credit losses in the second quarter of 2020, which allowed us the flexibility to support our customers, and our asset quality position remains strong, with an allowance for credit losses on loans to total loans of 1.11% as of March 31, 2021, compared to 0.84% as of March 31, 2020. In addition, our non-performing loans to total loans were 0.31% as of March 31, 2021, compared to 0.33% at March 31, 2020.
Driven by our strong quarterly performance, various financial metrics were significantly favorable compared to levels reported last year. This includes return on average assets of 1.62%, return on average equity of 15.00%, and an efficiency ratio of 50.96% for the first three months of 2021, compared to 1.21%, 11.30% and 56.45%, respectively, for the first three months of 2020. As a result of our focus on the financial strength of our company, our total risk-based capital ratio was 16.00% and tangible common equity ratio was 8.71% on March 31, 2021, compared to 13.81% and 8.78%, respectively, on March 31, 2020.
Total assets of $5.1 billion at March 31, 2021 were approximately $495 million greater than a year ago, reflecting a continued influx of deposits to the bank as customers are holding more money in various deposit accounts. We have reduced our borrowings as a result of increased deposits and, while we prefer not to hold
increased cash balances, we have chosen to maintain our loan underwriting and interest rate risk management guidelines as we assess current and anticipated economic conditions.
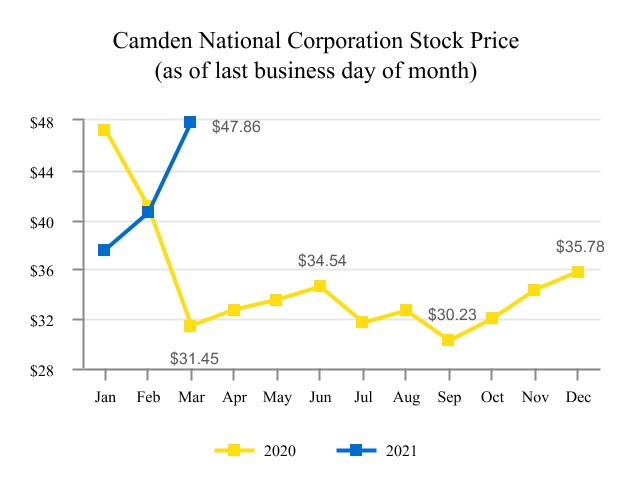
On March 30, 2021, we were pleased to announce that the Board of Directors approved a 9% increase in dividends to $0.36 per common share, or $1.44 on an annual basis. Tangible book value per share on March 31, 2021 was $29.12, a 10% increase from the prior year. These factors, along with a general improvement in the stock market, including a rebound in bank stocks, have resulted in our stock price closing at $47.86 per share on March 31, 2021, a 77.7% increase from our 52-week low recorded on April 16, 2020.
Continuously Evolving. Today, as we navigate the intricacies of COVID-19 vaccinations, government stimulus programs, and a wide range of social changes, our daily lives continue to change. As more community members receive the vaccine, we eagerly anticipate returning to a more normal way of life, but we also realize that there are ongoing challenges and areas of need in our communities. To continue evolving and getting stronger as a company, the Governance Committee of the Board of Directors has launched a review of its diversity, equity and inclusion programs that will complement management’s efforts. We are also sensitive to the growing wealth gap that has accelerated as a result of the pandemic, and, as a result, we are stepping up our efforts to support customers and communities in need of financial education, as well as developing products and services aimed at improving access to banking.
As we look to the year ahead—regardless of the future opportunities and challenges we may encounter—we remain committed as ever to our core values, in service of our customers, communities, employees, and shareholders.
Your support is deeply appreciated.
Sincerely,

Gregory A. Dufour
President and Chief Executive Officer
Financial Highlights (unaudited)
| Three Months Ended March 31, | ||||||||||||||
| (Dollars in thousands, except per share data) | 2021 | 2020 | ||||||||||||
| Earnings and Dividends | ||||||||||||||
| Net interest income | $ | 32,364 | $ | 31,826 | ||||||||||
| Non-interest income | 15,215 | 11,403 | ||||||||||||
| Non-interest expense | (24,899) | (24,561) | ||||||||||||
Pre-tax, pre-provision earnings(1) | 22,680 | 18,668 | ||||||||||||
| (Credit) provision for credit losses | 1,956 | (1,775) | ||||||||||||
| Income before income tax expense | 24,636 | 16,893 | ||||||||||||
| Income tax expense | (4,896) | (3,400) | ||||||||||||
| Net income | $ | 19,740 | $ | 13,493 | ||||||||||
| Diluted earnings per share | $ | 1.31 | $ | 0.89 | ||||||||||
| Cash dividends declared per share | 0.36 | 0.33 | ||||||||||||
| Performance Ratios | ||||||||||||||
| Return on average assets | 1.62 | % | 1.21 | % | ||||||||||
| Return on average equity | 15.00 | % | 11.30 | % | ||||||||||
| Net interest margin (fully-taxable equivalent) | 2.88 | % | 3.08 | % | ||||||||||
Efficiency ratio1 | 50.96 | % | 56.45 | % | ||||||||||
| Balance sheet (end of period) | ||||||||||||||
| Investments | $ | 1,131,178 | $ | 979,674 | ||||||||||
| Loans and loans held for sale | 3,259,275 | 3,185,492 | ||||||||||||
| Allowance for credit losses on loans | 35,775 | 26,521 | ||||||||||||
| Total assets | 5,089,279 | 4,594,539 | ||||||||||||
| Deposits | 4,211,630 | 3,563,705 | ||||||||||||
| Borrowings | 245,739 | 420,877 | ||||||||||||
| Shareholders' equity | 532,120 | 492,680 | ||||||||||||
| Book Value per Share and Capital Ratios | ||||||||||||||
| Book value per share | $ | 35.64 | $ | 32.95 | ||||||||||
Tangible book value per share1 | 29.12 | 26.39 | ||||||||||||
Tangible common equity ratio1 | 8.71 | % | 8.78 | % | ||||||||||
| Tier I leverage capital ratio | 9.61 | % | 9.53 | % | ||||||||||
| Total risk-based capital ratio | 16.00 | % | 13.81 | % | ||||||||||
| Asset Quality | ||||||||||||||
| Allowance for credit losses on loans to total loans | 1.11 | % | 0.84 | % | ||||||||||
| Net charge-offs to average loans (annualized) | 0.03 | % | 0.05 | % | ||||||||||
| Non-performing loans to total loans | 0.31 | % | 0.33 | % | ||||||||||
| Non-performing assets to total assets | 0.20 | % | 0.23 | % | ||||||||||
1 This is a non-GAAP measure. A reconciliation of non-GAAP to GAAP financial measures can be found in the Company's earnings release dated and filed with the SEC on April 27, 2021.