Attached files
| file | filename |
|---|---|
| EX-99.1 - PRESS RELEASE OF VERTEX ENERGY, INC., DATED MARCH 9, 2021 - Vertex Energy Inc. | ex99-1.htm |
| 8-K - CURRENT REPORT - Vertex Energy Inc. | vtnr-8k_030921.htm |
Exhibit 99.2

March 2021 Fourth Quarter and Full - Year 2020 Results Conference Call

Disclaimer This document may contain forward - looking statements including words such as “may,” “can,” “could,” “should,” “predict,” “aim,” “potential,” “continue,” “opportunity,” “intend,” “goal,” “estimate,” “expect,” “expectations,” “project,” “projections,” “plans,” “anticipates,” “believe,” “think,” “confident,” “scheduled,” or similar expressions, as well as information about management’s view of Vertex Energy’s future expectations, plans and prospects, within the safe harbor provisions under the Private Securities Litigation Reform Act of 1995 . These statements involve known and unknown risks, uncertainties and other factors which may cause the results of Vertex Energy, its divisions and concepts to be materially different than those expressed or implied in such statements . Should one or more of these risks or uncertainties occur, or should underlying assumptions prove incorrect, Vertex Energy's business, plans, prospects, financial condition, liquidity, cash flows, projections and results could differ materially from those expressed in any forward - looking statement . While forward - looking statements reflect our good faith beliefs, they are not guarantees of future performance . New risks and uncertainties arise over time, and it is not possible for us to predict the occurrence of those matters or the manner in which they may affect us . These risk factors and others are included from time to time in documents Vertex Energy files with the Securities and Exchange Commission, including, but not limited to, its Form 10 - Ks, Form 10 - Qs and Form 8 - Ks , available at the SEC’s website at www . sec . gov . Other unknown or unpredictable factors also could have material adverse effects on Vertex Energy’s future results . Except as required by law, Vertex Energy expressly disclaims any obligation or undertaking to update any forward - looking statements to reflect any change in its expectations with regard thereto or any change in events, conditions or circumstances on which any statement is based . The forward - looking statements included in this presentation are made only as of the date hereof . Vertex Energy cannot guarantee future results, levels of activity, performance or achievements . Accordingly, you should not place undue reliance on these forward - looking statements . Finally, Vertex Energy undertakes no obligation to update these statements after the date of this presentation, except as required by law, and also undertakes no obligation to update or correct information prepared by third parties that are not paid for by Vertex Energy . Industry Information Information regarding market and industry statistics contained in this presentation is based on information available to us that we believe is accurate . It is generally based on publications that are not produced for investment or economic analysis . 2

Business Update

Executive Summary 4Q20 performance and management outlook 4 4Q20 Performance Key Performance Indicators Strategic Initiatives Progress Update Management Outlook 4Q20 and Full - Year 2021 Heartland and Marrero Update. Both refineries are operating near peak utilization during the first quarter 2021 Refined Product Margins. As of March 2021, Group II base oil refined products margins were near record levels, while distillate margins have improved materially vs. 4Q20 levels First Quarter 2021. Anticipate total Adjusted EBITDA in the range of ~$2.0 million to ~$2.5 million Full - Year 2021. Anticipate positive free cash flow, net income and Adjusted EBITDA Unplanned downtime at Marrero. Marrero refinery throughputs declined 25% y/y in 4Q20 due to unplanned downtime and temporary feedstock constraints Heartland performed well. Total throughputs increased 10% q/q and 6% y/y; operated at peak utilization in response to improved base oil refining production economics Solid collections growth. Total direct used motor oil collections increased 9% in the fourth quarter 2020, supported by organic market share growth and improved vehicle miles traveled vs. 2Q20 trough levels Business has bottomed. Refinery utilization and refined product margins both improved, as 4Q20 progressed Myrtle Grove oil reclamation project. Myrtle Grove has begun to receive distressed hydrocarbon streams that will be pretreated and reclaimed as feedstock for sale into third - party industrial markets and at the Marrero refinery Myrtle Grove renewable diesel project. This project is under evaluation, as we continue to consider the construction of a pre - treatment facility capable of sourcing and stabilizing non - conforming organic oils used in the production of renewable diesel fuel Business turnaround. During the second half of 2020, we enacted a performance improvement plan that expanded our filter processing capabilities, while optimizing logistics to ensure improved fleet collection efficiencies

Adjusted EBITDA Performance Bridge Refined product margin declines and weather - related disruptions at Marrero impacted 4Q20 results 5 4Q19 vs. 4Q20 Adjusted EBITDA Bridge ($MM) • Additional SG&A related to the launch of new gasoline distribution division • Margin impact related to significant y/y decline commodity prices • Volume impact due to unplanned outage at Marrero in October 2020 • Metals business turnaround – reduced costs, improved operating efficiency • Group III base oil prices have recovered, driven by higher underlying commodity (WTI crude oil) prices ($3.1) ($4.2) ($0.4) ($0.4) Net New Division SG&A

Refined Product Margins Are Improving While margins are still below historical averages, higher crude oil prices benefit our business 6 USGC 3% HSFO Less West Texas Intermediate (WTI) Crude Oil ($/Barrel) High Sulfur Fuel Oil is a Proxy for Used Motor Oil (UMO) Price; WTI is a Proxy For Product Prices (1) Source: CME Group (March 2021) Higher Commodity Prices Benefit Us WTI crude oil climbed higher beginning in Dec - 20 and has held at current levels (1) $0 $10 $20 $30 $40 $50 $60 $70 $80 Jan-18 Apr-18 Jul-18 Oct-18 Jan-19 Apr-19 Jul-19 Oct-19 Jan-20 Apr-20 Jul-20 Oct-20 Jan-21 • Reduction in OPEC crude oil production drove crude oil prices higher beginning in Nov - 20 • U.S. Energy Information Administration forecasting WTI to remain ~$50 barrel at least through the end of 2022 • Refined product margins have improved at both Marrero and Heartland since November 2020 and remain strong into March 2021 ($7) ($6) ($5) ($4) ($3) ($2) ($1) $0 $1 Actual Spread Futures Spread

Myrtle Grove Facility Update Targeting more than 7 million gallons of annualized feedstock production at Myrtle Grove by year - end 2022 7 Vertex remains committed to developing high - purity transportation fuels and base oils that support global transition toward efficient, low - carbon energy solutions Myrtle Grove Facility Update Oil Reclamation Project expected to add an estimated $3 million of EBITDA by year - end 2022 • Overview. Our co - owned Myrtle Grove (MG) facility recycles distressed organic waste streams used in the production of renewable diesel fuel and other product streams. • Oil Reclamation. The oil reclamation project sources hydrocarbon waste streams from tankage and barges, recycles the oil, then resells the higher value intermediate stream into industrial end - markets. Vertex is currently in the process of enhancing its processing capabilities at MG to accept increased volumes of industrial oil for processing and expects to begin selling feed to third parties during the second half of 2021. • Renewable Diesel. A future phase currently being scoped includes the potential installation of a pre - treatment plant that converts crude vegetable oils such as soybean, canola, and waste - based materials such as used cooking oil, beef tallow and distillers - corn - oil into feedstocks suitable for producing feedstock used in the production of renewable diesel fuel.
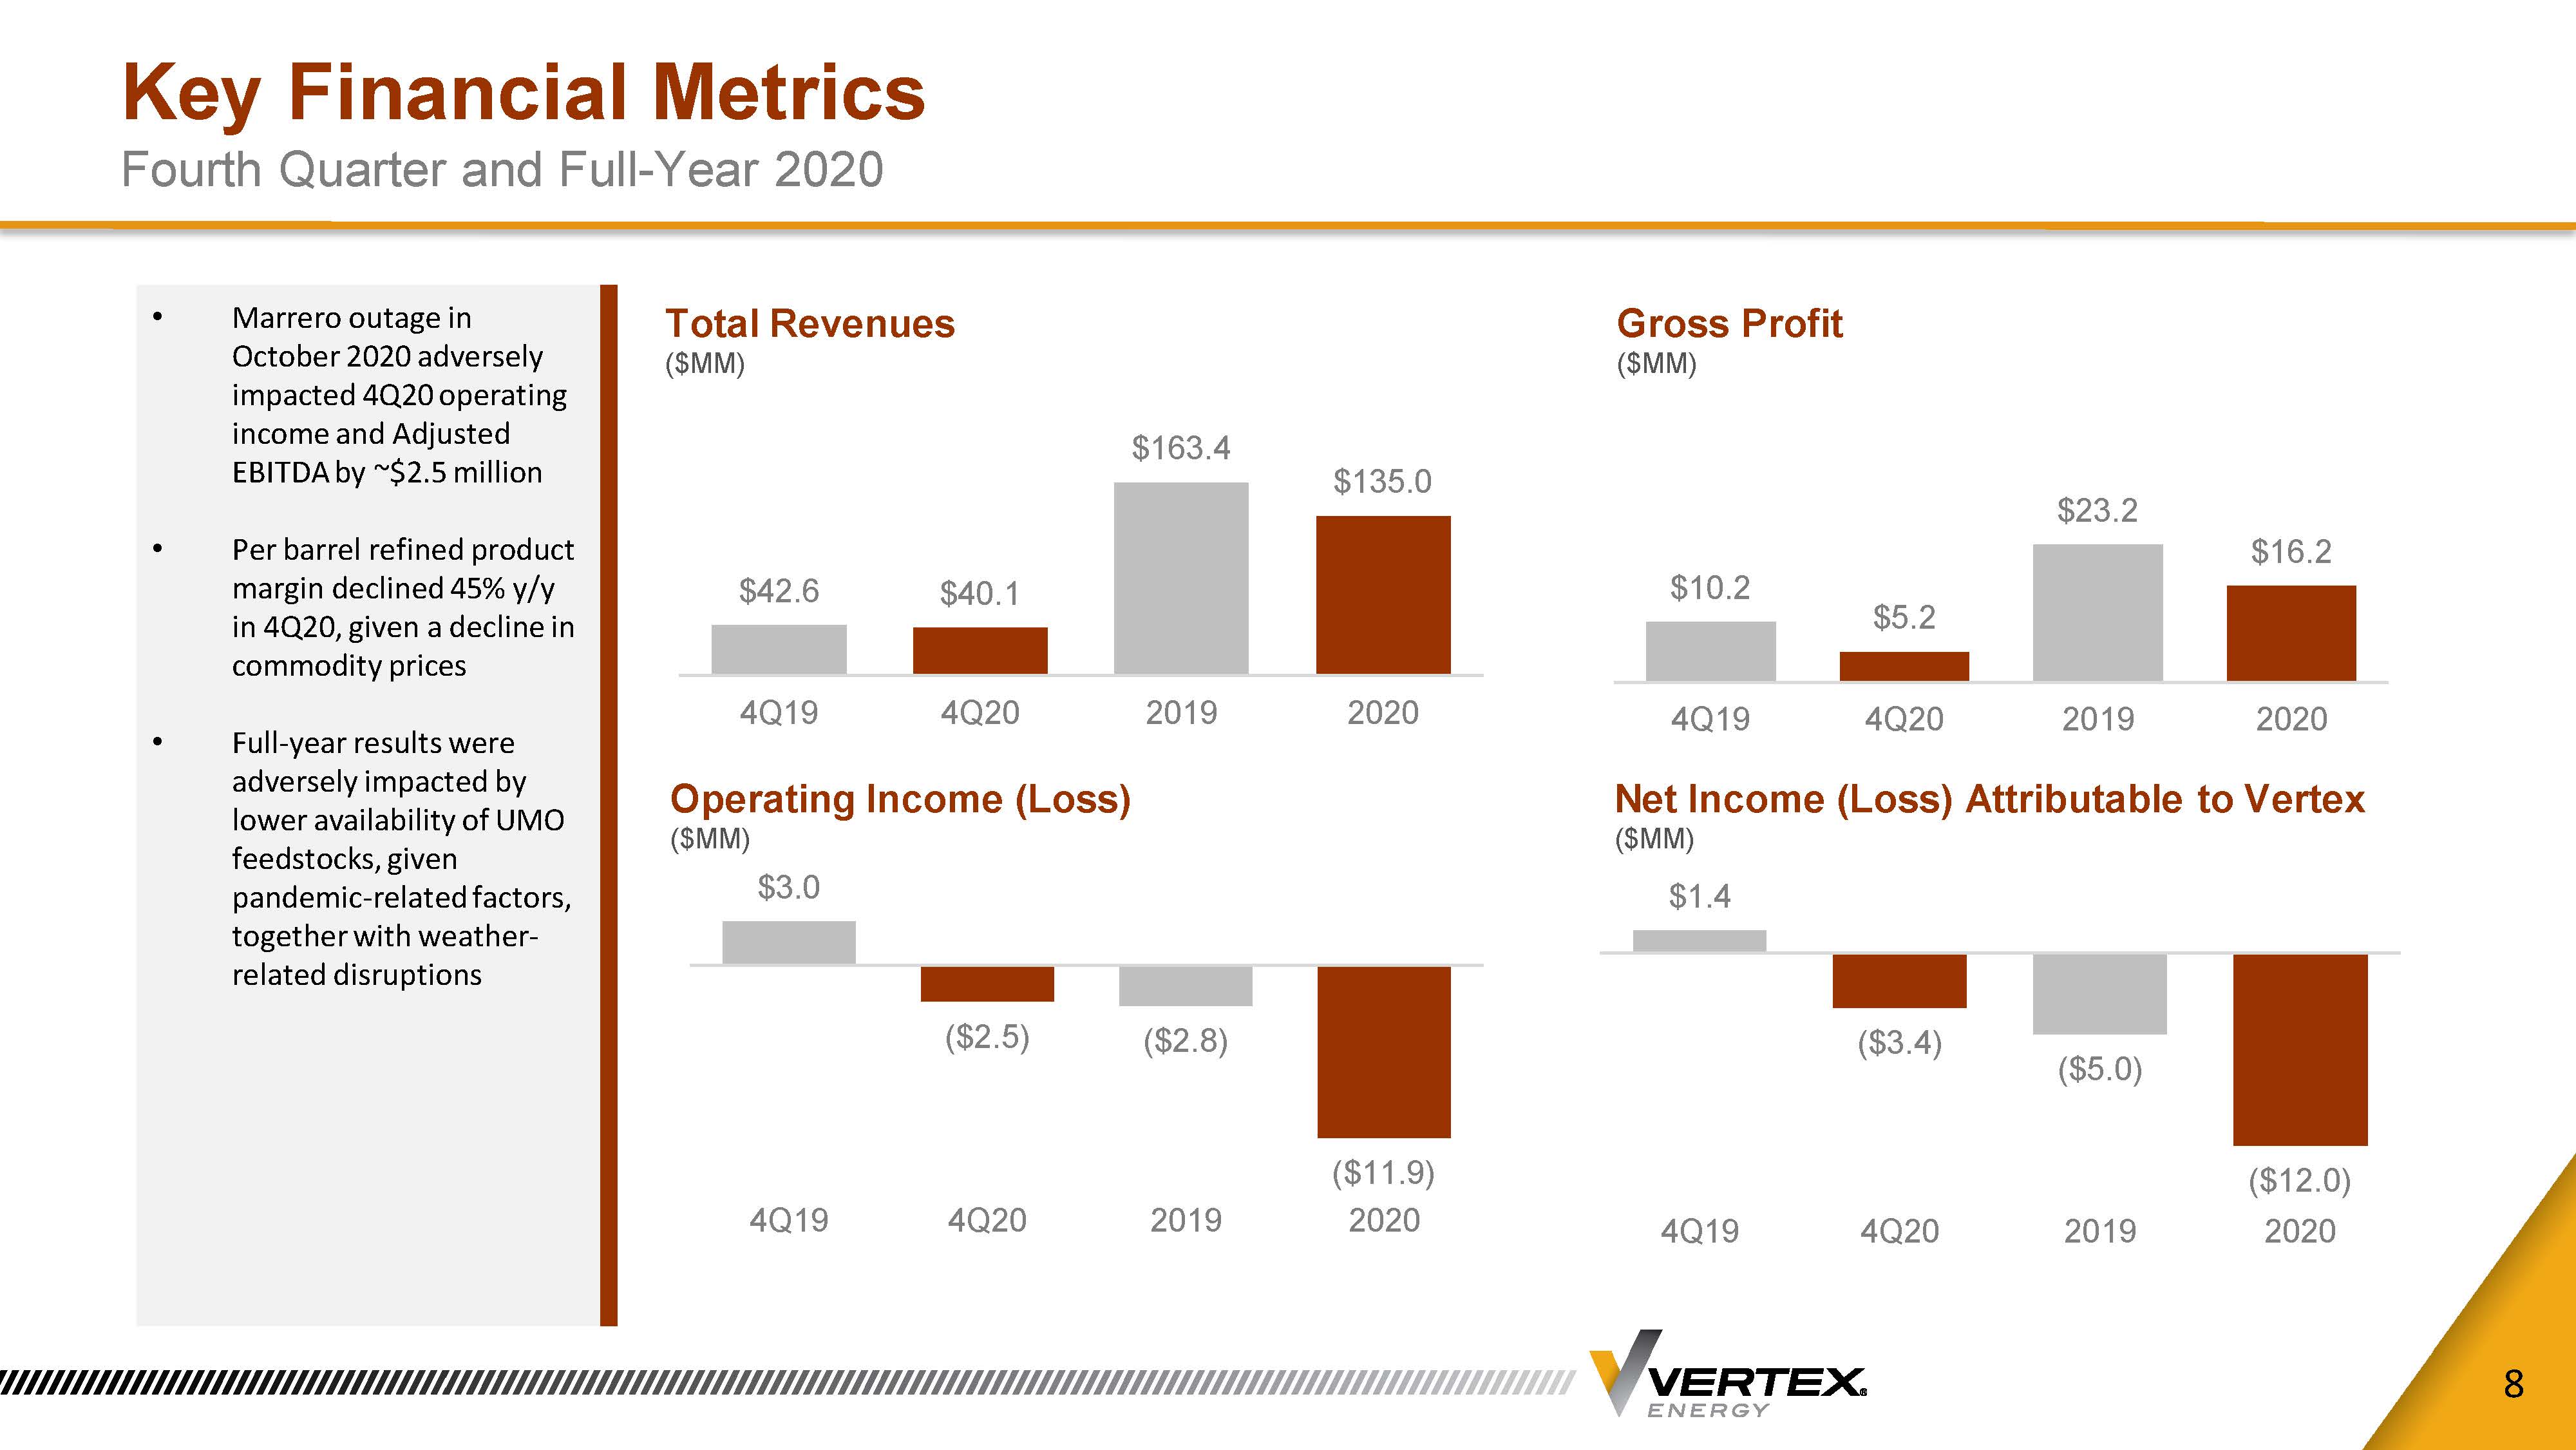
Key Financial Metrics Fourth Quarter and Full - Year 2020 8 Total Revenues ($MM) Gross Profit ($MM) Operating Income (Loss) ($MM) Net Income (Loss) Attributable to Vertex ($MM) • Marrero outage in October 2020 adversely impacted 4Q20 operating income and Adjusted EBITDA by ~$2.5 million • Per barrel refined product margin declined 45% y/y in 4Q20, given a decline in commodity prices • Full - year results were adversely impacted by lower availability of UMO feedstocks, given pandemic - related factors, together with weather - related disruptions $42.6 $40.1 $163.4 $135.0 4Q19 4Q20 2019 2020 $10.2 $5.2 $23.2 $16.2 4Q19 4Q20 2019 2020 $3.0 ($2.5) ($2.8) ($11.9) 4Q19 4Q20 2019 2020 $1.4 ($3.4) ($5.0) ($12.0) 4Q19 4Q20 2019 2020

UMO Collections Have Improved From 2Q20 Lows Collections remain below historical levels; improved operating efficiency reducing per gallon collections cost 9 Vertex UMO Feedstock Supply (UMO Gallons in Millions) U.S. Vehicle Miles Traveled (Millions of Road Vehicle Miles Traveled) (1) (1) Source: US DOT (February 2021) • Collection levels have improved since 2Q20; Total direct collections increased to 10.2 million gallons in 4Q20, +9% y/y, vs. 9.4 gallons in 4Q19 • Total cost per gallon to collect is nearly 20% lower than in the prior year in early 2021, given improved route optimization and operating efficiencies • U.S. vehicle miles traveled remain below historical levels; VMT 6% below 3 - year average in December 2020 21.2 20.1 15.1 19.3 18.8 4Q19 1Q20 2Q20 3Q20 4Q20 100,000 150,000 200,000 250,000 300,000 350,000 Jan-15 Mar-15 May-15 Jul-15 Sep-15 Nov-15 Jan-16 Mar-16 May-16 Jul-16 Sep-16 Nov-16 Jan-17 Mar-17 May-17 Jul-17 Sep-17 Nov-17 Jan-18 Mar-18 May-18 Jul-18 Sep-18 Nov-18 Jan-19 Mar-19 May-19 Jul-19 Sep-19 Nov-19 Jan-20 Mar-20 May-20 Jul-20 Sep-20 Nov-20 VMT by Month VMT 3-Year Trailing Average

Refinery Utilization Update Heartland operated at peak capacity, while Marrero was impacted by adverse weather 10 (1) Utilization defined as total refinery throughputs divided by nameplate capacity of the refinery Marrero Refinery Capacity Utilization Rate (1) Heartland Refinery Capacity Utilization Rate (1) • Full - year utilization severely impacted by pandemic - related decline in VMT, resulting in lower UMO availability • Fourth quarter utilization impacted by severe weather conditions in Oct - 20 • More UMO availability in regional markets vs. Marrero, allowing for utilization to remain near prior - year levels • Attractive base oil economics currently incentivize optimizing Heartland in 1Q21 100% 75% 95% 81% 4Q19 4Q20 2019 2020 103% 109% 102% 97% 4Q19 4Q20 2019 2020

Balance Sheet Update We expect to be free cash flow positive in both 1Q21 and Full - Year 2021 11 (1) Included in total cash amounts are $ 9 . 3 million in cash held in the Company’s special purpose vehicles (SPVs) relating to its co - owned Myrtle Grove and Heartland assets, which are limited to use by each SPV, respectively . (2) Free cash flow is defined as net cash from operating activities less total capital expenditures Cash & Available Liquidity $MM(1) Capital Allocation Priorities $6.3 $7.9 $12.3 Year-End 2018 Year-End 2019 Year-End 2020 Debt reduction High - ROIC Organic Growth Projects Strategic M&A Cash Preservation • Year - over - year growth in total cash and liquidity, despite significant pandemic - related challenges • Significant investment in new business lines to support future growth impacted free cash flow (2) • Anticipate generating positive FCF, Adjusted EBITDA and Net Income in the full - year 2021

APPENDIX

Our Strategic Focus Outlining a path toward profitable growth through the cycle 13 • Direct collections are significantly cost - advantaged over third - party purchased collections • By increasing direct collections as % of total collections, we significantly reduce feedstock costs Drive Direct Collections Growth • Safe, reliable operations drive profitable growth • Focused on reducing feedstock overhead and reducing direct OPEX per gallon sold Optimize Refining Asset Base • Shift from production of commodity intermediates toward higher value finished products • Be recognized as leading producer of IMO compliant marine fuel and high - purity base oils High - Grade Production Slate • Identify high - return organic growth projects within existing asset base • Partner with one or more venture investors on a project - by - project basis to support project CAPEX Growth CAPEX / Private Funding y • Generate Adj. EBITDA growth – use free cash flow to maintain conservative net leverage profile • Continue to diversify EBITDA across end - markets, geographies and customers • Profitable Growth Through Cycle

We Are Focused On High - Grading Our Production Slate Moving higher on the value chain from commoditized toward branded products 14 Realized Gross Margin Capture Product Portfolio Evolution Commodity Products Specialty Products Vacuum Gas Oil IMO Marine Fuels High Purity Base Oils Niche Lubricants
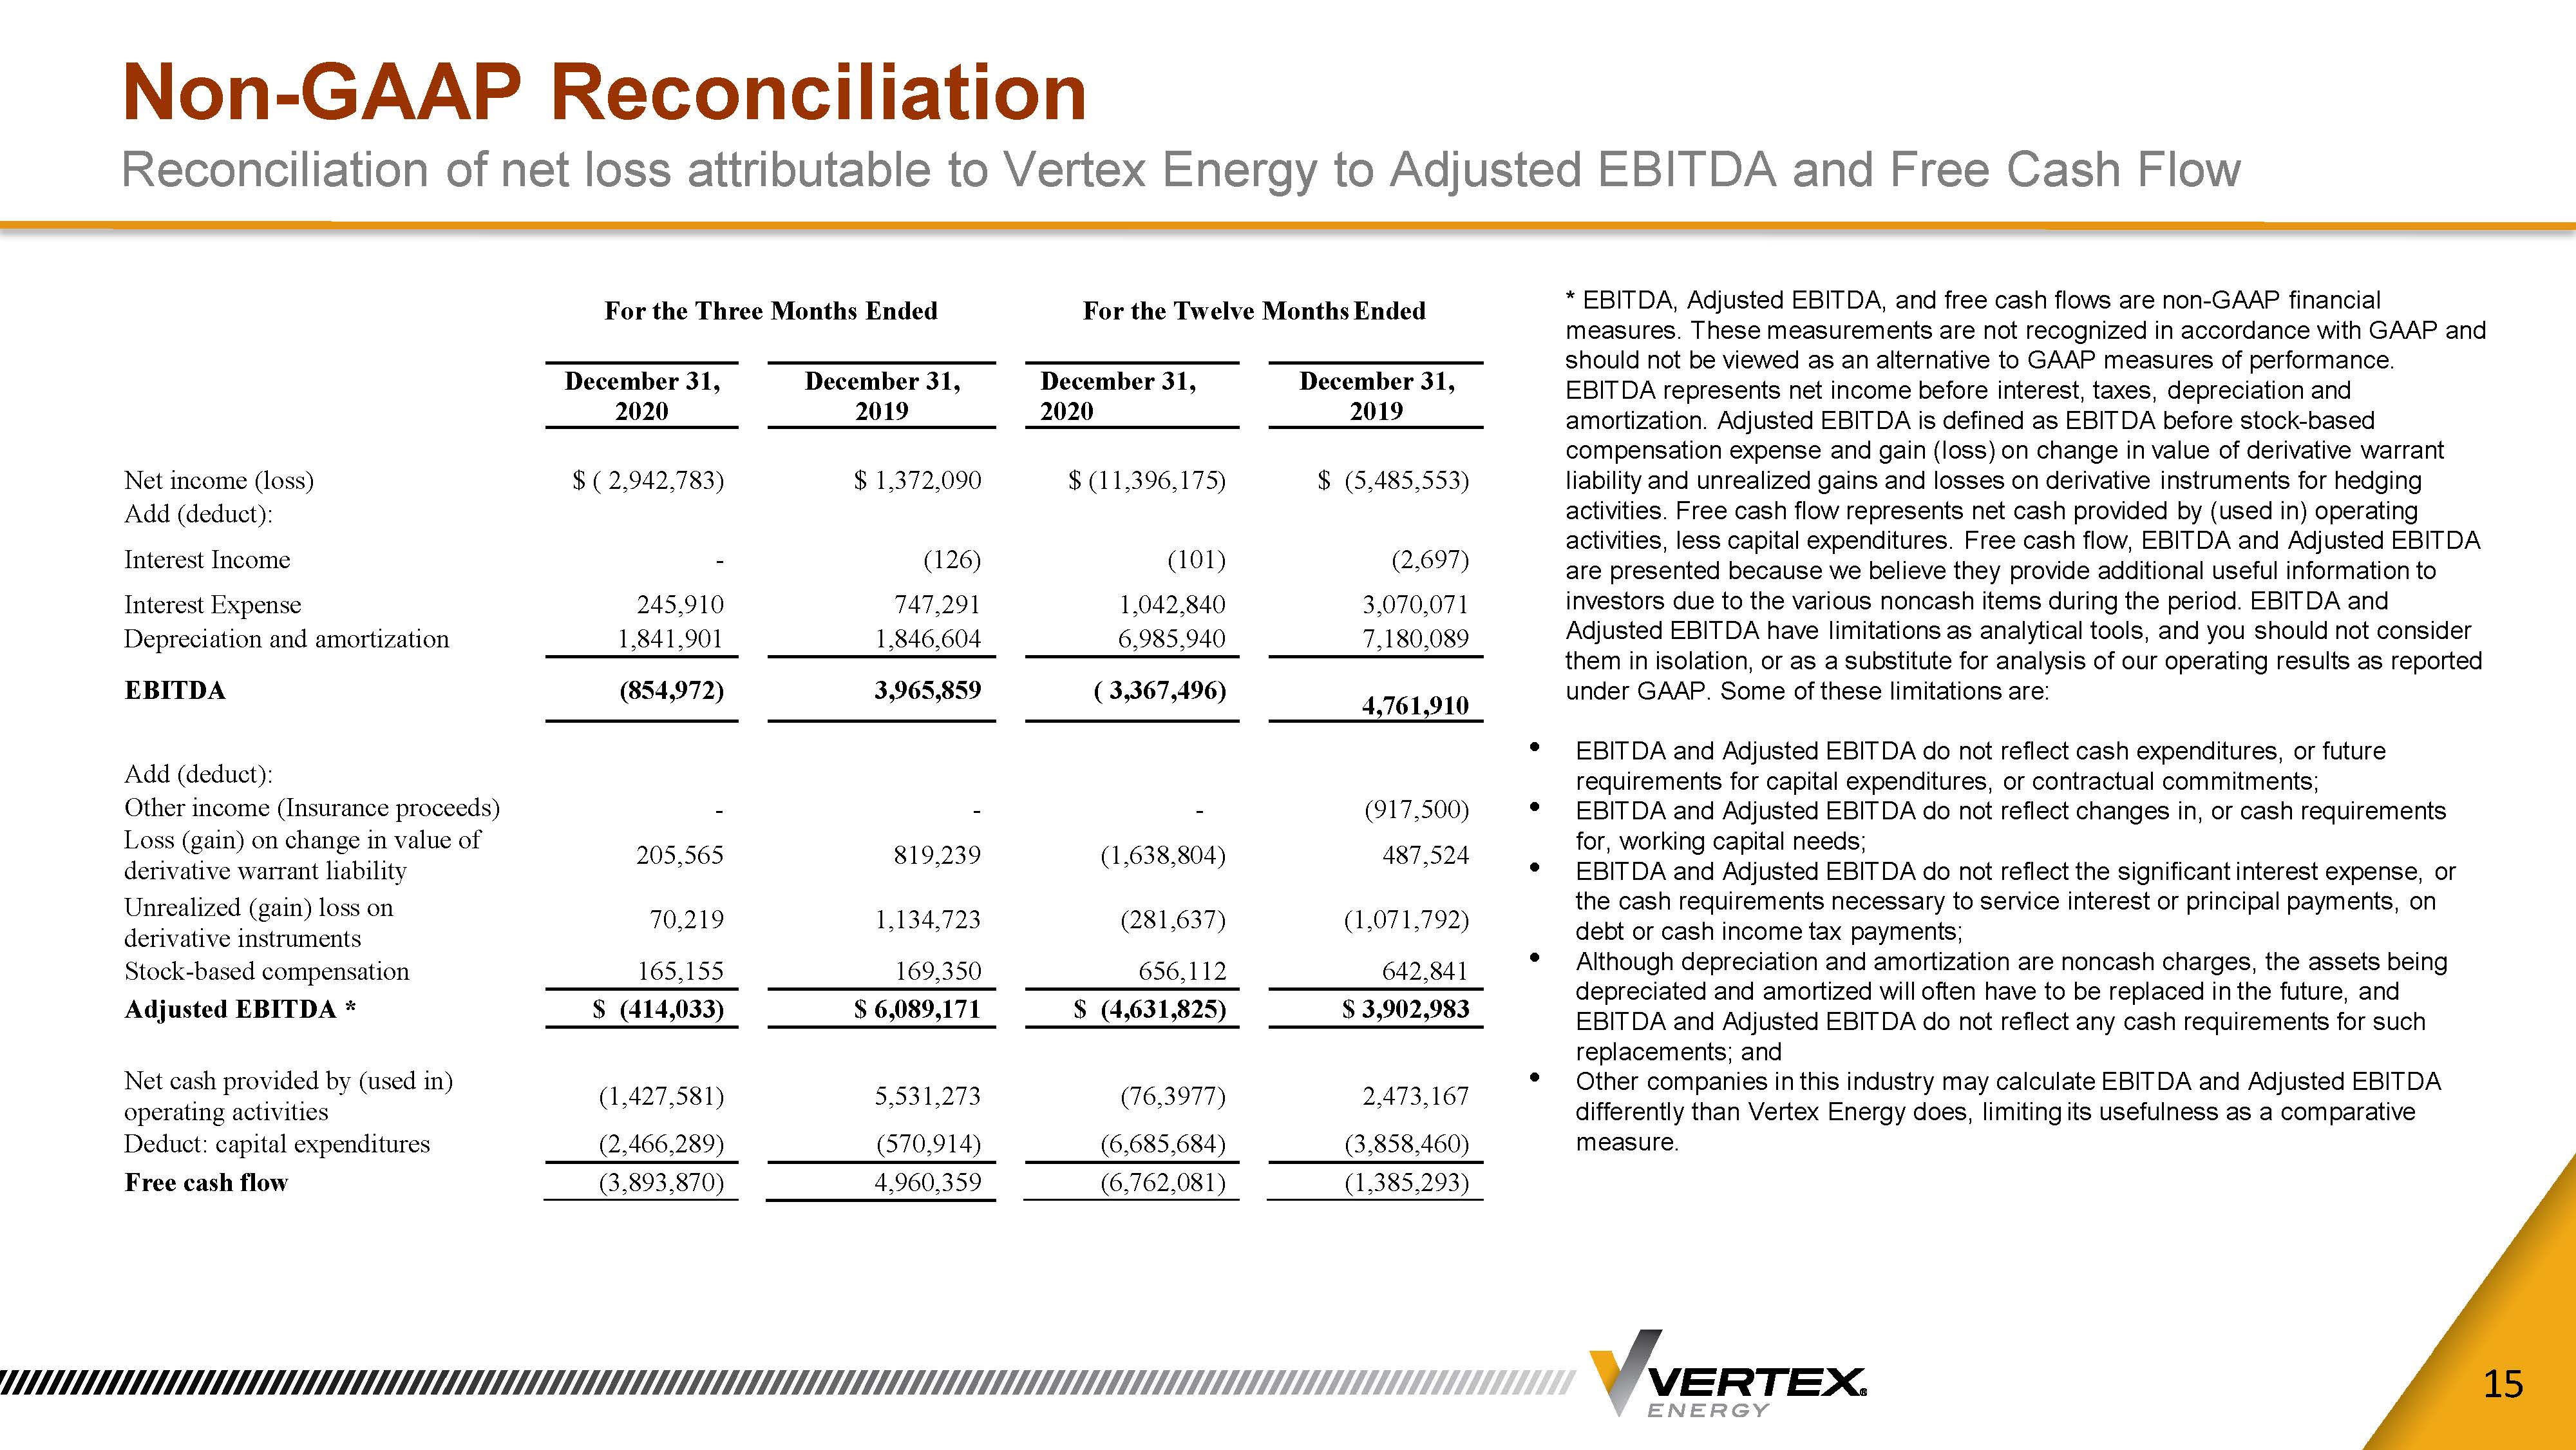
Non - GAAP Reconciliation Reconciliation of net loss attributable to Vertex Energy to Adjusted EBITDA and Free Cash Flow 15 * EBITDA, Adjusted EBITDA, and free cash flows are non - GAAP financial measures. These measurements are not recognized in accordance with GAAP and should not be viewed as an alternative to GAAP measures of performance. EBITDA represents net income before interest, taxes, depreciation and amortization. Adjusted EBITDA is defined as EBITDA before stock - based compensation expense and gain (loss) on change in value of derivative warrant liability and unrealized gains and losses on derivative instruments for hedging activities. Free cash flow represents net cash provided by (used in) operating activities, less capital expenditures. Free cash flow, EBITDA and Adjusted EBITDA are presented because we believe they provide additional useful information to investors due to the various noncash items during the period. EBITDA and Adjusted EBITDA have limitations as analytical tools, and you should not consider them in isolation, or as a substitute for analysis of our operating results as reported under GAAP. Some of these limitations are: • EBITDA and Adjusted EBITDA do not reflect cash expenditures, or future requirements for capital expenditures, or contractual commitments; • EBITDA and Adjusted EBITDA do not reflect changes in, or cash requirements for, working capital needs; • EBITDA and Adjusted EBITDA do not reflect the significant interest expense, or the cash requirements necessary to service interest or principal payments, on debt or cash income tax payments; • Although depreciation and amortization are noncash charges, the assets being depreciated and amortized will often have to be replaced in the future, and EBITDA and Adjusted EBITDA do not reflect any cash requirements for such replacements; and • Other companies in this industry may calculate EBITDA and Adjusted EBITDA differently than Vertex Energy does, limiting its usefulness as a comparative measure. For the Three Months Ended For the Twelve Months Ended December 31, 2020 December 31, 2019 December 31, 2020 December 31, 2019 Net income (loss) $ ( 2,942,783) $ 1,372,090 $ (11,396,175) $ (5,485,553) Add (deduct): Interest Income - (126) (101) (2,697) Interest Expense 245,910 747,291 1,042,840 3,070,071 Depreciation and amortization 1,841,901 1,846,604 6,985,940 7,180,089 EBITDA (854,972) 3,965,859 ( 3,367,496) 4,761,910 Add (deduct): Other income (Insurance proceeds) - - - (917,500) Loss (gain) on change in value of derivative warrant liability 205,565 819,239 (1,638,804) 487,524 Unrealized (gain) loss on derivative instruments 70,219 1,134,723 (281,637) (1,071,792) Stock-based compensation 165,155 169,350 656,112 642,841 Adjusted EBITDA * $ (414,033) $ 6,089,171 $ (4,631,825) $ 3,902,983 Net cash provided by (used in) operating activities (1,427,581) 5,531,273 (76,3977) 2,473,167 Deduct: capital expenditures (2,466,289) (570,914) (6,685,684) (3,858,460) Free cash flow (3,893,870) 4,960,359 (6,762,081) (1,385,293)