Attached files
| file | filename |
|---|---|
| 8-K - 8-K - INDEPENDENT BANK CORP | indb-20210309.htm |
2021 RBC Capital Markets Global Financials Conference March 9 Chris Oddleifson - Chief Executive Officer Gerry Nadeau - President and Chief Commercial Banking Officer Rob Cozzone - Executive Vice President and Chief Operating Officer Mark Ruggiero - Chief Financial Officer and Chief Accounting Officer

(2) Who We Are • Independent Bank Corp. (Nasdaq: INDB) ◦ Main Banking Sub: Rockland Trust •Market Cap: $2.9B (as of March 5, 2021) Loans: $9.4B Deposits: $11.0B Wealth Mgmt: AUA $4.9B Non-int. Income: 23.3% of revenue Market: Eastern Massachusetts 98 Branches
(3) Key Messages - Core Franchise • Extensive history of strong financial performance • Demonstrated resiliency in prior crises • Expanding footprint in growth markets • Healthy loan and core deposit originations • Diversified fee income business lines • Strong capital levels • Strong operating efficiency • Proven integrator of acquired banks • Tangible book value steadily growing* • Disciplined risk management culture *See appendix A for reconciliation
(4) Recent Accomplishments • Seven consecutive years of record operating earnings through 2019** • Strong new business generation despite pandemic • Solid growth in business and consumer households • Growing presence in Worcester County • Growth initiatives – online account opening, credit card launch, de novo branches, expanded digital offerings, enhanced mortgage capabilities, senior talent adds **See appendix B for reconciliation
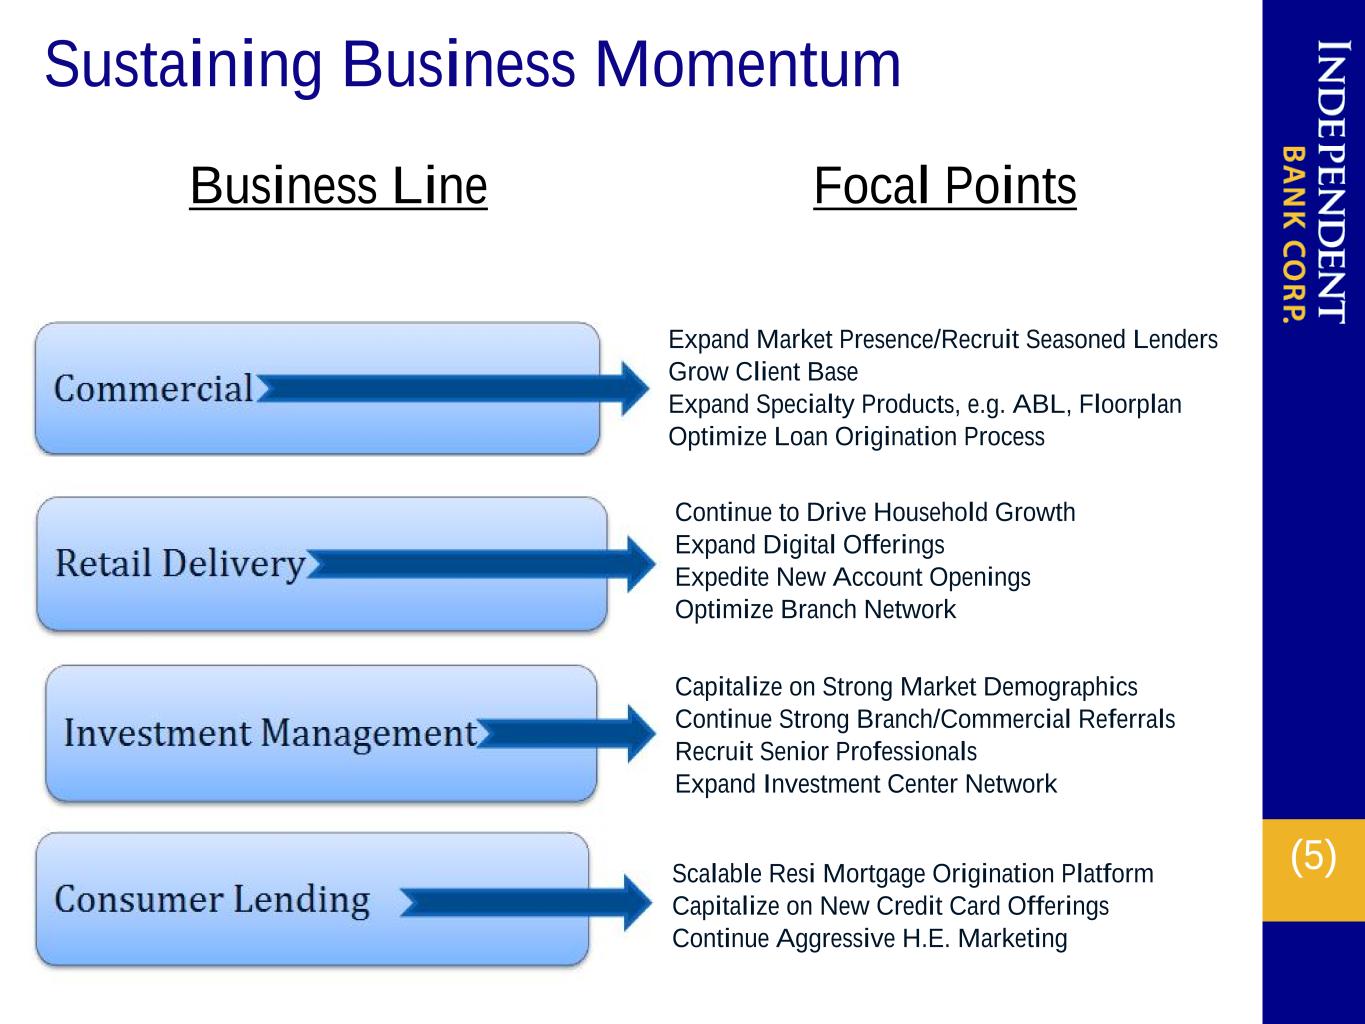
(5) Sustaining Business Momentum Business Line • Expand Market Presence/Recruit Seasoned Lenders • Grow Client Base • Expand Specialty Products, e.g. ABL, Floorplan • Optimize Loan Origination Process • Continue to Drive Household Growth • Expand Digital Offerings • Expedite New Account Openings • Optimize Branch Network • Capitalize on Strong Market Demographics • Continue Strong Branch/Commercial Referrals • Recruit Senior Professionals • Expand Investment Center Network • Scalable Resi Mortgage Origination Platform • Capitalize on New Credit Card Offerings • Continue Aggressive H.E. Marketing Focal Points
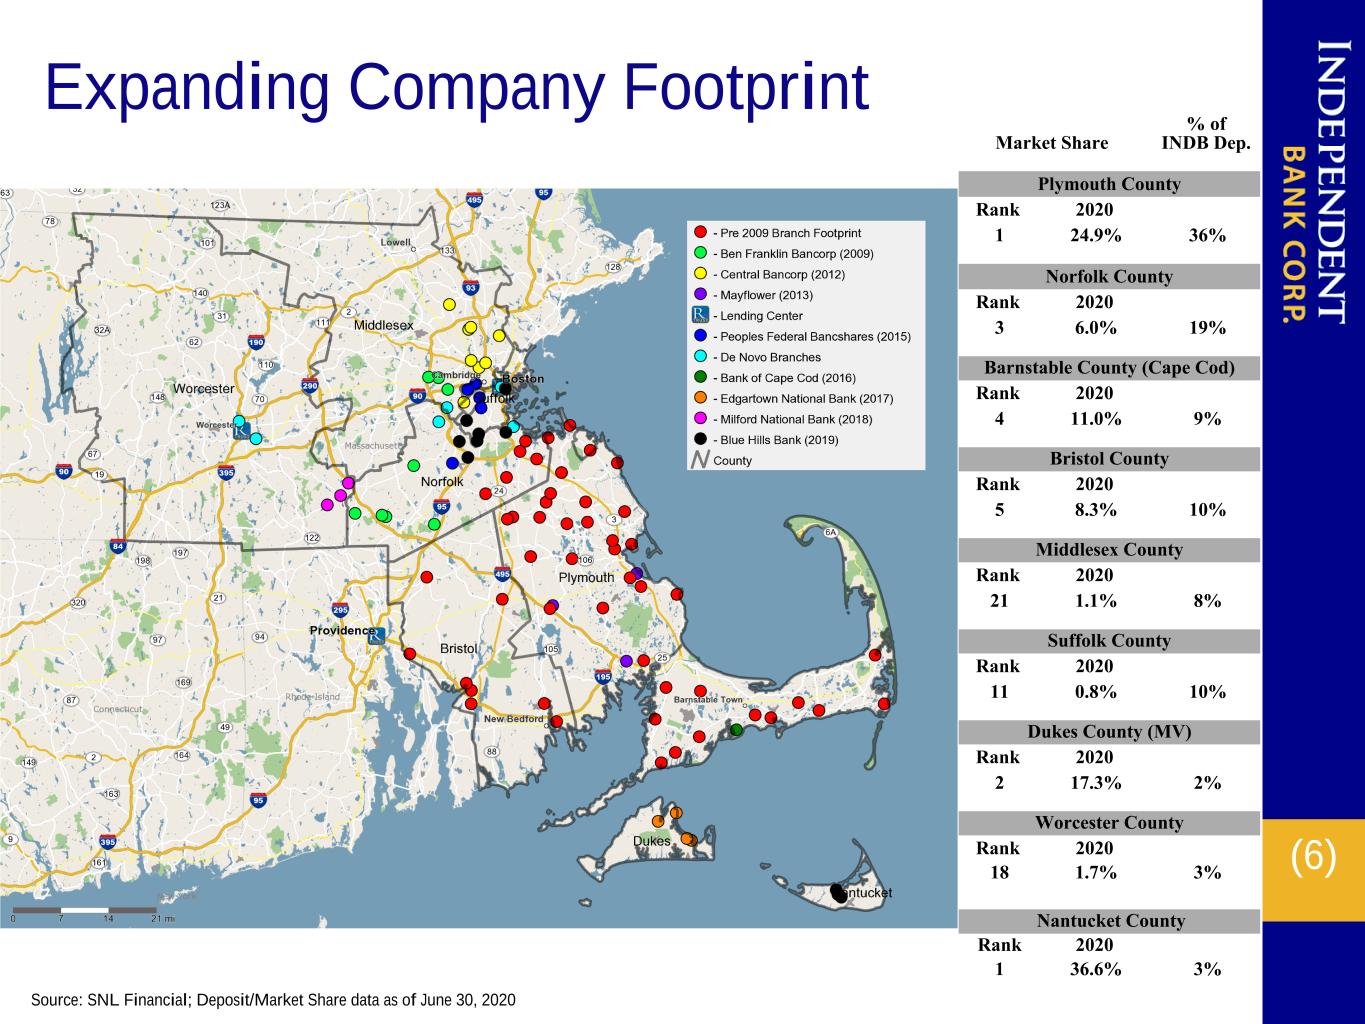
(6) Source: SNL Financial; Deposit/Market Share data as of June 30, 2020 Expanding Company Footprint Market Share % of INDB Dep. Plymouth County Rank 2020 1 24.9% 36% Norfolk County Rank 2020 3 6.0% 19% Barnstable County (Cape Cod) Rank 2020 4 11.0% 9% Bristol County Rank 2020 5 8.3% 10% Middlesex County Rank 2020 21 1.1% 8% Suffolk County Rank 2020 11 0.8% 10% Dukes County (MV) Rank 2020 2 17.3% 2% Worcester County Rank 2020 18 1.7% 3% Nantucket County Rank 2020 1 36.6% 3%
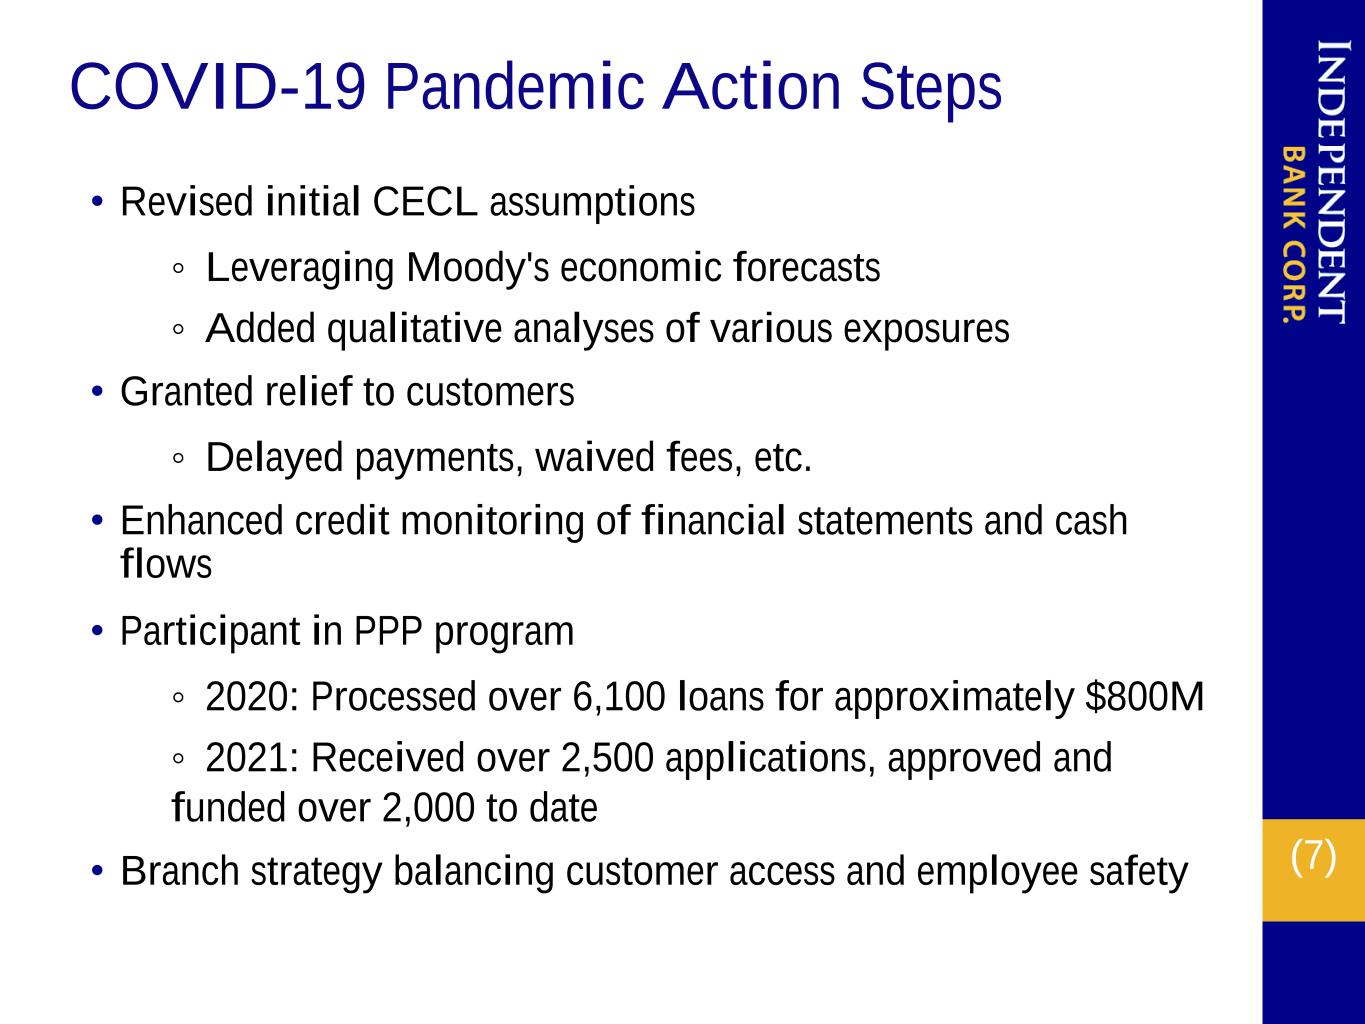
(7) COVID-19 Pandemic Action Steps • Revised initial CECL assumptions ◦ Leveraging Moody's economic forecasts ◦ Added qualitative analyses of various exposures • Granted relief to customers ◦ Delayed payments, waived fees, etc. • Enhanced credit monitoring of financial statements and cash flows • Participant in PPP program ◦ 2020: Processed over 6,100 loans for approximately $800M ◦ 2021: Received over 2,500 applications, approved and funded over 2,000 to date • Branch strategy balancing customer access and employee safety
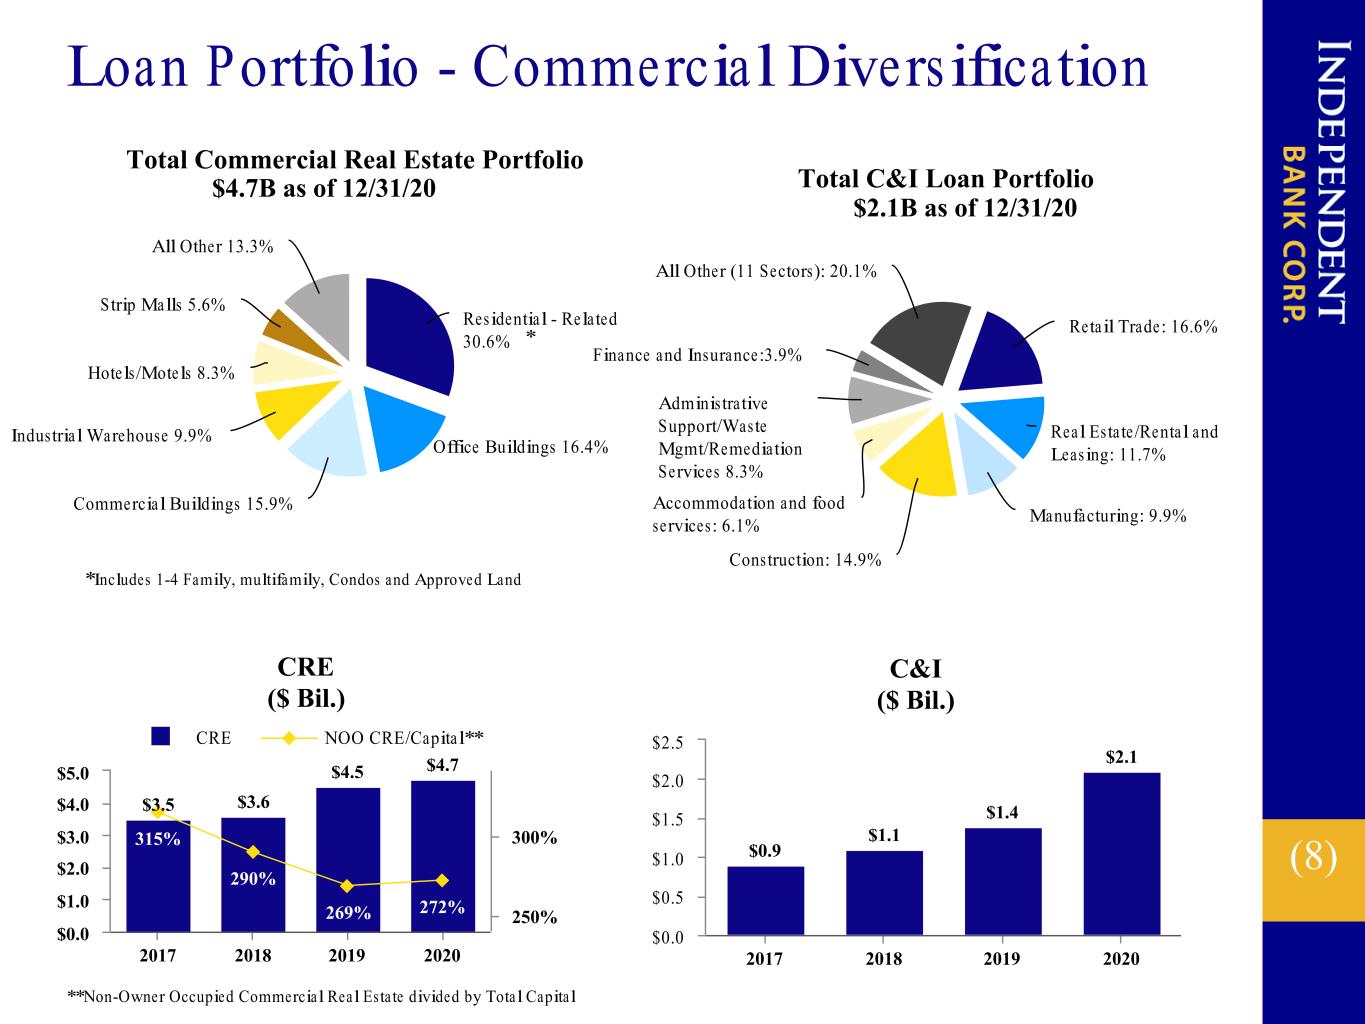
(8) Total Commercial Real Estate Portfolio Residential - Related 30.6% Office Buildings 16.4% Commercial Buildings 15.9% Industrial Warehouse 9.9% Hotels/Motels 8.3% Strip Malls 5.6% All Other 13.3% Loan Portfolio - Commercial Diversification $4.7B as of 12/31/20 Total C&I Loan Portfolio Retail Trade: 16.6% Real Estate/Rental and Leasing: 11.7% Manufacturing: 9.9% Construction: 14.9% Accommodation and food services: 6.1% Administrative Support/Waste Mgmt/Remediation Services 8.3% Finance and Insurance:3.9% All Other (11 Sectors): 20.1% $2.1B as of 12/31/20 *Includes 1-4 Family, multifamily, Condos and Approved Land CRE ($ Bil.) $3.5 $3.6 $4.5 $4.7 315% 290% 269% 272% CRE NOO CRE/Capital** 2017 2018 2019 2020 $0.0 $1.0 $2.0 $3.0 $4.0 $5.0 250% 300% **Non-Owner Occupied Commercial Real Estate divided by Total Capital C&I ($ Bil.) $0.9 $1.1 $1.4 $2.1 2017 2018 2019 2020 $0.0 $0.5 $1.0 $1.5 $2.0 $2.5 *
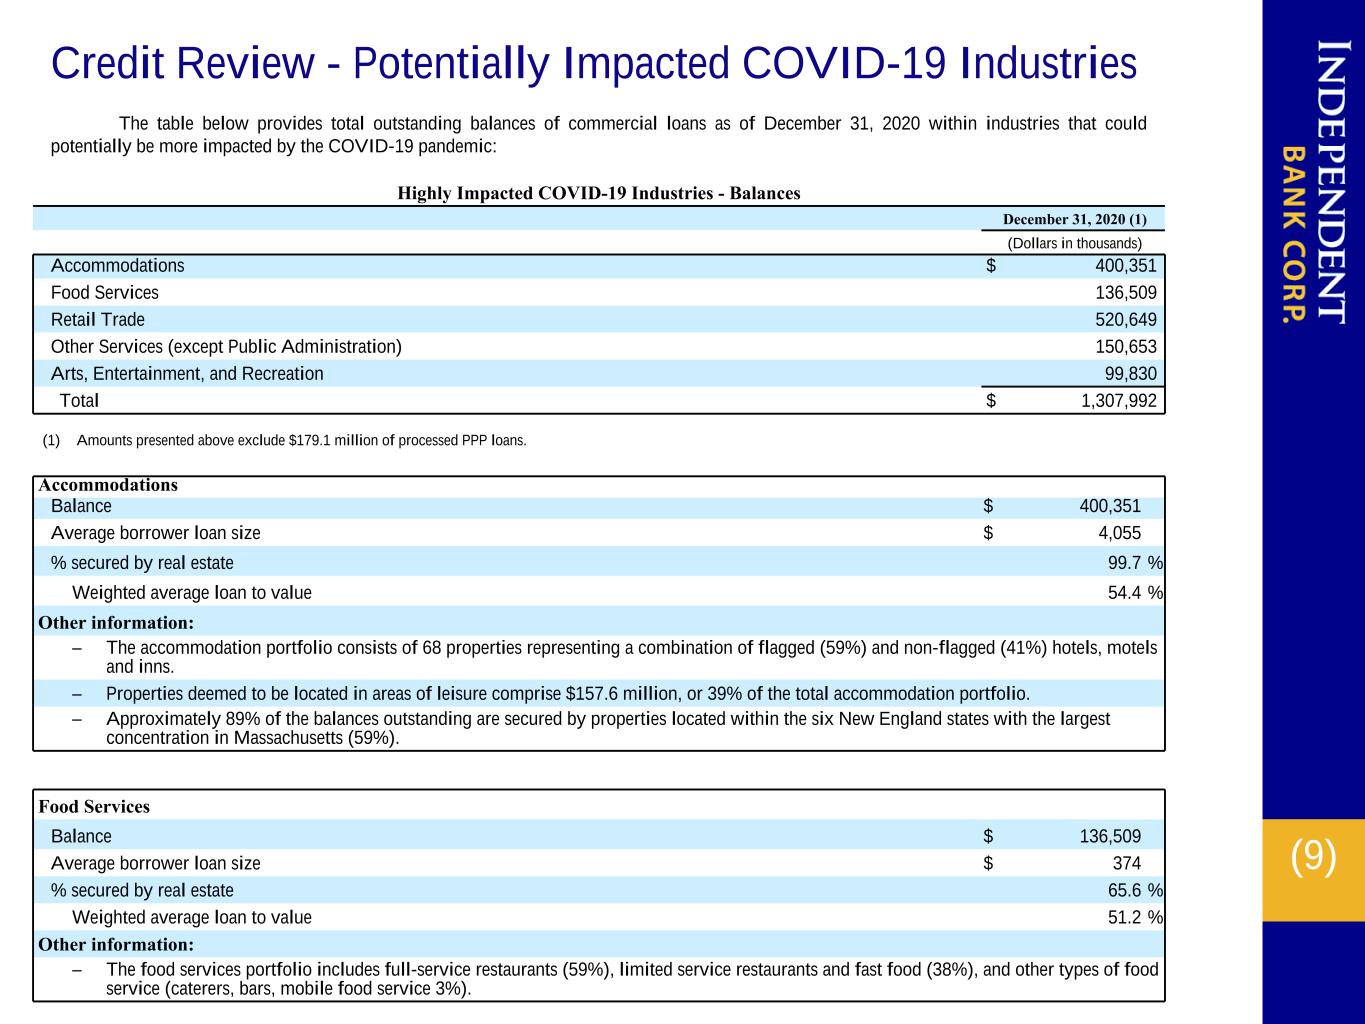
(9) Credit Review - Potentially Impacted COVID-19 Industries Accommodations Balance $ 400,351 Average borrower loan size $ 4,055 % secured by real estate 99.7 % Weighted average loan to value 54.4 % Other information: – The accommodation portfolio consists of 68 properties representing a combination of flagged (59%) and non-flagged (41%) hotels, motels and inns. – Properties deemed to be located in areas of leisure comprise $157.6 million, or 39% of the total accommodation portfolio. – Approximately 89% of the balances outstanding are secured by properties located within the six New England states with the largest concentration in Massachusetts (59%). The table below provides total outstanding balances of commercial loans as of December 31, 2020 within industries that could potentially be more impacted by the COVID-19 pandemic: Food Services Balance $ 136,509 Average borrower loan size $ 374 % secured by real estate 65.6 % Weighted average loan to value 51.2 % Other information: – The food services portfolio includes full-service restaurants (59%), limited service restaurants and fast food (38%), and other types of food service (caterers, bars, mobile food service 3%). Highly Impacted COVID-19 Industries - Balances December 31, 2020 (1) (Dollars in thousands) Accommodations $ 400,351 Food Services 136,509 Retail Trade 520,649 Other Services (except Public Administration) 150,653 Arts, Entertainment, and Recreation 99,830 Total $ 1,307,992 (1) Amounts presented above exclude $179.1 million of processed PPP loans.
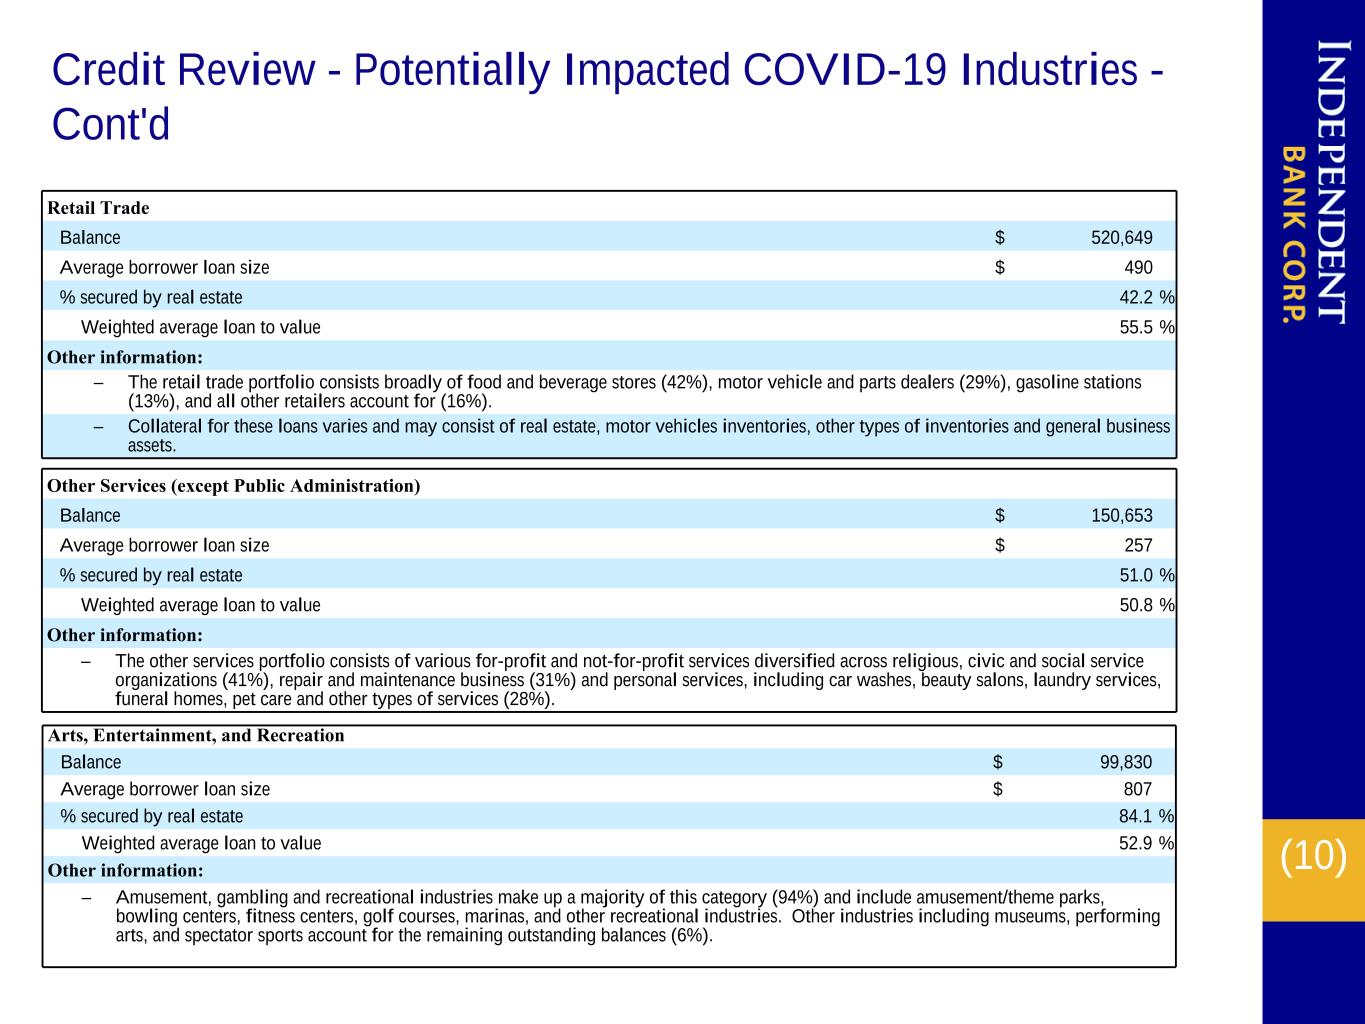
(10) Credit Review - Potentially Impacted COVID-19 Industries - Cont'd Other Services (except Public Administration) Balance $ 150,653 Average borrower loan size $ 257 % secured by real estate 51.0 % Weighted average loan to value 50.8 % Other information: – The other services portfolio consists of various for-profit and not-for-profit services diversified across religious, civic and social service organizations (41%), repair and maintenance business (31%) and personal services, including car washes, beauty salons, laundry services, funeral homes, pet care and other types of services (28%). Arts, Entertainment, and Recreation Balance $ 99,830 Average borrower loan size $ 807 % secured by real estate 84.1 % Weighted average loan to value 52.9 % Other information: – Amusement, gambling and recreational industries make up a majority of this category (94%) and include amusement/theme parks, bowling centers, fitness centers, golf courses, marinas, and other recreational industries. Other industries including museums, performing arts, and spectator sports account for the remaining outstanding balances (6%). Retail Trade Balance $ 520,649 Average borrower loan size $ 490 % secured by real estate 42.2 % Weighted average loan to value 55.5 % Other information: – The retail trade portfolio consists broadly of food and beverage stores (42%), motor vehicle and parts dealers (29%), gasoline stations (13%), and all other retailers account for (16%). – Collateral for these loans varies and may consist of real estate, motor vehicles inventories, other types of inventories and general business assets.
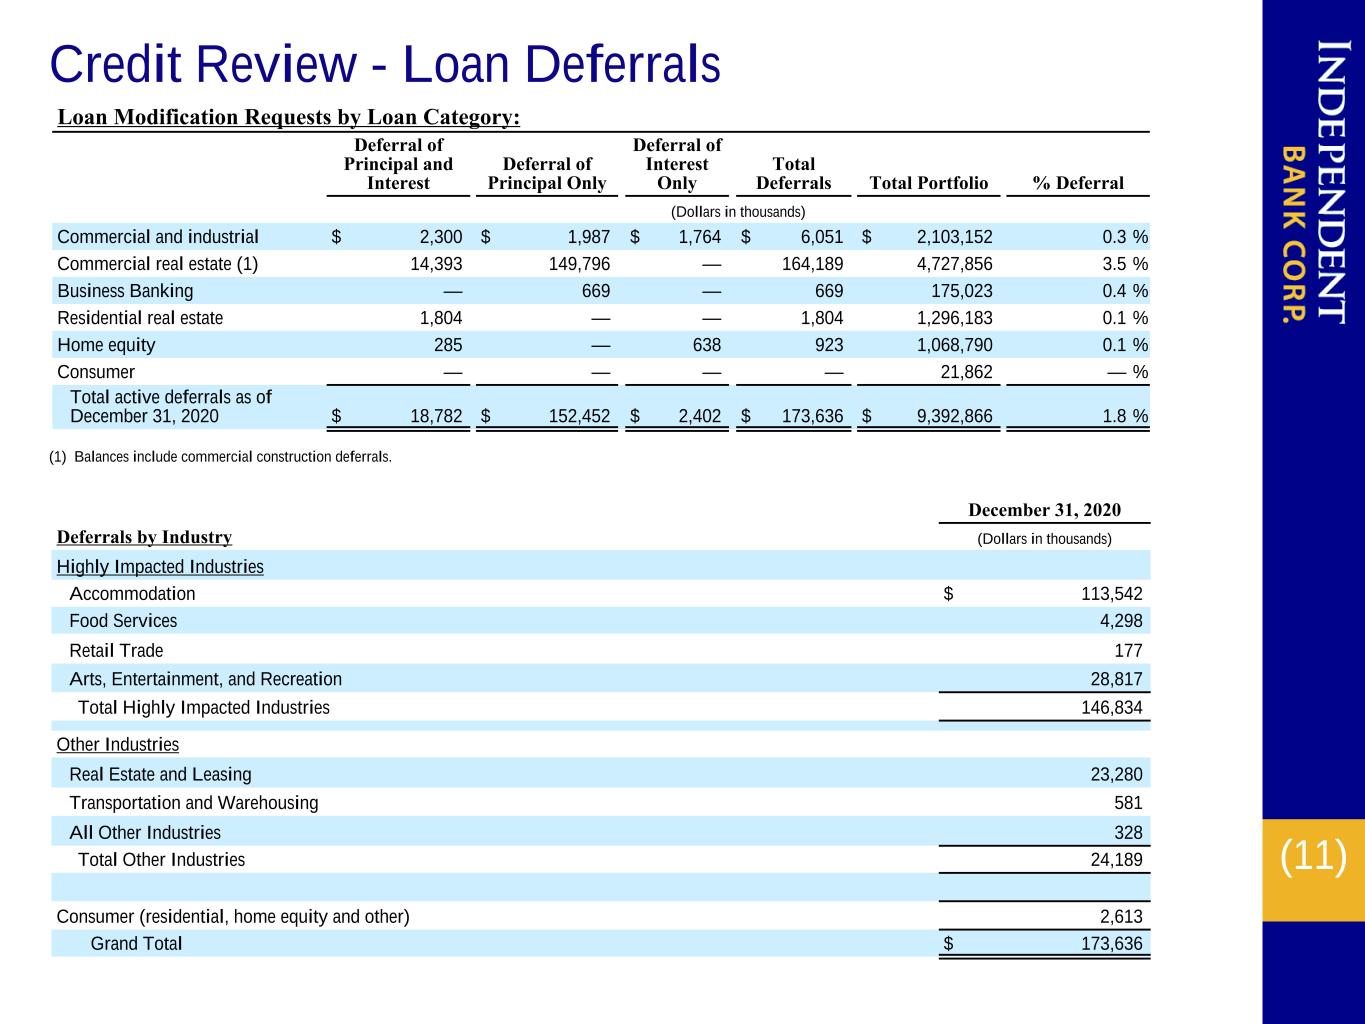
(11) Credit Review - Loan Deferrals December 31, 2020 Deferrals by Industry (Dollars in thousands) Highly Impacted Industries Accommodation $ 113,542 Food Services 4,298 Retail Trade 177 Arts, Entertainment, and Recreation 28,817 Total Highly Impacted Industries 146,834 Other Industries Real Estate and Leasing 23,280 Transportation and Warehousing 581 All Other Industries 328 Total Other Industries 24,189 Consumer (residential, home equity and other) 2,613 Grand Total $ 173,636 Loan Modification Requests by Loan Category: Deferral of Principal and Interest Deferral of Principal Only Deferral of Interest Only Total Deferrals Total Portfolio % Deferral (Dollars in thousands) Commercial and industrial $ 2,300 $ 1,987 $ 1,764 $ 6,051 $ 2,103,152 0.3 % Commercial real estate (1) 14,393 149,796 — 164,189 4,727,856 3.5 % Business Banking — 669 — 669 175,023 0.4 % Residential real estate 1,804 — — 1,804 1,296,183 0.1 % Home equity 285 — 638 923 1,068,790 0.1 % Consumer — — — — 21,862 — % Total active deferrals as of December 31, 2020 $ 18,782 $ 152,452 $ 2,402 $ 173,636 $ 9,392,866 1.8 % (1) Balances include commercial construction deferrals.

(12) C&I 52.0% Home Equity 8.1% CRE 15.2% Residential 23.2% Small Business 1.2% Other Consumer 0.2% Asset Quality: Well Managed NPLs ($Mil.) $49.6 $45.4 $48.0 $66.9 0.78% 0.66% 0.54% 0.71% NPLs ($Mil) NPL/Loan% 2017 2018 2019 2020 $0.0 $20.0 $40.0 $60.0 $80.0 $100.0 $120.0 $140.0 00% 0.20% 0.40% 0.60% 0.80% 10% Net Charge-offs ($Mil.) $3.9 $1.1 $2.6 $6.9 Net Charge-offs Loss Rate 2017 2018 2019 2020 $0.0 $1.0 $2.0 $3.0 $4.0 0bps 2bps 4bps 6bps 8bps 2bps 6bps 3bps 7bps * * Annualized • Disciplined underwriter • Low loss rates • High average FICOs and low average LTVs in consumer book • Proactive identification and resolution of problem loans NPLs 12/31/20
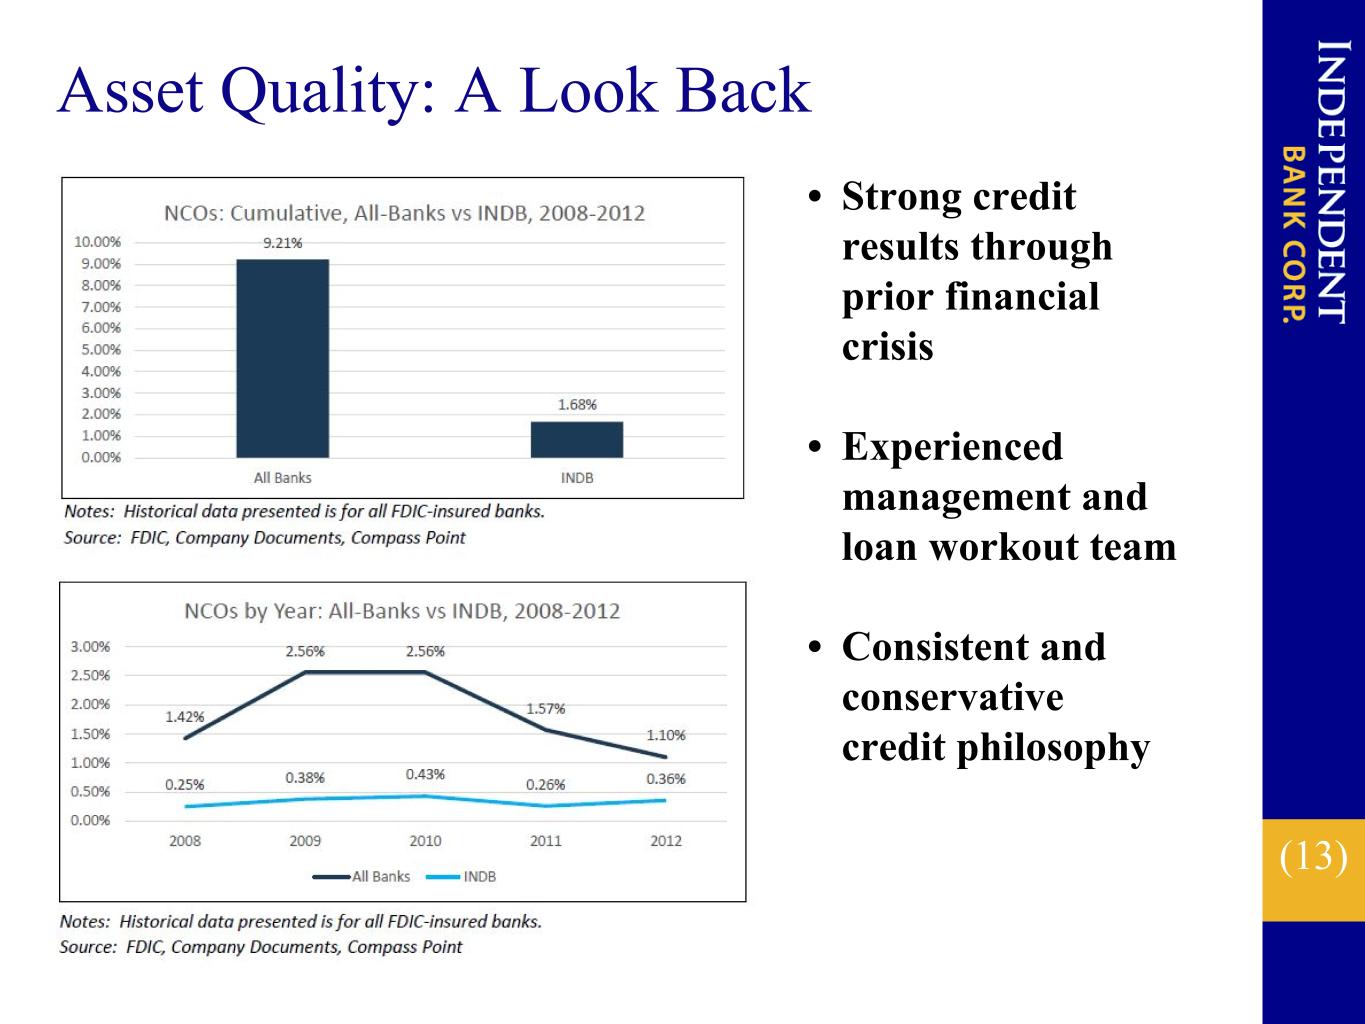
(13) Asset Quality: A Look Back • Strong credit results through prior financial crisis • Experienced management and loan workout team • Consistent and conservative credit philosophy
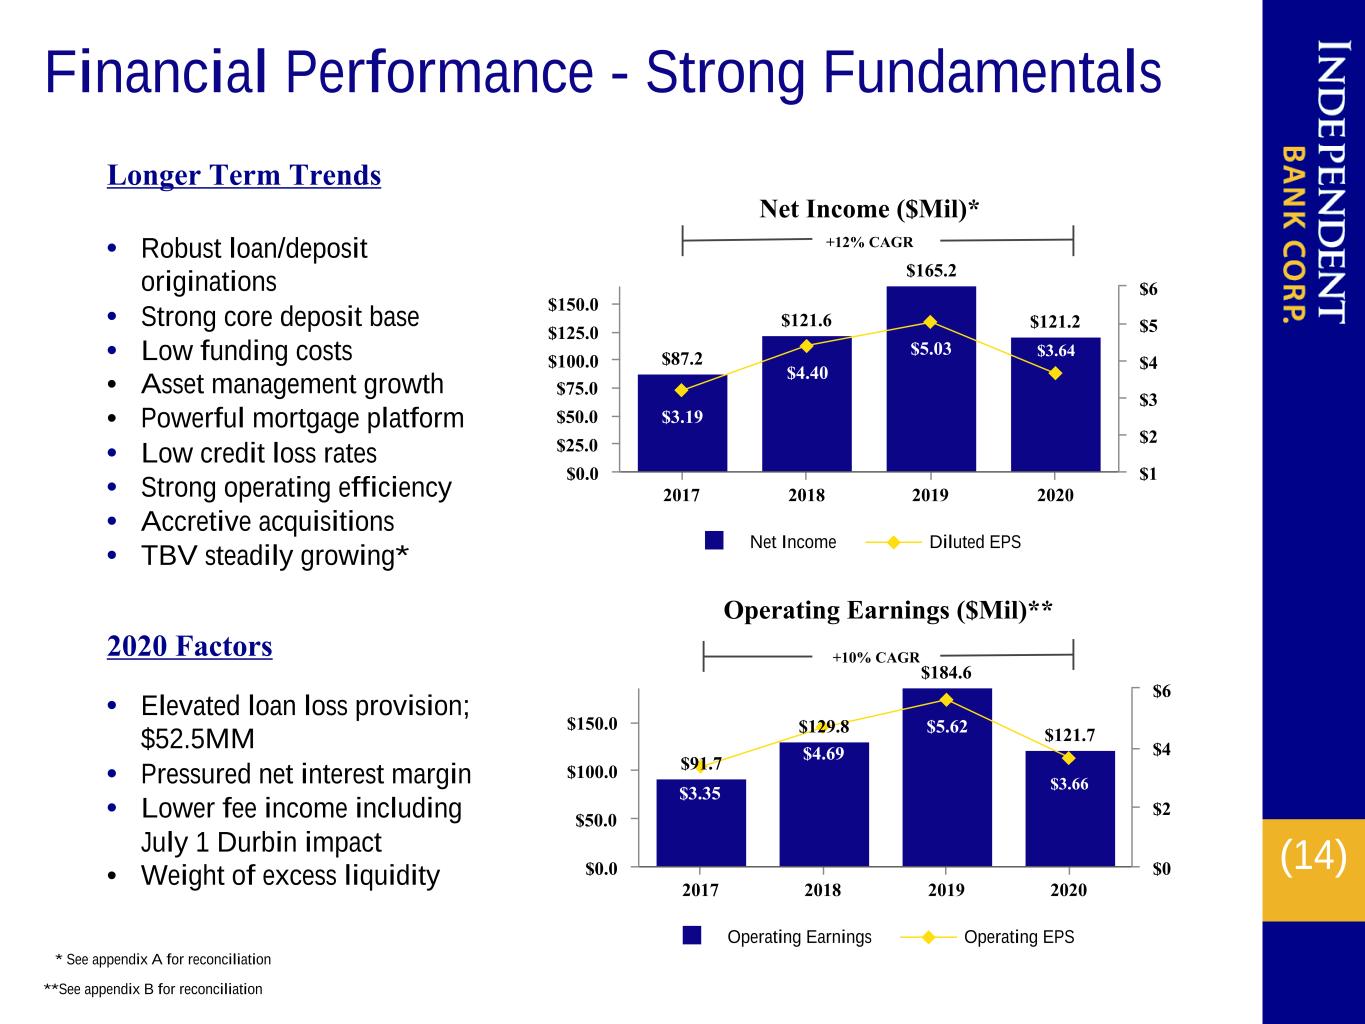
(14) $91.7 $129.8 $184.6 $121.7 $3.35 $4.69 $5.62 $3.66 Operating Earnings Operating EPS 2017 2018 2019 2020 $0.0 $50.0 $100.0 $150.0 $0 $2 $4 $6 $87.2 $121.6 $165.2 $121.2 $3.19 $4.40 $5.03 $3.64 Net Income Diluted EPS 2017 2018 2019 2020 $0.0 $25.0 $50.0 $75.0 $100.0 $125.0 $150.0 $1 $2 $3 $4 $5 $6 Financial Performance - Strong Fundamentals * See appendix A for reconciliation **See appendix B for reconciliation +12% CAGR +10% CAGR Longer Term Trends • Robust loan/deposit originations • Strong core deposit base • Low funding costs • Asset management growth • Powerful mortgage platform • Low credit loss rates • Strong operating efficiency • Accretive acquisitions • TBV steadily growing* 2020 Factors • Elevated loan loss provision; $52.5MM • Pressured net interest margin • Lower fee income including July 1 Durbin impact • Weight of excess liquidity Net Income ($Mil)* Operating Earnings ($Mil)**
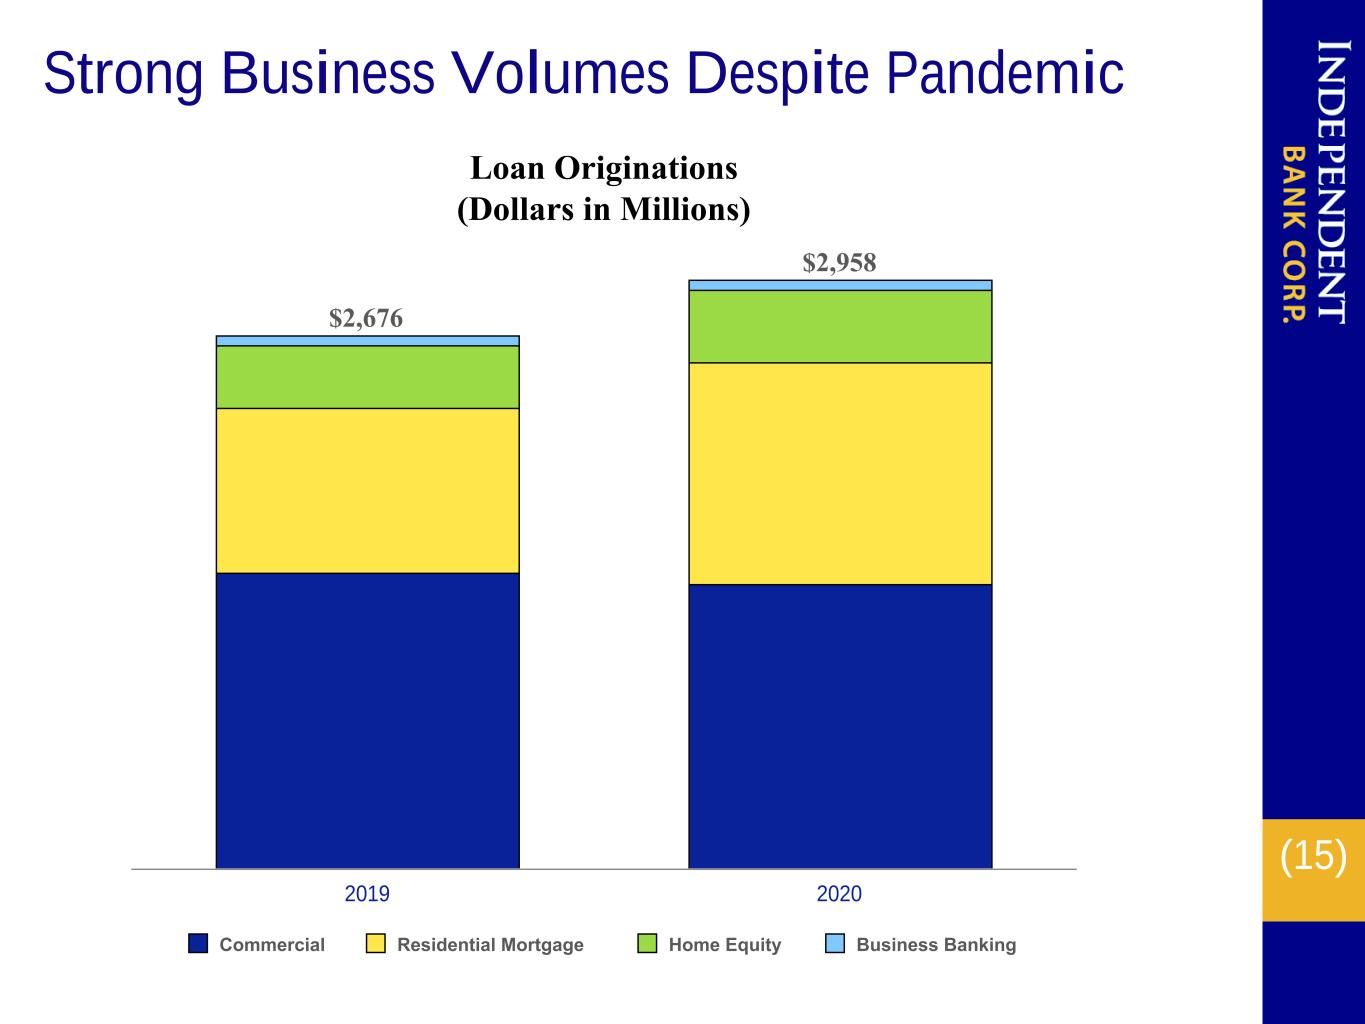
(15) Loan Originations (Dollars in Millions) $2,676 $2,958 Commercial Residential Mortgage Home Equity Business Banking 2019 2020 Strong Business Volumes Despite Pandemic

(16) Low Cost Deposit Base Demand Deposits 34% Money Market 20% Savings/Now 37% CDs 9% Total Deposits $11.0B 4Q 2020 Core Deposits ($ Bil.) $6.1 $6.6 $7.6 $9.8 90.1% 88.7% 79.9% 89.6% Core Deposits Core to Total 2017 2018 2019 2020 $0.0 $2.0 $4.0 $6.0 $8.0 $10.0 0.0% 20.0% 40.0% 60.0% 80.0% 100.0% Cost of Deposits 0.19% 0.29% 0.47% 0.27% 2017 2018 2019 2020 00% 0.10% 0.20% 0.30% 0.40% 0.50% • Sizable demand deposit component • Record new checking account openings in 2020 • <1% of HH's are CD only • Valuable source of liquidity • Relationship-based approach • Expanded digital access • Growing commercial base * *Q4 2020 Cost of Deposits 0.14%
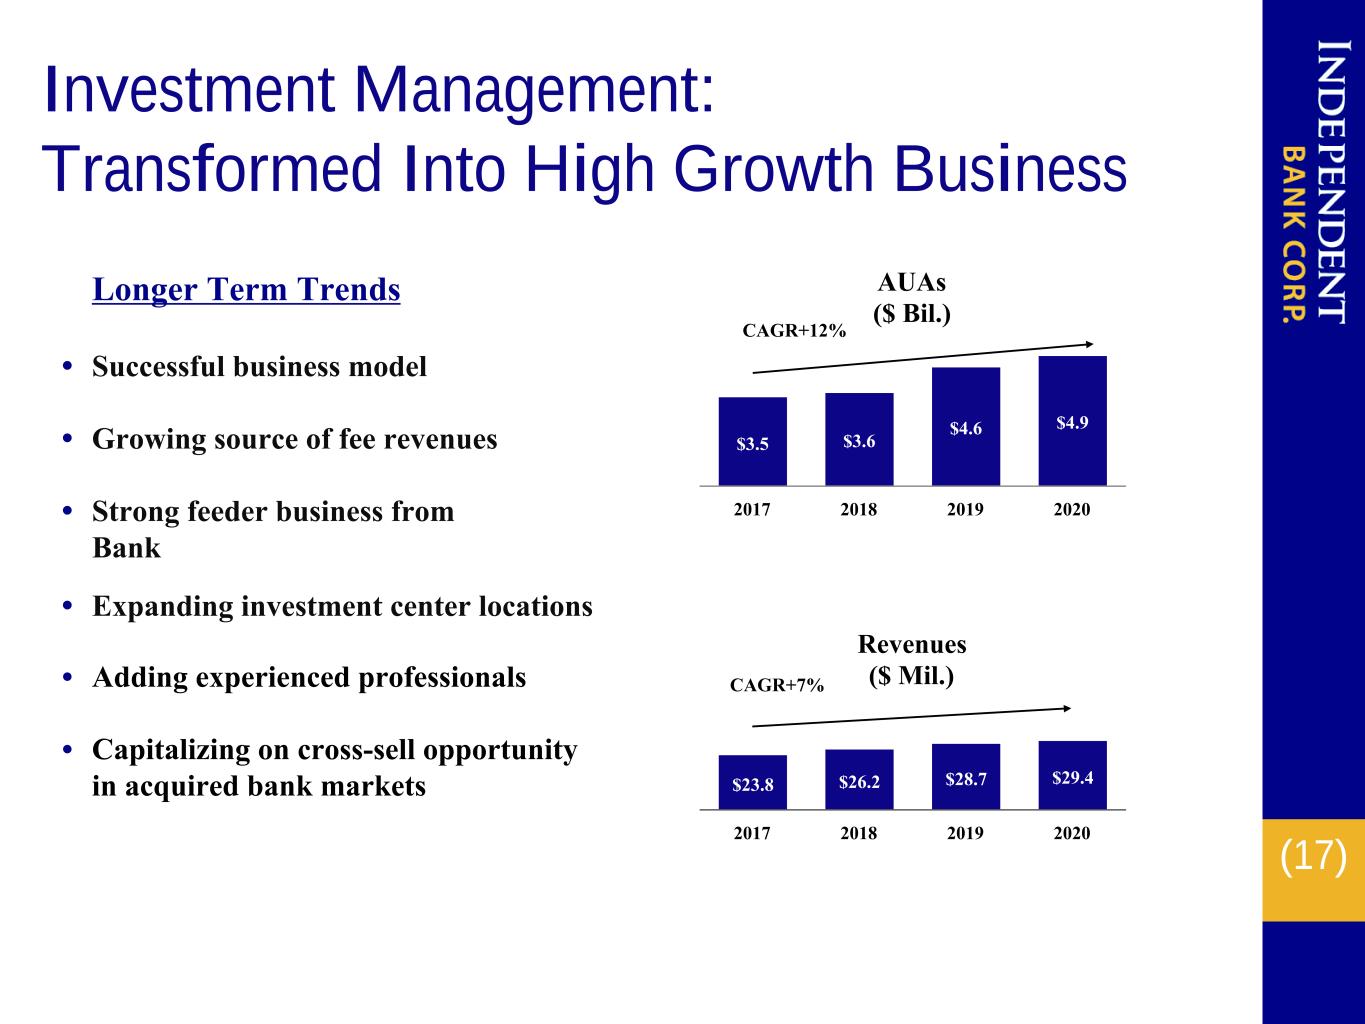
(17) Investment Management: Transformed Into High Growth Business Longer Term Trends • Successful business model • Growing source of fee revenues • Strong feeder business from Bank AUAs ($ Bil.) $3.5 $3.6 $4.6 $4.9 2017 2018 2019 2020 • Expanding investment center locations • Adding experienced professionals • Capitalizing on cross-sell opportunity in acquired bank markets • Revenues ($ Mil.) $23.8 $26.2 $28.7 $29.4 2017 2018 2019 2020 CAGR+7% CAGR+12%

(18) Book Value $34.38 $38.23 $49.69 $51.65 11.68% 12.13% 14.99% 12.89% 10.04% 10.69% 11.28% 9.56% Book Value Per Share Equity/Assets % Tier 1 Leverage 2017 2018 2019 2020 $0 $10 $20 $30 $40 $50 0% 5% 10% 15% 20% 25% Strong Capital Position Tangible Book Value* $25.60 $28.57 $34.11 $35.59 8.96% 9.35% 10.80% 9.26% TBV Per Share Tangible Equity/Tangible Assets % 2017 2018 2019 2020 $0.0 $5.0 $10.0 $15.0 $20.0 $25.0 $30.0 $35.0 0% 2% 4% 6% 8% 10% 12% 14% * See appendix A for reconciliation • Strong internal capital generation • History of healthy dividend increases • TBV rising even with multiple acquisitions • No storehousing of excess capital • Completed 1.5 million share repurchase for $95.1MM during 2020 Cash Dividends Declared Per Share $1.28 $1.52 $1.76 $1.84 2017 2018 2019 2020 $0.00 $0.50 $1.00 $1.50 $2.00
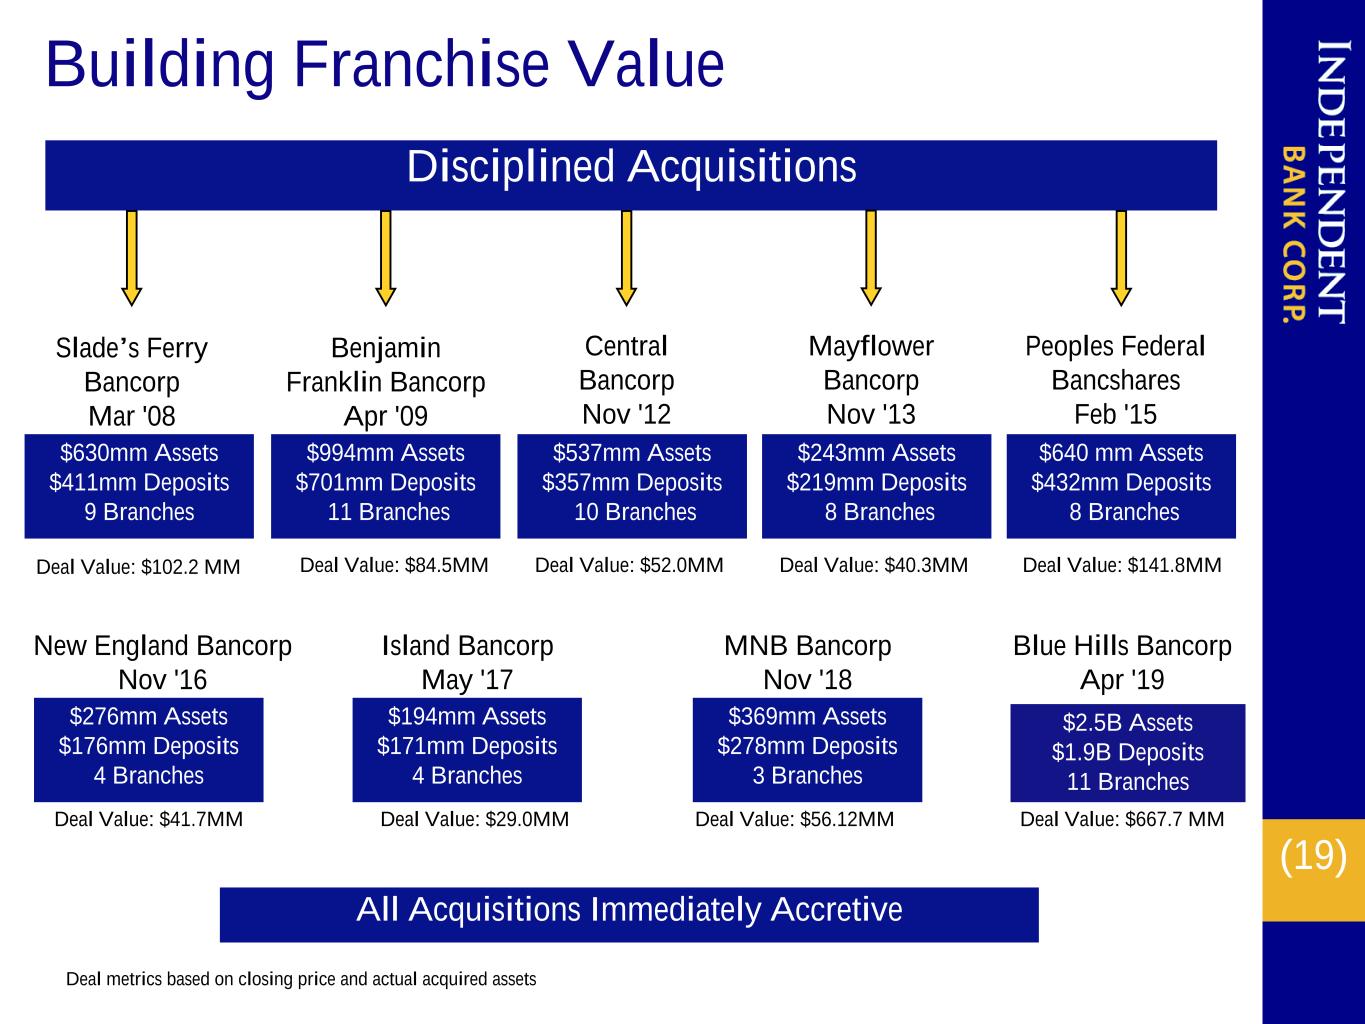
(19) Building Franchise Value Disciplined Acquisitions Deal Value: $84.5MM Benjamin Franklin Bancorp Apr '09 $994mm Assets $701mm Deposits 11 Branches Deal Value: $52.0MM Central Bancorp Nov '12 $537mm Assets $357mm Deposits 10 Branches Deal Value: $40.3MM Mayflower Bancorp Nov '13 $243mm Assets $219mm Deposits 8 Branches Deal Value: $41.7MM All Acquisitions Immediately Accretive Deal metrics based on closing price and actual acquired assets New England Bancorp Nov '16 Deal Value: $102.2 MM Slade’s Ferry Bancorp Mar '08 $630mm Assets $411mm Deposits 9 Branches Peoples Federal Bancshares Feb '15 $640 mm Assets $432mm Deposits 8 Branches Deal Value: $141.8MM Island Bancorp May '17 Deal Value: $29.0MM MNB Bancorp Nov '18 Deal Value: $56.12MM $276mm Assets $176mm Deposits 4 Branches $194mm Assets $171mm Deposits 4 Branches $369mm Assets $278mm Deposits 3 Branches $2.5B Assets $1.9B Deposits 11 Branches Blue Hills Bancorp Apr '19 Deal Value: $667.7 MM

(20) Major Opportunities in Acquired Bank Markets: Capitalizing on Rockland Trust Brand Acquired Bank Customer Bases Investment Management • $4.9 billion AUA • Wealth/Institutional • Strong referral network Commercial Banking • Sophisticated products • Expanded capacity • In-depth market knowledge Retail/Customer • Expanded digital & product offerings • Extensive mortgage origination capacity • Award-winning customer service
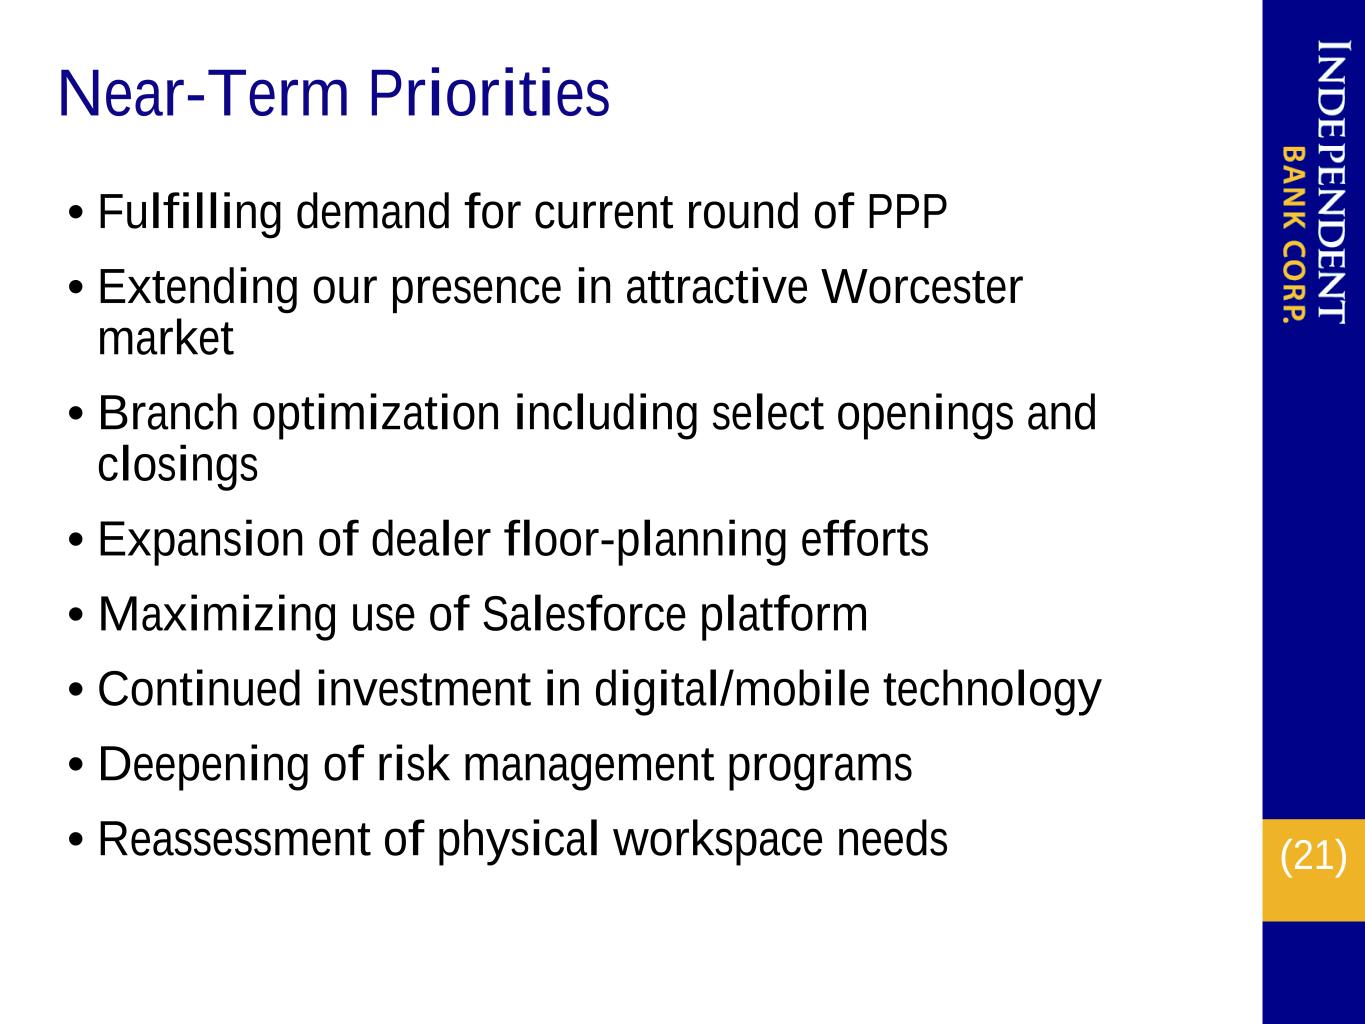
(21) Near-Term Priorities • Fulfilling demand for current round of PPP • Extending our presence in attractive Worcester market • Branch optimization including select openings and closings • Expansion of dealer floor-planning efforts • Maximizing use of Salesforce platform • Continued investment in digital/mobile technology • Deepening of risk management programs • Reassessment of physical workspace needs
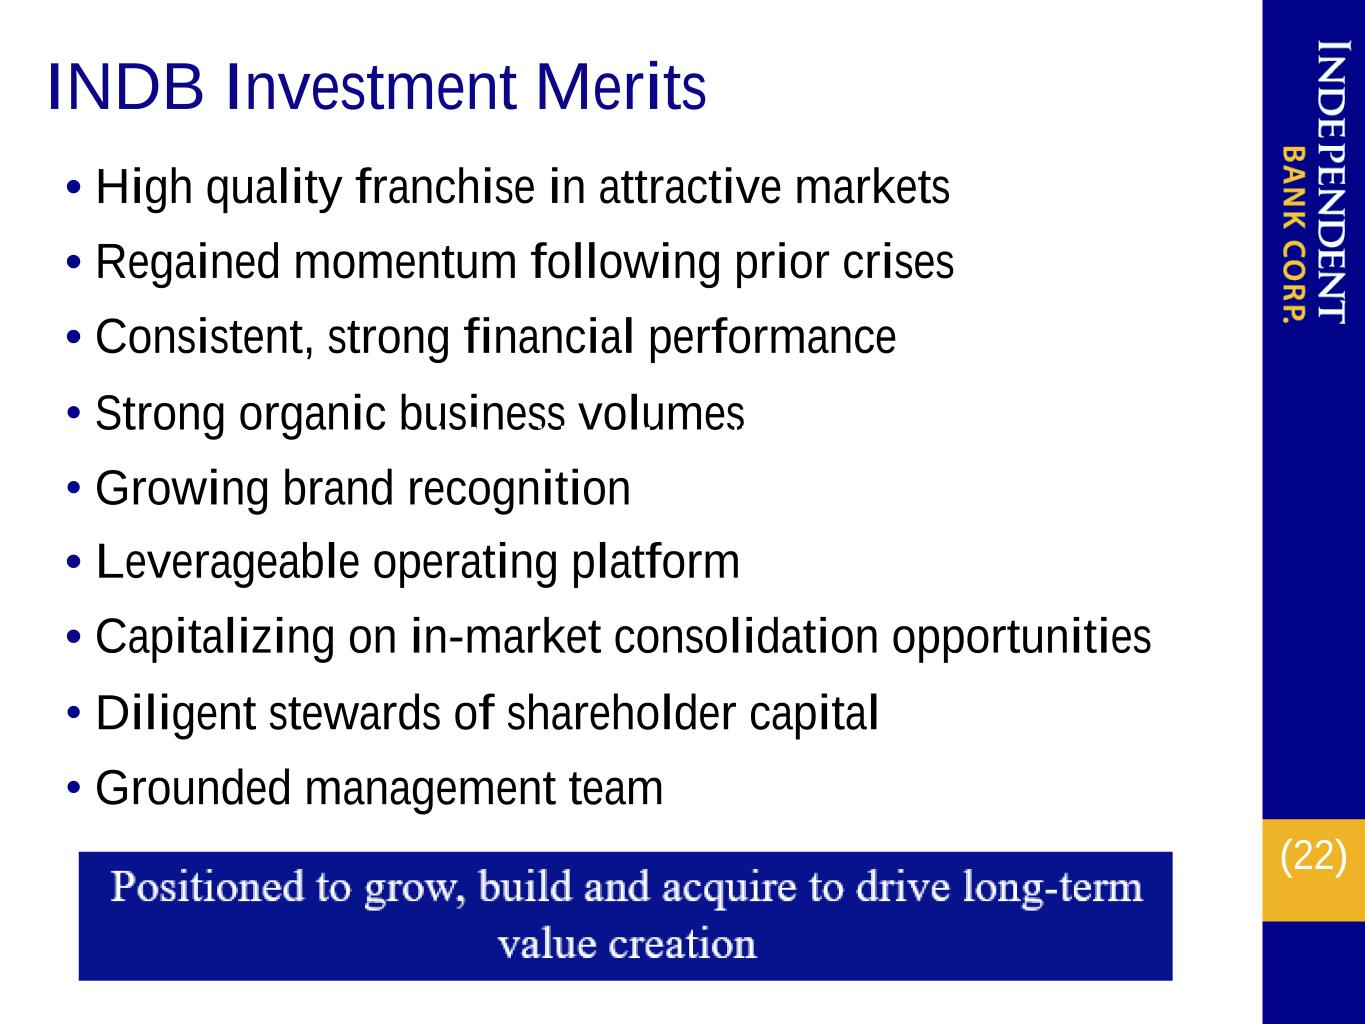
(22) INDB Investment Merits • High quality franchise in attractive markets • Regained momentum following prior crises • Consistent, strong financial performance • Strong organic business volumes • Growing brand recognition • Leverageable operating platform • Capitalizing on in-market consolidation opportunities • Diligent stewards of shareholder capital • Grounded management team All Acquisitions Immediately Accretive All Acquisitions Immediately Accretive
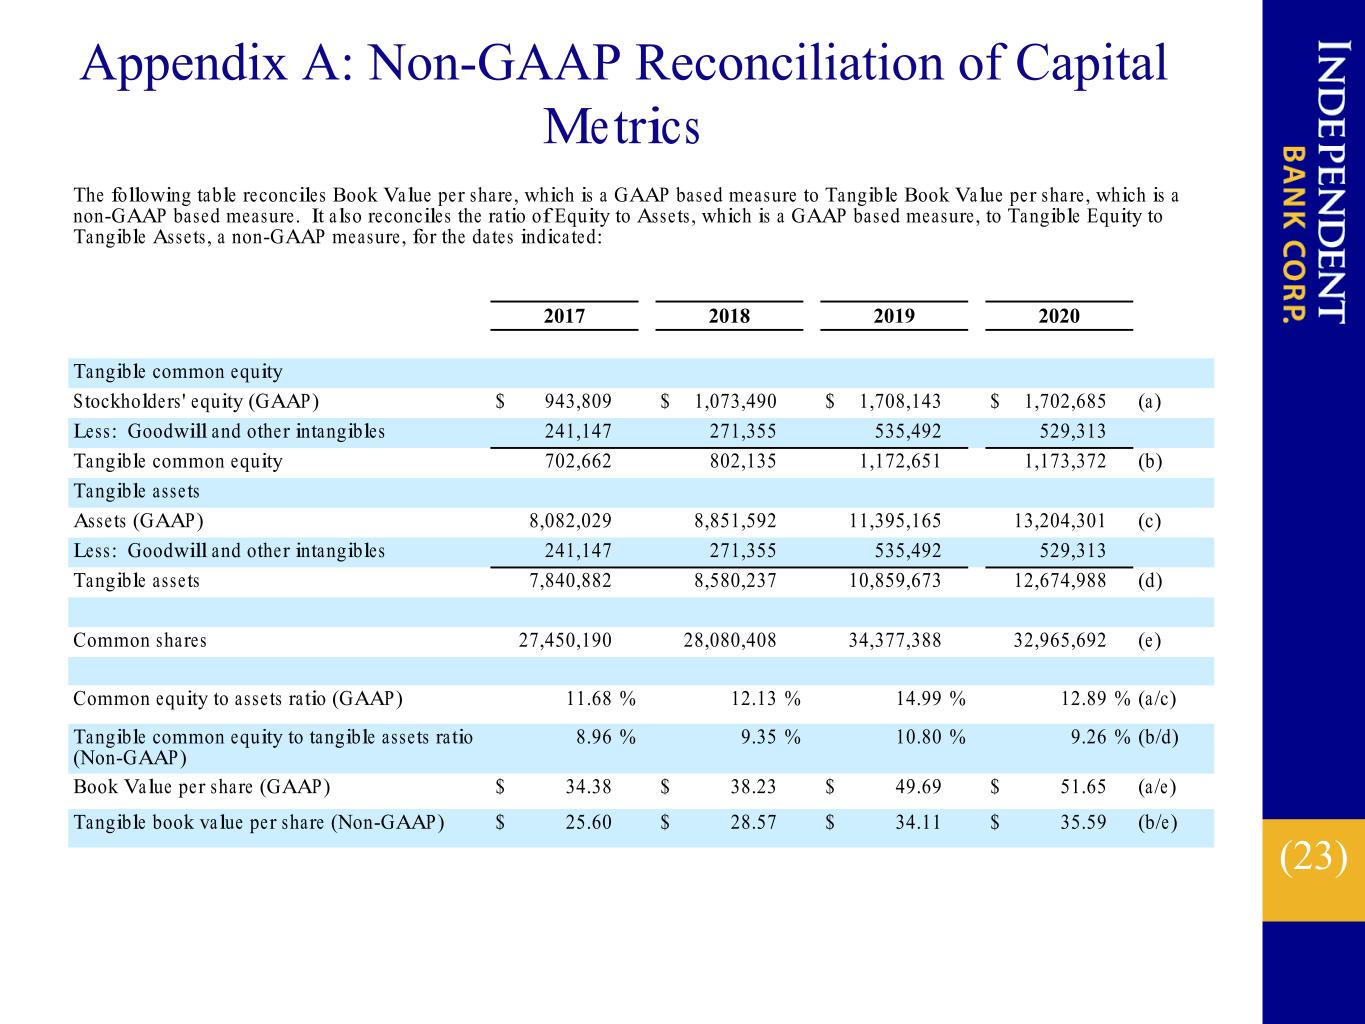
(23) Appendix A: Non-GAAP Reconciliation of Capital Metrics The following table reconciles Book Value per share, which is a GAAP based measure to Tangible Book Value per share, which is a non-GAAP based measure. It also reconciles the ratio of Equity to Assets, which is a GAAP based measure, to Tangible Equity to Tangible Assets, a non-GAAP measure, for the dates indicated: 2017 2018 2019 2020 Tangible common equity Stockholders' equity (GAAP) $ 943,809 $ 1,073,490 $ 1,708,143 $ 1,702,685 (a) Less: Goodwill and other intangibles 241,147 271,355 535,492 529,313 Tangible common equity 702,662 802,135 1,172,651 1,173,372 (b) Tangible assets Assets (GAAP) 8,082,029 8,851,592 11,395,165 13,204,301 (c) Less: Goodwill and other intangibles 241,147 271,355 535,492 529,313 Tangible assets 7,840,882 8,580,237 10,859,673 12,674,988 (d) Common shares 27,450,190 28,080,408 34,377,388 32,965,692 (e) Common equity to assets ratio (GAAP) 11.68 % 12.13 % 14.99 % 12.89 % (a/c) Tangible common equity to tangible assets ratio (Non-GAAP) 8.96 % 9.35 % 10.80 % 9.26 % (b/d) Book Value per share (GAAP) $ 34.38 $ 38.23 $ 49.69 $ 51.65 (a/e) Tangible book value per share (Non-GAAP) $ 25.60 $ 28.57 $ 34.11 $ 35.59 (b/e)
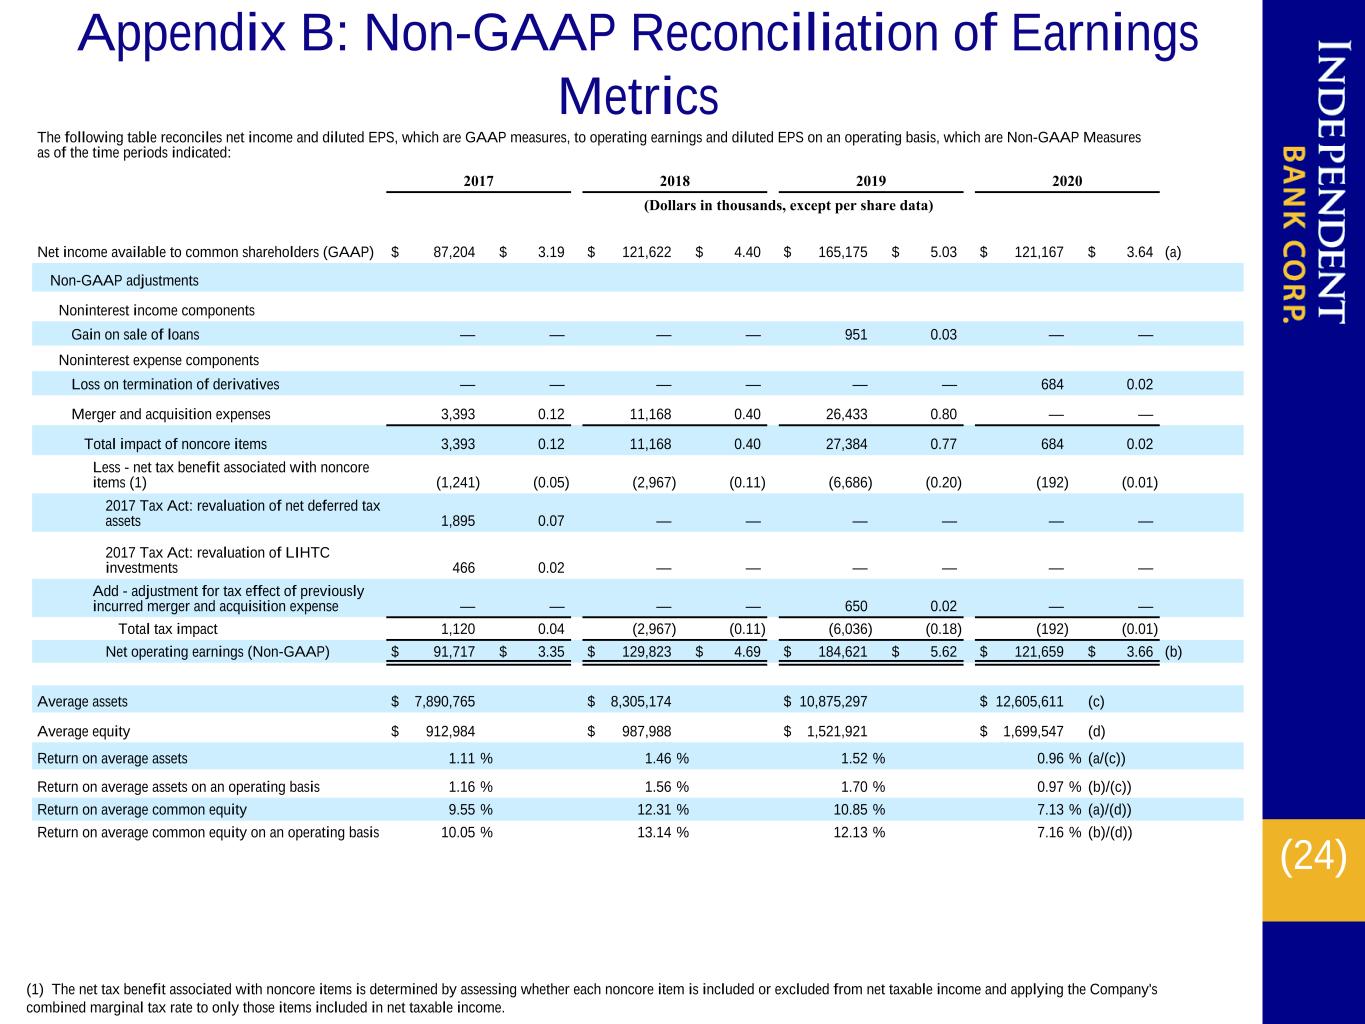
(24) Appendix B: Non-GAAP Reconciliation of Earnings Metrics The following table reconciles net income and diluted EPS, which are GAAP measures, to operating earnings and diluted EPS on an operating basis, which are Non-GAAP Measures as of the time periods indicated: 2017 2018 2019 2020 (Dollars in thousands, except per share data) Net income available to common shareholders (GAAP) $ 87,204 $ 3.19 $ 121,622 $ 4.40 $ 165,175 $ 5.03 $ 121,167 $ 3.64 (a) Non-GAAP adjustments Noninterest income components Gain on sale of loans — — — — 951 0.03 — — Noninterest expense components Loss on termination of derivatives — — — — — — 684 0.02 Merger and acquisition expenses 3,393 0.12 11,168 0.40 26,433 0.80 — — Total impact of noncore items 3,393 0.12 11,168 0.40 27,384 0.77 684 0.02 Less - net tax benefit associated with noncore items (1) (1,241) (0.05) (2,967) (0.11) (6,686) (0.20) (192) (0.01) 2017 Tax Act: revaluation of net deferred tax assets 1,895 0.07 — — — — — — 2017 Tax Act: revaluation of LIHTC investments 466 0.02 — — — — — — Add - adjustment for tax effect of previously incurred merger and acquisition expense — — — — 650 0.02 — — Total tax impact 1,120 0.04 (2,967) (0.11) (6,036) (0.18) (192) (0.01) Net operating earnings (Non-GAAP) $ 91,717 $ 3.35 $ 129,823 $ 4.69 $ 184,621 $ 5.62 $ 121,659 $ 3.66 (b) Average assets $ 7,890,765 $ 8,305,174 $ 10,875,297 $ 12,605,611 (c) Average equity $ 912,984 $ 987,988 $ 1,521,921 $ 1,699,547 (d) Return on average assets 1.11 % 1.46 % 1.52 % 0.96 % (a/(c)) Return on average assets on an operating basis 1.16 % 1.56 % 1.70 % 0.97 % (b)/(c)) Return on average common equity 9.55 % 12.31 % 10.85 % 7.13 % (a)/(d)) Return on average common equity on an operating basis 10.05 % 13.14 % 12.13 % 7.16 % (b)/(d)) (1) The net tax benefit associated with noncore items is determined by assessing whether each noncore item is included or excluded from net taxable income and applying the Company's combined marginal tax rate to only those items included in net taxable income.

(25) NASDAQ Ticker: INDB www.rocklandtrust.com Mark Ruggiero – CFO & Chief Accounting Officer Shareholder Relations: (781) 982-6737 Statements contained in this presentation that are not historical facts are “forward-looking statements” that are subject to risks and uncertainties which could cause actual results to differ materially from those currently anticipated due to a number of factors, which include, but are not limited to, factors discussed in documents filed by the Company with the Securities and Exchange Commission from time to time.
