Attached files
| file | filename |
|---|---|
| EX-99.1 - EX-99.1 - LHC Group, Inc | d146399dex991.htm |
| 8-K - 8-K - LHC Group, Inc | lhcg-8k_20210225.htm |
Supplemental Financial Information Fourth Quarter Ended December 31, 2020 February 25, 2021 Exhibit 99.2
Forward-Looking Statements This presentation contains “forward-looking statements” (as defined in the Securities Litigation Reform Act of 1995) regarding, among other things, future events or the future financial performance of the Company. Words such as “anticipate,” “expect,” “project,” “intend,” “believe,” “will,” “estimate,” “may,” “could,” “should,” “outlook,” and “guidance” and words and terms of similar substance used in connection with any discussion of future plans, actions, events or results identify forward-looking statements. Forward-looking statements are based on information currently available to the Company and involve estimates, expectations and projections. Investors are cautioned that all such forward-looking statements are subject to risks and uncertainties that could cause actual events or results to differ materially from the events or results described in the forward-looking statements, including, but not limited to, the risks and uncertainties related to the COVID-19 pandemic and those otherwise described in our filings with the Securities and Exchange Commission, including our most recent Annual Report on Form 10-K and subsequent Quarterly Reports on Form 10-Q and Current Reports on Form 8-K. Many of these risks, uncertainties and assumptions are beyond the Company’s ability to control or predict. Because of these risks, uncertainties and assumptions, investors should not place undue reliance on these forward-looking statements. Non-GAAP Financial Information This presentation includes certain financial measures that were not prepared in accordance with U.S. generally accepted accounting principles (“GAAP”), including EBITDA and Adjusted EBITDA. The company uses these non-GAAP financial measures in operating its business because management believes they are less susceptible to variances in actual operating performance that can result from the excluded items. The company presents these financial measures to investors because they believe they are useful to investors in evaluating the primary factors that drive the company's operating performance. The items excluded from these non-GAAP measures are important in understanding LHC Group’s financial performance, and any non-GAAP measures presented should not be considered in isolation of, or as an alternative to, GAAP financial measures. Since these non-GAAP financial measures are not measures determined in accordance with GAAP, have no standardized meaning prescribed by GAAP and are susceptible to varying calculations, these measures, as presented, may not be comparable to other similarly titled measures of other companies. EBITDA of LHC Group is defined as net income (loss) before income tax benefit (expense), interest expense, and depreciation and amortization expense. Adjusted EBITDA of LHC Group is defined as net income (loss) before income tax expense benefit (expense), depreciation and amortization expense, and transaction costs related to previous transactions. 2 Please visit the Investors section on our website at Investor.LHCgroup.com for additional information on LHC Group and the industry. Nasdaq: LHCG
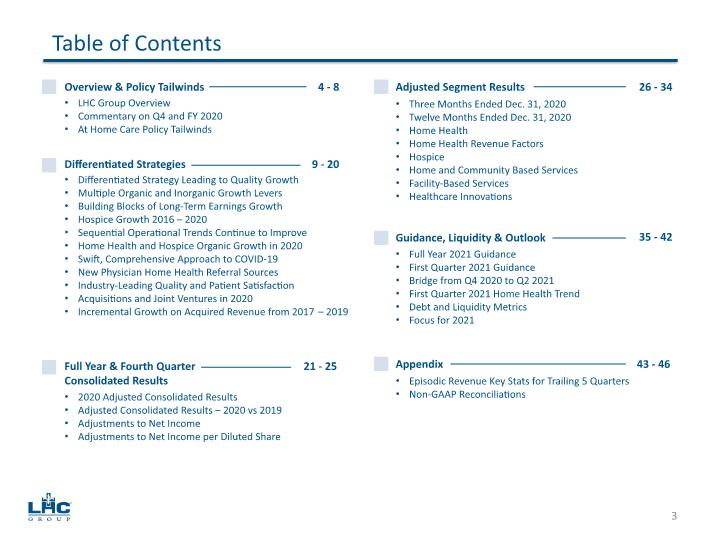
Table of Contents 3 Overview & Policy Tailwinds 4 - 8 Differentiated Strategies 9 - 20 Full Year & Fourth Quarter Consolidated Results Adjusted Segment Results Guidance, Liquidity & Outlook Appendix LHC Group Overview Commentary on Q4 and FY 2020 At Home Care Policy Tailwinds Differentiated Strategy Leading to Quality Growth Multiple Organic and Inorganic Growth Levers Building Blocks of Long-Term Earnings Growth Hospice Growth 2016 – 2020 Sequential Operational Trends Continue to Improve Home Health and Hospice Organic Growth in 2020 Swift, Comprehensive Approach to COVID-19 New Physician Home Health Referral Sources Industry-Leading Quality and Patient Satisfaction Acquisitions and Joint Ventures in 2020 Incremental Growth on Acquired Revenue from 2017 – 2019 21 - 25 2020 Adjusted Consolidated Results Adjusted Consolidated Results – 2020 vs 2019 Adjustments to Net Income Adjustments to Net Income per Diluted Share 26 - 34 Three Months Ended Dec. 31, 2020 Twelve Months Ended Dec. 31, 2020 Home Health Home Health Revenue Factors Hospice Home and Community Based Services Facility-Based Services Healthcare Innovations 35 - 42 Full Year 2021 Guidance First Quarter 2021 Guidance Bridge from Q4 2020 to Q2 2021 First Quarter 2021 Home Health Trend Debt and Liquidity Metrics Focus for 2021 43 - 46 Episodic Revenue Key Stats for Trailing 5 Quarters Non-GAAP Reconciliations
4 Overview & Policy Tailwinds
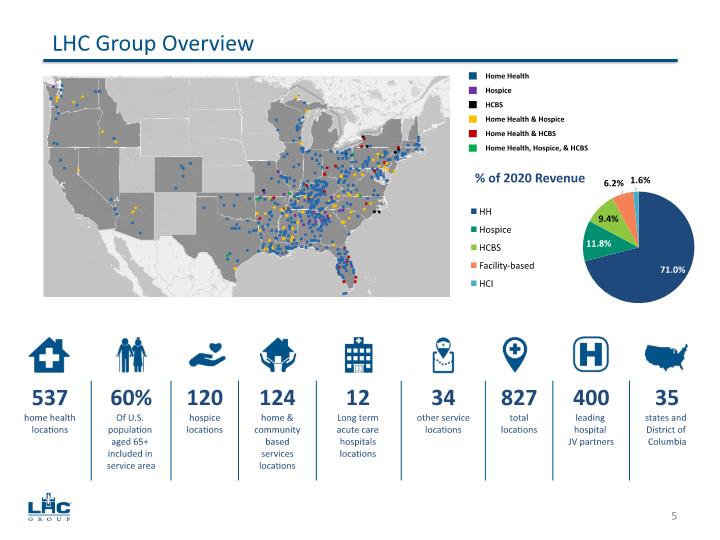
Home Health Hospice HCBS Home Health & Hospice Home Health & HCBS Home Health, Hospice, & HCBS LHC Group Overview 5 537 home health locations 60% Of U.S. population aged 65+ included in service area 120 hospice locations 124 home & community based services locations 12 Long term acute care hospitals locations 34 other service locations 827 total locations 400 leading hospital JV partners 35 states and District of Columbia
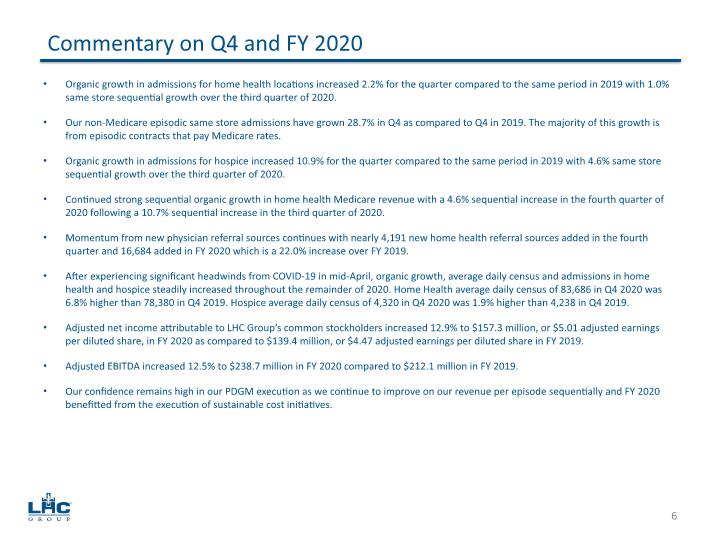
Organic growth in admissions for home health locations increased 2.2% for the quarter compared to the same period in 2019 with 1.0% same store sequential growth over the third quarter of 2020. Our non-Medicare episodic same store admissions have grown 28.7% in Q4 as compared to Q4 in 2019. The majority of this growth is from episodic contracts that pay Medicare rates. Organic growth in admissions for hospice increased 10.9% for the quarter compared to the same period in 2019 with 4.6% same store sequential growth over the third quarter of 2020. Continued strong sequential organic growth in home health Medicare revenue with a 4.6% sequential increase in the fourth quarter of 2020 following a 10.7% sequential increase in the third quarter of 2020. Momentum from new physician referral sources continues with nearly 4,191 new home health referral sources added in the fourth quarter and 16,684 added in FY 2020 which is a 22.0% increase over FY 2019. After experiencing significant headwinds from COVID-19 in mid-April, organic growth, average daily census and admissions in home health and hospice steadily increased throughout the remainder of 2020. Home Health average daily census of 83,686 in Q4 2020 was 6.8% higher than 78,380 in Q4 2019. Hospice average daily census of 4,320 in Q4 2020 was 1.9% higher than 4,238 in Q4 2019. Adjusted net income attributable to LHC Group’s common stockholders increased 12.9% to $157.3 million, or $5.01 adjusted earnings per diluted share, in FY 2020 as compared to $139.4 million, or $4.47 adjusted earnings per diluted share in FY 2019. Adjusted EBITDA increased 12.5% to $238.7 million in FY 2020 compared to $212.1 million in FY 2019. Our confidence remains high in our PDGM execution as we continue to improve on our revenue per episode sequentially and FY 2020 benefitted from the execution of sustainable cost initiatives. Commentary on Q4 and FY 2020 6
Each year Congress publishes reports with an enacted federal budget explaining appropriations including those for the Departments of Labor and HHS. This report language is how Congress directs appropriations, commands reports and investigations, speaks to agencies that spend money, and protects constituencies such as rural patient access to home healthcare. This year's report is notable for appropriations designed to keep people in the home under Medicare and Medicaid as opposed to institutional care, protecting traditional Medicare as opposed to managed-care, promoting tele-health, reviewing nursing homes, as well as developing innovations and alternatives to institutional care. These budget reports are separate from but support statutory budget, COVID and other bills….Some of the report language is urgent in the wake of COVID and challenges faced by patients in nursing homes. Because the Senate did not enact a budget the only reports published with the budget this year are those done by the House. House rules require such a report. “Report of the Committee on Appropriation of the House of Representatives on HR 7614” ("Report") https://www.congress.gov/116/crpt/hrpt450/CRPT-116hrpt450.pdf At Home Care Policy Tailwinds 7
Relevant sections of the Appropriation Committee Report are summarized below referencing report pages and quotes of interest. Rural Patient Access to Home Health Care - "Home Health Payment Systems - The Committee urges CMS to avoid home health payment systems that would risk patient access to home health providers in rural areas. The committee requests a report within 90 days of enactment of this Act regarding the impact of implementation of home health payment systems on the delivery of home health care services.” (p. 166) Traditional Medicare v. Medicare Advantage - CMS is directed "to avoid taking any action that actively promotes one form of Medicare coverage over another, particularly with respect to the choice between traditional Medicare and Medicare Advantage." CMS is further directed to maintain its online options in a way that "provides complete and unbiased information" directing CMS to "remain objective and neutral in its education and outreach materials" in relation to traditional Medicare and MA. (p. 169) "Nursing Home Quality"- Congress appropriated $1.5 million for the National Academy of Science, Engineering and Medicine to conduct a comprehensive study of how the nation delivers, regulates and measures the quality of nursing home care including their oversight, enforcement and penalties, the need for intervention in such services, family concerns and an examination of "alternative structures, policies and care models to promote care innovation and assure quality.” (p. 171) "Program of All-Inclusive Care for the Elderly (PACE)” - Congress acknowledges the important role of the program of all-inclusive care "by allowing these highly medically complex Medicare or Medicaid beneficiaries to live at home, instead of in a nursing facility" and directs CMS to "move forward expeditiously" on pilots under this program and to test "innovative, comprehensive, integrated models of care with new Medicare and Medicaid beneficiaries”. (p 172). Telehealth - Congress "strongly encourages CMS through its rulemaking" to "maximize access to healthcare through telehealth with equitable payment and reimbursement policies". (p. 173) Home and Community-Based Supportive Services - Congress appropriates $10 million above the 2020 enacted level to "fund a wide range of services that enables seniors to remain independent in their homes for as long as possible.” (p. 197) At Home Care Policy Tailwinds 8
9 Differentiated Strategies
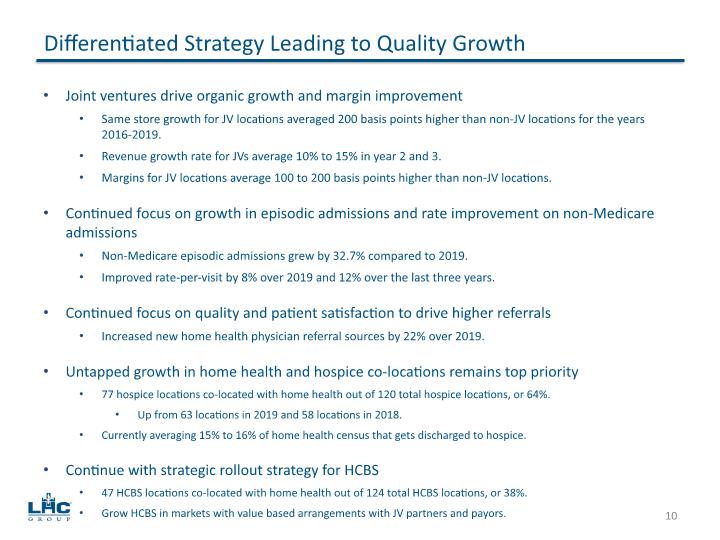
Joint ventures drive organic growth and margin improvement Same store growth for JV locations averaged 200 basis points higher than non-JV locations for the years 2016-2019. Revenue growth rate for JVs average 10% to 15% in year 2 and 3. Margins for JV locations average 100 to 200 basis points higher than non-JV locations. Continued focus on growth in episodic admissions and rate improvement on non-Medicare admissions Non-Medicare episodic admissions grew by 32.7% compared to 2019. Improved rate-per-visit by 8% over 2019 and 12% over the last three years. Continued focus on quality and patient satisfaction to drive higher referrals Increased new home health physician referral sources by 22% over 2019. Untapped growth in home health and hospice co-locations remains top priority 77 hospice locations co-located with home health out of 120 total hospice locations, or 64%. Up from 63 locations in 2019 and 58 locations in 2018. Currently averaging 15% to 16% of home health census that gets discharged to hospice. Continue with strategic rollout strategy for HCBS 47 HCBS locations co-located with home health out of 124 total HCBS locations, or 38%. Grow HCBS in markets with value based arrangements with JV partners and payors. Differentiated Strategy Leading to Quality Growth 10
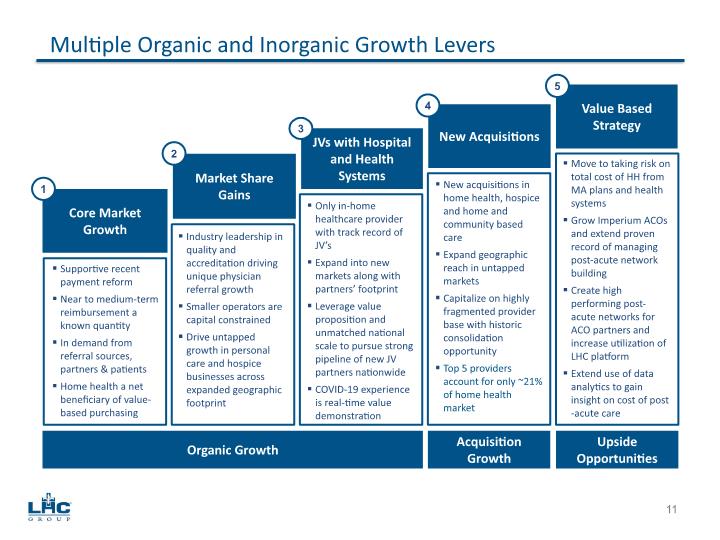
Multiple Organic and Inorganic Growth Levers Organic Growth Acquisition Growth Upside Opportunities Move to taking risk on total cost of HH from MA plans and health systems Grow Imperium ACOs and extend proven record of managing post-acute network building Create high performing post-acute networks for ACO partners and increase utilization of LHC platform Extend use of data analytics to gain insight on cost of post-acute care Core Market Growth Market Share Gains JVs with Hospital and Health Systems New Acquisitions Value Based Strategy New acquisitions in home health, hospice and home and community based care Expand geographic reach in untapped markets Capitalize on highly fragmented provider base with historic consolidation opportunity Top 5 providers account for only ~21% of home health market Only in-home healthcare provider with track record of JV’s Expand into new markets along with partners’ footprint Leverage value proposition and unmatched national scale to pursue strong pipeline of new JV partners nationwide COVID-19 experience is real-time value demonstration Industry leadership in quality and accreditation driving unique physician referral growth Smaller operators are capital constrained Drive untapped growth in personal care and hospice businesses across expanded geographic footprint Supportive recent payment reform Near to medium-term reimbursement a known quantity In demand from referral sources, partners & patients Home health a net beneficiary of value-based purchasing 1 2 3 4 5 11
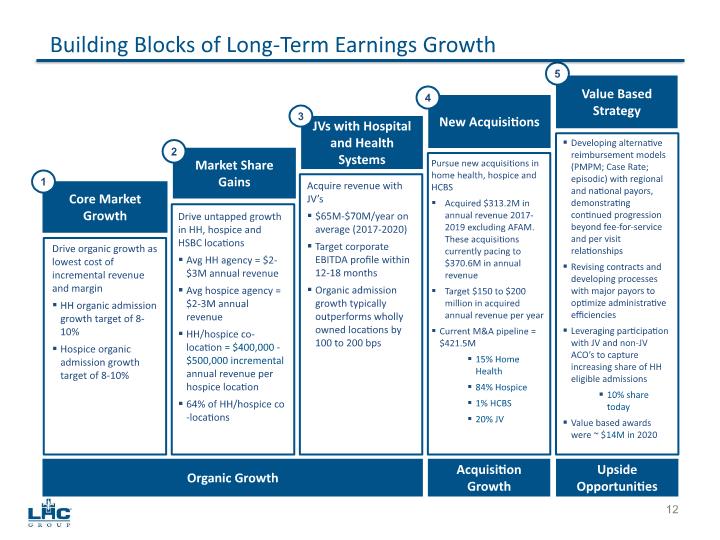
Building Blocks of Long-Term Earnings Growth Developing alternative reimbursement models (PMPM; Case Rate; episodic) with regional and national payors, demonstrating continued progression beyond fee-for-service and per visit relationships Revising contracts and developing processes with major payors to optimize administrative efficiencies Leveraging participation with JV and non-JV ACO’s to capture increasing share of HH eligible admissions 10% share today Value based awards were ~ $14M in 2020 Core Market Growth Market Share Gains JVs with Hospital and Health Systems New Acquisitions Value Based Strategy Pursue new acquisitions in home health, hospice and HCBS Acquired $313.2M in annual revenue 2017-2019 excluding AFAM. These acquisitions currently pacing to $370.6M in annual revenue Target $150 to $200 million in acquired annual revenue per year Current M&A pipeline = $421.5M 15% Home Health 84% Hospice 1% HCBS 20% JV Acquire revenue with JV’s $65M-$70M/year on average (2017-2020) Target corporate EBITDA profile within 12-18 months Organic admission growth typically outperforms wholly owned locations by 100 to 200 bps Drive untapped growth in HH, hospice and HSBC locations Avg HH agency = $2-$3M annual revenue Avg hospice agency = $2-3M annual revenue HH/hospice co-location = $400,000 - $500,000 incremental annual revenue per hospice location 64% of HH/hospice co-locations Drive organic growth as lowest cost of incremental revenue and margin HH organic admission growth target of 8-10% Hospice organic admission growth target of 8-10% 1 2 3 4 5 12 Organic Growth Acquisition Growth Upside Opportunities
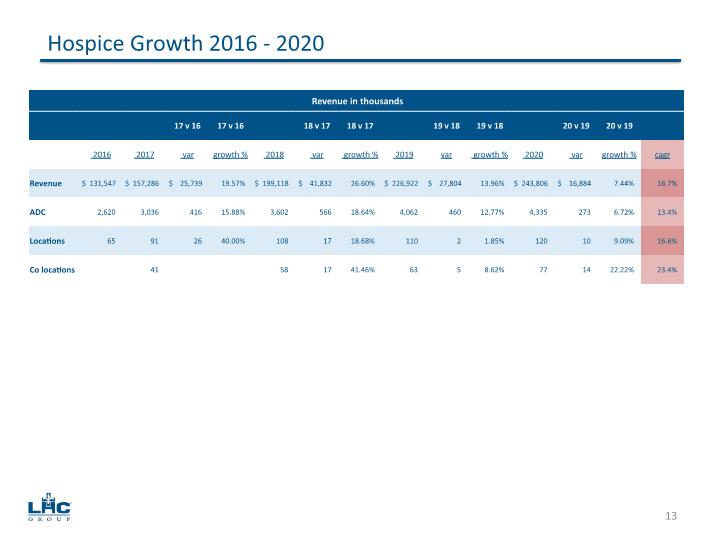
Hospice Growth 2016 - 2020 13
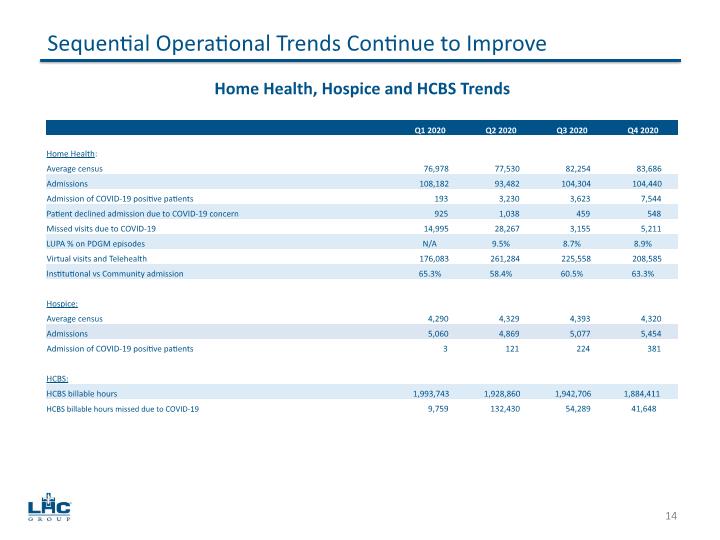
Sequential Operational Trends Continue to Improve 14 Home Health, Hospice and HCBS Trends
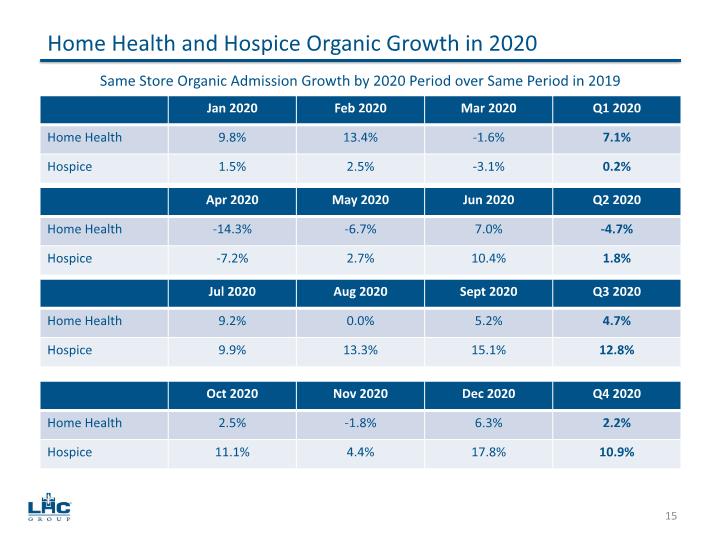
15 Home Health and Hospice Organic Growth in 2020 Same Store Organic Admission Growth by 2020 Period over Same Period in 2019
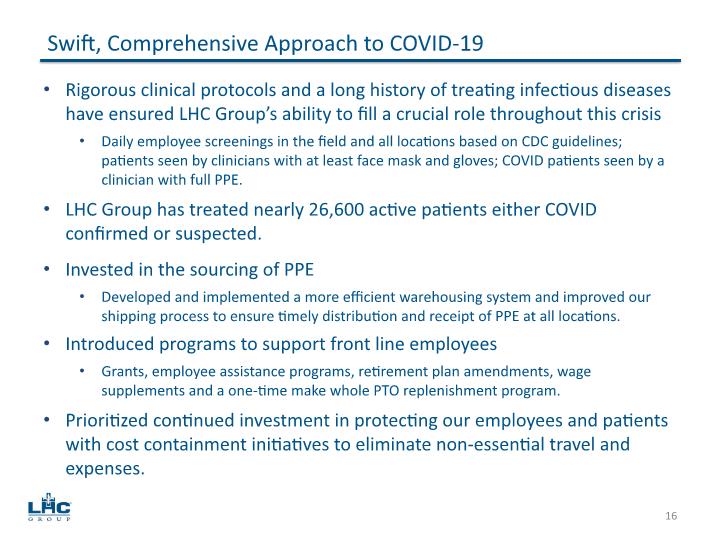
Rigorous clinical protocols and a long history of treating infectious diseases have ensured LHC Group’s ability to fill a crucial role throughout this crisis Daily employee screenings in the field and all locations based on CDC guidelines; patients seen by clinicians with at least face mask and gloves; COVID patients seen by a clinician with full PPE. LHC Group has treated nearly 26,600 active patients either COVID confirmed or suspected. Invested in the sourcing of PPE Developed and implemented a more efficient warehousing system and improved our shipping process to ensure timely distribution and receipt of PPE at all locations. Introduced programs to support front line employees Grants, employee assistance programs, retirement plan amendments, wage supplements and a one-time make whole PTO replenishment program. Prioritized continued investment in protecting our employees and patients with cost containment initiatives to eliminate non-essential travel and expenses. Swift, Comprehensive Approach to COVID-19 16
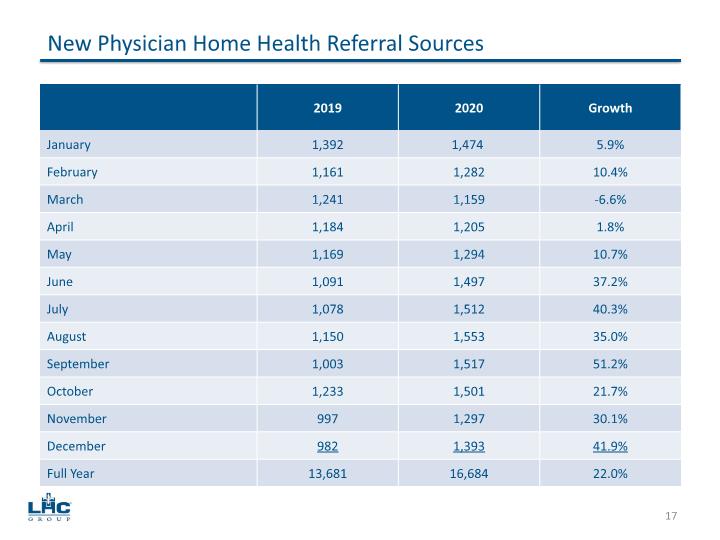
17 New Physician Home Health Referral Sources
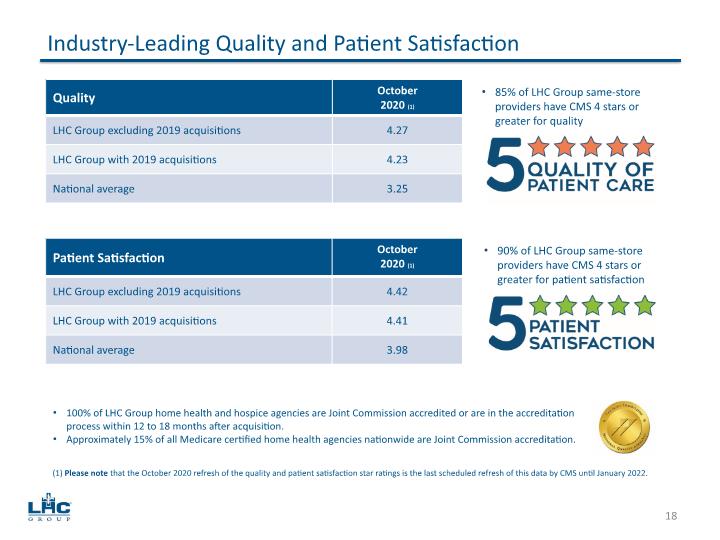
Industry-Leading Quality and Patient Satisfaction 85% of LHC Group same-store providers have CMS 4 stars or greater for quality 18 100% of LHC Group home health and hospice agencies are Joint Commission accredited or are in the accreditation process within 12 to 18 months after acquisition. Approximately 15% of all Medicare certified home health agencies nationwide are Joint Commission accreditation. 90% of LHC Group same-store providers have CMS 4 stars or greater for patient satisfaction (1) Please note that the October 2020 refresh of the quality and patient satisfaction star ratings is the last scheduled refresh of this data by CMS until January 2022.
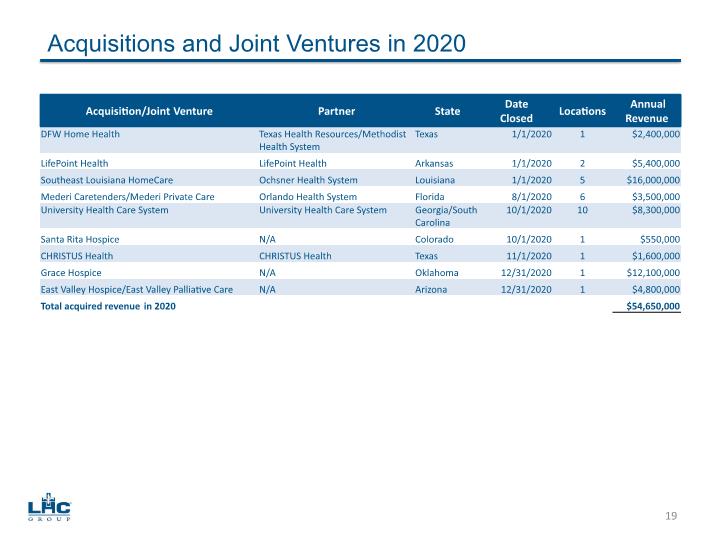
Acquisitions and Joint Ventures in 2020 19
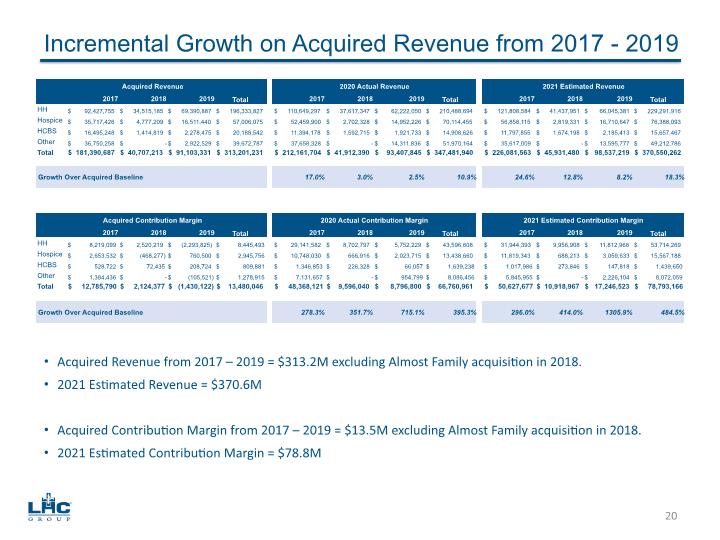
Incremental Growth on Acquired Revenue from 2017 - 2019 20 Acquired Revenue from 2017 – 2019 = $313.2M excluding Almost Family acquisition in 2018. 2021 Estimated Revenue = $370.6M Acquired Contribution Margin from 2017 – 2019 = $13.5M excluding Almost Family acquisition in 2018. 2021 Estimated Contribution Margin = $78.8M
21 Full Year & Fourth Quarter Consolidated Results
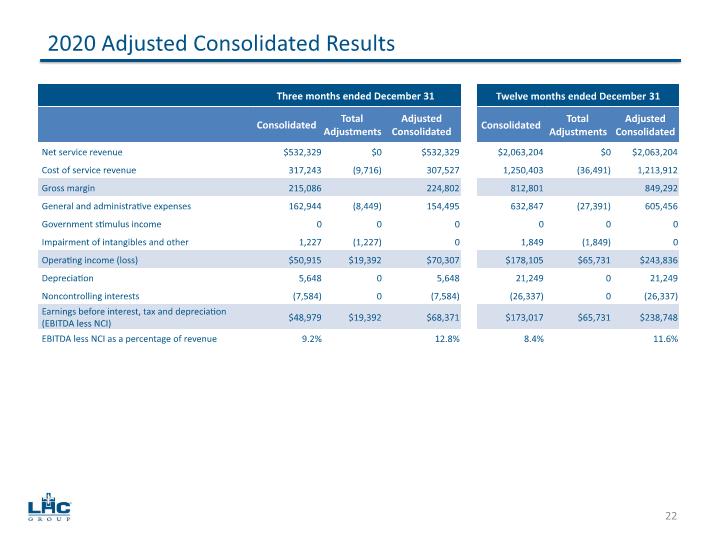
2020 Adjusted Consolidated Results 22
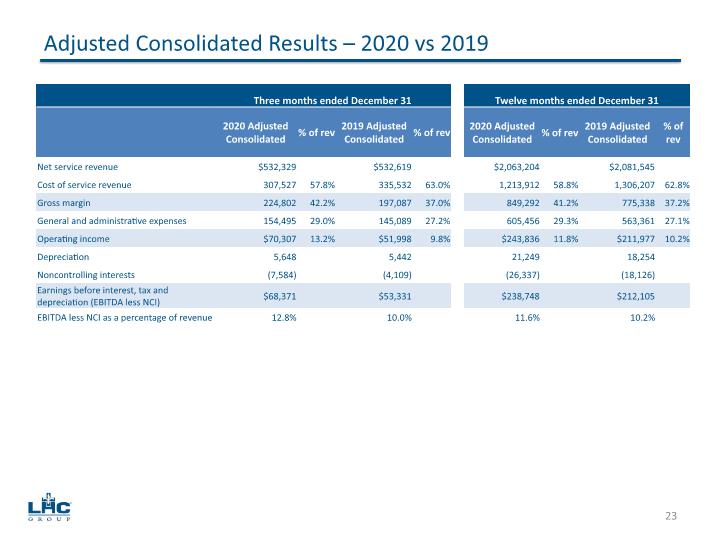
Adjusted Consolidated Results – 2020 vs 2019 23
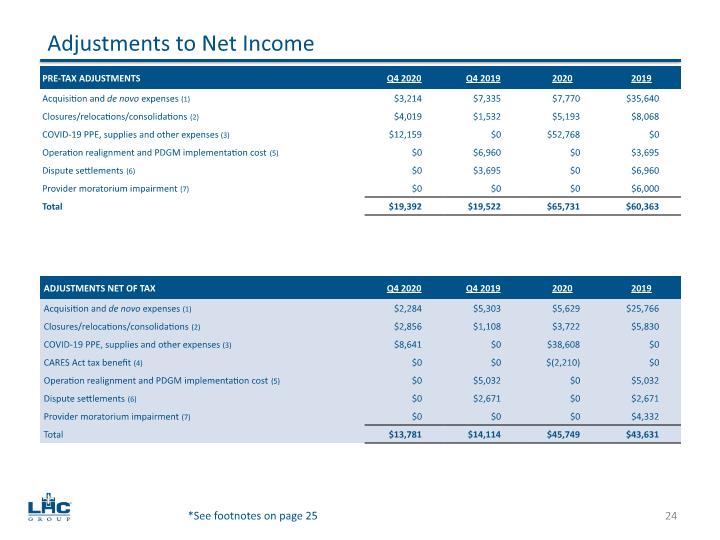
Adjustments to Net Income 24 *See footnotes on page 25
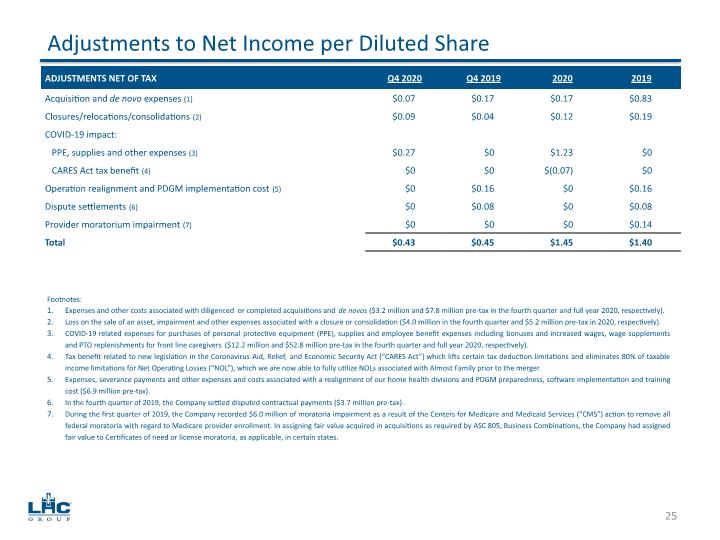
Adjustments to Net Income per Diluted Share 25
26 Segment Results
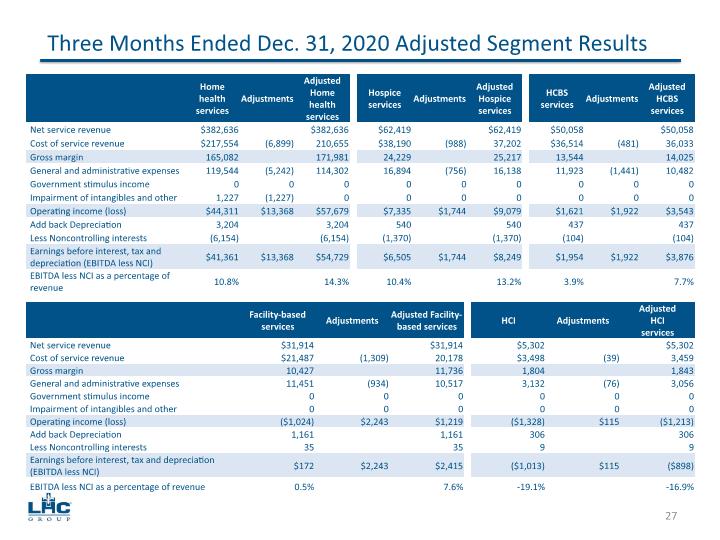
27 Three Months Ended Dec. 31, 2020 Adjusted Segment Results
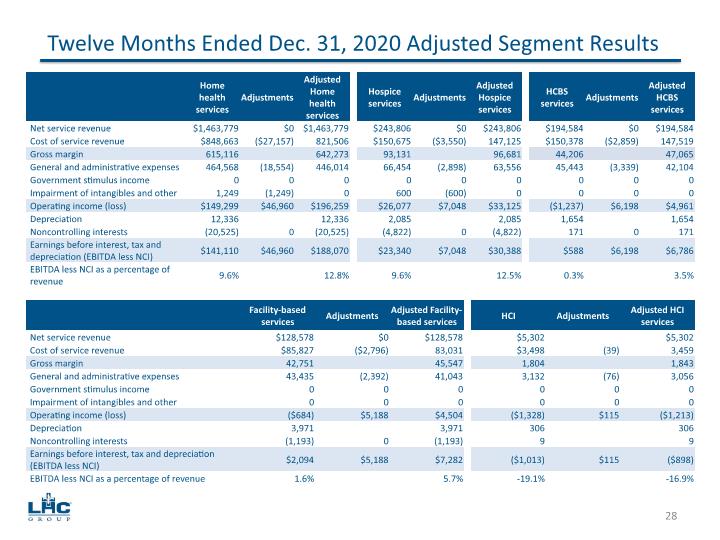
28 Twelve Months Ended Dec. 31, 2020 Adjusted Segment Results
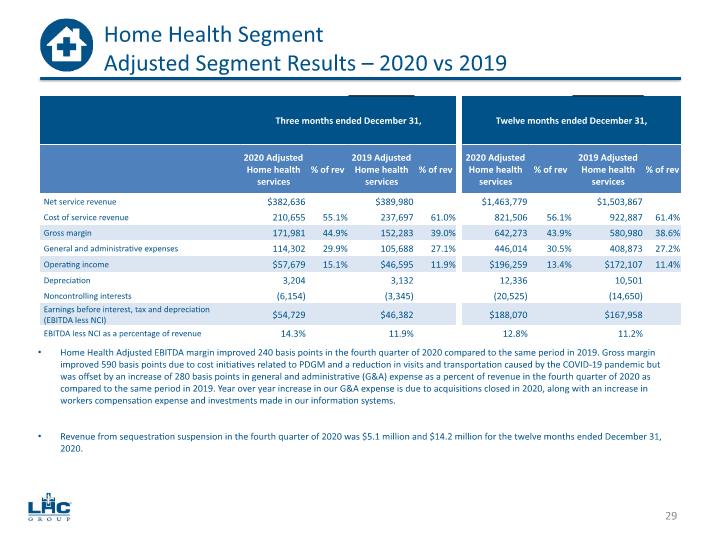
29 Home Health Segment Adjusted Segment Results – 2020 vs 2019 Home Health Adjusted EBITDA margin improved 240 basis points in the fourth quarter of 2020 compared to the same period in 2019. Gross margin improved 590 basis points due to cost initiatives related to PDGM and a reduction in visits and transportation caused by the COVID-19 pandemic but was offset by an increase of 280 basis points in general and administrative (G&A) expense as a percent of revenue in the fourth quarter of 2020 as compared to the same period in 2019. Year over year increase in our G&A expense is due to acquisitions closed in 2020, along with an increase in workers compensation expense and investments made in our information systems. Revenue from sequestration suspension in the fourth quarter of 2020 was $5.1 million and $14.2 million for the twelve months ended December 31, 2020.
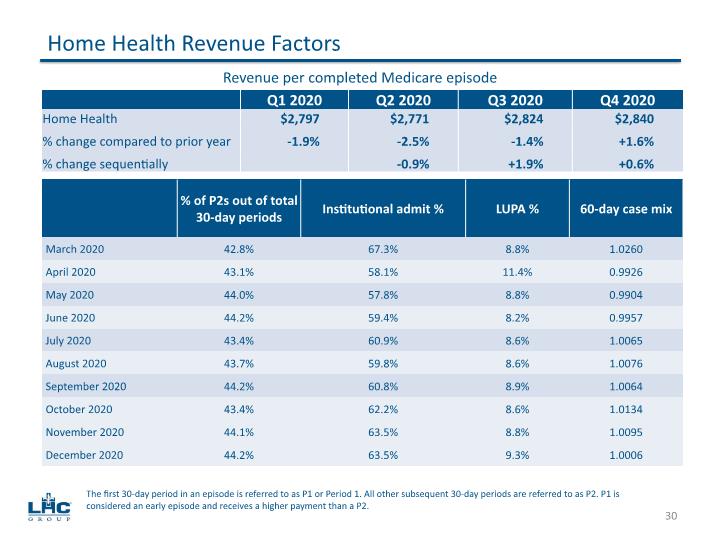
30 Home Health Revenue Factors The first 30-day period in an episode is referred to as P1 or Period 1. All other subsequent 30-day periods are referred to as P2. P1 is considered an early episode and receives a higher payment than a P2. Revenue per completed Medicare episode
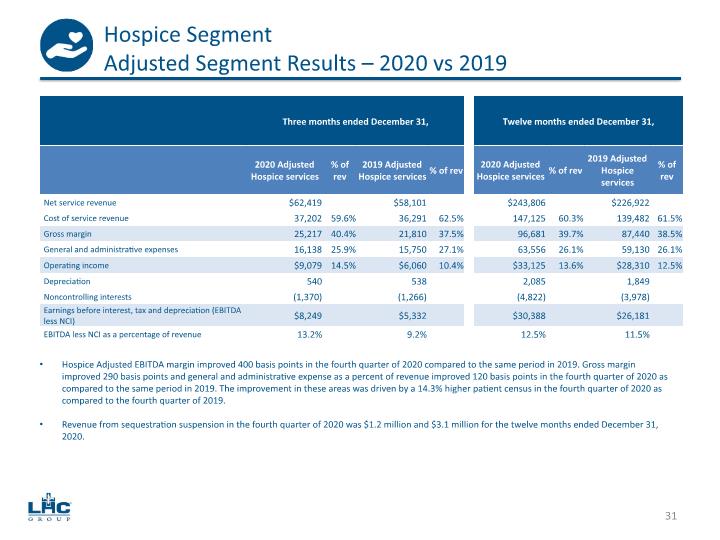
31 Hospice Segment Adjusted Segment Results – 2020 vs 2019 Hospice Adjusted EBITDA margin improved 400 basis points in the fourth quarter of 2020 compared to the same period in 2019. Gross margin improved 290 basis points and general and administrative expense as a percent of revenue improved 120 basis points in the fourth quarter of 2020 as compared to the same period in 2019. The improvement in these areas was driven by a 14.3% higher patient census in the fourth quarter of 2020 as compared to the fourth quarter of 2019. Revenue from sequestration suspension in the fourth quarter of 2020 was $1.2 million and $3.1 million for the twelve months ended December 31, 2020.
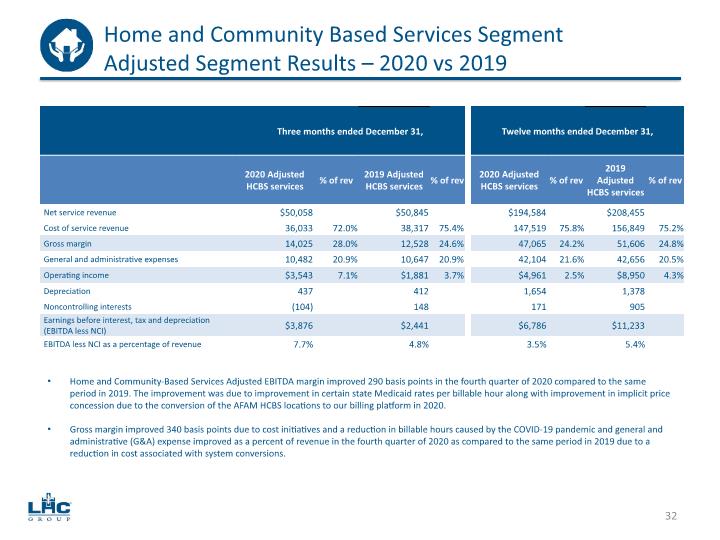
32 Home and Community Based Services Segment Adjusted Segment Results – 2020 vs 2019 Home and Community-Based Services Adjusted EBITDA margin improved 290 basis points in the fourth quarter of 2020 compared to the same period in 2019. The improvement was due to improvement in certain state Medicaid rates per billable hour along with improvement in implicit price concession due to the conversion of the AFAM HCBS locations to our billing platform in 2020. Gross margin improved 340 basis points due to cost initiatives and a reduction in billable hours caused by the COVID-19 pandemic and general and administrative (G&A) expense improved as a percent of revenue in the fourth quarter of 2020 as compared to the same period in 2019 due to a reduction in cost associated with system conversions.
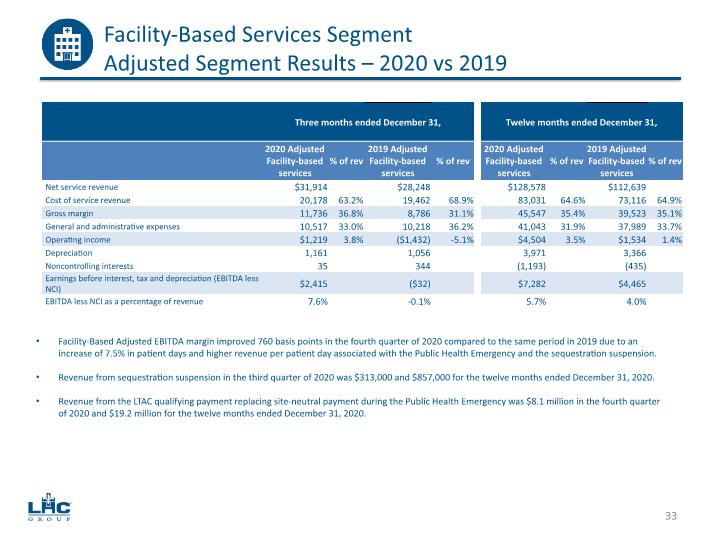
Facility-Based Services Segment Adjusted Segment Results – 2020 vs 2019 33 Facility-Based Adjusted EBITDA margin improved 760 basis points in the fourth quarter of 2020 compared to the same period in 2019 due to an increase of 7.5% in patient days and higher revenue per patient day associated with the Public Health Emergency and the sequestration suspension. Revenue from sequestration suspension in the third quarter of 2020 was $313,000 and $857,000 for the twelve months ended December 31, 2020. Revenue from the LTAC qualifying payment replacing site-neutral payment during the Public Health Emergency was $8.1 million in the fourth quarter of 2020 and $19.2 million for the twelve months ended December 31, 2020.
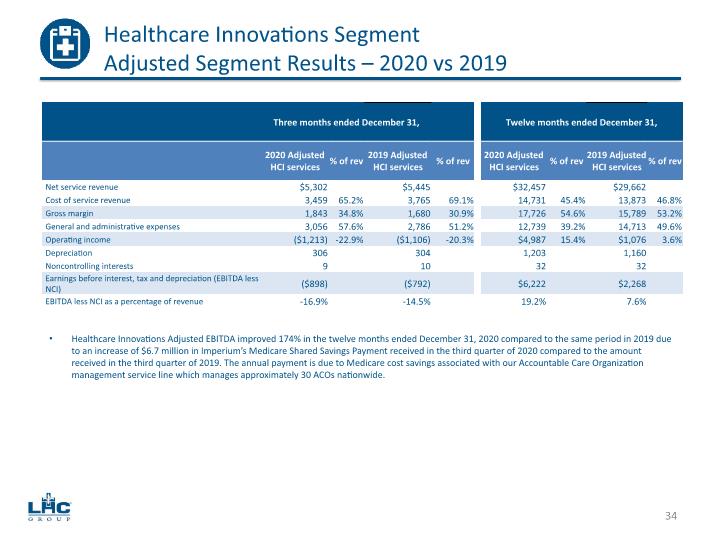
Healthcare Innovations Segment Adjusted Segment Results – 2020 vs 2019 34 Healthcare Innovations Adjusted EBITDA improved 174% in the twelve months ended December 31, 2020 compared to the same period in 2019 due to an increase of $6.7 million in Imperium’s Medicare Shared Savings Payment received in the third quarter of 2020 compared to the amount received in the third quarter of 2019. The annual payment is due to Medicare cost savings associated with our Accountable Care Organization management service line which manages approximately 30 ACOs nationwide.

35 Guidance, Liquidity & Outlook
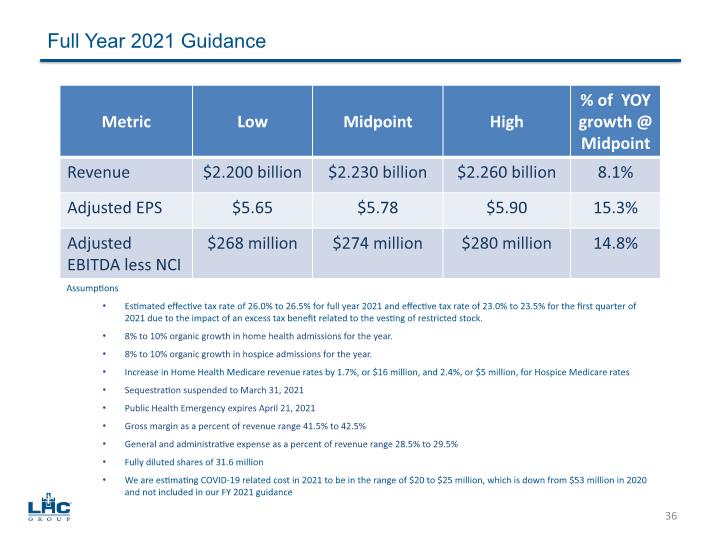
Assumptions Estimated effective tax rate of 26.0% to 26.5% for full year 2021 and effective tax rate of 23.0% to 23.5% for the first quarter of 2021 due to the impact of an excess tax benefit related to the vesting of restricted stock. 8% to 10% organic growth in home health admissions for the year. 8% to 10% organic growth in hospice admissions for the year. Increase in Home Health Medicare revenue rates by 1.7%, or $16 million, and 2.4%, or $5 million, for Hospice Medicare rates Sequestration suspended to March 31, 2021 Public Health Emergency expires April 21, 2021 Gross margin as a percent of revenue range 41.5% to 42.5% General and administrative expense as a percent of revenue range 28.5% to 29.5% Fully diluted shares of 31.6 million We are estimating COVID-19 related cost in 2021 to be in the range of $20 to $25 million, which is down from $53 million in 2020 and not included in our FY 2021 guidance Full Year 2021 Guidance 36
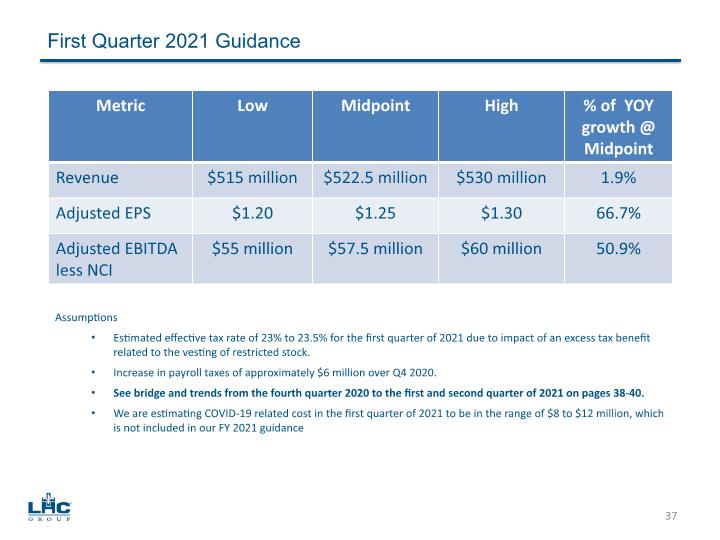
Assumptions Estimated effective tax rate of 23% to 23.5% for the first quarter of 2021 due to impact of an excess tax benefit related to the vesting of restricted stock. Increase in payroll taxes of approximately $6 million over Q4 2020. See bridge and trends from the fourth quarter 2020 to the first and second quarter of 2021 on pages 38-40. We are estimating COVID-19 related cost in the first quarter of 2021 to be in the range of $8 to $12 million, which is not included in our FY 2021 guidance First Quarter 2021 Guidance 37
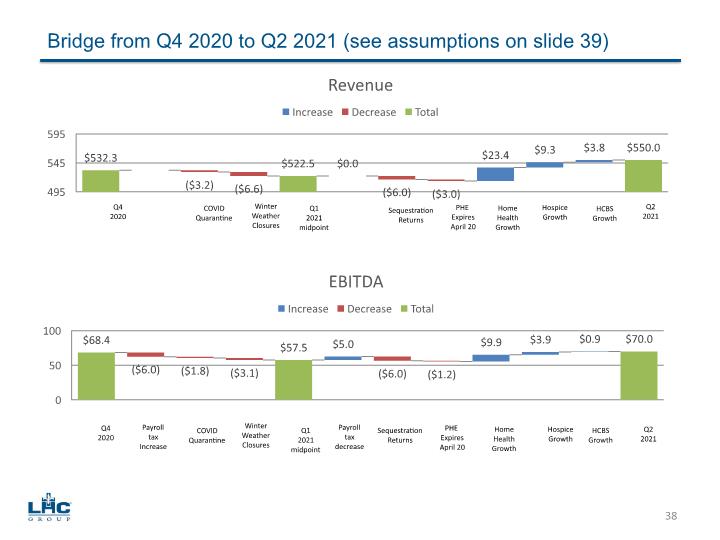
Bridge from Q4 2020 to Q2 2021 (see assumptions on slide 39) 38 Q4 2020 COVID Quarantine Winter Weather Closures Q1 2021 midpoint Sequestration Returns PHE Expires April 20 Home Health Growth Hospice Growth HCBS Growth Q2 2021 Q4 2020 Payroll tax Increase COVID Quarantine Winter Weather Closures Q1 2021 midpoint Sequestration Returns PHE Expires April 20 Home Health Growth Hospice Growth HCBS Growth Q2 2021 Payroll tax decrease
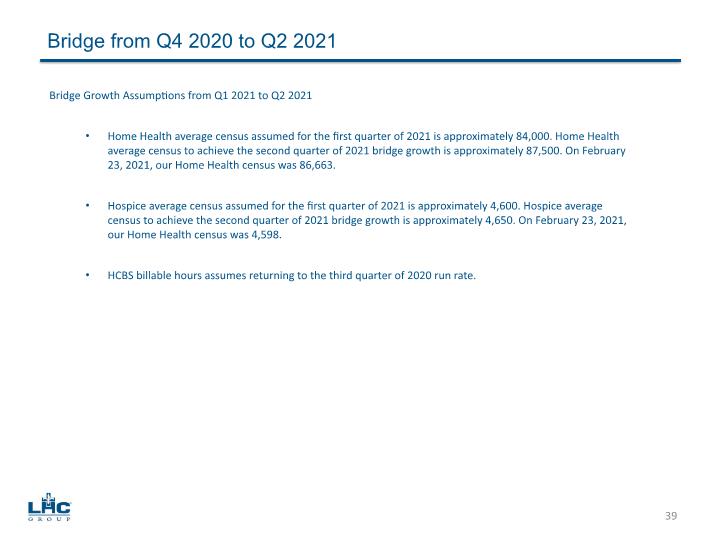
Bridge from Q4 2020 to Q2 2021 39 Bridge Growth Assumptions from Q1 2021 to Q2 2021 Home Health average census assumed for the first quarter of 2021 is approximately 84,000. Home Health average census to achieve the second quarter of 2021 bridge growth is approximately 87,500. On February 23, 2021, our Home Health census was 86,663. Hospice average census assumed for the first quarter of 2021 is approximately 4,600. Hospice average census to achieve the second quarter of 2021 bridge growth is approximately 4,650. On February 23, 2021, our Home Health census was 4,598. HCBS billable hours assumes returning to the third quarter of 2020 run rate.
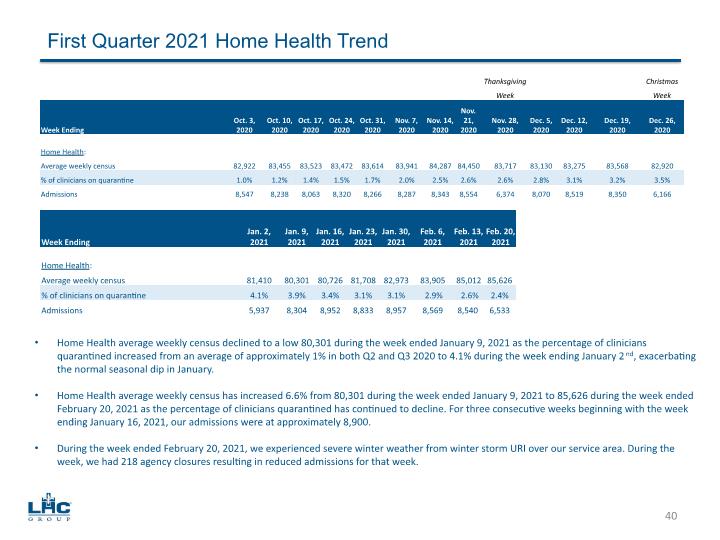
First Quarter 2021 Home Health Trend 40 Home Health average weekly census declined to a low 80,301 during the week ended January 9, 2021 as the percentage of clinicians quarantined increased from an average of approximately 1% in both Q2 and Q3 2020 to 4.1% during the week ending January 2nd, exacerbating the normal seasonal dip in January. Home Health average weekly census has increased 6.6% from 80,301 during the week ended January 9, 2021 to 85,626 during the week ended February 20, 2021 as the percentage of clinicians quarantined has continued to decline. For three consecutive weeks beginning with the week ending January 16, 2021, our admissions were at approximately 8,900. During the week ended February 20, 2021, we experienced severe winter weather from winter storm URI over our service area. During the week, we had 218 agency closures resulting in reduced admissions for that week.
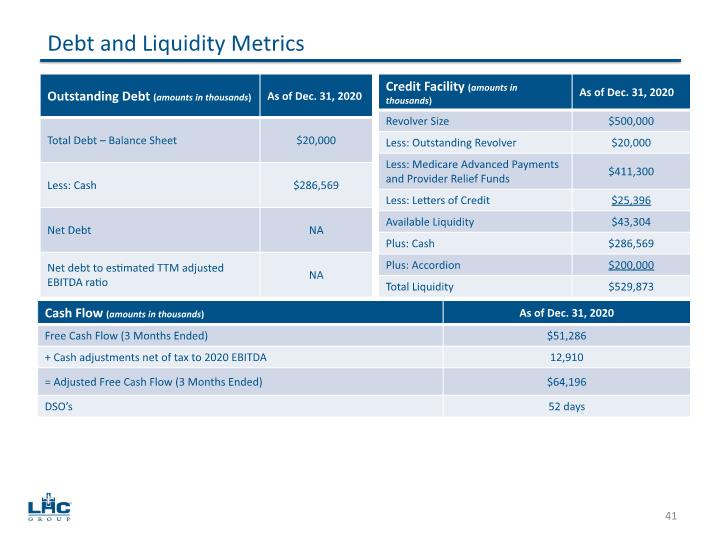
Debt and Liquidity Metrics 41
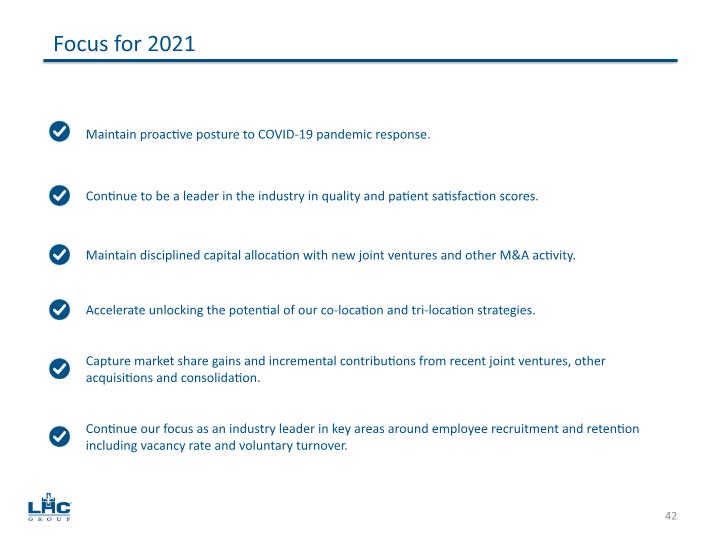
Focus for 2021 42 Maintain disciplined capital allocation with new joint ventures and other M&A activity. Accelerate unlocking the potential of our co-location and tri-location strategies. Maintain proactive posture to COVID-19 pandemic response. Continue to be a leader in the industry in quality and patient satisfaction scores. Capture market share gains and incremental contributions from recent joint ventures, other acquisitions and consolidation. Continue our focus as an industry leader in key areas around employee recruitment and retention including vacancy rate and voluntary turnover.
43 Appendix
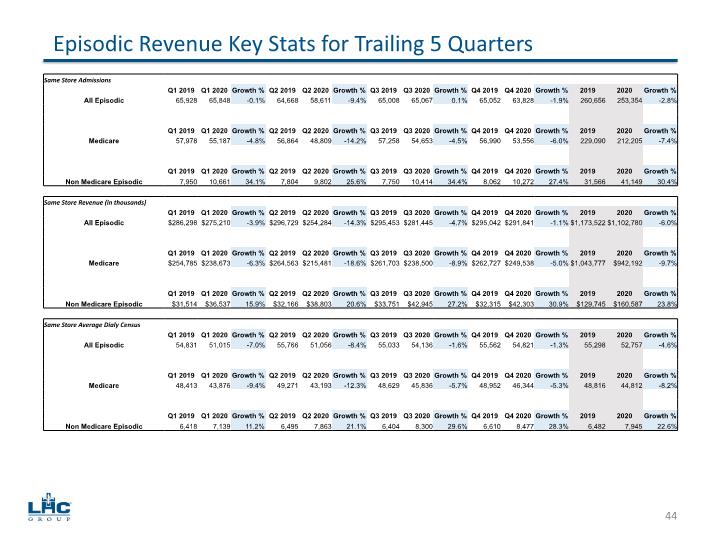
Episodic Revenue Key Stats for Trailing 5 Quarters 44
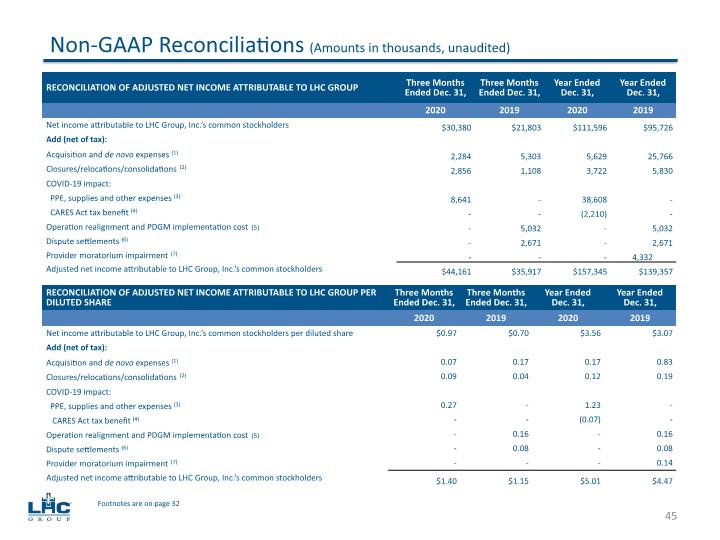
Non-GAAP Reconciliations (Amounts in thousands, unaudited) 45 Footnotes are on page 32
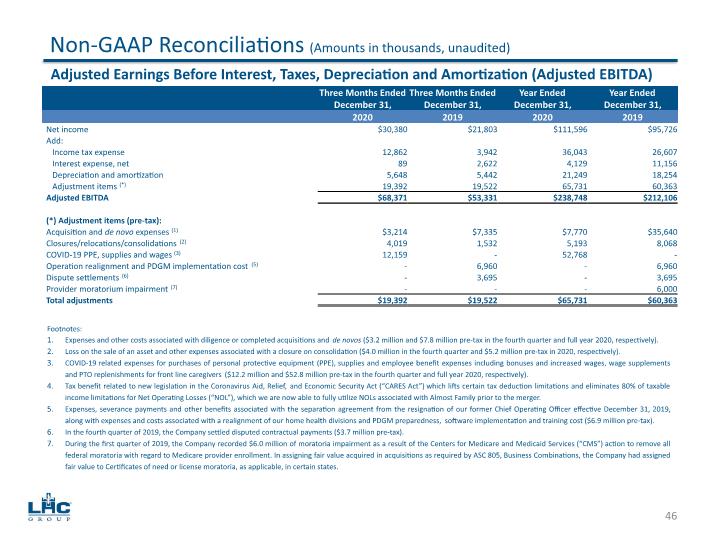
Non-GAAP Reconciliations (Amounts in thousands, unaudited) 46 Adjusted Earnings Before Interest, Taxes, Depreciation and Amortization (Adjusted EBITDA)
