Attached files
| file | filename |
|---|---|
| EX-23.1 - EX-23.1 - GATX CORP | gatx-202011068xkex231.htm |
| 8-K - 8-K - GATX CORP | gatx-20201106.htm |
Exhibit 99.1
Item 6. Selected Financial Data
The following financial information has been derived from our audited consolidated financial statements for the years ended December 31 (in millions, except per share data, recourse leverage, and return on equity). This information should be read in conjunction with "Management’s Discussion and Analysis of Financial Condition and Results of Operations" and the consolidated financial statements and accompanying notes thereto included elsewhere herein.
1
| 2019 | 2018 | 2017 | 2016 | 2015 | |||||||||||||||||||||||||
Results of Operations | |||||||||||||||||||||||||||||
Revenue | $ | 1,202.1 | $ | 1,175.1 | $ | 1,204.4 | $ | 1,418.3 | $ | 1,449.9 | |||||||||||||||||||
Net gain on asset dispositions | 51.6 | 72.7 | 56.0 | 98.0 | 79.2 | ||||||||||||||||||||||||
Share of affiliates’ pre-tax income | 94.5 | 61.1 | 55.9 | 53.1 | 45.4 | ||||||||||||||||||||||||
Net income from continuing operations (GAAP) | 180.8 | 190.5 | 467.8 | n/a | n/a | ||||||||||||||||||||||||
Net income from discontinued operations, net of tax (GAAP) | 30.4 | 20.8 | 34.2 | n/a | n/a | ||||||||||||||||||||||||
| Net income from consolidated operations, net of tax (GAAP) | 211.2 | 211.3 | 502.0 | 257.1 | 205.3 | ||||||||||||||||||||||||
Net income from continuing operations, excluding tax adjustments and other items (non-GAAP) (1) | 178.0 | 178.8 | 173.5 | n/a | n/a | ||||||||||||||||||||||||
Net income from discontinued operations, excluding tax adjustments and other items (non-GAAP) (1) | 22.3 | 21.0 | 11.5 | n/a | n/a | ||||||||||||||||||||||||
Net income from consolidated operations, excluding tax adjustments and other items (non-GAAP) (1) | 200.3 | 199.8 | 185.0 | 235.9 | 234.9 | ||||||||||||||||||||||||
Per Share Data | |||||||||||||||||||||||||||||
Basic earnings from continuing operations (GAAP) | 5.07 | 5.07 | 12.07 | n/a | n/a | ||||||||||||||||||||||||
Basic earnings from discontinued operations (GAAP) | 0.85 | 0.55 | 0.88 | n/a | n/a | ||||||||||||||||||||||||
Total | 5.92 | 5.62 | 12.95 | 6.35 | 4.76 | ||||||||||||||||||||||||
Diluted earnings from continuing operations (GAAP) | 4.97 | 4.98 | 11.88 | n/a | n/a | ||||||||||||||||||||||||
Diluted earnings from discontinued operations (GAAP) | 0.84 | 0.54 | 0.87 | n/a | n/a | ||||||||||||||||||||||||
Total | 5.81 | 5.52 | 12.75 | 6.29 | 4.69 | ||||||||||||||||||||||||
Diluted earnings from continuing operations, excluding tax adjustments and other items (non-GAAP) (1) | 4.89 | 4.67 | 4.41 | n/a | n/a | ||||||||||||||||||||||||
Diluted earnings from discontinued operations, excluding tax adjustments and other items (non-GAAP) (1) | 0.62 | 0.55 | 0.29 | n/a | n/a | ||||||||||||||||||||||||
Total | 5.51 | 5.22 | 4.70 | 5.77 | 5.37 | ||||||||||||||||||||||||
Dividends declared | 1.84 | 1.76 | 1.68 | 1.60 | 1.52 | ||||||||||||||||||||||||
Financial Condition | |||||||||||||||||||||||||||||
Operating assets and facilities, net of accumulated depreciation | $ | 6,457.3 | $ | 6,275.6 | $ | 5,940.3 | $ | 5,804.7 | $ | 5,698.4 | |||||||||||||||||||
Investments in affiliated companies | 512.6 | 464.5 | 441.0 | 387.0 | 348.5 | ||||||||||||||||||||||||
Assets from discontinued operations | 291.1 | 297.8 | 286.7 | n/a | n/a | ||||||||||||||||||||||||
Total assets | 8,285.1 | 7,616.7 | 7,422.4 | 7,105.4 | 6,894.2 | ||||||||||||||||||||||||
Off-balance sheet assets (1)(2) | — | 430.2 | 435.7 | 459.1 | 495.5 | ||||||||||||||||||||||||
Short-term borrowings | 15.8 | 110.8 | 4.3 | 3.8 | 7.4 | ||||||||||||||||||||||||
Long-term debt | 4,780.4 | 4,429.7 | 4,371.7 | 4,253.2 | 4,178.4 | ||||||||||||||||||||||||
Operating lease obligations | 429.4 | — | — | — | — | ||||||||||||||||||||||||
Finance lease obligations | 7.9 | 11.3 | 12.5 | 14.9 | 18.4 | ||||||||||||||||||||||||
Off-balance sheet recourse debt (1)(2) | — | 430.2 | 435.7 | 459.1 | 495.5 | ||||||||||||||||||||||||
Shareholders’ equity (3) | 1,835.1 | 1,788.1 | 1,792.7 | 1,347.2 | 1,280.2 | ||||||||||||||||||||||||
Other Data | |||||||||||||||||||||||||||||
Average number of common shares and common share equivalents | 36.4 | 38.3 | 39.4 | 40.9 | 43.8 | ||||||||||||||||||||||||
Net cash provided by operating activities from continuing operations | $ | 425.8 | $ | 485.2 | $ | 454.3 | $ | 629.4 | $ | 541.8 | |||||||||||||||||||
Portfolio proceeds from continuing operations | $ | 250.3 | $ | 234.4 | $ | 165.6 | $ | 223.7 | $ | 482.2 | |||||||||||||||||||
Portfolio investments and capital additions from continuing operations | $ | 722.8 | $ | 927.6 | $ | 589.4 | $ | 620.7 | $ | 714.7 | |||||||||||||||||||
Recourse leverage (4) | 2.8 | 2.7 | 2.5 | 3.3 | 3.5 | ||||||||||||||||||||||||
Return on equity (GAAP) | 11.7 | % | 11.8 | % | 32.0 | % | 19.6 | % | 15.8 | % | |||||||||||||||||||
Return on equity, excluding tax adjustments and other items (non-GAAP) (1)(5) | 13.5 | % | 13.6 | % | 13.1 | % | 18.0 | % | 18.1 | % | |||||||||||||||||||
_________
Note: The information above for 2016 and 2015 has not been recast for discontinued operations presentation.
2
(1) See "Non-GAAP Financial Measures" included in "Item 7. Management’s Discussion and Analysis of Financial Condition and Results of Operations" of this Exhibit for an explanation of tax adjustments and other items, as well as a reconciliation to the most directly comparable GAAP measures.
(2) Off-balance sheet assets and off-balance sheet recourse debt, which relate to operating leases, are applicable for 2015 through 2018. In accordance with the new lease accounting standard, off-balance sheet assets and recourse debt are no longer applicable beginning in 2019.
(3) Balances for 2019, 2018 and 2017 reflect increases in shareholders' equity resulting from the impact of the Tax Cuts and Jobs Act of 2017 ("Tax Act").
(4) The reduction in recourse leverage beginning with 2017 is due to the increase in shareholders' equity resulting from the impact of the Tax Act.
(5) Shareholder's equity used in this calculation for 2019, 2018 and 2017 excludes the impact of the Tax Act.
3
Item 7. Management’s Discussion and Analysis of Financial Condition and Results of Operations
OVERVIEW
We lease, operate, manage, and remarket long-lived, widely-used assets, primarily in the rail market. We report our financial results through three primary business segments: Rail North America, Rail International, and Portfolio Management. Historically, we also reported financial results for American Steamship Company ("ASC") as a fourth segment.
On February 7, 2020, we announced our intention to sell our ASC business segment to Rand Logistics, Inc. On May 14, 2020, we completed the sale of our ASC business, subject to customary post-closing adjustments. The divestiture was intended to provide us with greater ability to focus on our core franchise in global railcar and aircraft spare engine leasing. As a result, ASC is now reported as discontinued operations, and financial data for the ASC segment has been segregated and presented as discontinued operations for all periods presented. See "Note 26. Discontinued Operations" in Item 8 of this Exhibit for additional information. Unless otherwise indicated, the following information relates to continuing operations. A more complete description of our business is included in "Item 1. Business," in Part I of the 2019 Form 10-K.
The following discussion and analysis should be read in conjunction with the audited financial statements included in "Item 8. Financial Statements and Supplementary Data" in this Exhibit. We based the discussion and analysis that follows on financial data we derived from the financial statements prepared in accordance with U.S. generally accepted accounting principles ("GAAP") and on certain other financial data that we prepared using non-GAAP components. For a reconciliation of these non-GAAP measures to the most comparable GAAP measures, see “Non-GAAP Financial Measures” at the end of this item.
DISCUSSION OF OPERATING RESULTS
The following table shows a summary of our reporting segments and consolidated financial results relating to continuing operations and discontinued operations for years ended December 31 (dollars in millions, except per share data):
4
| 2019 | 2018 | 2017 | |||||||||||||||
| Segment Revenues | |||||||||||||||||
| Rail North America | $ | 964.5 | $ | 941.5 | $ | 977.4 | |||||||||||
| Rail International | 227.7 | 217.5 | 197.1 | ||||||||||||||
| Portfolio Management | 9.9 | 16.1 | 29.9 | ||||||||||||||
| $ | 1,202.1 | $ | 1,175.1 | $ | 1,204.4 | ||||||||||||
| Segment Profit | |||||||||||||||||
| Rail North America | $ | 276.2 | $ | 307.9 | $ | 299.3 | |||||||||||
| Rail International | 78.9 | 68.6 | 68.8 | ||||||||||||||
| Portfolio Management | 62.4 | 38.7 | 56.3 | ||||||||||||||
| 417.5 | 415.2 | 424.4 | |||||||||||||||
| Less: | |||||||||||||||||
| Selling, general and administrative expense | 180.4 | 182.5 | 172.4 | ||||||||||||||
| Unallocated interest (income) expense | (5.8) | (8.6) | (8.5) | ||||||||||||||
| Other, including eliminations | 3.2 | 9.5 | 7.1 | ||||||||||||||
Income taxes ($18.0, $10.8 and $12.0 related to affiliates' earnings) | 58.9 | 41.3 | (214.4) | ||||||||||||||
| Net Income from Continuing Operations (GAAP) | $ | 180.8 | $ | 190.5 | $ | 467.8 | |||||||||||
| Income from Discontinued Operations, Net of Taxes (GAAP) | 30.4 | $ | 20.8 | $ | 34.2 | ||||||||||||
| Net Income (GAAP) | $ | 211.2 | $ | 211.3 | $ | 502.0 | |||||||||||
| Net income from continuing operations, excluding tax adjustments and other items (non-GAAP) | $ | 178.0 | $ | 178.8 | $ | 173.5 | |||||||||||
| Net income from discontinued operations, excluding tax adjustments and other items (non-GAAP) | $ | 22.3 | $ | 21.0 | $ | 11.5 | |||||||||||
| Net income from consolidated operations, excluding tax adjustments and other items (non-GAAP) | $ | 200.3 | $ | 199.8 | $ | 185.0 | |||||||||||
| Diluted earnings per share from continuing operations (GAAP) | $ | 4.97 | $ | 4.98 | $ | 11.88 | |||||||||||
| Diluted earnings per share from discontinued operations (GAAP) | $ | 0.84 | $ | 0.54 | $ | 0.87 | |||||||||||
| Diluted earnings per share from consolidated operations (GAAP) | $ | 5.81 | $ | 5.52 | $ | 12.75 | |||||||||||
| Diluted earnings per share from continuing operations, excluding tax adjustments and other items (non-GAAP) (1) | $ | 4.89 | $ | 4.67 | $ | 4.41 | |||||||||||
| Diluted earnings per share from discontinued operations, excluding tax adjustments and other items (non-GAAP) (1) | $ | 0.62 | $ | 0.55 | $ | 0.29 | |||||||||||
| Diluted earnings per share from consolidated operations, excluding tax adjustments and other items (non-GAAP) (1) | $ | 5.51 | $ | 5.22 | $ | 4.70 | |||||||||||
| Return on equity (GAAP) | 11.7 | % | 11.8 | % | 32.0 | % | |||||||||||
| Return on equity, excluding tax adjustments and other items (non-GAAP) | 13.5 | % | 13.6 | % | 13.1 | % | |||||||||||
| Investment Volume | $ | 722.8 | $ | 927.6 | $ | 589.4 | |||||||||||
_________
(1) See "Non-GAAP Financial Measures" at the end of this item for further details.
5
2019 Summary
Net income from continuing operations was $180.8 million, or $4.97 per diluted share, for 2019 compared to $190.5 million, or $4.98 per diluted share, for 2018, and $467.8 million, or $11.88 per diluted share, for 2017. Results for 2019 included a net benefit of $2.8 million from tax adjustments and other items, compared to a net benefit of $11.7 million in 2018 and a net benefit of $294.3 million in 2017 (see "Non-GAAP Financial Measures" at the end of this item for further details).
•At Rail North America, segment profit was lower in 2019. The decrease was attributable to lower net gains on asset dispositions, higher maintenance expense, resulting from more tank qualifications, and lower lease revenue, partially offset by higher other revenue.
•At Rail International, segment profit was higher in 2019, largely due to the absence of the railcar maintenance facility closure costs recorded in the prior year, as well as higher revenue from more railcars on lease. These positive drivers were partially offset by the negative impact of foreign exchange rates.
•At Portfolio Management, segment profit increased in 2019, primarily due to higher share of affiliate income from the Rolls-Royce & Partners Finance joint ventures (collectively the "RRPF affiliates"), offset by a lower contribution from the marine operations.
Total investment volume was $722.8 in 2019, compared to $927.6 million in 2018, and $589.4 million in 2017.
2020 Outlook
Given the general economic and political uncertainty we see in North America today, our outlook for Rail North America is guarded. Despite the challenging environment, a substantial portion of the new railcars to be delivered in 2020 are committed to customer leases. Our strong balance sheet also offers us flexibility to pursue secondary market acquisitions as attractive opportunities arise.
•Rail North America's segment profit in 2020 is expected to decrease from 2019. Lease rates for railcars scheduled to renew in 2020 will likely be lower than expiring lease rates, and we anticipate a small decrease in fleet utilization due to a continued oversupply of railcars in the market. As a result, we project revenue in 2020 to decline compared to the prior year. We also project higher maintenance expense in 2020, primarily resulting from costs associated with transitioning cars between customers due to our expectation of a lower renewal success rate.
•We anticipate Rail International's segment profit in 2020 to increase from 2019 as the demand for railcars in Europe continues to be strong. Lease revenue is expected to be higher in 2020, resulting from higher lease rates and more railcars on lease. In addition, our railcar fleet in India grew significantly in 2019, and we expect additional revenue from these railcars and additional railcar investment in 2020.
•We believe Portfolio Management's segment profit in 2020 will be higher than 2019. Strong operating results at the RRPF affiliates are expected to continue. In addition, we anticipate improved financial performance from our marine operations.
•On February 7, 2020, we entered into an agreement to sell ASC, and on May 14, 2020 we completed the sale, subject to customary closing conditions. See "Note 26. Discontinued Operations" in Item 8 of this Exhibit for additional information.
Segment Operations
Segment profit is an internal performance measure used by the Chief Executive Officer to assess the profitability of each segment. Segment profit includes all revenues, expenses, pre-tax earnings from affiliates, and net gains on asset dispositions that are directly attributable to each segment. We allocate interest expense to the segments based on what we believe to be the appropriate risk-adjusted borrowing costs for each segment. Segment profit excludes selling, general and administrative expenses, income taxes, and certain other amounts not allocated to the segments. These amounts are included in Other.
6
RAIL NORTH AMERICA
Segment Summary
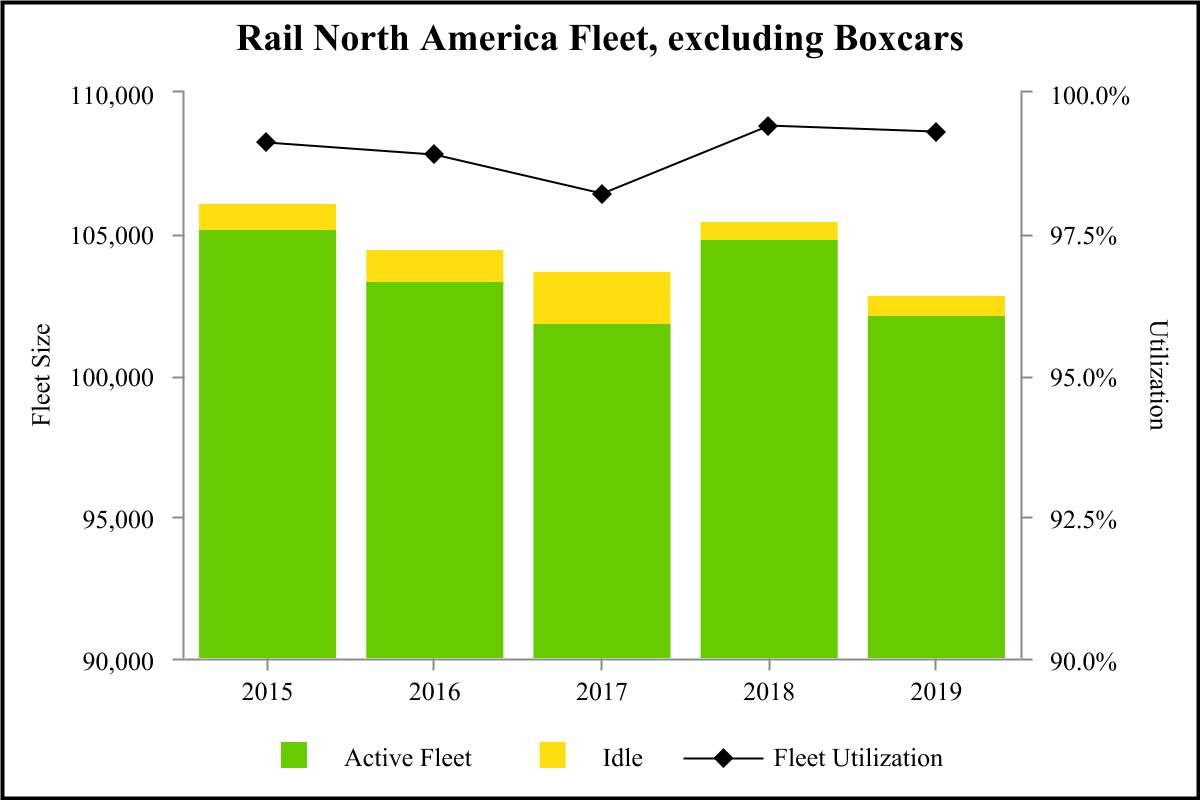
The operating environment for Rail North America was challenging in 2019 as a continued market oversupply of railcars, coupled with reduced carload volume and increased railroad velocity, put pressure on lease rates throughout the year. Despite this environment, Rail North America was able to maintain high fleet utilization and renewal success. At December 31, 2019, Rail North America's wholly owned fleet, excluding boxcars, consisted of approximately 102,800 cars. Fleet utilization, excluding boxcars, was 99.3% at the end of 2019, compared to 99.4% at the end of 2018, and 98.2% at the end of 2017. Fleet utilization for approximately 15,300 boxcars was 95.0% at the end of 2019 compared to 94.2% at the end of 2018, and 92.6% at the end of 2017. Utilization is calculated as the number of railcars on lease as a percentage of total railcars in the fleet.
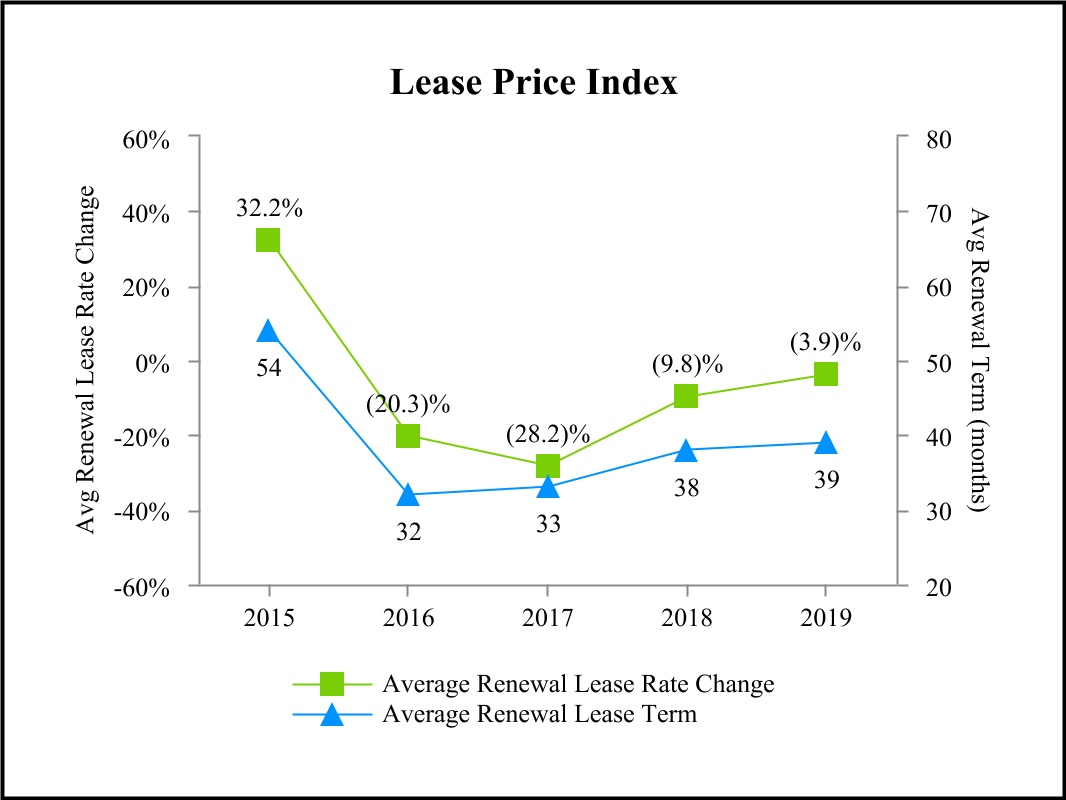
During 2019, an average of approximately 103,500 railcars, excluding boxcars, were on lease, compared to 102,100 in 2018, and 102,600 in 2017. Changes in railcars on lease compared to prior periods are impacted by the utilization of new railcars purchased under our supply agreements, the utilization of the railcars acquired from ECN Capital Corporation at the end of 2018, and the disposition of railcars that were sold or scrapped. During 2019, the renewal rate change of the Lease Price Index (the "LPI", see definition below) was negative 3.9%, compared to negative 9.8% in 2018 and negative 28.2% in 2017. Lease terms on renewals for cars in the LPI averaged 39 months in 2019, compared to 38 months in 2018, and 33 months in 2017. Additionally, the renewal success rate, which represents the percentage of railcars on expiring leases that were renewed with the existing lessee, was 82.2% in 2019, compared to 82.9% in 2018, and 74.7% in 2017. The renewal success rate is an important metric because railcars returned by our customers may incur transition costs, including additional repairs and related service prior to being leased to new customers, which may increase maintenance and associated expenses.
In 2014, we entered into a long-term supply agreement with Trinity Rail Group, LLC ("Trinity") a subsidiary of Trinity Industries. Under the terms of that agreement, we agreed to order 8,950 newly built railcars. As of December 31, 2019, all 8,950 railcars have been ordered, of which 7,678 railcars have been delivered. On May 24, 2018, we amended our long-term supply agreement with Trinity to extend the term to December 2023, and we agreed to purchase an additional 4,800 tank cars (1,200 per year) beginning in January 2020 and continuing through the expiration of the extended term. At December 31, 2019, 1,128 railcars have been ordered pursuant to the amended terms of the agreement.
In 2018, we entered into a multi-year railcar supply agreement with American Railcar Industries, Inc. ("ARI"), pursuant to which we will purchase 7,650 newly built railcars. The order encompasses a mix of tank and freight cars that are to be delivered over a five-year period, beginning in April 2019. ARI's railcar manufacturing business was subsequently acquired by The Greenbrier Companies, Inc. ("Greenbrier") on July 26, 2019, and Greenbrier assumed all of ARI's obligations under our long-term supply agreement. Under this agreement, 450 railcars were to be delivered in 2019, with the remaining 7,200 to be delivered ratably over the four-year period of 2020 to 2023. As of December 31, 2019, 2,129 railcars have been ordered. The agreement also includes an option to order up to an additional 4,400 railcars subject to certain restrictions.
Additionally, we acquired a fleet of 3,098 railcars from ECN Capital Corporation, with 2,832 of the railcars acquired in 2018 and the remaining 266 railcars in early 2019.
As of December 31, 2019, leases for approximately 17,800 tank cars and freight cars and approximately 3,200 boxcars are scheduled to expire in 2020. These amounts exclude railcars on leases expiring in 2020 that have already been renewed or assigned to a new lessee.
7
The following table shows Rail North America's segment results for the years ended December 31 (in millions):
| 2019 | 2018 | 2017 | |||||||||||||||
| Revenues | |||||||||||||||||
| Lease revenue | $ | 868.3 | $ | 873.4 | $ | 899.9 | |||||||||||
| Other revenue | 96.2 | 68.1 | 77.5 | ||||||||||||||
| Total Revenues | 964.5 | 941.5 | 977.4 | ||||||||||||||
| Expenses | |||||||||||||||||
| Maintenance expense | 267.9 | 254.7 | 265.0 | ||||||||||||||
| Depreciation expense | 256.9 | 248.5 | 239.4 | ||||||||||||||
| Operating lease expense | 54.4 | 49.6 | 60.7 | ||||||||||||||
| Other operating expense | 23.9 | 27.3 | 28.7 | ||||||||||||||
| Total Expenses | 603.1 | 580.1 | 593.8 | ||||||||||||||
| Other Income (Expense) | |||||||||||||||||
| Net gain on asset dispositions | 54.6 | 76.3 | 45.2 | ||||||||||||||
| Interest expense, net | (134.5) | (125.2) | (121.2) | ||||||||||||||
| Other expense | (5.3) | (5.2) | (5.9) | ||||||||||||||
| Share of affiliates' pre-tax income (loss) | — | 0.6 | (2.4) | ||||||||||||||
Segment Profit | $ | 276.2 | $ | 307.9 | $ | 299.3 | |||||||||||
| Investment Volume | $ | 502.2 | $ | 737.4 | $ | 460.9 | |||||||||||
The following table shows the components of Rail North America's lease revenue for the years ended December 31 (in millions):
| 2019 | 2018 | 2017 | |||||||||||||||
| Railcars | $ | 759.8 | $ | 757.8 | $ | 785.1 | |||||||||||
| Boxcars | 72.2 | 76.8 | 75.7 | ||||||||||||||
| Locomotives | 36.3 | 38.8 | 39.1 | ||||||||||||||
| Total | $ | 868.3 | $ | 873.4 | $ | 899.9 | |||||||||||
Lease Price Index
Our LPI is an internally-generated business indicator that measures lease rate pricing on renewals for our North American railcar fleet, excluding boxcars. We calculate the index using the weighted-average lease rate for a group of railcar types that we believe best represents our overall North American fleet, excluding boxcars. The average renewal lease rate change is reported as the percentage change between the average renewal lease rate and the average expiring lease rate, weighted by fleet composition. The average renewal lease term is reported in months and reflects the average renewal lease term of railcar types in the LPI, weighted by fleet composition.
8
Rail North America Fleet Data
The following table shows fleet activity for Rail North America railcars, excluding boxcars, for the years ended December 31:
| 2019 | 2018 | 2017 | |||||||||||||||
| Beginning balance | 105,472 | 103,730 | 104,522 | ||||||||||||||
| Cars added | 3,145 | 6,958 | 3,442 | ||||||||||||||
| Cars scrapped | (2,172) | (2,211) | (2,900) | ||||||||||||||
| Cars sold | (3,600) | (3,005) | (1,334) | ||||||||||||||
| Ending balance | 102,845 | 105,472 | 103,730 | ||||||||||||||
| Utilization rate at year end | 99.3 | % | 99.4 | % | 98.2 | % | |||||||||||
| Active railcars at year end | 102,127 | 104,864 | 101,849 | ||||||||||||||
| Average (monthly) active railcars | 103,452 | 102,061 | 102,600 | ||||||||||||||
9
The following table shows fleet statistics for Rail North America boxcars for the years ended December 31:
| 2019 | 2018 | 2017 | |||||||||||||||
| Ending balance | 15,264 | 16,220 | 16,398 | ||||||||||||||
| Utilization rate at year end | 95.0 | % | 94.2 | % | 92.6 | % | |||||||||||
The following table shows fleet activity for Rail North America locomotives for the years ended December 31:
| 2019 | 2018 | 2017 | |||||||||||||||
| Beginning balance | 680 | 665 | 660 | ||||||||||||||
| Locomotives added, net of scrapped or sold | (51) | 15 | 5 | ||||||||||||||
| Ending balance | 629 | 680 | 665 | ||||||||||||||
| Utilization rate at year end | 90.3 | % | 91.5 | % | 92.5 | % | |||||||||||
| Active locomotives at year end | 568 | 622 | 615 | ||||||||||||||
| Average (monthly) active locomotives | 608 | 622 | 623 | ||||||||||||||
Segment Profit
In 2019, segment profit of $276.2 million decreased 10.3% compared to $307.9 million in 2018. The decrease was driven by lower net gains on asset dispositions, higher maintenance expense, and lower lease revenue, partially offset by higher other revenue. Asset remarketing income is dependent on a number of factors and will vary from year to year.
In 2018, segment profit of $307.9 million increased 2.9% compared to $299.3 million in 2017. The increase was driven by higher asset disposition gains and lower maintenance expense, partially offset by lower lease revenue and lower lease termination fees.
10
Revenues
In 2019, lease revenue decreased $5.1 million, or 0.6%. The decrease was due to lower lease rates, higher rental abatement attributable to more railcars in the maintenance network, and fewer locomotives on lease in the current year, partially offset by more railcars on lease. Other revenue increased $28.1 million, due to higher repair revenue and higher lease termination fees in 2019.
In 2018, lease revenue decreased $26.5 million, or 2.9%, primarily due to lower lease rates and fewer railcars on lease. Other revenue decreased $9.4 million, largely a result of lower lease termination fees in 2018. Other revenue in 2017 included $7.8 million as compensation for damage to returned railcars. The expenses to repair these railcars were recognized as incurred.
Expenses
In 2019, maintenance expense increased $13.2 million, driven by more tank qualifications in 2019, as expected, as well as higher repairs performed by the railroads on GATX-owned railcars. Depreciation expense increased $8.4 million due to new railcar investments, including the railcars acquired from ECN Capital Corporation in 2018. Operating lease expense increased $4.8 million, primarily a result of the elimination of deferred gain amortization for sale-leaseback transactions in accordance with the new lease accounting standard. See "Note 2. Accounting Changes" and "Note 5. Leases" in Item 8 of this Exhibit for further detail regarding the impact of the new lease accounting standard. Other operating expense decreased $3.4 million, primarily due to lower switching, storage, and freight costs as a result of continued high utilization.
In 2018, maintenance expense decreased $10.3 million, driven by fewer repairs performed by the railroads, as well as fewer tank qualifications and lower costs from assigning railcars to new lessees. Depreciation expense increased $9.1 million due to railcar investments and the purchase of railcars previously on operating leases. Operating lease expense decreased $11.1 million, resulting from the purchase of railcars previously on operating leases. Other operating expense decreased $1.4 million, due to lower switching, storage, and freight costs, reflective of lower assignment activity.
Other Income (Expense)
In 2019, net gain on asset dispositions decreased $21.7 million, resulting from lower asset remarketing gains and lower net scrapping gains. Net scrapping gains were lower in the current year due to certain railcars and locomotives scrapped at a loss, as well as lower scrap prices per ton. See "Note 23. Financial Data of Business Segments", Item 8 of this Exhibit, for further details of the components of net gain on asset dispositions. The amount and timing of disposition gains is dependent on a number of factors and will vary from year to year. Net interest expense increased $9.3 million, driven by a higher average debt balance and a higher average interest rate.
In 2018, net gain on asset dispositions increased $31.1 million, attributable to more railcars sold in 2018, as well as higher scrapping gains resulting primarily from a higher scrap price per ton. Net interest expense increased $4.0 million, driven by a higher average interest rate and a higher average debt balance.
Investment Volume
During 2019, investment volume was $502.2 million compared to $737.4 million in 2018, and $460.9 million in 2017. We acquired 3,225 railcars in 2019, compared to 7,489 railcars, including 2,832 railcars purchased as part of the ECN Capital Corporation transaction in 2018, and 3,613 railcars in 2017.
Our investment volume is predominantly composed of acquired railcars, but also includes certain capitalized repairs and improvements to owned railcars and our maintenance facilities. As a result, the dollar value of investment volume does not necessarily correspond to the number of railcars acquired in any given period. In addition, the comparability of amounts invested and the number of railcars acquired in each period is impacted by the mix of railcars purchased, which may include tank cars and freight cars, as well as newly manufactured railcars or those purchased in the secondary market.
11
RAIL INTERNATIONAL
Segment Summary
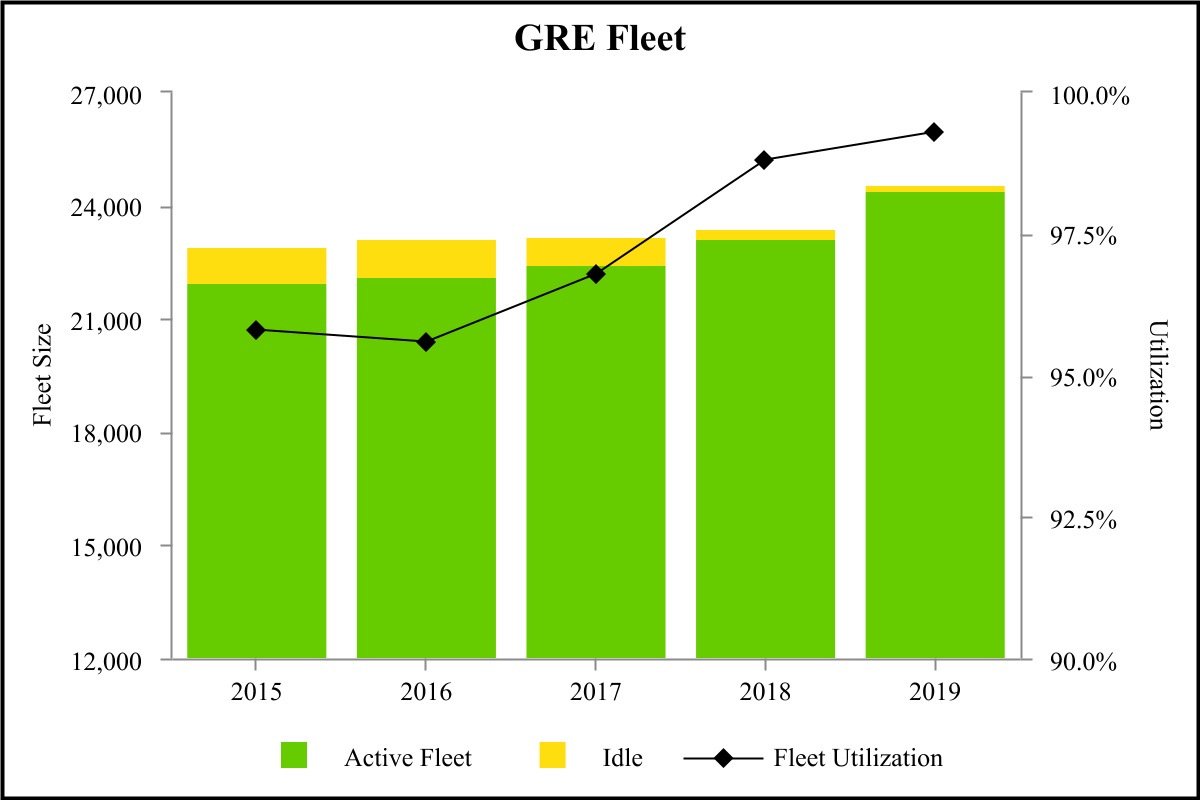
Rail International, composed primarily of GATX Rail Europe ("GRE"), produced solid operating results in 2019. Strong replacement demand and increasing new railcar production backlogs drove record utilization and strong lease rates at GRE. Railcar utilization for GRE was 99.3% at the end of 2019, compared to 98.8% at the end of 2018, and 96.8% at the end of 2017. Utilization is calculated as the number of railcars on lease as a percentage of total railcars in the fleet. In addition, our operations in India ("GRI") benefited from more cars on lease as it continued to significantly expand its fleet.
In 2018, GRE recorded $9.5 million of expenses attributable to the closure of a railcar maintenance facility in Germany.
GRI continued to focus on investment opportunities, diversification of its fleet, and developing relationships with customers, suppliers and the Indian Railways. In 2019, GRI added 1,626 railcars, compared to 1,001 in 2018 and 275 in 2017. GRI expects continued fleet growth and diversification in 2020.
Rail Russia focused on managing its existing fleet and maintaining strong relationships with its customer base. In 2019, Rail Russia added 26 railcars, compared to 184 in 2018 and zero in 2017.
The following table shows Rail International's segment results for the years ended December 31 (in millions):
| 2019 | 2018 | 2017 | |||||||||||||||
| Revenues | |||||||||||||||||
| Lease revenue | $ | 219.2 | $ | 209.3 | $ | 190.3 | |||||||||||
| Other revenue | 8.5 | 8.2 | 6.8 | ||||||||||||||
| Total Revenues | 227.7 | 217.5 | 197.1 | ||||||||||||||
| Expenses | |||||||||||||||||
| Maintenance expense | 46.5 | 44.5 | 41.1 | ||||||||||||||
| Depreciation expense | 57.8 | 55.5 | 48.9 | ||||||||||||||
| Other operating expense | 6.8 | 5.8 | 4.7 | ||||||||||||||
| Total Expenses | 111.1 | 105.8 | 94.7 | ||||||||||||||
| Other Income (Expense) | |||||||||||||||||
| Net gain (loss) on asset dispositions | 1.7 | (0.2) | 3.1 | ||||||||||||||
| Interest expense, net | (40.6) | (35.9) | (33.4) | ||||||||||||||
| Other income (expense) | 1.2 | (7.0) | (3.2) | ||||||||||||||
| Share of affiliates' pre-tax loss | — | — | (0.1) | ||||||||||||||
Segment Profit | $ | 78.9 | $ | 68.6 | $ | 68.8 | |||||||||||
| Investment Volume | $ | 215.7 | $ | 152.7 | $ | 90.9 | |||||||||||
12
The following table shows fleet activity for GRE railcars for the years ended December 31:
| 2019 | 2018 | 2017 | |||||||||||||||
| Beginning balance | 23,412 | 23,166 | 23,122 | ||||||||||||||
| Cars added | 1,417 | 847 | 871 | ||||||||||||||
| Cars scrapped or sold | (268) | (601) | (827) | ||||||||||||||
| Ending balance | 24,561 | 23,412 | 23,166 | ||||||||||||||
| Utilization rate at year end | 99.3 | % | 98.8 | % | 96.8 | % | |||||||||||
| Active railcars at year end | 24,392 | 23,124 | 22,422 | ||||||||||||||
| Average (monthly) active railcars | 23,665 | 22,619 | 22,137 | ||||||||||||||
 \
\Foreign Currency
Rail International's reported financial results are impacted by fluctuations in the exchange rates of the U.S. dollar versus foreign currencies in which it conducts business, primarily the euro. In 2019, a weaker euro, relative to the U.S. dollar, negatively impacted lease revenue by approximately $10.6 million and segment profit, excluding other income (expense), by approximately $5.0 million compared to 2018. In 2018, a stronger euro, relative to the U.S. dollar, positively impacted lease revenue by approximately $8.2 million and segment profit, excluding other income (expense), by approximately $4.3 million compared to 2017.
Segment Profit
In 2019, segment profit of $78.9 million increased 15.0% compared to $68.6 million in 2018. Segment profit in 2018 included expenses of approximately $9.5 million attributable to the closure of the railcar maintenance facility in Germany. Excluding these costs, results for Rail International were $0.8 million higher than 2018, primarily due to higher revenue from more railcars on lease, partially offset by higher maintenance expense and the negative impact of foreign exchange rates.
In 2018, segment profit of $68.6 million decreased 0.3% compared to $68.8 million in 2017. Excluding the impact of the closure of the railcar maintenance facility in Germany noted above, results for Rail International were $9.3 million higher than 2017, primarily due to more railcars on lease and the positive impact of foreign exchange rates.
13
Revenues
In 2019, lease revenue increased $9.9 million, or 4.7%, primarily due to more railcars on lease, partially offset by the impact of foreign exchange rates. Other revenue increased $0.3 million, driven by higher repair revenue.
In 2018, lease revenue increased $19.0 million, or 10.0%, due to more railcars on lease and the impact of foreign exchange rates. Other revenue increased $1.4 million, driven by higher repair revenue.
Expenses
In 2019, maintenance expense increased $2.0 million, primarily due to higher wheelset costs and other repairs. These negative drivers were partially offset by lower workshop costs, due in part to the elimination of expenses associated with the maintenance facility in Germany that was closed in 2018, as well as the impact of foreign exchange rates. Depreciation expense increased $2.3 million, primarily due to new railcars added to the fleet.
In 2018, maintenance expense increased $3.4 million, primarily due to higher wheelset costs and the impact of foreign exchange rates, partially offset by lower regulatory compliance costs. Depreciation expense increased $6.6 million, driven by the impact of new railcars added to the fleet, as well as the impact of foreign exchange rates.
Other Income (Expense)
In 2019, net gain on asset dispositions increased $1.9 million, attributable to the absence of the impairment for the maintenance facility in Germany recorded in the prior year, partially offset by lower railcar scrapping gains, as a result of fewer railcars scrapped in 2019. Net interest expense increased $4.7 million, due to a higher average interest rate and a higher average debt balance. Other expense decreased $8.2 million, driven by the absence of the railcar maintenance facility closure costs recorded in 2018 and lower net litigation costs related to the Viareggio matter, which reflected insurance proceeds received in 2019. See "Note 22. Legal Proceedings and Other Contingencies" in Item 8 of this Exhibit for further details about the Viareggio matter. This was partially offset by the negative impact of changes in foreign exchange rates on non-functional currency items.
In 2018, net gain on asset dispositions decreased $3.3 million, attributable to the impairment recorded for the maintenance facility in Germany. Net interest expense increased $2.5 million, due to a higher average debt balance and a higher average interest rate. Other expense increased $3.8 million, driven by the railcar maintenance facility closure costs and higher legal expenses, partially offset by the favorable impact of changes in foreign exchange rates on non-functional currency items.
Investment Volume
Investment volume was $215.7 million in 2019, $152.7 million in 2018, and $90.9 million in 2017. During 2019, GRE acquired 1,417 railcars (including 384 assembled at the GRE Ostroda, Poland facility), GRI acquired 1,626 rail cars, and Rail Russia acquired 26 railcars, compared to 847 railcars at GRE (including 316 assembled at the GRE Ostroda, Poland facility), 1,001 railcars at GRI, and 184 railcars at Rail Russia in 2018, and 871 railcars at GRE (including 272 assembled at the GRE Ostroda, Poland facility) and 275 railcars at GRI in 2017.
Our investment volume is predominantly composed of acquired railcars, but may also include certain capitalized repairs and improvements to owned railcars. As a result, the dollar value of investment volume does not necessarily correspond to the number of railcars acquired in any given period. In addition, the comparability of amounts invested and the number of railcars acquired in each period is impacted by the mix of the various car types acquired, as well as fluctuations in the exchange rates of the foreign currencies in which Rail International conducts business.
14
PORTFOLIO MANAGEMENT
Segment Summary
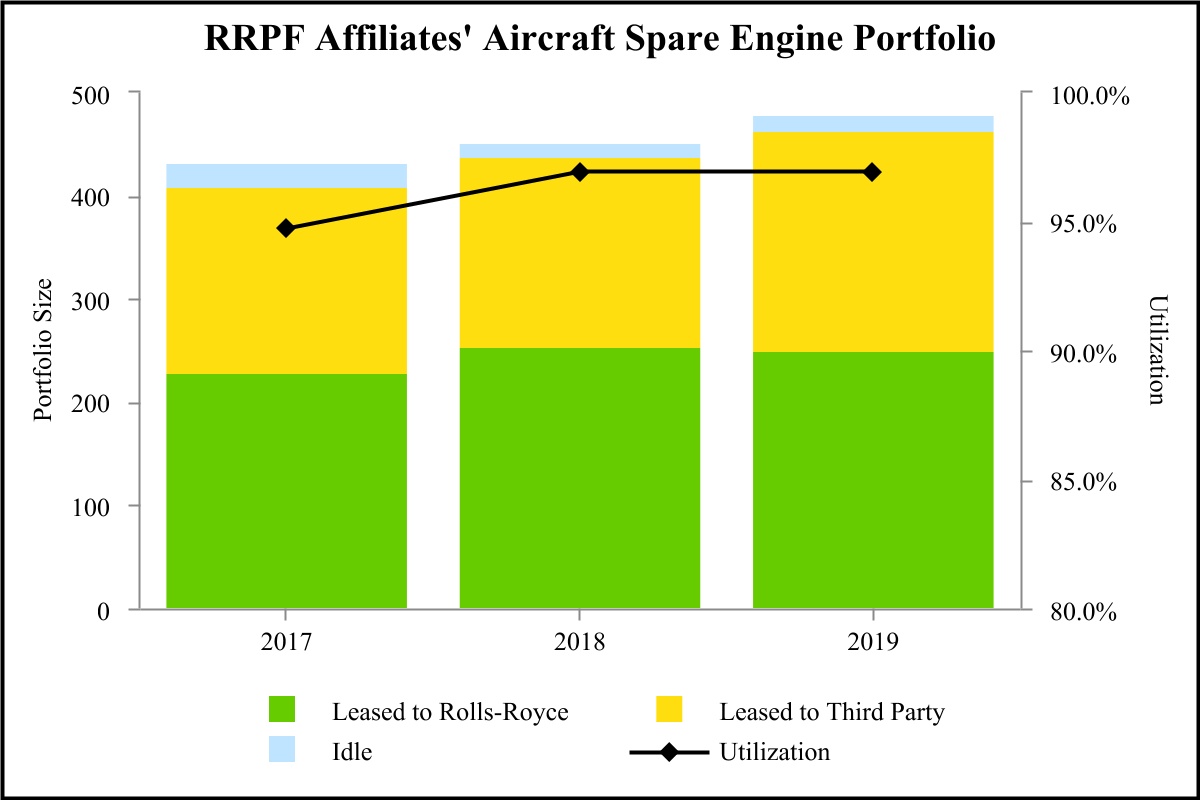
Portfolio Management's segment profit is attributable primarily to income from the RRPF affiliates, a group of 50% owned domestic and foreign joint ventures with Rolls-Royce plc (or affiliates thereof, collectively “Rolls-Royce”), a leading manufacturer of commercial aircraft jet engines. Segment profit included earnings from the RRPF affiliates of $94.5 million for 2019, $60.5 million for 2018, and $57.3 million for 2017. Portfolio Management did not make any additional investment in the RRPF affiliates in 2019, compared to $14.1 million in 2018 and $36.6 million in 2017. Dividend distributions from the RRPF affiliates totaled $27.5 million in 2019, compared to $35.2 million in 2018 and $30.2 million in 2017. The RRPF affiliates owned 478 aircraft spare engines with a net book value of approximately $5,036.4 million at the end of 2019 compared to 452 aircraft spare engines with a net book value of approximately $4,435.6 million at the end of 2018 and 432 aircraft spare engines with a net book value of $3,764.5 million at the end of 2017.
As we have disclosed previously, we have exited the majority of Portfolio Management's marine investments. As of December 31, 2017, we had completed all planned sales of the marine assets, including our 50% interest in the Cardinal Marine joint venture. In 2017, we received proceeds of $46.8 million, resulting in net gains of $1.8 million.
Portfolio Management continues to own marine assets, consisting primarily of five liquefied gas-carrying vessels (the "Specialized Gas Vessels"), previously referred to as the Norgas Vessels. During the second quarter of 2019, the prior commercial management agreement with Norgas Carriers Private Limited, and related pooling arrangement, was terminated, and we entered into a new agreement with Anthony Veder Group B.V. ("Veder") to commercially manage these vessels. During this transition, the Specialized Gas Vessels were idle for a significant portion of the second quarter of 2019. However, we realized increased utilization during the second half of 2019 and expect continuing improvement in future operating performance resulting from this new commercial agreement.
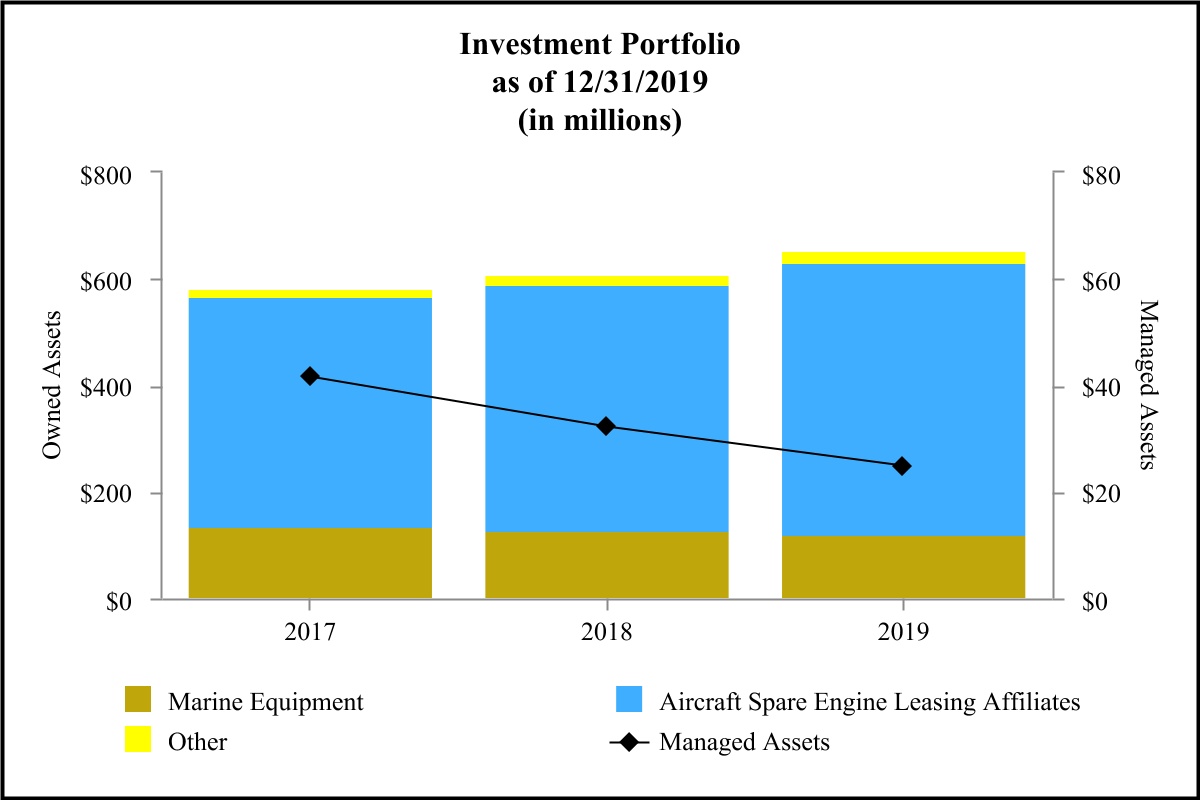
Portfolio Management's total asset base was $653.7 million at December 31, 2019, compared to $606.8 million at December 31, 2018, and $582.8 million at December 31, 2017.
The following table shows Portfolio Management’s segment results for the years ended December 31 (in millions):
| 2019 | 2018 | 2017 | |||||||||||||||
| Revenues | |||||||||||||||||
| Lease revenue | $ | 1.0 | $ | 1.0 | $ | 3.8 | |||||||||||
| Marine operating revenue | 8.2 | 14.3 | 25.0 | ||||||||||||||
| Other revenue | 0.7 | 0.8 | 1.1 | ||||||||||||||
| Total Revenues | 9.9 | 16.1 | 29.9 | ||||||||||||||
| Expenses | |||||||||||||||||
| Marine operating expense | 18.9 | 16.8 | 24.8 | ||||||||||||||
| Depreciation expense | 6.6 | 7.3 | 7.0 | ||||||||||||||
| Other operating expense | 0.6 | — | 1.0 | ||||||||||||||
| Total Expenses | 26.1 | 24.1 | 32.8 | ||||||||||||||
| Other Income (Expense) | |||||||||||||||||
| Net (loss) gain on asset dispositions | (4.7) | (3.4) | 7.7 | ||||||||||||||
| Interest expense, net | (11.2) | (10.4) | (9.2) | ||||||||||||||
| Other income | — | — | 2.3 | ||||||||||||||
| Share of affiliates' pre-tax income | 94.5 | 60.5 | 58.4 | ||||||||||||||
Segment Profit | $ | 62.4 | $ | 38.7 | $ | 56.3 | |||||||||||
Investment Volume | $ | — | $ | 14.1 | $ | 36.6 | |||||||||||
15
The following table sets forth the approximate net book value of Portfolio Management’s assets as of December 31 (in millions):
| 2019 | 2018 | 2017 | |||||||||||||||
| Investment in RRPF Affiliates | $ | 512.4 | $ | 464.3 | $ | 434.2 | |||||||||||
| Owned assets | 141.3 | 142.5 | 148.6 | ||||||||||||||
| Managed assets (1) | 24.8 | 32.3 | 41.6 | ||||||||||||||
________
(1) Amounts shown represent the estimated net book value of assets managed for third parties and are not included in our consolidated balance sheets.
RRPF Affiliates Engine Portfolio Data
The following table shows portfolio activity for the RRPF affiliates' aircraft spare engines for the years ended December 31:
| 2019 | 2018 | 2017 | |||||||||||||||
| Beginning balance | 452 | 432 | 407 | ||||||||||||||
| Engine acquisitions | 46 | 48 | 35 | ||||||||||||||
| Engine dispositions | (20) | (28) | (10) | ||||||||||||||
| Ending balance | 478 | 452 | 432 | ||||||||||||||
| Utilization rate at year end | 96.9 | % | 96.9 | % | 94.7 | % | |||||||||||
16
Comparison of Reported Results
Comparisons of reported results for 2018 and 2017 are impacted by the sale of marine investments.
Segment Profit
In 2019, segment profit was $62.4 million compared to $38.7 million in 2018. The increase reflects stronger results at the RRPF affiliates, partially offset by a lower contribution from the Specialized Gas Vessels.
In 2018, segment profit was $38.7 million compared to $56.3 million in 2017. Segment profit for 2017 included net gains of approximately $1.8 million associated with the exit of marine investments. Excluding this item, results for the Portfolio Management segment were $15.8 million lower in 2018 compared to 2017, primarily due to the absence of operating income from the marine assets sold during 2017, lower residual sharing fees from the managed portfolio, and a lower contribution from the Specialized Gas Vessels.
Revenues
In 2019, lease revenue was comparable to the same period in 2018. Marine operating revenue decreased $6.1 million, due to lower revenue from the Specialized Gas Vessels. In 2019, utilization of the vessels was lower due to idle time associated with the transition to a new commercial manager, as discussed previously.
In 2018, lease revenue decreased $2.8 million, primarily due to the impact of the sales of assets in 2017. Marine operating revenue decreased $10.7 million, largely due to lower revenue from the Specialized Gas Vessels and the absence of revenue from the marine assets that were sold in 2017. The revenue from the Specialized Gas Vessels declined due to continued pressure on charter rates and lower utilization, resulting from weak demand and oversupply of vessels in the market.
Expenses
In 2019, marine operating expense increased $2.1 million. This increase was driven by the write-off of residual net assets as part of the wind-up of activities under the prior commercial management pooling agreement, partially offset by lower expenses from the Specialized Gas Vessels.
17
In 2018, marine operating expense decreased $8.0 million, primarily due to the absence of the marine assets that were sold in 2017, as well as lower expenses from the Specialized Gas Vessels, which included higher dry-docking costs in the prior year.
Other Income (Expense)
In 2019, net loss on asset dispositions increased $1.3 million, largely due to higher impairment losses for certain offshore supply vessels, partially offset by higher residual sharing fees from the managed portfolio.
In 2018, net gain (loss) on asset dispositions decreased $11.1 million. Net gains of approximately $1.8 million were recorded in 2017 associated with the planned exit of marine investments. Excluding this item, net gain (loss) on asset dispositions decreased $9.3 million due to lower residual sharing fees from the managed portfolio, as well as well as higher impairment losses for certain offshore supply vessels.
In 2019, income from our share of affiliates' earnings increased $34.0 million. The increase was due to more engines on lease and increased residual realization at the RRPF affiliates.
In 2018, income from our share of affiliates' earnings increased $2.1 million, primarily from earnings at the RRPF affiliates due to higher operating income, driven by engines added to the fleet in 2018, partially offset by lower net disposition gains on engines sold.
Investment Volume
Portfolio Management did not make any investments in 2019. Investment volume of $14.1 million in 2018 and $36.6 million in 2017 consisted primarily of equity investments in the RRPF affiliates.
18
OTHER
Other comprises selling, general and administrative expenses (“SG&A”), unallocated interest expense, and miscellaneous income and expense not directly associated with the reporting segments and eliminations.
The following table shows components of Other for the years ended December 31 (in millions):
| 2019 | 2018 | 2017 | |||||||||||||||
| Selling, general and administrative expense | $ | 180.4 | $ | 182.5 | $ | 172.4 | |||||||||||
| Unallocated interest (income) expense | (5.8) | (8.6) | (8.5) | ||||||||||||||
| Other expense (income), including eliminations | 3.2 | 9.5 | 7.1 | ||||||||||||||
SG&A, Unallocated Interest and Other
During 2017, we exercised our option to terminate the office lease at our corporate headquarters early. As a result, accelerated depreciation on leasehold improvements was recorded in SG&A in 2017 and 2018, and lease termination costs were recorded in other expense (income) in 2017.
In 2019, SG&A of $180.4 million decreased $2.1 million from 2018. The decrease was primarily due to the absence of accelerated depreciation recorded in 2018 related to the early termination of the corporate headquarters office lease, partially offset by higher compensation and other employee benefits costs.
In 2018, SG&A of $182.5 million increased $10.1 million from 2017. The increase was primarily due to higher compensation and other employee benefits and higher information technology expense. SG&A was also negatively impacted by a full year of accelerated depreciation of leasehold improvements resulting from the early termination of the office lease.
Unallocated interest expense (the difference between external interest expense and interest expense allocated to the reporting segments) in any year is affected by our consolidated leverage position, the timing of debt issuances and investing activities, and intercompany allocations.
In 2019, other expense (income), including eliminations, decreased $6.3 million, driven by lower non-service pension expense. Specifically, certain lump sum distributions paid to retirees in 2018 triggered a non-recurring adjustment to pension expense for $2.1 million. In addition, lower provisions recorded for litigation and environmental accruals contributed to the decrease.
In 2018, other expense (income), including eliminations, increased $2.4 million, driven by provisions recorded for environmental and litigation accruals, as well as incremental pension expense associated with certain lump sum distributions in 2018, partially offset by the absence of costs recorded in 2017 associated with the early termination of the office lease.
Consolidated Income Taxes
In 2017, the Tax Cuts and Jobs Act (the “Tax Act”) made broad and complex changes to the U.S. federal income tax laws. The Tax Act had a significant impact on our earnings in 2017, as we recorded a one-time net tax benefit of $315.9 million, which represented our provisional estimate of the impact of the Tax Act. This amount included a net benefit of $371.4 million associated with the remeasurement of our net deferred tax liability utilizing the lower U.S. federal income tax rate. The Tax Act also imposed a one-time transitional repatriation tax of $57.2 million on certain undistributed earnings of our non-U.S. subsidiaries and affiliates. Additional guidance was issued by the Internal Revenue Service, the U.S. Department of the Treasury, and state taxing authorities during 2018 and, as a result, we recorded an adjustment to our provisional estimates. Specifically, in the fourth quarter of 2018, we recorded an additional net tax benefit of $16.5 million based on this clarifying guidance, the filing of our 2017 income tax returns, and the final determination of our foreign undistributed earnings and associated tax attributes. We do not expect to record any future material adjustments associated with the Tax Act. As part of the Tax Act, the U.S. corporation income tax rate was reduced to 21% from 35%, and this reduction favorably impacted our consolidated effective tax rate, net income, and diluted earnings per share; however, the Tax Act has not had a material impact on our consolidated cash flows from operations. See "Note 12. Income Taxes" in Item 8 of this Exhibit for additional information on income taxes.
19
Discontinued Operations
Segment Summary
On February 7, 2020, we entered into an agreement to sell ASC. On May 14, 2020, we completed the sale of our ASC business, subject to customary post-closing adjustments. As a result, ASC is now reported as discontinued operations, and financial data for the ASC segment has been segregated and presented as discontinued operations in the consolidated financial statements in this Exhibit for all periods presented. See "Note 26. Discontinued Operations" in Item 8 of this Exhibit for additional information. The ASC business comprises the entirety of GATX's discontinued operations.
The following table shows the income from discontinued operations, net of taxes (in millions):
| 2019 | 2018 | 2017 | |||||||||||||||
| Income from discontinued operations, net of taxes | $ | 30.4 | $ | 20.8 | $ | 34.2 | |||||||||||
BALANCE SHEET DISCUSSION
Assets
Total assets (including on- and off-balance sheet) were $8.3 billion at December 31, 2019, compared to $8.0 billion at December 31, 2018. A portion of our North American railcar fleet is financed through sale-leasebacks that are accounted for as operating leases. Prior to 2019, these railcar assets were not recorded on the balance sheet. Under the new lease accounting standard adopted on January 1, 2019, GATX records these railcar operating leases on the balance sheet as right-of-use assets. As such, we no longer have any assets that qualify as off-balance sheet assets beginning in 2019. The increase in total assets was primarily driven by an increase in operating assets at Rail International, higher investment in the RRPF affiliates, and an increase in cash and cash equivalents at Corporate.
The following table shows on- and off-balance sheet assets by segment as of December 31 (in millions):
| 2019 | 2018 | ||||||||||||||||||||||||||||||||||
| | On-Balance Sheet | Off-Balance Sheet (1) | Total | On-Balance Sheet | Off-Balance Sheet | Total | |||||||||||||||||||||||||||||
| Rail North America | $ | 5,646.7 | $ | — | $ | 5,646.7 | $ | 5,236.6 | $ | 430.2 | $ | 5,666.8 | |||||||||||||||||||||||
| Rail International | 1,486.7 | — | 1,486.7 | 1,363.2 | — | 1,363.2 | |||||||||||||||||||||||||||||
| Portfolio Management | 653.7 | — | 653.7 | 606.8 | — | 606.8 | |||||||||||||||||||||||||||||
| Other | 206.9 | — | 206.9 | 112.3 | — | 112.3 | |||||||||||||||||||||||||||||
| Discontinued Operations | 291.1 | — | 291.1 | 297.8 | — | 297.8 | |||||||||||||||||||||||||||||
| Total | $ | 8,285.1 | $ | — | $ | 8,285.1 | $ | 7,616.7 | $ | 430.2 | $ | 8,046.9 | |||||||||||||||||||||||
_________
(1) In accordance with the new lease accounting standard, we no longer have any assets that qualify as off-balance sheet assets beginning in 2019. The adoption of this new standard required us to recognize operating lease assets on our balance sheet. See “Non-GAAP Financial Measures” at the end of this item.
Gross Receivables
Receivables of $156.2 million at December 31, 2019 decreased $35.5 million from December 31, 2018, primarily due to the timing of payments by customers.
Allowance for Losses
As of December 31, 2019, allowance for losses totaled $6.2 million, or 9.4% of rent and other receivables, compared to $6.4 million, or 9.8%, at December 31, 2018. Both balances related entirely to general allowances.
20
See "Note 17. Allowance for Losses" in Item 8 of this Exhibit.
Operating Assets and Facilities
Net operating assets and facilities increased $181.7 million from 2018. The increase was primarily due to investments of $715.1 million offset by depreciation of $325.9 million, asset dispositions of $176.4 million, and negative foreign exchange rate effects of $21.9 million.
Investments in Affiliated Companies
Investments in affiliated companies increased $48.1 million in 2019 (see table below). The increase was driven by our share of earnings from the RRPF affiliates partially offset by distributions from the RRPF affiliates.
The following table shows our investments in affiliated companies by segment as of December 31 (in millions):
| 2019 | 2018 | ||||||||||
| Rail North America | $ | 0.2 | $ | 0.2 | |||||||
| Portfolio Management | 512.4 | 464.3 | |||||||||
| Total | $ | 512.6 | $ | 464.5 | |||||||
See "Note 6. Investments in Affiliated Companies" in Item 8 of this Exhibit.
Goodwill
In 2019 and 2018, changes in the balance of our goodwill, all of which is attributable to the Rail North America and Rail International segments, resulted from fluctuations in foreign currency exchange rates. We tested our goodwill for impairment in the fourth quarter of 2019, and no impairment was indicated.
See "Note 16. Goodwill" in Item 8 of this Exhibit.
Debt
Total debt increased $255.7 million from the prior year. Issuances of long-term debt of $748.5 million were offset by maturities and principal payments of $504.6 million and the effects of foreign exchange on foreign debt balances.
The following table shows the details of our long-term debt issuances in 2019 ($ in millions):
| Type of Debt | Term | Interest Rate | Principal Amount | |||||||||||||||||
| Recourse Unsecured | 10.2 Years | 4.70% Fixed | $ | 500.0 | ||||||||||||||||
| Recourse Unsecured | 5.0 Years | 0.96% Fixed | 110.2 | |||||||||||||||||
| Recourse Unsecured | 7.0 Years | 1.07% Fixed | 82.6 | |||||||||||||||||
| Recourse Unsecured | 5.0 Years | 0.90% Floating (1) | 55.7 | |||||||||||||||||
| $ | 748.5 | |||||||||||||||||||
________
(1)Floating interest rate at December 31, 2019.
As of December 31, 2019, our outstanding debt had a weighted-average remaining term of 8.7 years and a weighted-average interest rate of 4.08%, compared to 8.9 years and 4.01% at December 31, 2018.
The following table shows the carrying value of our debt and lease obligations by major component, including off-balance sheet debt, as of December 31 (in millions):
21
| 2019 | 2018 | ||||||||||||||||||||||
| Secured | Unsecured | Total | Total | ||||||||||||||||||||
| Commercial paper and borrowings under bank credit facilities | $ | — | $ | 15.8 | $ | 15.8 | $ | 110.8 | |||||||||||||||
| Recourse debt | — | 4,780.4 | 4,780.4 | 4,429.7 | |||||||||||||||||||
| Operating lease obligations | 429.4 | — | 429.4 | — | |||||||||||||||||||
| Finance lease obligations | 7.9 | — | 7.9 | 11.3 | |||||||||||||||||||
| Balance sheet debt and lease obligations | 437.3 | 4,796.2 | 5,233.5 | 4,551.8 | |||||||||||||||||||
| Recourse off-balance sheet debt (1) | — | — | — | 430.2 | |||||||||||||||||||
| Total | $ | 437.3 | $ | 4,796.2 | $ | 5,233.5 | $ | 4,982.0 | |||||||||||||||
________
(1) Prior to 2019, off-balance sheet debt represented the estimated present value of committed operating lease payments for certain railcars that have been financed through sale-leasebacks and was equal to the amount reported as off-balance sheet assets. In accordance with the new lease accounting standard, we no longer have any assets that qualify as off-balance sheet assets beginning in 2019. The adoption of this new standard required us to recognize operating lease liabilities on our balance sheet. See “Non-GAAP Financial Measures” at the end of this item.
See "Note 7. Debt" in Item 8 of this Exhibit.
Equity
Total equity increased $47.0 million in 2019, primarily due to net income of $211.2 million, $39.4 million from the impact of adoption of new accounting standards as of January 1, 2019, $13.7 million from the effects of share-based compensation, $7.2 million from the effects of post-retirement benefit plan adjustments, and $3.9 million of net unrealized gains on derivatives. These increases were offset by stock repurchases of $150.0 million, dividends of $68.5 million, and $10.1 million of foreign currency translation adjustments due to the balance sheet effects of a stronger U.S. dollar relative to the foreign currencies in which our subsidiaries conduct business, primarily the euro, Canadian dollar, and Polish zloty.
See "Note 19. Shareholders’ Equity" in Item 8 of this Exhibit.
CASH FLOW DISCUSSION
We generate a significant amount of cash from operating activities and investment portfolio proceeds. We also access domestic and international capital markets by issuing unsecured or secured debt and commercial paper. We use these resources, along with available cash balances, to fulfill our debt, lease, and dividend obligations, to support our share repurchase programs, and to fund portfolio investments and capital additions. We primarily use cash from operations to fund daily operations.
The timing of asset dispositions and changes in working capital impact cash flows from portfolio proceeds and operations. As a result, these cash flow components may vary materially from year to year. As of December 31, 2019, we had an unrestricted cash balance of $151.0 million.
22
The following table shows our principal sources and uses of cash from continuing operations for the years ended December 31 (in millions):
| 2019 | 2018 | 2017 | |||||||||||||||
Principal sources of cash | |||||||||||||||||
Net cash provided by operating activities | $ | 425.8 | $ | 485.2 | $ | 454.3 | |||||||||||
Portfolio proceeds | 250.3 | 234.4 | 165.6 | ||||||||||||||
Other asset sales | 23.0 | 37.3 | 30.3 | ||||||||||||||
Proceeds from sale-leasebacks | — | 59.1 | 90.6 | ||||||||||||||
Proceeds from issuance of debt, commercial paper, and credit facilities | 743.0 | 800.2 | 792.6 | ||||||||||||||
Total | $ | 1,442.1 | $ | 1,616.2 | $ | 1,533.4 | |||||||||||
Principal uses of cash | |||||||||||||||||
Portfolio investments and capital additions | $ | (722.8) | $ | (927.6) | $ | (589.4) | |||||||||||
Repayments of debt, commercial paper, and credit facilities | (504.6) | (632.8) | (703.3) | ||||||||||||||
Purchases of assets previously leased | (1.0) | (66.6) | (87.8) | ||||||||||||||
Payments on finance lease obligations | (11.3) | (1.2) | (1.3) | ||||||||||||||
Stock repurchases | (150.0) | (115.5) | (100.0) | ||||||||||||||
Dividends | (69.3) | (69.3) | (68.2) | ||||||||||||||
Total | $ | (1,459.0) | $ | (1,813.0) | $ | (1,550.0) | |||||||||||
Additionally, net cash from discontinued operations was $(0.1) million, $0.0 million, and $0.0 million for the years ended December 31, 2019, 2018, and 2017.
Net Cash Provided by Operating Activities
Net cash provided by operating activities of $425.8 million decreased $59.4 million compared to 2018. Comparability among reporting periods is impacted by the timing of changes in working capital items. Specifically, cash payments were higher in 2019 for interest expense, operating leases, maintenance expense, and compensation. This was partially offset by higher repair revenues and lower income tax payments in the current year.
Portfolio Investments and Capital Additions
Portfolio investments and capital additions primarily consist of purchases of operating assets, investments in affiliates, and capitalized asset improvements. Portfolio investments and capital additions of $722.8 million decreased $204.8 million compared to 2018, primarily due to fewer railcars acquired at Rail North America, including $204.2 million for the purchase of 2,832 railcars from ECN Capital Corporation in 2018, as well as lower equity investments in the RRPF affiliates at Portfolio Management. These decreases were partially offset by more railcars acquired at Rail International. The timing of investments depends on purchase commitments, transaction opportunities, and market conditions.
The following table shows portfolio investments and capital additions by segment for the years ended December 31 (in millions):
| 2019 | 2018 | 2017 | |||||||||||||||
| Rail North America | $ | 502.2 | $ | 737.4 | $ | 460.9 | |||||||||||
| Rail International | 215.7 | 152.7 | 90.9 | ||||||||||||||
| Portfolio Management | — | 14.1 | 36.6 | ||||||||||||||
| Other | 4.9 | 23.4 | 1.0 | ||||||||||||||
| Total | $ | 722.8 | $ | 927.6 | $ | 589.4 | |||||||||||
Additionally, portfolio investments and capital additions for discontinued operations were $18.9 million, $15.8 million, and $14.0 million for the years ended December 31, 2019, 2018, and 2017.
23
Portfolio Proceeds
Portfolio proceeds primarily consist of proceeds from sales of operating assets, loan and finance lease receipts, as well as capital distributions from affiliates. Portfolio proceeds of $250.3 million increased $15.9 million compared to 2018, primarily due to higher proceeds from railcar and locomotive sales at Rail North America. Portfolio proceeds included $46.8 million in 2017 associated with the exit of the majority of the marine assets at our Portfolio Management segment.
The following table shows portfolio proceeds for the years ended December 31 (in millions):
| 2019 | 2018 | 2017 | |||||||||||||||
Proceeds from sales of operating assets | $ | 239.6 | $ | 217.3 | $ | 145.9 | |||||||||||
Finance lease rents received, net of earned income | 8.4 | 9.7 | 11.3 | ||||||||||||||
Loan principal received | — | — | 5.4 | ||||||||||||||
Capital distributions and proceeds related to affiliates | 2.3 | 6.3 | 3.0 | ||||||||||||||
Other portfolio proceeds | — | 1.1 | — | ||||||||||||||
Total | $ | 250.3 | $ | 234.4 | $ | 165.6 | |||||||||||
Other Investing Activity
We purchased 49 railcars that were previously leased in 2019 compared to 3,412 railcars in 2018, and 3,970 railcars in 2017. Proceeds from sales of other assets for all periods were primarily related to railcar scrapping. Rail North America completed sale-leaseback financings for 467 railcars in 2018 and 699 railcars in 2017.
The following table shows other investing activity for the years ended December 31 (in millions):
| 2019 | 2018 | 2017 | |||||||||||||||
Purchases of assets previously leased | $ | (1.0) | $ | (66.6) | $ | (87.8) | |||||||||||
Proceeds from sales of other assets | 23.0 | 37.3 | 30.3 | ||||||||||||||
Proceeds from sale-leasebacks | — | 59.1 | 90.6 | ||||||||||||||
| Other | 2.7 | 3.1 | 0.4 | ||||||||||||||
Total | $ | 24.7 | $ | 32.9 | $ | 33.5 | |||||||||||
Additionally, other investing activity for discontinued operations was $27.0 million, $0.0 million, and $(24.0) million for the years ended December 31, 2019, 2018, and 2017.
24
Net Cash Provided by (Used in) Financing Activities
The following table shows net cash provided by (used) in financing activities for the years ended December 31 (in millions):
| 2019 | 2018 | 2017 | |||||||||||||||
Net proceeds from issuances of debt (original maturities longer than 90 days) | $ | 743.0 | $ | 693.7 | $ | 792.6 | |||||||||||
Repayments of debt (original maturities longer than 90 days) | (410.0) | (632.8) | (703.0) | ||||||||||||||
Net (decrease) increase in debt with original maturities of 90 days or less | (94.6) | 106.5 | (0.3) | ||||||||||||||
Payments on finance lease obligations | (11.3) | (1.2) | (1.3) | ||||||||||||||
Stock repurchases (1) | (150.0) | (115.5) | (100.0) | ||||||||||||||
Dividends | (69.3) | (69.3) | (68.2) | ||||||||||||||
Other | 59.1 | 4.7 | 0.8 | ||||||||||||||
Total | $ | 66.9 | $ | (13.9) | $ | (79.4) | |||||||||||
________
(1) During 2019, we repurchased 2.0 million shares of common stock for $150.0 million, compared to 1.5 million shares for $115.5 million in 2018 and 1.7 million shares for $100.0 million in 2017.
Cash Flows from Discontinued Operations
The following table shows cash flow information for our discontinued operations (in millions):
| Year Ended December 31 | |||||||||||||||||
| 2019 | 2018 | 2017 | |||||||||||||||
Net Cash Used in Operating Activities | $ | 36.8 | $ | 23.3 | $ | 42.5 | |||||||||||
Net Cash Provided By (Used In) Investing Activities | 8.1 | (15.8) | (38.0) | ||||||||||||||
Net Cash Provided By Financing Activities | (45.0) | (7.5) | (4.5) | ||||||||||||||
Cash Provided By Discontinued Operations, Net | $ | (0.1) | $ | — | $ | — | |||||||||||
25
LIQUIDITY AND CAPITAL RESOURCES
General
We fund our investments and meet our debt, lease, and dividend obligations, using our available cash balances, as well as cash generated from operating activities, sales of assets, commercial paper issuances, committed revolving credit facilities, distributions from affiliates, and issuances of secured and unsecured debt. We primarily use cash from operations to fund daily operations. We use both domestic and international capital markets and banks to meet our debt financing needs.
Contractual and Other Commercial Commitments
The following table shows our contractual commitments, including debt principal and related interest payments, lease payments, and purchase commitments at December 31, 2019 (in millions):
| Payments Due by Period | |||||||||||||||||||||||||||||||||||||||||
| Total | 2020 | 2021 | 2022 | 2023 | 2024 | Thereafter | |||||||||||||||||||||||||||||||||||
Recourse debt | $ | 4,813.9 | $ | 350.0 | $ | 600.0 | $ | 250.0 | $ | 250.0 | $ | 529.9 | $ | 2,834.0 | |||||||||||||||||||||||||||
Interest on recourse debt (1) | 1,897.9 | 180.4 | 168.6 | 147.9 | 136.5 | 124.3 | 1,140.2 | ||||||||||||||||||||||||||||||||||
Commercial paper and credit facilities | 15.8 | 15.8 | — | — | — | — | — | ||||||||||||||||||||||||||||||||||
Operating lease obligations | 508.2 | 65.8 | 64.2 | 56.2 | 54.2 | 49.8 | 218.0 | ||||||||||||||||||||||||||||||||||
Finance lease obligations, including interest | 7.9 | 7.9 | — | — | — | — | — | ||||||||||||||||||||||||||||||||||
Purchase commitments (2) | 1,838.3 | 737.8 | 362.4 | 365.3 | 372.8 | — | — | ||||||||||||||||||||||||||||||||||
Total | $ | 9,082.0 | $ | 1,357.7 | $ | 1,195.2 | $ | 819.4 | $ | 813.5 | $ | 704.0 | $ | 4,192.2 | |||||||||||||||||||||||||||
__________
(1) For floating rate debt, future interest payments are based on the applicable interest rate as of December 31, 2019.
(2) Primarily railcar purchase commitments. The amounts shown for all years are based on management's estimates of the timing, anticipated car types, and related costs of railcars to be purchased under its agreements.
In 2014, we entered into a long-term supply agreement with Trinity Rail Group, LLC ("Trinity") a subsidiary of Trinity Industries. Under the terms of that agreement, we agreed to order 8,950 newly built railcars. As of December 31, 2019, all 8,950 railcars have been ordered, of which 7,678 railcars have been delivered. On May 24, 2018, we amended our long-term supply agreement with Trinity to extend the term to December 2023, and we agreed to purchase an additional 4,800 tank cars (1,200 per year) beginning in January 2020 and continuing through the expiration of the extended term. At December 31, 2019, 1,128 railcars have been ordered pursuant to the amended terms of the agreement.
In 2018, we entered into a multi-year railcar supply agreement with American Railcar Industries, Inc. ("ARI"), pursuant to which we will purchase 7,650 newly built railcars. The order encompasses a mix of tank and freight cars that are to be delivered over a five-year period, beginning in April 2019. ARI's railcar manufacturing business was subsequently acquired by The Greenbrier Companies, Inc. ("Greenbrier") on July 26, 2019, and Greenbrier assumed all of ARI's obligations under our long-term supply agreement. Under this agreement, 450 railcars were to be delivered in 2019, with the remaining 7,200 to be delivered ratably over the four-year period of 2020 to 2023. As of December 31, 2019, 2,129 railcars have been ordered. The agreement also includes an option to order up to an additional 4,400 railcars subject to certain restrictions.
The following table shows our future contractual cash receipts arising from our direct finance leases and future rental receipts from noncancelable operating leases as of December 31, 2019 (in millions):
| Contractual Cash Receipts by Period | |||||||||||||||||||||||||||||||||||||||||
| Total | 2020 | 2021 | 2022 | 2023 | 2024 | Thereafter | |||||||||||||||||||||||||||||||||||
| Operating leases | $ | 3,139.1 | $ | 933.8 | $ | 721.7 | $ | 532.9 | $ | 399.3 | $ | 261.5 | $ | 289.9 | |||||||||||||||||||||||||||
| Finance leases | 84.4 | 19.7 | 13.7 | 21.9 | 7.2 | 7.7 | 14.2 | ||||||||||||||||||||||||||||||||||
| Total | $ | 3,223.5 | $ | 953.5 | $ | 735.4 | $ | 554.8 | $ | 406.5 | $ | 269.2 | $ | 304.1 | |||||||||||||||||||||||||||
26
Our aggregate future contractual cash receipts at December 31, 2019 decreased $124.5 million compared to 2018, primarily as a result of lease receipts in 2019, committed lease receipts associated with railcars sold in the current year, lower lease rates, and shortened lease terms for new leases and renewals completed during 2019 on existing railcars in the fleet, partially offset by the impact of the new railcars added to the fleet.
2020 Liquidity Outlook
In addition to our contractual obligations, expenditures in 2020 may also include the purchase of railcars that are currently leased and other discretionary capital spending for opportunistic asset purchases or strategic investments. We plan to fund these expenditures in 2020 using available cash at December 31, 2019 in combination with cash from operations, portfolio proceeds, long-term debt issuances, and our revolving credit facilities.
Short-Term Borrowings
We primarily use short-term borrowings as a source of working capital and to temporarily fund differences between our operating cash flows and portfolio proceeds, and our capital investments and debt maturities. We do not maintain or target any particular level of short-term borrowings on a permanent basis. Rather, we will temporarily utilize short-term borrowings at levels we deem appropriate until we decide to pay down these balances.
The following table shows additional information regarding our short-term borrowings:
| North America (1) | Europe (2) | ||||||||||||||||||||||||||||||||||
| 2019 | 2018 | 2017 | 2019 | 2018 | 2017 | ||||||||||||||||||||||||||||||
Balance as of December 31 (in millions) | $ | — | $ | 100.0 | $ | — | $ | 15.8 | $ | 10.8 | $ | 4.3 | |||||||||||||||||||||||
Weighted-average interest rate | — | % | 3.0 | % | — | % | 0.7 | % | 0.6 | % | 1.0 | % | |||||||||||||||||||||||
Euro/dollar exchange rate | n/a | n/a | n/a | 1.12 | 1.15 | 1.20 | |||||||||||||||||||||||||||||
Average daily amount outstanding during year (in millions) | $ | 25.6 | $ | 3.3 | $ | — | $ | 16.7 | $ | 3.8 | $ | 9.2 | |||||||||||||||||||||||
Weighted-average interest rate | 2.4 | % | 3.0 | % | — | % | 0.7 | % | 0.9 | % | 0.7 | % | |||||||||||||||||||||||
Average Euro/dollar exchange rate | n/a | n/a | n/a | 1.12 | 1.18 | 1.13 | |||||||||||||||||||||||||||||
Average daily amount outstanding during 4th quarter (in millions) | $ | 47.2 | $ | 13.0 | $ | — | $ | 19.9 | $ | 4.2 | $ | 12.0 | |||||||||||||||||||||||
Weighted-average interest rate | 2.1 | % | 3.0 | % | — | % | 0.7 | % | 0.8 | % | 0.6 | % | |||||||||||||||||||||||
Average Euro/dollar exchange rate | n/a | n/a | n/a | 1.11 | 1.14 | 1.18 | |||||||||||||||||||||||||||||
Maximum daily amount outstanding (in millions) | $ | 130.0 | $ | 100.0 | $ | — | $ | 161.1 | $ | 84.8 | $ | 78.2 | |||||||||||||||||||||||
Euro/dollar exchange rate | n/a | n/a | n/a | 1.11 | 1.13 | 1.18 | |||||||||||||||||||||||||||||
__________
(1)Short-term borrowings in North America are composed of commercial paper issued in the U.S.
(2)Short-term borrowings in Europe are composed of borrowings under bank credit facilities.
Credit Lines and Facilities
We have a $600 million, 5-year unsecured revolving credit facility in the U.S. that matures in May 2024. This credit facility contains two one-year extension options. As of December 31, 2019, the full $600 million was available under this facility. Additionally, we have a $250 million 3-year unsecured facility in the U.S. that matures in May 2022 and also has two one-year extension options. As of December 31, 2019, the full $250 million was available under this facility.
Our European subsidiaries have unsecured credit facilities with an aggregate limit of €35.0 million. As of December 31, 2019, €20.9 million was available under these credit facilities.
27
Restrictive Covenants
Our credit facility and certain other debt agreements contain various restrictive covenants. See "Note 7. Debt" in Item 8 of this Exhibit.
Credit Ratings
The global capital market environment and outlook may affect our funding options and our financial performance. Our access to capital markets at competitive rates depends on our credit rating and rating outlook, as determined by rating agencies. As of December 31, 2019, our long-term unsecured debt was rated BBB by Standard & Poor's and Baa2 by Moody’s Investor Service and our short-term unsecured debt was rated A-2 by Standard & Poor's and P-2 by Moody’s Investor Service. Our rating outlook from both agencies was stable.
Shelf Registration Statement
During 2019, we filed an automatic shelf registration statement that enables us to issue debt securities and pass-through certificates. The registration statement is effective for three years and does not limit the amount of debt securities and pass-through certificates we can issue.
Commercial Commitments
We have entered into various commercial commitments, including standby letters of credit and performance bonds, related to certain transactions. These commercial commitments require us to fulfill specific obligations in the event of third-party demands. Similar to our balance sheet investments, these commitments expose us to credit, market, and equipment risk. Accordingly, we evaluate these commitments and other contingent obligations using techniques similar to those we use to evaluate funded transactions.
The following table shows our commercial commitments at December 31, 2019 (in millions):
| Amount of Commitment Expiration by Period | |||||||||||||||||||||||||||||||||||||||||
| Total | 2020 | 2021 | 2022 | 2023 | 2024 | Thereafter | |||||||||||||||||||||||||||||||||||
| Standby letters of credit and performance bonds | $ | 9.3 | $ | 9.2 | $ | 0.1 | $ | — | $ | — | $ | — | $ | — | |||||||||||||||||||||||||||
We are parties to standby letters of credit and performance bonds, which primarily relate to contractual obligations and general liability insurance coverages. No material claims have been made against these obligations, and no material losses are anticipated.
Defined Benefit Plan Contributions
In 2019, we contributed $4.8 million to our defined benefit pension plans and other post-retirement benefit plans. In 2020, we expect to contribute approximately $6.2 million. As of December 31, 2019, our funded pension plans were 100.0% funded in aggregate. Additional contributions will depend primarily on plan asset investment returns and actuarial experience, and subject to the impact of these factors, we may make additional material plan contributions.
Separately, the shipboard personnel at ASC participate in various multiemployer benefit plans that provide pension, health care, and post-retirement and other benefits to active and retired employees. We contributed $9.1 million to these plans in 2019 and recognized that amount as marine operating expense. See "Note 10. Pension and Other Post-Retirement Benefits" in Item 8 of this Form 10-K for additional information on our benefit plans. On February 7, 2020, we entered into an agreement to sell ASC. On May 14, 2020, we completed the sale of our ASC business, subject to customary post-closing adjustments. See "Note 26. Discontinued Operations" in Item 8 of this Exhibit for additional information.
28
GATX Common Stock Repurchases
On January 25, 2019, our board of directors ("Board") approved a $300 million share repurchase program, pursuant to which we are authorized to purchase shares of our common stock in the open market, in privately negotiated transactions, or otherwise, including pursuant to Rule 10b5-1 plans. The share repurchase program does not have an expiration date, does not obligate the Company to repurchase any dollar amount or number of shares of common stock, and may be suspended or discontinued at any time. The timing of share repurchases will be dependent on market conditions and other factors. During 2019, we repurchased 2.0 million shares for $150.0 million, excluding commissions, under the program, compared to 1.5 million shares for $115.4 million in 2018 and 1.7 million shares for $100.0 million in 2017 under the prior repurchase program. As of December 31, 2019, $150.0 million remained available under the repurchase authorization.
CRITICAL ACCOUNTING POLICIES AND ESTIMATES
We prepare our consolidated financial statements in conformity with GAAP, which requires us to use judgment in making estimates and assumptions that affect reported amounts of assets, liabilities, revenues, and expenses, as well as information in the related disclosures. We regularly evaluate our estimates and judgments based on historical experience, market indicators, and other relevant factors and circumstances. Actual results may differ from these estimates under different assumptions or conditions.
Operating Assets
We state operating assets, including assets acquired under finance leases, at cost and depreciate them over their estimated economic useful lives to an estimated residual value using the straight-line method. We determine the economic useful life based on our estimate of the period over which the asset will generate revenue. For the majority of our operating assets, the economic useful life is greater than 30 years. The residual values are based on historical experience and economic factors. We periodically review the appropriateness of our estimates of useful lives and residual values based on changes in economic circumstances and other factors. Changes in these estimates would result in a change in future depreciation expense.
Lease Classification
We analyze all new and modified leases to determine whether we should classify the lease as an operating or finance lease. Our lease classification analysis relies on certain assumptions that require judgment, such as the asset's fair value, the asset's estimated residual value, the interest rate implicit in the lease, and the asset's economic useful life. While most of our leases are classified as operating leases, changes in the assumptions we use could result in a different lease classification, which could change the impacts of the lease transactions on our results of operations and financial position. See "Note 5. Leases" in Item 8 of this Exhibit.
Impairment of Long-Lived Assets
We review long-lived assets, such as operating assets, right-of-use assets, and facilities, for impairment annually, or whenever circumstances indicate that the carrying amount of those assets may not be recoverable. We evaluate the recoverability of assets to be held and used by comparing the carrying amount of the asset to the undiscounted future net cash flows we expect the asset to generate. We base estimated future cash flows on a number of assumptions, including lease rates, lease term (including renewals), freight rates and volume, operating costs, the life of the asset, and final disposition proceeds. If we determine an asset is impaired, we recognize an impairment loss equal to the amount by which the carrying amount exceeds the asset’s fair value. We classify assets we plan to sell or otherwise dispose of as held for sale, provided they meet specified accounting criteria, and we record those assets at the lower of their carrying amount or fair value less costs to sell. See "Note 9. Asset Impairments and Assets Held for Sale" in Item 8 of this Exhibit.
Impairment of Investments in Affiliated Companies
We review the carrying amount of our investments in affiliates annually, or whenever circumstances indicate that their value may have declined. If management determines that indicators of impairment are present for an investment, we perform an analysis to estimate the fair value of that investment. Active markets do not typically exist for our affiliate investments and as a result, we may estimate fair value using a discounted cash flow analysis at the investee level, price-earnings ratios based on comparable businesses, or other valuation techniques that are appropriate for the particular circumstances of the affiliate. For all fair value estimates, we use observable inputs whenever possible and appropriate.
29
Once we make an estimate of fair value, we compare the estimate of fair value to the investment’s carrying value. If the investment’s estimated fair value is less than its carrying value, then we consider the investment impaired. If an investment is impaired, we assess whether the impairment is other-than-temporary. We consider factors such as the expected operating results for the near future, the length of the economic life cycle of the underlying assets of the investee, and our ability to hold the investment through the end of the underlying assets’ useful life to determine if the impairment is other-than-temporary. We may also consider actions we anticipate the investee will take to improve its business prospects if it seems probable the investee will take those actions. If we determine an investment to be only temporarily impaired, we do not record an impairment loss. Alternatively, if we determine an impairment is other-than-temporary, we record a loss equal to the difference between the estimated fair value of the investment and its carrying value. See "Note 6. Investments in Affiliated Companies" and "Note 9. Asset Impairments and Assets Held for Sale" in Item 8 of this Exhibit.
Impairment of Goodwill
We review the carrying amount of our goodwill annually, or if circumstances indicate an impairment may have occurred. We perform the impairment review at the reporting unit level, which is one level below an operating segment. The goodwill impairment test is a two-step process and requires us to make certain judgments to determine the assumptions we use in the calculation. The first step requires us to estimate the fair value of each reporting unit, which we determine using a discounted cash flow model. We base our estimates of the future cash flows on revenue and expense forecasts and include assumptions for future growth. When estimating the fair value of the reporting unit, we also consider observable multiples of book value and earnings for companies that we believe are comparable to the applicable reporting units. We then compare our estimate of the fair value of the reporting unit with the reporting unit’s carrying amount, which includes goodwill. If the estimated fair value is less than the carrying amount, we compare the implied fair value of the reporting unit’s goodwill with the carrying amount of the goodwill. If the carrying amount of the goodwill exceeds its implied fair value, we record an impairment loss for the amount the carrying amount of the goodwill exceeds its implied fair value. See "Note 16. Goodwill" in Item 8 of this Exhibit.
Pension and Post-Retirement Benefits Assumptions
We use actuarial assumptions to calculate pension and other post-retirement benefit obligations and related costs. The discount rate and the expected return on plan assets are two assumptions that influence the plan expense and liability measurement. Other assumptions involve demographic factors such as expected retirement age, mortality, employee turnover, health care cost trends, and the rate of compensation increases.
We use a discount rate to calculate the present value of expected future pension and post-retirement cash flows as of the measurement date. The discount rate is based on yields for high-quality, long-term bonds with durations similar to the projected benefit obligation. We base the expected long-term rate of return on plan assets on current and expected asset allocations, as well as historical and expected returns on various categories of plan assets. We evaluate these assumptions annually and make adjustments as required in accordance with changes in underlying market conditions, valuation of plan assets, or demographics. Changes in these assumptions may increase or decrease periodic benefit plan expense as well as the carrying value of benefit plan obligations. See "Note 10. Pension and Other Post-Retirement Benefits" in Item 8 of this Exhibit for additional information regarding these assumptions.
Share-Based Compensation
We grant equity awards to certain employees and non-employee directors in the form of non-qualified stock options, stock appreciation rights, restricted stock, performance shares, and phantom stock. We recognize compensation expense for our equity awards over the applicable service period for each award, based on the award’s grant date fair value. We use the Black-Scholes options valuation model to calculate the grant date fair value of stock options and stock appreciation rights. This model requires us to make certain assumptions that affect the amount of compensation expense we will record. The assumptions we use in the model include the expected stock price volatility (based on the historical volatility of our stock price), the risk-free interest rate (based on the treasury yield curve), the expected life of the equity award (based on historical exercise patterns and post-vesting termination behavior), and the dividend equivalents we expect to pay during the estimated life of the equity award since our stock options and stock appreciation rights are dividend participating. We base the fair value of other equity awards on our stock price on the grant date. We recognize forfeitures when they occur. See "Note 11. Share-Based Compensation" in Item 8 of this Exhibit.
30
Income Taxes
Our operations are subject to taxes in the United States, various states, and foreign countries, and as a result, we may be subject to audit in all of these jurisdictions. Tax audits may involve complex issues and disagreements with taxing authorities that could require several years to resolve. GAAP requires that we presume the relevant tax authority will examine uncertain income tax positions. We must determine whether, based on the technical merits of our position, it is more likely than not that our uncertain income tax positions will be sustained by taxing authorities upon examination, which may include related appeals or litigation processes. We must then evaluate income tax positions that meet the "more likely than not" recognition threshold to determine the probable amount of benefit we would recognize in the financial statements. Establishing accruals for uncertain tax benefits requires us to make estimates and assessments with respect to the ultimate outcome of tax audit issues for amounts recorded in the financial statements. The ultimate resolution of uncertain tax benefits may differ from our estimates, potentially impacting our financial position, results of operations, or cash flows.
We evaluate the need for a deferred tax asset valuation allowance by assessing the likelihood that we will realize tax assets, including net operating loss and tax credit carryforward benefits. Our assessment of whether a valuation allowance is required involves judgment, including forecasting future taxable income and evaluating tax planning initiatives, if applicable.
We expect to continue to reinvest foreign earnings outside the United States indefinitely. If future earnings are repatriated to the United States, or if we expect such earnings to be repatriated, a provision for additional taxes may be required. Under provisions of the Tax Act, the territorial tax system will generally exempt such repatriated earnings from further United States income taxation, however, incremental income taxes may occur from withholding taxes, foreign exchange gains, or other taxable gains recognized in connection with tax basis differences in our foreign investments. The ultimate tax cost of repatriating such earnings will depend on tax laws in effect and other circumstances at that time. See "Note 12. Income Taxes" in Item 8 of this Exhibit for additional information on income taxes.
NEW ACCOUNTING PRONOUNCEMENTS
See "Note 2. Accounting Changes" in Item 8 of this Exhibit for a summary of new accounting pronouncements that may impact our business.
NON-GAAP FINANCIAL MEASURES
In addition to financial results reported in accordance with GAAP, we compute certain financial measures using non-GAAP components, as defined by the SEC. These measures are not in accordance with, or a substitute for, GAAP, and our financial measures may be different from non-GAAP financial measures used by other companies. We have provided a reconciliation of our non-GAAP components to the most directly comparable GAAP components.
Reconciliation of Non-GAAP Components Used in the Computation of Certain Financial Measures
Net Income Measures
We exclude the effects of certain tax adjustments and other items for purposes of presenting net income, diluted earnings per share, and return on equity because we believe these items are not attributable to our business operations. Management utilizes net income, excluding tax adjustments and other items, when analyzing financial performance because such amounts reflect the underlying operating results that are within management’s ability to influence. Accordingly, we believe presenting this information provides investors and other users of our financial statements with meaningful supplemental information for purposes of analyzing year-to-year financial performance on a comparable basis and assessing trends.
The following tables show our net income, diluted earnings per share, and return on equity, excluding tax adjustments and other items for the years ended December 31 (in millions, except per share data):
31
| Impact of Tax Adjustments and Other Items on Net Income: | |||||||||||||||||||||||||||||
| 2019 | 2018 | 2017 | 2016 | 2015 | |||||||||||||||||||||||||
| Net income (GAAP) | $ | 211.2 | $ | 211.3 | $ | 502.0 | $ | 257.1 | $ | 205.3 | |||||||||||||||||||
| Less: Net income from discontinued operations (GAAP) | 30.4 | 20.8 | 34.2 | n/a | n/a | ||||||||||||||||||||||||
| Net income from continuing operations (GAAP) | $ | 180.8 | $ | 190.5 | $ | 467.8 | $ | 257.1 | $ | 205.3 | |||||||||||||||||||
| Adjustments attributable to pre-tax income from continuing operations: | |||||||||||||||||||||||||||||
| Cost attributable to the closure of a maintenance facility at Rail International (1) | — | 9.5 | — | — | — | ||||||||||||||||||||||||
| Net gain on wholly owned Portfolio Management marine investments (2) | — | — | (1.8) | 2.5 | 9.2 | ||||||||||||||||||||||||
| Railcar impairment at Rail North America (3) | — | — | — | 29.8 | — | ||||||||||||||||||||||||
| Residual sharing settlement at Portfolio Management (4) | — | — | — | (49.1) | — | ||||||||||||||||||||||||
| Early retirement program (5) | — | — | — | — | 9.0 | ||||||||||||||||||||||||
| Total adjustments attributable to pre-tax income from continuing operations | $ | — | $ | 9.5 | $ | (1.8) | $ | (16.8) | $ | 18.2 | |||||||||||||||||||
| Income taxes thereon, based on applicable effective tax rate | $ | — | $ | (3.1) | $ | 0.7 | $ | 7.2 | $ | (6.9) | |||||||||||||||||||
| Other income tax adjustments attributable to income from continuing operations: | |||||||||||||||||||||||||||||
| Income tax rate changes (6) | (2.8) | — | — | — | 14.1 | ||||||||||||||||||||||||
| Impact of the Tax Act (7) | — | (16.7) | (293.2) | — | — | ||||||||||||||||||||||||
| Foreign tax credit utilization (8) | — | (1.4) | — | (7.1) | — | ||||||||||||||||||||||||
| Total other income tax adjustments attributable to income from continuing operations | $ | (2.8) | $ | (18.1) | $ | (293.2) | $ | (7.1) | $ | 14.1 | |||||||||||||||||||
| Adjustments attributable to affiliates' earnings from continuing operations, net of taxes: | |||||||||||||||||||||||||||||
| Net (gain) loss on Portfolio Management marine affiliate (2) | — | — | — | (0.6) | 11.9 | ||||||||||||||||||||||||
| Income tax rate changes (9) | — | — | — | (3.9) | (7.7) | ||||||||||||||||||||||||
| Total adjustments attributable to affiliates' earnings, net of taxes | $ | — | $ | — | $ | — | $ | (4.5) | $ | 4.2 | |||||||||||||||||||
| Net income from continuing operations, excluding tax adjustments and other items (non-GAAP) | $ | 178.0 | $ | 178.8 | $ | 173.5 | $ | 235.9 | $ | 234.9 | |||||||||||||||||||
| Adjustments attributable to discontinued operations, net of taxes: | |||||||||||||||||||||||||||||
| Net casualty gain at ASC (10) | (8.1) | — | — | n/a | n/a | ||||||||||||||||||||||||
| Impact of the Tax Act (7) | — | 0.2 | (22.7) | n/a | n/a | ||||||||||||||||||||||||
| Total adjustments attributable to discontinued operations, net of taxes | $ | (8.1) | $ | 0.2 | $ | (22.7) | n/a | n/a | |||||||||||||||||||||
| Net income from discontinued operations, excluding tax adjustments and other items (non-GAAP) | $ | 22.3 | $ | 21.0 | $ | 11.5 | n/a | n/a | |||||||||||||||||||||
| Net income from consolidated operations, excluding tax adjustments and other items (non-GAAP) | $ | 200.3 | $ | 199.8 | $ | 185.0 | $ | 235.9 | $ | 234.9 | |||||||||||||||||||
32
| Impact of Tax Adjustments and Other Items on Diluted Earnings per Share: | |||||||||||||||||||||||||||||
| 2019 | 2018 | 2017 | 2016 | 2015 | |||||||||||||||||||||||||
| Diluted earnings per share from consolidated operations (GAAP) | $ | 5.81 | $ | 5.52 | $ | 12.75 | $ | 6.29 | $ | 4.69 | |||||||||||||||||||
| Less: Diluted earnings per share from discontinued operations (GAAP) | 0.84 | 0.54 | 0.87 | n/a | n/a | ||||||||||||||||||||||||
| Diluted earnings per share from continuing operations (GAAP) | $ | 4.97 | $ | 4.98 | $ | 11.88 | $ | 6.29 | $ | 4.69 | |||||||||||||||||||
| Adjustments attributable to income from continuing operations, net of taxes: | |||||||||||||||||||||||||||||
| Cost attributable to the closure of a maintenance facility at Rail International (1) | — | 0.17 | — | — | — | ||||||||||||||||||||||||
| Net (gain) loss on wholly owned Portfolio Management marine investments (2) | — | — | (0.03) | 0.04 | 0.13 | ||||||||||||||||||||||||
| Railcar impairment at Rail North America (3) | — | — | — | 0.47 | — | ||||||||||||||||||||||||
| Residual sharing settlement at Portfolio Management (4) | — | — | — | (0.74) | — | ||||||||||||||||||||||||
| Early retirement program (5) | — | — | — | — | 0.13 | ||||||||||||||||||||||||
| Income tax rate changes (6) | (0.08) | — | — | — | 0.32 | ||||||||||||||||||||||||
| Impact of the Tax Act (7) | — | (0.44) | (7.44) | — | — | ||||||||||||||||||||||||
| Foreign tax credit utilization (8) | — | (0.04) | — | (0.17) | — | ||||||||||||||||||||||||
| Adjustments attributable to affiliates' earnings from continuing operations, net of taxes: | |||||||||||||||||||||||||||||
| Net (gain) loss on wholly owned Portfolio Management marine investments (2) | — | — | — | (0.02) | 0.27 | ||||||||||||||||||||||||
| Income tax rate changes (9) | — | — | — | (0.10) | (0.18) | ||||||||||||||||||||||||
| Diluted earnings per share from continuing operations, excluding tax adjustments and other items (non-GAAP) * | $ | 4.89 | $ | 4.67 | $ | 4.41 | $ | 5.77 | $ | 5.37 | |||||||||||||||||||
| Adjustments attributable to discontinued operations, net of taxes: | |||||||||||||||||||||||||||||
| Net casualty gain at ASC (10) | (0.22) | — | — | n/a | n/a | ||||||||||||||||||||||||
| Impact of the Tax Act (7) | — | 0.01 | (0.58) | n/a | n/a | ||||||||||||||||||||||||
| Diluted earnings per share from discontinued operations, excluding tax adjustments and other items (non-GAAP) | $ | 0.62 | $ | 0.55 | $ | 0.29 | n/a | n/a | |||||||||||||||||||||
| Diluted earnings per share from consolidated operations, excluding tax adjustments and other items (non-GAAP) * | $ | 5.51 | $ | 5.22 | $ | 4.70 | $ | 5.77 | $ | 5.37 | |||||||||||||||||||
*bSum of individual components may not be additive due to rounding.
Note: The information for 2016 and 2015 in the tables above has not been recast for discontinued operations presentation.
_______
(1) Expenses related to the closure of a maintenance facility.
(2) In 2015, we made the decision to exit the majority of our non-core, marine investments within our Portfolio Management segment. As a result, we recorded gains and losses associated with the impairments and sales of certain investments.
(3) Impairment losses related specifically to certain railcars in flammable service that we believe have been permanently and negatively impacted by regulatory changes.
(4) Income recognized from the settlement of a residual sharing agreement related to a residual guarantee we provided on certain rail assets.
(5) Expenses associated with an early retirement program offered to certain eligible employees.
(6) Deferred income tax adjustments due to an enacted corporate income tax rate decrease in Alberta, Canada in 2019 and an increase of our effective state income tax rate in 2015.
(7) Amounts attributable to the impact of corporate income tax changes enacted by the Tax Act.
(8) Benefits attributable to the utilization of foreign tax credits.
(9) Deferred income tax adjustments due to enacted statutory rate decreases in the United Kingdom for each of 2016 and 2015.
(10) Net casualty gain attributable to insurance recovery for a vessel at ASC.
33
| 2019 | 2018 | 2017 | 2016 | 2015 | |||||||||||||||||||||||||
| Return on Equity (GAAP) | 11.7 | % | 11.8 | % | 32.0 | % | 19.6 | % | 15.8 | % | |||||||||||||||||||
| Return on Equity, excluding tax adjustments and other items (non-GAAP) (1) | 13.5 | % | 13.6 | % | 13.1 | % | 18.0 | % | 18.1 | % | |||||||||||||||||||
_______
(1) Shareholders' equity used in this calculation for 2019, 2018 and 2017 excludes the increases resulting from the impact of the Tax Act, as described above.
Balance Sheet Measures
A portion of our North American railcar fleet is financed through sale-leasebacks that are accounted for as operating leases. Prior to 2019, these railcar assets were not recorded on the balance sheet. Under the new lease accounting standard adopted on January 1, 2019, GATX records these railcar operating leases on the balance sheet as right-of-use assets with corresponding amounts for operating lease liabilities. Similarly, ASC's fleet previously included vessels that were accounted for as operating leases and were not recorded on the balance sheet.
Prior to 2019, we reported total on- and off-balance sheet assets in our calculation of total assets (as adjusted) because we believed it provided investors a more comprehensive representation of the magnitude of the assets we operated and that drove our financial performance. In addition, this calculation of total assets (as adjusted) provided consistency with other non-financial information we disclosed about our fleet, including the number of railcars in the fleet, average number of cars on lease, and utilization. We also provide information regarding our leverage ratios, which are expressed as a ratio of debt (including off-balance sheet debt) to equity. The off-balance sheet debt amount in this calculation was the equivalent of the off-balance sheet asset amount. We believe reporting this corresponding off-balance sheet debt amount provided investors and other users of our financial statements with a more comprehensive representation of our debt obligations, leverage, and capital structure. Because the railcar operating lease assets and associated liabilities are now recorded on the balance sheet, beginning in 2019, the prior non-GAAP measure is no longer necessary in order to convey the full magnitude of our asset base.
The following table shows total assets as of December 31 (in millions):
| 2019 | 2018 | 2017 | 2016 | 2015 | |||||||||||||||||||||||||
| Total assets (GAAP) | $ | 8,285.1 | $ | 7,616.7 | $ | 7,422.4 | $ | 7,105.4 | $ | 6,894.2 | |||||||||||||||||||
| Off-balance sheet assets (1): | |||||||||||||||||||||||||||||
Rail North America | — | 430.2 | 435.7 | 456.5 | 488.7 | ||||||||||||||||||||||||
| Discontinued operations | — | — | — | 2.6 | 6.8 | ||||||||||||||||||||||||
| Total off-balance sheet assets | $ | — | $ | 430.2 | $ | 435.7 | $ | 459.1 | $ | 495.5 | |||||||||||||||||||
| Total assets, as adjusted (non-GAAP) | $ | 8,285.1 | $ | 8,046.9 | $ | 7,858.1 | $ | 7,564.5 | $ | 7,389.7 | |||||||||||||||||||
| Shareholders’ Equity (GAAP) | $ | 1,835.1 | $ | 1,788.1 | $ | 1,792.7 | $ | 1,347.2 | $ | 1,280.2 | |||||||||||||||||||
_______
(1) Off-balance sheet assets apply to each of the years 2018 and prior. In accordance with the new lease accounting standard, off-balance sheet assets are no longer applicable beginning in 2019.
34
The following table shows the components of recourse leverage as of December 31 (in millions, except recourse leverage ratio):
| 2019 | 2018 | 2017 | 2016 | 2015 | |||||||||||||||||||||||||
| Debt and lease obligations, net of unrestricted cash: | |||||||||||||||||||||||||||||
Unrestricted cash | $ | (151.0) | $ | (100.2) | $ | (296.5) | $ | (307.5) | $ | (202.4) | |||||||||||||||||||
Commercial paper and bank credit facilities | 15.8 | 110.8 | 4.3 | 3.8 | 7.4 | ||||||||||||||||||||||||
Recourse debt | 4,780.4 | 4,429.7 | 4,371.7 | 4,253.2 | 4,171.5 | ||||||||||||||||||||||||
Nonrecourse debt | — | — | — | — | 6.9 | ||||||||||||||||||||||||
Operating lease obligations | 432.3 | — | — | — | — | ||||||||||||||||||||||||
Finance lease obligations | 7.9 | 11.3 | 12.5 | 14.9 | 18.4 | ||||||||||||||||||||||||
| Total debt and lease obligations, net of unrestricted cash (GAAP) | 5,085.4 | 4,451.6 | 4,092.0 | 3,964.4 | 4,001.8 | ||||||||||||||||||||||||
| Off-balance sheet recourse debt (1) | — | 430.2 | 435.7 | 459.1 | 495.5 | ||||||||||||||||||||||||
| Total debt and lease obligations, net of unrestricted cash, as adjusted (non-GAAP) | $ | 5,085.4 | $ | 4,881.8 | $ | 4,527.7 | $ | 4,423.5 | $ | 4,497.3 | |||||||||||||||||||
| Total recourse debt (2) | $ | 5,085.4 | $ | 4,881.8 | $ | 4,527.7 | $ | 4,423.5 | $ | 4,490.4 | |||||||||||||||||||
| Shareholders' Equity (3) | $ | 1,835.1 | $ | 1,788.1 | $ | 1,792.7 | $ | 1,347.2 | $ | 1,280.2 | |||||||||||||||||||
| Recourse Leverage (4) | 2.8 | 2.7 | 2.5 | 3.3 | 3.5 | ||||||||||||||||||||||||
________
(1) Off-balance sheet recourse debt applies to each of the years 2018 and prior. In accordance with the new lease accounting standard, off-balance sheet recourse debt is no longer applicable beginning in 2019.
(2) Includes on- and off-balance sheet recourse debt, commercial paper and bank credit facilities, and operating and finance lease obligations, net of unrestricted cash.
(3) Balances for 2019, 2018 and 2017 reflect increases in shareholders' equity resulting from the impact of the Tax Act.
(4) Calculated as total recourse debt / shareholder's equity. The reduction in recourse leverage beginning with 2017 is due to the increase in shareholders' equity resulting from the impact of the Tax Act.
35
Item 8. Financial Statements and Supplementary Data
INDEX TO CONSOLIDATED FINANCIAL STATEMENTS AND NOTES
| Page | |||||
36
Report of Independent Registered Public Accounting Firm on Financial Statements
To the Shareholders and the Board of Directors of GATX Corporation
Opinion on the Financial Statements
We have audited the accompanying consolidated balance sheets of GATX Corporation and subsidiaries (the Company) as of December 31, 2019 and 2018, the related consolidated statements of comprehensive income, changes in shareholders’ equity and cash flows for each of the three years in the period ended December 31, 2019, and the related notes (collectively referred to as the “consolidated financial statements”). In our opinion, the consolidated financial statements present fairly, in all material respects, the financial position of the Company as of December 31, 2019 and 2018, and the results of its operations and its cash flows for each of the three years in the period ended December 31, 2019, in conformity with U.S. generally accepted accounting principles.
We also have audited, in accordance with the standards of the Public Company Accounting Oversight Board (United States) (PCAOB), the Company’s internal control over financial reporting as of December 31, 2019, based on criteria established in Internal Control – Integrated Framework issued by the Committee of Sponsoring Organizations of the Treadway Commission (2013 framework) and our report dated February 19, 2020 expressed an unqualified opinion thereon.
Basis for Opinion
These financial statements are the responsibility of the Company’s management. Our responsibility is to express an opinion on the Company’s financial statements based on our audits. We are a public accounting firm registered with the PCAOB and are required to be independent with respect to the Company in accordance with the U.S. federal securities laws and the applicable rules and regulations of the Securities and Exchange Commission and the PCAOB.
We conducted our audits in accordance with the standards of the PCAOB. Those standards require that we plan and perform the audit to obtain reasonable assurance about whether the financial statements are free of material misstatement, whether due to error or fraud. Our audits included performing procedures to assess the risks of material misstatement of the financial statements, whether due to error or fraud, and performing procedures that respond to those risks. Such procedures included examining, on a test basis, evidence regarding the amounts and disclosures in the financial statements. Our audits also included evaluating the accounting principles used and significant estimates made by management, as well as evaluating the overall presentation of the financial statements. We believe that our audits provide a reasonable basis for our opinion.
Critical Audit Matters
The critical audit matters communicated below are matters arising from the current period audit of the financial statements that were communicated or required to be communicated to the audit committee and that: (1) relate to accounts or disclosures that are material to the financial statements and (2) involved our especially challenging, subjective or complex judgments. The communication of the critical audit matters does not alter in any way our opinion on the consolidated financial statements, taken as a whole, and we are not, by communicating the critical audit matters below, providing separate opinions on the critical audit matters or on the accounts or disclosures to which they relate.
| Defined Benefit Pension Obligation | |||||
| Description of the Matter | At December 31, 2019, the aggregate defined benefit pension obligation was $475.4 million, and the fair value of pension plan assets was $432.7 million, resulting in an unfunded defined benefit pension obligation of $42.7 million. As described in Note 10 to the consolidated financial statements, the Company updated the estimates used to measure the defined benefit pension obligation and plan assets as of December 31, 2019 to reflect the actual return on plan assets and updated actuarial assumptions Auditing the defined benefit pension obligation was complex and required the involvement of specialists due to the judgmental nature of the actuarial assumptions used in the measurement process, including the discount rate, expected return on plan assets, and mortality rate. These assumptions have a significant effect on the projected benefit obligation. | ||||
37
| How We Addressed the Matter in Our Audit | We tested controls that address the risks of material misstatement relating to the measurement and valuation of the defined benefit pension obligation. For example, we tested controls over management’s review of the defined benefit pension obligation calculations and the significant actuarial assumptions discussed above. To test the defined benefit pension obligation, our audit procedures included, among others, evaluating the methodology used, the significant actuarial assumptions discussed above, and the underlying data used by the Company. For example, we compared the actuarial assumptions used by management to historical trends and evaluated the change in the defined benefit pension obligation from prior year due to the change in service cost, interest cost, actuarial gains and losses, benefit payments, contributions and other activities. In addition, we evaluated management’s methodology for determining the discount rate that reflects the maturity and duration of the benefit payments and is used to measure the defined benefit pension obligation. As part of this assessment, we compared the projected cash flows to prior year and compared the current year benefits paid to the prior year projected cash flows. We also tested the completeness and accuracy of the underlying data, including the participant data used in the defined benefit obligation calculations. To evaluate the expected return on plan assets, we assessed whether management’s assumptions were consistent with a range of returns for a portfolio of comparative investments. We also evaluated the assumptions used for the mortality rate to assess whether the information is consistent with publicly available information, and whether any market data adjusted for entity-specific adjustments were applied. We involved an actuarial specialist to assist with our procedures. | ||||
Impairment of Long-Lived Assets | |||||
| Description of the Matter | As described in Notes 3 and 9 to the consolidated financial statements, the Company reviews long-lived assets for impairment annually, or if circumstances indicate that the carrying amount of those assets may not be recoverable. The Company evaluates the recoverability of assets to be held and used by comparing the carrying amount of the asset to the undiscounted future net cash flows the asset is expected to generate. If the Company determines that an asset is impaired, an impairment loss is recognized equal to the excess of the asset’s carrying amount over its fair value. Auditing management’s evaluation of long-lived assets for impairment involved subjectivity due to the significant estimation required to determine the undiscounted future net cash flows for assets with indicators of potential impairment. In particular, these estimates are sensitive to significant assumptions, including lease rates, operating costs, the life of the asset, and final disposition proceeds, which can be affected by expectations about future market or economic conditions. | ||||
| How We Addressed the Matter in Our Audit | We obtained an understanding, evaluated the design and tested the operating effectiveness of controls over the Company’s long-lived asset impairment review process, including controls over management’s review of the significant assumptions discussed above. To test the Company’s long-lived asset impairment review process, we performed audit procedures that included, among others, assessing the methodologies used, evaluating the significant assumptions discussed above and testing the completeness and accuracy of the underlying data used by the Company in its analysis. We assessed the historical accuracy of management’s estimates, and we compared certain significant assumptions used by management to current industry and economic trends and evaluated whether changes to the Company’s business and other relevant factors would affect those significant assumptions. | ||||
/s/ Ernst & Young LLP
We have served as the Company’s auditor since 1916.
Chicago, Illinois
February 19, 2020
except for the effects of presenting American Steamship Company as discontinued operations discussed in Note 26 and subsequent events discussed in Note 25, as to which the date is
November 6, 2020
38
GATX CORPORATION AND SUBSIDIARIES
CONSOLIDATED BALANCE SHEETS
(In millions, except share data)
| December 31 | |||||||||||
| 2019 | 2018 | ||||||||||
Assets | |||||||||||
Cash and Cash Equivalents | $ | 151.0 | $ | 100.1 | |||||||
Restricted Cash | — | 6.5 | |||||||||
Receivables | |||||||||||
Rent and other receivables | 65.9 | 65.3 | |||||||||
Finance leases (as lessor) | 90.3 | 126.4 | |||||||||
Less: allowance for losses | (6.2) | (6.4) | |||||||||
| 150.0 | 185.3 | ||||||||||
Operating Assets and Facilities | 9,523.5 | 9,171.9 | |||||||||
Less: allowance for depreciation | (3,066.2) | (2,896.3) | |||||||||
| 6,457.3 | 6,275.6 | ||||||||||
Lease Assets (as lessee) | |||||||||||
Right-of-use assets, net of accumulated depreciation | 411.7 | — | |||||||||
Finance leases, net of accumulated depreciation | 8.9 | 16.8 | |||||||||
| 420.6 | 16.8 | ||||||||||
Investments in Affiliated Companies | 512.6 | 464.5 | |||||||||
Goodwill | 81.5 | 82.9 | |||||||||
Other Assets | 221.0 | 187.2 | |||||||||
Assets of Discontinued Operations | 291.1 | 297.8 | |||||||||
Total Assets | $ | 8,285.1 | $ | 7,616.7 | |||||||
Liabilities and Shareholders’ Equity | |||||||||||
Accounts Payable and Accrued Expenses | $ | 119.4 | $ | 153.1 | |||||||
Debt | |||||||||||
Commercial paper and borrowings under bank credit facilities | 15.8 | 110.8 | |||||||||
Recourse | 4,780.4 | 4,429.7 | |||||||||
| 4,796.2 | 4,540.5 | ||||||||||
Lease Obligations (as lessee) | |||||||||||
Operating leases | 429.4 | — | |||||||||
Finance leases | 7.9 | 11.3 | |||||||||
| 437.3 | 11.3 | ||||||||||
Deferred Income Taxes | 888.5 | 841.8 | |||||||||
Other Liabilities | 139.1 | 220.3 | |||||||||
Liabilities of Discontinued Operations | 69.5 | 61.6 | |||||||||
Total Liabilities | 6,450.0 | 5,828.6 | |||||||||
Shareholders’ Equity | |||||||||||
Common stock, $0.625 par value: Authorized shares — 120,000,000 Issued shares — 67,536,794 and 67,329,081 Outstanding shares — 34,833,037 and 36,612,227 | 41.8 | 41.6 | |||||||||
Additional paid in capital | 720.1 | 706.4 | |||||||||
Retained earnings | 2,601.3 | 2,419.2 | |||||||||
Accumulated other comprehensive loss | (163.6) | (164.6) | |||||||||
Treasury stock at cost (32,703,757 and 30,716,854 shares) | (1,364.5) | (1,214.5) | |||||||||
Total Shareholders’ Equity | 1,835.1 | 1,788.1 | |||||||||
Total Liabilities and Shareholders’ Equity | $ | 8,285.1 | $ | 7,616.7 | |||||||
See accompanying notes to consolidated financial statements.
39
GATX CORPORATION AND SUBSIDIARIES
CONSOLIDATED STATEMENTS OF COMPREHENSIVE INCOME
(In millions, except per share data)
| Year Ended December 31 | |||||||||||||||||
| 2019 | 2018 | 2017 | |||||||||||||||
Revenues | |||||||||||||||||
Lease revenue | $ | 1,088.5 | $ | 1,083.7 | $ | 1,094.0 | |||||||||||
Marine operating revenue | 8.2 | 14.3 | 25.0 | ||||||||||||||
Other revenue | 105.4 | 77.1 | 85.4 | ||||||||||||||
Total Revenues | 1,202.1 | 1,175.1 | 1,204.4 | ||||||||||||||
Expenses | |||||||||||||||||
Maintenance expense | 314.4 | 299.2 | 306.1 | ||||||||||||||
Marine operating expense | 18.9 | 16.8 | 24.8 | ||||||||||||||
Depreciation expense | 321.3 | 311.3 | 295.3 | ||||||||||||||
Operating lease expense | 54.4 | 49.6 | 60.7 | ||||||||||||||
Other operating expense | 31.3 | 33.1 | 34.4 | ||||||||||||||
Selling, general and administrative expense | 180.4 | 182.5 | 172.4 | ||||||||||||||
Total Expenses | 920.7 | 892.5 | 893.7 | ||||||||||||||
Other Income (Expense) | |||||||||||||||||
Net gain on asset dispositions | 51.6 | 72.7 | 56.0 | ||||||||||||||
Interest expense, net | (180.5) | (162.9) | (155.3) | ||||||||||||||
Other expense | (7.3) | (21.7) | (13.9) | ||||||||||||||
Income before Income Taxes and Share of Affiliates’ Earnings | 145.2 | 170.7 | 197.5 | ||||||||||||||
Income taxes | (40.9) | (30.5) | 226.4 | ||||||||||||||
Share of affiliates’ earnings, net of taxes | 76.5 | 50.3 | 43.9 | ||||||||||||||
Net Income from Continuing Operations | 180.8 | 190.5 | 467.8 | ||||||||||||||
Income from Discontinued Operations, Net of Taxes | 30.4 | 20.8 | 34.2 | ||||||||||||||
Net Income | 211.2 | 211.3 | 502.0 | ||||||||||||||
Other Comprehensive Income, Net of Taxes | |||||||||||||||||
Foreign currency translation adjustments | (10.1) | (47.5) | 93.2 | ||||||||||||||
Unrealized gain on derivative instruments | 3.9 | 4.5 | 4.8 | ||||||||||||||
Post-retirement benefit plans | 7.2 | 7.4 | 3.5 | ||||||||||||||
Other comprehensive income (loss) | 1.0 | (35.6) | 101.5 | ||||||||||||||
Comprehensive Income | $ | 212.2 | $ | 175.7 | $ | 603.5 | |||||||||||
Share Data | |||||||||||||||||
Basic earnings per share from continuing operations | $ | 5.07 | $ | 5.07 | $ | 12.07 | |||||||||||
Basic earnings per share from discontinued operations | 0.85 | 0.55 | 0.88 | ||||||||||||||
Basic earnings per share from consolidated operations | $ | 5.92 | $ | 5.62 | $ | 12.95 | |||||||||||
Average number of common shares | 35.7 | 37.6 | 38.8 | ||||||||||||||
Diluted earnings per share from continuing operations | $ | 4.97 | $ | 4.98 | $ | 11.88 | |||||||||||
Diluted earnings per share from discontinued operations | 0.84 | 0.54 | 0.87 | ||||||||||||||
Diluted earnings per share from consolidated operations | $ | 5.81 | $ | 5.52 | $ | 12.75 | |||||||||||
Average number of common shares and common share equivalents | 36.4 | 38.3 | 39.4 | ||||||||||||||
See accompanying notes to consolidated financial statements.
40
GATX CORPORATION AND SUBSIDIARIES
CONSOLIDATED STATEMENTS OF CASH FLOWS
(In millions)
| Year Ended December 31 | |||||||||||||||||
| 2019 | 2018 | 2017 | |||||||||||||||
Operating Activities | |||||||||||||||||
Net income | $ | 211.2 | $ | 211.3 | $ | 502.0 | |||||||||||
Income from discontinued operations, net of taxes | 30.4 | 20.8 | 34.2 | ||||||||||||||
Income from continuing operations | 180.8 | 190.5 | 467.8 | ||||||||||||||
Adjustments to reconcile net income to net cash provided by operating activities: | |||||||||||||||||
Depreciation expense | 332.7 | 327.3 | 310.2 | ||||||||||||||
Net gains on sales of assets | (56.2) | (79.3) | (54.4) | ||||||||||||||
Asset impairments | 6.6 | 9.0 | 8.6 | ||||||||||||||
Employee benefit plans | 3.9 | 4.6 | 3.3 | ||||||||||||||
Share-based compensation | 12.3 | 16.4 | 9.9 | ||||||||||||||
Deferred income taxes | 33.8 | 18.2 | (238.6) | ||||||||||||||
Share of affiliates’ earnings, net of dividends | (49.0) | (15.2) | (13.7) | ||||||||||||||
Changes in working capital items | (39.1) | 13.7 | (38.8) | ||||||||||||||
Net cash provided by operating activities of continuing operations | 425.8 | 485.2 | 454.3 | ||||||||||||||
Investing Activities | |||||||||||||||||
Additions to operating assets and facilities | (722.8) | (913.5) | (552.8) | ||||||||||||||
Investments in affiliates | — | (14.1) | (36.6) | ||||||||||||||
Portfolio investments and capital additions | (722.8) | (927.6) | (589.4) | ||||||||||||||
Purchases of assets previously leased | (1.0) | (66.6) | (87.8) | ||||||||||||||
Portfolio proceeds | 250.3 | 234.4 | 165.6 | ||||||||||||||
Proceeds from sales of other assets | 23.0 | 37.3 | 30.3 | ||||||||||||||
Proceeds from sale-leasebacks | — | 59.1 | 90.6 | ||||||||||||||
Other | 2.7 | 3.1 | 0.4 | ||||||||||||||
Net cash used in investing activities of continuing operations | (447.8) | (660.3) | (390.3) | ||||||||||||||
Financing Activities | |||||||||||||||||
Net proceeds from issuances of debt (original maturities longer than 90 days) | 743.0 | 693.7 | 792.6 | ||||||||||||||
Repayments of debt (original maturities longer than 90 days) | (410.0) | (632.8) | (703.0) | ||||||||||||||
Net (decrease) increase in debt with original maturities of 90 days or less | (94.6) | 106.5 | (0.3) | ||||||||||||||
Payments on finance lease obligations | (11.3) | (1.2) | (1.3) | ||||||||||||||
Stock repurchases | (150.0) | (115.5) | (100.0) | ||||||||||||||
Dividends | (69.3) | (69.3) | (68.2) | ||||||||||||||
| Other | 59.1 | 4.7 | 0.8 | ||||||||||||||
Net cash provided by (used in) financing activities of continuing operations | 66.9 | (13.9) | (79.4) | ||||||||||||||
Effect of Exchange Rate Changes on Cash and Cash Equivalents | (0.5) | (4.0) | 4.0 | ||||||||||||||
Net cash provided by operating activities of discontinued operations | 36.8 | 23.3 | 42.5 | ||||||||||||||
| Net cash provided by (used in) investing activities of discontinued operations | 8.1 | (15.8) | (38.0) | ||||||||||||||
| Net cash used in financial activities of discontinued operations | (45.0) | (7.5) | (4.5) | ||||||||||||||
Cash used in discontinued operations, net | (0.1) | — | — | ||||||||||||||
| Net increase (decrease) in Cash, Cash Equivalents, and Restricted Cash during the year | 44.3 | (193.0) | (11.4) | ||||||||||||||
Cash, Cash Equivalents, and Restricted Cash at beginning of year | 106.7 | 299.7 | 311.1 | ||||||||||||||
Cash, Cash Equivalents, and Restricted Cash at end of year | $ | 151.0 | $ | 106.7 | $ | 299.7 | |||||||||||
See accompanying notes to consolidated financial statements.
41
GATX CORPORATION AND SUBSIDIARIES
CONSOLIDATED STATEMENTS OF CHANGES IN SHAREHOLDERS’ EQUITY
(In millions)
| 2019 | 2019 | 2018 | 2018 | 2017 | 2017 | ||||||||||||||||||||||||||||||
| Shares | Dollars | Shares | Dollars | Shares | Dollars | ||||||||||||||||||||||||||||||
Common Stock | |||||||||||||||||||||||||||||||||||
Balance at beginning of year | 67.3 | $ | 41.6 | 67.1 | $ | 41.6 | 67.0 | $ | 41.5 | ||||||||||||||||||||||||||
Issuance of common stock | 0.2 | 0.2 | 0.2 | — | 0.1 | 0.1 | |||||||||||||||||||||||||||||
Balance at end of year | 67.5 | 41.8 | 67.3 | 41.6 | 67.1 | 41.6 | |||||||||||||||||||||||||||||
Treasury Stock | |||||||||||||||||||||||||||||||||||
Balance at beginning of year | (30.7) | (1,214.5) | (29.2) | (1,099.0) | (27.5) | (999.0) | |||||||||||||||||||||||||||||
Stock repurchases | (2.0) | (150.0) | (1.5) | (115.5) | (1.7) | (100.0) | |||||||||||||||||||||||||||||
Balance at end of year | (32.7) | (1,364.5) | (30.7) | (1,214.5) | (29.2) | (1,099.0) | |||||||||||||||||||||||||||||
Additional Paid In Capital | |||||||||||||||||||||||||||||||||||
Balance at beginning of year | 706.4 | 698.0 | 687.8 | ||||||||||||||||||||||||||||||||
Share-based compensation effects | 13.7 | 8.4 | 10.0 | ||||||||||||||||||||||||||||||||
Cumulative impact of accounting standard adoption | — | — | 0.2 | ||||||||||||||||||||||||||||||||
Balance at end of year | 720.1 | 706.4 | 698.0 | ||||||||||||||||||||||||||||||||
Retained Earnings | |||||||||||||||||||||||||||||||||||
Balance at beginning of year | 2,419.2 | 2,261.7 | 1,828.0 | ||||||||||||||||||||||||||||||||
Net income | 211.2 | 211.3 | 502.0 | ||||||||||||||||||||||||||||||||
Dividends declared ($1.84 in 2019, $1.76 in 2018 and $1.68 in 2017) | (68.5) | (69.0) | (68.2) | ||||||||||||||||||||||||||||||||
Cumulative impact of accounting standard adoption | 39.4 | 15.2 | (0.1) | ||||||||||||||||||||||||||||||||
Balance at end of year | 2,601.3 | 2,419.2 | 2,261.7 | ||||||||||||||||||||||||||||||||
Accumulated Other Comprehensive Loss | |||||||||||||||||||||||||||||||||||
Balance at beginning of year | (164.6) | (109.6) | (211.1) | ||||||||||||||||||||||||||||||||
Other comprehensive income (loss) | 1.0 | (35.6) | 101.5 | ||||||||||||||||||||||||||||||||
Cumulative impact of accounting standard adoption | — | (19.4) | — | ||||||||||||||||||||||||||||||||
Balance at end of year | (163.6) | (164.6) | (109.6) | ||||||||||||||||||||||||||||||||
Total Shareholders’ Equity | $ | 1,835.1 | $ | 1,788.1 | $ | 1,792.7 | |||||||||||||||||||||||||||||
See accompanying notes to consolidated financial statements.
42
GATX CORPORATION AND SUBSIDIARIES
NOTES TO CONSOLIDATED FINANCIAL STATEMENTS
NOTE 1. Description of Business
As used herein, "GATX," "we," "us," "our," and similar terms refer to GATX Corporation and its subsidiaries, unless indicated otherwise.
We lease, operate, manage, and remarket long-lived, widely-used assets, primarily in the rail market. We report our financial results through three primary business segments: Rail North America, Rail International, and Portfolio Management. Historically, we also reported financial results for American Steamship Company ("ASC") as a fourth segment.
On February 7, 2020, we announced our intention to sell our ASC business segment to Rand Logistics, Inc. On May 14, 2020, we completed the sale of our ASC business, subject to customary post-closing adjustments. As a result, ASC is now reported as discontinued operations, and financial data for the ASC segment has been segregated and presented as discontinued operations for all periods presented. See "Note 26. Discontinued Operations" for additional information.
43
GATX CORPORATION AND SUBSIDIARIES
NOTES TO CONSOLIDATED FINANCIAL STATEMENTS (Continued)
NOTE 2. Accounting Changes
New Accounting Pronouncements Adopted
| Standard/Description | Effective Date and Adoption Considerations | Effect on Financial Statements or Other Significant Matters | ||||||
Leases In February 2016, the FASB issued ASU 2016-02, Leases (Topic 842), which supersedes previous lease guidance. The FASB subsequently issued ASU 2018-10, ASU 2018-11, and ASU 2018-20, Lease (Topic 842), for codification and targeted improvements to the standard. The new guidance requires companies to recognize most leases on the balance sheet and modifies accounting, presentation, and disclosure for both lessors and lessees. | We adopted the new guidance in the first quarter of 2019, applying a modified retrospective transition method with a cumulative effect adjustment upon adoption. Comparative periods are not restated. We elected the package of practical expedients related to whether a contract is or contains a lease, lease classification and initial direct costs. We also elected the practical expedient that allows lessors and lessees to not separate non-lease components from the associated lease components for operating leases. | The adoption of this new standard required us to recognize right-of-use assets and lease liabilities on our balance sheet attributable to operating leases for railcars, offices, and certain equipment. This resulted in the recognition of right-of-use assets and lease liabilities of $460.7 million and $483.6 million, respectively, as of January 1, 2019. The adoption of this new standard also required us to eliminate deferred gains associated with our railcar sale-leaseback financing arrangements, and record a one-time increase to equity of $39.4 million (after-tax). Elimination of these deferred gains will increase reported operating lease expense going forward. In 2019, this impact was approximately $4.0 million (pre-tax). | ||||||
Derivatives and Hedging In August 2017, the FASB issued ASU 2017-12, Derivatives and Hedging (Topic 815): Targeted Improvements to Accounting for Hedging Activities, which expands and refines hedge accounting for both financial and non-financial risk components, aligns the recognition and presentation of the effects of hedging instruments and hedge items in the financial statements, and includes certain targeted improvements to ease the application of current guidance related to the assessment of hedge effectiveness. | We adopted the new guidance in the first quarter of 2019. | The application of this new guidance did not impact our financial statements and had an immaterial impact to related disclosures. | ||||||
Compensation In June 2018, the FASB issued ASU 2018-07, Compensation - Stock Compensation (Topic 718): Improvements to Nonemployee Share-Based Payment Accounting, which modifies the accounting for nonemployee share-based payments. | We adopted the new guidance in the first quarter of 2019. | The application of this new guidance did not impact our financial statements or related disclosures. | ||||||
44
GATX CORPORATION AND SUBSIDIARIES
NOTES TO CONSOLIDATED FINANCIAL STATEMENTS (Continued)
New Accounting Pronouncements Not Yet Adopted
| Standard/Description | Effective Date and Adoption Considerations | Effect on Financial Statements or Other Significant Matters | ||||||
Credit Losses In June 2016, the FASB issued ASU 2016-13, Credit Losses (Topic 326): Measurement of Credit Losses on Financial Instruments, which modifies how entities will measure credit losses. | The new guidance is effective for us in the first quarter of 2020, with early adoption permitted. We plan to adopt this standard January 1, 2020. | We do not expect the new guidance to have a significant impact on our financial statements or related disclosures. | ||||||
Income Taxes In December 2019, the FASB issued ASU 2019-12, Income Taxes (Topic 740): Simplifying the Accounting for Income Taxes which eliminates exceptions for intraperiod tax allocation, the methodology for calculating income taxes in an interim period, and the recognition of deferred tax liabilities for outside basis differences. | The new guidance is effective for us in the first quarter of 2021, with early adoption permitted. | We are evaluating the effect the new guidance will have on our financial statements and related disclosures. | ||||||
45
GATX CORPORATION AND SUBSIDIARIES
NOTES TO CONSOLIDATED FINANCIAL STATEMENTS (Continued)
NOTE 3. Significant Accounting Policies
Basis of Presentation
We prepared the accompanying consolidated financial statements in accordance with U.S. generally accepted accounting principles ("GAAP"). Certain prior year amounts have been reclassified to conform to the 2019 presentation.
Discontinued Operations
On May 14, 2020, we completed the sale of our ASC business. As a result, ASC is now reported as discontinued operations, and financial data for the ASC segment has been segregated and presented as discontinued operations for all periods presented. Accordingly, the results of operations from our ASC business are reported in the accompanying consolidated statements of operations as “discontinued operations, net of taxes” for the years ended December 31, 2019, 2018, and 2017, and the related assets and liabilities are classified as assets and liabilities of discontinued operations as of December 31, 2019 and 2018 in the accompanying balance sheets. In addition, cash flows from our ASC business are reported as cash flows from discontinued operations in the accompanying statements of cash flows for the years ended December 31, 2019, 2018, and 2017. See "Note 26. Discontinued Operations" for more information.
Consolidation
Our consolidated financial statements include our assets, liabilities, revenues, and expenses, as well as the assets, liabilities, revenues, and expenses of subsidiaries in which we had a controlling financial interest. We have eliminated intercompany transactions and balances.
Use of Estimates
Preparing financial statements in accordance with GAAP requires us to make estimates and assumptions that affect the amounts we report. We regularly evaluate our estimates and judgments based on historical experience and other relevant facts and circumstances. Actual amounts could differ from our estimates.
Lease Classification
We determine the classification of a lease at its inception. If the provisions of the lease subsequently change, other than by renewal or extension, we evaluate whether that change would have resulted in a different lease classification had the change been in effect at inception. If so, the revised agreement is considered a new lease for lease classification purposes. See "Note 5. Leases." In 2019, we adopted ASU 2016-02, Leases ("Topic 842"). As provided in the guidance, we elected the package of practical expedients that retains the classification of existing leases at the time of adoption and does not require re-evaluation of embedded leases or reassessment of initial direct costs.
Revenue Recognition
Revenue is recognized when control of the promised goods or services is transferred to our customers, in an amount that reflects the consideration we expect to be entitled to in exchange for those goods and services.
We disaggregate revenue into three categories as presented on our income statement:
Lease Revenue
Lease revenue, which includes operating lease revenue and finance lease revenue, is our primary source of revenue. In the first quarter of 2019, we adopted Topic 842 using the modified retrospective method. As part of this adoption, we elected the practical expedient that allows lessors to not separate non-lease components from the associated lease components for our operating leases.
46
GATX CORPORATION AND SUBSIDIARIES
NOTES TO CONSOLIDATED FINANCIAL STATEMENTS (Continued)
Operating Lease Revenue
We lease railcars and other operating assets under full-service and net operating leases. We price full-service leases as an integrated service that includes amounts related to maintenance, insurance, and ad valorem taxes. We do not offer stand-alone maintenance service contracts. Operating lease revenue is within the scope of Topic 842, and we have elected not to separate non-lease components from the associated lease component for qualifying leases. Operating lease revenue will continue to be recognized on a straight-line basis over the term of the underlying lease. As a result, lease revenue may not be recognized in the same period as maintenance and other costs, which we expense as incurred. Variable rents are recognized when applicable contingencies are resolved. Revenue is not recognized if collectability is not reasonably assured. See "Note 5. Leases."
Finance Lease Revenue
In certain cases, we lease railcars and other operating assets that, at lease inception, are classified as finance leases. In accordance with Topic 842, finance lease revenue will continue to be recognized using the interest method, which produces a constant yield over the lease term. Initial unearned income is the amount that the original lease payment receivable and the estimated residual value of the leased asset exceeds the original cost or carrying value of the leased asset. See "Note 5. Leases."
Marine Operating Revenue
We generate marine operating revenue through shipping services completed by our marine vessels. In accordance with Topic 606, marine operating revenue is recognized over time as the performance obligation is satisfied, beginning when cargo is loaded through its delivery and discharge. Revenue is recognized pro rata over the projected duration of each voyage, which is derived from our historical voyage data.
Other Revenue
Other revenue is comprised of customer liability repair revenue, termination fees, utilization income, fee income, interest on loans, and other miscellaneous revenues. Select components of other revenue are within the scope of Topic 606. Revenue attributable to terms provided in our lease contracts are variable lease components that are recognized when earned, in accordance with Topic 842.
Cash and Cash Equivalents
We classify all highly liquid investments with a maturity of three months or less as cash equivalents.
Restricted Cash
Restricted cash is cash and cash equivalents that are restricted as to withdrawal and use. Our restricted cash primarily relates to contractually required cash balances for one wholly owned special purpose limited liability company and required cash balances pursuant to terms of a bank guarantee.
Finance Lease Receivables
We record a gross lease payment receivable and an estimated residual value, net of unearned income, for our finance leases. For sales-type leases, we may also recognize a gain or loss in the period the lease is recorded. Gross lease payment receivables are the rents we expect to receive through the end of the lease term for a leased asset. Estimated residual values are our estimates of value of an asset at the end of a finance lease term. We review our estimates of residual values annually or whenever circumstances indicate that residual values may have declined. Other-than-temporary declines in value are recognized as impairments.
Allowance for Losses
The allowance for losses is our estimate of credit losses associated with receivables balances. Receivables include rent and other receivables, loans, and finance lease receivables.
Our loss reserves for rent and other receivables are based on historical loss experience and judgments about the impact of economic conditions, the state of the markets we operate in, and collateral values, if applicable. In addition, we may establish specific reserves
47
GATX CORPORATION AND SUBSIDIARIES
NOTES TO CONSOLIDATED FINANCIAL STATEMENTS (Continued)
for known troubled accounts. We evaluate reserve estimates for loans and finance lease receivables on a customer-specific basis, considering each customer's particular credit situation. We also consider the factors we use to evaluate rent and other receivables, which are outlined above.
We charge amounts against the allowance when we deem them uncollectable. We made no material changes in our estimation methods or assumptions for the allowance during 2019. We believe that the allowance is adequate to cover losses inherent in our receivables balances as of December 31, 2019. Since the allowance is based on judgments and estimates, it is possible that actual losses incurred will differ from the estimate. See "Note 17. Allowance for Losses."
Operating Assets and Facilities
We record operating assets, facilities, and capitalized improvements at cost. We depreciate operating assets and facilities over their estimated useful lives to estimated residual values using the straight-line method. We depreciate leasehold improvements over the shorter of their useful lives or the lease term. Our estimated depreciable lives of operating assets and facilities are as follows:
| Railcars | 20–45 years | ||||
| Locomotives | 10–20 years | ||||
| Buildings | 40–50 years | ||||
| Leasehold improvements | 5–15 years | ||||
| Marine vessels | 30–65 years | ||||
| Other equipment | 5–30 years | ||||
We review our operating assets and facilities for impairment annually, or if circumstances indicate that the carrying amount of those assets may not be recoverable. We evaluate the recoverability of assets to be held and used by comparing the carrying amount of the asset to the undiscounted future net cash flows we expect the asset to generate. If we determine an asset is impaired, we recognize an impairment loss equal to the amount the carrying amount exceeds the asset’s fair value. We classify assets we plan to sell or otherwise dispose of as held for sale, provided they meet specified accounting criteria, and we record those assets at the lower of their carrying amount or fair value less costs to sell. See "Note 9. Asset Impairments and Assets Held for Sale" for further information about asset impairment losses and assets held for sale.
Leased Assets as a Lessee
We record right-of-use assets for operating leases and finance leases and we record the related obligations as liabilities. We amortize the leased assets over the lease terms. We review our right-of-use assets for impairment annually, or if circumstances indicate that the carrying amount of those assets may not be recoverable.
Investments in Affiliates
We use the equity method to account for investments in joint ventures and other unconsolidated entities if we have the ability to exercise significant influence over the financial and operating policies of those investees. Under the equity method, we record our initial investments in these entities at cost and subsequently adjust the investment for our share of the affiliates’ earnings (losses), and distributions. We include loans to and from affiliates as part of our investment in the affiliate and include interest on any such loans in our share of the affiliates’ earnings. We review the carrying amount of our investments in affiliates annually, or whenever circumstances indicate that the value of these investments may have declined. If we determine an investment is impaired on an other-than-temporary basis, we record a loss equal to the difference between the fair value of the investment and its carrying amount. See "Note 6. Investments in Affiliated Companies."
Variable Interest Entities
We evaluate whether an entity is a variable interest entity based on the sufficiency of the entity’s equity and by determining whether the equity holders have the characteristics of a controlling financial interest. To determine if we are the primary beneficiary of a variable interest entity, we assess whether we have the power to direct the activities that most significantly impact the economic performance of the entity as well as the obligation to absorb losses or the right to receive benefits that may be significant to the entity. These determinations are both qualitative and quantitative, and they require us to make judgments and assumptions about the entity’s forecasted financial performance and the volatility inherent in those forecasted results. We evaluate new investments for variable interest entity determination and regularly review all existing entities for events that may result in an entity becoming a variable interest entity or us becoming the primary beneficiary of an existing variable interest entity.
48
GATX CORPORATION AND SUBSIDIARIES
NOTES TO CONSOLIDATED FINANCIAL STATEMENTS (Continued)
Goodwill
We recognize goodwill when the consideration paid to acquire a business exceeds the fair value of the net assets acquired. We assign goodwill to the same reporting unit as the net assets of the acquired business and we assess our goodwill for impairment on an annual basis in the fourth quarter, or if impairment indicators are present. Goodwill is initially assessed for impairment by performing a qualitative assessment to determine if it was more likely than not that the fair value of the reporting unit exceeded its carrying value. If necessary, the fair value of the reporting unit is then compared to its carrying value, including goodwill. If the carrying amount of the applicable reporting unit exceeds its fair value, we compare the implied fair value of the reporting unit’s goodwill with the carrying amount of goodwill. We record an impairment loss if the carrying amount of goodwill exceeds its implied fair value. The fair values of our reporting units are determined using discounted cash flow models. See "Note 16. Goodwill."
Inventory
Our inventory consists of railcar and locomotive repair components and marine vessel spare parts. All inventory balances are stated at lower of cost or market. Railcar repair components are valued using the average cost method. Vessel spare parts inventory is valued using the first-in, first-out method. Inventory is included in other assets on the balance sheet.
Income Taxes
We calculate provisions for federal, state, and foreign income taxes on our reported income before income taxes. We base our calculations of deferred tax assets and liabilities on the differences between the financial statement and tax bases of assets and liabilities, using enacted rates in effect for the year we expect the differences will reverse. We reflect the cumulative effect of changes in tax rates from those we previously used to determine deferred tax assets and liabilities in the provision for income taxes in the period the change is enacted. During 2017, the Tax Cuts and Jobs Act (the "Tax Act") was enacted, which made broad and complex changes to the U.S. tax laws. As a result, we recorded a one-time net tax benefit of $315.9 million, which represented our provisional estimate of the impact of the Tax Act. Additional guidance was issued by the Internal Revenue Service, the U.S. Department of the Treasury, and state taxing authorities during 2018 and, as a result, we recorded an adjustment to our provisional estimates. Specifically, in the fourth quarter of 2018, we recorded an additional net tax benefit of $16.5 million based on this clarifying guidance, the filing of our 2017 income tax returns, and the final determination of our foreign undistributed earnings and associated tax attributes. We do not expect to record any future material adjustments associated with the Tax Act. Provisions for income taxes in any given period can differ from those currently payable or receivable because certain items of income and expense are recognized in different periods for financial reporting purposes than for income tax purposes. We may deduct expenses or defer income attributable to uncertain tax positions for tax purposes, and include those items in our liability for uncertain tax positions in other liabilities on the balance sheet. See "Note 12. Income Taxes."
Fair Value Measurements
Fair value is the price that a market participant would receive to sell an asset or pay to transfer a liability in an orderly transaction at the measurement date. We classify fair value measurements according to the three-level hierarchy defined by GAAP, and those classifications are based on our judgment about the reliability of the inputs we use in the fair value measurement. Level 1 inputs are quoted prices available in active markets for identical assets or liabilities. Level 2 inputs are observable, either directly or indirectly, and may include quoted prices for similar assets or liabilities, quoted prices in markets that are not active, or other inputs that are observable or can be corroborated by observable market data. For assets or liabilities with a specified contractual term, Level 2 inputs must be observable for substantially the full term of that asset or liability. Level 3 inputs are unobservable, meaning they are supported by little or no market activity. Fair value measurements classified as Level 3 typically rely on pricing models and discounted cash flow methodologies, both of which require significant judgment. See "Note 8. Fair Value Disclosure."
Derivatives
We use derivatives, such as interest rate swap agreements, Treasury rate locks, options, cross currency swaps, and currency forwards, to hedge our exposure to interest rate and foreign currency exchange rate risk on existing and anticipated transactions. We formally designate derivatives that meet specific accounting criteria as qualifying hedges at inception. These criteria require us to have the expectation that the derivative will be highly effective at offsetting changes in the fair value or expected cash flows of the hedged exposure, both at the inception of the hedging relationship and on an ongoing basis.
49
GATX CORPORATION AND SUBSIDIARIES
NOTES TO CONSOLIDATED FINANCIAL STATEMENTS (Continued)
We recognize all derivative instruments at fair value and classify them on the balance sheet as either other assets or other liabilities. We generally base the classification of derivative activity in the statements of comprehensive income and cash flows on the nature of the hedged item. For derivatives we designate as fair value hedges, we recognize changes in the fair value of both the derivative and the hedged item in earnings. For derivatives we designate as cash flow hedges, we record the effective portion of the change in the fair value of the derivative as part of other comprehensive income (loss), and we recognize those changes in earnings in the period the hedged transaction affects earnings. We recognize any ineffective portion of the change in the fair value of the derivative immediately in earnings. Although we do not hold or issue derivative financial instruments for purposes other than hedging, we may not designate certain derivatives as accounting hedges. We recognize changes in the fair value of these derivatives in earnings immediately. We classify gains and losses on derivatives that are not designated as hedges as other expenses, and we include the related cash flows in cash flows from operating activities. See "Note 8. Fair Value Disclosure."
Foreign Currency
We translate the assets and liabilities of our operations that have non-US dollar functional currencies at exchange rates in effect at year-end. Revenue, expenses, and cash flows are translated monthly using average exchange rates. We defer gains and losses resulting from foreign currency translation and record those gains and losses as a separate component of accumulated other comprehensive income (loss). Gains and losses resulting from foreign currency transactions and from the remeasurement of non-functional currency assets and liabilities are recognized net of related hedges in other expense during the periods in which they occur. Net gains (losses) recognized were $1.7 million, $(3.4) million and $6.0 million for 2019, 2018, and 2017.
Environmental Liabilities
We record accruals for environmental remediation costs at applicable sites when they are probable and when we can reasonably estimate the expected costs. We record adjustments to initial estimates as necessary. Since these accruals are based on estimates, actual environmental remediation costs may differ. We expense or capitalize environmental remediation costs related to current or future operations as appropriate. See "Note 22. Legal Proceedings and Other Contingencies."
Defined Benefit Pension and Other Post-Retirement Plans
Our balance sheet reflects the funded status of our pension and post-retirement plans, which is the difference between the fair value of the plan assets and the projected benefit obligation. We recognize the aggregate overfunding of any plans in other assets, the aggregate underfunding of any plans in other liabilities, and the corresponding adjustments for unrecognized actuarial gains (losses) and prior service cost (credits) in accumulated other comprehensive income (loss). We record the service cost component of net periodic cost in selling, general, and administrative expense in the statements of comprehensive income and the non-service components in other expense. See "Note 10. Pension and Other Post-Retirement Benefits."
Maintenance and Repair Costs
We expense maintenance and repair costs as incurred. We capitalize certain costs incurred in connection with planned major maintenance activities if those activities improve the asset or extend its useful life. We depreciate those capitalized costs over the estimated useful life of the improvement. We capitalize required regulatory survey costs for vessels and amortize those costs over the applicable survey period, which is generally five years.
Operating Lease Expense
We classify leases of certain railcars and other assets and facilities, such as maintenance facilities and equipment, as operating leases. We record the lease expense associated with these leases on a straight-line basis. In 2019, we adopted Topic 842 that eliminated deferred gains associated with sale-leasebacks and recorded a one-time increase to equity of $39.4 million, net of income taxes. The elimination of deferred gains increased reported operating lease expense by approximately $4.0 million in 2019. See "Note 2. Accounting Changes." We also classify our leases of office facilities and related administrative assets as operating leases, and we record the associated expense in selling, general and administrative expense. See "Note 5. Leases."
ASC Expense Seasonality
ASC's sailing season runs from April 1 to December 31 of each year. We defer certain expenses incurred prior to the beginning of the sailing season, such as winter maintenance, insurance, operating lease expense, and depreciation and amortize them ratably over the sailing season.
50
GATX CORPORATION AND SUBSIDIARIES
NOTES TO CONSOLIDATED FINANCIAL STATEMENTS (Continued)
Share-Based Compensation
We base our measurement of share-based compensation expense on the grant date fair value of an award, and we recognize the expense over the requisite service period. Forfeitures are recorded when they occur. See "Note 11. Share-Based Compensation."
Net Gain on Asset Dispositions
Net gain on dispositions includes gains and losses on sales of operating assets and residual sharing income, which we also refer to as asset remarketing income; non-remarketing disposition gains, primarily from scrapping of railcars; and asset impairment losses. We recognize disposition gains, including non-remarketing gains, upon completion of the sale or scrapping of operating assets. Residual sharing income includes fees we receive from the sale of managed assets and assets subject to residual value guarantees, and we recognize these fees upon completion of the underlying transactions.
The following table presents the net gain on asset dispositions for the years ended December 31 (in millions):
| 2019 | 2018 | 2017 | |||||||||||||||
| Net disposition gains | $ | 58.6 | $ | 64.7 | $ | 45.9 | |||||||||||
| Residual sharing income | 1.9 | 2.5 | 10.2 | ||||||||||||||
| Non-remarketing net disposition gains | (2.3) | 14.5 | 8.5 | ||||||||||||||
| Asset impairment losses (1) | (6.6) | (9.0) | (8.6) | ||||||||||||||
Net Gain on Asset Dispositions | $ | 51.6 | $ | 72.7 | $ | 56.0 | |||||||||||
__________
(1) See "Note 9. Asset Impairments and Assets Held for Sale" for further information about asset impairment losses.
Interest Expense, net
Interest expense is the interest we accrue on indebtedness and the amortization of debt issuance costs and debt discounts and premiums. We defer debt issuance costs and debt discounts and premiums and amortize them over the term of the related debt. We report interest expense net of interest income on bank deposits. Interest income on bank deposits was $3.8 million in 2019, $5.7 million in 2018, and $3.1 million in 2017.
Other Income (Expense)
We include fair value adjustments on certain financial instruments, gains and/or losses on foreign currency transactions and remeasurements, legal defense costs and litigation settlements, along with other miscellaneous income and expense items in other income (expense).
51
GATX CORPORATION AND SUBSIDIARIES
NOTES TO CONSOLIDATED FINANCIAL STATEMENTS (Continued)
NOTE 4. Supplemental Cash Flow Information and Noncash Investing Transactions
| 2019 | 2018 | 2017 | |||||||||||||||
| Supplemental Cash Flow Information (in millions) | |||||||||||||||||
Interest paid (1) | $ | 185.1 | $ | 164.0 | $ | 154.6 | |||||||||||
Income taxes paid, net | 11.6 | 18.1 | 21.5 | ||||||||||||||
| 2019 | 2018 | 2017 | |||||||||||||||
Noncash Investing Transactions (in millions) | |||||||||||||||||
Portfolio investments and capital additions (2) | $ | 16.4 | $ | — | $ | — | |||||||||||
Purchase of leased-in assets (3) | — | — | 11.6 | ||||||||||||||
________
(1) Interest paid consisted of interest on debt obligations, interest rate swaps (net of interest received), and finance leases.
(2) This amount represents the cash paid for 157 railcars we acquired in 2019 that were previously accounted for as a finance lease.
(3) In 2017, we acquired 1,224 railcars that were previously on operating lease for a cash payment of $20.7 million and assumed a debt obligation in the amount of $11.6 million.
NOTE 5. Leases
Adoption of ASU 2016-02, "Leases (Topic 842)"
In the first quarter of 2019, we adopted ASU 2016-02 using the modified retrospective transition method with a cumulative effect adjustment upon adoption. Amounts for comparative periods are not required to be included in the footnote disclosures. See "Note 2. Accounting Changes" for additional information and impact on our financial statements from adoption of this standard.
We elected the package of practical expedients related to whether a contract is or contains a lease, lease classification and initial direct costs. We also elected the practical expedient that allows lessors and lessees to not separate non-lease components from the associated lease components for operating leases.
The adoption of this new standard required us to recognize right-of-use assets and lease liabilities on our balance sheet attributable to operating leases for railcars, offices, and certain equipment. In addition, the adoption of this new standard also required us to eliminate deferred gains associated with our railcar sale-leaseback financing arrangements, resulting in a one-time increase to equity.
The adoption of this standard did not have any impact on our cash flows.
GATX as Lessor
We lease railcars and other operating assets under full-service and net operating leases. We price full-service leases as an integrated service that includes amounts related to maintenance, insurance, and ad valorem taxes. Upon adoption of the new lease accounting standard in 2019, we elected the lessor practical expedient which allows us not to separate lease and non-lease components when reporting revenue for our full-service operating leases. In some cases, we lease railcars that, at commencement, are classified as finance leases. For certain operating leases, revenue is based on equipment usage and is recognized when earned. Typically, our leases do not provide customers with renewal options or options to purchase the asset. Our lease agreements do not generally have residual value guarantees. We collect reimbursements from customers for damage to our railcars, as well as additional rental payments for usage above specified levels, as provided in the lease agreements.
52
GATX CORPORATION AND SUBSIDIARIES
NOTES TO CONSOLIDATED FINANCIAL STATEMENTS (Continued)
The following table shows the components of our lease income for the year ended December 31 (in millions):
| 2019 | |||||
Operating lease income: | |||||
Fixed lease income | $ | 1,013.5 | |||
Variable lease income | 65.2 | ||||
Total operating lease income | $ | 1,078.7 | |||
Finance lease income | 9.8 | ||||
Total lease income | $ | 1,088.5 | |||
In accordance with the terms of our leases with customers, we may earn additional revenue, primarily for customer liability repairs. The amount is reported in other revenue in the statements of comprehensive income and was $88.2 million for the year ended December 31, 2019.
The following table shows the components of our finance leases as of December 31 (in millions):
| 2019 | 2018 | ||||||||||
Total contractual lease payments receivable | $ | 84.4 | $ | 119.5 | |||||||
Estimated unguaranteed residual value of leased assets | 40.7 | 57.5 | |||||||||
Unearned income | (34.8) | (50.6) | |||||||||
Finance leases | $ | 90.3 | $ | 126.4 | |||||||
The following table shows our future contractual receipts from our finance leases and noncancelable operating leases as of December 31, 2019 (in millions):
| | Operating Leases (1) | Finance Leases | Total | ||||||||||||||
| 2020 | $ | 933.8 | $ | 19.7 | $ | 953.5 | |||||||||||
| 2021 | 721.7 | 13.7 | 735.4 | ||||||||||||||
| 2022 | 532.9 | 21.9 | 554.8 | ||||||||||||||
| 2023 | 399.3 | 7.2 | 406.5 | ||||||||||||||
| 2024 | 261.5 | 7.7 | 269.2 | ||||||||||||||
Years thereafter | 289.9 | 14.2 | 304.1 | ||||||||||||||
| $ | 3,139.1 | $ | 84.4 | $ | 3,223.5 | ||||||||||||
__________
(1) The future contractual receipts due under our full-service operating leases include executory costs such as maintenance, car taxes, and insurance.
GATX as Lessee
We lease assets, including railcars at North America, as well as other assets such as offices, maintenance facilities, and other general purpose equipment. The railcars are subleased to customers as part of our normal course of operations. Certain leases have options to purchase the underlying assets early, renew the lease, or purchase the underlying assets at the end of the lease term. The specific terms of the renewal and purchase options vary, and we did not include these amounts in our future contractual rental payments. Additionally, the contractual rental payments do not include amounts we are required to pay for licenses, taxes, insurance, and maintenance. Our lease agreements do not contain any material residual value guarantees. At December 31, 2019, we leased approximately 8,200 railcars at Rail North America, all of which are accounted for as operating leases.
We use the implicit rate to calculate the right-of-use asset amount and lease liability for our leases when readily determinable. Specifically, the implicit rate was measurable for railcars leased at Rail North America. For our other operating leases, an implicit rate was not determinable, and we used our incremental borrowing rate. Leases with an initial term of 12 months or less are not recorded on the balance sheet. Operating lease expense is recognized on a straight-line basis over the lease term.
53
GATX CORPORATION AND SUBSIDIARIES
NOTES TO CONSOLIDATED FINANCIAL STATEMENTS (Continued)
The following table shows the components of lease expense for the year ending December 31 (in millions):
________
| 2019 | |||||
Finance lease cost: | |||||
Amortization of right-of-use assets | $ | 0.7 | |||
Interest on lease liabilities | 0.3 | ||||
Operating lease cost (1): | |||||
Fixed lease cost - operating leases | 59.7 | ||||
Total lease cost | $ | 60.7 | |||
(1) Total operating lease cost includes amounts recorded in selling, general and administrative expense. Operating lease cost also includes short-term leases, which are immaterial.
Operating lease cost includes amounts attributable to sale lease-back financing transactions for railcars we lease to customers. Lease revenue of $70.1 million for the year ended December 31, 2019 was recognized in connection with these operating leases.
The following table shows the maturities of our lease liabilities as of December 31, 2019 (in millions):
| Operating Leases | Finance Leases | Total | |||||||||||||||
| 2020 | $ | 65.8 | $ | 7.9 | $ | 73.7 | |||||||||||
| 2021 | 64.2 | — | 64.2 | ||||||||||||||
| 2022 | 56.2 | — | 56.2 | ||||||||||||||
| 2023 | 54.2 | — | 54.2 | ||||||||||||||
| 2024 | 49.8 | — | 49.8 | ||||||||||||||
Years thereafter | 218.0 | — | 218.0 | ||||||||||||||
| Total undiscounted lease payments | $ | 508.2 | $ | 7.9 | $ | 516.1 | |||||||||||
Less: amounts representing interest | (78.8) | — | (78.8) | ||||||||||||||
Total discounted lease liabilities | $ | 429.4 | $ | 7.9 | $ | 437.3 | |||||||||||
The following table shows assets recorded as finance leases as of December 31 (in millions):
| 2019 | 2018 | ||||||||||
Railcars | $ | 9.0 | $ | 19.3 | |||||||
Less: allowance for depreciation | (0.1) | (2.5) | |||||||||
| Finance leases, net of accumulated depreciation | $ | 8.9 | $ | 16.8 | |||||||
In 2019, we exercised an option to acquire 157 railcars previously recorded on the balance sheet as a finance lease for $10.5 million.
The following table shows the lease terms and discount rates related to leases as of December 31:
| 2019 | |||||
Weighted-average remaining lease term (years): | |||||
Operating leases | 9.6 | ||||
Finance leases (1) | — | ||||
Weighted-average discount rate: | |||||
Operating leases | 3.66 | % | |||
Finance leases | 2.26 | % | |||
________
(1) The weighted-average remaining lease term for outstanding finance leases was less than one year.
54
GATX CORPORATION AND SUBSIDIARIES
NOTES TO CONSOLIDATED FINANCIAL STATEMENTS (Continued)
The following table shows other information related to leases for the year ended December 31 (in millions):
| 2019 | |||||
Cash paid for amounts included in the measurement of lease liabilities: | |||||
Operating cash flows for operating leases | $ | 66.5 | |||
Operating cash flows for finance leases | 0.3 | ||||
Financing cash flows for finance leases | 11.3 | ||||
| Total cash for leases | $ | 78.1 | |||
NOTE 6. Investments in Affiliated Companies
Investments in affiliated companies substantially comprises investments in domestic and foreign affiliates, and primarily include entities that lease aircraft spare engines.
During 2017, we recorded an impairment loss of $3.0 million to reflect a decline in the value of the railcars remaining in the Adler Funding LLC fleet. As of December 31, 2018, all railcar assets had been sold, and the partnership is in the process of winding down remaining activities. There was no revenue from this partnership in 2019.
In 2015, as a result of our decision to exit the majority of our marine investments within our Portfolio Management segment, we sold our 50% interest in the Cardinal Marine joint venture. In 2017, we recognized gains of $1.1 million resulting from additional proceeds received related to the sale.
The following table presents our investments in affiliated companies and our ownership percentage in those companies by segment as of December 31, 2019 (in millions):
| Segment | Investment | Percentage Ownership | |||||||||||||||
| Rolls-Royce & Partners Finance (1) | Portfolio Management | $ | 512.4 | 50.0 | % | ||||||||||||
| Adler Funding LLC | Rail North America | 0.2 | 12.5 | % | |||||||||||||
| Investments in Affiliated Companies | $ | 512.6 | |||||||||||||||
__________
(1) Combined investment balances of a group of 50% owned domestic and foreign joint ventures with Rolls-Royce plc (collectively, the "RRPF affiliates").
The following table shows our share of affiliates’ earnings by segment for the years ended December 31 (in millions):
| 2019 | 2018 | 2017 | |||||||||||||||
| Rail North America (1) | $ | — | $ | 0.6 | $ | (2.4) | |||||||||||
| Rail International | — | — | (0.1) | ||||||||||||||
| Portfolio Management | 94.5 | 60.5 | 58.4 | ||||||||||||||
| Share of affiliates' pre-tax income | 94.5 | 61.1 | 55.9 | ||||||||||||||
| Income taxes | (18.0) | (10.8) | (12.0) | ||||||||||||||
| Share of affiliates' earnings, net of taxes | $ | 76.5 | $ | 50.3 | $ | 43.9 | |||||||||||
__________
(1) Amount for 2017 includes impairment losses of $3.0 million.
55
GATX CORPORATION AND SUBSIDIARIES
NOTES TO CONSOLIDATED FINANCIAL STATEMENTS (Continued)
The following table shows our cash investments in and distributions and loan payments from our affiliates by segment for the years ended December 31 (in millions):
| Cash Investments | Cash Distributions (2) | ||||||||||||||||||||||||||||||||||
| 2019 | 2018 | 2017 | 2019 | 2018 | 2017 | ||||||||||||||||||||||||||||||
| Rail North America (1) | $ | — | $ | — | $ | — | $ | — | $ | 6.3 | $ | 0.7 | |||||||||||||||||||||||
| Portfolio Management | — | 14.1 | 36.6 | 27.6 | 35.2 | 30.2 | |||||||||||||||||||||||||||||
| Total | $ | — | $ | 14.1 | $ | 36.6 | $ | 27.6 | $ | 41.5 | $ | 30.9 | |||||||||||||||||||||||
__________
(1) Loan payments in 2018 and 2017.
(2) Cash distributions exclude proceeds from sales of affiliates of $2.3 million in 2017.
Summarized Financial Data of Affiliates
The following table shows the aggregated operating results for the years ended December 31 for the affiliated companies we held at December 31 (in millions):
| 2019 | 2018 | 2017 | |||||||||||||||
| Revenues | $ | 469.8 | $ | 436.9 | $ | 350.7 | |||||||||||
| Net gains on sales of assets | 86.4 | 12.2 | 27.4 | ||||||||||||||
| Net income | 161.4 | 120.5 | 100.4 | ||||||||||||||
The following table shows aggregated summarized balance sheet data for our affiliated companies as of December 31 (in millions):
| 2019 | 2018 | ||||||||||
| Current assets | $ | 203.6 | $ | 303.8 | |||||||
| Noncurrent assets | 5,015.9 | 4,417.5 | |||||||||
| Total assets | $ | 5,219.5 | $ | 4,721.3 | |||||||
| Current liabilities | $ | 525.5 | $ | 827.8 | |||||||
| Noncurrent liabilities | 3,703.6 | 3,001.8 | |||||||||
| Shareholders’ equity | 990.4 | 891.7 | |||||||||
| Total liabilities and shareholders' equity | $ | 5,219.5 | $ | 4,721.3 | |||||||
Summarized Financial Data for the RRPF Affiliates
Our affiliate investments include interests in each of the RRPF affiliates, a group of 50% owned domestic and foreign joint ventures with Rolls-Royce plc (or affiliates thereof, collectively “Rolls-Royce”), a leading manufacturer of commercial aircraft jet engines. The RRPF affiliates are primarily engaged in two business activities: lease financing of aircraft spare engines to a diverse group of commercial aircraft operators worldwide and lease financing of aircraft spare engines to Rolls-Royce for use in their engine maintenance programs. In aggregate, the RRPF affiliates owned 478 aircraft engines at December 31, 2019, of which 250 were on lease to Rolls-Royce. Aircraft engines are generally depreciated over a useful life of 18 to 25 years to an estimated residual value. Lease terms vary but typically range from 3 to 12 years. Rolls-Royce manages each of the RRPF affiliates and also performs substantially all required maintenance activities. Our share of affiliates' earnings (after-tax) from the RRPF affiliates was $76.5 million in 2019, $49.8 million in 2018, and $44.8 million in 2017.
56
GATX CORPORATION AND SUBSIDIARIES
NOTES TO CONSOLIDATED FINANCIAL STATEMENTS (Continued)
We derived the following financial information from the combined financial statements of the RRPF affiliates.
The following table shows condensed income statements of the RRPF affiliates for the years ending December 31 (in millions):
| 2019 | 2018 | 2017 | |||||||||||||||
| Lease revenue from third parties | $ | 213.3 | $ | 178.6 | $ | 168.8 | |||||||||||
| Lease revenue from Rolls-Royce | 256.7 | 232.7 | 176.0 | ||||||||||||||
| Depreciation expense | (223.9) | (195.6) | (176.4) | ||||||||||||||
| Interest expense | (126.4) | (94.3) | (64.3) | ||||||||||||||
| Other expenses | (16.5) | (12.6) | (8.9) | ||||||||||||||
| Other income, including net gains on sales of assets | 86.4 | 12.5 | 20.5 | ||||||||||||||
| Income before income taxes | 189.6 | 121.3 | 115.7 | ||||||||||||||
| Income taxes (1) | (27.9) | (18.1) | (13.2) | ||||||||||||||
| Net income | $ | 161.7 | $ | 103.2 | $ | 102.5 | |||||||||||
_________
(1)Represents income taxes directly attributable to the RRPF affiliates in the United Kingdom. Certain of the RRPF affiliates are disregarded entities for income tax purposes and, as a result, income taxes are incurred at the shareholder level.
The following table shows the condensed balance sheets of the RRPF affiliates as of December 31 (in millions):
| 2019 | 2018 | ||||||||||
| Current assets | $ | 202.6 | $ | 301.9 | |||||||
| Noncurrent assets, including operating assets, net of accumulated depreciation of $1,178.5 and $1,024.7 (a) | 5,015.9 | 4,417.5 | |||||||||
| Total assets | $ | 5,218.5 | $ | 4,719.4 | |||||||
| Accounts payable and accrued expenses | $ | 96.2 | $ | 97.9 | |||||||
| Debt: | |||||||||||
| Current | 429.3 | 729.3 | |||||||||
| Noncurrent, net of adjustments for hedges | 3,367.5 | 2,722.4 | |||||||||
| Other liabilities | 336.1 | 279.4 | |||||||||
| Shareholders’ equity | 989.4 | 890.4 | |||||||||
| Total liabilities and shareholders' equity | $ | 5,218.5 | $ | 4,719.4 | |||||||
_________
(a) All operating assets were pledged as collateral for long-term debt obligations.
The following table shows contractual future lease receipts from noncancelable leases of the RRPF affiliates as of December 31, 2019 (in millions):
| Rolls-Royce | Third Parties | Total | |||||||||||||||
| 2020 | $ | 262.2 | $ | 210.7 | $ | 472.9 | |||||||||||
| 2021 | 250.5 | 186.3 | 436.8 | ||||||||||||||
| 2022 | 239.7 | 171.1 | 410.8 | ||||||||||||||
| 2023 | 216.5 | 157.7 | 374.2 | ||||||||||||||
| 2024 | 208.6 | 143.1 | 351.7 | ||||||||||||||
Thereafter | 472.0 | 468.9 | 940.9 | ||||||||||||||
Total | $ | 1,649.5 | $ | 1,337.8 | $ | 2,987.3 | |||||||||||
57
GATX CORPORATION AND SUBSIDIARIES
NOTES TO CONSOLIDATED FINANCIAL STATEMENTS (Continued)
The following table shows the scheduled principal payments of debt obligations of the RRPF affiliates as of December 31, 2019 (in millions):
| 2020 | $ | 432.3 | |||
| 2021 | 298.0 | ||||
| 2022 | 342.6 | ||||
| 2023 | 381.6 | ||||
| 2024 | 168.1 | ||||
Thereafter | 2,189.1 | ||||
Total debt principal (1) | $ | 3,811.7 | |||
_______
(1) All debt obligations are nonrecourse to the shareholders.
NOTE 7. Debt
Commercial Paper and Borrowings Under Bank Credit Facilities ($ in millions)
| December 31 | |||||||||||
| 2019 | 2018 | ||||||||||
| Balance | $ | 15.8 | $ | 110.8 | |||||||
| Weighted-average interest rate | 0.65 | % | 2.77 | % | |||||||
58
GATX CORPORATION AND SUBSIDIARIES
NOTES TO CONSOLIDATED FINANCIAL STATEMENTS (Continued)
Debt Obligations
The following table shows the outstanding balances of our debt obligations and the applicable interest rates as of December 31 ($ in millions):
| Date of Issue | Final Maturity | Interest Rate | 2019 | 2018 | |||||||||||||||||||||||||
| Recourse Fixed Rate Debt | |||||||||||||||||||||||||||||
Unsecured | 10/31/14 | 03/30/20 | 2.60 | % | 250.0 | 250.0 | |||||||||||||||||||||||
Unsecured | 02/06/15 | 03/30/20 | 2.60 | % | 100.0 | 100.0 | |||||||||||||||||||||||
Unsecured | 05/27/11 | 06/01/21 | 4.85 | % | 250.0 | 250.0 | |||||||||||||||||||||||
Unsecured | 09/20/11 | 06/01/21 | 4.85 | % | 50.0 | 50.0 | |||||||||||||||||||||||
Unsecured | 06/11/12 | 06/15/22 | 4.75 | % | 250.0 | 250.0 | |||||||||||||||||||||||
Unsecured | 03/19/13 | 03/30/23 | 3.90 | % | 250.0 | 250.0 | |||||||||||||||||||||||
Unsecured | 11/05/18 | 02/15/24 | 4.35 | % | 300.0 | 300.0 | |||||||||||||||||||||||
Unsecured | 11/12/19 | 11/05/24 | 0.96 | % | 112.1 | — | |||||||||||||||||||||||
Unsecured | 02/06/15 | 03/30/25 | 3.25 | % | 300.0 | 300.0 | |||||||||||||||||||||||
Unsecured | 09/13/16 | 09/15/26 | 3.25 | % | 350.0 | 350.0 | |||||||||||||||||||||||
Unsecured | 11/04/19 | 11/04/26 | 1.07 | % | 84.1 | — | |||||||||||||||||||||||
Unsecured | 02/09/17 | 03/30/27 | 3.85 | % | 300.0 | 300.0 | |||||||||||||||||||||||
Unsecured | 11/02/17 | 03/15/28 | 3.50 | % | 300.0 | 300.0 | |||||||||||||||||||||||
Unsecured | 05/07/18 | 11/07/28 | 4.55 | % | 300.0 | 300.0 | |||||||||||||||||||||||
Unsecured | 01/31/19 | 04/01/29 | 4.70 | % | 500.0 | — | |||||||||||||||||||||||
Unsecured | 03/04/14 | 03/15/44 | 5.20 | % | 300.0 | 300.0 | |||||||||||||||||||||||
Unsecured | 02/06/15 | 03/30/45 | 4.50 | % | 250.0 | 250.0 | |||||||||||||||||||||||
Unsecured | 05/16/16 | 05/30/66 | 5.63 | % | 150.0 | 150.0 | |||||||||||||||||||||||
Unsecured | 03/04/14 | 07/30/19 | 2.50 | % | — | 250.0 | |||||||||||||||||||||||
Total recourse fixed rate debt | $ | 4,396.2 | $ | 3,950.0 | |||||||||||||||||||||||||
| Recourse Floating Rate Debt | |||||||||||||||||||||||||||||
Unsecured | 11/06/17 | 11/05/21 | 2.61 | % | $ | 300.0 | $ | 300.0 | |||||||||||||||||||||
Unsecured (2) | 12/22/16 | 05/24/24 | 0.90 | % | 117.7 | 63.1 | |||||||||||||||||||||||
Unsecured (1) | 08/28/14 | 08/28/24 | 4.00 | % | — | 100.0 | |||||||||||||||||||||||
Unsecured (1) | 09/23/15 | 09/23/25 | 4.07 | % | — | 60.0 | |||||||||||||||||||||||
Total recourse floating rate debt | $ | 417.7 | $ | 523.1 | |||||||||||||||||||||||||
| Total debt principal | $ | 4,813.9 | $ | 4,473.1 | |||||||||||||||||||||||||
| Unamortized debt discount and debt issuance costs | (34.9) | (35.9) | |||||||||||||||||||||||||||
| Debt adjustment for fair value hedges | 1.4 | (7.5) | |||||||||||||||||||||||||||
| Total Debt | $ | 4,780.4 | $ | 4,429.7 | |||||||||||||||||||||||||
__________
(1) Debt repaid prior to the final maturity.
(2) This term loan was originally issued on December 22, 2016, with a maturity date of December 20, 2021. During 2019, GATX increased the size of the term loan and extended the maturity date to May 24, 2024.
59
GATX CORPORATION AND SUBSIDIARIES
NOTES TO CONSOLIDATED FINANCIAL STATEMENTS (Continued)
The following table shows the scheduled principal payments of our debt obligations as of December 31, 2019 (in millions):
| 2020 | $ | 350.0 | |||
| 2021 | 600.0 | ||||
| 2022 | 250.0 | ||||
| 2023 | 250.0 | ||||
| 2024 | 529.9 | ||||
Thereafter | 2,834.0 | ||||
Total debt principal | $ | 4,813.9 | |||
Shelf Registration Statement
During 2019, we filed an automatic shelf registration statement that enables us to issue debt securities and pass-through certificates. The registration statement is effective for three years and does not limit the amount of debt securities and pass-through certificates we can issue.
Credit Lines and Facilities
On May 23, 2019, we entered into a new $600 million, 5-year unsecured revolving credit facility in the U.S., expiring in May 2024. The new credit facility contains two 1-year extension options. This replaced our prior $600 million 5-year unsecured revolving credit facility, which was terminated upon our entry in the new credit facility. As of December 31, 2019, the full $600 million was available under this facility. Additionally, we terminated our prior $250 million 5-year secured railcar facility and entered into a new $250 million 3-year unsecured facility in the U.S. expiring in May 2022. This new credit facility also has two 1-year extension options. As of December 31, 2019, the full $250 million was available under this facility.
In addition, our European subsidiaries have unsecured credit facilities with an aggregate limit of €35.0 million. As of December 31, 2019, €20.9 million was available under these credit facilities.
Annual commitment fees for GATX's credit facilities were $1.6 million for 2019, $2.0 million for 2018, and $2.0 million for 2017.
Restrictive Covenants
Our $600 million revolving credit facility contains various restrictive covenants, including requirements to maintain a fixed charge coverage ratio and an asset coverage test. Our ratio of earnings to fixed charges, as defined in this facility, was 2.4 for the period ended December 31, 2019, which is in excess of the minimum covenant ratio of 1.2. At December 31, 2019, we were in compliance with all covenants and conditions of the facility. Some of our bank term loans have the same financial covenants as the facility.
The indentures for our public debt also contain various restrictive covenants, including limitation on liens provisions that restrict the amount of additional secured indebtedness that we may incur. As of December 31, 2019, this limit was $1,605.0 million. Additionally, certain exceptions to the covenants permit us to incur an unlimited amount of purchase money and nonrecourse indebtedness. At December 31, 2019, we were in compliance with all covenants and conditions of the indentures.
At December 31, 2019, our European rail subsidiaries ("GATX Rail Europe" or "GRE") had outstanding term loan balances totaling €280 million. The loans are guaranteed by GATX Corporation and are subject to the same restrictive covenants as the revolving credit facility noted above.
We do not anticipate any covenant violations nor do we expect that any of these covenants will restrict our operations or our ability to obtain additional financing. At December 31, 2019, we were in compliance with all covenants and conditions of all of our credit agreements.
60
GATX CORPORATION AND SUBSIDIARIES
NOTES TO CONSOLIDATED FINANCIAL STATEMENTS (Continued)
NOTE 8. Fair Value Disclosure
The assets and liabilities that GATX records at fair value on a recurring basis consisted entirely of derivatives at December 31, 2019 and December 31, 2018.
In addition, we review long-lived assets, such as operating assets and facilities, for impairment whenever circumstances indicate that the carrying amount of these assets may not be recoverable or when assets may be classified as held for sale. We determine the fair value of the respective assets using Level 3 inputs, including estimates of discounted future cash flows (including net proceeds from sale), independent appraisals, and market comparables, as applicable. Certain assets were subject to non-recurring Level 3 fair value measurements during 2019 and 2018 and continue to be held and used at December 31, 2019 and 2018. The fair value of such assets at the time of their measurement was $1.6 million in 2019 and $10.9 million in 2018 and included railcars, inland marine vessels, maintenance facilities and an affiliate investment. See "Note 9. Asset Impairments and Assets Held for Sale" for further information.
Adoption of ASU 2017-12, "Derivatives and Hedging (Topic 815): Targeted Improvements to Accounting for Hedging Activities"
In the first quarter of 2019, we adopted ASU 2016-02. The adoption of this new standard did not have an impact on our financial statements, but certain disclosures have been modified in accordance with the new requirements.
Derivative Instruments
Fair Value Hedges
We use interest rate swaps to manage the fixed-to-floating rate mix of our debt obligations by converting a portion of our fixed rate debt to floating rate debt. For fair value hedges, we recognize changes in fair value of both the derivative and the hedged item as interest expense. We had eight instruments outstanding with an aggregate notional amount of $450.0 million as of December 31, 2019 with maturities ranging from 2020 to 2022 and nine instruments outstanding with an aggregate notional amount of $500.0 million as of December 31, 2018 with maturities ranging from 2019 to 2022.
Cash Flow Hedges
We use Treasury rate locks and swap rate locks to hedge our exposure to interest rate risk on anticipated transactions. We also use currency swaps and put/call options to hedge our exposure to fluctuations in the exchange rates of foreign currencies for certain loans and operating expenses denominated in non-functional currencies. We had seven instruments outstanding with an aggregate notional amount of $336.5 million as of December 31, 2019 that mature from 2020 to 2022 and eight instruments outstanding with an aggregate notional amount of $501.9 million as of December 31, 2018 with maturities ranging from 2019 to 2022. Within the next 12 months, we expect to reclassify $1.7 million ($1.3 million after-tax) of net losses on previously terminated derivatives from accumulated other comprehensive income (loss) to interest expense or operating lease expense, as applicable. We reclassify these amounts when interest and operating lease expense on the related hedged transactions affect earnings.
Non-Designated Derivatives
We do not hold derivative financial instruments for purposes other than hedging, although certain of our derivatives are not designated as accounting hedges. We recognize changes in the fair value of these derivatives in other (income) expense immediately.
Certain of our derivative instruments contain credit risk provisions that could require us to make immediate payment on net liability positions in the event that we default on certain outstanding debt obligations. The aggregate fair value of our derivative instruments with credit risk related contingent features that are in a liability position as of December 31, 2019 was $7.6 million. We are not required to post any collateral on our derivative instruments and do not expect the credit risk provisions to be triggered.
In the event that a counterparty fails to meet the terms of an interest rate swap agreement or a foreign exchange contract, our exposure is limited to the fair value of the swap, if in our favor. We manage the credit risk of counterparties by transacting with institutions that we consider financially sound and by avoiding concentrations of risk with a single counterparty. We believe that the risk of non-performance by any of our counterparties is remote.
61
GATX CORPORATION AND SUBSIDIARIES
NOTES TO CONSOLIDATED FINANCIAL STATEMENTS (Continued)
The following tables show our derivative assets and liabilities that are measured at fair value (in millions):
| Balance Sheet Location | Fair Value December 31, 2019 | Quoted Prices in Active Markets for Identical Assets (Level 1) | Significant Observable Inputs (Level 2) | Significant Unobservable Inputs (Level 3) | |||||||||||||||||||||||||
| Derivative Assets | |||||||||||||||||||||||||||||
Interest rate contracts (1) | Other assets | $ | 1.4 | $ | — | $ | 1.4 | $ | — | ||||||||||||||||||||
Foreign exchange contracts (1) | Other assets | 6.9 | — | 6.9 | — | ||||||||||||||||||||||||
Foreign exchange contracts (2) | Other assets | 0.2 | — | 0.2 | — | ||||||||||||||||||||||||
Total derivative assets | $ | 8.5 | $ | — | $ | 8.5 | $ | — | |||||||||||||||||||||
| Derivative Liabilities | |||||||||||||||||||||||||||||
Interest rate contracts (1) | Other liabilities | $ | 0.6 | $ | — | $ | 0.6 | $ | — | ||||||||||||||||||||
Foreign exchange contracts (1) | Other liabilities | 7.0 | — | 7.0 | — | ||||||||||||||||||||||||
Foreign exchange contracts (2) | Other liabilities | 6.0 | — | 6.0 | — | ||||||||||||||||||||||||
Total derivative liabilities | $ | 13.6 | $ | — | $ | 13.6 | $ | — | |||||||||||||||||||||
| Balance Sheet Location | Fair Value December 31, 2018 | Quoted Prices in Active Markets for Identical Assets (Level 1) | Significant Observable Inputs (Level 2) | Significant Unobservable Inputs (Level 3) | |||||||||||||||||||||||||
| Derivative Assets | |||||||||||||||||||||||||||||
Foreign exchange contracts (1) | Other assets | $ | 4.4 | $ | — | $ | 4.4 | $ | — | ||||||||||||||||||||
Foreign exchange contracts (2) | Other assets | 0.5 | — | 0.5 | — | ||||||||||||||||||||||||
Total derivative assets | $ | 4.9 | $ | — | $ | 4.9 | $ | — | |||||||||||||||||||||
| Derivative Liabilities | |||||||||||||||||||||||||||||
Interest rate contracts (1) | Other liabilities | $ | 7.7 | $ | — | $ | 7.7 | $ | — | ||||||||||||||||||||
Foreign exchange contracts (1) | Other liabilities | 18.2 | — | 18.2 | — | ||||||||||||||||||||||||
Foreign exchange contracts (2) | Other liabilities | 4.7 | — | 4.7 | — | ||||||||||||||||||||||||
Total derivative liabilities | $ | 30.6 | $ | — | $ | 30.6 | $ | — | |||||||||||||||||||||
_________
(1) Designated as hedges.
(2) Not designated as hedges.
We value derivatives using a pricing model with inputs (such as yield curves and foreign currency rates) that are observable in the market or that can be derived principally from observable market data. As of December 31, 2019 and December 31, 2018, all derivatives were classified as Level 2 in the fair value hierarchy. There were no derivatives classified as Level 1 or Level 3.
The following table shows the amounts recorded on the balance sheet related to cumulative basis adjustments for fair value hedges as of December 31 (in millions):
62
GATX CORPORATION AND SUBSIDIARIES
NOTES TO CONSOLIDATED FINANCIAL STATEMENTS (Continued)
| Carrying Amount of the Hedged Assets/(Liabilities) | Cumulative Amount of Fair Value Hedging Adjustment Included in the Carrying Amount of the Hedged Assets/(Liabilities) | |||||||||||||||||||||||||
| Line Item in the Balance Sheet in Which the Hedged Item is Included | 2019 | 2018 | 2019 | 2018 | ||||||||||||||||||||||
Recourse debt | $ | 449.9 | $ | 493.5 | $ | 1.4 | $ | (7.7) | ||||||||||||||||||
The following tables show the impacts of our derivative instruments on our statements of comprehensive income for the years ended December 31 (in millions):
| Amount of Loss (Gain) Recognized in Other Comprehensive Income | Location of Loss (Gain) Reclassified from Accumulated Other Comprehensive Income into Income | Amount of Loss (Gain) Reclassified from Accumulated Other Comprehensive Income into Income | ||||||||||||||||||||||||||||||||||||||||||
| Derivative Designation | 2019 | 2018 | 2017 | 2019 | 2018 | 2017 | ||||||||||||||||||||||||||||||||||||||
| Derivatives in cash flow hedging relationships: | Interest expense | $ | 2.5 | $ | 4.2 | $ | 6.8 | |||||||||||||||||||||||||||||||||||||
Interest rate contracts | $ | 0.5 | $ | — | $ | 2.2 | Operating lease expense | — | 0.1 | 0.1 | ||||||||||||||||||||||||||||||||||
Foreign exchange contracts | (19.5) | (12.6) | 39.3 | Other (income) expense | (14.3) | (11.7) | 38.9 | |||||||||||||||||||||||||||||||||||||
Total | $ | (19.0) | $ | (12.6) | $ | 41.5 | Total | $ | (11.8) | $ | (7.4) | $ | 45.8 | |||||||||||||||||||||||||||||||
The following tables show the impact of our fair value and cash flow hedge accounting relationships, as well as the impact of our non-designated derivatives, on the statements of comprehensive income for the years ended December 31 (in millions):
| Location and Amount of Gain (Loss) Recognized in Income on Fair Value and Cash Flow Hedging Relationships | ||||||||||||||||||||
| Interest (expense), net | Other income (expense) | Operating lease (expense) | ||||||||||||||||||
| 2019 | ||||||||||||||||||||
| Total amounts of income and expense presented in the statements of comprehensive income in which the effects of fair value or cash flow hedges are recorded | $ | (180.5) | $ | (7.3) | $ | (54.4) | ||||||||||||||
| Gain (loss) on fair value hedging relationships | ||||||||||||||||||||
Interest rate contracts: | ||||||||||||||||||||
Hedged items | (9.0) | — | — | |||||||||||||||||
Derivatives designated as hedging instruments | 9.0 | — | — | |||||||||||||||||
| Gain (loss) on cash flow hedging relationships | ||||||||||||||||||||
Interest rate contracts: | ||||||||||||||||||||
Amount of gain (loss) reclassified from accumulated other comprehensive income into income | (2.5) | — | — | |||||||||||||||||
Foreign exchange contracts: | ||||||||||||||||||||
Amount of gain (loss) reclassified from accumulated other comprehensive income into income (1) | — | 14.3 | — | |||||||||||||||||
| Gain (loss) on non-designated derivative contracts | — | (1.7) | — | |||||||||||||||||
63
GATX CORPORATION AND SUBSIDIARIES
NOTES TO CONSOLIDATED FINANCIAL STATEMENTS (Continued)
| Location and Amount of Gain (Loss) Recognized in Income on Fair Value and Cash Flow Hedging Relationships | ||||||||||||||||||||
| Interest (expense), net | Other income (expense) | Operating lease (expense) | ||||||||||||||||||
| 2018 | ||||||||||||||||||||
| Total amounts of income and expense presented in the statements of comprehensive income in which the effects of fair value or cash flow hedges are recorded | $ | (162.9) | $ | (21.7) | $ | (49.6) | ||||||||||||||
| Gain (loss) on fair value hedging relationships | ||||||||||||||||||||
Interest rate contracts: | ||||||||||||||||||||
Hedged items | 3.0 | — | — | |||||||||||||||||
Derivatives designated as hedging instruments | (3.0) | — | — | |||||||||||||||||
| Gain (loss) on cash flow hedging relationships | ||||||||||||||||||||
Interest rate contracts: | ||||||||||||||||||||
Amount of gain (loss) reclassified from accumulated other comprehensive income into income | (4.2) | — | (0.1) | |||||||||||||||||
Foreign exchange contracts: | ||||||||||||||||||||
Amount of gain (loss) reclassified from accumulated other comprehensive income into income (1) | — | 11.7 | — | |||||||||||||||||
| Gain (loss) on non-designated derivative contracts | — | 2.2 | — | |||||||||||||||||
| Location and Amount of Gain (Loss) Recognized in Income on Fair Value and Cash Flow Hedging Relationships | ||||||||||||||||||||
| Interest (expense), net | Other income (expense) | Operating lease (expense) | ||||||||||||||||||
| 2017 | ||||||||||||||||||||
| Total amounts of income and expense presented in the statements of comprehensive income in which the effects of fair value or cash flow hedges are recorded | $ | (155.3) | $ | (13.9) | $ | (60.7) | ||||||||||||||
| Gain (loss) on fair value hedging relationships | ||||||||||||||||||||
Interest rate contracts: | ||||||||||||||||||||
Hedged items | 5.3 | — | — | |||||||||||||||||
Derivatives designated as hedging instruments | (5.3) | — | — | |||||||||||||||||
| Gain (loss) on cash flow hedging relationships | ||||||||||||||||||||
Interest rate contracts: | ||||||||||||||||||||
Amount of gain (loss) reclassified from accumulated other comprehensive income into income | (6.8) | — | (0.1) | |||||||||||||||||
Foreign exchange contracts: | ||||||||||||||||||||
Amount of gain (loss) reclassified from accumulated other comprehensive income into income (1) | — | (38.9) | — | |||||||||||||||||
| Gain (loss) on non-designated derivative contracts | — | (8.0) | — | |||||||||||||||||
_________
(1) These amounts are substantially offset by foreign currency remeasurement adjustments on related hedged instruments, also recognized in other income (expense).
64
GATX CORPORATION AND SUBSIDIARIES
NOTES TO CONSOLIDATED FINANCIAL STATEMENTS (Continued)
Other Financial Instruments
Except for derivatives, as disclosed above, GATX has no other assets and liabilities measured at fair value on a recurring basis. The carrying amounts of cash and cash equivalents, restricted cash, rent and other receivables, accounts payable, and commercial paper and bank credit facilities approximate fair value due to the short maturity of those instruments. We estimate the fair values of fixed and floating rate debt using discounted cash flow analyses that are based on interest rates currently offered for loans with similar terms to borrowers of similar credit quality. The inputs we use to estimate each of these values are classified in Level 2 of the fair value hierarchy because they are directly or indirectly observable inputs.
The following table shows the carrying amounts and fair values of our other financial instruments as of December 31 (in millions):
| 2019 | 2019 | 2018 | 2018 | ||||||||||||||||||||
| | Carrying Amount | Fair Value | Carrying Amount | Fair Value | |||||||||||||||||||
| Liabilities | |||||||||||||||||||||||
| Recourse fixed rate debt | $ | 4,389.3 | $ | 4,644.6 | $ | 3,933.4 | $ | 3,836.0 | |||||||||||||||
| Recourse floating rate debt | 417.5 | 419.0 | 522.7 | 515.1 | |||||||||||||||||||
NOTE 9. Asset Impairments and Assets Held for Sale
We review our operating assets annually, or whenever indicators of impairment may be present. The following table summarizes the components of asset impairments for the years ended December 31 (in millions):
| 2019 | 2018 | 2017 | |||||||||||||||
Attributable to Consolidated Assets | |||||||||||||||||
Rail North America | $ | 0.4 | $ | 0.6 | $ | 4.6 | |||||||||||
Rail International | — | 0.9 | 0.3 | ||||||||||||||
Portfolio Management | 6.2 | 4.5 | 3.7 | ||||||||||||||
Rail International - railcar maintenance facility closure | — | 3.0 | — | ||||||||||||||
Total | $ | 6.6 | $ | 9.0 | $ | 8.6 | |||||||||||
Attributable to Affiliate Investments | |||||||||||||||||
Rail North America | $ | — | $ | — | $ | 3.0 | |||||||||||
Impairment losses recorded in each year at Rail North America and Rail International were primarily attributable to railcars with declines in value due to excessive damage or functional obsolescence. Impairment losses recorded at Portfolio Management each year related to certain offshore marine supply vessels.
In 2017, an impairment loss of $3.0 million attributable to affiliate investments was related to our investment in Adler Funding LLC, resulting from a decline in the value of certain railcars in the fleet.
In 2018, GRE recorded $3.0 million of impairment losses associated with the closure of a railcar maintenance facility in Germany.
In the consolidated statements of comprehensive income, impairment losses related to consolidated assets were included in net (loss) gains on asset dispositions, and impairment losses related to affiliate investments were recorded in share of affiliates' earnings.
As of December 31, 2019 and 2018, assets held for sale, excluding net assets from discontinued operations, were $3.4 million and $1.3 million, all of which were at Rail North America. All assets held for sale at December 31, 2019 are expected to be sold in 2020.
65
GATX CORPORATION AND SUBSIDIARIES
NOTES TO CONSOLIDATED FINANCIAL STATEMENTS (Continued)
NOTE 10. Pension and Other Post-Retirement Benefits
We maintain both funded and unfunded noncontributory defined benefit pension plans covering our domestic employees and the employees of our subsidiaries. We also have a funded noncontributory defined benefit pension plan related to a former business in the United Kingdom that has no active employees. The plans base benefits payable on years of service and/or final average salary. We base our funding policies for the pension plans on actuarially determined cost methods allowable under IRS regulations and statutory requirements in the UK.
In addition to the pension plans, we have other post-retirement plans that provide health care, life insurance, and other benefits for certain retired domestic employees who meet established criteria. Most domestic employees that retire with immediate benefits under our pension plan are eligible for health care and life insurance benefits. The other post-retirement plans are either contributory or noncontributory, depending on various factors.
Certain lump sum distributions paid to retirees triggered settlement accounting, resulting in the recognition of $2.1 million, and $0.2 million of expense in 2018 and 2017.
We use a December 31 measurement date for all of our plans. The following tables show pension obligations, plan assets, and other post-retirement obligations as of December 31 (in millions):
| | 2019 Pension Benefits | 2018 Pension Benefits | 2019 Retiree Health and Life | 2018 Retiree Health and Life | |||||||||||||||||||
Change in Benefit Obligation | |||||||||||||||||||||||
Benefit obligation at beginning of year | $ | 413.7 | $ | 480.1 | $ | 27.5 | $ | 33.7 | |||||||||||||||
Service cost | 6.5 | 8.2 | 0.2 | 0.2 | |||||||||||||||||||
Interest cost | 15.2 | 14.7 | 0.9 | 1.0 | |||||||||||||||||||
Actuarial loss (gain) | 63.7 | (40.9) | (1.1) | (5.0) | |||||||||||||||||||
Benefits paid | (24.9) | (46.5) | (2.9) | (2.4) | |||||||||||||||||||
Effect of foreign exchange rate changes | 1.2 | (1.9) | — | — | |||||||||||||||||||
Benefit obligation at end of year | $ | 475.4 | $ | 413.7 | $ | 24.6 | $ | 27.5 | |||||||||||||||
Change in Fair Value of Plan Assets | |||||||||||||||||||||||
Plan assets at beginning of year | 369.8 | 435.6 | — | — | |||||||||||||||||||
Actual return on plan assets | 84.6 | (23.9) | — | — | |||||||||||||||||||
Effect of exchange rate changes | 1.3 | (2.0) | — | — | |||||||||||||||||||
Company contributions | 1.9 | 6.6 | 2.9 | 2.4 | |||||||||||||||||||
Benefits paid | (24.9) | (46.5) | (2.9) | (2.4) | |||||||||||||||||||
Plan assets at end of year | $ | 432.7 | $ | 369.8 | $ | — | $ | — | |||||||||||||||
Funded Status at end of year | $ | (42.7) | $ | (43.9) | $ | (24.6) | $ | (27.5) | |||||||||||||||
Amount Recognized | |||||||||||||||||||||||
Other liabilities and other assets (net) | $ | (42.7) | $ | (43.9) | $ | (24.6) | $ | (27.5) | |||||||||||||||
Accumulated other comprehensive loss (income): | |||||||||||||||||||||||
Net actuarial loss (gain) | 118.5 | 125.2 | (3.1) | (2.2) | |||||||||||||||||||
Prior service credit | — | — | (1.2) | (1.4) | |||||||||||||||||||
Accumulated other comprehensive loss (income) | 118.5 | 125.2 | (4.3) | (3.6) | |||||||||||||||||||
Total recognized | $ | 75.8 | $ | 81.3 | $ | (28.9) | $ | (31.1) | |||||||||||||||
After-tax amount recognized in accumulated other comprehensive loss (gain) | $ | 88.6 | $ | 95.4 | $ | (3.2) | $ | (2.8) | |||||||||||||||
The aggregate accumulated benefit obligation for the defined benefit pension plans was $450.5 million at December 31, 2019 and $394.8 million at December 31, 2018.
66
GATX CORPORATION AND SUBSIDIARIES
NOTES TO CONSOLIDATED FINANCIAL STATEMENTS (Continued)
The following table shows our pension plans that have a projected benefit obligation in excess of plan assets as of December 31 (in millions):
| 2019 | 2018 | ||||||||||
| Projected benefit obligations | $ | 354.1 | $ | 303.8 | |||||||
| Fair value of plan assets | 300.4 | 255.5 | |||||||||
The following table shows our pension plans that have an accumulated benefit obligation in excess of plan assets as of December 31 (in millions):
| 2019 | 2018 | ||||||||||
| Accumulated benefit obligations | $ | 37.0 | $ | 30.0 | |||||||
| Fair value of plan assets | — | — | |||||||||
The following table shows the components of net periodic cost (benefit) for the year ended December 31 (in millions):
| 2019 Pension Benefits | 2018 Pension Benefits | 2017 Pension Benefits | 2019 Retiree Health and Life | 2018 Retiree Health and Life | 2017 Retiree Health and Life | ||||||||||||||||||||||||||||||
Service cost | $ | 6.5 | $ | 8.2 | $ | 6.5 | $ | 0.2 | $ | 0.2 | $ | 0.2 | |||||||||||||||||||||||
Interest cost | 15.2 | 14.7 | 15.4 | 0.9 | 1.0 | 1.1 | |||||||||||||||||||||||||||||
Expected return on plan assets | (22.0) | (22.2) | (24.0) | — | — | — | |||||||||||||||||||||||||||||
Settlement expense | — | 2.1 | 0.2 | — | — | — | |||||||||||||||||||||||||||||
Amortization of: | |||||||||||||||||||||||||||||||||||
Unrecognized prior service credit | — | — | — | (0.2) | (0.1) | (0.2) | |||||||||||||||||||||||||||||
Unrecognized net actuarial loss (gain) | 7.9 | 10.0 | 9.3 | (0.1) | — | (0.3) | |||||||||||||||||||||||||||||
Net periodic cost | $ | 7.6 | $ | 12.8 | $ | 7.4 | $ | 0.8 | $ | 1.1 | $ | 0.8 | |||||||||||||||||||||||
The service cost component of net period cost is recorded in selling, general and administrative expense in the statements of comprehensive income, and the non-service components are recorded in other expense.
We amortize the unrecognized prior service credit using a straight-line method over the average remaining service period of the employees we expect to receive benefits under the plan. We amortize the unrecognized net actuarial loss (gain), which is subject to certain averaging conventions, over the average remaining service period of active employees.
The following table shows the amounts we expect to recognize as components of net periodic cost in 2020 from amounts recorded in accumulated comprehensive loss (income) as of December 31, 2019 (in millions):
| Pension Benefits | Retiree Health and Life | ||||||||||
| Unrecognized net actuarial loss (gain) | $ | 12.4 | $ | (0.2) | |||||||
| Unrecognized prior service cost | — | (0.2) | |||||||||
67
GATX CORPORATION AND SUBSIDIARIES
NOTES TO CONSOLIDATED FINANCIAL STATEMENTS (Continued)
We use the following assumptions to measure the benefit obligation, compute the expected long-term return on assets, and measure the periodic cost for our defined benefit pension plans and other post-retirement benefit plans for the years ended December 31:
| 2019 | 2018 | ||||||||||
Domestic defined benefit pension plans | |||||||||||
| Benefit Obligation at December 31: | |||||||||||
| Discount rate — salaried funded plans | 3.17 | % | 4.32 | % | |||||||
| Discount rate — salaried unfunded plans | 2.45% - 3.12% | 3.72% - 4.26% | |||||||||
| Discount rate — hourly funded plan | 3.35 | % | 4.42 | % | |||||||
| Rate of compensation increases — salaried funded and unfunded plans | 3.00 | % | 3.00 | % | |||||||
| Rate of compensation increases — hourly funded plans | n/a | n/a | |||||||||
| Net Periodic Cost (Benefit) for the years ended December 31: | |||||||||||
| Discount rate — salaried funded and unfunded plans | 4.32 | % | 3.68 | % | |||||||
| Discount rate — hourly funded plan | 4.43 | % | 3.74 | % | |||||||
| Expected return on plan assets — salaried funded plan | 6.20 | % | 5.90 | % | |||||||
| Expected return on plan assets — hourly funded plan | 6.00 | % | 5.50 | % | |||||||
| Rate of compensation increases — salaried funded and unfunded plans | 3.00 | % | 2.50 | % | |||||||
| Rate of compensation increases — hourly funded plan | n/a | n/a | |||||||||
| Foreign defined benefit pension plan | |||||||||||
| Benefit Obligation at December 31: | |||||||||||
| Discount rate | 1.90 | % | 2.60 | % | |||||||
| Rate of pension-in-payment increases | 3.00 | % | 3.20 | % | |||||||
| Net Periodic Cost (Benefit) for the years ended December 31: | |||||||||||
| Discount rate | 2.60 | % | 2.40 | % | |||||||
| Expected return on plan assets | 4.00 | % | 4.10 | % | |||||||
| Rate of pension-in-payment increases | 3.20 | % | 3.10 | % | |||||||
| Other post-retirement benefit plans | |||||||||||
| Benefit Obligation at December 31: | |||||||||||
| Discount rate - combined health | 2.88 | % | 4.06 | % | |||||||
| Discount rate - combined life insurance | 3.19 | % | 4.32 | % | |||||||
| Rate of compensation increases | n/a | n/a | |||||||||
| Net Periodic Cost (Benefit) for the years ended December 31: | |||||||||||
| Discount rate - combined health | 4.05 | % | 3.41 | % | |||||||
| Discount rate - combined life insurance | 4.32 | % | 3.66 | % | |||||||
| Rate of compensation increases | n/a | n/a | |||||||||
68
GATX CORPORATION AND SUBSIDIARIES
NOTES TO CONSOLIDATED FINANCIAL STATEMENTS (Continued)
We calculate the present value of expected future pension and post-retirement cash flows as of the measurement date using a discount rate. We base the discount rate on yields for high-quality, long-term bonds with durations similar to that of our projected benefit obligation. We base the expected return on our plan assets on current and expected asset allocations, as well as historical and expected returns on various categories of plan assets. We routinely review our historical returns along with current market conditions to ensure our expected return assumption is reasonable and appropriate.
| 2019 | 2018 | ||||||||||
| Assumed Health Care Cost Trend Rates at December 31: | |||||||||||
| Health care cost trend assumed for next year | |||||||||||
| Medical claims - pre age 65 | 6.40 | % | 6.70 | % | |||||||
| Medical claims - post age 65 | 5.60 | % | 5.80 | % | |||||||
| Prescription drugs claims - pre age 65 | 8.80 | % | 9.30 | % | |||||||
| Prescription drugs claims - post age 65 | 8.60 | % | 9.20 | % | |||||||
| Rate to which the cost trend is expected to decline (the ultimate trend rate) | |||||||||||
| Medical claims | 4.50 | % | 4.50 | % | |||||||
| Prescription drugs claims | 4.50 | % | 4.50 | % | |||||||
| Year that rate reaches the ultimate trend rate | |||||||||||
| Medical claims | 2028 | 2026 | |||||||||
| Prescription drugs claims | 2028 | 2026 | |||||||||
The health care cost trend, which is based on projected growth rates for medical and prescription drug claims, has an effect on our other post-retirement benefit costs and obligations. The following table shows the effects of a one percentage point change in the health care cost trend rate on service and interest costs for the year ended December 31, 2019 and the post-retirement benefit obligation as of December 31, 2019 (in millions):
| | One Percentage Point Increase | One Percentage Point Decrease | |||||||||
| Effect on total of service and interest cost (1) | $ | — | $ | — | |||||||
| Effect on post-retirement benefit obligation | 0.5 | (0.5) | |||||||||
_________
(1) The effect of a one percentage point increase (decrease) was less than $0.1 million.
69
GATX CORPORATION AND SUBSIDIARIES
NOTES TO CONSOLIDATED FINANCIAL STATEMENTS (Continued)
Our investment policies require that asset allocations of domestic and foreign funded pension plans be maintained at certain targets. The following table shows our weighted-average asset allocations of our domestic funded pension plans at December 31, 2019 and 2018, and current target asset allocation for 2020, by asset category:
| | Plan Assets for Salaried Employees at December 31 | ||||||||||||||||
| Target | 2019 | 2018 | |||||||||||||||
| Asset Category | |||||||||||||||||
| Equity securities | 45.6 | % | 46.6 | % | 44.1 | % | |||||||||||
| Debt securities | 51.0 | % | 48.5 | % | 51.8 | % | |||||||||||
| Real estate | 3.4 | % | 3.4 | % | 3.9 | % | |||||||||||
| Cash | — | % | 1.5 | % | 0.2 | % | |||||||||||
| 100.0 | % | 100.0 | % | 100.0 | % | ||||||||||||
| | | Plan Assets for Hourly Employees at December 31 | |||||||||||||||
| Target | 2019 | 2018 | |||||||||||||||
| Asset Category | |||||||||||||||||
| Equity securities | 30.0 | % | 30.5 | % | 30.3 | % | |||||||||||
| Debt securities | 67.0 | % | 65.1 | % | 64.9 | % | |||||||||||
| Real estate | 3.0 | % | 3.2 | % | 4.7 | % | |||||||||||
| Cash | — | % | 1.2 | % | 0.1 | % | |||||||||||
| 100.0 | % | 100.0 | % | 100.0 | % | ||||||||||||
The following table shows the weighted-average asset allocations of our foreign funded pension plan at December 31, 2019 and 2018, and current target asset allocation for 2020, by asset category:
| | | Plan Assets at December 31 | |||||||||||||||
| Target | 2019 | 2018 | |||||||||||||||
| Asset Category | |||||||||||||||||
| Equity securities | 36.8 | % | 33.4 | % | 33.4 | % | |||||||||||
| Debt securities | 63.2 | % | 66.6 | % | 66.6 | % | |||||||||||
| 100.0 | % | 100.0 | % | 100.0 | % | ||||||||||||
The following table sets forth the fair value of our pension plan assets as of December 31 (in millions):
| 2019 | 2018 | ||||||||||
| Assets measured at net asset value (1): | |||||||||||
Short-term investment fund | $ | 5.9 | $ | 0.7 | |||||||
Common stock collective trust funds | 181.3 | 148.2 | |||||||||
Fixed income group trusts | 232.4 | 207.1 | |||||||||
Real estate collective trust funds | 13.1 | 13.8 | |||||||||
Total | $ | 432.7 | $ | 369.8 | |||||||
_______
(1) In accordance with the relevant accounting standards, investments measured at fair value using the net asset value per share (or its equivalent) practical expedient are not recorded in any specific category of the fair value hierarchy.
70
GATX CORPORATION AND SUBSIDIARIES
NOTES TO CONSOLIDATED FINANCIAL STATEMENTS (Continued)
The following is a description of the valuation techniques and inputs used as of December 31, 2019 and 2018.
Short-term investment fund
We value the short-term investment fund based on the closing net asset values ("NAV") quoted by the funds. The short-term investment fund is a highly liquid investment in obligations of the U.S. Government, or its agencies or instrumentalities, and the related money market instruments. The short-term investment fund has no unfunded commitments, restrictions on redemption frequency, or advance notice periods required for redemption. The fund seeks to provide safety of principal, daily liquidity, and a competitive yield over the long term.
Common stock collective trust funds and fixed income group trusts
We value common stock collective trust funds and fixed income group trusts based on the closing NAV prices quoted by the funds. None of the collective trusts or the group trusts have unfunded commitments, restrictions on redemption frequency, or advance notice periods required for redemption. The investment objective of each of the common stock funds is long-term total return through capital appreciation and current income. The fixed income funds are each designed to deliver safety and stability by preserving principal and accumulated earnings. The group trust seeks to achieve, over an extended period of time, total returns comparable or superior to broad measures of the long-term domestic investment grade credit bond market.
Real estate collective trust funds
We value real estate collective trust funds based on the NAV provided by the funds' administrators. A lack of liquidity in the funds may limit or delay redemptions. The investment objective of the real estate funds, which are diversified by location and property type, is long-term return through property appreciation, current income, and timely sales.
The primary investing objective of the pension plans is to provide benefits to plan participants and their beneficiaries. To achieve this goal, we invest in a diversified portfolio of equities, debt, and real estate investments to maximize return and to keep long-term investment risk at a reasonable level. Equity investments are diversified across U.S. and non-U.S. stocks, growth and value stocks, and small cap and large cap stocks. Debt securities are predominately investments in long-term, investment-grade corporate bonds. Real estate investments include investments in funds that are diversified by location and property type.
On a timely basis, but not less than twice a year, we formally review pension plan investments to ensure we adhere to investment guidelines and our stated investment approach. Our review also evaluates the reasonableness of our investment decisions and risk positions. We compare our investments' performance to indices and peers to determine if investment performance has been acceptable.
In 2020, we expect to contribute approximately $6.2 million to our pension and other post-retirement benefit plans. Additional contributions to the domestic funded pension plans will depend on investment returns on plan assets and actuarial experience.
The following table shows benefit payments, which reflect expected future service (in millions):
| Funded Plans | Unfunded Plans | Retiree Health and Life | |||||||||||||||
| 2020 | $ | 28.8 | $ | 3.2 | $ | 3.0 | |||||||||||
| 2021 | 28.6 | 3.1 | 2.4 | ||||||||||||||
| 2022 | 28.4 | 3.3 | 2.2 | ||||||||||||||
| 2023 | 28.6 | 3.5 | 2.0 | ||||||||||||||
| 2024 | 29.9 | 3.5 | 1.9 | ||||||||||||||
| Years 2025-2029 | 141.3 | 16.7 | 7.8 | ||||||||||||||
| Total | $ | 285.6 | $ | 33.3 | $ | 19.3 | |||||||||||
71
GATX CORPORATION AND SUBSIDIARIES
NOTES TO CONSOLIDATED FINANCIAL STATEMENTS (Continued)
In addition to our defined benefit plans, we have two 401(k) retirement savings plans available to substantially all salaried employees and certain other employee groups. We may contribute to the plans as specified by their respective terms and as our board of directors determines. Contributions to our 401(k) retirement plans were $2.3 million for 2019, $2.2 million for 2018, and $1.9 million for 2017.
Multiemployer Plans
On February 7, 2020, we entered into an agreement to sell ASC. On May 14, 2020, we completed the sale of our ASC business, subject to customary post-closing adjustments. See "Note 26. Discontinued Operations" for additional information. The multiemployer plan information below relates to ASC. Most of the shipboard personnel at ASC participate in various multiemployer benefit plans that provide pension, health care, and post-retirement and other benefits to active and retired employees. Unlike single employer plans, we do not recognize plan assets or obligations for multiemployer plans on our balance sheet. Rather, we recognize our contributions to the plans as marine operating expenses. The amounts we contribute are based on the number of crew hours worked, which depends on the number of vessels deployed and aggregate operating days in a particular year. The risks of participating in these multiemployer plans are different from single employer plans in the following aspects:
•Assets contributed by one employer may be used to provide benefits to employees of other participating employers;
•If a participating employer fails to make its required contributions, any unfunded obligations of the plan may be the responsibility of the remaining participating employers; and
•If an employer chooses to stop participating in a multiemployer plan, the plan may require the withdrawing company to make additional contributions.
The following table shows our contributions to multiemployer benefit plans for the years indicated (in millions):
| Multiemployer Plans | EIN and Pension Plan Number | Pension Protection Act Zone Status | GATX Contributions | Collective Bargaining Agreement Expiration Date | ||||||||||||||||||||||||||||||||||
| 2019 | 2018 | 2017 | ||||||||||||||||||||||||||||||||||||
| American Maritime Officers Pension Plan (1) | 13-1969709-001 | Green | $ | 2.9 | $ | 2.3 | $ | 2.3 | 2/7/2021 | |||||||||||||||||||||||||||||
| Other multiemployer post-retirement plans | 6.2 | 5.8 | 6.1 | |||||||||||||||||||||||||||||||||||
| Total | $ | 9.1 | $ | 8.1 | $ | 8.4 | ||||||||||||||||||||||||||||||||
_______
(1) As of December 31, 2019, the actuary for the American Maritime Officers Pension Plan certified that the plan is in the “green zone” as defined by the Pension Protection Act of 2006. Our share of the total contributions was less than 5% in 2019 and 2018 and more than 5% in 2017. No surcharges were imposed for 2019, 2018, or 2017.
NOTE 11. Share-Based Compensation
We provide equity awards to our employees under the GATX Corporation 2012 Incentive Award Plan, including grants of non-qualified stock options, stock appreciation rights, restricted stock units, performance shares, and phantom stock awards. As of December 31, 2019, 6.4 million shares were authorized under the 2012 Plan and 3.2 million shares were available for future issuance. We recognize compensation expense for our equity awards in selling, general and administrative expenses over the applicable service period of each award. Share-based compensation expense was $19.3 million for 2019, $19.3 million for 2018, and $14.3 million for 2017, and the related tax benefits were $4.8 million for 2019, $4.8 million for 2018, and $5.5 million for 2017.
72
GATX CORPORATION AND SUBSIDIARIES
NOTES TO CONSOLIDATED FINANCIAL STATEMENTS (Continued)
Stock Options and Stock Appreciation Rights
Stock options and stock appreciation rights entitle the holder to purchase shares of common stock for periods up to seven years from the grant date. Stock appreciation rights entitle the holder to receive the difference between the market price of our common stock at the time of exercise and the exercise price, either in shares of common stock, cash, or a combination thereof, at our discretion. Stock options entitle the holder to purchase shares of our common stock at a specified exercise price. The dividends that accrue on all stock options and stock appreciation rights are paid upon vesting and continue to be paid until the stock options or stock appreciation rights are exercised, canceled, or expire. The exercise price for stock options and stock appreciation rights is equal to the average of the high and low trading prices of our common stock on the date of grant. We recognize compensation expense on a straight-line basis over the vesting period of the award, which is generally three years.
The estimated fair value of a stock option or stock appreciation right is the sum of the value we derive using the Black-Scholes option pricing model and the present value of dividends we expect to pay over the expected term of the award. The Black-Scholes valuation incorporates various assumptions, including expected term, expected volatility, and risk free interest rates. We base the expected term on historical exercise patterns and post-vesting terminations, and we base the expected volatility on the historical volatility of our stock price over a period equal to the expected term. We use risk-free interest rates that are based on the implied yield on recently-issued U.S. Treasury zero-coupon bonds with a term comparable to the expected term. No stock appreciation rights were issued during 2019, 2018, and 2017.
The following table shows the weighted-average fair value for our stock options and the assumptions we used to estimate fair value:
| 2019 | 2018 | 2017 | |||||||||||||||
| Weighted-average estimated fair value | $ | 22.23 | $ | 21.87 | $ | 19.40 | |||||||||||
| Quarterly dividend rate | $ | 0.46 | $ | 0.44 | $ | 0.42 | |||||||||||
| Expected term of stock options, in years | 4.2 | 4.5 | 4.7 | ||||||||||||||
| Risk-free interest rate | 2.5 | % | 2.4 | % | 1.9 | % | |||||||||||
Dividend yield | 2.6 | % | 2.5 | % | 2.8 | % | |||||||||||
Expected stock price volatility | 28.9 | % | 27.9 | % | 27.7 | % | |||||||||||
Present value of dividends | $ | 7.29 | $ | 7.51 | $ | 7.50 | |||||||||||
The following table shows information about outstanding stock options and stock appreciation rights for the year ended December 31, 2019:
| Number of Stock Options and Stock Appreciation Rights (in thousands) | Weighted-Average Exercise Price | |||||||||||||
| Outstanding at beginning of the year | 1,399 | $ | 55.73 | |||||||||||
| Granted | 327 | 71.53 | ||||||||||||
| Exercised | (150) | 51.34 | ||||||||||||
| Forfeited/Cancelled | (25) | 66.24 | ||||||||||||
| Outstanding at end of the year | 1,551 | 59.32 | ||||||||||||
| Vested and exercisable at end of the year | 927 | 52.64 | ||||||||||||
73
GATX CORPORATION AND SUBSIDIARIES
NOTES TO CONSOLIDATED FINANCIAL STATEMENTS (Continued)
The following table shows the aggregate intrinsic value of stock options and stock appreciation rights exercised in 2019, 2018, and 2017, and the weighted-average remaining contractual term and aggregate intrinsic value of stock options and stock appreciation rights outstanding and vested as of December 31, 2019:
| Stock Options and Stock Appreciation Rights | Weighted-Average Remaining Contractual Term (Years) | Aggregate Intrinsic Value (in millions) | ||||||||||||
| Exercised in 2017 | $ | 4.4 | ||||||||||||
| Exercised in 2018 | 17.2 | |||||||||||||
| Exercised in 2019 | 4.0 | |||||||||||||
| Outstanding at December 31, 2019 (a) | 3.8 | 36.7 | ||||||||||||
| Vested and exercisable at December 31, 2019 | 2.7 | 28.1 | ||||||||||||
_______
(a) As of December 31, 2019, 371,716 stock appreciation rights and 1,179,619 stock options were outstanding.
Total cash received from employees for exercises of stock options during the years ended December 31, 2019, 2018, and 2017 was $4.4 million, $3.7 million, and $1.6 million. As of December 31, 2019, we had $7.4 million of unrecognized compensation expense related to nonvested stock options and stock appreciation rights , which we expect to recognize over a weighted-average period of 1.7 years.
Restricted Stock Units and Performance Shares
Restricted stock units entitle the recipient to receive a specified number of restricted shares of common stock upon vesting. Restricted stock units do not carry voting rights and are not transferable prior to the expiration of a specified restriction period, which is generally three years, as determined by the Compensation Committee of the Board of Directors ("Compensation Committee"). We accrue dividends on all restricted stock units and pay those dividends when the awards vest. We recognize compensation expense for these awards over the applicable vesting period.
Performance shares are restricted shares that we grant to key employees for achieving certain strategic objectives. The shares convert to common stock at the end of a specified performance period if predetermined performance goals are achieved, as determined by the Compensation Committee. We estimate the number of shares we expect will vest as a result of actual performance against the performance criteria at the time of grant to determine total compensation expense to be recognized. We reevaluate the estimate annually and adjust total compensation expense for any changes to the estimate of the number of shares we expect to vest. The performance shares granted include an option to settle shares earned in cash upon vesting for certain eligible employees. As a result, these awards are accounted for as liability awards, and the liability and related compensation expense is adjusted to reflect the fair value of the underlying shares at the end of each reporting period. We recognize compensation expense for these awards over the applicable vesting period, which is generally three years.
We value our restricted stock units and performance share awards using the average of the high and low values of our common stock on the grant date of the awards. As of December 31, 2019, there was $10.3 million of unrecognized compensation expense related to these awards, which we expect to be recognized over a weighted-average period of 2.0 years.
74
GATX CORPORATION AND SUBSIDIARIES
NOTES TO CONSOLIDATED FINANCIAL STATEMENTS (Continued)
The following table shows information about restricted stock units and performance shares for the year ended December 31, 2019:
| Number of Share Units Outstanding (in thousands) | Weighted-Average Grant-Date Fair Value | ||||||||||
| Restricted Stock Units: | |||||||||||
| Nonvested at beginning of the year | 204 | $ | 57.57 | ||||||||
| Granted | 43 | 71.56 | |||||||||
| Vested | (75) | 42.21 | |||||||||
| Forfeited | (8) | 67.58 | |||||||||
| Nonvested at end of the year | 164 | 67.73 | |||||||||
| Performance Shares: | |||||||||||
| Nonvested at beginning of the year | 143 | $ | 62.08 | ||||||||
| Granted | 58 | 71.98 | |||||||||
| Net increase due to estimated performance | 16 | 66.20 | |||||||||
| Vested | (82) | 59.77 | |||||||||
| Forfeited | — | N/A | |||||||||
| Nonvested at end of the year | 135 | 68.23 | |||||||||
The total fair value of restricted stock units and performance shares that vested during the year was $12.6 million in 2019, $12.0 million in 2018, and $6.5 million in 2017.
Phantom Stock Awards
We grant phantom stock awards to non-employee directors as a component of their compensation for service on our board of directors. In accordance with the terms of the phantom stock awards, each director is credited with a quantity of units that equate to, but are not, common shares. Phantom stock awards are dividend participating, and all dividends are reinvested in additional phantom shares at the average of the high and low trading prices of our stock on the dividend payment date. At the expiration of each director’s service on the board of directors, or in accordance with his or her deferral election, whole units of phantom stock will be settled with shares of common stock and fractional units will be paid in cash. In 2019, we granted 22,641 units of phantom stock and there were 207,654 units outstanding as of December 31, 2019.
75
GATX CORPORATION AND SUBSIDIARIES
NOTES TO CONSOLIDATED FINANCIAL STATEMENTS (Continued)
NOTE 12. Income Taxes
In 2017, the Tax Cuts and Jobs Act (the "Tax Act") was enacted and we recorded a one-time net tax benefit of $315.9 million, which represented our provisional estimate of the impact of the Tax Act. This amount included a net benefit of $371.4 million associated with the remeasurement of our net deferred tax liability utilizing the lower U.S. tax rate. The Tax Act also imposed a one-time transitional repatriation tax of $57.2 million on certain undistributed earnings of our non-U.S. subsidiaries and affiliates. Additional guidance was issued by the Internal Revenue Service, the U.S. Department of the Treasury, and state taxing authorities during 2018 and, as a result, we recorded an adjustment to our provisional estimates. Specifically, in the fourth quarter of 2018, we recorded an additional net tax benefit of $16.5 million based on this clarifying guidance, the filing of our 2017 income tax returns, and the final determination of our foreign undistributed earnings and associated tax attributes. We do not expect to record any future material adjustments associated with the Tax Act.
Deferred income taxes are the net tax effects of temporary differences between the carrying amounts of assets and liabilities for financial reporting purposes and the amounts used for income tax purposes. We expect at this time to continue reinvestment of foreign earnings outside the U.S. indefinitely. Consequently, our tax provision does not include any deferred tax costs that might arise due to book versus tax basis differences in investments in foreign subsidiaries. While the Tax Act provided an exemption from U.S. income taxation on future dividend distributions from foreign subsidiaries and affiliates, taxes may arise from withholding taxes or on foreign exchange or other gains recognized in connection with the basis differences in our investments in foreign subsidiaries. The ultimate tax cost of repatriating these earnings depends on tax laws in effect and other circumstances at the time of distribution.
The following table shows the significant components of our deferred tax liabilities and assets for continuing and discontinued operations as of December 31 (in millions):
| 2019 | 2018 | ||||||||||
| Deferred Tax Liabilities | |||||||||||
| Book/tax basis difference due to depreciation | $ | 930.7 | $ | 890.7 | |||||||
| Right-of-use assets | 103.9 | — | |||||||||
| Investments in affiliated companies | 37.3 | 36.2 | |||||||||
| Lease accounting | 39.8 | 12.2 | |||||||||
| Other | 3.2 | 1.9 | |||||||||
| Total deferred tax liabilities | $ | 1,114.9 | $ | 941.0 | |||||||
| Deferred Tax Assets | |||||||||||
| Lease liability | 108.6 | — | |||||||||
| Federal net operating loss | 15.1 | — | |||||||||
| Alternative minimum tax credit | 1.7 | 3.4 | |||||||||
| Foreign tax credit | 0.8 | 0.2 | |||||||||
| Valuation allowance on foreign tax credit | (0.8) | (0.2) | |||||||||
| State net operating loss | 31.1 | 26.4 | |||||||||
| Valuation allowance on state net operating loss | (12.9) | (12.6) | |||||||||
| Foreign net operating loss | 2.2 | 2.1 | |||||||||
| Valuation allowance on foreign net operating loss | — | (0.3) | |||||||||
| Accruals not currently deductible for tax purposes | 23.2 | 24.8 | |||||||||
| Allowance for losses | 1.2 | 1.1 | |||||||||
| Pension and post-retirement benefits | 16.8 | 17.8 | |||||||||
| Other | 3.6 | 0.5 | |||||||||
| Total deferred tax assets | $ | 190.6 | $ | 63.2 | |||||||
| Net deferred tax liabilities, including continuing and discontinued operations (1) | $ | 924.3 | $ | 877.8 | |||||||
_______
(1) Includes net deferred tax liabilities of $35.8 million and $36.0 million for the years ended December 31, 2019 and 2018, respectively related to discontinued operations of the ASC business segment.
76
GATX CORPORATION AND SUBSIDIARIES
NOTES TO CONSOLIDATED FINANCIAL STATEMENTS (Continued)
In 2019, we adopted ASU 2016-02 related to lease accounting. See "Note 2. Accounting Changes" for additional information. In accordance with this new accounting standard, we have recorded a deferred tax asset of $108.6 million related to our operating lease liabilities and a deferred tax liability of $103.9 million related to our operating lease right-of-use assets as of December 31, 2019. There was no tax-related impact to our income statement resulting from this change.
At December 31, 2019, we had a U.S. federal tax net operating loss carryforward of $72.1 million that can be carried forward indefinitely until the loss is fully recovered. Under the Tax Act, the utilization of net operating losses carried forward are limited to 80% of future taxable income. At December 31, 2019, we had an alternative minimum tax credit of $1.7 million, which may be utilized or refunded in the next year. We also had foreign tax credits of $0.8 million that expire after 2027. We have recorded a $0.8 million valuation allowance related to these credits, as we believe it is more likely than not that we will be unable to utilize them.
At December 31, 2019, we had state tax net operating losses of $31.1 million, net of federal benefits that are scheduled to expire at various times beginning in 2020. We have recorded a $12.9 million valuation allowance related to state net operating losses, as we believe it is more likely than not that we will be unable to use all of these losses. Additionally, we had foreign net operating losses of $2.2 million, which have an unlimited carryforward period. Our use of future operating losses depends on a number of variables, including the amount of taxable income and state apportionment factors for state net operating loss carryforwards.
At December 31, 2019, our gross liability for unrecognized tax benefits was $1.6 million. We recognize interest and penalties related to unrecognized tax benefits as income tax expense. We have not accrued any amounts for penalties. To the extent interest is not assessed or is otherwise reduced with respect to uncertain tax positions, we will record any required adjustment as a reduction of income tax expense.
We file one consolidated federal income tax return with our domestic subsidiaries in the U.S. jurisdiction, as well as tax returns in various state and foreign jurisdictions. As of December 31, 2019, all audits or statutes of limitations with respect to our federal tax returns for years prior to 2016 have been closed or expired. Additionally, we currently have no ongoing open federal or state income tax audits.
The following table shows the components of income before income taxes, excluding affiliates, for continuing and discontinued operations for the years ended December 31 (in millions):
| 2019 | 2018 | 2017 | |||||||||||||||
| Domestic | $ | 77.0 | $ | 108.9 | $ | 124.5 | |||||||||||
| Foreign | 106.1 | 86.2 | 89.9 | ||||||||||||||
| Total, including continuing and discontinued operations (1) | $ | 183.1 | $ | 195.1 | $ | 214.4 | |||||||||||
_______
(1) Includes $37.9 million, $24.4 million, and $16.9 million for the years ended December 31, 2019 , 2018, and 2017, respectively related to discontinued operations of the ASC business segment.
77
GATX CORPORATION AND SUBSIDIARIES
NOTES TO CONSOLIDATED FINANCIAL STATEMENTS (Continued)
The following table shows income taxes, excluding domestic and foreign affiliates, for continuing and discontinued operations for the years ended December 31 (in millions):
| 2019 | 2018 | 2017 | |||||||||||||||
Current | |||||||||||||||||
Domestic: | |||||||||||||||||
Federal | $ | (1.7) | $ | (3.3) | $ | (1.1) | |||||||||||
State and local | (0.1) | 0.7 | (0.1) | ||||||||||||||
| $ | (1.8) | $ | (2.6) | $ | (1.2) | ||||||||||||
Foreign | 19.6 | 17.5 | 18.0 | ||||||||||||||
Total Current | $ | 17.8 | $ | 14.9 | $ | 16.8 | |||||||||||
Deferred | |||||||||||||||||
Domestic: | |||||||||||||||||
Federal | 16.7 | 2.1 | (270.0) | ||||||||||||||
State and local | 4.0 | 8.7 | 1.2 | ||||||||||||||
| $ | 20.7 | $ | 10.8 | $ | (268.8) | ||||||||||||
Foreign | 9.9 | 8.4 | 8.3 | ||||||||||||||
Total Deferred | $ | 30.6 | $ | 19.2 | $ | (260.5) | |||||||||||
Income taxes, including continuing and discontinued operations (1) | $ | 48.4 | $ | 34.1 | $ | (243.7) | |||||||||||
_______
(1) There are no current taxes attributable to the discontinued operations of the ASC business segment for any of the years presented. Deferred income taxes includes $7.5 million. $3.6 million, and $(17.3 million) for the years ended December 31, 2019, 2018, and 2017, respectively related to discontinued operations of the ASC business segment.
The following table shows the differences between our effective income tax rate and the federal statutory income tax rate for continuing and discontinued operations for the years ended December 31 (in millions):
| 2019 | 2018 | 2017 | |||||||||||||||
Income taxes at federal statutory rate | $ | 38.5 | $ | 41.0 | $ | 75.0 | |||||||||||
Adjust for effect of: | |||||||||||||||||
| Foreign tax credits | — | (1.4) | — | ||||||||||||||
| Foreign earnings taxed at applicable statutory rates | 9.8 | 7.8 | (5.5) | ||||||||||||||
| Foreign deferred tax rate change impact | (2.8) | — | — | ||||||||||||||
| Corporate owned life insurance | (0.8) | (1.0) | (0.9) | ||||||||||||||
| State income taxes | 3.2 | 5.2 | (0.5) | ||||||||||||||
| State deferred tax rate change impact | — | — | 5.0 | ||||||||||||||
| Other | 0.5 | (1.0) | (0.9) | ||||||||||||||
| Tax Act: | |||||||||||||||||
| Revaluation of deferred tax liabilities | — | 9.4 | (371.4) | ||||||||||||||
| Transition tax on foreign earnings and profits | — | (23.1) | 57.2 | ||||||||||||||
| Other | — | (2.8) | (1.7) | ||||||||||||||
| Total Tax Act impact | $ | — | $ | (16.5) | $ | (315.9) | |||||||||||
Income taxes, including continuing and discontinued operations | $ | 48.4 | $ | 34.1 | $ | (243.7) | |||||||||||
Effective income tax rate, including continuing and discontinued operations | 26.4 | % | 17.5 | % | (113.7) | % | |||||||||||
78
GATX CORPORATION AND SUBSIDIARIES
NOTES TO CONSOLIDATED FINANCIAL STATEMENTS (Continued)
In 2019, our effective tax rate was 26.4% compared to 17.5% in 2018 and (113.7)% in 2017. The 2019 effective tax rate included a net benefit of $2.8 million associated with the reduction of the corporate income tax rate in Alberta, Canada. Excluding this item, our effective tax rate was 28.0%. The 2018 effective tax rate included a net benefit of $16.5 million associated with the finalization of the accounting for the income tax effects from the adoption of the Tax Act on our operations. This amount included a net expense of $9.4 million associated with the remeasurement of our net deferred tax liability based on the filing of our 2017 income tax returns. It also included a net benefit of $23.1 million with respect to the transitional repatriation tax, based on our final determination of all applicable tax attributes associated with the undistributed earnings of our non-U.S. subsidiaries and affiliates. The 2018 effective tax rate also reflected the net benefit of $1.4 million from the utilization of foreign tax credits. Excluding the impacts of the Tax Act adjustment and foreign tax credits, our effective tax rate was 26.7% in 2018. The 2017 effective tax rate reflected our provisional net tax benefit of $315.9 million, associated with the initial impact of the Tax Act. The 2017 effective tax rate also included an incremental deferred state income tax of $5.0 million associated with a change in our consolidated effective state tax rate. Excluding the impacts of the Tax Act adjustment and the deferred state income tax adjustment, our 2017 effective tax rate was 31.2%.
The adjustment for foreign earnings in each year reflected the impact of applicable statutory tax rates on income earned at our foreign subsidiaries. State income taxes are recognized on domestic pretax income or loss. The amount of our domestic income subject to state taxes relative to our total worldwide income impacts the effect state income tax has on our overall income tax rate.
Separately, our affiliates incurred income taxes of $18.0 million, $10.8 million, and $12.0 million respectively in 2019, 2018, and 2017.
NOTE 13. Concentrations
Concentration of Revenues
We derived revenue from a wide range of industries and companies. In 2019, we generated approximately 28% of our total revenues from customers in the petroleum industry, 21% from the chemical industry, 20% from the transportation industry, 11% from food/agriculture industries and 11% from the mining, minerals and aggregates industry. Our foreign identifiable revenues were primarily derived in Canada, Germany, Poland, Mexico, and Austria.
Concentration of Credit Risk
We did not have revenue concentrations greater than 10% from any particular customer for any of the years ended December 31, 2019, 2018, and 2017. Under our lease agreements with customers, we typically retain legal ownership of the assets unless such assets have been financed by sale-leasebacks. We perform a credit evaluation prior to approval of a lease contract. Subsequently, we monitor the creditworthiness of the customer and the value of the collateral on an ongoing basis. We maintain an allowance for losses to provide for credit losses inherent in our receivables balances.
Concentration of Labor Force
As of December 31, 2019, collective bargaining agreements covered approximately 37% of our employees, of which agreements covering 9% of employees will expire within the next year. The hourly employees at our US service centers are represented by the United Steelworkers. Employees at three of Rail North America's Canadian service centers are represented by Unifor, the union formerly known as the Communication, Energy and Paperworkers Union of Canada, and the Employee Shop Committee of Riviere-des-Prairies. Certain employees of GATX Rail Europe are represented by three unions in Poland. We have begun negotiating new terms for the agreements expiring in 2020, and no work interruptions or other adverse events are currently expected.
NOTE 14. Commercial Commitments
We have entered into various commercial commitments, such as guarantees, standby letters of credit and performance bonds, related to certain transactions. These commercial commitments require us to fulfill specific obligations in the event of third-party demands. Similar to our balance sheet investments, these commitments expose us to credit, market, and equipment risk. Accordingly, we evaluate these commitments and other contingent obligations using techniques similar to those we use to evaluate funded transactions.
79
GATX CORPORATION AND SUBSIDIARIES
NOTES TO CONSOLIDATED FINANCIAL STATEMENTS (Continued)
The following table shows our commercial commitments as of December 31 (in millions):
| 2019 | 2018 | ||||||||||
| Lease payment guarantees | $ | — | $ | 2.0 | |||||||
| Standby letters of credit and performance bonds | 9.3 | 9.5 | |||||||||
| Total commercial commitments (1) | $ | 9.3 | $ | 11.5 | |||||||
_______
(1) There were no liabilities recorded on the balance sheet for commercial commitments at December 31, 2019 and December 31, 2018. As of December 31, 2019, our outstanding commitments expire in 2020 through 2021. We are not aware of any event that would require us to satisfy any of our commitments.
Lease payment guarantees are commitments to financial institutions to make lease payments for a third party in the event of default. We reduce any liability that may result from these guarantees by the value of the underlying asset or group of assets. As of December 31, 2019, our obligations for these guarantees had concluded.
We are also parties to standby letters of credit and performance bonds, which primarily relate to contractual obligations and general liability insurance coverages. No material claims have been made against these obligations, and no material losses are anticipated.
80
GATX CORPORATION AND SUBSIDIARIES
NOTES TO CONSOLIDATED FINANCIAL STATEMENTS (Continued)
NOTE 15. Earnings per Share
We compute basic earnings per share by dividing net income available to our common shareholders by the weighted-average number of shares of our common stock outstanding. We weight shares issued or reacquired during the year for the portion of the year that they were outstanding. Our diluted earnings per share reflect the impacts of our potentially dilutive securities, which include our equity compensation awards.
The following table shows the computation of our basic and diluted net income per common share for the years ended December 31 (in millions, except per share amounts):
| 2019 | 2018 | 2017 | |||||||||||||||
Numerator: | |||||||||||||||||
Net income from continuing operations | $ | 180.8 | $ | 190.5 | $ | 467.8 | |||||||||||
Net income from discontinued operations | 30.4 | 20.8 | 34.2 | ||||||||||||||
Net income | $ | 211.2 | $ | 211.3 | $ | 502.0 | |||||||||||
Denominator: | |||||||||||||||||
Weighted-average shares outstanding - basic | 35.7 | 37.6 | 38.8 | ||||||||||||||
Effect of dilutive securities: | |||||||||||||||||
| Equity compensation plans | 0.7 | 0.7 | 0.6 | ||||||||||||||
Weighted-average shares outstanding - diluted | 36.4 | 38.3 | 39.4 | ||||||||||||||
Basic earnings per share from continuing operations | $ | 5.07 | $ | 5.07 | $ | 12.07 | |||||||||||
Basic earnings per share from discontinued operations | 0.85 | 0.55 | 0.88 | ||||||||||||||
Basic earnings per share from consolidated operations | $ | 5.92 | $ | 5.62 | $ | 12.95 | |||||||||||
Diluted earnings per share from continuing operations | $ | 4.97 | $ | 4.98 | $ | 11.88 | |||||||||||
Diluted earnings per share from discontinued operations | 0.84 | 0.54 | 0.87 | ||||||||||||||
Diluted earnings per share from consolidated operations | $ | 5.81 | $ | 5.52 | $ | 12.75 | |||||||||||
NOTE 16. Goodwill
Our goodwill, all of which pertains to Rail North America and Rail International, was $81.5 million as of December 31, 2019 and $82.9 million as of December 31, 2018. In the fourth quarter of 2019, we performed a review for impairment of goodwill, and concluded that goodwill was not impaired. For 2019 and 2018, changes in the carrying amount of our goodwill resulted from fluctuations in foreign currency exchange rates.
NOTE 17. Allowance for Losses
The following table shows changes in the allowance for losses at December 31 (in millions):
| 2019 | 2018 | ||||||||||
| Beginning balance | $ | 6.4 | $ | 6.4 | |||||||
| Provision (reversal) for losses | 0.5 | (0.3) | |||||||||
| Charges to allowance | (0.6) | (0.1) | |||||||||
| Recoveries and other, including foreign exchange adjustments | (0.1) | 0.4 | |||||||||
| Ending balance | $ | 6.2 | $ | 6.4 | |||||||
81
GATX CORPORATION AND SUBSIDIARIES
NOTES TO CONSOLIDATED FINANCIAL STATEMENTS
NOTE 18. Other Assets and Other Liabilities
The following table shows the components of other assets reported on our balance sheets as of December 31 (in millions):
| 2019 | 2018 | ||||||||||
Inventory | $ | 59.4 | $ | 55.0 | |||||||
Office furniture, fixtures and other equipment, net of accumulated depreciation | 34.4 | 33.2 | |||||||||
Prepaid items | 21.5 | 9.5 | |||||||||
Prepaid pension | 11.0 | 4.4 | |||||||||
Derivatives | 8.5 | 4.9 | |||||||||
| Assets held for sale | 3.4 | 1.3 | |||||||||
Deferred financing costs | 2.6 | 3.1 | |||||||||
Other | 80.2 | 75.8 | |||||||||
Total other assets | $ | 221.0 | $ | 187.2 | |||||||
The following table shows the components of other liabilities reported on our balance sheets as of December 31 (in millions):
| 2019 | 2018 | ||||||||||
| Accrued pension and other post-retirement benefits | $ | 78.3 | $ | 75.8 | |||||||
| Environmental accruals | 14.4 | 13.7 | |||||||||
| Derivatives | 13.6 | 30.6 | |||||||||
| Deferred gains on sale-leasebacks | — | 53.8 | |||||||||
| Accrued operating lease expense | — | 4.3 | |||||||||
| Other | 32.8 | 42.1 | |||||||||
| Total other liabilities | $ | 139.1 | $ | 220.3 | |||||||
NOTE 19. Shareholders’ Equity
On January 25, 2019, our board of directors ("Board") approved a $300 million share repurchase program, pursuant to which we are authorized to purchase shares of our common stock in the open market, in privately negotiated transactions, or otherwise, including pursuant to Rule 10b5-1 plans. During 2019, we purchased 2.0 million shares of common stock for $150.0 million. In 2018, we purchased 1.5 million shares of common stock for $115.5 million. In 2017, we purchased 1.7 million shares of common stock for $100.0 million. The share repurchase program does not have an expiration date, does not obligate the Company to repurchase any dollar amount or number of shares of common stock, and may be suspended or discontinued at any time. The timing of share repurchases will be dependent on market conditions and other factors.
In accordance with our certificate of incorporation, 120 million shares of common stock are authorized, at a par value of $0.625 per share. As of December 31, 2019, 67.5 million shares were issued and 34.8 million shares were outstanding.
The following shares of common stock were reserved as of December 31, 2019 (in millions):
| GATX Corporation 2004 Equity Incentive Compensation Plan | 2.1 | ||||
| GATX Corporation 2012 Incentive Award Plan | 6.4 | ||||
| Total | 8.5 | ||||
Our certificate of incorporation also authorizes five million shares of preferred stock at a par value of $1.00 per share. We had no outstanding shares of preferred stock as of December 31, 2019 or December 31, 2018.
82
GATX CORPORATION AND SUBSIDIARIES
NOTES TO CONSOLIDATED FINANCIAL STATEMENTS
NOTE 20. Accumulated Other Comprehensive Income (Loss)
The following table shows the change in components for accumulated other comprehensive loss (in millions):
| Foreign Currency Translation Gain (Loss) | Unrealized Loss on Derivative Instruments | Post-Retirement Benefit Plans | Total | ||||||||||||||||||||
Balance at December 31, 2016 | $ | (103.7) | $ | (20.3) | $ | (87.1) | $ | (211.1) | |||||||||||||||
| Change in component | 93.2 | (39.6) | (3.2) | 50.4 | |||||||||||||||||||
| Reclassification adjustments into earnings (1) | — | 45.8 | 8.8 | 54.6 | |||||||||||||||||||
| Income tax effect | — | (1.4) | (2.1) | (3.5) | |||||||||||||||||||
Balance at December 31, 2017 | (10.5) | (15.5) | (83.6) | (109.6) | |||||||||||||||||||
| Change in component | (47.5) | 12.9 | 2.1 | (32.5) | |||||||||||||||||||
| Reclassification adjustments into earnings (1) | — | (7.4) | 9.9 | 2.5 | |||||||||||||||||||
| Income tax effect | — | (1.0) | (4.6) | (5.6) | |||||||||||||||||||
Reclassification adjustments into retained earnings (2) | — | (3.0) | (16.4) | (19.4) | |||||||||||||||||||
| Balance at December 31, 2018 | (58.0) | (14.0) | (92.6) | (164.6) | |||||||||||||||||||
| Change in component | (10.1) | 17.4 | 1.5 | 8.8 | |||||||||||||||||||
| Reclassification adjustments into earnings (1) | — | (11.8) | 7.6 | (4.2) | |||||||||||||||||||
| Income tax effect | — | (1.7) | (1.9) | (3.6) | |||||||||||||||||||
Balance at December 31, 2019 | $ | (68.1) | $ | (10.1) | $ | (85.4) | $ | (163.6) | |||||||||||||||
________
(1) See "Note 8. Fair Value Disclosure" and "Note 10. Pension and Other Post-Retirement Benefits" for impacts of the reclassification adjustments on the statement of comprehensive income.
(2) In 2018, we adopted ASU 2018-02, Income Statement Reporting - Reporting Comprehensive Income (Topic 220): Reclassification of Certain Tax Effects from Accumulated Other Comprehensive Income, which permits reclassification of certain stranded tax effects related to the Tax Act from Accumulated Other Comprehensive Income to Retained Earnings.
83
GATX CORPORATION AND SUBSIDIARIES
NOTES TO CONSOLIDATED FINANCIAL STATEMENTS (Continued)
NOTE 21. Foreign Operations
For the years ended December 31, 2019, 2018, and 2017, we did not derive revenues in excess of 10% of our consolidated revenues from any one foreign country. Additionally, at December 31, 2019 and 2018, we did not have more than 10% of our identifiable assets in any one foreign country.
The following table shows our domestic and foreign revenues and identifiable assets for the years ended or as of December 31 (in millions):
| 2019 | 2018 | 2017 | |||||||||||||||
Revenues From Continuing Operations | |||||||||||||||||
Foreign | $ | 331.1 | $ | 333.5 | $ | 323.2 | |||||||||||
United States | 871.0 | 841.6 | 881.2 | ||||||||||||||
Total | $ | 1,202.1 | $ | 1,175.1 | $ | 1,204.4 | |||||||||||
Identifiable Assets From Continuing Operations | |||||||||||||||||
Foreign | $ | 2,624.5 | $ | 2,470.9 | $ | 2,407.2 | |||||||||||
United States | 5,369.5 | 4,848.0 | 4,728.5 | ||||||||||||||
Total | $ | 7,994.0 | $ | 7,318.9 | $ | 7,135.7 | |||||||||||
NOTE 22. Legal Proceedings and Other Contingencies
Various legal actions, claims, assessments and other contingencies arising in the ordinary course of business are pending against GATX and certain of our subsidiaries. These matters are subject to many uncertainties, and it is possible that some of these matters could ultimately be decided, resolved or settled adversely.
Viareggio Derailment
In June 2009, tank cars owned by GATX Rail Austria GmbH and its subsidiaries (collectively, “GRA”) and leased to a subsidiary of the Italian state-owned railway (the "Italian Railway") were involved in a train derailment in Viareggio, Italy, resulting in personal injuries, deaths, and property damage. The accident resulted in numerous civil claims and criminal charges brought by Italian prosecutors against various Italian Railway companies, GRA, and certain of their current or former employees. The insurers for the Italian Railway and GRA have fully settled and resolved most of the civil claims. In January 2017, an Italian trial court in Lucca, Italy found the defendants guilty of negligence-based crimes related to the accident. The court imposed a fine of 1.4 million Euros against GRA and prison sentences against its employees. GRA appealed the trial court's ruling to the Court of Appeals in Florence, and on June 20, 2019, the appellate court affirmed the judgments, with minor reductions in fines and penalties. GRA and the employees will appeal to the Supreme Court in Rome, Italy. GRA will continue to incur legal expenses in connection with the appeal, although they are not expected to be material. We cannot predict the outcome of the appellate process and thus cannot reasonably estimate the possible amount or range of loss that ultimately may be incurred in connection with this litigation.
Other Litigation
GATX and its subsidiaries have been named as defendants in various other legal actions and claims, governmental proceedings, and private civil suits arising in the ordinary course of business, including environmental matters, workers’ compensation claims, and other personal injury claims. Some of these proceedings include claims for punitive as well as compensatory damages. Several of our subsidiaries have also been named as defendants or co-defendants in cases alleging injury caused by exposure to asbestos. The plaintiffs seek an unspecified amount of damages based on common law, statutory, or premises liability. In addition, demand has been made against GATX for asbestos-related claims under limited indemnities given in connection with the sale of certain of our former subsidiaries.
Litigation Accruals
We have recorded accruals totaling $5.1 million at December 31, 2019 for losses related to those litigation matters that we believe to be probable and for which an amount of loss can be reasonably estimated. However, we cannot determine a reasonable estimate of the maximum possible loss or range of loss for these matters given that they are at various stages of the litigation process and each case is
84
GATX CORPORATION AND SUBSIDIARIES
NOTES TO CONSOLIDATED FINANCIAL STATEMENTS (Continued)
subject to the inherent uncertainties of litigation (such as the strength of our legal defenses and the availability of insurance recovery). Although the maximum amount of liability that may ultimately result from any of these matters cannot be predicted with absolute certainty, management expects that none of the matters for which we have recorded an accrual, when ultimately resolved, will have a material adverse effect on our consolidated financial position or liquidity. It is possible, however, that the ultimate resolution of one or more of these matters could have a material adverse effect on our results of operations in a particular quarter or year if such resolution results in liability that materially exceeds the accrued amount.
In addition, we have other litigation matters pending for which we have not recorded any accruals because our potential liability for those matters is not probable or cannot be reasonably estimated based on currently available information. For those matters where we have not recorded an accrual but a loss is reasonably possible, we cannot determine a reasonable estimate of the maximum possible loss or range of loss for these matters given that they are at various stages of the litigation process and each case is subject to the inherent uncertainties of litigation (such as the strength of our legal defenses and the availability of insurance recovery). Although the maximum amount of liability that may ultimately result from any of these matters cannot be predicted with absolute certainty, management expects that none of the matters for which we have not recorded an accrual, when ultimately resolved, will have a material adverse effect on our consolidated financial position or liquidity. It is possible, however, that the ultimate resolution of one or more of these matters could have a material adverse effect on our results of operations in a particular quarter or year if such resolution results in a significant liability for GATX.
Environmental
Our operations are subject to extensive federal, state, and local environmental regulations. Our operating procedures include practices to protect the environment from the risks inherent in full service railcar leasing, which involves maintaining railcars used by customers to transport chemicals and other hazardous materials. Under some environmental laws in the U.S. and certain other countries, the owner of a leased railcar may be liable for environmental damage and cleanup or other costs in the event of a spill or discharge of material from a railcar without regard to the owner's fault. While our standard form of master railcar lease agreement requires the lessee to indemnify us against environmental claims and to carry liability insurance coverage, such indemnities and insurance may not fully protect us against claims for environmental damage. Additionally, some of our real estate holdings, including previously owned properties, are or have been used for industrial or transportation-related purposes or leased to commercial or industrial companies whose activities might have resulted in discharges on the property. As a result, we are subject to environmental cleanup and enforcement actions. In particular, the federal Comprehensive Environmental Response, Compensation and Liability Act (“CERCLA”), also known as the Superfund law, as well as similar state laws, impose joint and several liability for cleanup and enforcement costs on current and former owners and operators of a site without regard to fault or the legality of the original conduct. If there are other potentially responsible parties (“PRPs”), we generally contribute to the cleanup of these sites through cost-sharing agreements with terms that vary from site to site. Costs are typically allocated based on the relative volumetric contribution of material, the period of time the site was owned or operated, and/or the portion of the site owned or operated by each PRP.
At the time a potential environmental issue is identified, initial accruals for environmental liability are established when such liability is determined to be probable and a reasonable estimate of the associated costs can be made. Costs are estimated based on the type and level of investigation and/or remediation activities that our internal environmental staff (and where appropriate, independent consultants) have advised to be necessary to comply with applicable laws and regulations. Activities include surveys and environmental studies of potentially contaminated sites as well as costs for remediation and restoration of sites determined to be contaminated. In addition, we have provided indemnities for potential environmental liabilities to buyers of divested companies. In these instances, accruals are based on the scope and duration of the respective indemnities together with the extent of known contamination. Estimates are periodically reviewed and adjusted as required to reflect additional information about facility or site characteristics or changes in regulatory requirements. We conduct a quarterly environmental contingency analysis, which considers a combination of factors including independent consulting reports, site visits, legal reviews, analysis of the likelihood of participation in and the ability of other PRPs to pay for cleanup, and historical trend analyses.
We are involved in administrative and judicial proceedings and other voluntary and mandatory cleanup efforts at 13 sites, including Superfund sites, for which we are contributing to the cost of performing the study or cleanup, or both, of alleged environmental contamination. As of December 31, 2019, we have recorded accruals of $14.4 million for remediation and restoration costs that we believe to be probable and for which the amount of loss can be reasonably estimated. These amounts are included in other liabilities on our balance sheet. Our environmental liabilities are not discounted.
We did not materially change our methodology for identifying and calculating environmental liabilities in the last three years. Currently, no known trends, demands, commitments, events or uncertainties exist that are reasonably likely to occur and materially affect the methodology or assumptions described above.
85
GATX CORPORATION AND SUBSIDIARIES
NOTES TO CONSOLIDATED FINANCIAL STATEMENTS (Continued)
The recorded accruals represent our best estimate of all costs for remediation and restoration of affected sites, without reduction for anticipated recoveries from third parties, and include both asserted and unasserted claims. However, we are unable to provide a reasonable estimate of the maximum potential loss associated with these sites because cleanup costs cannot be predicted with certainty. Various factors beyond our control can impact the amount of loss GATX will ultimately incur with respect to these sites, including the extent of corrective actions that may be required; evolving environmental laws and regulations; advances in environmental technology, the extent of other parties' participation in cleanup efforts; developments in periodic environmental analyses related to sites determined to be contaminated, and developments in environmental surveys and studies of potentially contaminated sites. As a result, future charges associated with these sites could have a significant effect on results of operations in a particular quarter or year if the costs materially exceed the accrued amount as individual site studies and remediation and restoration efforts proceed. However, management believes it is unlikely that the ultimate cost to GATX for any of these sites, either individually or in the aggregate, will have a material adverse effect on our consolidated financial position or liquidity.
NOTE 23. Financial Data of Business Segments
The financial data presented below depicts the profitability, financial position, and capital expenditures of each of our business segments.
We lease, operate, manage, and remarket long-lived, widely-used assets, primarily in the rail market. We report our financial results through three primary business segments: Rail North America, Rail International, and Portfolio Management. Historically, we also reported financial results for ASC as a fourth segment.
On February 7, 2020, we announced our intention to sell our ASC business segment to Rand Logistics, Inc. On May 14, 2020, we completed the sale of our ASC business, subject to customary post-closing adjustments. As a result, ASC is now reported as discontinued operations, and financial data for the ASC segment has been segregated and presented as discontinued operations for all periods presented. See "Note 26. Discontinued Operations" for additional information.
Rail North America is composed of our operations in the United States, Canada, and Mexico. Rail North America primarily provides railcars pursuant to full-service leases under which it maintains the railcars, pays ad valorem taxes and insurance, and provides other ancillary services.
Rail International is composed of our operations in Europe ("GATX Rail Europe" or "GRE"), India ("GRI"), and Russia ("Rail Russia"). GRE primarily leases railcars to customers throughout Europe pursuant to full-service leases under which it maintains the railcars and provides value-added services according to customer requirements.
Portfolio Management is composed primarily of our ownership in a group of joint ventures with Rolls-Royce plc that lease aircraft spare engines, as well as five liquefied gas carrying vessels (the "Specialized Gas Vessels") and assorted other marine assets. In prior years, Portfolio Management generated leasing, marine operating, asset remarketing, and management fee income through a collection of diversified wholly owned assets and joint venture investments. As noted in prior years, in 2015, we made the decision to exit the majority of Portfolio Management's marine investments, excluding the Specialized Gas Vessels. The marine investments to be sold included six chemical parcel tankers, a number of inland marine vessels, and our interest in a joint venture. These specific investments were all sold as of December 31, 2017.
Segment profit is an internal performance measure used by the Chief Executive Officer to assess the profitability of each segment. Segment profit includes all revenues, expenses, pre-tax earnings from affiliates, and net gains on asset dispositions that are directly attributable to each segment. We allocate interest expense to the segments based on what we believe to be the appropriate risk-adjusted borrowing costs for each segment. Segment profit excludes selling, general and administrative expenses, income taxes, and certain other amounts not allocated to the segments. These amounts are included in Other.
86
GATX CORPORATION AND SUBSIDIARIES
NOTES TO CONSOLIDATED FINANCIAL STATEMENTS (Continued)
The following tables show certain segment data for the years ended December 31, 2019, 2018, and 2017 (in millions):
Rail North America | Rail International | Portfolio Management | Other | GATX Consolidated | |||||||||||||||||||||||||||||||
2019 Profitability | |||||||||||||||||||||||||||||||||||
Revenues | |||||||||||||||||||||||||||||||||||
Lease revenue | $ | 868.3 | $ | 219.2 | $ | 1.0 | $ | — | $ | 1,088.5 | |||||||||||||||||||||||||
Marine operating revenue | — | — | 8.2 | — | 8.2 | ||||||||||||||||||||||||||||||
Other revenue | 96.2 | 8.5 | 0.7 | — | 105.4 | ||||||||||||||||||||||||||||||
Total Revenues | 964.5 | 227.7 | 9.9 | — | 1,202.1 | ||||||||||||||||||||||||||||||
| Expenses | |||||||||||||||||||||||||||||||||||
Maintenance expense | 267.9 | 46.5 | — | — | 314.4 | ||||||||||||||||||||||||||||||
Marine operating expense | — | — | 18.9 | — | 18.9 | ||||||||||||||||||||||||||||||
Depreciation expense | 256.9 | 57.8 | 6.6 | — | 321.3 | ||||||||||||||||||||||||||||||
Operating lease expense | 54.4 | — | — | — | 54.4 | ||||||||||||||||||||||||||||||
Other operating expense | 23.9 | 6.8 | 0.6 | — | 31.3 | ||||||||||||||||||||||||||||||
Total Expenses | 603.1 | 111.1 | 26.1 | — | 740.3 | ||||||||||||||||||||||||||||||
Other Income (Expense) | |||||||||||||||||||||||||||||||||||
Net gain (loss) on asset dispositions | 54.6 | 1.7 | (4.7) | — | 51.6 | ||||||||||||||||||||||||||||||
Interest (expense) income, net | (134.5) | (40.6) | (11.2) | 5.8 | (180.5) | ||||||||||||||||||||||||||||||
Other (expense) income | (5.3) | 1.2 | — | (3.2) | (7.3) | ||||||||||||||||||||||||||||||
Share of affiliates' pre-tax income | — | — | 94.5 | — | 94.5 | ||||||||||||||||||||||||||||||
Segment profit | $ | 276.2 | $ | 78.9 | $ | 62.4 | $ | 2.6 | 420.1 | ||||||||||||||||||||||||||
Less: | |||||||||||||||||||||||||||||||||||
Selling, general and administrative expense | 180.4 | ||||||||||||||||||||||||||||||||||
Income taxes (includes $18.0 related to affiliates' earnings) | 58.9 | ||||||||||||||||||||||||||||||||||
Net income from continuing operations | $ | 180.8 | |||||||||||||||||||||||||||||||||
Net income from discontinued operations, net of taxes | 30.4 | ||||||||||||||||||||||||||||||||||
Net income | $ | 211.2 | |||||||||||||||||||||||||||||||||
Net Gain (Loss) on Asset Dispositions | |||||||||||||||||||||||||||||||||||
Asset Remarketing Income: | |||||||||||||||||||||||||||||||||||
Net gains on dispositions of owned assets | $ | 58.5 | $ | 0.1 | $ | — | $ | — | $ | 58.6 | |||||||||||||||||||||||||
Residual sharing income | 0.4 | — | 1.5 | — | 1.9 | ||||||||||||||||||||||||||||||
Non-remarketing net (losses) gains (1) | (3.9) | 1.6 | — | — | (2.3) | ||||||||||||||||||||||||||||||
Asset impairments | (0.4) | — | (6.2) | — | (6.6) | ||||||||||||||||||||||||||||||
| $ | 54.6 | $ | 1.7 | $ | (4.7) | $ | — | $ | 51.6 | ||||||||||||||||||||||||||
Capital Expenditures | |||||||||||||||||||||||||||||||||||
Portfolio investments and capital additions | $ | 502.2 | $ | 215.7 | $ | — | $ | 4.9 | $ | 722.8 | |||||||||||||||||||||||||
Selected Balance Sheet Data | |||||||||||||||||||||||||||||||||||
Investments in affiliated companies | $ | 0.2 | $ | — | $ | 512.4 | $ | — | $ | 512.6 | |||||||||||||||||||||||||
Identifiable assets from continuing operations | $ | 5,646.7 | $ | 1,486.7 | $ | 653.7 | $ | 206.9 | $ | 7,994.0 | |||||||||||||||||||||||||
Identifiable assets from discontinued operations | $ | — | $ | — | $ | — | $ | — | $ | 291.1 | |||||||||||||||||||||||||
__________
(1) Includes net gains (losses) from scrapping of railcars.
87
GATX CORPORATION AND SUBSIDIARIES
NOTES TO CONSOLIDATED FINANCIAL STATEMENTS (Continued)
Rail North America | Rail International | Portfolio Management | Other | GATX Consolidated | |||||||||||||||||||||||||
2018 Profitability | |||||||||||||||||||||||||||||
Revenues | |||||||||||||||||||||||||||||
Lease revenue | $ | 873.4 | $ | 209.3 | $ | 1.0 | $ | — | $ | 1,083.7 | |||||||||||||||||||
Marine operating revenue | — | — | 14.3 | — | 14.3 | ||||||||||||||||||||||||
Other revenue | 68.1 | 8.2 | 0.8 | — | 77.1 | ||||||||||||||||||||||||
Total Revenues | 941.5 | 217.5 | 16.1 | — | 1,175.1 | ||||||||||||||||||||||||
| Expenses | |||||||||||||||||||||||||||||
Maintenance expense | 254.7 | 44.5 | — | — | 299.2 | ||||||||||||||||||||||||
Marine operating expense | — | — | 16.8 | — | 16.8 | ||||||||||||||||||||||||
Depreciation expense | 248.5 | 55.5 | 7.3 | — | 311.3 | ||||||||||||||||||||||||
Operating lease expense | 49.6 | — | — | — | 49.6 | ||||||||||||||||||||||||
Other operating expense | 27.3 | 5.8 | — | — | 33.1 | ||||||||||||||||||||||||
Total Expenses | 580.1 | 105.8 | 24.1 | — | 710.0 | ||||||||||||||||||||||||
Other Income (Expense) | |||||||||||||||||||||||||||||
Net gain (loss) on asset dispositions | 76.3 | (0.2) | (3.4) | — | 72.7 | ||||||||||||||||||||||||
Interest (expense) income, net | (125.2) | (35.9) | (10.4) | 8.6 | (162.9) | ||||||||||||||||||||||||
Other (expense) income | (5.2) | (7.0) | — | (9.5) | (21.7) | ||||||||||||||||||||||||
Share of affiliates' pre-tax income | 0.6 | — | 60.5 | — | 61.1 | ||||||||||||||||||||||||
Segment profit | $ | 307.9 | $ | 68.6 | $ | 38.7 | $ | (0.9) | 414.3 | ||||||||||||||||||||
Less: | |||||||||||||||||||||||||||||
Selling, general and administrative expense | 182.5 | ||||||||||||||||||||||||||||
Income taxes (includes $10.8 related to affiliates' earnings) | 41.3 | ||||||||||||||||||||||||||||
Net income from continuing operations | $ | 190.5 | |||||||||||||||||||||||||||
Net income from discontinued operations, net of taxes | 20.8 | ||||||||||||||||||||||||||||
Net income | $ | 211.3 | |||||||||||||||||||||||||||
Net Gain (Loss) on Asset Dispositions | |||||||||||||||||||||||||||||
Asset Remarketing Income: | |||||||||||||||||||||||||||||
Net gains on dispositions of owned assets | $ | 64.7 | $ | — | $ | — | $ | — | $ | 64.7 | |||||||||||||||||||
Residual sharing income | 1.4 | — | 1.1 | — | 2.5 | ||||||||||||||||||||||||
Non-remarketing net gains (1) | 10.8 | 3.7 | — | — | 14.5 | ||||||||||||||||||||||||
Asset impairments | (0.6) | (3.9) | (4.5) | — | (9.0) | ||||||||||||||||||||||||
| $ | 76.3 | $ | (0.2) | $ | (3.4) | $ | — | $ | 72.7 | ||||||||||||||||||||
Capital Expenditures | |||||||||||||||||||||||||||||
Portfolio investments and capital additions | $ | 737.4 | $ | 152.7 | $ | 14.1 | $ | 23.4 | $ | 927.6 | |||||||||||||||||||
Selected Balance Sheet Data | |||||||||||||||||||||||||||||
Investments in affiliated companies | $ | 0.2 | $ | — | $ | 464.3 | $ | — | $ | 464.5 | |||||||||||||||||||
Identifiable assets from continuing operations | $ | 5,236.6 | $ | 1,363.2 | $ | 606.8 | $ | 112.3 | $ | 7,318.9 | |||||||||||||||||||
Identifiable assets from discontinued operations | $ | — | $ | — | $ | — | $ | — | $ | 297.8 | |||||||||||||||||||
__________
(1) Includes net gains (losses) from scrapping of railcars.
88
GATX CORPORATION AND SUBSIDIARIES
NOTES TO CONSOLIDATED FINANCIAL STATEMENTS (Continued)
Rail North America | Rail International | Portfolio Management | Other | GATX Consolidated | |||||||||||||||||||||||||
2017 Profitability | |||||||||||||||||||||||||||||
Revenues | |||||||||||||||||||||||||||||
Lease revenue | $ | 899.9 | $ | 190.3 | $ | 3.8 | $ | — | $ | 1,094.0 | |||||||||||||||||||
Marine operating revenue | — | — | 25.0 | — | 25.0 | ||||||||||||||||||||||||
Other revenue | 77.5 | 6.8 | 1.1 | — | 85.4 | ||||||||||||||||||||||||
Total Revenues | 977.4 | 197.1 | 29.9 | — | 1,204.4 | ||||||||||||||||||||||||
| Expenses | |||||||||||||||||||||||||||||
Maintenance expense | 265.0 | 41.1 | — | — | 306.1 | ||||||||||||||||||||||||
Marine operating expense | — | — | 24.8 | — | 24.8 | ||||||||||||||||||||||||
Depreciation expense | 239.4 | 48.9 | 7.0 | — | 295.3 | ||||||||||||||||||||||||
Operating lease expense | 60.7 | — | — | — | 60.7 | ||||||||||||||||||||||||
Other operating expense | 28.7 | 4.7 | 1.0 | — | 34.4 | ||||||||||||||||||||||||
Total Expenses | 593.8 | 94.7 | 32.8 | — | 721.3 | ||||||||||||||||||||||||
Other Income (Expense) | |||||||||||||||||||||||||||||
Net gain (loss) on asset dispositions | 45.2 | 3.1 | 7.7 | — | 56.0 | ||||||||||||||||||||||||
Interest (expense) income, net | (121.2) | (33.4) | (9.2) | 8.5 | (155.3) | ||||||||||||||||||||||||
Other (expense) income | (5.9) | (3.2) | 2.3 | (7.1) | (13.9) | ||||||||||||||||||||||||
Share of affiliates' pre-tax income | (2.4) | (0.1) | 58.4 | — | 55.9 | ||||||||||||||||||||||||
Segment profit | $ | 299.3 | $ | 68.8 | $ | 56.3 | $ | 1.4 | 425.8 | ||||||||||||||||||||
Less: | |||||||||||||||||||||||||||||
Selling, general and administrative expense | 172.4 | ||||||||||||||||||||||||||||
Income taxes (includes $12.0 related to affiliates' earnings) | (214.4) | ||||||||||||||||||||||||||||
Net income from continuing operations | $ | 467.8 | |||||||||||||||||||||||||||
Net income from discontinued operations, net of taxes | 34.2 | ||||||||||||||||||||||||||||
Net income | $ | 502.0 | |||||||||||||||||||||||||||
Net Gain (Loss) on Asset Dispositions | |||||||||||||||||||||||||||||
Asset Remarketing Income: | |||||||||||||||||||||||||||||
Net gains on dispositions of owned assets | $ | 44.0 | $ | 0.1 | $ | 1.8 | $ | — | $ | 45.9 | |||||||||||||||||||
Residual sharing income | 0.6 | — | 9.6 | — | 10.2 | ||||||||||||||||||||||||
Non-remarketing net (losses) gains (1) | 5.2 | 3.3 | — | — | 8.5 | ||||||||||||||||||||||||
Asset impairments | (4.6) | (0.3) | (3.7) | — | (8.6) | ||||||||||||||||||||||||
| $ | 45.2 | $ | 3.1 | $ | 7.7 | $ | — | $ | 56.0 | ||||||||||||||||||||
Capital Expenditures | |||||||||||||||||||||||||||||
Portfolio investments and capital additions | $ | 460.9 | $ | 90.9 | $ | 36.6 | $ | 1.0 | $ | 589.4 | |||||||||||||||||||
Selected Balance Sheet Data | |||||||||||||||||||||||||||||
Investments in affiliated companies | $ | 6.8 | $ | — | $ | 434.2 | $ | — | $ | 441.0 | |||||||||||||||||||
Identifiable assets from continuing operations | $ | 4,915.0 | $ | 1,332.9 | $ | 582.8 | $ | 305.0 | $ | 7,135.7 | |||||||||||||||||||
Identifiable assets from discontinued operations | $ | — | $ | — | $ | — | $ | — | $ | 286.7 | |||||||||||||||||||
__________
(1) Includes net gains (losses) from scrapping of railcars.
89
GATX CORPORATION AND SUBSIDIARIES
NOTES TO CONSOLIDATED FINANCIAL STATEMENTS (Continued)
NOTE 24. Selected Quarterly Financial Data (unaudited)
| | First Quarter | Second Quarter (2) | Third Quarter | Fourth Quarter (3) | Total | ||||||||||||||||||||||||
| In millions, except per share data | |||||||||||||||||||||||||||||
| 2019 | |||||||||||||||||||||||||||||
Total revenues from continuing operations | $ | 305.3 | $ | 297.5 | $ | 298.8 | $ | 300.5 | $ | 1,202.1 | |||||||||||||||||||
Net income from continuing operations | $ | 41.2 | $ | 60.3 | $ | 37.2 | $ | 42.1 | $ | 180.8 | |||||||||||||||||||
Net income from discontinued operations | 0.3 | 7.7 | 7.9 | 14.5 | 30.4 | ||||||||||||||||||||||||
Net income from consolidated operations | $ | 41.5 | 41.5 | $ | 68.0 | $ | 45.1 | $ | 56.6 | $ | 211.2 | ||||||||||||||||||
Share Data (1) | |||||||||||||||||||||||||||||
Basic earnings per share from continuing operations | $ | 1.13 | $ | 1.68 | $ | 1.05 | 1.21 | 5.07 | |||||||||||||||||||||
Basic earnings per share from discontinued operations | 0.01 | 0.21 | 0.23 | 0.41 | 0.85 | ||||||||||||||||||||||||
Basic earnings per share from consolidated operations | $ | 1.14 | $ | 1.89 | $ | 1.28 | $ | 1.62 | $ | 5.92 | |||||||||||||||||||
Diluted earnings per share from continuing operations | $ | 1.11 | $ | 1.65 | $ | 1.03 | 1.18 | 4.97 | |||||||||||||||||||||
Diluted earnings per share from discontinued operations | 0.01 | 0.21 | 0.22 | 0.41 | 0.84 | ||||||||||||||||||||||||
Diluted earnings per share from consolidated operations | $ | 1.12 | $ | 1.86 | $ | 1.25 | $ | 1.59 | $ | 5.81 | |||||||||||||||||||
| 2018 | |||||||||||||||||||||||||||||
Total revenues from continuing operations | $ | 294.5 | $ | 296.2 | $ | 290.9 | $ | 293.5 | $ | 1,175.1 | |||||||||||||||||||
Net income from continuing operations | $ | 77.3 | $ | 34.1 | $ | 39.4 | $ | 39.7 | $ | 190.5 | |||||||||||||||||||
Net (loss) income from discontinued operations | (1.0) | 4.7 | 7.6 | 9.5 | 20.8 | ||||||||||||||||||||||||
Net income from consolidated operations | $ | 76.3 | $ | 38.8 | $ | 47.0 | $ | 49.2 | $ | 211.3 | |||||||||||||||||||
Share Data (1) | |||||||||||||||||||||||||||||
Basic earnings per share from continuing operations | $ | 2.04 | $ | 0.91 | $ | 1.05 | 1.07 | 5.07 | |||||||||||||||||||||
Basic earnings per share from discontinued operations | (0.02) | 0.12 | 0.20 | 0.25 | 0.55 | ||||||||||||||||||||||||
Basic earnings per share from consolidated operations | $ | 2.02 | $ | 1.03 | $ | 1.25 | $ | 1.32 | $ | 5.62 | |||||||||||||||||||
Diluted earnings per share from continuing operations | $ | 2.01 | $ | 0.89 | $ | 1.02 | 1.05 | 4.98 | |||||||||||||||||||||
Diluted earnings per share from discontinued operations | (0.03) | 0.12 | 0.20 | 0.25 | 0.54 | ||||||||||||||||||||||||
Diluted earnings per share from consolidated operations | $ | 1.98 | $ | 1.01 | $ | 1.22 | $ | 1.30 | $ | 5.52 | |||||||||||||||||||
_______
(1) Quarterly earnings per share may not be additive, as per share amounts are computed independently for each quarter and the full year is based on the respective weighted-average common shares and common stock equivalents outstanding.
(2) In the second quarter of 2019, net income included a $2.8 million tax benefit from a deferred income tax adjustment due to an enacted corporate income tax rate decrease in Alberta, Canada. In the second quarter of 2018, net income included $5.8 million of expense (net of taxes) attributable to the closure of a maintenance facility.
(3) In the fourth quarter of 2018, net income included $18.1 million of income tax benefits, primarily related to the impacts of the enacted Tax Act.
90
GATX CORPORATION AND SUBSIDIARIES
NOTES TO CONSOLIDATED FINANCIAL STATEMENTS (Continued)
NOTE 25. Subsequent Events
On March 11, 2020, the World Health Organization declared the Coronavirus Disease 2019 (“COVID-19”) a pandemic and on March 13, 2020, the United States declared a national emergency related to COVID-19. Our consolidated financial statements reflect estimates and assumptions at the date of the consolidated financial statements and reported amounts of revenue and expenses during the reporting periods presented. We considered the impact of COVID-19 on our operations and the assumptions and estimates used. While COVID-19 did have a negative impact on our operating results through November 6, 2020, we determined the impact to our assumptions and estimates was not significant. However, we expect COVID-19 will continue to have an adverse impact on our operating and financial results in future periods, the magnitude and duration of which cannot be determined at this time.
On March 27, 2020, the U.S. government enacted the Coronavirus Aid, Relief, and Economic Security Act (“CARES Act”), which includes modifications to the interest expense limitation threshold and net operating loss carryback period and utilization limitation, the acceleration of payments for alternative minimum tax credit refunds, and the deferral of employer payroll tax payments. The CARES Act is not expected to have a material impact on our consolidated financial statements.
91
GATX CORPORATION AND SUBSIDIARIES
NOTES TO CONSOLIDATED FINANCIAL STATEMENTS (Continued)
NOTE 26. Discontinued Operations
On February 7, 2020, we announced our intention to sell our ASC business segment to Rand Logistics, Inc. On May 14, 2020, we completed the sale of our ASC business, subject to customary post-closing adjustments. The divestiture was intended to provide us with greater ability to focus on our core franchise in global railcar and aircraft spare engine leasing.
Accordingly, the results of operations from our ASC business are reported in the accompanying consolidated statements of operations as “discontinued operations, net of taxes” for the years ended December 31, 2019, 2018, and 2017, and the related assets and liabilities are classified as assets and liabilities of discontinued operations as of December 31, 2019 and 2018 in the accompanying balance sheets.
Results of discontinued operations reflect directly attributable revenues, operating and ownership expenses, and income taxes. Results also reflect intercompany allocations for interest. Interest expense was $6.1 million, $5.7 million, and $5.2 million for the years ended December 31, 2019, 2018, and 2017. Interest was allocated consistent with GATX's risk-adjusted approach for continuing operations.
The following table shows the financial results of our discontinued operations (in millions):
| Year Ended December 31 | |||||||||||||||||
| 2019 | 2018 | 2017 | |||||||||||||||
Revenues | 191.7 | 185.8 | 172.5 | ||||||||||||||
Expenses | |||||||||||||||||
Operating expense | 138.8 | 136.7 | 130.2 | ||||||||||||||
Depreciation expense | 10.6 | 10.6 | 12.0 | ||||||||||||||
Selling, general and administrative expense | 8.2 | 8.6 | 7.6 | ||||||||||||||
Total Expenses | 157.6 | 155.9 | 149.8 | ||||||||||||||
Other income (expense) | $ | 3.8 | (5.5) | (5.8) | |||||||||||||
| Income from Discontinued Operations Before Taxes | 37.9 | 24.4 | 16.9 | ||||||||||||||
Income tax (expense) benefit | (7.5) | (3.6) | 17.3 | ||||||||||||||
Income from Discontinued Operations, Net of Taxes | 30.4 | 20.8 | 34.2 | ||||||||||||||
The following table shows the assets and liabilities of the discontinued business (in millions):
| 2019 | 2018 | ||||||||||
| Assets of Discontinued Operations: | |||||||||||
| Rent and other receivables | 21.2 | 21.7 | |||||||||
| Operating assets and facilities, net | 249.9 | 257.1 | |||||||||
| Other | 20.0 | 19.0 | |||||||||
| Total Assets of Discontinued Operations | $ | 291.1 | $ | 297.8 | |||||||
| Liabilities of Discontinued Operations: | |||||||||||
| Accounts payable and accrued expenses | $ | 29.7 | $ | 24.4 | |||||||
| Deferred income taxes | 35.8 | 36.0 | |||||||||
| Other | 4.0 | 1.2 | |||||||||
| Total Liabilities of Discontinued Operations | $ | 69.5 | $ | 61.6 | |||||||
The following table shows cash flow information for our discontinued operations (in millions):
92
GATX CORPORATION AND SUBSIDIARIES
NOTES TO CONSOLIDATED FINANCIAL STATEMENTS (Continued)
| Year Ended December 31 | |||||||||||||||||
| 2019 | 2018 | 2017 | |||||||||||||||
Net Cash Used in Operating Activities | $ | 36.8 | $ | 23.3 | $ | 42.5 | |||||||||||
Net Cash Provided By (Used In) Investing Activities | 8.1 | (15.8) | (38.0) | ||||||||||||||
Net Cash Provided By Financing Activities | (45.0) | (7.5) | (4.5) | ||||||||||||||
Cash Provided By Discontinued Operations, Net | $ | (0.1) | $ | — | $ | — | |||||||||||
93