Attached files
| file | filename |
|---|---|
| EX-23 - EXHIBIT 23 - GATX CORP | gmt-20151231xexhibit23.htm |
| EX-24.2 - EXHIBIT 24.2 - GATX CORP | gmt-20151231xexhibit242.htm |
| EX-24.1 - EXHIBIT 24.1 - GATX CORP | gmt-20151231xexhibit241.htm |
| EX-31.1 - EXHIBIT 31.1 - GATX CORP | gmt-20151231xexhibit311.htm |
| EX-12 - EXHIBIT 12 - GATX CORP | gmt-20151231xexhibit12.htm |
| EX-24.5 - EXHIBIT 24.5 - GATX CORP | gmt-20151231xexhibit245.htm |
| EX-24.7 - EXHIBIT 24.7 - GATX CORP | gmt-20151231xexhibit247.htm |
| EX-32 - EXHIBIT 32 - GATX CORP | gmt-20151231xexhibit32.htm |
| EX-21 - EXHIBIT 21 - GATX CORP | gmt-20151231xexhibit21.htm |
| EX-24.9 - EXHIBIT 24.9 - GATX CORP | gmt-20151234xexhibit249.htm |
| EX-31.2 - EXHIBIT 31.2 - GATX CORP | gmt-20151231xexhibit312.htm |
| EX-24.3 - EXHIBIT 24.3 - GATX CORP | gmt-20151231xexhibit243.htm |
| EX-24.6 - EXHIBIT 24.6 - GATX CORP | gmt-20151231xexhibit246.htm |
| EX-24.8 - EXHIBIT 24.8 - GATX CORP | gmt-20151231xexhibit248.htm |
| XML - IDEA: XBRL DOCUMENT - GATX CORP | R9999.htm |
| EX-24.4 - EXHIBIT 24.4 - GATX CORP | gmt-20151231xexhibit244.htm |
UNITED STATES SECURITIES AND EXCHANGE COMMISSION
Washington, D.C. 20549
_______________
Form 10-K
þ | ANNUAL REPORT PURSUANT TO SECTION 13 OR 15(d) OF THE SECURITIES EXCHANGE ACT OF 1934 |
For the fiscal year ended December 31, 2015 | |
or | |
o | TRANSITION REPORT PURSUANT TO SECTION 13 OR 15(d) OF THE SECURITIES EXCHANGE ACT OF 1934 |
Commission File Number 1-2328
______________________
GATX Corporation
(Exact name of registrant as specified in its charter)
New York | 36-1124040 |
(State of incorporation) | (I.R.S. Employer Identification No.) |
222 West Adams Street
Chicago, IL 60606-5314
(Address of principal executive offices, including zip code)
(312) 621-6200
(Registrant’s telephone number, including area code)
Securities Registered Pursuant to Section 12(b) of the Act:
Title of each class or series | Name of each exchange on which registered | |
Common Stock | New York Stock Exchange Chicago Stock Exchange | |
Securities Registered Pursuant to Section 12(g) of the Act:
None
Indicate by check mark if the registrant is a well-known seasoned issuer, as defined in Rule 405 of the Securities Act. Yes þ No o
Indicate by check mark if the registrant is not required to file reports pursuant to Section 13 or 15(d) of the Act. Yes o No þ
-
Indicate by check mark whether the registrant (1) has filed all reports required to be filed by Section 13 or 15 (d) of the Securities Exchange Act of 1934 during the preceding 12 months (or for such shorter period that the registrant was required to file such reports), and (2) has been subject to such filing requirements for the past 90 days. Yes þ No o
Indicate by check mark if disclosure of delinquent filers pursuant to Item 405 of Regulation S-K (§229.405) is not contained herein, and will not be contained, to the best of registrant’s knowledge, in definitive proxy or information statements incorporated by reference in Part III of this Form 10-K or any amendment to this
Form 10-K. o
Form 10-K. o
Indicate by check mark whether the registrant has submitted electronically and posted on its corporate Web site, if any, every Interactive Data File required to be submitted and posted pursuant to Rule 405 of Regulation S-T (§232.405 of this chapter) during the preceding 12 months (or for such shorter period that the registrant was required to submit and post such files). Yes þ No ¨
Indicate by check mark whether the registrant is a large accelerated filer, an accelerated filer, or a non-accelerated filer, or a smaller reporting company. See the definitions of “large accelerated filer”, “accelerated filer” and “smaller reporting company” in Rule 12b-2 of the Exchange Act.
þ Large accelerated filer o Accelerated filer o Non-accelerated filer o Smaller reporting company
Indicate by check mark whether the registrant is a shell company (as defined in Rule 12b-2 of the Exchange Act). Yes o No þ
The aggregate market value of the voting stock held by non-affiliates of the registrant was approximately $2.3 billion as of June 30, 2015.
As of January 31, 2016, 42.1 million common shares were outstanding.
DOCUMENTS INCORPORATED BY REFERENCE
GATX’s definitive Proxy Statement to be filed on or about March 11, 2016 | PART III |
GATX CORPORATION
2015 FORM 10-K
INDEX
Item No. | Page No. | |
Part I | ||
Forward-Looking Statements | ||
Item 1. | ||
Item 1A. | ||
Item 1B. | ||
Item 2. | ||
Item 3. | ||
Item 4. | ||
Part II | ||
Item 5. | ||
Item 6. | ||
Item 7. | ||
Item 7A. | ||
Item 8. | ||
Item 9. | ||
Item 9A. | ||
Item 9B. | ||
Part III | ||
Item 10. | ||
Item 11. | ||
Item 12. | ||
Item 13. | ||
Item 14. | ||
Part IV | ||
Item 15. | ||
1
FORWARD-LOOKING STATEMENTS
Forward-looking statements in this report that are not historical facts are “forward-looking statements” within the meaning of the Private Securities Litigation Reform Act of 1995. These include statements that reflect our current views with respect to, among other things, future events, financial performance and market conditions. In some cases, forward-looking statements can be identified by the use of words such as “may,” “could,” “expect,” “intend,” “plan,” “seek,” “anticipate,” “believe,” “estimate,” “predict,” “potential,” “continue,” “likely,” “will,” “would” and variations of these terms and similar expressions, or the negative of these terms or similar expressions. Specific risks and uncertainties include, but are not limited to, (1) inability to maintain our assets on lease at satisfactory rates, (2) weak economic conditions, financial market volatility, and other factors that may decrease demand for our assets and services, (3) decreased demand for portions of our railcar fleet due to adverse changes in commodity prices, including, but not limited to, sustained low crude oil prices, (4) events having an adverse impact on assets, customers, or regions where we have a large investment, (5) operational disruption and increased costs associated with increased railcar assignments following non-renewal of leases, compliance maintenance programs, and other maintenance initiatives, (6) financial and operational risks associated with long-term railcar purchase commitments, (7) reduced opportunities to generate asset remarketing income, (8) changes in railroad efficiency that could decrease demand for railcars, (9) operational and financial risks related to our affiliate investments, including the RRPF affiliates, (10) fluctuations in foreign exchange rates, (11) failure to successfully negotiate collective bargaining agreements with the unions representing a substantial portion of our employees, (12) the impact of new regulatory requirements for tank cars carrying crude, ethanol, and other flammable liquids, (13) deterioration of conditions in the capital markets, reductions in our credit ratings, or increases in our financing costs, (14) asset impairment charges we may be required to recognize, (15) competitive factors in our primary markets, (16) risks related to international operations and expansion into new geographic markets, (17) exposure to damages, fines, and civil and criminal penalties arising from a negative outcome in our pending or threatened litigation, (18) changes in, or failure to comply with, laws, rules, and regulations (19) inability to obtain cost-effective insurance, (20) environmental remediation costs, and (21) inadequate allowances to cover credit losses in our portfolio.
Investors should not place undue reliance on forward-looking statements, which speak only as of the date they are made, and are not guarantees of future performance. The Company undertakes no obligation to publicly update or revise these forward-looking statements.
2
PART I
Item 1. Business
GENERAL
GATX Corporation ("GATX", "we,""us,""our," and similar terms), a New York corporation founded in 1898, is one of the world's largest railcar lessors, owning fleets in North America, Europe, and Asia. In addition, we operate the largest fleet of US-flagged vessels on the Great Lakes and own and manage marine assets and other long-lived, widely-used assets. We also invest in joint ventures that complement our existing business activities. We report our financial results through four primary business segments: Rail North America, Rail International, American Steamship Company (“ASC”), and Portfolio Management.
The following description of our business should be read in conjunction with the information contained in our Management’s Discussion and Analysis of Financial Condition and Results of Operations included in Item 7 and the consolidated financial statements included in Item 8 of this Annual Report on Form 10-K. For geographic and financial information relating to each of our reportable segments, see "Note 23. Foreign Operations" and "Note 25. Financial Data of Business Segments" included with our consolidated financial statements.
At December 31, 2015, we had total assets of $7.4 billion, comprised largely of railcars. This amount includes $0.5 billion of off-balance sheet assets, primarily railcars that were financed with operating leases.
OPERATIONS
GATX RAIL BUSINESS OVERVIEW
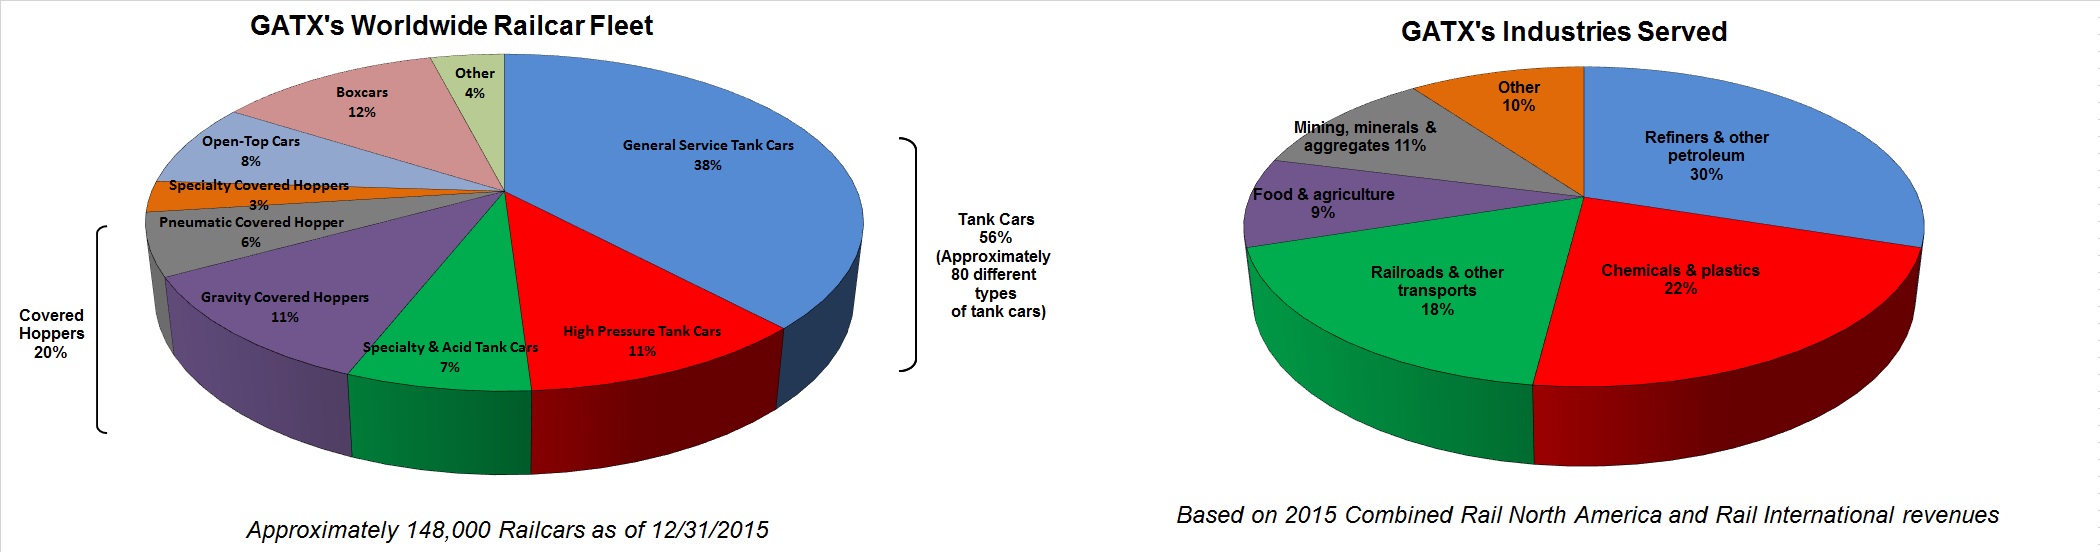
We strive to be recognized as the finest railcar leasing company in the world by our customers, our shareholders, our employees, and the communities where we operate. Our wholly owned fleet of approximately 148,400 railcars is one of the largest railcar lease fleets in the world. With more than a century of rail industry experience, we offer customers leasing, maintenance, asset, financial, and management expertise. We currently lease tank cars, freight cars, and locomotives in North America, tank cars and freight cars in Europe and freight cars in India. We also have an ownership interest in approximately 2,400 railcars through investments in affiliated companies, and we actively manage approximately 600 railcars for other third-party owners. The following table sets forth our worldwide rail fleet data as of December 31, 2015:
Tank Railcars | Freight Railcars (1) | Total Fleet | Affiliate Railcars | Managed Railcars | Total Railcars | Locomotives | ||||||||||||||
Rail North America | 60,470 | 64,105 | 124,575 | 2,375 | 590 | 127,540 | 637 | |||||||||||||
Rail International | 22,456 | 1,394 | 23,850 | — | 7 | 23,857 | — | |||||||||||||
82,926 | 65,499 | 148,425 | 2,375 | 597 | 151,397 | 637 | ||||||||||||||
__________________
(1) Includes approximately 18,400 boxcars in Rail North America.
3
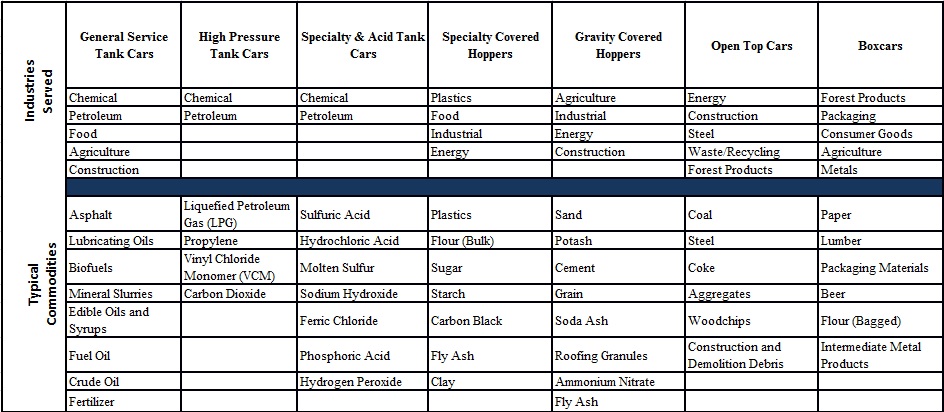
Our rail customers primarily operate in the petroleum, chemical, food/agriculture and transportation industries. Our worldwide railcar fleet consists of diverse railcar types that our customers use to ship approximately 600 different commodities. The following table presents an overview of our railcar types as well as the industries of our customers and the commodities they ship.
RAIL NORTH AMERICA
Rail North America is comprised of our wholly owned operations in the United States, Canada, and Mexico, as well as an affiliate investment. Rail North America primarily provides railcars pursuant to full-service leases under which it maintains the railcars, pays ad valorem taxes and property insurance, and provides administrative and other ancillary services. These railcars have estimated useful economic lives of 27 to 42 years and an average age of approximately 20 years. Rail North America has a large and diverse customer base, serving approximately 800 customers. In 2015, no single customer accounted for more than 6% of Rail North America’s total lease revenue, and the top ten customers combined accounted for approximately 24% of Rail North America’s total lease revenue. Rail North America leases railcars for terms that generally range from four to ten years, although leases may be for longer or shorter terms depending on market conditions. The average remaining lease term of the North American fleet was approximately four years as of December 31, 2015. Rail North America’s primary competitors are Union Tank Car Company, American Railcar Leasing, Trinity Industries Leasing Company, the CIT Group, Wells Fargo Rail, The Andersons, Inc., and SMBC Rail Services, LLC. Rail North America competes on the basis of customer relationships, lease rate, maintenance capabilities, customer service, engineering expertise, and availability of railcars.
Rail North America purchases new railcars from a number of manufacturers, including Trinity Industries, National Steel Car Ltd., The Greenbrier Companies, Freightcar America, and American Railcar Industries, Inc. We also acquire railcars in the secondary market.
4
During 2014, we acquired more than 18,500 boxcars from General Electric Railcar Services Corporation for approximately $340 million (the "Boxcar Fleet"). In 2011, we entered into an agreement to acquire 12,500 newly built railcars from Trinity Rail Group, LLC ("Trinity"), a subsidiary of Trinity Industries, over a five-year period. As of December 31, 2015, we have received customer commitments to lease 12,400 railcars from this agreement, of which 10,100 have been delivered. In 2014, we entered into a new long-term supply agreement with Trinity that will take effect in mid-2016, upon the scheduled expiration of the 2011 supply agreement. Under the terms of that agreement, we may order up to 8,950 newly built railcars over a four-year period from March, 2016 through March, 2020. We may order either tank or freight cars; however, we expect that the majority of the order will be for tank cars. In January 2017, as part of the agreement, either party may initiate a review of the contract pricing if it no longer reflects market rates. This review could result in modifications to the agreement, including termination.
Rail North America also owns a fleet of locomotives, consisting of 611 older four-axle and 26 six-axle locomotives as of December 31, 2015. Locomotive customers are primarily Class I, regional, and short-line railroads and industrial users. Lease terms vary from month-to-month to 15 years. As of December 31, 2015, the average remaining lease term of the locomotive fleet was approximately seven years. Rail North America's primary competitors in locomotive leasing are Wells Fargo Rail, CIT Group Inc., and Progress Rail Services Corporation. Competitive factors in the market include equipment condition, availability, customer service, and pricing.
Rail North America also remarkets rail assets, including assets managed for third parties and an affiliate. Remarketing activities generate fees and gains which may contribute significantly to Rail North America’s segment profit.
Maintenance
Rail North America operates an extensive network of maintenance facilities in the United States and Canada dedicated to performing timely, efficient, and high quality maintenance for customers. Services include interior cleaning of railcars, routine maintenance and general repairs to the car body and safety appliances, regulatory compliance work, wheelset replacements, exterior blast and painting, and car stenciling. To the extent possible, railcar maintenance is scheduled in a manner that minimizes the amount of time the car is out of service. Rail North America’s maintenance network consists of:
• | Six major maintenance facilities that can complete all types of maintenance services. |
• | Five field maintenance facilities that primarily focus on routine cleaning, repair, and regulatory compliance services. |
• | Six customer-dedicated sites operating solely within specific customer facilities that offer services tailored to the needs of our customers’ fleets. |
• | Twenty mobile unit locations that travel to many track-side field locations to provide spot repairs and interior cleaning services, thus avoiding the need to send a railcar to a major maintenance facility. |
The maintenance network is supplemented by a number of preferred third-party maintenance facilities. In certain cases, we have entered into fixed-capacity contracts with these third parties under which Rail North America has secured access to maintenance capacity. In 2015, third-party maintenance facilities accounted for approximately 45% of Rail North America’s maintenance costs (excluding the cost of repairs performed by railroads).
In 2015, wholly owned and third-party maintenance facilities performed approximately 79,000 service events, including multiple independent service events for the same car.
Our maintenance activities are substantially dedicated to servicing our wholly owned railcar fleet pursuant to the provisions of our lease contracts. Additionally, our customers periodically require services that are not included in the full-service lease agreement, such as repair of railcar damage and, as noted below, we provide maintenance services to one of our affiliates. Revenue earned from these types of maintenance services is recorded in other revenue.
5
Affiliates
Adler Funding LLC ("Adler") is a 12.5% owned railcar leasing partnership that was formed in 2010 with UniCredit Bank AG, Sperber Rail Holdings Inc., and LBT Holding Corporation. Rail North America provides lease, maintenance and asset remarketing services to Adler, for which it receives a base service fee and a performance-based asset remarketing fee. As of December 31, 2015, Adler owned approximately 2,400 railcars in North America consisting primarily of freight cars with an average age of approximately twelve years.
Southern Capital Corporation LLC (“SCC”) was a 50% owned joint venture with the Kansas City Southern Railroad, formed in 1996. During 2014 and 2015, SCC sold substantially all of its remaining railcars and locomotives.
RAIL INTERNATIONAL
Rail International is comprised of our wholly owned European operations ("GATX Rail Europe" or "GRE") and a wholly owned railcar leasing business in India ("Rail India"), as well as one development stage affiliate in China. GRE leases railcars to customers throughout Europe pursuant to full-service leases under which it maintains the railcars and provides value-adding services according to customer requirements. These railcars have estimated useful lives of 35 to 40 years and an average age of approximately 18 years. GRE has a diverse customer base with approximately 250 customers. In 2015, two customers each accounted for more than 10% of GRE's total lease revenue and the top ten customers combined accounted for approximately 65% of GRE's total lease revenue. GRE's lease terms generally range from one to ten years and as of December 31, 2015, the average remaining lease term of the European fleet was approximately two years. GRE competes principally on the basis of customer relationships, lease rate, maintenance expertise, and availability of railcars. Its primary competitors are VTG Aktiengesellschaft, the Ermewa Group, Nacco, a subsidiary of CIT Group Inc, Wascosa AG, and On Rail.
GRE acquires new railcars primarily from Astra Rail Industries S.R.L., Legios Loco a.s., and Feldbinder Spezialfahrzeugwerke GmbH. Additionally, GRE's Ostróda, Poland maintenance facility assembles several hundred tank cars each year. As of December 31, 2015, GRE has a firm commitment to acquire approximately 300 newly manufactured railcars to be delivered in 2016.
Rail India began operations in 2012 as the first company registered to lease railcars under the Indian Railways Wagon Leasing Scheme. In 2015, Rail India focused on pursuing investment opportunities in new and existing flat wagons, and developing relationships with customers, suppliers and the Indian Railways. As of December 31, 2015 Rail India owned 777 railcars with estimated useful lives of 20-25 years. Rail India's lease terms, all of which are net leases, generally range from two to ten years and as of December 31, 2015, the average remaining lease term of the Indian fleet was approximately five years. In 2016, Rail India expects to continue to pursue investment opportunities and grow its fleet of wagons.
Maintenance
GRE operates maintenance facilities in Hannover, Germany and Ostróda, Poland that perform significant repairs, regulatory compliance and modernization work for owned railcars. These service centers are supplemented by a number of third-party repair facilities, which in 2015 accounted for approximately 43% of GRE's fleet repair costs.
Similar to our Rail North America segment, Rail International's customers periodically require maintenance services that are not included in the full-service lease agreement. For GRE, these services are generally related to the repair of damages by customers and railways. Revenue earned from these maintenance activities is recorded in other revenue.
In India, all railcar maintenance is performed by the Indian Railways or an authorized third party provider.
Rail International Affiliates
In 2012, IMC-GATX Financial Leasing (Shanghai) Co., Ltd. (“IMC-GATX China”) was established as a 50% owned China-based joint venture between us and IMC Pan Asia Alliance Group (“IMC”). IMC is a well-established shipping enterprise with experience operating in China and was also our partner in a marine joint venture until we sold our interest in 2015. The primary objective of IMC-GATX China is to establish a rail leasing business in China, if that market develops.
6
We previously owned a 37.5% interest in Ahaus Alstätter Eisenbahn Cargo AG (“AAE”), a Switzerland-based freight railcar leasing affiliate. During 2013, we sold our interest to our partner, Ahaus Alstätter Eisenbahn Holding AG.
ASC
ASC operates the largest fleet of US-flagged vessels on the Great Lakes and strives to attain the highest levels of delivery efficiency, safety and environmental stewardship. ASC provides waterborne transportation of dry bulk commodities such as iron ore, coal, limestone aggregates, and metallurgical limestone, which serve end markets that include steel making, domestic automobile manufacturing, electricity generation, and non-residential construction. Customer service, primarily in the form of scheduling flexibility, reliability, and operating safety, is key to ASC’s success. ASC’s sailing season generally runs from April 1 through December 31; however, depending on customer demand and weather conditions, certain vessels may commence operations during March and continue to operate into January of the following year.
At December 31, 2015, ASC’s fleet consisted of 17 vessels with a net book value of $236.5 million and $6.8 million of off-balance sheet assets. All ships are environmentally and operationally compliant. Fourteen of the vessels are diesel powered, have an average age of 38 years, and estimated useful lives of 65 years. Two steam powered vessels were built in the 1940s and 1950s and have estimated remaining useful lives of four years. The other vessel in ASC's fleet is a diesel-powered articulated tug-barge built in 2012, which is leased by ASC under an operating lease that expires in 2017. Sixteen of ASC’s vessels are generally available for both service contract and spot business; the remaining vessel is dedicated to a time charter agreement that is scheduled to expire following the 2018 sailing season. ASC’s vessels operate exclusively in the fresh water of the Great Lakes and as a result, with proper maintenance and periodic refurbishment, may achieve extended service well beyond the useful life estimates.
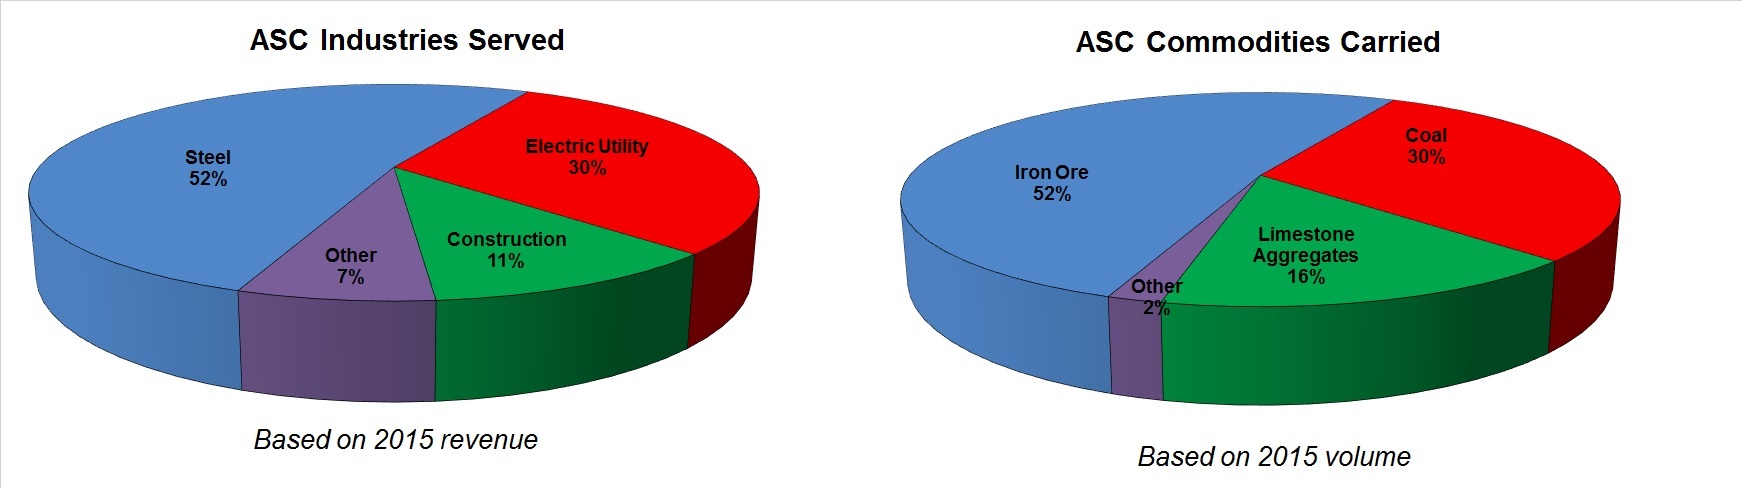
All of ASC’s vessels are equipped with self-unloading equipment, enabling them to discharge dry bulk cargo without assistance from shore-side equipment or personnel. This equipment enables the vessels to operate twenty-four hours a day, seven days a week. ASC’s vessels are capable of transporting and unloading almost any free flowing, dry bulk commodity. In 2015, ASC served 26 customers with the top five customers comprising 85% of total revenue.
7
The following table sets forth ASC's fleet as of December 31, 2015:
Great Lakes Vessels | Length (feet) | Capacity (gross tons) | ||
M/V American Spirit | 1004' | 62,400 | ||
M/V Burns Harbor | 1000' | 80,900 | ||
M/V Indiana Harbor | 1000' | 80,900 | ||
M/V Walter J. McCarthy, Jr | 1000' | 80,900 | ||
M/V American Century | 1000' | 78,850 | ||
M/V American Integrity | 1000' | 78,850 | ||
M/V St. Clair | 770' | 44,800 | ||
M/V American Mariner | 730' | 37,300 | ||
M/V H. Lee White | 704' | 35,400 | ||
M/V John J. Boland | 680' | 34,000 | ||
M/V Adam E. Cornelius | 680' | 29,200 | ||
M/V Buffalo | 634'-10" | 24,300 | ||
M/V Sam Laud | 634'-10" | 24,300 | ||
M/V American Courage | 634'-10" | 23,800 | ||
Str. American Victory | 730' | 26,300 | ||
Str. American Valor | 767' | 25,500 | ||
Ken Boothe and Lakes Contender (articulated tug-barge) | 740' | 34,000 | ||
ASC’s vessels operate pursuant to customer contracts that stipulate freight volume and may also be supplemented with additional spot volume opportunities. In 2015, ASC operated 13 vessels and carried 26.5 million net tons of cargo. The number of vessels deployed by ASC in any given year is dependent on customer volume requirements.
ASC’s primary competitors on the Great Lakes are Interlake Steamship Company, Great Lakes Fleet, Inc., Grand River Navigation, Central Marine Logistics, and VanEnkevort Tug and Barge. ASC principally competes on the basis of service capabilities, customer relationships, and price.
The United States shipping industry is subject to the Jones Act, which requires all commercial vessels transporting goods between US ports to be built, owned, operated and manned by US citizens, and registered under the US flag.
8
PORTFOLIO MANAGEMENT
Portfolio Management has historically generated leasing, marine operating, asset remarketing, and management fee income through a collection of diversified wholly owned assets and joint venture investments. In addition, Portfolio Management's segment profit is significantly impacted by the contribution of the Rolls-Royce & Partners Finance companies. In 2015, we made the decision to exit the majority of our marine investments within our Portfolio Management segment, including six chemical parcel tankers, a number of inland marine vessels, and our 50% interest in the Cardinal Marine joint venture. Certain marine investments were sold during 2015, and additional sales are expected to be completed in 2016. See the Portfolio Management section in Part II, Item 7 of this Form 10-K for further details. Management believes that selling these investments at this time will provide favorable returns and eliminate the future risk of continuing to hold these investments in markets that have become more volatile. Subsequent to the sales of these marine investments, segment profit will be driven primarily by the Rolls-Royce & Partners Finance entities and, to a lesser extent, by certain retained marine investments.
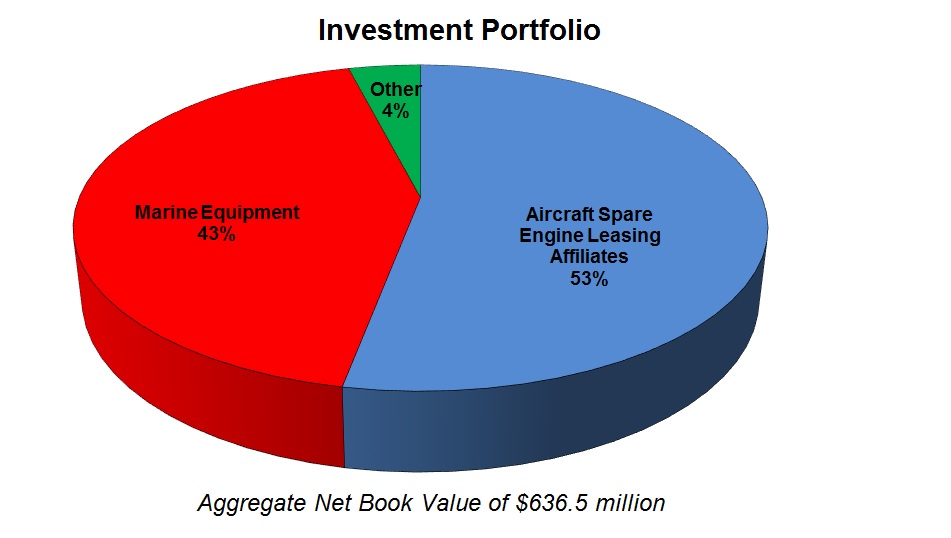
The following table sets forth the approximate net book value of Portfolio Management’s assets as of December 31 (in millions):
Owned Assets | Affiliate Investments | Managed Assets | |||||||||
2015 | $ | 301.4 | $ | 335.1 | $ | 71.0 | |||||
2014 | 474.6 | 338.7 | 64.1 | ||||||||
2013 | 536.0 | 320.9 | 125.3 | ||||||||
Owned and Managed Assets
Portfolio Management's wholly owned portfolio consists of assets subject to operating and finance leases, marine assets operating in pooling arrangements, and secured loans. As of December 31, 2015, $103.4 million of the owned assets were held for sale. Upon completion of the sales of the marine investments described above, Portfolio Management's remaining owned assets will consist primarily of five liquefied gas carrying vessels.
Portfolio Management also manages portfolios of assets for third parties which generate fee and residual sharing income through portfolio administration and remarketing of these assets.
Affiliates
Portfolio Management has historically held investments in affiliated companies, primarily aircraft spare engine leasing and shipping operations.
9
The Rolls-Royce & Partners Finance companies (collectively the “RRPF affiliates”) are a collection of fifteen 50% owned domestic and foreign joint ventures with Rolls-Royce plc (or affiliates thereof, collectively “Rolls-Royce”), a leading manufacturer of commercial aircraft jet engines. The RRPF affiliates are primarily engaged in two business activities: lease financing of aircraft spare engines to a diverse group of commercial aircraft operators worldwide and sale-leaseback financing of aircraft spare engines to Rolls-Royce for use in their engine maintenance programs. As of December 31, 2015, the RRPF affiliates, in aggregate, owned 436 engines, of which 224 were on lease to Rolls-Royce. Aircraft engines are generally depreciated over a useful life of 25 years when new and, depending on actual hours of usage and with proper maintenance, may achieve extended service well beyond the useful life estimates. As of December 31, 2015, the average age of these engines was approximately 11 years. Lease terms vary but typically range from 7 to 10 years. Rolls-Royce acts as manager for each of the RRPF affiliates and also performs substantially all required maintenance activities.
Cardinal Marine Investments LLC (“Cardinal Marine”) was a 50% owned marine joint venture with IMC Holdings, a subsidiary of IMC. IMC is a leading Asia-focused integrated maritime and industrial solutions provider with diversified interests in dry and liquid bulk shipping, ship and crew management, offshore and marine engineering, oil and gas assets, and services and logistics. Cardinal Marine owns five chemical parcel tankers (each with 45,000 dead weight tons (“dwt”) carrying capacity) that operate under a pooling arrangement with IMC's other chemical tankers in support of the movement of liquid bulk chemicals in the Middle East Gulf/Far East and US Gulf/Far East trades. In 2015, we sold our interest in this joint venture to our partner, IMC Holdings.
Intermodal Investment Funds V and VII were each 50% owned joint ventures with DVB Bank SE. The affiliates were formed to finance shipping containers, which were on direct finance leases to third parties. In 2014, we sold our investments in these joint ventures.
Somargas II Private Limited (“Somargas”) and Singco Gas Pte, Limited (“Singco”) were 35% and 50% owned joint ventures with IM Skaugen ASA (“Skaugen”). Somargas owned six liquid petroleum gas/ethylene vessels (each with 8,500 - 10,000 cubic meters (“cbm”) carrying capacity) and Singco owned four liquid petroleum gas/ethylene/LNG vessels (each with 10,000 cbm carrying capacity). In 2013, we sold our interests in Singco and Somargas to Skaugen. In connection with the sale, we received five of the vessels. The vessels continue to operate under a pooling arrangement with Skaugen.
TRADEMARKS, PATENTS AND RESEARCH ACTIVITIES
Patents, trademarks, licenses and research and development activities are not material to our businesses taken as a whole.
SEASONAL NATURE OF BUSINESS
ASC’s fleet is inactive for a significant portion of the first quarter of each year due to the winter conditions on the Great Lakes.
CUSTOMER BASE
GATX, taken as a whole, is not dependent upon a single customer nor does it have any significant customer concentrations. Segment concentrations, if material, are described above.
10
EMPLOYEES AND EMPLOYEE RELATIONS
As of December 31, 2015, we employed 2,253 persons, of whom approximately 42% were union workers covered by collective bargaining agreements.
See "Note 15. Concentrations" in Part II, Item 8 of this Form 10-K for additional information about our employees and concentration of labor force.
ENVIRONMENTAL MATTERS
Our operations, facilities and properties are subject to extensive federal, state, local, and foreign environmental laws and regulations. These laws cover discharges to waters; air emissions; toxic substances; the generation, handling, storage, transportation, and disposal of waste and hazardous materials; and the investigation and remediation of contamination. These laws have the effect of increasing the cost and liability associated with leasing and operating assets, and violations can result in significant fines, penalties, or other liabilities. Environmental risks and compliance with applicable environmental laws and regulations are inherent in rail operations, which frequently involve transporting chemicals and other hazardous materials.
We are subject to, and may from time to time continue to be subject to, environmental cleanup and enforcement actions in the US and in the foreign countries in which we operate. In particular, the federal Comprehensive Environmental Response, Compensation and Liability Act (“CERCLA”), also known as the Superfund law, generally imposes joint and several liability for investigation, cleanup and enforcement costs on current and former owners and operators of a site, without regard to fault or the legality of the original conduct. Accordingly, we have been and may, in the future, be named as a potentially responsible party under CERCLA and other federal, state, local, and foreign laws or regulations for all or a portion of the costs to investigate and clean up sites at which certain contaminants may have been discharged or released by us, our current lessees, former owners or lessees of properties, or other third parties. Environmental remediation and other environmental costs are accrued when considered probable and amounts can be reasonably estimated. As of December 31, 2015, environmental costs were not material to our financial position, results of operations or cash flows. For further discussion, see "Note 24. Legal Proceedings and Other Contingencies" in Part II, Item 8 of this Form 10-K.
EXECUTIVE OFFICERS OF THE REGISTRANT
The following information regarding our executive officers is included in Part I in lieu of inclusion in our definitive Proxy Statement:
Name | Offices Held | Position Held Since | Age | |
Brian A. Kenney | Chairman, President and Chief Executive Officer | 2005 | 56 | |
Robert C. Lyons | Executive Vice President and Chief Financial Officer | 2012 | 52 | |
James F. Earl | Executive Vice President and President, Rail International | 2012 | 59 | |
Thomas A. Ellman | Executive Vice President and President, Rail North America | 2013 | 47 | |
Deborah A. Golden | Executive Vice President, General Counsel and Corporate Secretary | 2012 | 61 | |
Niyi A. Adedoyin | Senior Vice President and Chief Information Officer | 2016 | 48 | |
Michael T. Brooks | Senior Vice President, Operations and Technology | 2013 | 46 | |
James M. Conniff | Senior Vice President, Human Resources | 2014 | 58 | |
Curt F. Glenn | Senior Vice President, Portfolio Management | 2007 | 61 | |
William M. Muckian | Senior Vice President, Controller and Chief Accounting Officer | 2007 | 56 | |
Paul F. Titterton | Senior Vice President and Chief Commercial Officer | 2015 | 40 | |
Eric D. Harkness | Vice President, Treasurer and Chief Risk Officer | 2012 | 43 | |
Jeffery R. Young | Vice President and Chief Tax Officer | 2015 | 53 | |
11
• | Mr. Kenney has served as Chairman, President and Chief Executive Officer since 2005. Previously, Mr. Kenney served as President from 2004 to 2005, Senior Vice President, Finance and Chief Financial Officer from 2002 to 2004, Vice President, Finance and Chief Financial Officer from 1999 to 2002, Vice President, Finance from 1998 to 1999, Vice President and Treasurer from 1997 to 1998, and Treasurer from 1995 to 1996. |
• | Mr. Lyons has served as Executive Vice President and Chief Financial Officer since June 2012. Previously, Mr. Lyons served as Senior Vice President and Chief Financial Officer from 2007 to June 2012, Vice President and Chief Financial Officer from 2004 to 2007, Vice President, Investor Relations from 2000 to 2004, Project Manager, Corporate Finance from 1998 to 2000, and Director of Investor Relations from 1996 to 1998. |
• | Mr. Earl has served as Executive Vice President and President, Rail International since June 2012. In addition, Mr. Earl has served as the Chief Executive Officer of American Steamship Company since June 2012. Previously, Mr. Earl served as Executive Vice President and Chief Operating Officer from 2006 to June 2012, Executive Vice President — Rail from 2004 to 2006, Executive Vice President — Commercial at Rail from 2001 to 2004 and in a variety of increasingly responsible positions in the GATX Capital Rail Group from 1988 to 2001. |
• | Mr. Ellman has served as Executive Vice President and President, Rail North America since June 2013. Previously, Mr. Ellman served as Senior Vice President and Chief Commercial Officer from November 2011 to June 2013, Vice President and Chief Commercial Officer from 2006 to November 2011. Prior to re-joining GATX in 2006, Mr. Ellman served as Senior Vice President and Chief Risk Officer and Senior Vice President, Asset Management of GE Equipment Services, Railcar Services and held various positions at GATX in the GATX Rail Finance Group. |
• | Ms. Golden has served as Executive Vice President, General Counsel and Corporate Secretary since June 2012. Previously, Ms. Golden served as Senior Vice President, General Counsel and Corporate Secretary from 2007 to June 2012. Ms. Golden joined GATX in 2006 as Vice President, General Counsel and Corporate Secretary. Prior to joining GATX, Ms. Golden served as Vice President and General Counsel of Midwest Generation, LLC from 2004 to 2005, Deputy General Counsel, State of Illinois, Office of the Governor from 2003 to 2004 and Assistant General Counsel with Ameritech Corporation/SBC Communications, Inc. from 1997 to 2001. |
• | Mr. Adedoyin was elected Senior Vice President and Chief Information Officer in January 2016. Previously, Mr. Adedoyin served as Vice President and Chief Information Officer from 2013 to 2016 and Senior Director, IT Strategy and Project Management Office from 2008 to 2013. |
• | Mr. Brooks has served as Senior Vice President, Operations and Technology since June 2013. Previously, Mr. Brooks served as Senior Vice President and Chief Information Officer from November 2008 to June 2013. Prior to joining GATX, Mr. Brooks served as Chief Information Officer and Vice President of the retail division of Constellation Energy and held various consulting roles of increasing responsibility with Accenture and Oracle Corporation. |
• | Mr. Conniff has served as Senior Vice President, Human Resources since December 2014. Previously, Mr. Conniff served as Vice President, Human Resources since 2014 and Senior Director, Benefits and Employee Services since 2008. Mr. Conniff joined GATX in 1981 and has held a variety of positions in finance and human resources. |
• | Mr. Glenn has served as Senior Vice President, Portfolio Management since 2007. Previously, Mr. Glenn served as Vice President, Portfolio Management from 2006 to 2007 and as a GATX Corporation Vice President since 2004 and Executive Vice President of Portfolio Management since 2003. Prior to that, Mr. Glenn served as Senior Vice President and Chief Financial Officer of the GATX Capital Division of GATX Financial Corporation from 2000 to 2003 and in a variety of increasingly responsible positions at GATX Capital from 1980 to 2000. |
• | Mr. Muckian has served as Senior Vice President, Controller and Chief Accounting Officer since 2007. Previously, Mr. Muckian served as Vice President, Controller and Chief Accounting Officer from 2002 to 2007, Controller and Chief Accounting Officer from 2000 to 2002, and Director of Taxes of GATX from 1994 to 2000. |
• | Mr. Titterton was elected Senior Vice President and Chief Commercial Officer in April 2015. Previously, Mr. Titterton served as Vice President and Chief Commercial Officer from June 2013 to April 2015, Vice President and Group Executive, Fleet Management, |
12
Marketing and Government Affairs from December 2011 to June 2013, Vice President and Executive Director, Fleet Management from 2008 to 2011, and in a variety of increasingly responsible positions since joining the company in 1997.
• | Mr. Harkness has served as Vice President, Treasurer and Chief Risk Officer since October 2012. Previously, Mr. Harkness served as Vice President, Chief Risk Officer from September 2010 to October 2012 and Senior Investment Risk Officer from 2007 to September 2010. Prior to joining GATX, Mr. Harkness served in a variety of positions of increasing responsibility in the financial services industry. |
• | Mr. Young was elected Vice President and Chief Tax Officer in January 2015. Previously, Mr. Young served as Vice President of Tax from 2007 to January 2015 and as Director of Tax from 2003 to 2007. Prior to joining GATX, Mr. Young spent twenty years in a variety of tax related positions in public accounting and the financial services industry. |
AVAILABLE INFORMATION
We make available free of charge at our website, www.gatx.com, our most recent annual report on Form 10-K, quarterly reports on Form 10-Q, current reports on Form 8-K, and any amendments to those reports filed or furnished pursuant to the Securities Exchange Act of 1934, as amended (the "1934 Act"), as soon as reasonably practicable after such reports are electronically filed with, or furnished to, the US Securities and Exchange Commission (“SEC”). Charters for the Audit Committee, Compensation Committee and Governance Committee of the Board of Directors, the Corporate Governance Guidelines, the Code of Business Conduct and Ethics and the Code of Ethics for Senior Company Officers are posted under Corporate Governance in the Investor Relations section of our website, and are available in print upon request by any shareholder. Within the time period prescribed by SEC and New York Stock Exchange regulations, we will post on our website any amendment to the Code of Ethics for Senior Company Officers and the Code of Business Conduct and Ethics or any waivers thereof. The information on our website is not incorporated by reference into this report.
13
Item 1A. Risk Factors
Investors should consider the risk factors described below as well as other information contained in this filing or our other filings with the US Securities and Exchange Commission before investing in our securities. If any of the events described in the risk factors below occur, our business, financial condition and results of operations could be adversely affected.
We may be unable to maintain assets on lease at satisfactory rates due to decreases in customer demand, oversupply of railcars in the market, or other changes in supply and demand.
Our profitability depends on our ability to lease assets at satisfactory rates and to re-lease assets upon lease expiration. Circumstances such as excess capacity in particular railcar types or generally in the marketplace, decreases in customer demand for our railcars, economic downturns, changes in customer behavior, or other changes in supply or demand can adversely affect asset utilization rates and lease rates. Economic uncertainty or a decline in customer demand for our assets could cause customers to request shorter lease terms and lower lease rates, which may result in a decrease in our asset utilization rate and reduced revenues. Alternatively, customers may seek to lock-in relatively low lease rates for longer terms, which may result in an adverse impact on current or future revenues.
Weak economic conditions in the US or other parts of the world and other factors may decrease customer demand for our assets and services and negatively impact our business and results of operations.
We rely on continued demand from our customers to lease our railcars and locomotives. Demand for these assets and services depends on the markets for our customers’ products and services and the strength and growth of their businesses. Some of our customers operate in cyclical markets, such as the steel, energy, chemical, and construction industries, which are susceptible to macroeconomic downturns and may experience significant changes in demand over time. Weakness in certain sectors of the economy in the United States and other parts of the world may make it more difficult for us to lease certain types of railcars that are either returned at the end of a lease term or returned as a result of a customer bankruptcy or default.
Additional factors, such as changes in harvest or production volumes, changes in supply chains, choices in types of transportation assets, availability of substitutes and other operational needs may also influence customer demand for our assets. Demand for our marine assets and shipping services also depends on the factors discussed above. Significant declines in customer demand for our assets and services could adversely affect our financial performance.
In many cases, demand for our assets also depends on our customers’ desire to lease, rather than buy, the assets. Tax and accounting considerations, interest rates, and operational flexibility, among other factors, may influence a customer’s decision to lease or buy assets. We have no control over these external considerations, and changes in these factors, including anticipated changes to lease accounting rules, could negatively impact demand for our assets held for lease.
Adverse changes in the price of, or demand for, crude oil or other commodities could reduce demand for our railcars and have a negative impact on our results of operations.
Adverse changes in commodity prices or reduced demand for commodities could reduce customer demand for various types of railcars in our fleet. A significant decrease in the price of a commodity may cause producers of that commodity to cut their production levels. A significant increase in the price of a commodity could cause our customers to switch to less expensive alternatives that are not delivered by rail. In each case, these changes in customer behavior can reduce demand for the portions of our fleet that are used to transport the commodity.
Demand for railcars that are used to transport crude oil and related products, including commodities used in drilling operations and the commodities produced by such operations, is dependent on the demand for these commodities. While only about 1.7% of our worldwide fleet is engaged in direct crude-by-rail service, approximately 21% of our North American fleet is leased to petroleum-related customers, making them an important source of our worldwide revenue. Sustained low oil prices could cause oil producers to curtail the drilling of new wells or cease production at certain existing wells that are uneconomical to operate at current crude price levels. Reduced oil drilling activity could result in decreased demand for our railcars used to transport the commodities used in drilling operations, such as frac sand and fracking chemicals, and the commodities produced by such operations, including crude oil and refined products such as gasoline, diesel fuel, petrochemicals and liquefied petroleum gas. A significant and sustained decrease in the price of crude oil and related products could reduce customer demand for our railcars and negatively impact revenue and our results of operations.
14
Demand for railcars that are used to transport ethanol and other renewable fuels may be affected by government subsidies and mandates, which may be enacted, changed, or eliminated from time to time. It is possible that the reduction or elimination of current US mandates for ethanol blending in motor fuels could reduce the production of ethanol, which would reduce demand for portions of our tank car fleet and negatively impact our revenue and profitability.
Events that negatively affect certain assets, customers, or geographic regions could have a negative impact on our results of operations.
We generally derive our revenues from a variety of asset types, customers, industries, and geographic locations. However, from time to time we could have a large investment in a particular asset type, a large revenue stream associated with a particular customer or industry, or a large number of customers located in a particular geographic region. Decreased demand from a discrete event impacting a specific asset type, customer, or industry, or region in which we have a concentrated exposure could negatively impact our results of operations.
A significant decrease in lease renewals by our customers or a significant increase in the number of tank cars requiring compliance-based maintenance could negatively impact operations and substantially increase our costs.
Decreases in customer demand for our railcars could increase the number of leases that are not renewed upon expiration and could cause some customers to default, resulting in the early return of railcars. Railcars that are returned by our customers often must undergo maintenance and service work before being leased to new customers. A significant increase in the number of railcars requiring maintenance may negatively affect our operations and substantially increase maintenance and other related costs. In addition, low demand for certain types of railcars in our fleet may make those railcars more difficult to lease to new customers if they are returned at the end of their existing leases or following a customer default, which could negatively affect our results of operations.
We also perform a variety of government or industry-mandated maintenance programs on our full-service tank cars based on their service time. These compliance programs are cyclical in nature, and as a result, we can face significant increases in the volume of tank cars requiring extensive maintenance in any given year. A significant increase in the number of tank cars requiring maintenance may negatively impact our operations and substantially increase maintenance and other related costs. In addition, while we have contracted with third party maintenance providers to assist with these compliance procedures to the extent our demand exceeds our owned maintenance capacity, high demand faced by these providers from other tank car owners may constrain our access to the providers or may substantially increase our costs.
Our long-term railcar purchase commitments could subject us to material operational and financial risks.
Unlike some of our competitors in the railcar leasing market, we do not manufacture railcars. In order to obtain committed access to a supply of newly built railcars on competitive terms, we regularly enter into long-term supply agreements with manufacturers to purchase significant numbers of newly built railcars over a multi-year period. Some of these agreements may provide for flexibility in the pricing, timing, and quantity of our purchasing commitments, while other agreements may provide no such flexibility. Therefore, if economic conditions weaken during the term of a long-term supply agreement, it is possible that we may be required to continue to accept delivery of, and pay for, new railcars at times when it may be difficult for us to lease such railcars and our financing costs may be high, which could negatively affect our revenues and profitability.
Soft market conditions and declines in asset values may reduce opportunities for us to generate remarketing income.
We utilize our extensive knowledge and experience to remarket rail assets in order to optimize the composition of our fleet, and these activities generate income that contributes significantly to Rail North America’s segment profit. Reduced demand for our assets due to adverse market conditions could reduce opportunities for us to generate remarketing income. A significant or prolonged decline in the secondary market for our assets could adversely affect our financial performance.
15
We have significant financial exposure related to the performance of our aircraft engine leasing affiliate investments.
GATX and Rolls-Royce plc (“Rolls Royce”) each own 50% of fifteen domestic and foreign joint venture entities (collectively, the “RRPF affiliates”) that own and lease aircraft engines to Rolls-Royce and owners and operators of commercial aircraft. These investments expose us to various risks associated with the commercial aviation industry, including geographic exposure and customer concentrations unique to that industry. The financial results of the RRPF affiliates depend heavily on the performance of Rolls-Royce, as Rolls-Royce is both a major customer of, and a critical supplier of maintenance services to, the RRPF affiliates. The RRPF affiliates contribute significantly to our profit. If the financial or operating performance of the RRPF affiliates deteriorates, our results of operations and cash flows could be negatively affected.
Fluctuations in foreign exchange rates and interest rates could negatively impact our results of operations.
Upon consolidation, we translate the financial results of certain subsidiaries from their local currency to the US dollar, which exposes us to foreign exchange rate fluctuations. As exchange rates vary, the translated operating results of foreign subsidiaries may differ materially from period to period. We also have gains and losses on foreign currency transactions, which could vary based on fluctuations in exchange rates and the timing of the transactions and their settlement. In addition, fluctuations in foreign exchange rates can affect the demand and price for services we provide both domestically and internationally, and could negatively impact our results of operations. We also face risks associated with fluctuations in interest rates. We may seek to limit our exposure to foreign exchange rate and interest rate risk with currency or interest rate derivatives, which may or may not be effective. A material and unexpected change in interest rates or foreign exchange rates could negatively affect our financial performance.
Many of our employees are represented by unions, and failure to successfully negotiate collective bargaining agreements may result in strikes, work stoppages, or substantially higher labor costs.
A significant portion of our employees are represented by labor unions and work under collective bargaining agreements that cover a range of workplace matters, such as wages, health and welfare benefits, and work rules. We have generally been successful in negotiating acceptable agreements with the unions without experiencing material work stoppages. However, if we fail to negotiate acceptable new agreements, our business could be disrupted by strikes or lockouts. We could also incur increased operating costs due to higher wages or benefits paid to union workers. Business disruptions or higher operating costs could both have an adverse effect on our financial position, results of operations, or cash flows.
Changes in railroad efficiency may adversely affect demand for our railcars.
Railroad infrastructure investments that improve efficiency or declines in rail traffic due to decreased demand could increase the average speed at which railroads can operate their trains, which may reduce the number of railcars needed for railroads to haul the same amount of cargo. Adverse weather conditions, railroad mergers, and increases in rail traffic could result in slower transit times making rail transportation less attractive to shippers versus other modes of transport. In each case, these changes could reduce demand for our railcars and negatively impact revenue and our results of operations.
New rules in the US and Canada applicable to tank cars carrying crude oil, ethanol, and other flammable liquids could negatively impact our tank car fleet in flammable liquids service.
Recently adopted legislation and regulations in the US and Canada established new design standards for tank cars used to transport various flammable liquids, including crude oil and ethanol. Existing tank cars in flammables service that were built prior to the adoption of the new design standards must be modified or removed from service between May, 2017, and May, 2029, depending on the type of car, the type of commodity carried, and whether the car is used in the US, Canada, or both countries. We have a fleet of approximately 125,000 railcars in North America, including approximately 13,900 tank cars currently used to transport flammable liquids that are affected by the new rules, of which approximately 4,300 are moving crude oil and ethanol. Over 90% of our affected tank cars have a compliance deadline of 2023 or later. We expect to modify some of the most modern of our affected cars tank cars to comply with the new standards. However, for the majority of the affected cars, we currently anticipate retiring, redeploying, or selling them rather than performing retrofits. The additional costs to modify certain tank cars and the cost of retiring tank cars early could have an adverse impact on our business and results of operations.
16
Deterioration of conditions in the global capital markets or negative changes in our credit ratings may limit our ability to secure financing and may increase our borrowing costs.
We rely largely on banks and capital markets to fund our operations and contractual commitments, including the issuance of long-term debt instruments and commercial paper. These markets can experience high levels of volatility and access to capital can be limited for an extended period of time. In addition to conditions in the capital markets, changes in our financial performance or credit ratings or ratings outlook, as determined by rating agencies such as Standard & Poor’s and Moody’s Investors Service, could cause us to incur increased borrowing costs or to have greater difficulty accessing public and private markets for secured and unsecured debt. If we are unable to secure financing on acceptable terms, our other sources of funds, including available cash, bank facilities, cash flow from operations, and portfolio proceeds, may not be adequate to fund our operations and contractual commitments.
We may incur future asset impairment charges.
We review long-lived assets and joint venture investments for impairment regularly, or when circumstances indicate the carrying value of an asset or investment may not be recoverable. Among other circumstances, the following may change our estimates of the cash flows we expect our long-lived assets or joint venture investments will generate, which could require us to recognize asset impairment charges:
• | A weak economic environment or challenging market conditions |
• | New laws, rules or regulations affecting our assets, or changes to existing laws, rules or regulations |
• | Events related to particular customers or asset types |
• | Asset or portfolio sale decisions by management |
Competition could result in decreased profitability.
We operate in a highly competitive business environment. In certain cases, our competitors are larger than we are and have greater financial resources, higher credit ratings, and a lower cost of capital. These factors may enable our competitors to offer leases to customers at lower rates than we can provide, thus negatively impacting our profitability, asset utilization and investment volume.
Risks related to our international operations and expansion into new geographic markets could adversely affect our business, financial condition, and operating results.
We generate a significant amount of our net income outside the United States. In recent years, we have increased our focus on international rail growth and expansion into select emerging markets as a means to grow and diversify earnings. Our foreign operations and international expansion strategy are subject to the following risks associated with international operations:
• | Noncompliance with US laws affecting operations outside of the United States, such as the Foreign Corrupt Practices Act |
• | Noncompliance with a variety of foreign laws and regulations |
• | Failure to properly implement changes in tax laws and the interpretation of those laws |
• | Failure to develop and maintain data management practices that comply with laws related to cybersecurity, privacy, data localization, and data protection |
• | Fluctuations in currency values |
• | Sudden changes in foreign currency exchange controls |
• | Discriminatory or conflicting fiscal policies |
• | Difficulties enforcing contractual rights or foreclosing to obtain the return of our assets in certain jurisdictions |
• | Uncollectible accounts and longer collection cycles that may be more prevalent in foreign countries |
• | Ineffective or delayed implementation of appropriate controls, policies, and processes across our diverse operations and employee base |
• | Imposition of sanctions against countries where we operate or specific companies or individuals with whom we do business |
• | Nationalization or confiscation of assets by foreign governments, and imposition of additional or new tariffs, quotas, trade barriers, and similar restrictions on our operations outside the United States |
17
We have been and may continue to be involved in various types of litigation.
The nature of our business and our assets potentially exposes us to significant personal injury and property damage claims and litigation, environmental claims, or other types of lawsuits inside and outside the US. Customers may use certain types of our railcars to transport crude oil and other hazardous materials, and an accident involving a railcar carrying such materials could lead to litigation and subject us to significant liability, particularly where the accident involves serious personal injuries or the loss of life. Our failure to maintain railcars in compliance with governmental regulations and industry rules could also expose us to fines and claims for personal injury, property damage, and environmental damage. In some jurisdictions, an accident can give rise to both civil and criminal liabilities for us and, in some cases, our employees. In the event of an unfavorable outcome, we could be subject to substantial damages, including criminal penalties and fines, and our employees who are named as criminal defendants in any such litigation may be subject to incarceration and fines. A substantial adverse judgment against us could have a material effect on our financial position, results of operations, cash flows, and reputation.
Our rail and marine assets and operations are subject to various laws, rules, and regulations. If these laws rules, and regulations change or we fail to comply with them, it could have a significant negative effect on our business and profitability.
Our rail and marine operations are subject to various laws, rules, and regulations administered by authorities in jurisdictions where we do business. In North America, our railcar and locomotive fleet and operations are subject to safety, operations, maintenance, and mechanical standards, rules, and regulations enforced by various federal and state agencies and industry organizations, including the US Department of Transportation, the Federal Railroad Administration, the Pipeline and Hazardous Materials Safety Administration of the US Department of Transportation, Transport Canada, and the Association of American Railroads. State and provincial agencies regulate some health and safety matters related to rail operations not otherwise preempted by federal law. Our business and railcar and locomotive fleet may be adversely impacted by new rules or regulations, or changes to existing rules or regulations, which could require additional maintenance or substantial modification or refurbishment of our railcars, or could make certain types of railcars inoperable or obsolete or require them to be phased out prior to the end of their useful lives. In addition, violations of these rules and regulations can result in substantial fines and penalties, including potential limitations on operations or forfeitures of assets.
Similarly, our marine assets and operations are subject to rules and regulations relating to safety, US citizen ownership requirements, emissions, ballast discharges, and other environmental and operational matters enforced by various federal and state agencies, including the Maritime Administration of the US Department of Transportation, the US Coast Guard, and the US Environmental Protection Agency. If we fail to comply with these rules and regulations, we could be prohibited from operating or leasing marine assets in the US market, and under certain circumstances, could incur severe fines and penalties, including potential limitations on operations or forfeitures of assets.
In addition, our foreign operations are subject to the jurisdiction of authorities in countries where we do business. If we fail to comply with these laws, rules, and regulations, or if they change in the future, the use of our assets could be restricted, or the economic value of our assets may be reduced. These restrictions or reductions could lead to loss of revenue or cause us to incur significant expenses to comply with laws, rules, and regulations, thereby increasing operating expenses. Certain changes to or actions by authorities under existing laws, rules, and regulations, or actions, could result in the obsolescence of various assets or impose compliance costs that are significant enough to render those assets economically obsolete.
We may not be able to obtain cost-effective insurance.
We manage our exposure to risk, in part, by purchasing insurance. There is no guarantee that cost-effective insurance will consistently be available. If insurance coverage becomes prohibitively expensive, we could be forced to reduce our coverage amount and increase the amount of self-insured risk we retain, thereby increasing our exposure to uninsured adverse judgments and other losses and liabilities that could have a material effect on our financial position, results of operations and cash flows.
18
We are subject to extensive environmental regulations and the costs of remediation may be material.
We are subject to extensive federal, foreign, state, and local environmental laws and regulations concerning, among other things, the discharge of hazardous materials and remediation of contaminated sites. In addition, some of our properties, including those previously owned or leased, have been used for industrial purposes, which may have resulted in discharges onto these properties. Environmental liability can extend to previously owned or operated properties in addition to properties we currently own or use. Additionally, we could incur substantial costs, including cleanup costs, fines and costs arising out of third-party claims for property or natural resource damage and personal injury as a result of violations of or liabilities under environmental laws and regulations in connection with our or our lessees’ current or historical operations. Under some environmental laws in the United States and certain other countries, the owner of a leased railcar may be liable for environmental damage, cleanup or other costs in the event of a spill or discharge of material from a railcar without regard to the owner's fault. We routinely assess environmental liabilities, including our potential obligations and commitments for remediation of contaminated sites and the possible amount of recoveries from other responsible parties. Due to the regulatory complexities, risk of unidentified contaminants on our properties and the potential liability for the operations of our lessees, it is possible environmental and remediation costs may be materially different from the costs we have estimated.
The fair market value of our long-lived assets may differ from the value of those assets reflected in our financial statements.
Our assets primarily consist of long-lived assets such as railcars, marine vessels, and other equipment. The carrying value of these assets in our financial statements may sometimes differ from their fair market value. These valuation differences may be positive or negative and could be material based on market conditions and demand for certain assets.
Our assets may become obsolete.
In addition to changes in laws, rules, and regulations that may make assets obsolete, changes in the preferred method our customers use to ship their products, changes in demand for particular products, or a shift by customers toward purchasing assets rather than leasing them may adversely impact us. Our customers' industries are driven by dynamic market forces and trends, which are influenced by economic and political factors. Changes in our customers' markets may significantly affect demand for our rail and marine assets. A reduction in customer demand or change in customers' preferred method of product transportation could result in the economic obsolescence of the assets leased by those customers.
Unfavorable conditions on the Great Lakes could impact business operations, which could result in increases in costs and decreases in revenues.
The success of our ASC subsidiary depends on the efficiency of its operations on the Great Lakes. Disruptions at the Sault St. Marie locks or severe weather conditions, such as high wind and ice formation, could cause significant business interruptions or shortened sailing seasons. Additionally, low water levels and vessel draft restrictions may restrict the volume that ASC's vessels can transport per trip. These conditions could negatively impact our results of operations through increased operating costs or decreased revenues.
We are subject to the inherent risks of our affiliate investments.
We are indirectly exposed to risks through our ownership interests in affiliates, as our affiliates may experience many of the same risks discussed in this "Risk Factors" section. Rolls-Royce manages our RRPF affiliates, and we sometimes retain third parties to manage assets we own directly, such as our ocean-going vessels. Poor business or financial results of these affiliates, or the third parties who manage, operate, or invest along with us in these affiliates, could negatively impact our financial results. Additionally, when a third party manages or operates an affiliate or asset, we may not have control over operational matters related to the affiliate or asset, which could result in actions that have an adverse economic impact on the affiliate, the asset, or GATX or could expose GATX to potential liability.
19
We may be affected by climate change or market or regulatory responses to climate change.
Changes in laws, rules, and regulations, or actions by authorities under existing laws, rules, or regulations, to address greenhouse gas emissions and climate change could negatively impact our customers and business. For example, restrictions on emissions could significantly increase costs for our customers whose production processes require significant amounts of energy. Customers' increased costs could reduce their demand to lease our assets. In addition, railcars in our fleet that are used to carry fossil fuels, such as coal and petroleum, could see reduced demand if new government regulations mandate a reduction in fossil fuel consumption. New government regulations could also increase our marine and other operating costs and compliance with those regulations could be costly. Potential consequences of laws, rules, or regulations addressing climate change could have an adverse effect on our financial position, results of operations, and cash flows.
A small number of shareholders could significantly influence our business.
Five shareholders collectively control more than 50% of our outstanding common stock. Accordingly, a small number of shareholders could affect matters that require shareholder approval, such as the election of directors and the approval of significant business transactions.
Changes to assumptions used to calculate post-retirement costs, increases in funding requirements, and investment losses in pension funds could adversely affect our results of operations.
We calculate our pension and other post-retirement costs using various assumptions, such as discount rates, long-term return on plan assets, salary increases, health care cost trend rates, and other factors. Changes to any of these assumptions could adversely affect our financial position and results of operations. Periods of low interest rates reduce the discount rate we use to calculate our funding obligations, which may increase our funding requirements. Additionally, changes to laws, regulations, or rules could require us to increase funding requirements or to compensate for investment losses in pension plan assets. If we were forced to increase contributions to our pension plans, our financial position, results of operations, and cash flows could be negatively affected.
Changes in the mix of earnings in the US and foreign countries could adversely affect our effective tax rate.
We are subject to taxes in the United States and various foreign jurisdictions. As a result, our effective tax rate could be adversely affected by changes in the mix of earnings in the United States and foreign countries with differing statutory tax rates. Our effective tax rate could also be adversely affected by changes in tax laws, material audit assessments, or legislative changes that impact statutory tax rates, which could include an impact on previously-recorded deferred tax assets and liabilities.
Our allowance for losses may be inadequate.
Our allowance for losses on reservable assets may not be adequate to cover credit losses in our portfolio if unexpected adverse changes occur in macroeconomic conditions or if discrete events adversely affect specific customers, industries, or markets. If the credit quality of our customer base materially deteriorates, it may require us to incur additional credit losses and our financial position or results of operations could be negatively impacted.
We cannot predict with certainty the impact that inflation or deflation will have on our financial results.
The timing and duration of the effects of inflation are unpredictable and depend on market conditions and economic factors. Inflation in lease rates as well as inflation in residual values for rail and marine assets has historically benefited our financial results. However, these benefits may be offset by increases in the costs for goods and services we purchase, including salaries and wages, health care costs, supplies, utilities, maintenance and repair services, and materials, as well as increased financing costs. Significant increases in our cost of goods and services could adversely impact our financial performance. Conversely, a period of prolonged deflation could negatively impact our lease rate pricing, residual values, and asset remarketing opportunities. These negative impacts of deflation may be offset by decreases to our costs for goods and services, including those listed above.
We could be adversely affected by United States and global political conditions, including acts or threats of terrorism or war.
We may be adversely affected by national and international political developments, instability, and uncertainties, including political unrest and threats of terrorist attacks, which could lead to the following:
20
• | Legislation or regulatory action directed toward improving the security of railcars and marine vessels against acts of terrorism, which could affect the construction or operation of railcars and marine vessels |
• | A decrease in demand for rail and marine services |
• | Lower utilization of rail and marine equipment |
• | Lower rail lease and marine charter rates |
• | Impairments of rail and marine assets or capital market disruption, which may raise our financing costs or limit our access to capital |
• | Liability or losses resulting from acts of terrorism involving our assets |
• | A downturn in the commercial aviation industry, which could lead to adverse financial results for our RRPF affiliates. |
Depending upon the severity, scope, and duration of these circumstances, the impact on our financial position, results of operations, and cash flows could be material.
We rely on technology in all aspects of our business operations. If we are unable to adequately maintain and secure our IT infrastructure from cybersecurity threats and related disruptions, our business could be negatively impacted.
We rely on our IT infrastructure to process, transmit, and store electronic information that is critical to all aspects of our business operations, including employee and customer information. All IT systems are vulnerable to security threats, such as hacking, viruses, malicious software, and other unlawful attempts to disrupt or gain access to these systems. Although we have taken steps to mitigate these risks, we may not be able to prevent breaches of our IT infrastructure, some of which is managed by third parties. Breaches of our IT infrastructure could lead to disruptions in our business, potentially including the theft, destruction, loss, misappropriation, or release of confidential employee and customer information stored on our IT systems or confidential data or other business information and subject us to potential lawsuits or other material legal liabilities. These disruptions could adversely affect our operations, financial position, and results of operations.
Our internal control over financial accounting and reporting may not detect all errors or omissions in the financial statements.
If we fail to maintain adequate internal controls over financial accounting, we may not be able to conclude on an ongoing basis that we have effective internal control over financial reporting in accordance with Section 404 of the Sarbanes-Oxley Act of 2002 and related regulations. Although management has concluded that adequate internal control procedures are in place, no system of internal control provides absolute assurance that the financial statements are accurate and free of error.
Item 1B. Unresolved Staff Comments
None.
21
Item 2. Properties
Information regarding the general character of our properties is included in Item 1, “Business” of this Form 10-K.
As of December 31, 2015, our locations of operations were as follows:
GATX Headquarters | ||
Chicago, Illinois | ||
Rail North America | ||
Business Offices | Major Maintenance Facilities | Mobile Units |
Alpharetta, Georgia | Colton, California | Camp Minden, Louisiana |
Chicago, Illinois | Hearne, Texas | Copperhill, Tennessee |
Houston, Texas | Waycross, Georgia | Donaldsonville, Louisiana |
Mexico City, Mexico | Montreal, Quebec | Galena Park, Texas |
Mississauga, Ontario | Moose Jaw, Saskatchewan | Freeport, Texas |
Montreal, Quebec | Red Deer, Alberta | Macon, Georgia |
East Chicago, Indiana | ||
Field Maintenance Facilities | Lake Charles, Louisiana | |
East Chicago, Indiana | Mobile, Alabama | |
Kansas City, Kansas | Kansas City, Kansas | |
Plantersville, Texas | Olympia, Washington | |
Terre Haute, Indiana | Sioux City, Iowa | |
Sarnia, Ontario | Lakeland, Florida | |
Clarkson, Ontario | ||
Customer Site Locations | Edmonton, Alberta | |
Aurora, North Carolina | Moose Jaw, Saskatchewan | |
Catoosa, Oklahoma | Montreal, Quebec | |
Donaldsonville, Louisiana | Quebec City, Quebec | |
Freeport, Texas | Red Deer, Alberta | |
Geismar, Louisiana | Sarnia, Ontario | |
Yazoo City, Mississippi | ||
Rail International | ||
Business Offices | Major Maintenance Facilities | Customer Site Locations |
Düsseldorf, Germany | Hannover, Germany | Płock, Poland |
Hamburg, Germany | Ostróda, Poland | |
Leipzig, Germany | ||
Moscow, Russia | ||
Gurgaon, India | ||
Paris, France | ||
Vienna, Austria | ||
Warsaw, Poland | ||
American Steamship Company | ||
Duluth, Minnesota | ||
Toledo, Ohio | ||
Williamsville, New York | ||
Portfolio Management | ||
Chicago, Illinois | ||
22
Item 3. Legal Proceedings
Information concerning litigation and other contingencies is described in "Note 24. Legal Proceedings and Other Contingencies" in Part II, Item 8 of this Form 10-K and is incorporated herein by reference.
Item 4. Mine Safety Disclosures
None.
23
PART II
Item 5. Market for Registrant’s Common Equity, Related Stockholder Matters, and Issuer Purchases of Equity Securities
Our common stock is listed on the New York and Chicago Stock Exchanges under ticker symbol GMT. We had approximately 1,925 common shareholders of record as of January 31, 2016. The following table shows the reported high and low sales price of our common shares and the dividends declared per share:
2015 | 2014 | ||||||||||||||||||||||
2015 | 2015 | 2014 | 2014 | Dividends Declared | Dividends Declared | ||||||||||||||||||
Common Stock | High | Low | High | Low | |||||||||||||||||||
First quarter | $ | 63.36 | $ | 52.67 | $ | 69.87 | $ | 50.80 | $ | 0.38 | $ | 0.33 | |||||||||||
Second quarter | 61.41 | 53.10 | 69.00 | 62.48 | 0.38 | 0.33 | |||||||||||||||||
Third quarter | 53.72 | 42.94 | 68.45 | 58.21 | 0.38 | 0.33 | |||||||||||||||||
Fourth quarter | 50.56 | 37.95 | 65.87 | 52.51 | 0.38 | 0.33 | |||||||||||||||||
Issuer Purchases of Equity Securities
In 2015, we repurchased 2.4 million shares for $125.4 million, which completed our $250 million repurchase authorization approved in 2014. In 2014, we repurchased 1.9 million shares for $124.6 million. Subsequent to December 31, 2015, our board of directors authorized a new $300 million stock repurchase program. The timing of share repurchases will be dependent on various factors.
The following is a summary of common stock repurchases completed by month during the fourth quarter of 2015 (in millions, except per share amounts):
Issuer Purchases of Equity Securities | ||||||||||||||
(a) | (b) | (c) | (d) | |||||||||||
Total | Total Number of Shares Purchased | Average Price Paid per Share | Total Number of Shares Purchased as Part of Publicly Announced Plans or Programs | Maximum Number (or Approximate Dollar Value) of Shares that May Yet Be Purchased Under the Plans or Programs | ||||||||||
October 1, 2015 - October 31, 2015 | 309,646 | $ | 46.43 | 309,646 | $ | — | ||||||||
24
Equity Compensation Plan Information as of December 31, 2015:
Number of Securities to be Issued Upon Exercise of Outstanding Options, Warrants and Rights | Weighted-Average Exercise Price of Outstanding Options, Warrants and Rights | Number of Securities Remaining Available for Future Issuance Under Equity Compensation Plans (excluding securities reflected in Column (a)) | ||||||||||
Plan Category | (a) | (b) | (c) | |||||||||
Equity Compensation Plans Approved by Shareholders | 2,127,852 | (1) | $ | 45.18 | (2) | 1,832,518 | ||||||
Equity Compensation Plans Not Approved by Shareholders | — | — | ||||||||||
Total | 2,127,852 | 1,832,518 | ||||||||||
__________
(1) | Consists of 1,573,716 stock appreciation rights, 214,371 performance shares, 173,744 restricted stock units and 166,021 phantom stock units. |
(2) | The weighted-average exercise price does not include performance shares, restricted stock or phantom stock units. |
For additional information about issuable securities under our equity compensation plans and the related weighted average exercise price, see "Note 13. Share-Based Compensation" in Part II, Item 8 of this Form 10-K.
25
Common Stock Performance Graph
The performance graph below compares the cumulative total shareholder return on our common stock for the five-year period ended December 31, 2015, with the cumulative total return of the S&P 500, the S&P MidCap 400, and the Russell 3000. We are not aware of any peer companies whose businesses are directly comparable to ours and, therefore, the graph displays the returns of the S&P 500, the S&P MidCap 400 and the Russell 3000 since those indices are comprised of companies with market capitalizations similar to ours. The graph and table assume that $100 was invested in our common stock and each of the indices on December 31, 2010, and that all dividends were reinvested.
12/31/10 | 12/31/11 | 12/31/12 | 12/31/13 | 12/31/14 | 12/31/15 | ||||||||||||||||||
GATX | $ | 100.00 | $ | 127.78 | $ | 130.40 | $ | 161.12 | $ | 181.54 | $ | 138.42 | |||||||||||
S&P 500 | 100.00 | 102.08 | 118.39 | 156.70 | 178.10 | 180.56 | |||||||||||||||||
S&P MidCap 400 | 100.00 | 98.25 | 115.74 | 154.45 | 169.47 | 165.78 | |||||||||||||||||
Russell 3000 | 100.00 | 101.00 | 117.57 | 157.02 | 176.70 | 177.55 | |||||||||||||||||
26
Item 6. Selected Financial Data
The following financial information has been derived from our audited consolidated financial statements for the years ended December 31 (in millions, except per share data, recourse leverage, and return on equity). This information should be read in conjunction with "Management’s Discussion and Analysis of Financial Condition and Results of Operations" and the consolidated financial statements and accompanying notes thereto included elsewhere herein.
2015 | 2014 | 2013 | 2012 | 2011 | |||||||||||||||
Results of Operations | |||||||||||||||||||
Revenue | $ | 1,449.9 | $ | 1,451.0 | $ | 1,321.0 | $ | 1,243.2 | $ | 1,191.4 | |||||||||
Net gain on asset dispositions | 79.2 | 87.2 | 85.6 | 79.5 | 65.8 | ||||||||||||||
Share of affiliates’ earnings (pretax) | 45.4 | 67.8 | 92.3 | 21.6 | 40.6 | ||||||||||||||
Net income | 205.3 | 205.0 | 169.3 | 137.3 | 110.8 | ||||||||||||||
Net income, excluding tax adjustments and other items (1) | 234.9 | 205.0 | 164.8 | 133.8 | 95.0 | ||||||||||||||
Per Share Data | |||||||||||||||||||
Basic earnings | 4.76 | 4.55 | 3.64 | 2.93 | 2.39 | ||||||||||||||
Diluted earnings | 4.69 | 4.48 | 3.59 | 2.88 | 2.35 | ||||||||||||||
Diluted earnings, excluding tax adjustments and other items (1) | 5.37 | 4.48 | 3.50 | 2.81 | 2.01 | ||||||||||||||
Dividends declared | 1.52 | 1.32 | 1.24 | 1.20 | 1.16 | ||||||||||||||
Financial Condition | |||||||||||||||||||
Operating assets and facilities, net of accumulated depreciation | $ | 5,698.4 | $ | 5,688.0 | $ | 5,070.3 | $ | 4,654.4 | $ | 4,359.3 | |||||||||
Investments in affiliated companies | 348.5 | 357.7 | 354.3 | 502.0 | 513.8 | ||||||||||||||
Total assets | 6,894.2 | 6,919.9 | 6,535.5 | 6,044.7 | 5,846.0 | ||||||||||||||
Off-balance sheet assets (1) | 495.5 | 617.8 | 904.4 | 884.5 | 887.1 | ||||||||||||||
Short-term borrowings | 7.4 | 72.1 | 23.6 | 273.6 | 28.6 | ||||||||||||||
Long-term debt and capital lease obligations | 4,196.8 | 4,184.5 | 3,833.3 | 3,283.6 | 3,507.0 | ||||||||||||||
Shareholders’ equity | 1,280.2 | 1,314.0 | 1,397.0 | 1,244.2 | 1,127.3 | ||||||||||||||
Other Data | |||||||||||||||||||
Average number of common shares and common share equivalents | 43.8 | 45.8 | 47.1 | 47.6 | 47.2 | ||||||||||||||
Net cash provided by operating activities | $ | 534.3 | $ | 449.2 | $ | 400.7 | $ | 370.2 | $ | 306.8 | |||||||||
Portfolio proceeds | $ | 482.2 | $ | 264.0 | $ | 385.3 | $ | 288.9 | $ | 154.1 | |||||||||
Portfolio investments and capital additions | $ | 714.7 | $ | 1,030.5 | $ | 859.6 | $ | 770.0 | $ | 614.6 | |||||||||
Recourse leverage | 3.5 | 3.5 | 3.0 | 3.2 | 3.4 | ||||||||||||||
ROE | 15.8 | % | 15.1 | % | 12.8 | % | 11.6 | % | 9.9 | % | |||||||||
ROE, excluding tax adjustments and other items (1) | 18.1 | % | 15.1 | % | 12.5 | % | 11.3 | % | 8.5 | % | |||||||||
__________
(1) See "Non-GAAP Financial Measures" included in "Item 7. Management’s Discussion and Analysis of Financial Condition and Results of Operations" of this Form 10-K for an explanation of tax adjustments and other items.
27
Item 7. Management’s Discussion and Analysis of Financial Condition and Results of Operations
OVERVIEW
We lease, operate, manage, and remarket long-lived, widely-used assets, primarily in the rail market. We also invest in joint ventures that complement our existing business activities. We report our financial results through four primary business segments: Rail North America, Rail International, American Steamship Company (“ASC”), and Portfolio Management. A more complete description of our business is included in "Item 1. Business," in Part I of this Form 10-K.
The following discussion and analysis should be read in conjunction with the audited financial statements included in "Item 8. Financial Statements and Supplementary Data" in this Form10-K. We based the discussion and analysis that follows on financial data we derived from the financial statements prepared in accordance with US generally accepted accounting principles ("GAAP") and on certain other financial data that we prepared using non-GAAP components. For a reconciliation of these non-GAAP components to the most comparable GAAP components, see “Non-GAAP Financial Measures” at the end of this item.
DISCUSSION OF OPERATING RESULTS
The following table shows a summary of our reporting segments and consolidated financial results for years ended December 31 (in millions, except per share data and percentages):
2015 | 2014 | 2013 | |||||||||
Segment Revenues | |||||||||||
Rail North America | $ | 1,006.8 | $ | 927.5 | $ | 817.1 | |||||
Rail International | 180.4 | 198.9 | 189.0 | ||||||||
ASC | 170.2 | 227.2 | 227.7 | ||||||||
Portfolio Management | 92.5 | 97.4 | 87.2 | ||||||||
$ | 1,449.9 | $ | 1,451.0 | $ | 1,321.0 | ||||||
Segment Profit | |||||||||||
Rail North America | $ | 379.5 | $ | 321.0 | $ | 231.6 | |||||
Rail International | 70.1 | 78.7 | 97.4 | ||||||||
ASC | 15.1 | 27.3 | 28.9 | ||||||||
Portfolio Management | 49.8 | 68.2 | 74.4 | ||||||||
514.5 | 495.2 | 432.3 | |||||||||
Less: | |||||||||||
Selling, general and administrative expense | 192.4 | 189.2 | 178.3 | ||||||||
Unallocated interest expense, net | 5.3 | 5.4 | 3.8 | ||||||||
Other, including eliminations | 1.1 | 1.6 | (1.1 | ) | |||||||
Income taxes (($0.5), $18.3 and $16.5 related to affiliates' earnings) | 110.4 | 94.0 | 82.0 | ||||||||
Net Income | $ | 205.3 | $ | 205.0 | $ | 169.3 | |||||
Net income, excluding tax adjustments and other items | $ | 234.9 | $ | 205.0 | $ | 164.8 | |||||
Diluted earnings per share | 4.69 | 4.48 | 3.59 | ||||||||
Diluted earnings per share, excluding tax adjustments and other items | 5.37 | 4.48 | 3.50 | ||||||||
Return on equity | 15.8 | % | 15.1 | % | 12.8 | % | |||||
Return on equity, excluding tax adjustments and other items | 18.1 | % | 15.1 | % | 12.5 | % | |||||
Investment Volume | $ | 714.7 | $ | 1,030.5 | $ | 859.6 | |||||
28
2015 Summary
Net income was $205.3 million, or $4.69 per diluted share, for 2015 compared to $205.0 million, or $4.48 per diluted share, for 2014, and $169.3 million, or $3.59 per diluted share, for 2013. Results included the impact of tax adjustments and other items of a $29.6 million loss in 2015 and a $4.5 million benefit in 2013 (see "Non-GAAP Financial Measures" at the end of this item for further details). Excluding the impact of these items, net income increased $29.9 million, or 14.6%, in 2015 compared to 2014 and $40.2 million, or 24.4%, in 2014 compared to 2013.
• | At Rail North America, higher lease rates, a full year contribution of the boxcar fleet acquired in 2014, lower net maintenance expenses, and higher remarketing gains were partially offset by lower scrapping proceeds, resulting in a net increase in segment profit in 2015. |
• | At Rail International, segment profit in 2015 declined primarily due to the effects of foreign exchange offsetting higher lease revenue and lower net maintenance expenses. |
• | At ASC, segment profit was lower in 2015, largely due to lower demand for iron ore shipments. |
• | At Portfolio Management, segment profit declined, as the impact of the planned exit of the majority of marine investments more than offset higher income at our Rolls-Royce Partners Finance affiliates. |
Total investment volume was $714.7 million in 2015, compared to $1,030.5 million in 2014 and $859.6 million in 2013.
2016 Outlook
Despite increasing global economic uncertainty, a slowdown in the US energy markets, and a declining railcar leasing market, we are well positioned to continue to benefit from our North American fleet actions over the past few years. By extending average lease terms and optimizing our fleet, we have reduced the number of leases scheduled for expiration in 2016, relative to prior years. For those cars that do expire in 2016, markets will generally be weaker than in 2015, and our focus for these cars will be keeping them on lease to maximize our fleet utilization. In the weakest sectors of the North American rail market, we will also focus on shortening lease terms to optimize our ability to reprice these leases when those markets recover. In 2016, we will continue to use our supply agreements to pursue new car placements with customers. Our strong balance sheet also offers us flexibility to pursue attractive secondary market acquisitions if opportunities arise.
• | We expect Rail North America's segment profit in 2016 to decrease from 2015, primarily due to lower expected railcar remarketing activity. |
• | We anticipate Rail International's segment profit in 2016 to be similar to 2015, as higher lease revenue is offset by higher maintenance expenses and foreign currency impacts. |
• | We expect ASC’s segment profit to be higher in 2016, resulting from improved fleet efficiency. However, uncertainty in the steel industry and the related impact on tonnage carried will continue to be a driver of segment results. |
• | We believe Portfolio Management's segment profit in 2016 will be comparable to 2015 as performance at the Rolls-Royce Partners Finance affiliates will continue to drive segment results. |
29
Segment Operations
Segment profit is an internal performance measure used by the Chief Executive Officer to assess the performance of each segment in a given period. Segment profit includes all revenues, pretax earnings from affiliates, and net gains on asset dispositions that are attributable to the segments, as well as expenses that management believes are directly associated with the financing, maintenance, and operation of the revenue earning assets. Segment profit excludes selling, general and administrative expenses, income taxes, and certain other amounts not allocated to the segments. These amounts are included in Other.
We allocate debt balances and related interest expense to each segment based upon a predetermined fixed recourse leverage level expressed as a ratio of recourse debt (including off-balance sheet debt) to equity. The leverage levels are 5:1 for Rail North America, 2:1 for Rail International, 1.5:1 for ASC, and 3:1 for Portfolio Management. We believe that by using this leverage and interest expense allocation methodology, each operating segment’s financial performance reflects appropriate risk-adjusted borrowing costs.
RAIL NORTH AMERICA
Segment Summary
At the end of the first quarter of 2014, we acquired more than 18,500 boxcars from General Electric Railcar Services Corporation for approximately $340 million (the "Boxcar Fleet"). At December 31, 2015, Rail North America's wholly owned fleet, excluding boxcars, consisted of approximately 106,100 cars. Fleet utilization, excluding boxcars, was 99.1% at the end of 2015, compared to 99.2% at the end of 2014, and 98.5% at the end of 2013. Fleet utilization for approximately 18,400 boxcars was 97.7% at the end of 2015 compared to 92.7% at the end of 2014, and 78.8% upon acquisition of the Boxcar Fleet.
The rail market weakened as the year progressed, resulting in a more challenging lease rate environment. During the year, the Lease Price Index on renewals (the "LPI", see definition below) increased 32.2%, compared to an increase of 38.8% in 2014, and 34.5% in 2013. Lease terms on renewals for cars in the LPI averaged 54 months in 2015, compared to 66 months in 2014, and 62 months in 2013. During 2015, an average of approximately 106,000 railcars, excluding boxcars, were on lease, compared to 105,800 in 2014, and 106,200 in 2013. The decline in demand, and the resulting decline in lease rates, was broad-based, but was particularly severe among cars serving the coal, frac sand, and flammable liquids markets.
In 2011, we entered into a purchase agreement with Trinity Rail Group, LLC ("Trinity") for 12,500 railcars through mid-2016, which was the largest such commitment in our history. In 2014, we entered into a new long-term supply agreement with Trinity to take effect upon the scheduled expiration of the current railcar supply agreement in 2016. Under the terms of this agreement, we may order up to 8,950 newly built railcars over a four-year period from March, 2016 through March, 2020. As of December 31, 2015, we have received customer commitments to lease 12,400 railcars from the 2011 Trinity supply agreement and 1,200 railcars from the 2014 Trinity supply agreement. Of those railcars, 10,100 have been delivered from the 2011 agreement and none have been delivered from the 2014 agreement.
In 2016, we expect a decrease in segment profit due to lower expected railcar remarketing activity. As current market lease rates decline and expiring rates increase (resulting from the expiration of leases originated in the stronger markets of prior years), we expect the LPI to decrease from 2015's levels. Leases for approximately 12,500 railcars in our term lease fleet and approximately 5,500 boxcars are scheduled to expire in 2016. These amounts exclude railcars on leases that are scheduled to expire in 2016 but have already been renewed or assigned to a new lessee.
30
The following table shows Rail North America's segment results for the years ended December 31 (in millions):
2015 | 2014 | 2013 | |||||||||
Revenues | |||||||||||
Lease revenue | $ | 930.9 | $ | 864.1 | $ | 758.9 | |||||
Other revenue | 75.9 | 63.4 | 58.2 | ||||||||
Total Revenues | 1,006.8 | 927.5 | 817.1 | ||||||||
Expenses | |||||||||||
Maintenance expense | 264.2 | 265.5 | 228.2 | ||||||||
Depreciation expense | 215.1 | 190.0 | 176.7 | ||||||||
Operating lease expense | 82.2 | 103.7 | 124.4 | ||||||||
Other operating expense | 26.2 | 21.9 | 18.4 | ||||||||
Total Expenses | 587.7 | 581.1 | 547.7 | ||||||||
Other Income (Expense) | |||||||||||
Net gain on asset dispositions | 67.2 | 72.3 | 67.7 | ||||||||
Interest expense, net | (102.1 | ) | (98.4 | ) | (106.0 | ) | |||||
Other expense | (5.2 | ) | (7.2 | ) | (9.8 | ) | |||||
Share of affiliates' earnings (pretax) | 0.5 | 7.9 | 10.3 | ||||||||
Segment Profit | $ | 379.5 | $ | 321.0 | $ | 231.6 | |||||
Investment Volume | $ | 524.5 | $ | 810.6 | $ | 502.4 | |||||
The following table shows the components of Rail North America's lease revenue for the years ended December 31 (in millions):
2015 | 2014 | 2013 | |||||||||
Railcars (excluding boxcars) | $ | 809.7 | $ | 764.5 | $ | 716.9 | |||||
Boxcars | 83.6 | 64.7 | 9.8 | ||||||||
Locomotives | 37.6 | 34.9 | 32.2 | ||||||||
$ | 930.9 | $ | 864.1 | $ | 758.9 | ||||||
Lease Price Index
Our LPI is an internally-generated business indicator that measures lease rate pricing on renewals for our North American railcar fleet, excluding boxcars. We calculate the index using the weighted average lease rate for a group of railcar types that we believe best represents our overall North American fleet, excluding boxcars. The average renewal lease rate change is reported as the percentage change between the average renewal lease rate and the average expiring lease rate, weighted by fleet composition. The average renewal lease term is reported in months and reflects the average renewal lease term of railcar types in the LPI, weighted by fleet composition.
31
Rail North America Fleet Data
The following table shows fleet activity for Rail North America railcars, excluding boxcars, for the years ended December 31:
2015 | 2014 | 2013 | ||||||
Beginning balance | 107,343 | 107,004 | 107,826 | |||||
Cars added | 3,762 | 3,453 | 4,596 | |||||
Cars scrapped | (1,445 | ) | (1,397 | ) | (1,693 | ) | ||
Cars sold | (3,514 | ) | (1,717 | ) | (3,725 | ) | ||
Ending balance | 106,146 | 107,343 | 107,004 | |||||
Utilization rate at year end | 99.1 | % | 99.2 | % | 98.5 | % | ||
Active railcars at year end | 105,164 | 106,500 | 105,394 | |||||
Average (monthly) active railcars | 105,987 | 105,791 | 106,186 | |||||
32

The following table shows fleet statistics for Rail North America boxcars for the years ended December 31:
2015 | 2014 | 2013 | ||||||
Ending balance | 18,429 | 19,021 | 2,109 | |||||
Utilization rate at year end | 97.7 | % | 92.7 | % | 100.0 | % | ||
The following table shows fleet activity for Rail North America locomotives for the years ended December 31:
2015 | 2014 | 2013 | ||||||
Beginning balance | 603 | 595 | 561 | |||||
Locomotives added | 34 | 8 | 83 | |||||
Locomotives scrapped or sold | — | — | (49 | ) | ||||
Ending balance | 637 | 603 | 595 | |||||
Utilization rate at year end | 93.3 | % | 99.3 | % | 98.2 | % | ||
Active locomotives at year end | 584 | 599 | 584 | |||||
Average (monthly) active locomotives | 589 | 590 | 547 | |||||
33
Segment Profit
In 2015, segment profit was $379.5 million, compared to $321.0 million in 2014. The increase was driven by higher lease rates, a positive contribution from the full year impact of the Boxcar Fleet in 2015, and lower net maintenance expense, partially offset by higher depreciation expense and lower share of affiliates' earnings.
In 2014, segment profit was $321.0 million, compared to $231.6 million in 2013. The increase was primarily driven by higher lease rates and more cars on lease, including the Boxcar Fleet, partially offset by higher net maintenance expense and depreciation expense. The results in 2014, compared to 2013, were also favorably impacted by a change in depreciation implemented during the year. Effective January 1, 2014, we revised the depreciable lives of our North American railcars based on a review of the current economic lives and usage of various railcar types. In aggregate, the average depreciable life of the fleet increased approximately 2.2 years. This change had a positive $21.9 million impact on segment profit for 2014.
Revenues
In 2015, lease revenue increased $66.8 million, primarily due to higher lease rates across the fleet and a full year of revenue in 2015 from the acquired Boxcar Fleet. Other revenue increased $12.5 million, primarily due to higher repair revenue, mileage equalization revenue, and lease termination fees.
In 2014, lease revenue increased $105.2 million, primarily due to the impact of the Boxcar Fleet and higher lease rates. Other revenue increased $5.2 million, primarily due to higher repair revenue in 2014.
Expenses
In 2015, maintenance expense decreased $1.3 million, primarily due to lower tank car compliance maintenance, partially offset by higher costs attributable to the boxcar fleet. Depreciation expense increased $25.1 million, largely due to depreciation on new investments, including the Boxcar Fleet. Operating lease expense decreased $21.5 million, resulting from the purchase of railcars previously on operating leases in each year. Other operating expense increased $4.3 million, primarily due to higher switching, storage, and freight costs, as well as a higher loss reserve in 2015.
In 2014, maintenance expense increased $37.3 million, primarily due to costs associated with the Boxcar Fleet. Excluding boxcars, maintenance expense was still higher in 2014 as a result of the expected increase in compliance costs and repairs. Depreciation expense increased $13.3 million, primarily due to incremental depreciation from new investments, including the Boxcar Fleet, partially offset by the impact of the accounting policy change in estimated useful lives of the railcar fleet implemented as of January 1, 2014. Operating lease expense decreased $20.7 million due to the purchase of railcars previously on operating leases in each year. Other operating expense increased $3.5 million, primarily due to higher switching and freight costs.
Other Income (Expense)
In 2015, net gain on asset dispositions decreased $5.1 million, primarily due to lower scrapping proceeds, resulting from lower rates and fewer cars scrapped, as well as lower residual sharing gains, and higher impairments of railcars in 2015. These impacts were partially offset by higher gains on cars sold. Net interest expense increased $3.7 million, primarily due to higher average debt balances, partially offset by the impact of lower average interest rates. Share of affiliates' earnings decreased $7.4 million, primarily due to gains on dispositions of railcars at our Southern Capital affiliate in the prior year.
In 2014, net gain on asset dispositions increased $4.6 million, primarily due to higher gains on cars sold, partially offset by lower scrapping gains. Net interest expense decreased $7.6 million, driven by lower average rates and the impact of prepayments of higher cost debt more than offsetting a higher average debt balance. Other expense decreased $2.6 million, primarily due to higher penalties associated with the early repayment of debt and higher termination costs associated with the early buyouts of railcars on operating leases in 2013 compared to 2014. Share of affiliates' earnings decreased $2.4 million, primarily due to income at our Southern Capital affiliate in 2013.
34
Investment Volume
During 2015, investment volume was $524.5 million compared to $810.6 million in 2014, and $502.4 million in 2013. We acquired approximately 3,790 railcars in 2015, compared to 3,570 railcars in 2014, and 4,520 railcars in 2013. Additionally, investments in 2014 included the purchase of the Boxcar Fleet of approximately 18,500 boxcars for approximately $340 million.
North American Rail Regulatory Matters
On May 1, 2015, the Pipeline and Hazardous Materials Safety Administration of the US Department of Transportation (“PHMSA”) issued final rules that established new design standards for tank cars in flammable liquids service (the “PHMSA Rules”). The PHMSA Rules became effective on July 7, 2015, and all newly built tank cars for use in certain flammable liquids service were required to comply with the new design standards commencing on October 1, 2015. The PHMSA Rules also established standards for modifications to existing tank cars in certain flammable liquids service and deadlines for modifying or removing those cars from service. The US Congress subsequently adopted the Fixing America’s Surface Transportation Act (“FAST Act”), which changed certain requirements of the PHMSA Rules. Key changes included revisions to the design standards for modified cars, amendments to the modification deadlines, and expansion of the applicability of the new tank car design standards to all cars used in flammable liquids service, not only those cars that operate in trains consisting of large numbers of tank cars carrying flammable liquids. Under the FAST Act, the deadlines for modifying or removing existing tank cars from flammables service range from January 2018 to May 2029, depending on the type of car and the type of commodity carried. While several legal challenges to the PHMSA Rules are pending in the US Circuit Court for the District of Columbia, the tank car design standards and the deadlines for modifying or removing cars from service were enacted into law by the FAST Act, and therefore, are unlikely to be affected by the outcome of these legal challenges.
On May 1, 2015, Transport Canada (“TC”) issued final rules establishing new design standards for tank cars carrying flammable liquids in Canada (the “Canadian Rules”). The Canadian Rules became effective on May 20, 2015, and all newly built tank cars for use in flammable liquids service were required to comply with the new standards effective October 1, 2015. The Canadian Rules also established standards for modifications to existing tank cars in flammable liquids service and deadlines for modifying or removing cars from service ranging from May 2017 to May 2025, depending on the type of car and the type of commodity carried.
We have a fleet of approximately 125,000 railcars in North America, including approximately 13,900 tank cars currently used to transport flammable liquids that are affected by the new rules, of which approximately 4,300 are moving crude oil and ethanol. Over 90% of our affected tank cars have a compliance deadline of 2023 or later. We expect to modify some of the most modern of our affected tank cars to comply with the new standards. However, for the majority of the affected cars, we currently anticipate retiring, redeploying, or selling them rather than performing retrofits.
RAIL INTERNATIONAL
Segment Summary
Rail International, comprised primarily of GATX Rail Europe ("GRE"), achieved solid operating results during 2015. Throughout 2015, we invested in the European fleet to replace our customers' older, less efficient fleets with newer, higher capacity railcars. Railcar utilization for GRE was 95.8% at the end of 2015, compared to 95.9% at the end of 2014, and 96.6% at the end of 2013. During 2013, we sold our 37.5% interest in Ahaus Alstätter Eisenbahn Cargo AG (“AAE”).
Rail India has continued to focus on investment opportunities and developing relationships with customers, suppliers and the Indian Railways. In 2015, Rail India took delivery of 410 railcars, compared to 184 railcars in 2014 and 137 railcars in 2013. Continued investment in railcars is expected in 2016.
35
The following table shows Rail International's segment results for the years ended December 31 (in millions):
2015 | 2014 | 2013 | |||||||||
Revenues | |||||||||||
Lease revenue | $ | 172.9 | $ | 188.6 | $ | 180.2 | |||||
Other revenue | 7.5 | 10.3 | 8.8 | ||||||||
Total Revenues | 180.4 | 198.9 | 189.0 | ||||||||
Expenses | |||||||||||
Maintenance expense | 39.6 | 45.9 | 42.9 | ||||||||
Depreciation expense | 43.7 | 47.1 | 43.2 | ||||||||
Other operating expense | 5.1 | 5.1 | 5.3 | ||||||||
Total Expenses | 88.4 | 98.1 | 91.4 | ||||||||
Other Income (Expense) | |||||||||||
Net gain on asset dispositions | 6.8 | 6.0 | 3.7 | ||||||||
Interest expense, net | (22.4 | ) | (24.7 | ) | (23.9 | ) | |||||
Other expense | (6.0 | ) | (3.1 | ) | (1.1 | ) | |||||
Share of affiliates' earnings (pretax) | (0.3 | ) | (0.3 | ) | 21.1 | ||||||
Segment Profit | $ | 70.1 | $ | 78.7 | $ | 97.4 | |||||
Investment Volume | $ | 148.0 | $ | 163.6 | $ | 168.5 | |||||
The following table shows fleet activity for GRE railcars for the years ended December 31:
2015 | 2014 | 2013 | ||||||
Beginning balance | 22,451 | 21,836 | 21,794 | |||||
Cars added | 1,421 | 1,672 | 1,368 | |||||
Cars scrapped or sold | (949 | ) | (1,057 | ) | (1,326 | ) | ||
Ending balance | 22,923 | 22,451 | 21,836 | |||||
Utilization rate at year end | 95.8 | % | 95.9 | % | 96.6 | % | ||
Active railcars at year end | 21,969 | 21,533 | 21,097 | |||||
Average (monthly) active railcars | 21,598 | 20,915 | 20,913 | |||||
36
 \
\Foreign Currency
Rail International's reported results of operations are impacted by fluctuations in the exchange rates of the foreign currencies in which it conducts business, primarily the euro. In 2015, a weaker euro negatively impacted lease revenue by approximately $30.8 million and segment profit, excluding other income (expense), by approximately $16.1 million compared to 2014. Although the Euro was weaker at the end of 2014 compared to 2013, the average exchange rate for each year was comparable and had no material impact on reported segment profit.
Segment Profit
In 2015, segment profit was $70.1 million, compared to $78.7 million in 2014. The decrease was largely due to the negative effects of foreign exchange.
In 2014, segment profit was $78.7 million, compared to $97.4 million in 2013. The 2013 results included a gain of $9.3 million on the sale of our AAE investment and gains of $7.7 million related to certain interest rate swaps at AAE. Excluding the effect of the AAE items noted, segment profit decreased $1.7 million in 2014. This decrease was largely due to lower share of affiliates’ earnings, higher maintenance expense and higher depreciation expense, partially offset by higher lease revenue.
AAE held interest rate swaps intended to hedge interest rate risk associated with existing and forecasted floating rate debt issuances. Some of these swaps did not qualify for hedge accounting, and as a result, changes in their fair values were recognized in affiliates' earnings.
Revenues
In 2015, lease revenue decreased $15.7 million, due to the effects of a weaker euro, as noted above. The decrease was partially offset by additional cars on lease in the current year. Other revenue decreased $2.8 million, primarily due to the absence of interest income on the AAE note received as part of the sale, which was repaid in the first quarter of 2015.
37
In 2014, lease revenue increased $8.4 million, primarily due to more cars on lease. Other revenue increased $1.5 million, primarily due to higher interest income on the AAE note.
Expenses
In 2015, maintenance expense decreased $6.3 million, primarily due to the effects of a weaker euro, lower costs at our European maintenance facilities, and lower costs for wheelset replacements, partially offset by the higher cost of railcar revisions. Depreciation expense decreased $3.4 million, largely due to the effects of a weaker euro, partially offset by the impact of new cars added to the fleet.
In 2014, maintenance expense increased $3.0 million, primarily due to higher workshop expenses and costs for wheelset replacements. Depreciation expense increased $3.9 million, largely driven by the impact of new cars added to the fleet.
Other Income (Expense)
In 2015, net interest expense decreased $2.3 million, driven by the effects of foreign exchange. Other expense increased $2.9 million, primarily due to higher legal costs in 2015 and income from a warranty settlement in 2014, partially offset by the favorable impact of changes in foreign exchange rates on non-functional currency items and derivatives.
In 2014, net gain on asset dispositions increased $2.3 million compared to 2013, primarily due to impairments in 2013 for railcars designated to be scrapped. Net interest expense increased $0.8 million due to higher average debt balances, partially offset by lower rates. Other expense increased $2.0 million, primarily due to higher legal costs and the unfavorable impact of foreign exchange on non-functional currency items compared to 2013, partially offset by a warranty settlement in 2014. Excluding the impacts of the AAE disposition gain and the interest rate swaps from each period, share of affiliates' earnings decreased $4.4 million, primarily due to the absence of operating income at AAE after the sale in 2013.
Investment Volume
Investment volume was $148.0 million in 2015, $163.6 million in 2014, and $168.5 million in 2013. During 2015, we acquired approximately 1,980 railcars compared to 1,860 railcars in 2014, and 1,500 railcars in 2013. Additionally, capitalized wheelset costs were $4.6 million in 2015, $4.8 million in 2014, and $25.7 million in 2013.
ASC
Segment Summary
In 2015, ASC experienced lower demand for iron ore shipments as steel production in the region declined. As a result, several ASC vessels were laid up earlier than in prior years. During 2015, there were thirteen vessels operating and the season concluded in mid-January. While operating conditions and water levels led to improved efficiencies, the lower iron ore tonnage in 2015 reduced segment profit significantly.
ASC carried 26.5 million net tons of freight and deployed 13 vessels in 2015 compared to 30.5 million net tons and 15 vessels in 2014 and 28.8 million net tons and 13 vessels in 2013.
38
The following table shows ASC’s segment results for the years ended December 31 (in millions):
2015 | 2014 | 2013 | |||||||||
Revenues | |||||||||||
Lease revenue | $ | 4.1 | $ | 4.2 | $ | 4.2 | |||||
Marine operating revenue | 166.1 | 223.0 | 223.5 | ||||||||
Total Revenues | 170.2 | 227.2 | 227.7 | ||||||||
Expenses | |||||||||||
Maintenance expense | 22.3 | 25.6 | 22.9 | ||||||||
Marine operating expense | 107.2 | 149.2 | 151.3 | ||||||||
Depreciation expense | 14.3 | 13.6 | 12.1 | ||||||||
Operating lease expense | 5.2 | 5.2 | 5.2 | ||||||||
Other operating expense | — | — | — | ||||||||
Total Expenses | 149.0 | 193.6 | 191.5 | ||||||||
Other Income (Expense) | |||||||||||
Net loss on asset dispositions | (0.1 | ) | (0.5 | ) | (1.3 | ) | |||||
Interest expense, net | (5.3 | ) | (5.6 | ) | (6.2 | ) | |||||
Other (expense) income | (0.7 | ) | (0.2 | ) | 0.2 | ||||||
Segment Profit | $ | 15.1 | $ | 27.3 | $ | 28.9 | |||||
Investment Volume | $ | 20.3 | $ | 18.4 | $ | 11.2 | |||||
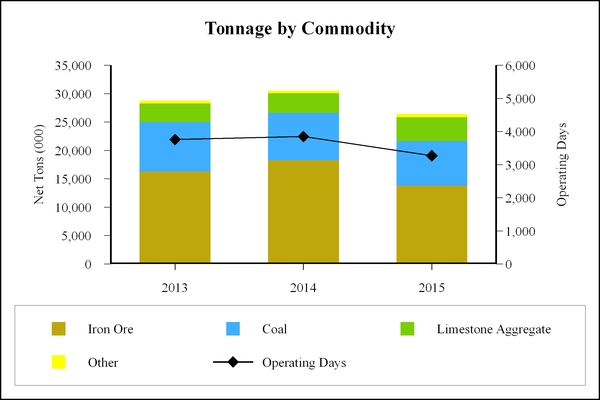 \
\39
Segment Profit
In 2015, segment profit was $15.1 million compared to $27.3 million in 2014. Both periods were unfavorably impacted by difficult operating conditions on the Great Lakes at the start of each sailing season. Additionally, results in 2015 were negatively impacted by lower shipments of higher-margin, long-haul iron ore.
In 2014, segment profit was $27.3 million compared to $28.9 million in 2013. The variance was largely attributable to ice coverage on the Great Lakes in 2014 that led to significant operating inefficiencies early in the year.
Revenues
In 2015, marine operating revenue decreased $56.9 million, largely due to $37.6 million lower fuel revenue, which is offset in marine operating expense. The terms of ASC's contracts provide that a portion of fuel costs may be passed on to customers. In addition, lower long-haul shipments of iron ore contributed to the variance.
In 2014, marine operating revenue decreased $0.5 million, primarily due to the operating inefficiencies early in the year, the mix of commodities carried, and lower fuel surcharge revenue, which is offset by a corresponding decrease in marine operating expense.
Expenses
In 2015, maintenance expense decreased $3.3 million, due to less winter work and lower operating repairs. Marine operating expense decreased $42.0 million, largely driven by lower fuel costs and the impact of fewer operating days caused by the delay of deployment of vessels at the beginning of the season and fewer vessels operating late in the year. Inefficiencies associated with the extended winter conditions earlier in each year also negatively impacted operations in both years.
In 2014, maintenance expense increased $2.7 million, driven by more winter work and costs associated with deploying two additional vessels in 2014 compared to 2013. Marine operating expense decreased $2.1 million largely due to lower fuel consumption and lower fuel costs, which is largely offset in revenue. These increases were partially offset by the impact of more operating days and additional vessels deployed in the current year.
Operating lease expense in 2015, 2014 and 2013 relates to the lease of ASC's tug-barge vessel.
Other Income (Expense)
Net loss on asset dispositions in each year was attributable to the initial impairment and subsequent costs related to the ultimate disposal of an older, idle vessel. Additionally, interest expense declined each year due to lower rates.
Investment Volume
ASC's investments in each of 2015, 2014, and 2013 consisted of structural and mechanical upgrades to our vessels.
PORTFOLIO MANAGEMENT
Segment Summary
In prior years, GATX indicated that it would no longer seek new investment opportunities in marine assets within Portfolio Management and would focus on maximizing the value of existing investments. In the third quarter of 2015, we made the decision to exit the majority of our marine investments, including six chemical parcel tankers (the "Nordic Vessels"), a number of inland marine vessels and our 50% interest in the Cardinal Marine joint venture. We believe that selling these investments at this time will provide favorable returns for GATX and eliminate the future risk of continuing to hold these investments in markets that have become more volatile. As a result of this decision, impairment losses of $30.8 million on the Nordic Vessels and $19.0 million on the Cardinal Marine joint venture were
40
recognized. Subsequently, we have completed the sales of certain of our marine investments, including our 50% interest in the Cardinal Marine joint venture, for total proceeds of $124.4 million. These sales resulted in net gains of $21.6 million. We expect to complete additional sales of marine assets in 2016. Upon completion of the marine investment sales, Portfolio Management will continue to own other marine investments, consisting primarily of five gas carrying vessels (the "Norgas Vessels").
A significant portion of Portfolio Management's segment profit is generated by the Rolls-Royce & Partners Finance companies. The Rolls-Royce & Partners Finance companies (collectively the “RRPF affiliates”) are a collection of fifteen 50% owned domestic and foreign joint ventures with Rolls-Royce plc (or affiliates thereof, collectively “Rolls-Royce”), a leading manufacturer of commercial aircraft jet engines. Segment profit included earnings from the RRPF affiliates of $65.5 million for 2015, $55.9 million for 2014, and $52.6 million for 2013. The RRPF affiliates owned 436 aircraft engines at the end of 2015 compared to 433 at the end of 2014.
In 2014, we sold our investments in the Intermodal Investment Fund V and Intermodal Investment Fund VII affiliates. As a result of these sales, we received aggregate cash proceeds of $18.3 million.
In 2013, we dissolved our Singco and Somargas marine affiliates, taking direct ownership of the Norgas Vessels with an aggregate value of $151.8 million, and recognized a pretax gain of $2.5 million, which is reflected in share of affiliates' earnings. In connection with the dissolution, we paid $101.3 million, primarily to satisfy our share of the affiliates' external debt. The vessels continue to operate in a vessel pooling arrangement managed by our former partner.
Portfolio Management's total asset base was $636.5 million at December 31, 2015 compared to $813.3 million at December 31, 2014, and $856.9 million at December 31, 2013.
The following table shows Portfolio Management’s segment results for the years ended December 31 (in millions):
2015 | 2014 | 2013 | |||||||||
Revenues | |||||||||||
Lease revenue | $ | 22.2 | $ | 29.7 | $ | 31.9 | |||||
Marine operating revenue | 68.9 | 63.3 | 51.6 | ||||||||
Other revenue | 1.4 | 4.4 | 3.7 | ||||||||
Total Revenues | 92.5 | 97.4 | 87.2 | ||||||||
Expenses | |||||||||||
Marine operating expense | 48.7 | 48.6 | 38.5 | ||||||||
Depreciation expense | 17.4 | 22.8 | 23.0 | ||||||||
Other operating expense | 7.1 | 1.9 | 2.4 | ||||||||
Total Expenses | 73.2 | 73.3 | 63.9 | ||||||||
Other Income (Expense) | |||||||||||
Net gain on asset dispositions | 5.3 | 9.4 | 15.5 | ||||||||
Interest expense, net | (20.0 | ) | (24.3 | ) | (26.7 | ) | |||||
Other (expense) income | — | (1.2 | ) | 1.4 | |||||||
Share of affiliates' earnings (pretax) | 45.2 | 60.2 | 60.9 | ||||||||
Segment Profit | $ | 49.8 | $ | 68.2 | $ | 74.4 | |||||
Investment Volume | $ | 18.4 | $ | 32.3 | $ | 170.5 | |||||
41

Segment Profit
In 2015, segment profit was $49.8 million, compared to $68.2 million in 2014. The current year included a net loss of approximately $28.2 million associated with the planned exit of the majority of the marine investments. Excluding this net loss, segment profit increased $9.8 million primarily due to higher RRPF affiliate income and higher residual sharing gains on managed portfolio sales.
In 2014, segment profit was $68.2 million, compared to $74.4 million in 2013. The decrease was driven by lower asset remarketing income and lower aggregate net operating income from our marine operations, primarily from our ocean-going vessels, which include the Norgas Vessels and Nordic Vessels.
Revenues
In 2015, lease revenue decreased $7.5 million, primarily due to the impact of sales of leased assets in both years. Marine operating revenue increased $5.6 million, primarily due to higher revenue from the Nordic Vessels and higher inland marine revenue partially offset by lower revenue from the Norgas Vessels. Other revenue decreased $3.0 million primarily due to lower investment fund distributions in 2015 and lower interest income resulting from the repayment of loans in both years.
In 2014, lease revenue decreased $2.2 million, primarily due to the sale of leases throughout 2013 and 2014. Marine operating revenue increased $11.7 million, primarily due to higher inland marine revenue resulting from strong demand during the harvest season. In addition, 2014 includes a full year of revenue from the Norgas Vessels.
Expenses
In 2015, depreciation expense decreased $5.4 million, primarily due to the sale of leased assets. Other operating expense increased $5.2 million, largely due to a loss reserve recorded in 2015 in connection with one investment.
42
In 2014, marine operating expense increased $10.1 million, primarily due to higher expenses for inland marine. Additionally, 2014 reflects a full year of operations for the Norgas Vessels.
Other Income (Expense)
In 2015, net gain on asset dispositions decreased $4.1 million. The current year included a net loss of approximately $9.2 million associated with the planned exit of marine investments. Excluding the net loss from the marine investments, net gain on other asset dispositions increased $5.1 million primarily due to higher residual sharing gains on managed portfolio sales. Net interest expense decreased $4.3 million as a result of lower average debt balance and lower average interest rates.
In 2015, share of affiliates' earnings decreased $15.0 million. The current year included the $19.0 million impairment charge for our 50% interest in the Cardinal Marine joint venture. Excluding this item, affiliates' earnings increased $4.0 million primarily due to higher operating income and higher gains on engine sales at the RRPF affiliates in the current year, partially offset by the absence of earnings from joint ventures sold in 2015 and 2014.
In 2014, net gain on asset dispositions decreased $6.1 million, primarily due to fewer asset dispositions. Net interest expense decreased $2.4 million, primarily due to lower rates. Other expense increased $2.6 million, primarily due to the expense associated with a revenue sharing agreement adjustment related to the Nordic Vessels and the absence of insurance proceeds received in 2013 related to a vessel casualty.
In 2014, share of affiliates' earnings decreased $0.7 million, as the absence of income from Singco/Somargas II entities, which were dissolved in 2013, was substantially offset by higher income at the RRPF affiliates.
Investment Volume
Investment volume of $18.4 million in 2015 consisted of $15.5 million for Portfolio Management's share in a newly created RRPF joint venture entity and $2.9 million to convert 51 open hopper barges to covered hopper barges.
Investment volume of $32.3 million in 2014 consisted of $10.5 million for two tank barges and one pushboat, $6.5 million for 13 new hopper barges and $15.3 million of incremental investment in an RRPF affiliate.
Investment volume of $170.5 million in 2013 consisted of a $101.3 million contribution to the Singco and Somargas joint ventures primarily to satisfy our share of the affiliates' debt, $47.9 million for marine vessels and equipment, $14.2 million for investments in loans for dry bulk vessels, and $7.1 million for investments in container assets.
OTHER
Other is comprised of selling, general and administrative expenses (“SG&A”), unallocated interest expense, and miscellaneous income and expense not directly associated with the reporting segments and eliminations.
The following table shows components of other for the years ended December 31 (in millions):
2015 | 2014 | 2013 | |||||||||
Selling, general and administrative expense | $ | 192.4 | $ | 189.2 | $ | 178.3 | |||||
Unallocated interest expense, net | 5.3 | 5.4 | 3.8 | ||||||||
Other expense (income) (including eliminations) | 1.1 | 1.6 | (1.1 | ) | |||||||
SG&A, Unallocated Interest and Other
In 2015, SG&A of $192.4 million increased $3.2 million from 2014. The increase was primarily due to $9.0 million of expense associated with an early retirement program offered to certain employees in 2015, partially offset by lower compensation expense in 2015 and costs associated with the closure of our San Francisco office recognized in 2014.
43
In 2014, SG&A of $189.2 million increased $10.9 million from 2013. The increase includes an accrual for costs associated with the closure of our San Francisco office in early 2015, which impacted approximately 35 employees through workforce reductions or relocation. In addition, SG&A was negatively impacted by the impairment of an IT project, higher compensation expenses, information technology expenses, and increased group insurance costs.
Unallocated interest expense (the difference between external interest expense and amounts allocated to the reporting segments in accordance with assigned leverage targets) in any year is affected by our consolidated leverage position as well as the timing of debt issuances and investing activities.
Other expense and eliminations were immaterial in each of 2015, 2014, and 2013.
Consolidated Income Taxes
See "Note 14. Income Taxes" in Part II, Item 8 of this Form 10-K.
44
BALANCE SHEET DISCUSSION
Assets
Total assets (including on- and off-balance sheet) were $7.4 billion at December 31, 2015, compared to $7.5 billion at December 31, 2014. The decrease was driven by the sales of marine investments at Portfolio Management and the repayment of the note received as part of the AAE sale, partially offset by an increase in Rail North America operating assets. In addition to the assets we recorded on our balance sheet, we utilized off-balance sheet assets, primarily railcars, which we leased in pursuant to operating lease agreements. The off-balance sheet assets represent the estimated present value of our committed future operating lease payments.
The following table shows on- and off-balance sheet assets by segment as of December 31 (in millions):
2015 | 2014 | ||||||||||||||||||||||
On-Balance Sheet | Off-Balance Sheet | Total | On-Balance Sheet | Off-Balance Sheet | Total | ||||||||||||||||||
Rail North America | $ | 4,629.1 | $ | 488.7 | $ | 5,117.8 | $ | 4,358.2 | $ | 606.1 | $ | 4,964.3 | |||||||||||
Rail International | 1,117.6 | — | 1,117.6 | 1,228.8 | — | 1,228.8 | |||||||||||||||||
ASC | 284.7 | 6.8 | 291.5 | 286.7 | 11.7 | 298.4 | |||||||||||||||||
Portfolio Management | 636.5 | — | 636.5 | 813.3 | — | 813.3 | |||||||||||||||||
Other | 226.3 | — | 226.3 | 232.9 | — | 232.9 | |||||||||||||||||
$ | 6,894.2 | $ | 495.5 | $ | 7,389.7 | $ | 6,919.9 | $ | 617.8 | $ | 7,537.7 | ||||||||||||
Gross Receivables
Receivables of $245.8 million at December 31, 2015 decreased $112.2 million from December 31, 2014, primarily due to the repayment of a note received as part of the AAE sale.
Allowance for Losses
As of December 31, 2015, general allowances for trade receivables were $6.3 million, or 9.1% of rent and other receivables, compared to $4.5 million, or 5.2%, at December 31, 2014. At December 31, 2015, specific allowances for finance leases were $4.0 million compared to $1.2 million at December 31, 2014. The specific allowance increase in 2015 was related to a loss reserve recorded in connection with one investment at Portfolio Management.
See "Note 19. Allowance for Losses" in Part II, Item 8 of this Form 10-K.
Operating Assets and Facilities
Net operating assets and facilities increased $10.4 million from 2014. The increase was primarily due to new investments of $674.5 million and purchase of leased-in assets of $118.4 million. These increases were offset by depreciation expense of $295.4 million, dispositions of $202.2 million, the reclassification of $197.7 million of assets to assets held-for-sale, primarily related to our planned exit of the majority of our Portfolio Management marine assets, and foreign exchange rate effects of $101.8 million.
Investments in Affiliated Companies
Investments in affiliated companies decreased $9.2 million in 2015 (see table below). The decrease at Rail North America was largely due to a loan payment from an affiliate. The decrease at Portfolio Management was driven by the sale of our 50% interest in the Cardinal Marine joint venture, offset by operating results of RRPF, as well as an investment in a newly created RRPF joint venture entity.
45
The following table shows our investments in affiliated companies by segment as of December 31 (in millions):
2015 | 2014 | ||||||
Rail North America | $ | 12.0 | $ | 17.2 | |||
Rail International | 1.4 | 1.8 | |||||
Portfolio Management | 335.1 | 338.7 | |||||
$ | 348.5 | $ | 357.7 | ||||
See "Note 7. Investments in Affiliated Companies" in Part II, Item 8 of this Form 10-K.
Goodwill
In 2015 and 2014, changes in the balance of our goodwill, all of which are attributable to the Rail North America and Rail International segments, resulted from changes in foreign currency exchange rates. We tested our goodwill for impairment in the fourth quarter of 2015 and no impairment was indicated.
See "Note 18. Goodwill" in Part II, Item 8 of this Form 10-K.
Debt
Total debt decreased $52.4 million from the prior year, primarily due to net repayments of commercial paper and credit facilities of $64.5 million and the effects of foreign exchange on outstanding long-term debt balances, partially offset by a net increase in long-term debt and capital lease principal amounts. During 2015, issuances of long-term debt of $766.5 million were largely offset by scheduled maturities and principal payments of $726.3 million.
The following table shows the details of our long-term debt issuances in 2015 ($ in millions):
Type of Debt | Term | Interest Rate | Principal Amount | |||||
Recourse Unsecured | 10.2 Years | 3.25% Fixed | $ | 300.0 | ||||
Recourse Unsecured | 30.2 Years | 4.50% Fixed | 250.0 | |||||
Recourse Unsecured | 5.2 Years | 2.60% Fixed | 100.0 | |||||
Recourse Unsecured | 10.0 Years | 1.84% Floating (1) | 60.0 | |||||
Recourse Unsecured | 3.9 Years | 1.20% Fixed | 56.5 | |||||
$ | 766.5 | |||||||
________
(1) | Floating interest rate at December 31, 2015. |
46
The following table shows the carrying value of our debt obligations by major component, including off-balance sheet debt, as of December 31, 2015 (in millions):
Secured | Unsecured | Total | |||||||||
Commercial paper and borrowings under bank credit facilities | $ | — | $ | 7.4 | $ | 7.4 | |||||
Recourse debt | — | 4,171.5 | 4,171.5 | ||||||||
Nonrecourse debt | 6.9 | — | 6.9 | ||||||||
Capital lease obligations | 18.4 | — | 18.4 | ||||||||
Balance sheet debt | 25.3 | 4,178.9 | 4,204.2 | ||||||||
Recourse off-balance sheet debt (1) | 495.5 | — | 495.5 | ||||||||
$ | 520.8 | $ | 4,178.9 | $ | 4,699.7 | ||||||
________
(1) Off-balance sheet debt represents the estimated present value of committed operating lease payments and is equal to the amount reported as off-balance sheet assets.
See "Note 9. Debt" in Part II, Item 8 of this Form 10-K.
Equity
Total equity decreased $33.8 million from the prior year, primarily due to $125.4 million of stock repurchases, $68.0 million of dividends paid, $55.8 million of foreign currency translation adjustments due to the balance sheet effects of a stronger US dollar, and $2.4 million from changes in the fair value of derivative instruments and other securities. These decreases were partially offset by net income of $205.3 million, $7.8 million from the effects of post-retirement benefit plan adjustments, and $4.7 million from the effects of share-based compensation.
See "Note 21. Shareholders’ Equity" in Part II, Item 8 of this Form 10-K.
CASH FLOW DISCUSSION
We generate a significant amount of cash from operating activities and from our investment portfolio. We also access domestic and international capital markets by issuing unsecured or secured debt and commercial paper. We use these sources of cash, along with our available cash balances, to fulfill our debt, lease, and dividend obligations and to fund portfolio investments and capital additions. We primarily use cash from operations and commercial paper issuances to fund daily operations.
The timing of asset dispositions and changes in working capital impact cash flows from operations and portfolio proceeds. As a result, these cash flow components may vary materially from quarter to quarter and year to year. As of December 31, 2015, we had unrestricted cash balances of $202.4 million.
47
The following table shows our principal sources and uses of cash for the years ended December 31 (in millions):
2015 | 2014 | 2013 | |||||||||
Principal sources of cash | |||||||||||
Net cash provided by operating activities | $ | 534.3 | $ | 449.2 | $ | 400.7 | |||||
Portfolio proceeds | 482.2 | 264.0 | 385.3 | ||||||||
Other asset sales | 18.7 | 26.9 | 32.3 | ||||||||
Proceeds from sale-leasebacks | — | — | 90.7 | ||||||||
Proceeds from issuance of debt, commercial paper, and credit facilities | 748.8 | 1,273.0 | 1,132.2 | ||||||||
$ | 1,784.0 | $ | 2,013.1 | $ | 2,041.2 | ||||||
Principal uses of cash | |||||||||||
Portfolio investments and capital additions | $ | (696.9 | ) | $ | (1,030.5 | ) | $ | (859.6 | ) | ||
Repayments of debt, commercial paper, and credit facilities | (790.8 | ) | (819.8 | ) | (854.1 | ) | |||||
Purchases of leased-in assets | (118.4 | ) | (150.5 | ) | (61.4 | ) | |||||
Payments on capital lease obligations | (2.7 | ) | (2.6 | ) | (2.4 | ) | |||||
Stock repurchases | (125.4 | ) | (124.6 | ) | (68.6 | ) | |||||
Cash dividends | (68.2 | ) | (62.0 | ) | (60.5 | ) | |||||
$ | (1,802.4 | ) | $ | (2,190.0 | ) | $ | (1,906.6 | ) | |||
Net Cash Provided by Operating Activities
Net cash provided by operating activities of $534.3 million increased $85.1 million compared to 2014. The increase was driven by higher lease revenue and lower maintenance expense, partially offset by lower distributions from joint ventures, as well as the net impact of changes in the balances of certain working capital items.
Portfolio Investments and Capital Additions
Portfolio investments and capital additions primarily consist of purchases of operating assets, investments in affiliates, and capitalized asset improvements. Portfolio investments and capital additions of $696.9 million decreased $333.6 million compared to 2014. 2014 investments included Rail North America's purchase of approximately 18,500 boxcars for approximately $340 million. The increase in 2014 compared to 2013 was primarily due to the purchase of boxcars noted above, partially offset by Portfolio Management's $101.3 million contribution to the Singco and Somargas joint ventures in 2013. The timing of investments depends on purchase commitments, transaction opportunities, and market conditions.
The following table shows portfolio investments and capital additions by segment for the years ended December 31 (in millions):
2015 | 2014 | 2013 | |||||||||
Rail North America (1) | $ | 506.7 | $ | 810.6 | $ | 502.4 | |||||
Rail International | 148.0 | 163.6 | 168.5 | ||||||||
ASC | 20.3 | 18.4 | 11.2 | ||||||||
Portfolio Management (2) | 18.4 | 32.3 | 170.5 | ||||||||
Other | 3.5 | 5.6 | 7.0 | ||||||||
$ | 696.9 | $ | 1,030.5 | $ | 859.6 | ||||||
__________________
(1) | 2014 investment volume includes approximately $340 million related to the purchase of approximately 18,500 boxcars in 2014. |
(2) | Portfolio Management’s investment volume includes $101.3 million related to the Singco and Somargas dissolution in 2013. |
48
Portfolio Proceeds
Portfolio proceeds primarily consist of loan and finance lease receipts, proceeds from sales of operating assets, proceeds from sales of securities, and capital distributions from affiliates. In 2015, AAE repaid its outstanding loan principal in the amount of €67.5 million ($76.4 million). In addition, portfolio proceeds in 2015 included $124.4 million from the sales of marine investments as part of our decision to exit the majority of the marine assets at our Portfolio Management segment. The decrease in proceeds in 2014 was primarily due to the absence of proceeds from the sale of our interest in AAE in 2013 and lower proceeds from sales of operating assets.
The following table shows portfolio proceeds for the years ended December 31 (in millions):
2015 | 2014 | 2013 | |||||||||
Finance lease rents received, net of earned income and leveraged lease nonrecourse debt service | $ | 11.2 | $ | 12.5 | $ | 16.6 | |||||
Loan principal received | 82.7 | 14.9 | 13.5 | ||||||||
Proceeds from sales of operating assets | 357.8 | 202.1 | 285.9 | ||||||||
Capital distributions from affiliates | 29.8 | 33.6 | 68.1 | ||||||||
Other portfolio proceeds | 0.7 | 0.9 | 1.2 | ||||||||
$ | 482.2 | $ | 264.0 | $ | 385.3 | ||||||
Other Investing Activity
Rail North America acquired 5,004 railcars in 2015, 4,560 railcars in 2014, and 2,967 railcars in 2013 that were previously on operating leases. Proceeds from sales of other assets for all periods were primarily related to railcar scrapping. Rail North America completed sale-leasebacks for 710 railcars in 2013.
Our restricted cash is primarily contractually required cash amounts we maintain for two wholly owned bankruptcy-remote, special purpose corporations. The special purpose corporations were formed in prior years to finance railcars on a structured, nonrecourse basis. Changes in restricted cash largely represent the net change in the cash we maintain for the special purpose corporations that result from their operating and financing activities. We expect our contributions to restricted cash to limit payment shortfalls in the future, thus preventing interest and penalties that might otherwise be incurred under the terms of the applicable financing arrangements.
The following table shows other investing activity for the years ended December 31 (in millions):
2015 | 2014 | 2013 | |||||||||
Purchases of leased-in assets | $ | (118.4 | ) | $ | (150.5 | ) | $ | (61.4 | ) | ||
Proceeds from sales of other assets | 18.7 | 26.9 | 32.3 | ||||||||
Proceeds from sale-leasebacks | — | — | 90.7 | ||||||||
Net increase (decrease) in restricted cash | (2.9 | ) | 5.8 | 9.5 | |||||||
Other | 9.7 | 5.8 | — | ||||||||
$ | (92.9 | ) | $ | (112.0 | ) | $ | 71.1 | ||||
49
Net Cash (used in) provided by Financing Activities
The following table shows net cash (used in) provided by financing activities for the years ended December 31 (in millions):
2015 | 2014 | 2013 | |||||||||
Net proceeds from issuances of debt (original maturities longer than 90 days) | $ | 748.8 | $ | 1,223.0 | $ | 1,132.2 | |||||
Repayments of debt (original maturities longer than 90 days) | (726.3 | ) | (819.8 | ) | (602.8 | ) | |||||
Net increase (decrease) in debt with original maturities of 90 days or less | (64.5 | ) | 50.0 | (251.3 | ) | ||||||
Payments on capital lease obligations | (2.7 | ) | (2.6 | ) | (2.4 | ) | |||||
Stock repurchases (1) | (125.4 | ) | (124.6 | ) | (68.6 | ) | |||||
Cash dividends | (68.2 | ) | (62.0 | ) | (60.5 | ) | |||||
Other | 9.3 | (1.8 | ) | 2.5 | |||||||
$ | (229.0 | ) | $ | 262.2 | $ | 149.1 | |||||
________
(1) During 2015, we repurchased 2.4 million shares of common stock for $125.4 million, which completed our $250 million repurchase program authorized in 2014. In 2014, we repurchased 1.9 million shares of common stock for $124.6 million. In 2013, we repurchased 1.4 million shares of common stock for $68.6 million, which completed a separate repurchase program that was authorized in 2008.
LIQUIDITY AND CAPITAL RESOURCES
General
We fund our investments and meet our debt, lease, and dividend obligations using our available cash balances, as well as cash generated from operating activities, sales of assets, commercial paper issuances, committed revolving credit facilities, distributions from affiliates, and issuances of secured and unsecured debt. We primarily use cash from operations and commercial paper issuances to fund daily operations. We use both domestic and international capital markets and banks to meet our debt financing needs.
Contractual and Other Commercial Commitments
The following table shows our contractual commitments, including debt principal payments, lease payments, and purchase commitments at December 31, 2015 (in millions):
Payments Due by Period | |||||||||||||||||||||||||||
Total | 2016 | 2017 | 2018 | 2019 | 2020 | Thereafter | |||||||||||||||||||||
Recourse debt | $ | 4,198.5 | $ | 557.9 | $ | 412.7 | $ | 517.9 | $ | 550.0 | $ | 350.0 | $ | 1,810.0 | |||||||||||||
Nonrecourse debt | 6.9 | 6.9 | — | — | — | — | — | ||||||||||||||||||||
Commercial paper and credit facilities | 7.4 | 7.4 | — | — | — | — | — | ||||||||||||||||||||
Capital lease obligations | 20.2 | 4.3 | 2.8 | 1.6 | 11.5 | — | — | ||||||||||||||||||||
Recourse operating leases | 656.3 | 85.1 | 91.7 | 83.0 | 79.8 | 72.7 | 244.0 | ||||||||||||||||||||
Purchase commitments (1) | 1,735.2 | 575.0 | 379.9 | 318.4 | 339.8 | 122.1 | — | ||||||||||||||||||||
$ | 6,624.5 | $ | 1,236.6 | $ | 887.1 | $ | 920.9 | $ | 981.1 | $ | 544.8 | $ | 2,054.0 | ||||||||||||||
__________
(1) | Primarily railcar purchase commitments. The amounts shown for all years are based on management's estimates of the timing, anticipated car types and related costs of railcars to be purchased under its agreements. The amount shown for 2016 includes $89.2 million related to options we exercised to purchase 2,623 railcars that are currently on lease. In addition, the amount shown for 2017 includes $24.0 million related to an option we exercised to purchase a vessel that is currently on lease. |
50
In 2014, we entered into a long-term supply agreement with Trinity that will take effect upon the scheduled expiration of the current railcar supply agreement in 2016. Under the terms of the agreement, we will purchase up to 8,950 newly built railcars over a four-year period from March, 2016 through March, 2020. We may order either tank or freight cars; however, we expect that the majority of the order will be for tank cars. Except to the extent the parties otherwise agree, railcar pricing will be on an agreed upon, or cost-plus, basis subject to certain specified adjustments and surcharges throughout the term of the agreement. In addition, in January, 2017, either party may initiate a review of the cost-plus basis pricing if it is not reflective of then-current market prices. If the parties cannot agree on revised cost-plus pricing (or otherwise agree that no changes are necessary), either party may, at its election, deliver to the other party a notice of its intent to terminate, and in such case, the agreement will automatically terminate 30 days thereafter, unless the non-terminating party agrees to a specified revised margin as set forth in the agreement.
The following table shows our contractual cash receipts arising from future lease payments from finance leases, future rental receipts from noncancelable operating leases, and future payments on loans as of December 31, 2015 (in millions):
Contractual Cash Receipts by Period | |||||||||||||||||||||||||||
Total | 2016 | 2017 | 2018 | 2019 | 2020 | Thereafter | |||||||||||||||||||||
Finance leases | $ | 199.6 | $ | 28.3 | $ | 25.9 | $ | 23.9 | $ | 22.6 | $ | 21.1 | $ | 77.8 | |||||||||||||
Operating leases | 4,392.6 | 970.3 | 815.1 | 684.3 | 568.1 | 442.6 | 912.2 | ||||||||||||||||||||
Loans | 8.8 | 2.0 | 2.0 | 4.2 | 0.1 | 0.1 | 0.4 | ||||||||||||||||||||
Total | $ | 4,601.0 | $ | 1,000.6 | $ | 843.0 | $ | 712.4 | $ | 590.8 | $ | 463.8 | $ | 990.4 | |||||||||||||
Our future contractual cash receipts at December 31, 2015 increased $446.0 million compared to 2014, primarily as a result of growing our committed lease receipts by raising rates and extending term. This increase in contractual cash receipts was net of lease receipts in 2015 and the repayment of the AAE loan.
2016 Liquidity Outlook
We plan to meet our contractual obligations for 2016 using our available cash at December 31, 2015, as well as a combination of cash we expect to receive from operations, portfolio proceeds, long-term debt issuances, and our revolving credit facilities. Additionally, we anticipate that portfolio investments in 2016 will likely exceed contractual commitments as we expect to exercise options to purchase railcars that are currently on lease and opportunistically pursue other strategic investments. However, changes in the economic environment or capital markets could adversely impact our liquidity position, and we cannot provide assurance that our sources of cash will be adequate to fund our operations and contractual commitments.
Short-Term Borrowings
We primarily use short-term borrowings as a source of working capital and to temporarily fund differences between our operating cash flows and portfolio proceeds, and our capital investments and debt maturities. We do not maintain or target any particular level of short-term borrowings on a permanent basis. Rather, we will temporarily utilize short-term borrowings at levels we deem appropriate until we decide to pay down these balances using proceeds from a long-term debt issuance.
51
The following table shows additional information regarding our short-term borrowings:
North America (1) | Europe (2) | ||||||||||||||||||||||
2015 | 2014 | 2013 | 2015 | 2014 | 2013 | ||||||||||||||||||
Balance as of December 31 (in millions) | $ | — | $ | 69.0 | $ | — | $ | 7.4 | $ | 3.1 | $ | 23.6 | |||||||||||
Weighted average interest rate | — | % | 0.6 | % | — | % | 0.9 | % | 1.5 | % | 1.3 | % | |||||||||||
Euro/Dollar exchange rate | n/a | n/a | n/a | 1.09 | 1.21 | 1.37 | |||||||||||||||||
Average daily amount outstanding during year (in millions) | $ | 5.7 | $ | 41.9 | $ | 19.3 | $ | 5.5 | $ | 17.4 | $ | 28.5 | |||||||||||
Weighted average interest rate | 0.5 | % | 0.3 | % | 0.4 | % | 1.1 | % | 1.1 | % | 1.0 | % | |||||||||||
Average Euro/Dollar exchange rate | n/a | n/a | n/a | 1.11 | 1.33 | 1.33 | |||||||||||||||||
Average daily amount outstanding during 4th quarter (in millions) | $ | — | $ | 19.4 | $ | — | $ | 5.2 | $ | 8.4 | $ | 17.5 | |||||||||||
Weighted average interest rate | — | % | 0.4 | % | — | % | 1.1 | % | 1.1 | % | 1.1 | % | |||||||||||
Average Euro/Dollar exchange rate | n/a | n/a | n/a | 1.10 | 1.25 | 1.36 | |||||||||||||||||
Maximum daily amount outstanding (in millions) | $ | 69.0 | $ | 162.0 | $ | 185.0 | $ | 75.5 | $ | 49.8 | $ | 147.1 | |||||||||||
Euro/Dollar exchange rate | n/a | n/a | n/a | 1.06 | 1.36 | 1.37 | |||||||||||||||||
__________
(1) | Short-term borrowings in North America are comprised of commercial paper issued in the US. |
(2) | Short-term borrowings in Europe are comprised of borrowings under bank credit facilities. |
In 2013, we entered into a new $575 million 5-year unsecured revolving credit facility in the US. In 2015, we exercised an option to extend the maturity date of our revolving credit facility by one year, to April 2020. As of December 31, 2015, the full $575 million was available under the facility.
Restrictive Covenants
Our credit facility and certain other debt agreements contain various restrictive covenants. See "Note 9. Debt" in Part II, Item 8 of this Form 10-K.
Credit Ratings
The global capital market environment and outlook may affect our funding options and our financial performance. Our access to capital markets at competitive rates depends on our credit rating and rating outlook, as determined by rating agencies. As of December 31, 2015, our long-term unsecured debt was rated BBB by Standard & Poor's and Baa2 by Moody’s Investor Service and our short-term unsecured debt was rated A-2 by Standard & Poor's and P-2 by Moody’s Investor Service. Our rating outlook from both agencies was stable.
Shelf Registration Statement
During 2013, we filed a shelf registration statement that enables us to issue debt securities and pass-through certificates. The registration statement is effective for three years and does not limit the amount of debt securities and pass-through certificates we can issue.
Commercial Commitments
We have entered into various commercial commitments, such as guarantees and standby letters of credit, related to certain transactions. These commercial commitments require us to fulfill specific obligations in the event of third-party demands. Similar to our balance sheet investments, these commitments expose us to credit, market, and equipment risk. Accordingly, we evaluate these commitments and other contingent obligations using techniques similar to those we use to evaluate funded transactions.
52
The following table shows our commercial commitments at December 31, 2015 (in millions):
Amount of Commitment Expiration by Period | |||||||||||||||||||||||||||
Total | 2016 | 2017 | 2018 | 2019 | 2020 | Thereafter | |||||||||||||||||||||
Lease payment guarantees | $ | 22.1 | $ | 7.1 | $ | 10.1 | $ | 2.8 | $ | 2.1 | $ | — | $ | — | |||||||||||||
Standby letters of credit and performance bonds | 8.9 | 8.9 | — | — | — | — | — | ||||||||||||||||||||
$ | 31.0 | $ | 16.0 | $ | 10.1 | $ | 2.8 | $ | 2.1 | $ | — | $ | — | ||||||||||||||
Lease payment guarantees are commitments to financial institutions to make lease payments for a third party in the event they default. We reduce any liability that may result from these guarantees by the value of the underlying asset or group of assets.
We are also parties to standby letters of credit and performance bonds, which primarily relate to contractual obligations and general liability insurance coverages. No material claims have been made against these obligations, and no material losses are anticipated.
Defined Benefit Plan Contributions
In 2015, we contributed $5.8 million to our defined benefit pension plans and other post-retirement benefit plans. In 2016, we expect to contribute approximately $6.4 million. As of December 31, 2015, our funded pension plans were 95% funded in aggregate. Additional contributions will depend primarily on plan asset investment returns and actuarial experience, and subject to the impact of these factors, we may make additional material plan contributions.
Separately, the shipboard personnel at ASC participate in various multiemployer benefit plans that provide pension, health care, and post-retirement and other benefits to active and retired employees. We contributed $8.2 million to these plans in 2015 and recognized that amount as marine operating expense. We expect our 2016 contributions to approximate 2015 amounts, but our contributions will ultimately depend on the number of vessels deployed and crew hours worked during the year.
See "Note 12. Pension and Other Post-Retirement Benefits" in Part II, Item 8 of this Form 10-K for additional information on our benefit plans.
GATX Common and Preferred Stock Repurchases
In 2015, we repurchased 2.4 million shares for $125.4 million under this repurchase program, which completed our $250 million repurchase authorization approved in 2014. In 2014, we repurchased 1.9 million shares for $124.6 million. In 2013, we purchased 1.4 million shares for $68.6 million, which completed a separate repurchase program that was authorized in 2008. Subsequent to December 31, 2015, our board of directors authorized a new $300 million stock repurchase program. The timing of share repurchases will be dependent on market conditions and other factors.
In 2013, we either converted or redeemed all 15,567 outstanding shares of our $2.50 cumulative convertible preferred stock.
CRITICAL ACCOUNTING POLICIES AND ESTIMATES
We prepare our consolidated financial statements in conformity with GAAP, which requires us to use judgment in making estimates and assumptions that affect reported amounts of assets, liabilities, revenues, and expenses, as well as information in the related disclosures. We regularly evaluate our estimates and judgments based on historical experience, market indicators, and other relevant factors and circumstances. Actual results may differ from these estimates under different assumptions or conditions.
Operating Assets
We state operating assets, including assets acquired under capital leases, at cost and depreciate them over their estimated economic useful lives to an estimated residual value using the straight-line method. We determine the economic useful life based on our estimate of the period over which the asset will generate revenue. For the majority of our operating assets, the economic useful life is greater than
53
thirty years. The residual values are based on historical experience and economic factors. We periodically review the appropriateness of our estimates of useful lives and residual values based on changes in economic circumstances and other factors. Changes in these estimates would result in a change in future depreciation expense.
In addition, we review long-lived assets, such as operating assets and facilities, for impairment whenever circumstances indicate that the carrying amount of these assets may not be recoverable. We measure the recoverability of assets we expect to hold and use by comparing the carrying amount of an asset to its estimated future net cash flows. We base estimated future cash flows on a number of assumptions, including lease rates, lease term (including renewals), freight rates and volume, operating costs, the life of the asset, and final disposition proceeds. If we determine an asset is impaired, we record an impairment loss equal to the excess of the asset’s carrying amount over its estimated fair value. We base our estimates of fair value on discounted future cash flows, and supplement those estimates with independent appraisals and market comparables when available.
Lease Classification
We analyze all new and modified leases to determine whether we should classify the lease as an operating or capital lease. Our lease classification analysis relies on certain assumptions that require significant judgment, such as the asset's fair value, the asset's estimated residual value, the interest rate implicit in the lease, and the asset's economic useful life. While most of our leases are classified as operating leases, changes in the assumptions we use could result in a different lease classification, which would change the way the lease transaction impacts our financial position and results of operations. See "Note 5. Leases" in Part II, Item 8 of this Form 10-K.
Impairment of Investments in Affiliated Companies
We review the carrying amount of our investments in affiliates annually, or whenever circumstances indicate that their value may have declined. If management determines that indicators of impairment are present for an investment, we perform an analysis to estimate the fair value of that investment. Active markets do not typically exist for our affiliate investments and as a result, we may estimate fair value using discounted cash flow analysis at the investee level, price-earnings ratios based on comparable businesses, or other valuation techniques that are appropriate for the particular circumstances of the affiliate. For all fair value estimates, we use observable inputs whenever possible and appropriate.
Once we make an estimate of fair value, we compare the estimate of fair value to the investment’s carrying value. If the investment’s estimated fair value is less than its carrying value, then we consider the investment impaired. If an investment is impaired, we assess whether the impairment is other-than-temporary. We consider factors such as the expected operating results for the investment's near future, the length of the economic life cycle of the underlying assets of the investee, and our ability to hold the investment through the end of the underlying assets’ useful life to determine if the impairment is other-than-temporary. We may also consider actions we anticipate the investee will take to improve its business prospects if it seems probable the investee will take those actions. If we determine an investment to be only temporarily impaired, we do not record an impairment loss. Alternatively, if we determine an impairment is other-than-temporary, we record a loss equal to the difference between the estimated fair value of the investment and its carrying value. See "Note 7. Investments in Affiliated Companies" and "Note 11. Asset Impairments" in Part II, Item 8 of this Form 10-K.
Impairment of Goodwill
We review the carrying amount of our goodwill annually or in interim periods if circumstances indicate an impairment may have occurred. We perform the impairment review at the reporting unit level, which is one level below an operating segment. The goodwill impairment test is a two-step process and requires us to make certain judgments to determine the assumptions we use in the calculation. The first step requires us to estimate the fair value of each reporting unit, which we determine using a discounted cash flow model. We base our estimates of the future cash flows on revenue and expense forecasts and include assumptions for future growth. When estimating the fair value of the reporting unit, we also consider observable multiples of book value and earnings for companies that we believe are comparable to the applicable reporting units. We then compare our estimate of the fair value of the reporting unit with the reporting unit’s carrying amount, which includes goodwill. If the estimated fair value is less than the carrying amount, we compare the implied fair value of the reporting unit’s goodwill with the carrying amount of the goodwill. If the carrying amount of the goodwill exceeds its implied fair value, we record an impairment loss for the amount the carrying amount of the goodwill exceeds its implied fair value. See "Note 18. Goodwill" in Part II, Item 8 of this Form 10-K.
54
Pension and Post-Retirement Benefits Assumptions
We use actuarial assumptions to calculate pension and other post-retirement benefit obligations and related costs. The discount rate and the expected return on plan assets are two critical assumptions that influence the plan expense and liability measurement. Other assumptions involve demographic factors such as expected retirement age, mortality, employee turnover, health care cost trends, and the rate of compensation increases.
We use the discount rate to calculate the present value of expected future pension and post-retirement cash flows as of the measurement date. The discount rate is based on yields for high-quality, long-term bonds with durations similar to the projected benefit obligation. We base the expected long-term rate of return on plan assets on current and expected asset allocations, as well as historical and expected returns on various categories of plan assets. We evaluate these critical assumptions annually and make adjustments as required in accordance with changes in underlying market conditions, valuation of plan assets, or demographics. Changes in these assumptions may increase or decrease periodic benefit plan expense as well as the carrying value of benefit plan obligations.
See "Note 12. Pension and Other Post-Retirement Benefits" in Part II, Item 8 of this Form 10-K for additional information regarding these assumptions.
Share-Based Compensation
We grant equity awards to certain employees and non-employee directors in the form of stock appreciation rights, restricted stock, performance shares, and phantom stock. We recognize compensation expense for these awards on a pro-rata basis over the applicable vesting period based on the award’s grant date fair value. We use the Black-Scholes options valuation model to calculate the grant date fair value of stock appreciation rights. This model requires us to make certain assumptions, some of which are highly subjective, that affect the amount of compensation expense we will record. The assumptions we use in the model include the expected stock price volatility (based on the historical volatility of our stock price), the risk-free interest rate (based on the treasury yield curve), the expected life of the equity award (based on historical exercise patterns and post-vesting termination behavior), and the dividend equivalents we expect to pay during the estimated life of the equity award since our stock appreciation rights are dividend participating. We base the fair value of other equity awards on our stock price on the grant date.
See "Note 13. Share-Based Compensation" in Part II, Item 8 of this Form 10-K.
Income Taxes
Our operations are subject to taxes in the US, various states, and foreign countries, and as result, we may be subject to audit in all of these jurisdictions. Tax audits may involve complex issues and disagreements with taxing authorities that could require several years to resolve. GAAP requires that we presume the relevant tax authority will examine uncertain income tax positions. We must determine whether, based on the technical merits of our position, it is more likely than not that our uncertain income tax positions will be sustained by taxing authorities upon examination, which may include related appeals or litigation processes. We must then evaluate income tax positions that meet the more likely than not recognition threshold to determine the probable amount of benefit we would recognize in the financial statements. Establishing accruals for uncertain tax benefits requires us to make estimates and assessments with respect to the ultimate outcome of tax audit issues for amounts recorded in the financial statements. The ultimate resolution of uncertain tax benefits may differ from our estimate, potentially impacting our financial position, results of operations, or cash flows.
We evaluate the need for a deferred tax asset valuation allowance by assessing the likelihood we will realize deferred tax assets, including net operating loss and tax credit carryforward benefits, in the future. Our assessment of whether a valuation allowance is required involves judgment, including forecasting future taxable income and evaluating tax planning initiatives, if applicable.
Our tax provision does not include taxes on undistributed earnings of foreign subsidiaries as we intend to permanently reinvest such earnings in those foreign operations. If, in the future, these earnings are repatriated to the US, or if we expect such earnings to be repatriated, a provision for additional taxes may be required.
See "Note 14. Income Taxes" in Part II, Item 8 of this Form 10-K for additional information on income taxes.
55
NEW ACCOUNTING PRONOUNCEMENTS
See "Note 2. Accounting Changes" in Part II, Item 8 of this Form 10-K for a summary of new accounting pronouncements that may impact our business.
NON-GAAP FINANCIAL MEASURES
We compute certain financial measures using non-GAAP components, as defined by the SEC. These measures are not in accordance with, or a substitute for, GAAP and our financial measures may be different from non-GAAP financial measures used by other companies.
We have provided a reconciliation of our non-GAAP components to the most directly comparable GAAP components. We include these non-GAAP financial measures to provide additional information and insight into our operating results and financial position. We use these measures in analyzing our financial performance from period to period and when making compensation decisions.
Reconciliation of Non-GAAP Components used in the Computation of Certain Financial Measures
Balance Sheet Measures
We disclose total on- and off-balance sheet assets because a portion of our North American railcar fleet has been financed through sale-leasebacks that are accounted for as operating leases and the assets are not recorded on the balance sheet. Additionally, ASC utilizes a tug and barge unit that is accounted for as an operating lease and the assets are not recorded on the balance sheet. We believe this information provides investors with a better representation of the assets deployed in our businesses.
The following table shows total on- and off-balance sheet assets (in millions):
2015 | 2014 | 2013 | 2012 | 2011 | |||||||||||||||
Consolidated on-balance sheet assets | $ | 6,894.2 | $ | 6,919.9 | $ | 6,535.5 | $ | 6,044.7 | $ | 5,846.0 | |||||||||
Off-balance sheet assets: | |||||||||||||||||||
Rail North America | 488.7 | 606.1 | 887.9 | 863.5 | 884.5 | ||||||||||||||
ASC | 6.8 | 11.7 | 16.5 | 21.0 | — | ||||||||||||||
Portfolio Management | — | — | — | — | 2.6 | ||||||||||||||
Total On- and Off-Balance Sheet Assets | $ | 7,389.7 | $ | 7,537.7 | $ | 7,439.9 | $ | 6,929.2 | $ | 6,733.1 | |||||||||
Shareholders’ Equity | $ | 1,280.2 | $ | 1,314.0 | $ | 1,397.0 | $ | 1,244.2 | $ | 1,127.3 | |||||||||
Net Income Measures
We exclude the effects of tax adjustments and other items when we present return on equity, net income, and diluted earnings per share. We exclude these items to provide a more meaningful comparison of financial performance between years and to provide transparency in our operating results.
56
The following tables show our net income and diluted earnings per share excluding tax adjustments and other items for the years ended December 31 (in millions, except per share data):
Impact of Tax Adjustments and Other Items on Net Income: | |||||||||||||||||||
2015 | 2014 | 2013 | 2012 | 2011 | |||||||||||||||
Net income | $ | 205.3 | $ | 205.0 | $ | 169.3 | $ | 137.3 | $ | 110.8 | |||||||||
Adjustments attributable to consolidated income: | |||||||||||||||||||
Net loss on wholly owned Portfolio Management marine investments, net of tax (1) | 5.7 | — | — | — | — | ||||||||||||||
Early retirement program, net of tax (2) | 5.6 | — | — | — | — | ||||||||||||||
Income tax rate changes (3) | 14.1 | — | — | 0.7 | — | ||||||||||||||
GATX income taxes on sale of AAE (4) | — | — | 23.2 | — | — | ||||||||||||||
Foreign tax credit carryforward (5) | — | — | (3.9 | ) | (4.6 | ) | — | ||||||||||||
Tax benefits upon close of tax audits | — | — | — | (15.5 | ) | (4.8 | ) | ||||||||||||
Litigation recoveries, no tax effect (6) | — | — | — | — | (3.2 | ) | |||||||||||||
Leveraged lease adjustment, net of tax (7) | — | — | — | — | (3.5 | ) | |||||||||||||
Adjustments attributable to affiliates' earnings: | |||||||||||||||||||
Impairment loss on Portfolio Management affiliate (1) | 11.9 | — | — | — | — | ||||||||||||||
Income tax rate changes (8) | (7.7 | ) | — | (7.6 | ) | (4.6 | ) | (4.1 | ) | ||||||||||
Pretax gain on sale of AAE (4) | — | — | (9.3 | ) | — | — | |||||||||||||
Interest rate swaps at AAE, net of taxes (9) | — | — | (6.9 | ) | 20.5 | (0.2 | ) | ||||||||||||
Net income, excluding tax adjustments and other items | $ | 234.9 | $ | 205.0 | $ | 164.8 | $ | 133.8 | $ | 95.0 | |||||||||
Impact of Tax Adjustments and Other Items on Diluted Earnings per Share: | |||||||||||||||||||
2015 | 2014 | 2013 | 2012 | 2011 | |||||||||||||||
Diluted earnings per share | $ | 4.69 | $ | 4.48 | $ | 3.59 | $ | 2.88 | $ | 2.35 | |||||||||
Adjustments attributable to consolidated income: | |||||||||||||||||||
Net loss on wholly owned Portfolio Management marine investments, net of tax (1) | 0.13 | — | — | — | — | ||||||||||||||
Early retirement program, net of tax (2) | 0.13 | — | — | — | — | ||||||||||||||
Income tax rate changes (3) | 0.32 | — | — | 0.01 | — | ||||||||||||||
GATX income taxes on sale of AAE (4) | — | — | 0.50 | — | — | ||||||||||||||
Foreign tax credit carryforward (5) | — | — | (0.08 | ) | (0.09 | ) | — | ||||||||||||
Tax benefits upon close of tax audits | — | — | — | (0.33 | ) | (0.10 | ) | ||||||||||||
Litigation recoveries, no tax effect (6) | — | — | — | — | (0.07 | ) | |||||||||||||
Leveraged lease adjustment, net of tax (7) | — | — | — | — | (0.08 | ) | |||||||||||||
Adjustments attributable to affiliates' earnings: | |||||||||||||||||||
Impairment loss on Portfolio Management affiliate (1) | 0.27 | — | — | — | — | ||||||||||||||
Income tax rate changes (8) | (0.18 | ) | — | (0.16 | ) | (0.09 | ) | (0.09 | ) | ||||||||||
Pretax gain on sale of AAE (4) | — | — | (0.20 | ) | — | — | |||||||||||||
Interest rate swaps at AAE, net of taxes (9) | — | — | (0.15 | ) | 0.43 | — | |||||||||||||
Diluted earnings per share, excluding tax adjustments and other items* | $ | 5.37 | $ | 4.48 | $ | 3.50 | $ | 2.81 | $ | 2.01 | |||||||||
* Sum of individual components may not be additive, due to rounding.
57
________
(1) | In 2015, we made the decision to exit the majority of our non-core, marine investments within our Portfolio Management segment. As a result, we recorded losses and gains associated with the impairments and sales of certain investments. |
(2) | Expenses associated with an early retirement program offered to certain eligible employees. |
(3) | Deferred income tax adjustment attributable to an increase of our effective state income tax rate in 2015 and a deferred income tax adjustment due to an enacted statutory rate increase in Ontario in 2012. |
(4) | Aggregate after-tax impact of the AAE sale, including the $3.9 million foreign credit carryforward, was a net loss of $10.0 million. |
(5) | Benefits attributable to the utilization of foreign tax credit carryforwards. |
(6) | Accrual reversals resulting from the favorable resolution of litigation matters. |
(7) | Income on a leveraged lease adjustment. |
(8) | Deferred income tax adjustments due to enacted statutory rate decreases in the United Kingdom for each of 2015, 2013, 2012, and 2011. |
(9) | Realized and/or unrealized gains/losses on AAE interest rate swaps. |
58
Item 7A. Quantitative and Qualitative Disclosures About Market Risk
In the normal course of business, we are exposed to interest rate and foreign currency exchange rate risks that could impact our financial results. To manage these risks we may enter into certain derivative transactions, principally interest rate swaps, Treasury rate locks, options and currency forwards and swaps. These instruments and other derivatives are entered into only for hedging existing underlying exposures. We do not hold or issue derivative financial instruments for speculative purposes.
Interest Rate Exposure — Our reported interest expense is affected by changes in interest rates, primarily LIBOR, as a result of the issuance of floating rate debt instruments. We generally manage the amount of floating rate debt instruments in relation to our floating rate investments. Based on our floating rate debt instruments at December 31, 2015, and giving effect to related derivatives, a hypothetical increase in market interest rates of 100 basis points would cause an increase in after-tax interest expense of $5.2 million in 2016. Comparatively, at December 31, 2014, a hypothetical 100 basis point increase in interest rates would have resulted in a $8.0 million increase in after-tax interest expense in 2015. Our earnings are also exposed to interest rate changes from affiliates' earnings. Certain affiliates issue floating rate debt instruments to finance their investments.
Foreign Currency Exchange Rate Exposure — Certain of our foreign subsidiaries conduct business in currencies other than the US dollar, principally those operating in Austria, Canada, Germany, and Poland. As a result, we are exposed to foreign currency risk attributable to changes in the exchange value of the US dollar in terms of the euro, Canadian dollar, and Polish zloty. Based on 2015 local currency earnings and considering non-functional currency assets and liabilities recorded as of December 31, 2015, and giving effect to related derivatives, a uniform and hypothetical 10% strengthening in the US dollar versus applicable foreign currencies would decrease after-tax income in 2016 by $2.4 million. Comparatively, based on 2014 local currency earnings and considering non-functional currency assets and liabilities recorded as of December 31, 2014, a uniform and hypothetical 10% strengthening in the US dollar versus applicable foreign currencies would have decreased after-tax income in 2015 by $2.4 million.
59
Item 8. Financial Statements and Supplementary Data
Report of Independent Registered Public Accounting Firm on Financial Statements
The Board of Directors and Shareholders of GATX Corporation and subsidiaries
We have audited the accompanying consolidated balance sheets of GATX Corporation and subsidiaries as of December 31, 2015 and 2014, and the related consolidated statements of comprehensive income, changes in shareholders' equity and cash flows for each of the three years in the period ended December 31, 2015. Our audits also included the financial statement schedule listed in the Index at Item 15(a)(2). These financial statements and schedule are the responsibility of the Company's management. Our responsibility is to express an opinion on these financial statements and schedule based on our audits.
We conducted our audits in accordance with the standards of the Public Company Accounting Oversight Board (United States). Those standards require that we plan and perform the audit to obtain reasonable assurance about whether the financial statements are free of material misstatement. An audit includes examining, on a test basis, evidence supporting the amounts and disclosures in the financial statements. An audit also includes assessing the accounting principles used and significant estimates made by management, as well as evaluating the overall financial statement presentation. We believe that our audits provide a reasonable basis for our opinion.
In our opinion, the financial statements referred to above present fairly, in all material respects, the consolidated financial position of GATX Corporation and subsidiaries at December 31, 2015 and 2014, and the consolidated results of their operations and their cash flows for each of the three years in the period ended December 31, 2015, in conformity with US generally accepted accounting principles. Also, in our opinion, the related financial statement schedule, when considered in relation to the basic financial statements taken as a whole, presents fairly in all material respects the information set forth therein.
We also have audited, in accordance with the standards of the Public Company Accounting Oversight Board (United States), GATX Corporation and subsidiaries’ internal control over financial reporting as of December 31, 2015, based on criteria established in Internal Control-Integrated Framework issued by the Committee of Sponsoring Organizations of the Treadway Commission (2013 framework) and our report dated February 24, 2016, expressed an unqualified opinion thereon.

Chicago, Illinois |
February 24, 2016 |
60
GATX CORPORATION AND SUBSIDIARIES
CONSOLIDATED BALANCE SHEETS
(In millions, except share data)
December 31 | |||||||
2015 | 2014 | ||||||
Assets | |||||||
Cash and Cash Equivalents | $ | 202.4 | $ | 209.9 | |||
Restricted Cash | 17.3 | 14.5 | |||||
Receivables | |||||||
Rent and other receivables | 69.4 | 86.0 | |||||
Loans | 8.8 | 97.3 | |||||
Finance leases | 167.6 | 174.7 | |||||
Less: allowance for losses | (10.3 | ) | (5.7 | ) | |||
235.5 | 352.3 | ||||||
Operating Assets and Facilities ($122.9 and $123.1 related to a consolidated VIE) | 8,204.0 | 8,143.5 | |||||
Less: allowance for depreciation ($39.7 and $35.0 related to a consolidated VIE) | (2,505.6 | ) | (2,455.5 | ) | |||
5,698.4 | 5,688.0 | ||||||
Investments in Affiliated Companies | 348.5 | 357.7 | |||||
Goodwill | 79.7 | 86.1 | |||||
Other Assets | 312.4 | 211.4 | |||||
Total Assets | $ | 6,894.2 | $ | 6,919.9 | |||
Liabilities and Shareholders’ Equity | |||||||
Accounts Payable and Accrued Expenses | $ | 170.9 | $ | 165.9 | |||
Debt | |||||||
Commercial paper and borrowings under bank credit facilities | 7.4 | 72.1 | |||||
Recourse | 4,171.5 | 4,162.3 | |||||
Nonrecourse ($6.9 and $15.9 related to a consolidated VIE) | 6.9 | 15.9 | |||||
Capital lease obligations | 18.4 | 6.3 | |||||
4,204.2 | 4,256.6 | ||||||
Deferred Income Taxes | 1,018.3 | 937.3 | |||||
Other Liabilities | 220.6 | 246.1 | |||||
Total Liabilities | 5,614.0 | 5,605.9 | |||||
Shareholders’ Equity | |||||||
Common stock, $0.625 par value: Authorized shares — 120,000,000 Issued shares — 66,776,290 and 66,600,984 Outstanding shares — 41,970,098 and 44,198,850 | 41.5 | 41.4 | |||||
Additional paid in capital | 677.4 | 672.8 | |||||
Retained earnings | 1,639.0 | 1,501.7 | |||||
Accumulated other comprehensive loss | (198.8 | ) | (148.4 | ) | |||
Treasury stock at cost (24,806,192 and 22,402,134 shares) | (878.9 | ) | (753.5 | ) | |||
Total Shareholders’ Equity | 1,280.2 | 1,314.0 | |||||
Total Liabilities and Shareholders’ Equity | $ | 6,894.2 | $ | 6,919.9 | |||
See accompanying notes to consolidated financial statements.
61
GATX CORPORATION AND SUBSIDIARIES
CONSOLIDATED STATEMENTS OF COMPREHENSIVE INCOME
(In millions, except per share data)
Year Ended December 31 | |||||||||||
2015 | 2014 | 2013 | |||||||||
Revenues | |||||||||||
Lease revenue | $ | 1,130.1 | $ | 1,086.6 | $ | 975.2 | |||||
Marine operating revenue | 235.0 | 286.3 | 275.1 | ||||||||
Other revenue | 84.8 | 78.1 | 70.7 | ||||||||
Total Revenues | 1,449.9 | 1,451.0 | 1,321.0 | ||||||||
Expenses | |||||||||||
Maintenance expense | 326.1 | 337.0 | 294.0 | ||||||||
Marine operating expense | 155.9 | 197.8 | 189.8 | ||||||||
Depreciation expense | 290.5 | 273.5 | 255.0 | ||||||||
Operating lease expense | 87.2 | 108.7 | 129.4 | ||||||||
Other operating expense | 38.4 | 28.9 | 26.1 | ||||||||
Selling, general and administrative expense | 192.4 | 189.2 | 178.3 | ||||||||
Total Expenses | 1,090.5 | 1,135.1 | 1,072.6 | ||||||||
Other Income (Expense) | |||||||||||
Net gain on asset dispositions | 79.2 | 87.2 | 85.6 | ||||||||
Interest expense, net | (155.1 | ) | (158.4 | ) | (166.6 | ) | |||||
Other expense | (13.2 | ) | (13.5 | ) | (8.4 | ) | |||||
Income before Income Taxes and Share of Affiliates’ Earnings | 270.3 | 231.2 | 159.0 | ||||||||
Income Taxes | (110.9 | ) | (75.7 | ) | (65.5 | ) | |||||
Share of Affiliates’ Earnings, Net of Taxes | 45.9 | 49.5 | 75.8 | ||||||||
Net Income | $ | 205.3 | $ | 205.0 | $ | 169.3 | |||||
Other Comprehensive Income, Net of Taxes | |||||||||||
Foreign currency translation adjustments | (55.8 | ) | (79.1 | ) | 25.8 | ||||||
Unrealized (loss) gain on securities | (0.6 | ) | (0.1 | ) | 0.8 | ||||||
Unrealized (loss) gain on derivative instruments | (1.8 | ) | 3.0 | 22.4 | |||||||
Post-retirement benefit plans | 7.8 | (29.5 | ) | 52.9 | |||||||
Other comprehensive (loss) income | (50.4 | ) | (105.7 | ) | 101.9 | ||||||
Comprehensive Income | $ | 154.9 | $ | 99.3 | $ | 271.2 | |||||
Share Data | |||||||||||
Basic earnings per share | $ | 4.76 | $ | 4.55 | $ | 3.64 | |||||
Average number of common shares | 43.1 | 45.0 | 46.4 | ||||||||
Diluted earnings per share | $ | 4.69 | $ | 4.48 | $ | 3.59 | |||||
Average number of common shares and common share equivalents | 43.8 | 45.8 | 47.1 | ||||||||
Dividends declared per common share | $ | 1.52 | $ | 1.32 | $ | 1.24 | |||||
See accompanying notes to consolidated financial statements.
62
GATX CORPORATION AND SUBSIDIARIES
CONSOLIDATED STATEMENTS OF CASH FLOWS
(In millions)
Year Ended December 31 | |||||||||||
2015 | 2014 | 2013 | |||||||||
Operating Activities | |||||||||||
Net income | $ | 205.3 | $ | 205.0 | $ | 169.3 | |||||
Adjustments to reconcile net income to net cash provided by operating activities: | |||||||||||
Depreciation expense | 303.3 | 287.0 | 267.8 | ||||||||
Share-based compensation | 11.6 | 14.0 | 13.1 | ||||||||
Asset impairment charges | 33.9 | 1.3 | 5.9 | ||||||||
Net gains on sales of assets | (99.7 | ) | (79.3 | ) | (80.7 | ) | |||||
Deferred income taxes | 90.2 | 61.4 | 53.6 | ||||||||
Share of affiliates’ earnings, net of dividends | (13.7 | ) | (9.5 | ) | (41.4 | ) | |||||
Change in income taxes payable | 7.4 | (4.4 | ) | 4.5 | |||||||
Change in accrued operating lease expense | (24.2 | ) | (5.2 | ) | (7.7 | ) | |||||
Employee benefit plans | 10.6 | 3.7 | 7.5 | ||||||||
Other | 9.6 | (24.8 | ) | 8.8 | |||||||
Net cash provided by operating activities | 534.3 | 449.2 | 400.7 | ||||||||
Investing Activities | |||||||||||
Additions to operating assets and facilities | (681.4 | ) | (1,015.2 | ) | (744.1 | ) | |||||
Loans extended | — | — | (14.2 | ) | |||||||
Investments in affiliates | (15.5 | ) | (15.3 | ) | (101.3 | ) | |||||
Portfolio investments and capital additions | (696.9 | ) | (1,030.5 | ) | (859.6 | ) | |||||
Purchases of leased-in assets | (118.4 | ) | (150.5 | ) | (61.4 | ) | |||||
Portfolio proceeds | 482.2 | 264.0 | 385.3 | ||||||||
Proceeds from sales of other assets | 18.7 | 26.9 | 32.3 | ||||||||
Proceeds from sale-leasebacks | — | — | 90.7 | ||||||||
Net (increase) decrease in restricted cash | (2.9 | ) | 5.8 | 9.5 | |||||||
Other | 9.7 | 5.8 | — | ||||||||
Net cash used in investing activities | (307.6 | ) | (878.5 | ) | (403.2 | ) | |||||
Financing Activities | |||||||||||
Net proceeds from issuances of debt (original maturities longer than 90 days) | 748.8 | 1,223.0 | 1,132.2 | ||||||||
Repayments of debt (original maturities longer than 90 days) | (726.3 | ) | (819.8 | ) | (602.8 | ) | |||||
Net (decrease) increase in debt with original maturities of 90 days or less | (64.5 | ) | 50.0 | (251.3 | ) | ||||||
Payments on capital lease obligations | (2.7 | ) | (2.6 | ) | (2.4 | ) | |||||
Stock repurchases | (125.4 | ) | (124.6 | ) | (68.6 | ) | |||||
Dividends | (68.2 | ) | (62.0 | ) | (60.5 | ) | |||||
Other | 9.3 | (1.8 | ) | 2.5 | |||||||
Net cash (used in) provided by financing activities | (229.0 | ) | 262.2 | 149.1 | |||||||
Effect of Exchange Rate Changes on Cash and Cash Equivalents | (5.2 | ) | (2.7 | ) | (1.1 | ) | |||||
Net (decrease) increase in Cash and Cash Equivalents during the year | (7.5 | ) | (169.8 | ) | 145.5 | ||||||
Cash and Cash Equivalents at beginning of year | 209.9 | 379.7 | 234.2 | ||||||||
Cash and Cash Equivalents at end of year | $ | 202.4 | $ | 209.9 | $ | 379.7 | |||||
See accompanying notes to consolidated financial statements.
63
GATX CORPORATION AND SUBSIDIARIES
CONSOLIDATED STATEMENTS OF CHANGES IN SHAREHOLDERS’ EQUITY
(In millions)
2015 | 2015 | 2014 | 2014 | 2013 | 2013 | |||||||||||||||
Shares | Dollars | Shares | Dollars | Shares | Dollars | |||||||||||||||
Common Stock | ||||||||||||||||||||
Balance at beginning of year | 66.6 | $ | 41.4 | 66.3 | $ | 41.3 | 66.0 | $ | 41.2 | |||||||||||
Issuance of common stock | 0.2 | 0.1 | 0.3 | 0.1 | 0.3 | 0.1 | ||||||||||||||
Balance at end of year | 66.8 | 41.5 | 66.6 | 41.4 | 66.3 | 41.3 | ||||||||||||||
Treasury Stock | ||||||||||||||||||||
Balance at beginning of year | (22.4 | ) | (753.5 | ) | (20.5 | ) | (628.9 | ) | (19.1 | ) | (560.3 | ) | ||||||||
Stock repurchases | (2.4 | ) | (125.4 | ) | (1.9 | ) | (124.6 | ) | (1.4 | ) | (68.6 | ) | ||||||||
Balance at end of year | (24.8 | ) | (878.9 | ) | (22.4 | ) | (753.5 | ) | (20.5 | ) | (628.9 | ) | ||||||||
Additional Paid In Capital | ||||||||||||||||||||
Balance at beginning of year | 672.8 | 668.9 | 658.5 | |||||||||||||||||
Share-based compensation effects | 4.6 | 3.9 | 9.3 | |||||||||||||||||
Issuance of common stock | — | — | 1.1 | |||||||||||||||||
Balance at end of year | 677.4 | 672.8 | 668.9 | |||||||||||||||||
Retained Earnings | ||||||||||||||||||||
Balance at beginning of year | 1,501.7 | 1,358.4 | 1,249.4 | |||||||||||||||||
Net income | 205.3 | 205.0 | 169.3 | |||||||||||||||||
Dividends declared | (68.0 | ) | (61.7 | ) | (60.3 | ) | ||||||||||||||
Balance at end of year | 1,639.0 | 1,501.7 | 1,358.4 | |||||||||||||||||
Accumulated Other Comprehensive Loss | ||||||||||||||||||||
Balance at beginning of year | (148.4 | ) | (42.7 | ) | (144.6 | ) | ||||||||||||||
Other comprehensive (loss) income | (50.4 | ) | (105.7 | ) | 101.9 | |||||||||||||||
Balance at end of year | (198.8 | ) | (148.4 | ) | (42.7 | ) | ||||||||||||||
Total Shareholders’ Equity | $ | 1,280.2 | $ | 1,314.0 | $ | 1,397.0 | ||||||||||||||
See accompanying notes to consolidated financial statements.
64
GATX CORPORATION AND SUBSIDIARIES
NOTES TO CONSOLIDATED FINANCIAL STATEMENTS
NOTE 1. Description of Business
As used herein, "GATX," "we," "us," "our," and similar terms refer to GATX Corporation and its subsidiaries, unless indicated otherwise.
We lease, operate, manage, and remarket long-lived, widely-used assets, primarily in the rail market. We also invest in joint ventures that complement our existing business activities. We report our financial results through four primary business segments: Rail North America, Rail International, American Steamship Company (“ASC”), and Portfolio Management.
NOTE 2. Accounting Changes
Change in Accounting Estimate
At the end of 2015, we changed the approach used to measure service and interest costs for pension and other postretirement benefits. For 2015, the Company measured service and interest costs utilizing a single weighted-average discount rate derived from the yield curve used to measure the plan obligations. For 2016, we will measure service and interest costs by applying the specific spot rates along that yield curve to the plans’ liability cash flows. The Company believes the new approach provides a more precise measurement of service and interest costs by aligning the timing of the plans’ liability cash flows to the corresponding spot rates on the yield curve. This change does not affect the measurement of our plan obligations. The Company has accounted for this change as a change in accounting estimate and, accordingly, has accounted for it on a prospective basis.
In 2014, we completed a review of the estimated useful lives used for our North American railcar fleet and determined that the economic service life of many of our railcars differed from the useful life that was used to calculate depreciation. As a result, effective January 1, 2014, we revised the estimated useful lives from a range of 30-38 years to a range of 27-42 years. In aggregate, the average depreciable life of the fleet increased approximately 2.2 years. The impacts of these implemented changes on depreciation expense for affected assets was a net decrease in depreciation expense of approximately $21.9 million and an increase in net income of $14.0 million, or $0.31 per diluted share for the year ended December 31, 2014.
New Accounting Pronouncements Adopted
Debt Issue Costs
As of December 31, 2015, the Company elected to early adopt Accounting Standards Update ("ASU") 2015-03, Interest - Imputation of Interest (Subtopic 835-30): Simplifying the Presentation of Debt Issuance Costs, which requires presentation of debt issue costs as a deduction from the carrying amount of the related debt liability on the balance sheet, rather than as a deferred charge. Adoption of the new guidance did not impact the amount or timing of net income but required us to reclassify deferred debt issuance costs ($18.8 million in 2015 and $17.6 million in 2014), which were previously included in other assets, to a reduction in the carrying amount of our related debt balances.
Discontinued Operations
In April 2014, the Financial Accounting Standards Board ("FASB") issued ASU 2014-08, Presentation of Financial Statements (Topic 205) and Property, Plant and Equipment (Topic 360): Reporting Discontinued Operations and Disclosures of Components of an Entity. The amendments require that disposals representing strategic shifts that have (or will have) a major effect on an entity’s operations or financial results should be reported in discontinued operations. The amendments also expand the disclosure requirements for both discontinued operations and significant dispositions that do not qualify as discontinued operations.
The amendments were effective for us beginning in the first quarter of 2015. Adoption of the new guidance did not impact the amount or timing of net income or the presentation and disclosures of our financial statements.
65
GATX CORPORATION AND SUBSIDIARIES
NOTES TO CONSOLIDATED FINANCIAL STATEMENTS
New Accounting Pronouncements Not Yet Adopted
Consolidation
In February 2015, the FASB issued ASU 2015-02, Consolidation (Topic 810) Amendments to the Consolidation Analysis, which amends the analysis required to determine whether to consolidate certain types of legal entities such as limited partnerships, limited liability corporations, and certain securitization structures. The new guidance is effective for us beginning in the first quarter of 2016, with early adoption permitted. Application of the new guidance will not impact our financial statements and related disclosures.
Business Combinations
In September 2015, the FASB issued ASU 2015-16, Business Combinations (Topic 805), Simplifying the Accounting for Measurement-Period Adjustments, which requires the acquirer in a business combination to recognize measurement-period adjustments in the period in which it determines the amount of the adjustment. The new guidance is effective for us in the first quarter of 2016, with early adoption permitted. We do not expect the new guidance to have a significant impact on our financial statements and related disclosures.
Revenue from Contracts with Customers
In May 2014, the FASB issued ASU 2014-09, Revenue from Contracts with Customers (Topic 606), which supersedes most current revenue recognition guidance, including industry-specific guidance. The new guidance requires companies to recognize revenue to depict the transfer of promised goods or services to customers in an amount that reflects the consideration it expects to be entitled to in exchange for those goods or services.
In August 2015, the FASB deferred the effective date of this standard from the first quarter of 2017 to the first quarter of 2018. Early adoption is permitted as of the original effective date. We can adopt the new guidance using either the retrospective method or the cumulative effect transition method. We are still evaluating the effect that the new guidance will have on our consolidated financial statements and related disclosures, including which transition method we will use and when we will choose to adopt this standard.
NOTE 3. Significant Accounting Policies
Basis of Presentation
We prepared the accompanying consolidated financial statements in accordance with US generally accepted accounting principles ("GAAP"). Certain prior year amounts may have been reclassified to conform to the 2015 presentation.
Use of Estimates
Preparing financial statements in accordance with GAAP requires us to make estimates and assumptions that affect the amounts we report. We regularly evaluate our estimates and judgments based on historical experience and other relevant facts and circumstances. Actual amounts could differ from our estimates.
Consolidation
Our consolidated financial statements include our assets, liabilities, revenues, and expenses, as well as the assets, liabilities, revenues, and expenses of subsidiaries in which we have a controlling financial interest and variable interest entities for which we are the primary beneficiary. We have eliminated intercompany transactions and balances. Our consolidated subsidiaries include the following wholly owned, bankruptcy-remote special purpose corporations that finance and lease railcars: General American Railcar Corporation, General American Railcar Corporation III, General American Marks Company, and GARC LLC. The debt and lease obligations of these special purpose corporations are nonrecourse to us, and their assets are available first to satisfy claims of their creditors.
66
GATX CORPORATION AND SUBSIDIARIES
NOTES TO CONSOLIDATED FINANCIAL STATEMENTS (Continued)
Investments in Affiliates
We use the equity method to account for investments in joint ventures and other unconsolidated entities if we have the ability to exercise significant influence over the financial and operating policies of those investees. Under the equity method, we record our initial investments in these entities at cost and subsequently adjust the investment for our share of the affiliates’ undistributed earnings (losses), and distributions. We include loans to and from affiliates as part of our investment in the affiliate and include interest on any such loans in our share of the affiliates’ earnings. We review the carrying amount of our investments in affiliates annually, or whenever circumstances indicate that the value of these investments may have declined. If we determine an investment is impaired on an other-than-temporary basis, we record a loss equal to the difference between the fair value of the investment and its carrying value. See "Note 7. Investments in Affiliated Companies."
Variable Interest Entities
We evaluate whether an entity is a variable interest entity based on the sufficiency of the entity’s equity and by determining whether the equity holders have the characteristics of a controlling financial interest. To determine if we are the primary beneficiary of a variable interest entity, we assess whether we have the power to direct the activities that most significantly impact the economic performance of the entity as well as the obligation to absorb losses or the right to receive benefits that may be significant to the entity. These determinations are both qualitative and quantitative, and they require us to make judgments and assumptions about the entity’s forecasted financial performance and the volatility inherent in those forecasted results. We evaluate new investments for variable interest entity determination and regularly review all existing entities for events that may result in an entity becoming a variable interest entity or us becoming the primary beneficiary of an existing variable interest entity. See "Note 8. Variable Interest Entities."
Fair Value Measurements
Fair value is the price that a market participant would receive to sell an asset or pay to transfer a liability in an orderly transaction at the measurement date. We classify fair value measurements according to the three-level hierarchy defined by GAAP, and those classifications are based on our judgment about the reliability of the inputs we use in the fair value measurement. Level 1 inputs are quoted prices available in active markets for identical assets or liabilities. Level 2 inputs are observable, either directly or indirectly, and may include quoted prices for similar assets or liabilities, quoted prices in markets that are not active, or other inputs that are observable or can be corroborated by observable market data. For assets or liabilities with a specified contractual term, Level 2 inputs must be observable for substantially the full term of that asset or liability. Level 3 inputs are unobservable, meaning they are supported by little or no market activity. Fair value measurements classified as Level 3 typically rely on pricing models and discounted cash flow methodologies, both of which require significant judgment. See "Note 10. Fair Value Disclosure."
Cash and Cash Equivalents
We classify all highly liquid investments with a maturity of three months or less when purchased as cash equivalents.
Restricted Cash
Restricted cash is cash and cash equivalents that are restricted as to withdrawal and use. Our restricted cash primarily relates to contractually required cash amounts we maintain for two wholly owned bankruptcy-remote, special purpose corporations.
67
GATX CORPORATION AND SUBSIDIARIES
NOTES TO CONSOLIDATED FINANCIAL STATEMENTS (Continued)
Operating Assets and Facilities
We state operating assets, facilities, and capitalized improvements at cost. We include assets we acquire under capital leases in operating assets, and we record the related obligations as liabilities. We depreciate operating assets and facilities over their estimated useful lives or lease terms to estimated residual values using the straight-line method. We depreciate leasehold improvements over the shorter of their useful lives or the lease term. Our estimated depreciable lives of operating assets and facilities are as follows:
Railcars | 20–42 years |
Locomotives | 10–20 years |
Buildings | 40–50 years |
Leasehold improvements | 5–15 years |
Marine vessels | 30–65 years |
Other equipment | 5–30 years |
We review long-lived assets for impairment whenever circumstances indicate that the carrying amount of those assets may not be recoverable. We evaluate the recoverability of assets to be held and used by comparing the carrying amount of the asset to the undiscounted future net cash flows we expect the asset to generate. If we determine an asset is impaired, we recognize an impairment loss equal to the amount the carrying amount exceeds the asset’s fair value. We classify assets we plan to sell or otherwise dispose of as held for sale, provided they meet specified accounting criteria, and we record those assets at the lower of their carrying amount or fair value less costs to sell.
Lease Classification
We determine the classification of a lease at its inception. If the provisions of the lease subsequently change, other than by renewal or extension, we evaluate whether that change would have resulted in a different lease classification had the change been in effect at inception. If so, the revised agreement is considered a new lease for lease classification purposes. See "Note 5. Leases."
Operating Leases
We offer full-service and net operating leases. We price full-service leases as an integrated service that includes amounts related to executory costs, such as maintenance, insurance, and ad valorem taxes. We do not offer stand-alone maintenance service contracts and are unable to separate executory costs from full-service lease revenue. We recognize operating lease revenue, including amounts related to executory costs, on a straight-line basis over the term of the underlying lease. As a result, we may not recognize lease revenue in the same period as maintenance and other executory costs, which we expense as incurred. See "Note 5. Leases."
Finance Leases
For finance leases, we record a gross lease payment receivable and an estimated residual value, net of unearned income. For sales-type leases, we may also recognize a gain or loss in the period the lease is recorded. Gross lease payment receivables are the rents we expect to receive through the end of the lease term for a leased asset. Estimated residual values are our estimates of value of an asset at the end of a finance lease term. We review our estimates of residual values annually or whenever circumstances indicate that residual values may have declined. Other-than-temporary declines in value are recognized as impairments. Initial unearned income is the amount that the original lease payment receivable and the estimated residual value of the leased asset exceeds the original cost or carrying value of the leased asset. We amortize unearned income to lease revenue using the interest method, which produces a constant yield over the lease term. We also defer the initial direct costs related to our direct finance leases and amortize those costs over the lease term as an adjustment to lease revenue.
We regularly review the finance lease portfolio and classify finance leases as non-performing if it is probable that we will be unable to collect all amounts due under the lease. We generally stop accruing income on non-performing finance leases until all contractual payments are current. We apply payments we receive for non-performing finance leases to the lease payment receivable. See "Note 5. Leases."
68
GATX CORPORATION AND SUBSIDIARIES
NOTES TO CONSOLIDATED FINANCIAL STATEMENTS (Continued)
Inventory
Our inventory consists of railcar and locomotive repair components and marine vessel spare parts. All inventory balances are stated at lower of cost or market. Railcar repair components are valued using the average cost method. Vessel spare parts inventory is valued using the first-in, first-out method. Inventory is included in other assets on the balance sheet.
Loans
We record loans at their principal amount outstanding adjusted for allowances, deferred fees, unamortized premiums or discounts, and accrued interest. We review the loan portfolio regularly and classify a loan as impaired when it is probable that we will be unable to collect all amounts due under the loan agreement. Since most loans are collateralized, we generally measure impairment as the amount the carrying value of the loan exceeds the expected repayments, including any value attributable to underlying collateral. We do not typically recognize interest income on impaired loans until the loan has been paid to contractually current status. We offset loan origination fees by the related direct loan origination costs for a given loan and amortize the net amount of those costs over the term of the loan as an adjustment to interest income. See "Note 6. Loans."
Allowance for Losses
The allowance for losses is our estimate of credit losses associated with reservable assets. Reservable assets are divided into two categories: rent and other receivables, which includes short-term trade billings, and loans and finance lease receivables. We base our loss reserves for rent and other receivables on historical loss experience and judgments about the impact of economic conditions, the state of the markets we operate in, and collateral values, if applicable. In addition, we may establish specific reserves for known troubled accounts. We evaluate reserve estimates for loans and finance lease receivables on a customer-specific basis, considering each customer's particular credit situation. We also consider the factors we use to evaluate rent and other receivables, which are outlined above. We charge amounts against the allowance when we deem them uncollectable. We made no material changes in our estimation methods or assumptions for the allowance during 2015. We believe that the allowance is adequate to cover losses inherent in our reservable assets as of December 31, 2015. Since the allowance is based on judgments and estimates, it is possible that actual losses incurred will differ from the estimate. See "Note 19. Allowance for Losses."
Goodwill
We recognize goodwill when the consideration paid to acquire a business exceeds the fair value of the net assets acquired. We assign goodwill to the same reporting unit as the net assets of the acquired business and we assess our goodwill for impairment on an annual basis in the fourth quarter, or during interim periods if impairment indicators are present. If the carrying amount of the applicable reporting unit exceeds its fair value, we compare the implied fair value of the reporting unit’s goodwill with the carrying amount of goodwill. We record an impairment loss if the carrying amount of goodwill exceeds its implied fair value. The fair values of our reporting units are determined using discounted cash flow models. See "Note 18. Goodwill."
Income Taxes
We calculate provisions for federal, state, and foreign income taxes on our reported income before income taxes. We base our calculations of deferred tax assets and liabilities on the differences between the financial statement and tax bases of assets and liabilities, using enacted rates in effect for the year we expect the differences will reverse. We reflect the cumulative effect of changes in tax rates from those we previously used to determine deferred tax assets and liabilities in the provision for income taxes in the period the change is enacted. Provisions for income taxes in any given period differ from those currently payable or receivable because certain items of income and expense are recognized in different periods for financial reporting purposes than for income tax purposes. We may deduct expenses or defer income attributable to uncertain tax positions for tax purposes, however, we have not recognized a tax benefit in the financial statements for those items. We include our liability for uncertain tax positions in other liabilities on the balance sheet. See "Note 14. Income Taxes."
Derivatives
We use derivatives, such as interest rate swap agreements, Treasury rate locks, options, and currency forwards, to hedge our exposure to interest rate and foreign currency exchange rate risk on existing and anticipated transactions. We formally designate derivatives that
69
GATX CORPORATION AND SUBSIDIARIES
NOTES TO CONSOLIDATED FINANCIAL STATEMENTS (Continued)
meet specific accounting criteria as qualifying hedges at inception. These criteria require us to have the expectation that the derivative will be highly effective at offsetting changes in the fair value or expected cash flows of the hedged exposure, both at the inception of the hedging relationship and on an ongoing basis.
We recognize all derivative instruments at fair value and classify them on the balance sheet as either other assets or other liabilities. We generally base the classification of derivative activity in the statements of comprehensive income and cash flows on the nature of the hedged item. For derivatives we designate as fair value hedges, we recognize changes in the fair value of both the derivative and the hedged item in earnings. For derivatives we designate as cash flow hedges, we record the effective portion of the change in the fair value of the derivative as part of other comprehensive income (loss), and we recognize those changes in earnings in the period the hedged transaction affects earnings. We recognize any ineffective portion of the change in the fair value of the derivative immediately in earnings. Although we do not hold or issue derivative financial instruments for purposes other than hedging, we do not designate certain derivatives as accounting hedges. We recognize changes in the fair value of these derivatives in earnings immediately. We classify gains and losses on derivatives that are not designated as hedges as other expenses, and we include the related cash flows in cash flows from operating activities. See "Note 10. Fair Value Disclosure."
Defined Benefit Pension and Other Post-Retirement Plans
Our balance sheet reflects the funded status of our pension and post-retirement plans, which is the difference between the fair value of the plan assets and the projected benefit obligation. We recognize the aggregate overfunding of any plans in other assets, the aggregate underfunding of any plans in other liabilities, and the corresponding adjustments for unrecognized actuarial gains (losses) and prior service cost (credits) in accumulated other comprehensive income (loss). See "Note 12. Pension and Other Post-Retirement Benefits."
Foreign Currency
We translate the assets and liabilities of our operations that have non-US dollar functional currencies at exchange rates in effect at year-end. Revenue, expenses, and cash flows are translated monthly using average exchange rates. We defer gains and losses resulting from foreign currency translation and record those gains and losses as a separate component of accumulated other comprehensive income (loss). Gains and losses resulting from foreign currency transactions and from the remeasurement of non-functional currency assets and liabilities are recorded net of related hedges in other expense during the periods in which they occur. Net gains (losses) were $1.1 million, $(3.4) million and $2.1 million for 2015, 2014, and 2013.
Environmental Liabilities
We record accruals for environmental remediation costs at sites relating to past or discontinued operations when they are probable and when we can reasonably estimate the expected costs. We record adjustments to initial estimates as necessary. Since these accruals are based on estimates, actual environmental remediation costs may differ. We expense or capitalize environmental remediation costs related to current or future operations as appropriate. See "Note 24. Legal Proceedings and Other Contingencies."
Marine Operating Revenue
We recognize marine operating revenue as we perform shipping services, and we allocate revenue among reporting periods based on the relative transit time in each reporting period for shipments in process.
Other Revenue
We include customer liability repair revenue, fee income, interest on loans, and other miscellaneous revenues in other revenue. We recognize these revenues when earned, which, in the case of management fees we receive from affiliates, is when we perform the related services.
Interest Expense, net
Interest expense is the interest we accrue on indebtedness and the amortization of debt issuance costs and debt discounts and premiums. We defer debt issuance costs and debt discounts and premiums and amortize them over the term of the related debt. We report interest
70
GATX CORPORATION AND SUBSIDIARIES
NOTES TO CONSOLIDATED FINANCIAL STATEMENTS (Continued)
expense net of interest income on bank deposits. Interest income on bank deposits was $1.1 million in 2015, $0.9 million in 2014, and $1.2 million in 2013.
Operating Lease Expense
We classify leases of certain railcars and other assets and facilities, such as maintenance facilities and equipment, as operating leases. We record the lease expense associated with these leases on a straight-line basis. We defer gains and financing costs associated with sale-leasebacks and amortize those gains and costs as a component of operating lease expense over the related leaseback term. We also classify our leases of office facilities and related administrative assets as operating leases, and we record the associated expense in selling, general and administrative expense. See "Note 5. Leases."
Maintenance and Repair Costs
We expense maintenance and repair costs as incurred. We capitalize certain costs incurred in connection with planned major maintenance activities if those activities improve the asset or extend its useful life. We depreciate those capitalized costs over the estimated useful life of the improvement. We capitalize required regulatory survey costs for vessels and amortize those costs over the applicable survey period, which is generally five years.
ASC Expense Seasonality
ASC's sailing season runs from April 1 to December 31 of each year. We defer certain indirect expenses incurred prior to the beginning of the sailing season, such as winter maintenance, insurance, operating lease expense, and depreciation and amortize them ratably over the sailing season.
Share-Based Compensation
We base our measurement of share-based compensation expense on the grant date fair value of an award, and we recognize the expense net of estimated forfeitures over the requisite service period. Forfeiture rates at grant date are initially based on historical experience and are adjusted in subsequent periods if actual experience differs from the estimate. We record a final adjustment when those awards vest. See "Note 13. Share-Based Compensation."
Net Gain on Asset Dispositions
Net gain on disposition includes gains and losses on sales of operating assets and residual sharing income, which we also refer to as asset remarketing income; non-remarketing disposition gains, primarily from scrapping of railcars; and asset impairment losses. We recognize disposition gains, including non-remarketing gains, upon completion of the sale or scrapping of operating assets. Residual sharing income includes fees we receive from the sale of managed assets and assets subject to residual value guarantees, and we recognize these fees upon completion of the underlying transactions.
The following table presents the net gain on asset dispositions for the years ending December 31 (in millions):
2015 | 2014 | 2013 | |||||||||
Disposition gains | $ | 90.3 | $ | 63.1 | $ | 60.0 | |||||
Residual sharing income | 13.4 | 9.4 | 10.8 | ||||||||
Non-remarketing disposition gains | 9.4 | 16.0 | 20.7 | ||||||||
Asset impairment losses (1) | (33.9 | ) | (1.3 | ) | (5.9 | ) | |||||
Net Gain on Asset Dispositions | $ | 79.2 | $ | 87.2 | $ | 85.6 | |||||
__________
(1) See "Note 11. Asset Impairments" for further information about asset impairment losses.
71
GATX CORPORATION AND SUBSIDIARIES
NOTES TO CONSOLIDATED FINANCIAL STATEMENTS (Continued)
Other Income (Expense)
We include fair value adjustments on certain financial instruments, gains and/or losses on foreign currency transactions and remeasurements, legal defense costs and litigation settlements, along with other miscellaneous income and expense items in other income (expense).
NOTE 4. Supplemental Cash Flow Information and Noncash Investing Transactions
2015 | 2014 | 2013 | |||||||||
Supplemental Cash Flow Information (in millions) | |||||||||||
Interest paid (1) | $ | 144.4 | $ | 142.6 | $ | 148.7 | |||||
Income taxes paid, net | 13.3 | 18.7 | 7.4 | ||||||||
________
(1) | Interest paid consisted of interest on debt obligations, interest rate swaps (net of interest received), and capital leases. The interest expense we capitalized as part of the cost of construction of major assets was immaterial for all periods presented. |
2015 | 2014 | 2013 | |||||||||
Noncash Investing Transactions (in millions) | |||||||||||
Capital lease (1) | $ | 17.8 | $ | — | $ | — | |||||
Distributions from affiliates (2) | — | 1.1 | 174.7 | ||||||||
Portfolio proceeds (3) | — | — | 91.1 | ||||||||
________
(1) | In 2015, we acquired all of the rights and obligations of 157 rail cars, classified as a capital lease in the amount of $17.8 million, which included the assumption of a capital lease obligation in the amount of $14.8 million. |
(2) | In 2014, we received distributions of 62 railcars with a fair value of $1.1 million from our Southern Capital Corporation LLC affiliate ("SCC"). In 2013, we received five vessels and related working capital with a fair value of $151.8 million in connection with our disposition of the Singco Gas Pte, Limited ("Singco") and Somargas II Pte Limited ("Somargas") joint ventures. Additionally, we received distributions of 640 railcars with a fair value of $22.9 million from SCC. |
(3) | In 2013 proceeds from the sale of our interest in Ahaus Alstätter Eisenbahn Cargo AG (“AAE”) included receipt of a €67.5 million ($91.1 million) note. |
NOTE 5. Leases
GATX as Lessor
The following table shows the components of our direct finance leases as of December 31 (in millions):
2015 | 2014 | ||||||
Total contractual lease payments receivable | $ | 199.6 | $ | 204.8 | |||
Estimated unguaranteed residual value of leased assets | 58.7 | 68.5 | |||||
Unearned income | (90.7 | ) | (98.6 | ) | |||
Finance leases | $ | 167.6 | $ | 174.7 | |||
Usage rents
We base lease revenue for certain operating leases on equipment usage. Lease revenue from such usage rents was $91.2 million in 2015, $83.9 million in 2014, and $21.3 million in 2013. The increases in 2015 and 2014 were due to higher utilization revenue as a result of the acquisition of approximately 18,500 boxcars in 2014.
72
GATX CORPORATION AND SUBSIDIARIES
NOTES TO CONSOLIDATED FINANCIAL STATEMENTS (Continued)
Initial direct costs
Deferred initial direct costs related to direct financing leases were $0.1 million at December 31, 2015 and $0.3 million, at December 31, 2014.
Future receipts
The following table shows our future contractual receipts from finance leases and noncancelable operating leases as of December 31, 2015 (in millions):
Finance Leases | Operating Leases (1) | Total | |||||||||
2016 | $ | 28.3 | $ | 970.3 | $ | 998.6 | |||||
2017 | 25.9 | 815.1 | 841.0 | ||||||||
2018 | 23.9 | 684.3 | 708.2 | ||||||||
2019 | 22.6 | 568.1 | 590.7 | ||||||||
2020 | 21.1 | 442.6 | 463.7 | ||||||||
Years thereafter | 77.8 | 912.2 | 990.0 | ||||||||
$ | 199.6 | $ | 4,392.6 | $ | 4,592.2 | ||||||
__________
(1) | The future contractual receipts due under our full-service operating leases include executory costs such as maintenance, car taxes, and insurance. |
GATX as Lessee
Capital Lease Assets
The following table shows assets we financed with capital lease obligations as of December 31 (in millions):
2015 | 2014 | ||||||
Railcars | $ | 17.8 | $ | — | |||
Marine vessels | 84.5 | 83.1 | |||||
Less: allowance for depreciation | (79.8 | ) | (75.3 | ) | |||
$ | 22.5 | $ | 7.8 | ||||
Operating Leases
We lease assets that are closely associated with our revenue generating operations. At December 31, 2015 we leased approximately 19,000 railcars at Rail North America and one vessel at ASC. In addition, we lease office facilities and other general purpose equipment. Total operating lease expense, which includes amounts recorded in selling, general and administrative expense, was $91.2 million in 2015, $112.9 million in 2014, and $134.0 million in 2013.
73
GATX CORPORATION AND SUBSIDIARIES
NOTES TO CONSOLIDATED FINANCIAL STATEMENTS (Continued)
Lease Obligations
For some leases, we have the option to renew the leases or purchase the assets at the end of the lease term. The specific terms of the renewal and purchase options vary, and we did not include these amounts in our future contractual rental payments. Additionally, the contractual rental payments do not include amounts we are required to pay for licenses, taxes, insurance, and maintenance. The following table shows our future contractual rental payments due under noncancelable leases as of December 31, 2015 (in millions):
Capital Leases | Recourse Operating Leases | ||||||
2016 | $ | 4.3 | $ | 85.1 | |||
2017 | 2.8 | 91.7 | |||||
2018 | 1.6 | 83.0 | |||||
2019 | 11.5 | 79.8 | |||||
2020 | — | 72.7 | |||||
Years thereafter | — | 244.0 | |||||
$ | 20.2 | $ | 656.3 | ||||
Less: amounts representing interest | (1.8 | ) | |||||
Present value of future contractual capital lease payments | $ | 18.4 | |||||
NOTE 6. Loans
We had total loans receivable of $8.8 million at December 31, 2015 and $97.3 million at December 31, 2014. No loans were impaired at December 31, 2015 or 2014. In 2015, AAE repaid its outstanding loan in the amount of €68.2 million ($77.2 million), including €67.5 million ($76.4 million) of remaining principal and €0.7 million ($0.8 million) of accrued interest.
The following table shows scheduled loan principal payments due by year at December 31, 2015 (in millions):
2016 | $ | 2.0 | |
2017 | 2.0 | ||
2018 | 4.2 | ||
2019 | 0.1 | ||
2020 | 0.1 | ||
Thereafter | 0.4 | ||
$ | 8.8 | ||
NOTE 7. Investments in Affiliated Companies
Investments in affiliated companies represent investments in and loans to domestic and foreign affiliates, and primarily include companies offering lease financing and related services for customers operating rail and marine assets, as well as entities that lease aircraft spare engines. Loan amounts included in investments in affiliated companies were $11.2 million as of December 31, 2015 and $16.3 million as of December 31, 2014.
In 2015, as a result of our decision to exit the majority of our marine investments within our Portfolio Management segment, we recorded a $19.0 million impairment loss and then sold our 50% interest in the Cardinal Marine joint venture. We received aggregate cash proceeds of $24.7 million from this sale.
In 2014, we sold our investments in the Intermodal Investment Fund V and Intermodal Investment Fund VII affiliates. As a result of these sales, we received aggregate cash proceeds of $18.3 million.
74
GATX CORPORATION AND SUBSIDIARIES
NOTES TO CONSOLIDATED FINANCIAL STATEMENTS (Continued)
In 2013, we dissolved our Singco and Somargas marine affiliates, taking direct ownership of five liquefied gas carrying vessels with a fair value of $151.8 million. In connection with the dissolution we paid $101.3 million, primarily to satisfy our share of the affiliates' external debt, and recognized a pretax gain of $2.5 million, which is recorded in share of affiliates' earnings. The vessels continue to operate in a vessel pooling arrangement that our former partner manages.
In 2013, we sold our 37.5% interest in AAE to our partner, Ahaus Alstätter Eisenbahn Holding AG (“AAE Holding”), and recognized a pretax gain of $9.3 million, which we reported as part of our share of affiliates' earnings. The sale price of $114.1 million consisted of a cash payment at closing of $23.0 million and a seller loan of €67.5 million ($91.1 million) at a market interest rate. The loan was paid in full in January 2015.
The following table presents our most significant investments in affiliated companies and our ownership percentage in those companies by segment as of December 31, 2015 (in millions):
Segment | Investment | Percentage Ownership | ||||||
Rolls-Royce & Partners Finance (1) | Portfolio Management | $ | 335.1 | 50.0 | % | |||
Adler Funding LLC | Rail North America | 11.7 | 12.5 | % | ||||
Other affiliates | Various | 1.7 | Various | |||||
Investments in Affiliated Companies | $ | 348.5 | ||||||
__________
(1) Combined investment balances of fifteen separate joint ventures (collectively, the "RRPF affiliates").
The following table shows our share of affiliates’ earnings by segment for the years ending December 31 (in millions):
2015 | 2014 | 2013 | |||||||||
Rail North America | $ | 0.5 | $ | 7.9 | $ | 10.3 | |||||
Rail International | (0.3 | ) | (0.3 | ) | 21.1 | ||||||
Portfolio Management (1) | 45.2 | 60.2 | 60.9 | ||||||||
Share of affiliates' earnings (pretax) | 45.4 | 67.8 | 92.3 | ||||||||
Income taxes | 0.5 | (18.3 | ) | (16.5 | ) | ||||||
Share of Affiliates' Earnings | $ | 45.9 | $ | 49.5 | $ | 75.8 | |||||
__________
(1) Includes a $19.0 million impairment loss in 2015.
75
GATX CORPORATION AND SUBSIDIARIES
NOTES TO CONSOLIDATED FINANCIAL STATEMENTS (Continued)
The following table shows our cash investments in and distributions and loan payments from our affiliates by segment for the years ended December 31 (in millions):
Cash Investments | Cash Distributions (1) | ||||||||||||||||||||||
2015 | 2014 | 2013 | 2015 | 2014 | 2013 | ||||||||||||||||||
Rail North America | $ | — | $ | — | $ | — | $ | 5.1 | $ | 20.0 | $ | — | |||||||||||
Portfolio Management | 15.5 | 15.3 | 101.3 | 32.2 | 34.2 | 47.0 | |||||||||||||||||
$ | 15.5 | $ | 15.3 | $ | 101.3 | $ | 37.3 | $ | 54.2 | $ | 47.0 | ||||||||||||
__________
(1) | Cash distributions exclude proceeds from sales of affiliates of $24.7 million in 2015, $19.4 million in 2014, and $55.6 million in 2013. |
Summarized Financial Data of Affiliates
The following table shows the aggregated operating results for the years ended December 31 for the affiliated companies we held at December 31 (in millions):
2015 | 2014 | 2013 | |||||||||
Revenues | $ | 339.3 | $ | 339.0 | $ | 334.5 | |||||
Gains on sales of assets | 37.6 | 33.7 | 43.5 | ||||||||
Net income | 121.4 | 99.6 | 108.6 | ||||||||
The following table shows aggregated summarized balance sheet data for our affiliated companies as of December 31 (in millions):
2015 | 2014 | ||||||
Current assets | $ | 185.0 | $ | 211.6 | |||
Noncurrent assets | 3,254.1 | 3,195.1 | |||||
Total assets | $ | 3,439.1 | $ | 3,406.7 | |||
Current liabilities | $ | 285.5 | $ | 378.4 | |||
Noncurrent liabilities | 2,512.2 | 2,388.2 | |||||
Shareholders’ equity | 641.4 | 640.1 | |||||
Total liabilities and shareholders' equity | $ | 3,439.1 | $ | 3,406.7 | |||
Summarized Financial Data for the RRPF Affiliates
As noted above, our affiliate investments include 50% interests in each of the RRPF affiliates, a collection of fifteen domestic and foreign joint ventures with Rolls-Royce plc (or affiliates thereof, collectively “Rolls-Royce”), a leading manufacturer of commercial aircraft jet engines. The RRPF affiliates are primarily engaged in two business activities: lease financing of aircraft spare engines to a diverse group of commercial aircraft operators worldwide and lease financing of aircraft spare engines to Rolls-Royce for use in their engine maintenance programs. In aggregate, the RRPF affiliates own 436 aircraft engines at December 31, 2015, of which 224 were on lease to Rolls-Royce. Aircraft engines are generally depreciated over a useful life of 25 years to an estimated residual value. Lease terms vary but typically range from 7 to 10 years. Rolls-Royce manages each of the RRPF affiliates and also performs substantially all required maintenance activities. Our share of affiliates' earnings (after-tax) from the RRPF affiliates was $58.4 million in 2015, $42.2 million in 2014, and $46.5 million in 2013.
76
GATX CORPORATION AND SUBSIDIARIES
NOTES TO CONSOLIDATED FINANCIAL STATEMENTS (Continued)
We derived the following financial information from the combined financial statements of the RRPF affiliates.
The following table shows condensed income statements of the RRPF affiliates for the years ending December 31 (in millions):
2015 | 2014 | 2013 | |||||||||
Lease revenue from third parties | $ | 191.4 | $ | 176.9 | $ | 147.6 | |||||
Lease revenue from Rolls-Royce | 138.7 | 124.7 | 119.7 | ||||||||
Depreciation expense | (166.1 | ) | (140.7 | ) | (120.2 | ) | |||||
Interest expense | (56.7 | ) | (59.5 | ) | (65.8 | ) | |||||
Other expenses | (8.8 | ) | (11.8 | ) | (10.2 | ) | |||||
Gains on sales of assets | 33.1 | 22.7 | 35.2 | ||||||||
Income before income taxes | 131.6 | 112.3 | 106.3 | ||||||||
Income tax benefits (provision) (1) | (9.0 | ) | (17.3 | ) | 0.4 | ||||||
Net income | $ | 122.6 | $ | 95.0 | $ | 106.7 | |||||
_________
(1) | Represents income taxes directly attributable to the RRPF affiliates in the United Kingdom. Several of the RRPF affiliates are flow through entities and income taxes are incurred at the owner level. Amounts shown for 2015 and 2013 include deferred income tax benefits of approximately $15.4 million and $15.2 million, attributable to statutory rate decreases enacted in the United Kingdom. |
The following table shows the condensed balance sheets of the RRPF affiliates as of December 31 (in millions):
2015 | 2014 | ||||||
Current assets | $ | 173.4 | $ | 146.3 | |||
Noncurrent assets, including operating assets, net of accumulated depreciation of $993.6 and $862.8 (a) | 3,161.4 | 2,988.1 | |||||
Total assets | $ | 3,334.8 | $ | 3,134.4 | |||
Current liabilities, excluding debt | $ | 85.1 | $ | 74.4 | |||
Debt obligations | 2,391.1 | 2,295.7 | |||||
Other liabilities | 231.4 | 219.4 | |||||
Shareholders’ equity | 627.2 | 544.9 | |||||
Total liabilities and shareholders' equity | $ | 3,334.8 | $ | 3,134.4 | |||
_________
(a) All operating assets were pledged as collateral for long-term debt obligations.
The following table shows contractual future lease receipts from noncancelable leases of the RRPF affiliates as of December 31, 2015 (in millions):
Rolls-Royce | Third Parties | Total | |||||||||
2016 | $ | 144.1 | $ | 157.7 | $ | 301.8 | |||||
2017 | 122.9 | 147.5 | 270.4 | ||||||||
2018 | 119.0 | 126.9 | 245.9 | ||||||||
2019 | 114.0 | 84.5 | 198.5 | ||||||||
2020 | 93.3 | 72.4 | 165.7 | ||||||||
Thereafter | 239.5 | 247.2 | 486.7 | ||||||||
$ | 832.8 | $ | 836.2 | $ | 1,669.0 | ||||||
77
GATX CORPORATION AND SUBSIDIARIES
NOTES TO CONSOLIDATED FINANCIAL STATEMENTS (Continued)
The following table shows maturities of debt obligations of the RRPF affiliates as of December 31, 2015 (in millions):
2016 | $ | 187.6 | |
2017 | 279.6 | ||
2018 | 134.3 | ||
2019 | 238.2 | ||
2020 | 470.7 | ||
Thereafter | 1,076.7 | ||
Total debt principal (1) | $ | 2,387.1 | |
_________
(1) All debt obligations are nonrecourse to the shareholders.
NOTE 8. Variable Interest Entities
We determined that we are the primary beneficiary of one of our variable interest entities, a structured lease financing of a portfolio of railcars, because we have the power to direct its significant activities. As a result, we consolidate this variable interest entity. The risks associated with it are similar to those of our wholly owned railcar leasing activities.
The following table shows the carrying amounts of assets and liabilities of the consolidated variable interest entity as of December 31 (in millions):
2015 | 2014 | ||||||
Operating assets, net of accumulated depreciation (1) | $ | 83.2 | $ | 88.1 | |||
Nonrecourse debt | 6.9 | 15.9 | |||||
_________
(1) | All operating assets are pledged as collateral on the nonrecourse debt. |
We determined that we are not the primary beneficiary of our other variable interest entities, which are primarily investments in aircraft spare engine leasing affiliates that were financed through a variety of equity investments and third-party lending arrangements. We are not the primary beneficiary of these variable interest entities because we do not have the power to direct the activities that most significantly impact the entities’ economic performance. Rather, that power was shared by the affiliate partners based on the terms of the relevant joint venture agreements, which require approval of all partners for significant decisions regarding the variable interest entity.
The following table shows the carrying amounts and maximum exposure to loss for our unconsolidated variable interest entities as of December 31 (in millions):
2015 | 2014 | ||||||||||||||
Net Carrying Amount | Maximum Exposure to Loss | Net Carrying Amount | Maximum Exposure to Loss | ||||||||||||
Investments in affiliates | $ | 161.2 | $ | 161.2 | $ | 143.9 | $ | 143.9 | |||||||
Other investment | 0.2 | 0.2 | 0.4 | 0.4 | |||||||||||
Total | $ | 161.4 | $ | 161.4 | $ | 144.3 | $ | 144.3 | |||||||
78
GATX CORPORATION AND SUBSIDIARIES
NOTES TO CONSOLIDATED FINANCIAL STATEMENTS (Continued)
NOTE 9. Debt
Commercial Paper and Borrowings Under Bank Credit Facilities ($ in millions)
December 31 | |||||||
2015 | 2014 | ||||||
Balance | $ | 7.4 | $ | 72.1 | |||
Weighted average interest rate | 1.22 | % | 0.56 | % | |||
Recourse and Nonrecourse Debt Obligations
The following table shows the outstanding balances of our debt obligations and the applicable interest rates as of December 31 ($ in millions):
Date of Issue | Final Maturity | Interest Rate | 2015 | 2014 | ||||||||||
Recourse Fixed Rate Debt | ||||||||||||||
Unsecured | 03/03/06 | 03/01/16 | 5.80 | % | $ | 200.0 | $ | 200.0 | ||||||
Unsecured | 11/19/10 | 07/15/16 | 3.50 | % | 250.0 | 250.0 | ||||||||
Unsecured | 09/20/11 | 07/15/16 | 3.50 | % | 100.0 | 100.0 | ||||||||
Unsecured | 03/04/14 | 03/04/17 | 1.25 | % | 300.0 | 300.0 | ||||||||
Unsecured | 02/06/08 | 02/15/18 | 6.00 | % | 200.0 | 200.0 | ||||||||
Unsecured | 03/19/13 | 07/30/18 | 2.38 | % | 250.0 | 250.0 | ||||||||
Unsecured (1) | 12/27/10 | 10/31/18 | 3.84 | % | 10.9 | 15.7 | ||||||||
Unsecured (1) | 11/29/10 | 11/30/18 | 3.70 | % | 8.1 | 12.1 | ||||||||
Unsecured | 01/30/15 | 12/31/18 | 1.20 | % | 54.3 | — | ||||||||
Unsecured | 11/19/13 | 03/15/19 | 2.50 | % | 300.0 | 300.0 | ||||||||
Unsecured | 03/04/14 | 07/30/19 | 2.50 | % | 250.0 | 250.0 | ||||||||
Unsecured | 10/31/14 | 03/30/20 | 2.60 | % | 250.0 | 250.0 | ||||||||
Unsecured | 02/06/15 | 03/30/20 | 2.60 | % | 100.0 | — | ||||||||
Unsecured | 05/27/11 | 06/01/21 | 4.85 | % | 250.0 | 250.0 | ||||||||
Unsecured | 09/20/11 | 06/01/21 | 4.85 | % | 50.0 | 50.0 | ||||||||
Unsecured | 06/11/12 | 06/15/22 | 4.75 | % | 250.0 | 250.0 | ||||||||
Unsecured | 03/19/13 | 03/30/23 | 3.90 | % | 250.0 | 250.0 | ||||||||
Unsecured | 02/06/15 | 03/30/25 | 3.25 | % | 300.0 | — | ||||||||
Unsecured | 03/04/14 | 03/15/44 | 5.20 | % | 300.0 | 300.0 | ||||||||
Unsecured | 02/06/15 | 03/30/45 | 4.50 | % | 250.0 | — | ||||||||
Unsecured | 04/14/05 | 04/15/15 | 5.70 | % | — | 100.0 | ||||||||
Unsecured (2) | 02/05/10 | 05/15/15 | 4.75 | % | — | 250.0 | ||||||||
Unsecured | 12/22/05 | 12/22/15 | 5.75 | % | — | 70.0 | ||||||||
Total recourse fixed rate debt | $ | 3,923.3 | $ | 3,647.8 | ||||||||||
Recourse Floating Rate Debt | ||||||||||||||
Unsecured (1) | 09/02/11 | 08/31/16 | 0.94 | % | $ | 5.2 | $ | 8.0 | ||||||
Unsecured | 12/21/12 | 12/21/17 | 1.64 | % | 100.0 | 100.0 | ||||||||
Unsecured | 01/22/13 | 12/21/17 | 1.64 | % | 10.0 | 10.0 | ||||||||
Unsecured | 08/28/14 | 08/28/24 | 1.71 | % | 100.0 | 100.0 | ||||||||
79
GATX CORPORATION AND SUBSIDIARIES
NOTES TO CONSOLIDATED FINANCIAL STATEMENTS (Continued)
Date of Issue | Final Maturity | Interest Rate | 2015 | 2014 | ||||||||||
Unsecured | 09/23/15 | 09/23/25 | 1.84 | % | 60.0 | — | ||||||||
Unsecured (3) | 12/15/10 | 10/31/15 | 1.43 | % | — | 24.8 | ||||||||
Unsecured (2)(3) | 12/06/11 | 08/31/16 | 1.44 | % | — | 15.3 | ||||||||
Unsecured (2)(3) | 03/29/06 | 09/30/16 | 2.02 | % | — | 18.9 | ||||||||
Unsecured (2)(3) | 06/29/07 | 09/30/16 | 2.03 | % | — | 8.5 | ||||||||
Unsecured (2)(3) | 12/18/07 | 10/31/16 | 1.98 | % | — | 12.7 | ||||||||
Unsecured (2)(3) | 08/31/12 | 12/31/19 | 2.33 | % | — | 60.5 | ||||||||
Unsecured (2)(3) | 06/27/13 | 12/31/20 | 1.73 | % | — | 121.0 | ||||||||
Unsecured (2)(3) | 10/30/13 | 12/31/20 | 1.78 | % | — | 30.2 | ||||||||
Unsecured (2)(3) | 05/05/14 | 12/31/20 | 1.85 | % | — | 30.2 | ||||||||
Total recourse floating rate debt | $ | 275.2 | $ | 540.1 | ||||||||||
Nonrecourse Fixed Rate Debt | ||||||||||||||
Secured (1) | 09/30/97 | 09/20/16 | 6.69 | % | $ | 6.9 | $ | 15.9 | ||||||
Total nonrecourse fixed rate debt | $ | 6.9 | $ | 15.9 | ||||||||||
Total debt principal | $ | 4,205.4 | $ | 4,203.8 | ||||||||||
Unamortized debt discount and debt issuance costs | (28.5 | ) | (26.2 | ) | ||||||||||
Debt adjustment for fair value hedges | 1.5 | 0.6 | ||||||||||||
Total Debt | $ | 4,178.4 | $ | 4,178.2 | ||||||||||
__________
(1) Amount shown includes scheduled principal payments prior to the final maturity.
(2) Debt repaid prior to the final maturity.
(3) For floating rate debt repaid during 2015, the interest rate reflected is as of the final payment date.
The following table shows the scheduled principal payments of our debt obligations as of December 31, 2015 (in millions):
2016 | $ | 564.8 | |
2017 | 412.7 | ||
2018 | 517.9 | ||
2019 | 550.0 | ||
2020 | 350.0 | ||
Thereafter | 1,810.0 | ||
Total debt principal | $ | 4,205.4 | |
At December 31, 2015, $83.2 million of our operating assets were pledged as collateral for certain of our debt obligations.
Shelf Registration Statement
During the third quarter of 2013, we filed an updated shelf registration statement that enables us to issue debt securities and pass-through certificates. The registration statement is effective for three years and does not limit the amount of debt securities and pass-through certificates we can issue.
80
GATX CORPORATION AND SUBSIDIARIES
NOTES TO CONSOLIDATED FINANCIAL STATEMENTS (Continued)
Credit Lines and Facilities
In 2013, we entered into a new $575 million 5-year unsecured revolving credit facility in the US. In 2015, we exercised an option to extend the maturity date of our revolving credit facility by one year, to April 2020. At December 31, 2015, the full $575 million was available under the facility.
Annual commitment fees for GATX's credit facilities were $1.0 million for 2015, $1.0 million for 2014, and $1.3 million for 2013.
Restrictive Covenants
Our $575 million revolving credit facility contains various restrictive covenants, including requirements to maintain a fixed charge coverage ratio and an asset coverage test. Our ratio of earnings to fixed charges, as defined in this facility, was 2.9 for the period ended December 31, 2015, which is in excess of the minimum covenant ratio of 1.2. At December 31, 2015, we were in compliance with all covenants and conditions of the facility. Some of our bank term loans have the same financial covenants as the facility.
As of December 31, 2015, the indentures for our public debt also contain various restrictive covenants, including limitation on liens provisions that limit the amount of additional secured indebtedness that we may incur to $1,320.4 million. Additionally, certain exceptions to the covenants permit us to incur an unlimited amount of purchase money and nonrecourse indebtedness. At December 31, 2015, we were in compliance with all covenants and conditions of the indentures.
The loan agreements for our European rail subsidiaries ( "GATX Rail Europe" or "GRE") also contain restrictive covenants, including leverage and cash flow covenants specific to those subsidiaries, restrictions on making loans, and limitations on the ability of those subsidiaries to repay loans or to distribute capital to certain related parties (including GATX, the US parent company). These covenants effectively limit GRE's ability to transfer funds to us. At December 31, 2015, the maximum amount that GRE could transfer to us without violating its covenants was $121.5 million, therefore implying the loan covenants restrict $374.4 million of subsidiary net assets. At December 31, 2015, GRE was in compliance with all covenants and conditions of these loan agreements.
Another subsidiary’s financing that is guaranteed by us contains various restrictive covenants, including covenants that require us to maintain a defined net worth and a fixed charge coverage ratio. This fixed charge coverage ratio covenant is less restrictive than the covenant in our revolving credit facility.
We do not anticipate any covenant violations nor do we anticipate that any of these covenants will restrict our operations or our ability to obtain additional financing.
81
GATX CORPORATION AND SUBSIDIARIES
NOTES TO CONSOLIDATED FINANCIAL STATEMENTS (Continued)
NOTE 10. Fair Value Disclosure
The following tables show our assets and liabilities that are measured at fair value on a recurring basis (in millions):
Assets | Total December 31 2015 | Quoted Prices in Active Markets for Identical Assets (Level 1) | Significant Observable Inputs (Level 2) | Significant Unobservable Inputs (Level 3) | |||||||||||
Interest rate derivatives (1) | $ | 1.8 | $ | — | $ | 1.8 | $ | — | |||||||
Foreign exchange rate derivatives (1) | 10.2 | — | 10.2 | — | |||||||||||
Foreign exchange rate derivatives (2) | 0.8 | — | 0.8 | — | |||||||||||
Available-for-sale equity securities | 3.3 | 3.3 | — | — | |||||||||||
Liabilities | |||||||||||||||
Interest rate derivatives (1) | 1.2 | — | 1.2 | — | |||||||||||
Foreign exchange rate derivatives (1) | 0.2 | — | 0.2 | — | |||||||||||
Foreign exchange rate derivatives (2) | 2.4 | — | 2.4 | — | |||||||||||
Assets | Total December 31 2014 | Quoted Prices in Active Markets for Identical Assets (Level 1) | Significant Observable Inputs (Level 2) | Significant Unobservable Inputs (Level 3) | |||||||||||
Interest rate derivatives (1) | $ | 1.8 | $ | — | $ | 1.8 | $ | — | |||||||
Foreign exchange rate derivatives (2) | 9.7 | — | 9.7 | — | |||||||||||
Available-for-sale equity securities | 4.4 | 4.4 | — | — | |||||||||||
Liabilities | |||||||||||||||
Interest rate derivatives (1) | 5.9 | — | 5.9 | — | |||||||||||
Foreign exchange rate derivatives (2) | 1.6 | — | 1.6 | — | |||||||||||
_________
(1) | Designated as hedges. |
(2) | Not designated as hedges. |
We base our valuations of available-for-sale equity securities on their quoted prices on an active exchange. We value derivatives using a pricing model with inputs (such as yield curves and foreign currency rates) that are observable in the market or that can be derived principally from observable market data.
In addition, we review long-lived assets, such as operating assets and facilities, for impairment whenever circumstances indicate that the carrying amount of these assets may not be recoverable. We determine the fair value of the respective assets using Level 3 inputs, including estimates of discounted future cash flows (including net proceeds from sale), independent appraisals, and market comparables, as applicable. See "Note 11. Asset Impairments" for further information about our impairment losses. The fair value of assets held at December 31 that were subject to non-recurring Level 3 fair value measurements was $34.0 million and $2.5 million for 2015 and 2014. These amounts are consistent with the fair value of the assets at the time of impairment.
Derivative instruments
Fair Value Hedges
We use interest rate swaps to manage the fixed-to-floating rate mix of our debt obligations by converting the fixed rate debt to floating rate debt. For fair value hedges, we recognize changes in fair value of both the derivative and the hedged item as interest expense. We had eight instruments outstanding with an aggregate notional amount of $550.0 million as of December 31, 2015 that mature from 2017 to 2020 and eight instruments outstanding with an aggregate notional amount of $600.0 million as of December 31, 2014.
82
GATX CORPORATION AND SUBSIDIARIES
NOTES TO CONSOLIDATED FINANCIAL STATEMENTS (Continued)
Cash Flow Hedges
We use interest rate swaps to convert floating rate debt to fixed rate debt. We use Treasury rate locks to hedge our exposure to interest rate risk on anticipated transactions. We also use currency swaps to hedge our exposure to fluctuations in the exchange rates of the foreign currencies in which we conduct business. We had ten instruments outstanding with an aggregate notional amount of $442.9 million as of December 31, 2015 that mature from 2016 to 2022 and seven instruments outstanding with an aggregate notional amount of $281.5 million as of December 31, 2014. Within the next 12 months, we expect to reclassify $5.8 million ($3.6 million after-tax) of net losses on previously terminated derivatives from accumulated other comprehensive income (loss) to interest expense or operating lease expense, as applicable. We reclassify these amounts when interest and operating lease expense on the related hedged transactions affect earnings.
Non-designated Derivatives
We do not hold derivative financial instruments for purposes other than hedging, although certain of our derivatives are not designated as accounting hedges. We recognize changes in the fair value of these derivatives in other (income) expense immediately.
Some of our derivative instruments contain credit risk provisions that could require us to make immediate payment on net liability positions in the event that we default on certain outstanding debt obligations. The aggregate fair value of our derivative instruments with credit risk related contingent features that are in a liability position as of December 31, 2015 was $1.4 million. We are not required to post any collateral on our derivative instruments and do not expect the credit risk provisions to be triggered.
In the event that a counterparty fails to meet the terms of an interest rate swap agreement or a foreign exchange contract, our exposure is limited to the fair value of the swap, if in our favor. We manage the credit risk of counterparties by transacting with institutions that we consider financially sound and by avoiding concentrations of risk with a single counterparty. We believe that the risk of non-performance by any of our counterparties is remote.
The following table shows the impacts of our derivative instruments on our statement of comprehensive income for the years ended December 31 (in millions):
Derivative Designation | Location of Loss (Gain) Recognized | 2015 | 2014 | 2013 | ||||||||||
Fair value hedges (1) | Interest expense | $ | (0.8 | ) | $ | 4.7 | $ | 4.9 | ||||||
Cash flow hedges | Other comprehensive loss (effective portion) | 5.3 | 5.1 | (0.7 | ) | |||||||||
Cash flow hedges | Interest expense (effective portion reclassified from accumulated other comprehensive loss) | 5.6 | 4.9 | 5.1 | ||||||||||
Cash flow hedges | Operating lease expense (effective portion reclassified from accumulated other comprehensive loss) | 0.3 | 3.2 | 1.5 | ||||||||||
Cash flow hedges (2) | Other (income) expense (effective portion reclassified from accumulated other comprehensive loss) | (6.9 | ) | (2.1 | ) | — | ||||||||
Non-designated (3) | Other (income) expense | (6.1 | ) | (11.4 | ) | (0.6 | ) | |||||||
_________
(1) | The fair value adjustments related to the underlying debt equally offset the amounts recognized in interest expense. |
(2) | For 2015 and 2014, includes $6.1 million and $2.1 million of gains on foreign currency derivatives which are substantially offset by losses from foreign currency remeasurement adjustments, also recognized in Other (income) expense. |
(3) | For 2015 and 2014, includes $5.1 million, and $10.4 million of gains on foreign currency derivatives which substantially offset losses from foreign currency remeasurement adjustments on the AAE loan, also recognized in Other (income) expense. |
83
GATX CORPORATION AND SUBSIDIARIES
NOTES TO CONSOLIDATED FINANCIAL STATEMENTS (Continued)
Other Financial Instruments
The carrying amounts of cash and cash equivalents, restricted cash, rent and other receivables, accounts payable, and commercial paper and bank credit facilities approximate fair value due to the short maturity of those instruments. We base the fair values of investment funds, which are accounted for under the cost method, on the best information available, which may include quoted investment fund values. We estimate the fair values of loans and fixed and floating rate debt using discounted cash flow analyses that are based on interest rates currently offered for loans with similar terms to borrowers of similar credit quality. The inputs we use to estimate each of these values are classified in Level 2 of the fair value hierarchy because they are directly or indirectly observable inputs.
The following table shows the carrying amounts and fair values of our other financial instruments as of December 31 (in millions):
2015 | 2015 | 2014 | 2014 | ||||||||||||
Carrying Amount | Fair Value | Carrying Amount | Fair Value | ||||||||||||
Assets | |||||||||||||||
Investment funds | $ | 0.6 | $ | 1.2 | $ | 1.5 | $ | 2.4 | |||||||
Loans | 8.8 | 8.7 | 97.3 | 97.4 | |||||||||||
Liabilities | |||||||||||||||
Recourse fixed rate debt | $ | 3,915.0 | $ | 3,882.6 | $ | 3,639.9 | $ | 3,775.0 | |||||||
Recourse floating rate debt | 275.2 | 264.6 | 540.0 | 540.0 | |||||||||||
Nonrecourse debt | 6.9 | 7.1 | 15.9 | 16.6 | |||||||||||
NOTE 11. Asset Impairments
We recorded impairment losses of $33.9 million, $1.3 million, and $5.9 million for certain of our operating assets in 2015, 2014 and 2013. In addition, an impairment loss of $19.0 million was recorded in 2015 for one of our affiliate investments.
During 2015, GATX management made the decision to exit the majority of our marine investments within the Portfolio Management segment, including six chemical parcel tankers (the "Nordic Vessels"), certain inland marine vessels, and our 50% interest in the Cardinal Marine joint venture. As a result, the Nordic Vessels and the inland marine vessels were classified as held for sale and adjusted to the lower of their respective carrying amounts or fair value less costs to sell. Furthermore, the Cardinal Marine joint venture was evaluated to assess whether an other-than-temporary decline in the value of the investment had occurred. Based on our analysis, an aggregate impairment loss of $49.8 million was recognized. These impairments were driven by our decision to exit these investments and resulted primarily from the associated change in our expected use and holding periods for these assets. The impairment losses on the vessels of $30.8 million were included in net (loss) gains on asset dispositions, and the impairment loss on our Cardinal Marine investment of $19.0 million was included in the share of affiliates' earnings in the consolidated statement of comprehensive income. As of December 31, 2015, we have completed the sales of certain of our marine investments, as well as our 50% interest in the Cardinal Marine joint venture.
In addition to the impairments of marine assets noted above, we also recorded impairment losses of $3.1 million for railcars and other operating assets designated for sale or scrapping in 2015. In 2014 and 2013, impairment losses related to certain railcars and other long-lived assets designated for sale or scrapping. For each year, impairment losses were included in net (loss) gains on asset dispositions in the consolidated statement of comprehensive income. Total assets classified as held for sale at December 31, 2015 were $106.0 million, including $103.4 million of marine investments, all of which we expect to sell in 2016.
NOTE 12. Pension and Other Post-Retirement Benefits
We maintain both funded and unfunded noncontributory defined benefit pension plans covering our domestic employees and the employees of our subsidiaries. We also have a funded noncontributory defined benefit pension plan related to a former business in the United Kingdom that has no active employees. The plans base benefits payable on years of service and/or final average salary. We base our funding policies for the pension plans on actuarially determined cost methods allowable under IRS regulations and statutory requirements in the UK.
In addition to the pension plans, we have other post-retirement plans that provide health care, life insurance, and other benefits for certain retired domestic employees who meet established criteria. Most domestic employees that retire with immediate benefits under our pension plan are eligible for health care and life insurance benefits. The other post-retirement plans are either contributory or noncontributory, depending on various factors.
84
GATX CORPORATION AND SUBSIDIARIES
NOTES TO CONSOLIDATED FINANCIAL STATEMENTS (Continued)
During 2015, we offered an early retirement program for certain eligible employees, effective in 2016. This program provided enhanced benefits to the employees that elected to participate and provided the option for employees to receive their benefits as a lump sum payment or as an annuity. Employees that elected to participate in this program will choose their payment option in 2016. Special termination benefits of $9.0 million resulting from this program were recognized as a one-time charge and recorded as an expense in 2015.
We use a December 31 measurement date for all of our plans. The following tables show pension obligations, plan assets, and other post-retirement obligations as of December 31 (in millions):
2015 Pension Benefits | 2014 Pension Benefits | 2015 Retiree Health and Life | 2014 Retiree Health and Life | ||||||||||||
Change in Benefit Obligation | |||||||||||||||
Benefit obligation at beginning of year | $ | 502.7 | $ | 442.7 | $ | 40.8 | $ | 40.4 | |||||||
Service cost | 7.4 | 5.9 | 0.2 | 0.1 | |||||||||||
Interest cost | 19.6 | 20.7 | 1.3 | 1.6 | |||||||||||
Plan amendments | — | — | (2.5 | ) | — | ||||||||||
Actuarial (gain) loss | (22.6 | ) | 67.0 | (3.6 | ) | 2.6 | |||||||||
Benefits paid | (36.9 | ) | (31.2 | ) | (2.9 | ) | (3.9 | ) | |||||||
Special termination benefits | 7.3 | — | 1.7 | — | |||||||||||
Effect of foreign exchange rate changes | (2.5 | ) | (2.4 | ) | — | — | |||||||||
Benefit obligation at end of year | $ | 475.0 | $ | 502.7 | $ | 35.0 | $ | 40.8 | |||||||
Change in Fair Value of Plan Assets | |||||||||||||||
Plan assets at beginning of year | 456.9 | 447.8 | — | — | |||||||||||
Actual return on plan assets | (4.6 | ) | 40.3 | — | — | ||||||||||
Effect of exchange rate changes | (2.2 | ) | (2.4 | ) | — | — | |||||||||
Company contributions | 2.9 | 2.4 | 2.9 | 3.9 | |||||||||||
Benefits paid | (36.9 | ) | (31.2 | ) | (2.9 | ) | (3.9 | ) | |||||||
Plan assets at end of year | $ | 416.1 | $ | 456.9 | $ | — | $ | — | |||||||
Funded Status at end of year | $ | (58.9 | ) | $ | (45.8 | ) | $ | (35.0 | ) | $ | (40.8 | ) | |||
Amount Recognized | |||||||||||||||
Other Liabilities and Other Assets (net) | $ | (58.9 | ) | $ | (45.8 | ) | $ | (35.0 | ) | $ | (40.8 | ) | |||
Accumulated other comprehensive loss: | |||||||||||||||
Net actuarial loss | 163.3 | 170.9 | (0.2 | ) | 3.3 | ||||||||||
Prior service (credit) cost | (1.1 | ) | (2.1 | ) | (2.0 | ) | 0.4 | ||||||||
Accumulated other comprehensive loss | 162.2 | 168.8 | (2.2 | ) | 3.7 | ||||||||||
Total recognized | $ | 103.3 | $ | 123.0 | $ | (37.2 | ) | $ | (37.1 | ) | |||||
After-tax amount recognized in accumulated other comprehensive loss | $ | 101.3 | $ | 105.4 | $ | (1.4 | ) | $ | 2.3 | ||||||
The aggregate accumulated benefit obligation for the defined benefit pension plans was $449.4 million at December 31, 2015 and $475.8 million at December 31, 2014.
85
GATX CORPORATION AND SUBSIDIARIES
NOTES TO CONSOLIDATED FINANCIAL STATEMENTS (Continued)
The following table shows our pension plans that have a projected benefit obligation in excess of plan assets as of December 31 (in millions):
2015 | 2014 | ||||||
Projected benefit obligations | $ | 438.3 | $ | 502.7 | |||
Fair value of plan assets | 378.6 | 456.9 | |||||
The following table shows our pension plans that have an accumulated benefit obligation in excess of plan assets as of December 31 (in millions):
2015 | 2014 | ||||||
Accumulated benefit obligations | $ | 412.6 | $ | 170.6 | |||
Fair value of plan assets | 378.6 | 140.5 | |||||
The following table shows the components of net periodic cost (benefit) for the year ended December 31 (in millions):
2015 Pension Benefits | 2014 Pension Benefits | 2013 Pension Benefits | 2015 Retiree Health and Life | 2014 Retiree Health and Life | 2013 Retiree Health and Life | ||||||||||||||||||
Service cost | $ | 7.4 | $ | 5.9 | $ | 6.7 | $ | 0.2 | $ | 0.1 | $ | 0.2 | |||||||||||
Interest cost | 19.6 | 20.7 | 18.4 | 1.3 | 1.6 | 1.6 | |||||||||||||||||
Expected return on plan assets | (25.8 | ) | (28.4 | ) | (27.5 | ) | — | — | — | ||||||||||||||
Special termination benefits | 7.3 | — | — | 1.7 | — | — | |||||||||||||||||
Amortization of: | |||||||||||||||||||||||
Unrecognized prior service credit | (1.0 | ) | (1.0 | ) | (1.0 | ) | (0.1 | ) | (0.1 | ) | (0.1 | ) | |||||||||||
Unrecognized net actuarial loss (gain) | 14.8 | 11.3 | 14.9 | (0.2 | ) | (0.1 | ) | — | |||||||||||||||
Net periodic cost | $ | 22.3 | $ | 8.5 | $ | 11.5 | $ | 2.9 | $ | 1.5 | $ | 1.7 | |||||||||||
We amortize the unrecognized prior service credit using a straight-line method over the average remaining service period of the employees we expect to receive benefits under the plan. We amortize the unrecognized net actuarial loss (gain), which is subject to certain averaging conventions, over the average remaining service period of active employees.
The following table shows the amounts we expect to recognize as components of net periodic cost in 2016 from amounts recorded in accumulated comprehensive loss (gain) as of December 31, 2015 (in millions):
2016 | |||||||
Pension Benefits | Retiree Health and Life | ||||||
Unrecognized net actuarial loss (gain) | $ | 10.4 | $ | (0.1 | ) | ||
Unrecognized prior service credit | (1.0 | ) | (0.2 | ) | |||
86
GATX CORPORATION AND SUBSIDIARIES
NOTES TO CONSOLIDATED FINANCIAL STATEMENTS (Continued)
We use the following assumptions to measure the benefit obligation, compute the expected long-term return on assets, and measure the periodic cost for our defined benefit pension plans and other post-retirement benefit plans for the years ended December 31:
2015 | 2014 | ||||
Domestic defined benefit pension plans | |||||
Benefit Obligation at December 31: | |||||
Discount rate — salaried funded and unfunded plans | 4.46 | % | 4.05 | % | |
Discount rate — hourly funded plan | 4.51 | % | 4.10 | % | |
Rate of compensation increases — salaried funded and unfunded plans | 2.50 | % | 2.50 | % | |
Rate of compensation increases — hourly funded plans | N/A | N/A | |||
Net Periodic Cost (Benefit) for the years ended December 31: | |||||
Discount rate — salaried funded and unfunded plans | 4.05 | % | 4.80 | % | |
Discount rate — hourly funded plan | 4.10 | % | 4.90 | % | |
Expected return on plan assets — salaried funded plan | 6.50 | % | 7.60 | % | |
Expected return on plan assets — hourly funded plan | 6.35 | % | 6.90 | % | |
Rate of compensation increases — salaried funded and unfunded plans | 2.50 | % | 3.00 | % | |
Rate of compensation increases — hourly funded plan | N/A | N/A | |||
Foreign defined benefit pension plan | |||||
Benefit Obligation at December 31: | |||||
Discount rate | 3.60 | % | 3.20 | % | |
Rate of pension-in-payment increases | 3.00 | % | 2.90 | % | |
Net Periodic Cost (Benefit) for the years ended December 31: | |||||
Discount rate | 3.20 | % | 4.40 | % | |
Expected return on plan assets | 4.80 | % | 5.40 | % | |
Rate of pension-in-payment increases | 2.90 | % | 3.40 | % | |
Other post-retirement benefit plans | |||||
Benefit Obligation at December 31: | |||||
Discount rate - salaried health | 3.96 | % | 3.65 | % | |
Discount rate - hourly health | 4.11 | % | 3.85 | % | |
Discount rate - salaried life insurance | 4.40 | % | 4.00 | % | |
Discount rate - hourly life insurance | 4.04 | % | 3.70 | % | |
Rate of compensation increases | N/A | N/A | |||
Net Periodic Cost (Benefit) for the years ended December 31: | |||||
Discount rate - salaried health | 3.65 | % | 4.20 | % | |
Discount rate - hourly health | 3.85 | % | 4.60 | % | |
Discount rate - salaried life insurance | 4.00 | % | 4.75 | % | |
Discount rate - hourly life insurance | 3.70 | % | 4.40 | % | |
Rate of compensation increases | N/A | N/A | |||
87
GATX CORPORATION AND SUBSIDIARIES
NOTES TO CONSOLIDATED FINANCIAL STATEMENTS (Continued)
We calculate the present value of expected future pension and post-retirement cash flows as of the measurement date using a discount rate. We base the discount rate on yields for high-quality, long-term bonds with durations similar to that of our projected benefit obligation. We base the expected return on our plan assets on current and expected asset allocations, as well as historical and expected returns on various categories of plan assets. We routinely review our historical returns along with current market conditions to ensure our expected return assumption is reasonable and appropriate.
2015 | 2014 | ||||
Assumed Health Care Cost Trend Rates at December 31 | |||||
Health care cost trend assumed for next year | |||||
Medical claims - pre age 65 | 7.00 | % | 7.50 | % | |
Medical claims - post age 65 | 6.00 | % | 7.50 | % | |
Prescription drugs claims - pre age 65 | 10.00 | % | 7.00 | % | |
Prescription drugs claims - post age 65 | 10.50 | % | 7.00 | % | |
Rate to which the cost trend is expected to decline (the ultimate trend rate) | |||||
Medical claims | 4.50 | % | 5.00 | % | |
Prescription drugs claims | 4.50 | % | 5.00 | % | |
Year that rate reaches the ultimate trend rate | |||||
Medical claims | 2024 | 2023 | |||
Prescription drugs claims | 2024 | 2023 | |||
The health care cost trend, which is based on projected growth rates for medical and prescription drug claims, has a significant effect on our other post-retirement benefit costs and obligations. The following table shows the effects of a one percentage point change in the health care cost trend rate on service and interest costs for the year ended December 31, 2015 and the post-retirement benefit obligation as of December 31, 2015 (in millions) :
One Percentage Point Increase | One Percentage Point Decrease | ||||||
Effect on total of service and interest cost | $ | 0.1 | $ | (0.1 | ) | ||
Effect on post-retirement benefit obligation | 1.5 | (1.3 | ) | ||||
Our investment policies require that asset allocations of domestic and foreign funded pension plans be maintained at certain targets. The following table shows our weighted-average asset allocations of our domestic funded pension plans at December 31, 2015 and 2014, and current target asset allocation for 2016, by asset category:
Plan Assets at December 31 | ||||||||
Target | 2015 | 2014 | ||||||
Asset Category | ||||||||
Equity securities | 52.0 | % | 50.2 | % | 51.7 | % | ||
Debt securities | 44.0 | % | 44.4 | % | 43.9 | % | ||
Real estate | 4.0 | % | 5.4 | % | 4.3 | % | ||
Cash | — | % | — | % | 0.1 | % | ||
100.0 | % | 100.0 | % | 100.0 | % | |||
88
GATX CORPORATION AND SUBSIDIARIES
NOTES TO CONSOLIDATED FINANCIAL STATEMENTS (Continued)
The following table shows the weighted-average asset allocations of our foreign funded pension plan at December 31, 2015 and 2014, and current target asset allocation for 2016, by asset category:
Plan Assets at December 31 | ||||||||
Target | 2015 | 2014 | ||||||
Asset Category | ||||||||
Equity securities | 36.8 | % | 36.8 | % | 37.7 | % | ||
Debt securities | 63.2 | % | 63.2 | % | 62.3 | % | ||
100.0 | % | 100.0 | % | 100.0 | % | |||
The following tables set forth the fair value of our pension plan assets as of December 31 (in millions):
Total December 31 2015 | Quoted Prices in Active Markets for Identical Assets (Level 1) | Significant Observable Inputs (Level 2) | Significant Unobservable Inputs (Level 3) | ||||||||||||
Assets | |||||||||||||||
Short-term investment funds | $ | 1.6 | $ | 1.6 | $ | — | $ | — | |||||||
Common stock | — | ||||||||||||||
US equities | 11.4 | 11.4 | — | — | |||||||||||
International equities | 1.2 | 1.2 | — | — | |||||||||||
Common stock collective funds | 190.4 | — | 190.4 | — | |||||||||||
Fixed income collective trust funds | 160.4 | — | 160.4 | — | |||||||||||
Real estate collective trust funds | 20.2 | — | 20.2 | — | |||||||||||
Loan fund | 30.9 | — | 30.9 | — | |||||||||||
Total | $ | 416.1 | $ | 14.2 | $ | 401.9 | $ | — | |||||||
Total December 31 2014 | Quoted Prices in Active Markets for Identical Assets (Level 1) | Significant Observable Inputs (Level 2) | Significant Unobservable Inputs (Level 3) | ||||||||||||
Assets | |||||||||||||||
Short-term investment funds | $ | 0.9 | $ | 0.9 | $ | — | $ | — | |||||||
Common stock | — | ||||||||||||||
US equities | 13.3 | 13.3 | — | — | |||||||||||
International equities | 1.6 | 1.6 | — | — | |||||||||||
Common stock collective funds | 215.2 | — | 215.2 | — | |||||||||||
Fixed income collective trust funds | 177.8 | — | 177.8 | — | |||||||||||
Real estate collective trust funds | 17.9 | — | 17.9 | — | |||||||||||
Loan fund | 30.2 | — | 30.2 | — | |||||||||||
Total | $ | 456.9 | $ | 15.8 | $ | 441.1 | $ | — | |||||||
89
GATX CORPORATION AND SUBSIDIARIES
NOTES TO CONSOLIDATED FINANCIAL STATEMENTS (Continued)
The following is a description of the valuation techniques and inputs used as of December 31, 2015 and 2014:
Short-term investment funds
We value short-term investment funds based on the closing net asset values quoted by the funds. The net asset values are the unitized fair values of the underlying securities held by the trusts, which are traded in an active market. Short-term investment funds are highly liquid investments in obligations of the US Government or its agencies or instrumentalities, and the related money market instruments. The short-term investment funds have no unfunded commitments, restrictions on redemption frequency, or advance notice periods required for redemption.
Common stock
We value common stock traded in an active market at the last reported sales price on the last business day of the plan year.
Common stock and fixed income collective trust funds
We value common stock and fixed income collective trust funds based on the closing net asset values quoted by the funds. The net asset values are the unitized fair values of the underlying securities held by the trusts, which are traded in an active market. None of the collective trusts have unfunded commitments, restrictions on redemption frequency, or advance notice periods required for redemption. The investment objective of each of the common stock funds is long-term total return through capital appreciation and current income. The fixed income funds are each designed to deliver safety and stability by preserving principal and accumulated earnings.
Real estate collective trust funds
We value real estate collective trust funds based on the net asset values provided by the funds' administrators, which are the unitized fair values of the underlying US commercial real estate investments held by the funds. An independent appraisal determines the fair values of the real estate properties. Redemptions from the real estate funds are available with either 45 or 60 day notice prior to the end of a quarter. A lack of liquidity in the funds may limit or delay redemptions. The investment objective of the real estate funds, which are diversified by location and property type, is long-term return through property appreciation, current income, and timely sales.
Loan fund
The loan fund is a limited liability company (LLC) and is valued using the NAV. The NAV is based on the fair value of the underlying assets owned by the LLC, less its liabilities, multiplied times the ownership interest of the LLC. As of December 31, 2015, the GATX Master Trust held investments in one LLC. Generally, capital may be withdrawn as of the last day of the month upon written notice given on no later than 30 days prior to the withdrawal date. The investment manager may determine in its discretion to allow withdrawals on any such other date. The limited liability company fund seeks to achieve risk-adjusted total returns by buying and selling investments that are anticipated to have a primarily bank loan focus. Investments will be primarily in debt securities of midsize and large capitalizations. The Plan is allocated 100% of the interest that the GATX Corporation Master Trust holds in the LLC. There are no unfunded commitments.
The primary investing objective of the pension plans is to provide benefits to plan participants and their beneficiaries. To achieve this goal, we invest in a diversified portfolio of equities, debt, and real estate investments to maximize return and to keep long-term investment risk at a reasonable level. Equity investments are diversified across US and non-US stocks, growth and value stocks, and small cap and large cap stocks. Debt securities are predominately investments in long-term, investment-grade corporate bonds. Real estate investments include investments in funds that are diversified by location and property type.
On a timely basis, but not less than twice a year, we formally review pension plan investments to ensure we adhere to investment guidelines and our stated investment approach. Our review also evaluates the reasonableness of our investment decisions and risk positions. We compare our investments' performance to indices and peers to determine if investment performance has been acceptable.
In 2016, we expect to contribute approximately $6.4 million to our pension and other post-retirement benefit plans. Additional contributions to the domestic funded pension plans will depend on investment returns on plan assets and actuarial experience.
90
GATX CORPORATION AND SUBSIDIARIES
NOTES TO CONSOLIDATED FINANCIAL STATEMENTS (Continued)
The following table shows benefit payments, which reflect expected future service, as appropriate, we expect the plan to pay (in millions):
Funded Plans | Unfunded Plans | Retiree Health and Life | |||||||||
2016 | $ | 42.9 | $ | 2.5 | $ | 3.9 | |||||
2017 | 27.9 | 2.6 | 3.8 | ||||||||
2018 | 28.1 | 2.6 | 3.3 | ||||||||
2019 | 28.2 | 3.2 | 2.8 | ||||||||
2020 | 28.6 | 3.5 | 2.6 | ||||||||
Years 2021-2025 | 144.5 | 18.3 | 11.6 | ||||||||
$ | 300.2 | $ | 32.7 | $ | 28.0 | ||||||
In addition to our defined benefit plans, we have two 401(k) retirement plans available to substantially all salaried employees and certain other employee groups. We may contribute to the plans as specified by their respective terms and as our board of directors determines. Contributions to our 401(k) retirement plans were $1.9 million for 2015, $1.8 million for 2014, and $1.6 million for 2013.
Multiemployer Plans
Most of the shipboard personnel at ASC participate in various multiemployer benefit plans that provide pension, health care, and post-retirement and other benefits to active and retired employees. Unlike single employer plans, we do not recognize plan assets or obligations for multiemployer plans on our balance sheet. Rather, we recognize our contributions to the plans as marine operating expenses. The amounts we contribute are based on the number of crew hours worked, which depends on the number of vessels deployed and aggregate operating days in a particular year. The risks of participating in these multiemployer plans are different from single employer plans in the following aspects:
• | Assets contributed by one employer may be used to provide benefits to employees of other participating employers; |
• | If a participating employer fails to make its required contributions, any unfunded obligations of the plan may be the responsibility of the remaining participating employers; and |
• | If an employer chooses to stop participating in a multiemployer plan, the plan may require the withdrawing company to make additional contributions. |
The following table shows our contributions to multiemployer benefit plans for the years indicated (in millions):
Multiemployer Plans | EIN and Pension Plan Number | Pension Protection Act Zone Status | GATX Contributions | Collective Bargaining Agreement Expiration Date | ||||||||||||||
2015 | 2014 | 2013 | ||||||||||||||||
American Maritime Officers Pension Plan (1) | 13-1969709-001 | Endangered-Yellow | $ | 1.4 | $ | 1.5 | $ | 1.4 | January 15, 2017 | |||||||||
Other multiemployer post-retirement plans | 6.8 | 7.0 | 6.7 | |||||||||||||||
Total | $ | 8.2 | $ | 8.5 | $ | 8.1 | ||||||||||||
__________________
(1)Our contributions represented more than 5% of the total contributions to the plan during each year and no surcharge was imposed for any year. The actuary for the American Maritime Officers Pension Plan certified that the plan is in endangered status (i.e. “yellow zone” as defined by the Pension Protection Act of 2006) for the plan year beginning October 1, 2013, because it has funding or liquidity problems, or both. A rehabilitation plan, as defined by the Employee Retirement Security Act of 1974, was instituted under which certain adjustable benefits were reduced or eliminated, and we are required to contribute at a negotiated rate per day worked by each employee.
91
GATX CORPORATION AND SUBSIDIARIES
NOTES TO CONSOLIDATED FINANCIAL STATEMENTS (Continued)
NOTE 13. Share-Based Compensation
We provide equity awards to our employees under the GATX Corporation 2012 Incentive Award Plan, including grants of stock appreciation rights, restricted stock units, performance shares and phantom stock awards. As of December 31, 2015, 3.5 million shares were authorized under the 2012 Plan and 1.8 million shares were available for future issuance. We recognize compensation expense for our equity awards in selling, general and administrative expenses over the service period of each award. Share-based compensation expense was $11.6 million for 2015, $14.0 million for 2014, and $13.1 million for 2013, and the related tax benefits were $4.4 million for 2015, $5.3 million for 2014, and $4.9 million for 2013.
Stock Options and Stock Appreciation Rights
Stock options and stock appreciation rights entitle the holder to purchase shares of common stock for periods up to seven years from the grant date. Stock appreciation rights entitle the holder to receive the difference between the market price of our common stock at the time of exercise and the exercise price, either in shares of common stock, cash, or a combination thereof, at our discretion. Stock options entitle the holder to purchase shares of our common stock at a specified exercise price. Since 2006, only stock-settled stock appreciation rights have been awarded. The dividends that accrue on all stock options and stock appreciation rights are paid upon vesting and continue to be paid until the stock options or stock appreciation rights are exercised, canceled, or expire. The exercise price for stock options and stock appreciation rights is equal to the average of the high and low trading prices of our common stock on the date of grant. We recognize compensation expense on a straight-line basis over the vesting period of the award, which is generally three years.
The estimated fair value of a stock appreciation right is the sum of the value we derive using the Black-Scholes option pricing model and the present value of dividends we expect to pay over the expected term of the stock appreciation right. The Black-Scholes valuation incorporates various assumptions, including expected term, expected volatility, and risk free interest rates. We base the expected term on historical exercise patterns and post-vesting terminations, and we base the expected volatility on the historical volatility of our stock price over a period equal to the expected term. We use risk-free interest rates that are based on the implied yield on recently-issued US Treasury zero-coupon bonds with a term comparable to the expected term.
The following table shows the weighted average fair value for our stock appreciation rights and the assumptions we used to estimate fair value:
2015 | 2014 | 2013 | |||||||||
Weighted average estimated fair value | $ | 18.16 | $ | 18.12 | $ | 18.89 | |||||
Quarterly dividend rate | $ | 0.38 | $ | 0.33 | $ | 0.30 | |||||
Expected term of stock appreciation rights, in years | 4.7 | 4.4 | 4.7 | ||||||||
Risk-free interest rate | 1.2 | % | 1.3 | % | 0.7 | % | |||||
Dividend yield | 2.6 | % | 2.3 | % | 2.6 | % | |||||
Expected stock price volatility | 29.2 | % | 30.3 | % | 42.4 | % | |||||
Present value of dividends | $ | 6.90 | $ | 5.76 | $ | 5.60 | |||||
92
GATX CORPORATION AND SUBSIDIARIES
NOTES TO CONSOLIDATED FINANCIAL STATEMENTS (Continued)
The following table shows information about outstanding stock options and stock appreciation rights for the year ended December 31, 2015:
Number of Stock Options and Stock Appreciation Rights (in thousands) | Weighted Average Exercise Price | ||||
Outstanding at beginning of the year | 1,490 | $ | 39.65 | ||
Granted | 342 | 56.91 | |||
Exercised | (231) | 25.96 | |||
Forfeited/Cancelled | (26) | 53.29 | |||
Expired | (1) | 50.02 | |||
Outstanding at end of the year | 1,574 | 45.18 | |||
Vested and exercisable at end of the year | 976 | 38.68 | |||
The following table shows the aggregate intrinsic value of stock options and stock appreciation rights exercised in 2015, 2014, and 2013, and the weighted average remaining contractual term and aggregate intrinsic value of stock appreciation rights outstanding and vested as of December 31, 2015:
Stock Options and Stock Appreciation Rights | Weighted Average Remaining Contractual Term (Years) | Aggregate Intrinsic Value (in millions) | |||
Exercised in 2013 | $ | 6.9 | |||
Exercised in 2014 | 11.8 | ||||
Exercised in 2015 | 6.2 | ||||
Outstanding at December 31, 2015 (a) | 3.7 | 6.3 | |||
Vested and exercisable at December 31, 2015 | 2.7 | 6.3 | |||
__________________
(a) As of December 31, 2015, there are no remaining stock options outstanding.
As of December 31, 2013, all stock options were either exercised, forfeited, or expired. Therefore, no cash was received from employees for exercises of stock options during the year ended December 31, 2015 and December 31, 2014. The total cash we received from employees for exercises of stock options during the years ended December 31, 2013 was $1.2 million. As of December 31, 2015, we had $6.0 million of unrecognized compensation expense related to nonvested stock appreciation rights, which we expect to recognize over a weighted average period of 1.7 years.
Restricted Stock Units and Performance Shares
Restricted stock units entitle the recipient to receive a specified number of restricted shares of common stock upon vesting. Restricted stock units do not carry voting rights and are not transferable prior to the expiration of a specified restriction period, which is generally three years, as determined by the Compensation Committee of the Board of Directors ("Compensation Committee"). We accrue dividends on all restricted stock units and pay those dividends when the awards vest. We recognize compensation expense for these awards over the applicable vesting period.
93
GATX CORPORATION AND SUBSIDIARIES
NOTES TO CONSOLIDATED FINANCIAL STATEMENTS (Continued)
Performance shares are restricted shares that we grant to key employees for achieving certain strategic objectives. The shares convert to common stock at the end of a specified performance period if predetermined performance goals are achieved, as determined by the Compensation Committee. We estimate the number of shares we expect will vest as a result of actual performance against the performance criteria at the time of grant to determine total compensation expense to be recognized. We reevaluate the estimate annually and adjust total compensation expense for any changes to the estimate of the number of shares we expect to vest. We recognize compensation expense for these awards over the applicable vesting period, which is generally three years. The performance shares granted in 2014 include an option to settle shares earned in cash upon vesting.
We value our restricted stock units and performance share awards using the average of the high and low values of our common stock on the grant date of the awards. As of December 31, 2015, there was $6.3 million of unrecognized compensation expense related to these awards, which we expect to be recognized over a weighted average period of 2.1 years.
The following table shows information about restricted stock units and performance shares for the year ended December 31, 2015:
Number of Share Units Outstanding | Weighted Average Grant-Date Fair Value | |||||
Restricted Stock Units: | ||||||
Nonvested at beginning of the year | 177,210 | $ | 48.90 | |||
Granted | 68,710 | 56.73 | ||||
Vested | (63,748 | ) | 44.92 | |||
Forfeited | (10,232 | ) | 54.33 | |||
Nonvested at end of the year | 171,940 | 53.18 | ||||
Performance Shares: | ||||||
Nonvested at beginning of the year | 175,069 | $ | 48.95 | |||
Granted | 61,740 | 55.54 | ||||
Net (decrease) due to estimated performance | (22,578 | ) | 54.39 | |||
Vested | (92,991 | ) | 45.01 | |||
Nonvested at end of the year | 121,240 | 54.32 | ||||
The total fair value of restricted stock units and performance shares that vested during the year was $7.2 million in 2015, $6.6 million in 2014, and $7.5 million in 2013.
Phantom Stock Awards
We grant phantom stock awards to non-employee directors as a component of their compensation for service on our board of directors. In accordance with the terms of the phantom stock awards, each director is credited with a quantity of units that equate to, but are not, common shares. Phantom stock awards are dividend participating, and all dividends are reinvested in additional phantom shares at the average of the high and low trading prices of our stock on the dividend payment date. At the expiration of each director’s service on the board of directors, or in accordance with his or her deferral election, whole units of phantom stock will be settled with shares of common stock and fractional units will be paid in cash. In 2015, we granted 23,431 units of phantom stock and there were 166,021 units outstanding as of December 31, 2015.
NOTE 14. Income Taxes
Deferred income taxes are the net tax effects of temporary differences between the carrying amounts of assets and liabilities for financial reporting purposes and the amounts used for income tax purposes. We have not recognized deferred US income taxes on the undistributed earnings of foreign subsidiaries and affiliates that we intend to permanently reinvest in foreign operations. The cumulative amount of such earnings was $847.7 million at December 31, 2015. The ultimate tax cost of repatriating these earnings depends on tax laws in effect and other circumstances at the time of distribution.
94
GATX CORPORATION AND SUBSIDIARIES
NOTES TO CONSOLIDATED FINANCIAL STATEMENTS (Continued)
The following table shows the significant components of our deferred tax liabilities and assets as of December 31 (in millions):
2015 | 2014 | ||||||
Deferred Tax Liabilities | |||||||
Book/tax basis difference due to depreciation | $ | 1,058.1 | $ | 963.8 | |||
Investments in affiliated companies | 72.9 | 99.7 | |||||
Lease accounting | 7.3 | 10.5 | |||||
Other | — | 0.1 | |||||
Total deferred tax liabilities | 1,138.3 | 1,074.1 | |||||
Deferred Tax Assets | |||||||
Federal net operating loss | 13.2 | 41.8 | |||||
Alternative minimum tax credit | 14.8 | 9.2 | |||||
Foreign tax credit | 5.8 | 3.6 | |||||
Valuation allowance on foreign tax credit | (5.8 | ) | (3.6 | ) | |||
State net operating loss | 27.7 | 28.7 | |||||
Valuation allowance on state net operating loss | (12.6 | ) | (11.3 | ) | |||
Foreign net operating loss | 3.6 | 5.8 | |||||
Valuation allowance on foreign net operating loss | (0.3 | ) | (0.2 | ) | |||
Accruals not currently deductible for tax purposes | 22.2 | 18.7 | |||||
Allowance for losses | 3.2 | 1.7 | |||||
Pension and post-retirement benefits | 35.8 | 32.6 | |||||
Other | 12.4 | 9.8 | |||||
Total deferred tax assets | 120.0 | 136.8 | |||||
Net deferred tax liabilities | $ | 1,018.3 | $ | 937.3 | |||
At December 31, 2015, we have a US federal tax net operating loss carryforward of $37.7 million that will start expiring in 2033. We also have an alternative minimum tax credit of $14.8 million that has an unlimited carryforward period.
At December 31, 2015, we have foreign tax credits of $5.8 million that are scheduled to expire beginning in 2016. We have recorded a $5.8 million valuation allowance related to these credits, as we believe it is more likely than not that we will be unable to utilize them. We also have state net operating losses of $27.7 million, net of federal benefits that are scheduled to expire at various times beginning in 2016. We have recorded a $12.6 million valuation allowance related to state net operating losses, as we believe it is more likely than not that we will be unable to use all of these losses. Additionally, we have foreign net operating losses, net of valuation allowances, of $3.3 million which have unlimited carryforward periods. Our use of future tax credits and net operating losses depends on a number of variables, including the amount of taxable income, foreign source income attributes, and state apportionment factors.
The following table shows a reconciliation of the beginning and ending amount of our gross liability for unrecognized tax benefits (in millions)
2015 | 2014 | ||||||
Beginning balance | $ | 5.6 | $ | 5.7 | |||
Reductions due to settlement of tax audit issues | — | (0.4 | ) | ||||
Additions to tax positions for prior years | 0.1 | 0.3 | |||||
Ending balance | $ | 5.7 | $ | 5.6 | |||
At December 31, 2015, our gross liability for unrecognized tax benefits was $5.7 million, of which $3.8 million, if recognized, would favorably impact income tax expense. During the year ended December 31, 2015, we added an additional $0.1 million gross state tax liability. During the year ended December 31, 2014, we settled a tax audit recognizing a tax benefit of $0.4 million. Additionally, in 2014,
95
GATX CORPORATION AND SUBSIDIARIES
NOTES TO CONSOLIDATED FINANCIAL STATEMENTS (Continued)
we added a gross state tax liability of $0.3 million (net tax expense impact of $0.2 million). We recognize interest and penalties related to unrecognized tax benefits as income tax expense. We have not accrued any amounts for penalties. To the extent interest is not assessed or is otherwise reduced with respect to uncertain tax positions, we will record any required adjustment as a reduction of income tax expense.
We file one consolidated federal income tax return with our domestic subsidiaries in the US jurisdiction, as well as tax returns in various state and foreign jurisdictions. As of December 31, 2015, all audits or statute of limitations with respect to our federal tax returns for years prior to 2012 have been closed or expired. However, GATX and our subsidiaries are undergoing audits in various state jurisdictions.
The following table shows the components of income before income taxes, excluding affiliates, for the years ending December 31 (in millions):
2015 | 2014 | 2013 | |||||||||
Domestic | $ | 174.7 | $ | 137.9 | $ | 66.0 | |||||
Foreign | 95.6 | 93.3 | 93.0 | ||||||||
$ | 270.3 | $ | 231.2 | $ | 159.0 | ||||||
The following table shows income taxes, excluding domestic and foreign joint ventures, for the years ending December 31 (in millions):
2015 | 2014 | 2013 | |||||||||
Current | |||||||||||
Domestic: | |||||||||||
Federal | $ | 5.6 | $ | 0.7 | $ | 1.4 | |||||
State and local | (0.2 | ) | 0.6 | — | |||||||
5.4 | 1.3 | 1.4 | |||||||||
Foreign | 15.3 | 13.0 | 10.5 | ||||||||
20.7 | 14.3 | 11.9 | |||||||||
Deferred | |||||||||||
Domestic: | |||||||||||
Federal | 44.7 | 45.0 | 36.6 | ||||||||
State and local | 33.7 | 5.6 | 5.3 | ||||||||
78.4 | 50.6 | 41.9 | |||||||||
Foreign | 11.8 | 10.8 | 11.7 | ||||||||
90.2 | 61.4 | 53.6 | |||||||||
Income taxes | $ | 110.9 | $ | 75.7 | $ | 65.5 | |||||
96
GATX CORPORATION AND SUBSIDIARIES
NOTES TO CONSOLIDATED FINANCIAL STATEMENTS (Continued)
The following table shows the differences between our effective income tax rate and the federal statutory income tax rate for the years ending December 31 (in millions):
2015 | 2014 | 2013 | |||||||||
Income taxes at federal statutory rate | $ | 94.6 | $ | 80.9 | $ | 55.6 | |||||
Adjust for effect of: | |||||||||||
GATX income taxes on sale of AAE | — | — | 23.2 | ||||||||
Foreign tax credits | — | — | (3.9 | ) | |||||||
Foreign earnings taxed at lower rates | (6.2 | ) | (8.5 | ) | (10.3 | ) | |||||
Tax effect of foreign dividends | 0.9 | — | — | ||||||||
Corporate owned life insurance | (0.9 | ) | (0.6 | ) | (0.5 | ) | |||||
State income taxes | 7.6 | 4.1 | 1.5 | ||||||||
State deferred tax rate change impact | 14.1 | — | — | ||||||||
Other | 0.8 | (0.2 | ) | (0.1 | ) | ||||||
Income taxes | $ | 110.9 | $ | 75.7 | $ | 65.5 | |||||
Effective income tax rate | 41.0 | % | 32.7 | % | 41.2 | % | |||||
In 2015, our effective tax rate was 41.0% compared to 32.7% in 2014 and 41.2% in 2013. The current year effective tax rate reflects incremental deferred state income taxes of $14.1 million associated with a change in our consolidated effective state tax rate. Specifically, the sale of our marine assets in our Portfolio Management segment will have a negative impact on our allocation factors that will increase our overall effective state income tax rates in future years. Additionally, the rate in 2015 reflects a higher contribution from domestic source income, which is taxed at a higher rate, as well as the impact of an increase in the statutory tax rate in Alberta, Canada. In 2013, we recognized US and state income taxes of $23.2 million on the sale of our investment in AAE. Additionally, we realized foreign tax credit carry forwards of $3.9 million.
The adjustment for foreign earnings in each year reflects the impact of lower tax rates on income earned at our foreign subsidiaries. State income taxes are recognized on domestic pretax income or loss. The amount of our domestic income subject to state taxes relative to our total worldwide income impacts the effect state income tax has on our overall income tax rate.
Separately, our affiliates incurred a tax benefit of $0.5 million in 2015, and income taxes of $18.3 million in 2014, and $16.5 million in 2013. The 2015 and 2013 amounts were favorably impacted by tax benefits of $7.7 million and $7.6 million respectively, as a result of income tax rate reductions enacted in the United Kingdom.
NOTE 15. Concentrations
Concentration of Revenues
We derived revenue from a wide range of industries and companies. In 2015, we generated approximately 30% of our total revenues from customers in the petroleum industry, 18% from the chemical industry, 15% from the transportation industry, 9% from the mining, minerals and aggregates industry, and 7% from the food/agriculture industries. Our foreign identifiable revenues were primarily derived in Germany, Canada, Poland, Mexico, and Austria.
Concentration of Credit Risk
We did not have revenue concentrations greater than 10% from any particular customer for the years ended December 31, 2015, 2014, and 2013. Under our lease agreements with customers, we typically retain legal ownership of the assets unless such assets have been financed by sale-leasebacks. We perform a credit evaluation prior to approval of a lease contract. Subsequently, we monitor the creditworthiness of the customer and the value of the collateral on an ongoing basis. We maintain an allowance for losses to provide for credit losses inherent in our reservable assets portfolio.
97
GATX CORPORATION AND SUBSIDIARIES
NOTES TO CONSOLIDATED FINANCIAL STATEMENTS (Continued)
Concentration of Labor Force
As of December 31, 2015, collective bargaining agreements covered approximately 42% of our employees, of which agreements covering 22% of employees will expire within the next year. The hourly employees at our US service centers are represented by the United Steelworkers. Employees at three of Rail North America's Canadian service centers are represented by Unifor, the union formerly known as the Communication, Energy and Paperworkers Union of Canada, and Employee Shop Committee of Riviere-des-Prairies. The unlicensed shipboard personnel on twelve of the ASC vessels in operation during 2015 are represented by the Seafarers International Union. Licensed personnel on ASC’s vessels, other than captains, are represented by the American Maritime Officers. Certain employees of GATX Rail Europe are represented by one union in Germany and three unions in Poland.
NOTE 16. Commercial Commitments
We have entered into various commercial commitments, such as guarantees and standby letters of credit, related to certain transactions. These commercial commitments require us to fulfill specific obligations in the event of third-party demands. Similar to our balance sheet investments, these commitments expose us to credit, market, and equipment risk. Accordingly, we evaluate these commitments and other contingent obligations using techniques similar to those we use to evaluate funded transactions.
The following table shows our commercial commitments as of December 31 (in millions):
2015 | 2014 | ||||||
Lease payment guarantees | $ | 22.1 | $ | 28.5 | |||
Standby letters of credit and performance bonds | 8.9 | 9.1 | |||||
Total commercial commitments (1) | $ | 31.0 | $ | 37.6 | |||
__________________
(1) | The carrying value of liabilities on the balance sheet for commercial commitments was $4.1 million at December 31, 2015 and $5.1 million at December 31, 2014. The expirations of these commitments range from 2017 to 2023. We are not aware of any event that would require us to satisfy any of our commitments. |
Lease payment guarantees are commitments to financial institutions to make lease payments for a third party in the event they default. We reduce any liability that may result from these guarantees by the value of the underlying asset or group of assets.
We are also parties to standby letters of credit and performance bonds, which primarily relate to contractual obligations and general liability insurance coverages. No material claims have been made against these obligations, and no material losses are anticipated.
NOTE 17. Earnings per Share
We compute basic earnings per share by dividing net income available to our common shareholders by the weighted average number of shares of our common stock outstanding. We appropriately weighted shares issued or reacquired during the year for the portion of the year that they were outstanding. Our diluted earnings per share reflect the impacts of our potentially dilutive securities, which include our equity compensation awards.
98
GATX CORPORATION AND SUBSIDIARIES
NOTES TO CONSOLIDATED FINANCIAL STATEMENTS
The following table shows the computation of our basic and diluted net income per common share for the years ending December 31 (in millions, except per share amounts):
2015 | 2014 | 2013 | |||||||||
Numerator: | |||||||||||
Net income | $ | 205.3 | $ | 205.0 | $ | 169.3 | |||||
Denominator: | |||||||||||
Weighted average shares outstanding - basic | 43.1 | 45.0 | 46.4 | ||||||||
Effect of dilutive securities: | |||||||||||
Equity compensation plans | 0.7 | 0.8 | 0.7 | ||||||||
Weighted average shares outstanding - diluted | 43.8 | 45.8 | 47.1 | ||||||||
Basic earnings per share | $ | 4.76 | $ | 4.55 | $ | 3.64 | |||||
Diluted earnings per share | $ | 4.69 | $ | 4.48 | $ | 3.59 | |||||
NOTE 18. Goodwill
Our goodwill, all of which pertains to Rail North America and Rail International, was $79.7 million as of December 31, 2015 and $86.1 million as of December 31, 2014. In the fourth quarter of 2015, we performed a review for impairment of goodwill, and concluded that goodwill was not impaired. For 2015 and 2014, changes in the carrying amount of our goodwill resulted from changes in foreign currency exchange rates.
NOTE 19. Allowance for Losses
The following table shows changes in the allowance for losses at December 31 (in millions):
2015 | 2014 | ||||||
Beginning balance | $ | 5.7 | $ | 5.2 | |||
Provision for losses | 6.6 | 0.8 | |||||
Charges to allowance | (1.9 | ) | (0.3 | ) | |||
Recoveries and other, including foreign exchange adjustments | (0.1 | ) | — | ||||
Ending balance | $ | 10.3 | $ | 5.7 | |||
The allowance for losses is comprised of a general allowance for trade receivables and specific allowances for finance leases. As of December 31, 2015, the general allowance for trade receivables was $6.3 million, or 9.1% of rent and other receivables, compared to $4.5 million, or 5.2% of rent and other receivables, at December 31, 2014. At December 31, 2015, specific allowances for finance leases were $4.0 million compared to $1.2 million at December 2014. The specific allowance increase in 2015 was related to a loss reserve recorded in connection with one investment at Portfolio Management.
99
GATX CORPORATION AND SUBSIDIARIES
NOTES TO CONSOLIDATED FINANCIAL STATEMENTS
NOTE 20. Other Assets and Other Liabilities
The following table shows the components of other assets reported on our balance sheets as of December 31 (in millions):
2015 | 2014 | ||||||
Inventory | $ | 55.2 | $ | 52.0 | |||
Office furniture, fixtures and other equipment, net of accumulated depreciation | 31.8 | 34.1 | |||||
Derivatives | 12.7 | 11.5 | |||||
Deferred financing costs | 3.4 | 4.0 | |||||
Assets held for sale | 106.0 | 7.0 | |||||
Other investments | 4.2 | 6.0 | |||||
Prepaid items | 14.3 | 12.4 | |||||
Prepaid pension | 0.7 | — | |||||
Other | 84.1 | 84.4 | |||||
$ | 312.4 | $ | 211.4 | ||||
Assets held for sale increased at December 31, 2015 as a result of management's decision to exit the majority of our marine investments within the Portfolio Management segment. For additional information, see "Note 11. Asset Impairments."
The following table shows the components of other liabilities reported on our balance sheets as of December 31 (in millions):
2015 | 2014 | ||||||
Accrued operating lease expense | $ | 19.3 | $ | 43.4 | |||
Accrued pension and other post-retirement benefits | 94.6 | 86.6 | |||||
Deferred gains on sale-leasebacks | 44.8 | 49.0 | |||||
Unrecognized tax benefits | 3.8 | 3.6 | |||||
Environmental accruals | 13.2 | 13.8 | |||||
Deferred income | 7.7 | 5.6 | |||||
Derivatives | 3.7 | 7.5 | |||||
Other | 33.5 | 36.6 | |||||
$ | 220.6 | $ | 246.1 | ||||
Accrued operating lease expense decreased at December 31, 2015 as a result of the purchase of railcars previously on operating leases during the year.
NOTE 21. Shareholders’ Equity
In 2015, we purchased 2.4 million shares of common stock for $125.4 million, which completed our $250 million repurchase program authorized in 2014. In 2014, we purchased 1.9 million shares of common stock for $124.6 million. In 2013, we purchased 1.4 million shares of common stock for $68.6 million, which completed our $200 million repurchase authorization approved in 2008. Subsequent to December 31, 2015, our board of directors authorized a new $300 million stock repurchase program. The timing of share repurchases will be dependent on market conditions and other factors.
In accordance with our certificate of incorporation, 120 million shares of common stock are authorized, at a par value of $0.625 per share. As of December 31, 2015, 66.8 million shares were issued and 42.0 million shares were outstanding.
100
GATX CORPORATION AND SUBSIDIARIES
NOTES TO CONSOLIDATED FINANCIAL STATEMENTS (Continued)
The following shares of common stock were reserved as of December 31, 2015 (in millions):
GATX Corporation 2004 Equity Incentive Compensation Plan | 2.3 | |
GATX Corporation 2012 Incentive Award Plan | 3.5 | |
5.8 | ||
Our certificate of incorporation also authorizes five million shares of preferred stock at a par value of $1.00 per share. As of December 31, 2015 and December 31, 2014, we have no outstanding shares of preferred stock. In 2013, we either converted or redeemed all 15,567 outstanding shares of our $2.50 cumulative convertible preferred stock.
NOTE 22. Accumulated Other Comprehensive Income (Loss)
The following table shows the change in components for accumulated other comprehensive loss (in millions):
Foreign Currency Translation Gain (Loss) | Unrealized Gain (Loss) on Securities | Unrealized Loss on Derivative Instruments | Post-Retirement Benefit Plans | Total | |||||||||||||||
Balance at December 31, 2012 | $ | 31.4 | $ | (0.4 | ) | $ | (44.5 | ) | $ | (131.1 | ) | $ | (144.6 | ) | |||||
Change in component | 25.8 | 1.4 | 22.3 | 71.0 | 120.5 | ||||||||||||||
Reclassification adjustments into earnings | — | — | 6.6 | 13.8 | 20.4 | ||||||||||||||
Income tax effect | — | (0.6 | ) | (6.5 | ) | (31.9 | ) | (39.0 | ) | ||||||||||
Balance at December 31, 2013 | 57.2 | 0.4 | (22.1 | ) | (78.2 | ) | (42.7 | ) | |||||||||||
Change in component | (79.1 | ) | (0.2 | ) | 0.3 | (57.3 | ) | (136.3 | ) | ||||||||||
Reclassification adjustments into earnings | — | — | 6.0 | 10.1 | 16.1 | ||||||||||||||
Income tax effect | — | 0.1 | (3.3 | ) | 17.7 | 14.5 | |||||||||||||
Balance at December 31, 2014 | (21.9 | ) | 0.3 | (19.1 | ) | (107.7 | ) | (148.4 | ) | ||||||||||
Change in component | (55.8 | ) | (1.0 | ) | 1.6 | (0.9 | ) | (56.1 | ) | ||||||||||
Reclassification adjustments into earnings | — | — | (1.0 | ) | 13.5 | 12.5 | |||||||||||||
Income tax effect | — | 0.4 | (2.4 | ) | (4.8 | ) | (6.8 | ) | |||||||||||
Balance at December 31, 2015 | $ | (77.7 | ) | $ | (0.3 | ) | $ | (20.9 | ) | $ | (99.9 | ) | $ | (198.8 | ) | ||||
________
See "Note 10. Fair Value Disclosure" and "Note 12. Pension and Other Post-Retirement Benefits" for impacts of the reclassification adjustments on the statement of comprehensive income.
NOTE 23. Foreign Operations
For the years ended December 31, 2015, 2014, and 2013, we did not derive revenues in excess of 10% of our consolidated revenues from any one foreign country. Additionally, at December 31, 2015 and 2014, we did not have more than 10% of our identifiable assets in any one foreign country.
101
GATX CORPORATION AND SUBSIDIARIES
NOTES TO CONSOLIDATED FINANCIAL STATEMENTS
The following table shows our domestic and foreign revenues and identifiable assets for the years ended or as of December 31 (in millions):
2015 | 2014 | 2013 | |||||||||
Revenues | |||||||||||
Foreign | $ | 329.4 | $ | 346.2 | $ | 332.1 | |||||
United States | 1,120.5 | 1,104.8 | 988.9 | ||||||||
$ | 1,449.9 | $ | 1,451.0 | $ | 1,321.0 | ||||||
Identifiable Assets | |||||||||||
Foreign | $ | 1,992.3 | $ | 2,133.3 | $ | 2,199.2 | |||||
United States | 4,901.9 | 4,786.6 | 4,336.3 | ||||||||
$ | 6,894.2 | $ | 6,919.9 | $ | 6,535.5 | ||||||
NOTE 24. Legal Proceedings and Other Contingencies
Various legal actions, claims, assessments and other contingencies arising in the ordinary course of business are pending against GATX and certain of our subsidiaries. These matters are subject to many uncertainties, and it is possible that some of these matters could ultimately be decided, resolved or settled adversely.
Viareggio Derailment
In June 2009, a train consisting of fourteen liquefied petroleum gas (“LPG”) tank cars owned by GATX Rail Austria GmbH (an indirect subsidiary of the Company, "GATX Rail Austria") and its subsidiaries derailed while passing through the City of Viareggio, in the province of Lucca, Italy. Five tank cars overturned and one of the overturned cars was punctured by a peg or obstacle along the side of the track, resulting in a release of LPG, which subsequently ignited. Thirty-two people died and others were injured in the fire, which also resulted in property damage. The LPG tank cars were leased to FS Logistica S.p.A., a subsidiary of the Italian state-owned railway, Ferrovie dello Stato S.p.A (the “Italian Railway”).
On December 14, 2012, the Public Prosecutors of Lucca ("Public Prosecutors") formally charged GATX Rail Austria and two of its subsidiaries (collectively, "GRA"), as well as ten maintenance and supervisory employees (the "Employees"), with various negligence-based crimes related to the accident, all of which are punishable under Italian law by incarceration, damages, and fines. Similar charges were brought against four Italian Railway companies and eighteen of their employees, among others. The Public Prosecutors assert that the axle on a tank car broke, causing the derailment and resulting in a tank rupture and release of LPG, after the car hit an obstacle placed on the side of the track by the Italian Railway. The Public Prosecutors further allege that a crack in the axle was detectable at the time of final inspection but was overlooked by the Employees at the Jungenthal Waggon GmbH workshop (a subsidiary of GATX Rail Austria). The trial in the Court of Lucca (the “Lucca Trial”) commenced on November 13, 2013.
With respect to civil claims, GRA’s insurers continue to work cooperatively with the insurer for the Italian Railway to adjust and settle personal injury and property damage claims. These joint settlement efforts have so far settled most of the significant civil claims related to the accident; however, approximately 80 civil claimants did not settle and are currently parties to the Lucca Trial. The Court of Lucca will determine both the civil and criminal liability of the defendants in the one proceeding. GRA expects that its insurers will cover any civil damages if awarded to the claimants in the Lucca trial. The Public Prosecutors and civil claimants have finished presenting their cases in the Lucca Trial. GRA, the Italian Railway, and the other defendants in the Lucca Trial began presenting the defense of their cases on September 16, 2015, which presentations are currently underway.
Since May 2012, one of the excess insurers providing coverage, Liberty Mutual Insurance Europe Limited (“Liberty”), settled civil claims but refused to reimburse GRA for its ongoing legal defense fees and costs, taking a position contrary to our other insurers in the prior underlying layers that had provided coverage for such expenses. As of December 31, 2015, GRA had incurred approximately $12.2 million in unreimbursed defense fees and costs, and GRA continues to incur costs in connection with the Lucca Trial. Consequently, in October 2013, GRA filed an arbitration proceeding against Liberty seeking to recoup its unreimbursed defense fees and costs (the “Liberty Arbitration”), which was heard in November 2015. GRA received a partial arbitration award in its favor and anticipates reimbursement
102
GATX CORPORATION AND SUBSIDIARIES
NOTES TO CONSOLIDATED FINANCIAL STATEMENTS (Continued)
of a portion its defense costs in relation to the Lucca Trial. GRA is currently negotiating issues of reimbursement for outstanding defense costs with the insurers in the current coverage layer, which also includes a 25% share held by Liberty.
While GRA believes that it and its Employees acted diligently and properly, we cannot predict the outcome of the negotiations with our insurers, the Lucca Trial, or what other legal proceedings or claims, if any, may be initiated against GRA or its personnel, and, therefore, cannot reasonably estimate the possible amount or range of loss that may ultimately be incurred in connection with this accident.
Other Litigation
GATX and its subsidiaries have been named as defendants in various other legal actions and claims, governmental proceedings, and private civil suits arising in the ordinary course of business, including environmental matters, workers’ compensation claims, and other personal injury claims. Some of these proceedings include claims for punitive as well as compensatory damages.
Several of our subsidiaries have also been named as defendants or co-defendants in cases alleging injury caused by exposure to asbestos. The plaintiffs seek an unspecified amount of damages based on common law, statutory, or premises liability or, in the case of ASC, the Jones Act, which provides limited remedies to certain maritime employees. As of January 31, 2016, there were 79 asbestos-related cases pending against GATX and its subsidiaries. Of the total number of pending cases, 63 are Jones Act claims, most of which were filed against ASC before the year 2000. During 2015, 5 new cases were filed, and 26 cases were dismissed without payment or otherwise settled for an immaterial amount. In addition, demand has been made against GATX for asbestos-related claims under limited indemnities given in connection with the sale of certain of our former subsidiaries. It is possible that the number of these cases or claims for indemnity could begin to grow and that the cost of these cases, including costs to defend, could correspondingly increase in the future.
Litigation Accruals
We have recorded accruals totaling $1.9 million at December 31, 2015 for losses related to those litigation matters that we believe to be probable and for which an amount of loss can be reasonably estimated. However, we cannot determine a reasonable estimate of the maximum possible loss or range of loss for these matters given that they are at various stages of the litigation process and each case is subject to the inherent uncertainties of litigation (such as the strength of our legal defenses and the availability of insurance recovery). Although the maximum amount of liability that may ultimately result from any of these matters cannot be predicted with absolute certainty, management expects that none of the matters for which we have recorded an accrual, when ultimately resolved, will have a material adverse effect on our consolidated financial position or liquidity. It is possible, however, that the ultimate resolution of one or more of these matters could have a material adverse effect on our results of operations in a particular quarter or year if such resolution results in liability that materially exceeds the accrued amount.
In addition, we have other litigation matters pending for which we have not recorded any accruals because our potential liability for those matters is not probable or cannot be reasonably estimated based on currently available information. For those matters where we have not recorded an accrual but a loss is reasonably possible, we cannot determine a reasonable estimate of the maximum possible loss or range of loss for these matters given that they are at various stages of the litigation process and each case is subject to the inherent uncertainties of litigation (such as the strength of our legal defenses and the availability of insurance recovery). Although the maximum amount of liability that may ultimately result from any of these matters cannot be predicted with absolute certainty, management expects that none of the matters for which we have not recorded an accrual, when ultimately resolved, will have a material adverse effect on our consolidated financial position or liquidity. It is possible, however, that the ultimate resolution of one or more of these matters could have a material adverse effect on our results of operations in a particular quarter or year if such resolution results in a significant liability for GATX.
Environmental
Our operations are subject to extensive federal, state, and local environmental regulations. Our operating procedures include practices to protect the environment from the risks inherent in full service railcar leasing, which involves maintaining railcars used by customers to transport chemicals and other hazardous materials. Under some environmental laws in the US and certain other countries, the owner of a leased railcar may be liable for environmental damage and cleanup or other costs in the event of a spill or discharge of material from a railcar without regard to the owner's fault. While our standard master railcar lease agreement requires the lessee to indemnify us against environmental claims and to carry liability insurance coverage, such indemnities and insurance may not fully protect us against claims for environmental damage. Additionally, some of our real estate holdings, including previously owned properties, are or have been used
103
GATX CORPORATION AND SUBSIDIARIES
NOTES TO CONSOLIDATED FINANCIAL STATEMENTS (Continued)
for industrial or transportation-related purposes or leased to commercial or industrial companies whose activities might have resulted in discharges on the property. As a result, we are subject to environmental cleanup and enforcement actions. In particular, the federal Comprehensive Environmental Response, Compensation and Liability Act (“CERCLA”), also known as the Superfund law, as well as similar state laws, impose joint and several liability for cleanup and enforcement costs on current and former owners and operators of a site without regard to fault or the legality of the original conduct. If there are other potentially responsible parties (“PRPs”), we generally contribute to the cleanup of these sites through cost-sharing agreements with terms that vary from site to site. Costs are typically allocated based on the relative volumetric contribution of material, the period of time the site was owned or operated, and/or the portion of the site owned or operated by each PRP.
At the time a potential environmental issue is identified, initial accruals for environmental liability are established when such liability is determined to be probable and a reasonable estimate of the associated costs can be made. Costs are estimated based on the type and level of investigation and/or remediation activities that our internal environmental staff (and where appropriate, independent consultants) have advised to be necessary to comply with applicable laws and regulations. Activities include surveys and environmental studies of potentially contaminated sites as well as costs for remediation and restoration of sites determined to be contaminated. In addition, we have provided indemnities for potential environmental liabilities to buyers of divested companies. In these instances, accruals are based on the scope and duration of the respective indemnities together with the extent of known contamination. Estimates are periodically reviewed and adjusted as required to reflect additional information about facility or site characteristics or changes in regulatory requirements. We conduct a quarterly environmental contingency analysis, which considers a combination of factors including independent consulting reports, site visits, legal reviews, analysis of the likelihood of participation in and the ability of other PRPs to pay for cleanup, and historical trend analyses.
We are involved in administrative and judicial proceedings and other voluntary and mandatory cleanup efforts at 18 sites, including Superfund sites, for which we are contributing to the cost of performing the study or cleanup, or both, of alleged environmental contamination. As of December 31, 2015, we have recorded accruals of $13.2 million for remediation and restoration costs that we believe to be probable and for which the amount of loss can be reasonably estimated. These amounts are included in other liabilities on our balance sheet. Our environmental liabilities are not discounted.
We did not materially change our methodology for identifying and calculating environmental liabilities in the last three years. Currently, no known trends, demands, commitments, events or uncertainties exist that are reasonably likely to occur and materially affect the methodology or assumptions described above.
The recorded accruals represent our best estimate of all costs for remediation and restoration of affected sites, without reduction for anticipated recoveries from third parties, and include both asserted and unasserted claims. However, we are unable to provide a reasonable estimate of the maximum potential loss associated with these sites because cleanup costs cannot be predicted with certainty. Various factors beyond our control can impact the amount of loss GATX will ultimately incur with respect to these sites, including the extent of corrective actions that may be required; evolving environmental laws and regulations; advances in environmental technology, the extent of other parties' participation in cleanup efforts; developments in periodic environmental analyses related to sites determined to be contaminated, and developments in environmental surveys and studies of potentially contaminated sites. As a result, future charges associated with these sites could have a significant effect on results of operations in a particular quarter or year if the costs materially exceed the accrued amount as individual site studies and remediation and restoration efforts proceed. However, management believes it is unlikely that the ultimate cost to GATX for any of these sites, either individually or in the aggregate, will have a material adverse effect on our consolidated financial position or liquidity.
104
GATX CORPORATION AND SUBSIDIARIES
NOTES TO CONSOLIDATED FINANCIAL STATEMENTS (Continued)
NOTE 25. Financial Data of Business Segments
The financial data presented below depicts the profitability, financial position, and capital expenditures of each of our business segments.
We lease, operate, manage, and remarket long-lived, widely-used assets, primarily in the rail market. We also invest in joint ventures that complement our existing business activities. We report our financial results through four primary business segments: Rail North America, Rail International, American Steamship Company (“ASC”), and Portfolio Management.
Rail North America is comprised of our wholly owned operations in the United States, Canada, and Mexico, as well as an affiliate investment. Rail North America primarily provides railcars pursuant to full-service leases under which it maintains the railcars, pays ad valorem taxes and insurance, and provides other ancillary services.
Rail International is comprised of our wholly owned European operations ("GATX Rail Europe" or "GRE") and a wholly owned railcar leasing business in India ("Rail India"), as well as one development stage affiliate in China. GRE leases railcars to customers throughout Europe pursuant to full-service leases under which it maintains the railcars and provides value-adding services according to customer requirements.
ASC operates the largest fleet of US-flagged vessels on the Great Lakes, providing waterborne transportation of dry bulk commodities such as iron ore, coal, limestone aggregates, and metallurgical limestone.
Portfolio Management generates leasing, marine operating, asset remarketing and management fee income through a collection of diversified wholly owned assets and joint venture investments.
Segment profit is an internal performance measure used by the Chief Executive Officer to assess the performance of each segment in a given period. Segment profit includes all revenues, pretax earnings from affiliates, and net gains on asset dispositions that are attributable to the segments, as well as expenses that management believes are directly associated with the financing, maintenance, and operation of the revenue earning assets. Segment profit excludes selling, general and administrative expenses, income taxes, and certain other amounts not allocated to the segments. These amounts are included in Other.
We allocate debt balances and related interest expense to each segment based upon a predetermined fixed recourse leverage level expressed as a ratio of recourse debt (including off-balance sheet debt) to equity. The leverage levels are 5:1 for Rail North America, 2:1 for Rail International, 1.5:1 for ASC, and 3:1 for Portfolio Management. We believe that by using this leverage and interest expense allocation methodology, each operating segment’s financial performance reflects appropriate risk-adjusted borrowing costs.
105
GATX CORPORATION AND SUBSIDIARIES
NOTES TO CONSOLIDATED FINANCIAL STATEMENTS (Continued)
The following tables show certain segment data for the years ended December 31, 2015, 2014, and 2013 (in millions):
Rail North America | Rail International | ASC | Portfolio Management | Other | GATX Consolidated | ||||||||||||||||||
2015 Profitability | |||||||||||||||||||||||
Revenues | |||||||||||||||||||||||
Lease revenue | $ | 930.9 | $ | 172.9 | $ | 4.1 | $ | 22.2 | $ | — | $ | 1,130.1 | |||||||||||
Marine operating revenue | — | — | 166.1 | 68.9 | — | 235.0 | |||||||||||||||||
Other revenue | 75.9 | 7.5 | — | 1.4 | — | 84.8 | |||||||||||||||||
Total Revenues | 1,006.8 | 180.4 | 170.2 | 92.5 | — | 1,449.9 | |||||||||||||||||
Expenses | |||||||||||||||||||||||
Maintenance expense | 264.2 | 39.6 | 22.3 | — | — | 326.1 | |||||||||||||||||
Marine operating expense | — | — | 107.2 | 48.7 | — | 155.9 | |||||||||||||||||
Depreciation expense | 215.1 | 43.7 | 14.3 | 17.4 | — | 290.5 | |||||||||||||||||
Operating lease expense | 82.2 | — | 5.2 | — | (0.2 | ) | 87.2 | ||||||||||||||||
Other operating expense | 26.2 | 5.1 | — | 7.1 | — | 38.4 | |||||||||||||||||
Total Expenses | 587.7 | 88.4 | 149.0 | 73.2 | (0.2 | ) | 898.1 | ||||||||||||||||
Other Income (Expense) | |||||||||||||||||||||||
Net gain (loss) on asset dispositions | 67.2 | 6.8 | (0.1 | ) | 5.3 | — | 79.2 | ||||||||||||||||
Interest expense, net | (102.1 | ) | (22.4 | ) | (5.3 | ) | (20.0 | ) | (5.3 | ) | (155.1 | ) | |||||||||||
Other expense | (5.2 | ) | (6.0 | ) | (0.7 | ) | — | (1.3 | ) | (13.2 | ) | ||||||||||||
Share of affiliates' earnings (pretax) (1) | 0.5 | (0.3 | ) | — | 45.2 | — | 45.4 | ||||||||||||||||
Segment profit (loss) | $ | 379.5 | $ | 70.1 | $ | 15.1 | $ | 49.8 | $ | (6.4 | ) | 508.1 | |||||||||||
Selling, general and administrative expense | 192.4 | ||||||||||||||||||||||
Income taxes (including $0.5 tax benefits related to affiliates' earnings) | 110.4 | ||||||||||||||||||||||
Net income | $ | 205.3 | |||||||||||||||||||||
Net Gain on Asset Dispositions | |||||||||||||||||||||||
Asset Remarketing Income: | |||||||||||||||||||||||
Disposition gains on owned assets | 66.6 | — | — | 23.7 | — | $ | 90.3 | ||||||||||||||||
Residual sharing income | 0.8 | — | — | 12.6 | — | 13.4 | |||||||||||||||||
Non-remarketing disposition gains (2) | 2.3 | 7.2 | (0.1 | ) | — | — | 9.4 | ||||||||||||||||
Asset impairment | (2.5 | ) | (0.4 | ) | — | (31.0 | ) | — | (33.9 | ) | |||||||||||||
$ | 67.2 | $ | 6.8 | $ | (0.1 | ) | $ | 5.3 | $ | — | $ | 79.2 | |||||||||||
Capital Expenditures | |||||||||||||||||||||||
Portfolio investments and capital additions | $ | 524.5 | $ | 148.0 | $ | 20.3 | $ | 18.4 | $ | 3.5 | $ | 714.7 | |||||||||||
Selected Balance Sheet Data | |||||||||||||||||||||||
Investments in affiliated companies | $ | 12.0 | $ | 1.4 | $ | — | $ | 335.1 | $ | — | $ | 348.5 | |||||||||||
Identifiable assets | $ | 4,629.1 | $ | 1,117.6 | $ | 284.7 | $ | 636.5 | $ | 226.3 | $ | 6,894.2 | |||||||||||
__________
(1) Includes a $19.0 million impairment loss in the Portfolio Management segment.
(2) Includes scrapping gains.
106
GATX CORPORATION AND SUBSIDIARIES
NOTES TO CONSOLIDATED FINANCIAL STATEMENTS (Continued)
Rail North America | Rail International | ASC | Portfolio Management | Other | GATX Consolidated | ||||||||||||||||||
2014 Profitability | |||||||||||||||||||||||
Revenues | |||||||||||||||||||||||
Lease revenue | $ | 864.1 | $ | 188.6 | $ | 4.2 | $ | 29.7 | $ | — | $ | 1,086.6 | |||||||||||
Marine operating revenue | — | — | 223.0 | 63.3 | — | 286.3 | |||||||||||||||||
Other revenue | 63.4 | 10.3 | — | 4.4 | — | 78.1 | |||||||||||||||||
Total Revenues | 927.5 | 198.9 | 227.2 | 97.4 | — | 1,451.0 | |||||||||||||||||
Expenses | |||||||||||||||||||||||
Maintenance expense | 265.5 | 45.9 | 25.6 | — | — | 337.0 | |||||||||||||||||
Marine operating expense | — | — | 149.2 | 48.6 | — | 197.8 | |||||||||||||||||
Depreciation expense | 190.0 | 47.1 | 13.6 | 22.8 | — | 273.5 | |||||||||||||||||
Operating lease expense | 103.7 | — | 5.2 | — | (0.2 | ) | 108.7 | ||||||||||||||||
Other operating expense | 21.9 | 5.1 | — | 1.9 | — | 28.9 | |||||||||||||||||
Total Expenses | 581.1 | 98.1 | 193.6 | 73.3 | (0.2 | ) | 945.9 | ||||||||||||||||
Other Income (Expense) | |||||||||||||||||||||||
Net gain (loss) on asset dispositions | 72.3 | 6.0 | (0.5 | ) | 9.4 | — | 87.2 | ||||||||||||||||
Interest expense, net | (98.4 | ) | (24.7 | ) | (5.6 | ) | (24.3 | ) | (5.4 | ) | (158.4 | ) | |||||||||||
Other expense | (7.2 | ) | (3.1 | ) | (0.2 | ) | (1.2 | ) | (1.8 | ) | (13.5 | ) | |||||||||||
Share of affiliates' earnings (pretax) | 7.9 | (0.3 | ) | — | 60.2 | — | 67.8 | ||||||||||||||||
Segment profit (loss) | $ | 321.0 | $ | 78.7 | $ | 27.3 | $ | 68.2 | $ | (7.0 | ) | 488.2 | |||||||||||
Selling, general and administrative expense | 189.2 | ||||||||||||||||||||||
Income taxes (including $18.3 related to affiliates' earnings) | 94.0 | ||||||||||||||||||||||
Net income | $ | 205.0 | |||||||||||||||||||||
Net Gain on Asset Dispositions | |||||||||||||||||||||||
Asset Remarketing Income: | |||||||||||||||||||||||
Disposition gains on owned assets | $ | 57.4 | $ | 0.6 | $ | — | $ | 5.1 | $ | — | $ | 63.1 | |||||||||||
Residual sharing income | 5.2 | — | — | 4.2 | — | 9.4 | |||||||||||||||||
Non-remarketing disposition gains (1) | 10.4 | 5.7 | (0.1 | ) | — | — | 16.0 | ||||||||||||||||
Asset impairment | (0.7 | ) | (0.3 | ) | (0.4 | ) | 0.1 | — | (1.3 | ) | |||||||||||||
$ | 72.3 | $ | 6.0 | $ | (0.5 | ) | $ | 9.4 | $ | — | $ | 87.2 | |||||||||||
Capital Expenditures | |||||||||||||||||||||||
Portfolio investments and capital additions | $ | 810.6 | $ | 163.6 | $ | 18.4 | $ | 32.3 | $ | 5.6 | $ | 1,030.5 | |||||||||||
Selected Balance Sheet Data | |||||||||||||||||||||||
Investments in affiliated companies | $ | 17.2 | $ | 1.8 | $ | — | $ | 338.7 | $ | — | $ | 357.7 | |||||||||||
Identifiable assets | $ | 4,358.2 | $ | 1,228.8 | $ | 286.7 | $ | 813.3 | $ | 232.9 | $ | 6,919.9 | |||||||||||
__________
(1) Includes scrapping gains.
107
GATX CORPORATION AND SUBSIDIARIES
NOTES TO CONSOLIDATED FINANCIAL STATEMENTS (Continued)
Rail North America | Rail International | ASC | Portfolio Management | Other | GATX Consolidated | ||||||||||||||||||
2013 Profitability | |||||||||||||||||||||||
Revenues | |||||||||||||||||||||||
Lease revenue | $ | 758.9 | $ | 180.2 | $ | 4.2 | $ | 31.9 | $ | — | $ | 975.2 | |||||||||||
Marine operating revenue | — | — | 223.5 | 51.6 | — | 275.1 | |||||||||||||||||
Other revenue | 58.2 | 8.8 | — | 3.7 | — | 70.7 | |||||||||||||||||
Total Revenues | 817.1 | 189.0 | 227.7 | 87.2 | — | 1,321.0 | |||||||||||||||||
Expenses | |||||||||||||||||||||||
Maintenance expense | 228.2 | 42.9 | 22.9 | — | — | 294.0 | |||||||||||||||||
Marine operating expense | — | — | 151.3 | 38.5 | — | 189.8 | |||||||||||||||||
Depreciation expense | 176.7 | 43.2 | 12.1 | 23.0 | — | 255.0 | |||||||||||||||||
Operating lease expense | 124.4 | — | 5.2 | — | (0.2 | ) | 129.4 | ||||||||||||||||
Other operating expense | 18.4 | 5.3 | — | 2.4 | — | 26.1 | |||||||||||||||||
Total Expenses | 547.7 | 91.4 | 191.5 | 63.9 | (0.2 | ) | 894.3 | ||||||||||||||||
Other Income (Expense) | |||||||||||||||||||||||
Net gain (loss) on asset dispositions | 67.7 | 3.7 | (1.3 | ) | 15.5 | — | 85.6 | ||||||||||||||||
Interest expense, net | (106.0 | ) | (23.9 | ) | (6.2 | ) | (26.7 | ) | (3.8 | ) | (166.6 | ) | |||||||||||
Other expense (income) | (9.8 | ) | (1.1 | ) | 0.2 | 1.4 | 0.9 | (8.4 | ) | ||||||||||||||
Share of affiliates' earnings (pretax) | 10.3 | 21.1 | — | 60.9 | — | 92.3 | |||||||||||||||||
Segment profit (loss) | $ | 231.6 | $ | 97.4 | $ | 28.9 | $ | 74.4 | $ | (2.7 | ) | 429.6 | |||||||||||
Selling, general and administrative expense | 178.3 | ||||||||||||||||||||||
Income taxes (including $16.5 related to affiliates' earnings) | 82.0 | ||||||||||||||||||||||
Net income | $ | 169.3 | |||||||||||||||||||||
Net Gain on Asset Dispositions | |||||||||||||||||||||||
Asset Remarketing Income: | |||||||||||||||||||||||
Disposition gains on owned assets | $ | 51.1 | $ | 0.3 | $ | — | $ | 8.6 | $ | — | $ | 60.0 | |||||||||||
Residual sharing income | 3.4 | — | — | 7.4 | — | 10.8 | |||||||||||||||||
Non-remarketing disposition gains (1) | 14.5 | 6.2 | — | — | — | 20.7 | |||||||||||||||||
Asset impairment | (1.3 | ) | (2.8 | ) | (1.3 | ) | (0.5 | ) | — | (5.9 | ) | ||||||||||||
$ | 67.7 | $ | 3.7 | $ | (1.3 | ) | $ | 15.5 | $ | — | $ | 85.6 | |||||||||||
Capital Expenditures | |||||||||||||||||||||||
Portfolio investments and capital additions | $ | 502.4 | $ | 168.5 | $ | 11.2 | $ | 170.5 | $ | 7.0 | $ | 859.6 | |||||||||||
Selected Balance Sheet Data | |||||||||||||||||||||||
Investments in affiliated companies | $ | 31.4 | $ | 2.0 | $ | — | $ | 320.9 | $ | — | $ | 354.3 | |||||||||||
Identifiable assets | $ | 3,710.3 | $ | 1,296.2 | $ | 271.0 | $ | 856.9 | $ | 401.1 | $ | 6,535.5 | |||||||||||
__________
(1) Includes scrapping gains.
108
GATX CORPORATION AND SUBSIDIARIES
NOTES TO CONSOLIDATED FINANCIAL STATEMENTS (Continued)
NOTE 26. Selected Quarterly Financial Data (unaudited)
First Quarter | Second Quarter | Third Quarter (2) | Fourth Quarter (3) | Total | |||||||||||||||
In millions, except per share data | |||||||||||||||||||
2015 | |||||||||||||||||||
Total revenues | $ | 319.7 | $ | 365.3 | $ | 386.2 | $ | 378.7 | $ | 1,449.9 | |||||||||
Net income | $ | 62.2 | $ | 45.4 | $ | 39.5 | $ | 58.2 | $ | 205.3 | |||||||||
Per Share Data (1) | |||||||||||||||||||
Basic | $ | 1.41 | $ | 1.04 | $ | 0.92 | $ | 1.38 | $ | 4.76 | |||||||||
Diluted | $ | 1.39 | $ | 1.03 | $ | 0.91 | $ | 1.37 | $ | 4.69 | |||||||||
2014 | |||||||||||||||||||
Total revenues | $ | 286.6 | $ | 365.8 | $ | 397.2 | $ | 401.4 | $ | 1,451.0 | |||||||||
Net income | $ | 42.1 | $ | 53.1 | $ | 51.3 | $ | 58.5 | $ | 205.0 | |||||||||
Per Share Data (1) | |||||||||||||||||||
Basic | $ | 0.92 | $ | 1.17 | $ | 1.16 | $ | 1.32 | $ | 4.55 | |||||||||
Diluted | $ | 0.90 | $ | 1.15 | $ | 1.14 | $ | 1.30 | $ | 4.48 | |||||||||
___________________
(1) | Quarterly earnings per share may not be additive, as per share amounts are computed independently for each quarter and the full year is based on the respective weighted average common shares and common stock equivalents outstanding. |
(2) | In the third quarter of 2015, net income included $31.1 million of net impairment losses and $4.5 million of net disposition gains, both related to the decision to exit the majority of the marine investments within the Portfolio Management segment. |
(3) | In the fourth quarter of 2015, net income included $9.0 million of net disposition gains related to the decision to exit the majority of the marine investments within the Portfolio Management segment. In addition, we recorded $14.1 million of expense attributable to an increase in our effective state income tax rate, $7.7 million of benefit resulting from a reduction in the statutory income tax rate in the UK, and $5.6 million of net expenses associated with an early retirement program offered to certain employees. |
109
Item 9. Changes in and Disagreements with Accountants on Accounting and Financial Disclosure
None.
Item 9A. Controls and Procedures
Management’s Report Regarding the Effectiveness of Disclosure Controls and Procedures
Our management, with the participation of our Chief Executive Officer and Chief Financial Officer, has conducted an evaluation of our disclosure controls and procedures (as defined in Rules 13a-15(e) and 15d-15(e) of the Securities Exchange Act of 1934 (the “Exchange Act”)). Based on such evaluation, our Chief Executive Officer and Chief Financial Officer have concluded that, as of the end of the period covered by this annual report, our disclosure controls and procedures were effective.
Management’s Report Regarding the Effectiveness of Internal Control and Procedures
Our management is responsible for establishing and maintaining adequate internal control over financial reporting as defined in Rules 13a-15(f) and 15d-15(f) of the Exchange Act for us. Our internal control over financial reporting is designed to provide reasonable assurance regarding the reliability of financial reporting and the preparation of financial statements for external purposes in accordance with generally accepted accounting principles. Our internal control over financial reporting includes those policies and procedures that:
(i) | pertain to the maintenance of records that, in reasonable detail, accurately and fairly reflect the transactions and dispositions of our assets; |
(ii) | provide reasonable assurance that transactions are recorded as necessary to permit preparation of financial statements in accordance with generally accepted accounting principles, and that our receipts and expenditures are being made only in accordance with authorizations of our management and directors; and |
(iii) | provide reasonable assurance regarding prevention or timely detection of unauthorized acquisition, use or disposition of our assets that could have a material effect on the financial statements. |
Because of its inherent limitations, internal control over financial reporting may not prevent or detect misstatements. In addition, projections of any evaluation of effectiveness to future periods are subject to the risk that controls may become inadequate as a result of changes in conditions, or that the degree of compliance with the applicable policies and procedures may deteriorate.
Our management, with the participation of our Chief Executive Officer and Chief Financial Officer, has conducted an evaluation of our internal control over financial reporting as of the end of the period covered by this annual report based on the framework in Internal Control-Integrated Framework issued by the Committee of Sponsoring Organizations of the Treadway Commission (2013 framework). Such evaluation included reviewing the documentation of our internal controls, evaluating the design effectiveness of the internal controls and testing their operating effectiveness.
Based on such evaluation, our management has concluded that as of the end of the period covered by this annual report, our internal control over financial reporting was effective.
Ernst & Young LLP, the independent registered public accounting firm that audited the financial statements included in this annual report, has issued a report on our internal control over financial reporting. That report follows.
110
Report of Independent Registered Public Accounting Firm on Internal Control Over Financial Reporting
The Board of Directors and Shareholders of GATX Corporation and subsidiaries
We have audited GATX Corporation and subsidiaries’ internal control over financial reporting as of December 31, 2015, based on criteria established in Internal Control-Integrated Framework issued by the Committee of Sponsoring Organizations of the Treadway Commission (2013 framework) (the COSO criteria). GATX Corporation and subsidiaries’ management is responsible for maintaining effective internal control over financial reporting, and for its assessment of the effectiveness of internal control over financial reporting included in the accompanying Management’s Report Regarding the Effectiveness of Internal Control and Procedures. Our responsibility is to express an opinion on the company’s internal control over financial reporting based on our audit.
We conducted our audit in accordance with the standards of the Public Company Accounting Oversight Board (United States). Those standards require that we plan and perform the audit to obtain reasonable assurance about whether effective internal control over financial reporting was maintained in all material respects. Our audit included obtaining an understanding of internal control over financial reporting, assessing the risk that a material weakness exists, testing and evaluating the design and operating effectiveness of internal control based on the assessed risk, and performing such other procedures as we considered necessary in the circumstances. We believe that our audit provides a reasonable basis for our opinion.
A company’s internal control over financial reporting is a process designed to provide reasonable assurance regarding the reliability of financial reporting and the preparation of financial statements for external purposes in accordance with generally accepted accounting principles. A company’s internal control over financial reporting includes those policies and procedures that (1) pertain to the maintenance of records that, in reasonable detail, accurately and fairly reflect the transactions and dispositions of the assets of the company; (2) provide reasonable assurance that transactions are recorded as necessary to permit preparation of financial statements in accordance with generally accepted accounting principles, and that receipts and expenditures of the company are being made only in accordance with authorizations of management and directors of the company; and (3) provide reasonable assurance regarding prevention or timely detection of unauthorized acquisition, use, or disposition of the company’s assets that could have a material effect on the financial statements.
Because of its inherent limitations, internal control over financial reporting may not prevent or detect misstatements. Also, projections of any evaluation of effectiveness to future periods are subject to the risk that controls may become inadequate because of changes in conditions, or that the degree of compliance with the policies or procedures may deteriorate.
In our opinion, GATX Corporation and subsidiaries maintained, in all material respects, effective internal control over financial reporting as of December 31, 2015, based on the COSO criteria.
We also have audited, in accordance with the standards of the Public Company Accounting Oversight Board (United States), the consolidated balance sheets of GATX Corporation and subsidiaries as of December 31, 2015 and 2014, and the related consolidated statements of comprehensive income, changes in shareholders’ equity and cash flows for each of the three years in the period ended December 31, 2015 and our report dated February 24, 2016, expressed an unqualified opinion thereon.
Chicago, Illinois |
February 24, 2016 |
111
Changes in Internal Control Over Financial Reporting
No change in our internal control over financial reporting (as defined in Exchange Act Rules 13a-15(f) and 15d-15(f)) occurred during the fiscal quarter ended December 31, 2015, that materially affected, or is reasonably likely to materially affect, our internal control over financial reporting.
Item 9B. Other Information
None.
PART III
Item 10. Directors, Executive Officers and Corporate Governance
Information required by this item regarding directors, our Code of Business Conduct and Ethics, Code of Ethics for Senior Company Officers, Audit Committee Financial Experts, compliance with Section 16(a) of the Exchange Act, and corporate governance is contained in sections entitled "Nominees for Election to the Board of Directors", "Director Criteria and Nomination Process", "Board of Directors", "Board Independence", "Board Leadership Structure", "Board Committees", "Director and Officer Identification and Insurance Arrangements", "Communication with the Board", "Audit Committee Report", and "Section 16(a) Beneficial Ownership Reporting Compliance" in our definitive Proxy Statement to be filed on or about March 11, 2016, which sections are incorporated herein by reference.
Information regarding executive officers is included after Item 1 in Part I of this Form 10-K.
Item 11. Executive Compensation
Information required by this item regarding compensation of our directors and executive officers is contained in sections entitled “Director Compensation”, “Compensation Discussion and Analysis”, “Compensation Committee Report”, and “Executive Compensation Tables”, in our definitive Proxy Statement to be filed on or about March 11, 2016, which sections are incorporated herein by reference.
Item 12. Security Ownership of Certain Beneficial Owners and Management and Related Stockholder Matters
Information required by this item regarding security ownership of certain beneficial owners and management is contained in sections entitled “Security Ownership of Directors and Executive Officers” and “Principal Shareholders” in our definitive Proxy Statement to be filed on or about March 11, 2016, which sections are incorporated herein by reference.
Item 13. Certain Relationships and Related Transactions, and Director Independence
Information required by this item regarding transactions with related persons and director independence is contained in the sections entitled “Related Party Transactions” and “Board Independence” in our definitive Proxy Statement to be filed on or about March 11, 2016, which sections are incorporated herein by reference.
Item 14. Principal Accounting Fees and Services
Information required by this item regarding fees paid to Ernst & Young is contained in sections entitled "Pre-Approval Policy", “Audit Fees”, “Audit Related Fees”, “Tax Fees”, and “All Other Fees” in our definitive Proxy Statement to be filed on or about March 11, 2016, which sections are incorporated herein by reference.
112
PART IV
Item 15. Exhibits, Financial Statement Schedules
(a) 1. Financial Statements
Page | |
Documents Filed as Part of this Report: | |
Consolidated Statements of Cash Flows — Years Ended December 31, 2015, 2014, and 2013 | |
2. | Financial Statement Schedules: |
All other schedules for which provision is made in the applicable accounting regulations of the Securities and Exchange Commission are not required under the related instructions or are inapplicable, and, therefore, have been omitted.
3. Exhibits. See the Exhibit Index included herewith and incorporated by reference hereto.
113
SIGNATURES
Pursuant to the requirements of Section 13 or 15(d) of the Securities Exchange Act of 1934, the Registrant has duly caused this report to be signed on its behalf by the undersigned, thereunto duly authorized.
GATX CORPORATION | ||||
Registrant | ||||
/s/ BRIAN A. KENNEY | ||||
Brian A. Kenney | ||||
Chairman, President and Chief Executive Officer | ||||
February 24, 2016 | ||||
Pursuant to the requirements of the Securities Exchange Act of 1934, this report has been signed by the following persons on behalf of the Registrant and in the capacities and on the date indicated.
/s/ BRIAN A. KENNEY | Chairman, President and Chief Executive Officer (Principal Executive Officer) | |
Brian A. Kenney | ||
February 24, 2016 | ||
/s/ ROBERT C. LYONS | Executive Vice President and Chief Financial Officer (Principal Financial Officer) | |
Robert C. Lyons | ||
February 24, 2016 | ||
/s/ WILLIAM M. MUCKIAN | Senior Vice President, Controller and Chief Accounting Officer (Principal Accounting Officer) | |
William M. Muckian | ||
February 24, 2016 | ||
Anne L. Arvia | Director | |
Ernst A. Häberli | Director | |
James B. Ream | Director | |
Robert J. Ritchie | Director | |
David S. Sutherland | Director | |
Casey J. Sylla | Director | |
Stephen R. Wilson | Director | |
Paul G. Yovovich | Director | |
/s/ DEBORAH A. GOLDEN | Executive Vice President, General Counsel and Corporate Secretary (Attorney in Fact) | |
Deborah A. Golden | ||
February 24, 2016 | ||
114
SCHEDULE I — CONDENSED FINANCIAL INFORMATION OF REGISTRANT
GATX CORPORATION
(Parent Company)
BALANCE SHEETS
(In millions)
December 31 | |||||||
2015 | 2014 | ||||||
Assets | |||||||
Cash and cash equivalents | $ | 147.6 | $ | 162.3 | |||
Operating assets and facilities, net | 3,373.6 | 3,397.0 | |||||
Investments in affiliated companies | 2,255.3 | 2,199.5 | |||||
Other assets | 709.4 | 396.0 | |||||
Total Assets | $ | 6,485.9 | $ | 6,154.8 | |||
Liabilities and Shareholders’ Equity | |||||||
Accounts payable and accrued expenses | $ | 72.0 | $ | 54.9 | |||
Debt | 4,107.7 | 3,821.1 | |||||
Other liabilities | 1,026.0 | 964.8 | |||||
Total Liabilities | 5,205.7 | 4,840.8 | |||||
Total Shareholders’ Equity | 1,280.2 | 1,314.0 | |||||
Total Liabilities and Shareholders’ Equity | $ | 6,485.9 | $ | 6,154.8 | |||
See accompanying note to condensed financial statements.
115
SCHEDULE I — CONDENSED FINANCIAL INFORMATION OF REGISTRANT (CONT’D)
GATX CORPORATION
(Parent Company)
STATEMENTS OF COMPREHENSIVE INCOME
(In millions)
Year Ended December 31 | |||||||||||
2015 | 2014 | 2013 | |||||||||
Revenues | |||||||||||
Lease revenue | $ | 718.3 | $ | 669.7 | $ | 543.0 | |||||
Other revenue | 66.7 | 60.2 | 51.3 | ||||||||
Total Revenues | 785.0 | 729.9 | 594.3 | ||||||||
Expenses | |||||||||||
Maintenance expense | 233.6 | 227.6 | 176.5 | ||||||||
Depreciation expense | 164.8 | 147.7 | 131.1 | ||||||||
Operating lease expense | 61.7 | 83.0 | 89.5 | ||||||||
Other operating expense | 25.4 | 17.1 | 12.7 | ||||||||
Selling, general and administrative expense | 149.2 | 139.7 | 131.1 | ||||||||
Total Expenses | 634.7 | 615.1 | 540.9 | ||||||||
Other Income (Expense) | |||||||||||
Net gain on asset dispositions | 48.0 | 67.9 | 68.6 | ||||||||
Interest expense, net | (68.7 | ) | (66.7 | ) | (63.7 | ) | |||||
Other income (expense) | — | 2.5 | (7.0 | ) | |||||||
Income before Income Taxes and Share of Affiliates' Earnings | 129.6 | 118.5 | 51.3 | ||||||||
Income Taxes | (62.4 | ) | (41.7 | ) | (10.7 | ) | |||||
Share of Affiliates' Earnings, Net of Taxes | 138.1 | 128.2 | 128.7 | ||||||||
Net Income | $ | 205.3 | $ | 205.0 | $ | 169.3 | |||||
Other Comprehensive Income, Net of Taxes | |||||||||||
Foreign currency translation adjustments | (55.8 | ) | (79.1 | ) | 25.8 | ||||||
Unrealized (loss) gain on securities | (0.6 | ) | (0.1 | ) | 0.8 | ||||||
Unrealized (loss) gain on derivative instruments | (1.8 | ) | 3.0 | 22.4 | |||||||
Post-retirement benefit plans | 7.8 | (29.5 | ) | 52.9 | |||||||
Other comprehensive (loss) income | (50.4 | ) | (105.7 | ) | 101.9 | ||||||
Comprehensive Income | $ | 154.9 | $ | 99.3 | $ | 271.2 | |||||
See accompanying note to condensed financial statements.
116
SCHEDULE I — CONDENSED FINANCIAL INFORMATION OF REGISTRANT (CONT’D)
GATX CORPORATION
(Parent Company)
STATEMENTS OF CASH FLOWS
(In millions)
Year Ended December 31 | |||||||||||
2015 | 2014 | 2013 | |||||||||
Operating Activities | |||||||||||
Net cash provided by operating activities | $ | 412.5 | $ | 219.5 | $ | 104.3 | |||||
Investing Activities | |||||||||||
Capital additions | (602.9 | ) | (748.1 | ) | (513.5 | ) | |||||
Purchases of leased-in assets | (118.4 | ) | (150.5 | ) | (61.4 | ) | |||||
Proceeds from sale-leasebacks | — | — | 90.7 | ||||||||
Portfolio proceeds and other | 208.7 | 169.5 | 320.7 | ||||||||
Net cash used in investing activities | (512.6 | ) | (729.1 | ) | (163.5 | ) | |||||
Financing Activities | |||||||||||
Repayments of debt (original maturities longer than 90 days) | (350.0 | ) | (692.2 | ) | (483.8 | ) | |||||
Net increase (decrease) in debt with original maturities of 90 days or less | (69.0 | ) | 69.0 | (185.0 | ) | ||||||
Proceeds from issuances of debt (original maturities longer than 90 days) | 695.7 | 1,188.7 | 967.0 | ||||||||
Stock repurchased | (125.4 | ) | (124.6 | ) | (68.6 | ) | |||||
Dividends | (68.2 | ) | (62.0 | ) | (60.5 | ) | |||||
Other | 2.3 | (1.6 | ) | 1.2 | |||||||
Net cash provided by financing activities | 85.4 | 377.3 | 170.3 | ||||||||
Net (decrease) increase in cash and cash equivalents during the year | (14.7 | ) | (132.3 | ) | 111.1 | ||||||
Cash and Cash Equivalents at beginning of year | 162.3 | 294.6 | 183.5 | ||||||||
Cash and Cash Equivalents at end of year | $ | 147.6 | $ | 162.3 | $ | 294.6 | |||||
See accompanying note to condensed financial statements.
117
Note to Condensed Financial Statements
Basis of Presentation
The condensed financial statements represent the Balance Sheets, Statements of Comprehensive Income and Cash Flows of GATX Corporation, the parent company. In these parent-company-only financial statements, our investment in subsidiaries and joint ventures (collectively "affiliates") is stated at cost plus equity in undistributed earnings of affiliates since the date of acquisition. Our share of net income from affiliates is included in consolidated net income using the equity method. The parent-company-only financial statements should be read in conjunction with our consolidated financial statements.
118
EXHIBIT INDEX
Exhibit Number | Exhibit Description | |
Filed with this Report: | ||
12 | Statement regarding computation of ratios of earnings to combined fixed charges and preferred stock dividends. | |
21 | Subsidiaries of the Registrant. | |
23 | Consent of Ernst & Young LLP, Independent Registered Public Accounting Firm. | |
24 | Powers of Attorney with respect to the Annual Report on Form 10-K for the fiscal year ended December 31, 2015. | |
31.1 | Certification Pursuant to Exchange Act Rule 13a-14(a) and Rule 15d-14(a) (CEO Certification). | |
31.2 | Certification Pursuant to Exchange Act Rule 13a-14(a) and Rule 15d-14(a) (CFO Certification). | |
32 | Certification Pursuant to 18 U.S.C. Section 1350 (CEO and CFO Certification). | |
101 | The following materials from GATX Corporation’s Annual Report on Form 10-K for the year ended December 31, 2015, are formatted in XBRL (eXtensible Business Reporting Language): (i) Consolidated Balance Sheets at December 31, 2015 and December 31, 2014, (ii) Consolidated Statements of Comprehensive Income for the years ended December 31, 2015, 2014, and 2013, (iii) Consolidated Statements of Cash Flows for the years ended December 31, 2015, 2014, and 2013, (iv) Notes to the Consolidated Financial Statements, and (v) Schedule I Condensed Financial Information of Registrant. | |
Incorporated by Reference: | ||
3.1 | Restated Certificate of Incorporation of GATX Corporation is incorporated herein by reference to Exhibit 3.2 to GATX’s Form 8-K dated October 31, 2013, file number 1-2328. | |
3.2 | Amended and Restated By-Laws of GATX Corporation are incorporated herein by reference to Exhibit 3.1 of GATX’s Form 8-K dated August 5, 2015, file number 1-2328. | |
4.1 | Indenture dated as of November 1, 2003 between GATX Financial Corporation and JP Morgan Chase Bank is incorporated herein by reference to Exhibit 4Q to GATX Financial Corporation’s Annual Report on Form 10-K for the fiscal year ended December 31, 2003, file number 1-8319. | |
4.2 | Indenture dated as of February 6, 2008, between GATX Corporation and U.S. Bank National Association, as Trustee, is incorporated herein by reference to Exhibit 4.12 to GATX’s Annual Report on Form 10-K for the fiscal year ended December 31, 2007, file number 1-2328. | |
10.1 | Five Year Credit Agreement with Citigroup Global Markets Inc. and Merrill Lynch, Pierce, Fenner & Smith Incorporated, as joint lead arrangers and joint book managers, Bank of America, N.A., as syndication agent, PNC Bank, National Association, U.S. Bank, National Association, and Bayerische Landesbank, acting through its New York branch, as co-documentation agents, Citibank, N.A., as administrative agent, and the lenders party thereto is incorporated herein by reference to GATX’s Form 8-K dated May 3, 2013, file number 1-2328. | |
i. | Amendment No. 1 to the Credit Agreement, dated as of July 8, 2014, among GATX Corporation, as borrower, Citigroup Global Markets Inc. and Merrill Lynch, Pierce, Fenner & Smith Incorporated, as joint lead arrangers and joint book managers, Bank of America, N.A., as syndication agent, PNC Bank, N.A., U.S. Bank, National Association and Bayerische Landesbank, acting through its New York branch, as co-documentation agents, Citibank, N.A., as administrative agent, and the lenders party thereto is incorporated by reference to Exhibit 10.1 to GATX’s Current Report on Form 8-K dated July 11, 2014, file number 1-2328. | |
ii. | Amendment No. 2 to the Credit Agreement, dated as of May 20, 2015, among GATX Corporation, as borrower, Citigroup Global Markets Inc. and Merrill Lynch, Pierce, Fenner & Smith Incorporated, as joint lead arrangers and joint book managers, Bank of America, N.A., as syndication agent, PNC Bank, N.A., U.S. Bank, National Association and Bayerische Landesbank, acting through its New York branch, as co-documentation agents, Citibank, N.A., as administrative agent, and the lenders party thereto is incorporated by reference to Exhibit 10.1 to GATX’s Current Report on Form 10-Q dated June 30, 2015, file number 1-2328. | |
119
10.2 | Supply Agreement by and between GATX Corporation, as Buyer, and Trinity Rail Group, LLC, as Seller, date March 14, 2011 is incorporated by reference to GATX’s Quarterly Report on Form 10-Q for the fiscal quarter ended March 31, 2011, file number 1-2328 (Note: Portions of this document have been omitted pursuant to a Request for Confidential Treatment filed with the Securities and Exchange Commission on April 27, 2011). | |
i. | First Amendment to Supply Agreement by and between GATX Corporation, as Buyer, and Trinity Rail Group, LLC, as Seller, dated April 25, 2011 is incorporated by reference to GATX’s Quarterly Report on Form 10-Q for the fiscal quarter ended March 31, 2011, file number 1-2328. | |
10.3 | GATX Corporation Directors’ Phantom Stock Plan, effective as of December 7, 2007, is incorporated herein by reference to Exhibit 10.31 to GATX’s Annual Report on Form 10-K for the fiscal year ended December 31, 2007, file number 1-2328. | |
10.4 | Amended and Restated GATX Corporation Directors’ Voluntary Deferred Fee Plan, effective as of December 7, 2007, is incorporated herein by reference to Exhibit 10.32 to GATX’s Annual Report on Form 10-K for the fiscal year ended December 31, 2007, file number 1-2328.* | |
10.5 | Summary of GATX Corporation Non-Employee Directors’ Compensation is incorporated herein by reference to the section entitled “Director Compensation” in GATX’s Definitive Proxy Statement filed on March 15, 2013, in connection with GATX’s 2013 Annual Meeting of Shareholders, file number 1-2328.* | |
10.6 | GATX Corporation 2004 Equity Incentive Compensation Plan is incorporated herein by reference to Exhibit C to the Definitive Proxy Statement filed on March 18, 2004 in connection with GATX’s 2004 Annual Meeting of Shareholders, file number 1-2328.* | |
i. | Amendment of said Plan, effective as of December 7, 2007, is incorporated herein by reference to Exhibit 10.28 to GATX’s Annual Report on Form 10-K for the fiscal year ended December 31, 2007, file number 1-2328.* | |
ii. | Second Amendment of GATX Corporation 2004 Equity Incentive Compensation Plan effective October 22, 2010.* | |
10.7 | Restricted Stock Unit Agreement for awards made to executive officers on February 25, 2011, under the 2004 Equity Incentive Compensation Plan is incorporated herein by reference to Exhibit 10.1(a) to GATX’s Quarterly Report on Form 10-Q for the quarterly period ended March 31, 2011, file number 1-2328.* | |
10.8 | GATX Corporation 2004 Equity Incentive Compensation Plan Stock-Settled Stock Appreciation Right (SSAR) Agreement between GATX Corporation and certain executive officers entered into as of March 10, 2006 is incorporated herein by reference to Exhibit 10.1 to GATX’s Quarterly Report on Form 10-Q for the quarterly period ended March 31, 2006, file number 1-2328.* | |
10.9 | GATX Corporation 2004 Equity Incentive Compensation Plan Stock-Settled Appreciation Right (SAR) Agreement between GATX Corporation and certain eligible grantees entered into as of March 8, 2007, incorporated by reference to Exhibit 10.1 to GATX’s Quarterly Report on Form 10-Q for the quarterly period ended March 31, 2007.* | |
10.10 | Form of GATX Corporation Stock-Settled Stock Appreciation Right (SAR) Agreement for grants under the 2004 Equity Incentive Compensation Plan to executive officers on or after January 1, 2009, incorporated herein by reference to Exhibit 10.2 to GATX’s Quarterly Report on Form 10-Q for the quarterly period ended March 31, 2009, file number 1-2328.* | |
10.11 | Form of GATX Corporation Performance Share Agreement for grants under the 2004 Equity Incentive Compensation Plan to executive officers on for after January 1, 2009, incorporated herein by reference to Exhibit 10.3 to GATX’s Quarterly Report on Form 10-Q for the quarterly period ended March 31, 2009, file number 1-2328.* | |
10.12 | GATX Corporation 2012 Incentive Award Plan is incorporated herein by reference to Exhibit A to the Definitive Proxy Statement filed on March 11, 2012 in connection with GATX's 2012 Annual Meeting of Shareholders, file number 1-2328.* | |
10.13 | GATX Corporation Cash Incentive Compensation Plan is incorporated herein by reference to Exhibit D to the Definitive Proxy Statement filed on March 18, 2004 in connection with GATX’s 2004 Annual Meeting of Shareholders, file number 1-2328.* | |
i. | Amendment of said Plan, effective as of December 7, 2007, is incorporated herein by reference to Exhibit 10.30 to GATX’s Annual Report on Form 10-K for the fiscal year ended December 31, 2007, file number 1-2328.* | |
10.14 | Form of Amended and Restated Agreement for Employment Following a Change of Control dated as of January 1, 2009, between GATX Corporation and Brian A. Kenney is incorporated herein by reference to Exhibit 10.27 to GATX’s Annual Report on Form 10-K for the fiscal year ended December 31, 2008, file number 1-2328.* | |
10.15 | Form of Amended and Restated Agreement for Employment Following a Change of Control dated as of January 1, 2009, between GATX Corporation and Robert C. Lyons, James F. Earl, Deborah A. Golden, William M. Muckian, Michael T. Brooks, and Curt F. Glenn is incorporated herein by reference to Exhibit 10.28 to GATX’s Annual Report on Form 10-K for the fiscal year ended December 31, 2008, file number 1-2328.* | |
120
10.16 | Form of Agreement for Employment Following a Change of Control between GATX Corporation and James M. Conniff (dated as of February 1, 2015) and Thomas A. Ellman (dated as of January 1, 2014) is incorporated herein by reference to Exhibit 10.1 to GATX's Quarterly Report on Form 10-Q for the quarterly period ended March 31, 2015, file number 1-2328.* | |
10.17 | Form of Agreement for Employment following a Change of Control between GATX Corporation and Eric D. Harkness (dated as of February 1, 2015), Jeffrey D. Young (dated as of February 1, 2015), and Paul F. Titterton (dated as of January 1, 2014) is incorporated by reference to Exhibit 10.3 to GATX’s Quarterly Report on Form 10-Q for the quarterly period ended March 31, 2015, file number 1-2328.* | |
10.18 | Form of GATX Corporation Indemnification Agreement for directors as of February 23, 2009, is incorporated herein by reference to Exhibit 10.1 to GATX’s Form 8-K dated February 24, 2009, file number 1-2328. | |
10.19 | Form of GATX Corporation Stock-Settled Appreciation Right (SAR) Agreement for grants to executive officers on or after January 1, 2008, is incorporated herein by reference to Exhibit 10.23 to GATX’s Annual Report on Form 10-K for the fiscal year ended December 31, 2009, file number 1-2328.* | |
10.20 | Form of Stock-Settled Stock Appreciation Right (SAR) Agreement for awards under the GATX Corporation 2012 Incentive Award Plan to executive officers with Agreements for Employment Following a Change of Control is incorporated by reference to Exhibit 10.24 of GATX's Annual Report on Form 10-K for the fiscal year ended December 31, 2012, file number 1-2328.* | |
10.21 | Form of Performance Share Agreement for grants under the GATX Corporation 2012 Incentive Award Plan to executive officers with Agreements for Employment Following a Change of Control is incorporated by reference to Exhibit 10.25 of GATX's Annual Report on Form 10-K for the fiscal year ended December 31, 2012, file number 1-2328.* | |
10.22 | Form of Performance Share Agreement with cash-election option for grants under the GATX Corporation 2012 Incentive Award Plan to executive officers with Agreements for Employment Following a Change of Control is incorporated by reference to Exhibit 10.1 to GATX’s Quarterly Report on Form 10-Q for the quarterly period ended March 31, 2014, file number 1-2328.* | |
99.1 | Undertakings to the GATX Corporation Salaried Employees’ Retirement Savings Plan is incorporated herein by reference to GATX’s Annual Report on Form 10-K for the fiscal year ended December 31, 1982, file number 1-2328.* | |
99.2 | Certain instruments evidencing long-term indebtedness of GATX Corporation are not being filed as exhibits to this Report because the total amount of securities authorized under any such instrument does not exceed 10% of GATX Corporation’s total assets. GATX Corporation will furnish copies of any such instruments upon request of the Securities and Exchange Commission. | |
__________
(*) Compensatory Plans or Arrangements
121